Embed Size (px)
Citation preview

Performance Improvement at Penn Medicine V.1
A Structured Approach to Problem Solving

Performance Improvement at Penn Medicine V.1 Overview
Page 2 of 96

Performance Improvement at Penn Medicine V.1 Overview
Page 3 of 96
“Without continual growth and progress, such words as improvement,
achievement, and success have no meaning.”
Benjamin Franklin

Performance Improvement at Penn Medicine V.1 Overview
Page 4 of 96
Table of Contents Performance Improvement at Penn Medicine .............................................................................................................. 7
What is Performance Improvement ........................................................................................................................... 8
History ......................................................................................................................................................................... 8
Project Tracker .......................................................................................................................................................... 10
Teams: Do you need a team to solve your opportunity ........................................................................................... 11
Project Sponsor ......................................................................................................................................................... 12
Identify Process Owner ............................................................................................................................................. 14
Team/Project Roles ................................................................................................................................................... 14
Does your project need IRB approval? ...................................................................................................................... 16
When to use Evidence-based Practice for Clinical Projects ...................................................................................... 18
Performance Improvement in Action (PIIA) ................................................................................................................ 19
The PIIA Journey ........................................................................................................................................................ 20
A3 Roadmap for Performance Improvement ........................................................................................................... 23
Description of A3 Phases ........................................................................................................................................... 24
A3 Funnel diagram .................................................................................................................................................... 26
Phase 1-Find.................................................................................................................................................................. 27
Project Charter .......................................................................................................................................................... 28
Elevator Speech ........................................................................................................................................................ 31
Change Management ................................................................................................................................................ 32
Stakeholder Analysis ................................................................................................................................................. 33
Resistance Analysis.................................................................................................................................................... 34
Phase 2-Organize and Clarify ....................................................................................................................................... 37
Project Management-Developing an Action Plan ..................................................................................................... 38
Observing the Process .............................................................................................................................................. 40
Process Mapping ....................................................................................................................................................... 41
Value/Non-Value Added Analysis ............................................................................................................................. 48
Baseline Data ............................................................................................................................................................. 50
Phase 3-Understand/Select ......................................................................................................................................... 53
Graphing Measurements .......................................................................................................................................... 54
Understanding a Fishbone Diagram (Cause and Effect) ........................................................................................... 56
Root Cause ................................................................................................................................................................ 57
Performance Improvement at Penn Medicine V.1 Overview
Page 5 of 96
Phase 4-Plan/Do ........................................................................................................................................................... 60
Select Current vs. Future State ................................................................................................................................. 61
Translating Root Causes into Action ......................................................................................................................... 62
Prioritize Countermeasures with 2X2 Matrix ............................................................................................................ 67
Develop Pilot ............................................................................................................................................................. 68
Communication Plan ................................................................................................................................................. 70
Phase 5-Study ............................................................................................................................................................... 72
3M’s for Performance Improvement ........................................................................................................................ 73
Pilot Assessment ....................................................................................................................................................... 76
Phase 6-Act ................................................................................................................................................................... 78
Sustaining the gain .................................................................................................................................................... 79
Tracking Metrics ....................................................................................................................................................... 79
Control Plan .............................................................................................................................................................. 80
Replication Plan ........................................................................................................................................................ 81
Project Close ............................................................................................................................................................. 82
Additional Resources .................................................................................................................................................... 84
Credits ........................................................................................................................................................................... 84
Glossary of Terms ......................................................................................................................................................... 86
Appendix -Additional Tools .......................................................................................................................................... 88
People........................................................................................................................................................................ 88
Change Management ....................................................................................................................................... 88
Team Dynamics ................................................................................................................................................ 90
Data ........................................................................................................................................................................... 91
Run Chart ......................................................................................................................................................... 91
Bar Chart .......................................................................................................................................................... 92
Takt Time .......................................................................................................................................................... 93
Cycle Time ........................................................................................................................................................ 93
Process ...................................................................................................................................................................... 94
Fail Safe ............................................................................................................................................................ 94
Error Proofing ................................................................................................................................................... 95
Pull.................................................................................................................................................................... 95

Performance Improvement at Penn Medicine V.1 Overview
Page 6 of 96

Performance Improvement at Penn Medicine V.1 Overview
Page 7 of 96
The purpose of this guide is to provide a framework for problem solving improvement opportunities. Opportunities
large or small can use this “A3” model outlined in this guide. This guide is broken down into several sections:
Overview
Alignment to the Performance Improvement In Action (PIIA) program
A3 model for problem solving
Appendix
o Includes additional tools and information
This guide can be used inside or outside the Performance Improvement In Action (PIIA) program. The process,
methods and tools are the same. The PIIA program includes classroom days, coaching, and a report out. In order
for your team to be successful outside of the PIIA program, you must take the initiative to create your own
structure and timeline.
You will notice icons that depict tools and resources to help you through the process.
Performance Improvement at
Video Classroom Tips Template Meeting
Web
Content
Challenge
/Barrier
Document Sponsor
Check-in

Performance Improvement at Penn Medicine V.1 Overview
Page 8 of 96
What is Performance Improvement?
Performance Improvement (PI) is a process using structured methodology to improve existing processes in an
organization. While Performance Improvement involves a systematic approach using specific methodology, there
are a variety of approaches to be considered, such as Six Sigma or LEAN. Each methodology focuses on
improvement but uses different methods to achieve the best result.
Performance Improvement is a continuous process which when implemented successfully produces results that
measure customer satisfaction, employee satisfaction, improved efficiency, increased productivity, increased profit,
and enhanced quality.
The term “Performance Improvement” will be used exclusively throughout this document. Across healthcare,
Performance Improvement is used synonymously with “Quality Improvement” and “Process Improvement”.
Although clinical/medical settings are more prone to use the terminology “Quality Improvement” and supply chain
settings use “Process Improvement”, the overall goal is the same.
History
Performance improvement has been around for a long time.
Some issues are really tough to solve (or at least sustain), in healthcare. Ignaz Semmelweis is a perfect example, in
the 1840s he tried to demonstrate that performance improvement around hand-washing could drastically reduce
the number of women dying after childbirth.

Performance Improvement at Penn Medicine V.1 Overview
Page 9 of 96
There are two main methodologies to process improvement - Six Sigma and LEAN. Six Sigma uses statistics
to understand process variation and LEAN focuses on identifying and eliminating non-value added activities within
a process. The goal of both models is to promote business and operational excellence.
Companies such as Honeywell and General Electric were early adopters of Six Sigma and by the late 1990’s
about two-thirds of Fortune 500 companies had begun to use Six Sigma initiatives to increase quality, reduce
waste, reduce cost, and gain efficiency.
Lean manufacturing, referred to simply as Lean, was derived mainly from Toyota Production System (TPS).
Toyota’s growth to one of the World’s largest automobile producers has been linked to the Lean philosophy of
reducing waste to improve overall customer value. Lean methodology is a systematic method for eliminating waste
or non-value steps within a process. A few examples of waste include over production, excess processing, and wait
time. By reducing or eliminating waste, the added value becomes obvious. From a customer or client prospective,
“value” is any action or process that a customer would be willing to pay for.
More recently, companies have combined Six Sigma ideas and Lean manufacturing practices to create a
methodology named Lean Six Sigma. The Lean Six Sigma approach combines efficiency with precision.
Penn Medicine takes the key concepts from Lean and Six Sigma to create a blended approach to PI. The
methods and tools deemed most relevant within the healthcare environment have been incorporated into PI
initiatives at Penn Medicine.

Performance Improvement at Penn Medicine V.1 Overview
Page 10 of 96
Project Tracker
Tracking the progress and status of your project is critical as it allows you to:
Share projects across UPHS
Reduce the number of repeat projects
Collaborate on “like” projects
The project tracker allows project teams to enter their project information following the A3 phases. All
performance improvement projects should be into the project tracker and updated over time. Here are some of
the benefits of entering your projects into the project tracker:
Automatically create a charter from the information entered
Automatically create an abstract from the information entered
Quickly filter projects
Quickly identify exemplar projects
Access to the project tracker can be obtained via the following link or typing “piprojects” into the Internet
Explorer URL while on the UPHS network. http://pennpoint.uphs.upenn.edu/sites/contimprv/default.aspx
Performance Improvement at Penn Medicine V.1 Overview
Page 11 of 96
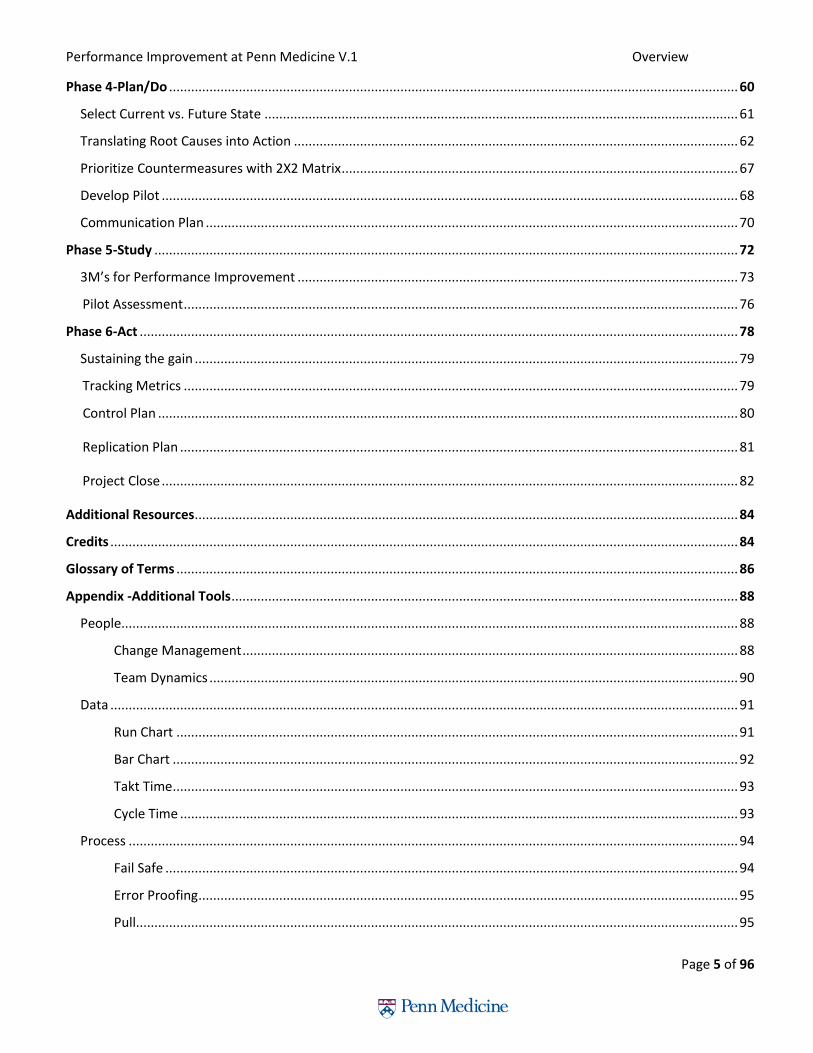
Teams: Do you need a team to solve your
opportunity?
Here are some questions and answers from Peter Scholte’s “Teams in the Age of Systems” to help determine if the
improvement opportunity requires a team:
Is the issue simple or complex? Complex issues often require teamwork, and inputs from multiple perspectives.
Does the issue require a specific area of expertise or several experts from multiple disciplines?
The need for multiple areas of expertise warrants the use of a team.
Can it be completed quickly or will it take a longer time?
A team with more members will provide more continuity and “team memory” over time.
Does the issue involve a single function or is it cross-functional?
The team should reflect all functional areas if the process crosses functions.
Will the implementation be easy or complex?
Implementers will have a better understanding of the change and the reasoning behind it if they are
part of the team developing the solutions.
Performance Improvement at Penn Medicine V.1 Overview
Page 12 of 96
Steps to Form Your Team
Identify a sponsor
Identify a process owner
Define team roles
Understand team dynamics (see Appendix)
Project Sponsor
Each project should have a sponsor. The project sponsor is a key member of the team to ensure success and
sustainment. It is critical that the sponsor is able to influence the areas impacted by the change. Most projects will
fail without the proper sponsor. Sponsor’s role includes:
Primary responsibility: to ensure the project charter is correctly defining the issue, metrics and scope, as
well as meets the organization’s strategic needs
Supports the Champion, Process Owner and Project Leader, as needed, to achieve the defined goals
Assists team to remove barriers
Approves and/or authored the charter
May need to provide resources if the Champion is unable
Participates in check-ins and report outs, as well as approves the action plans
Provides the team further direction as needed
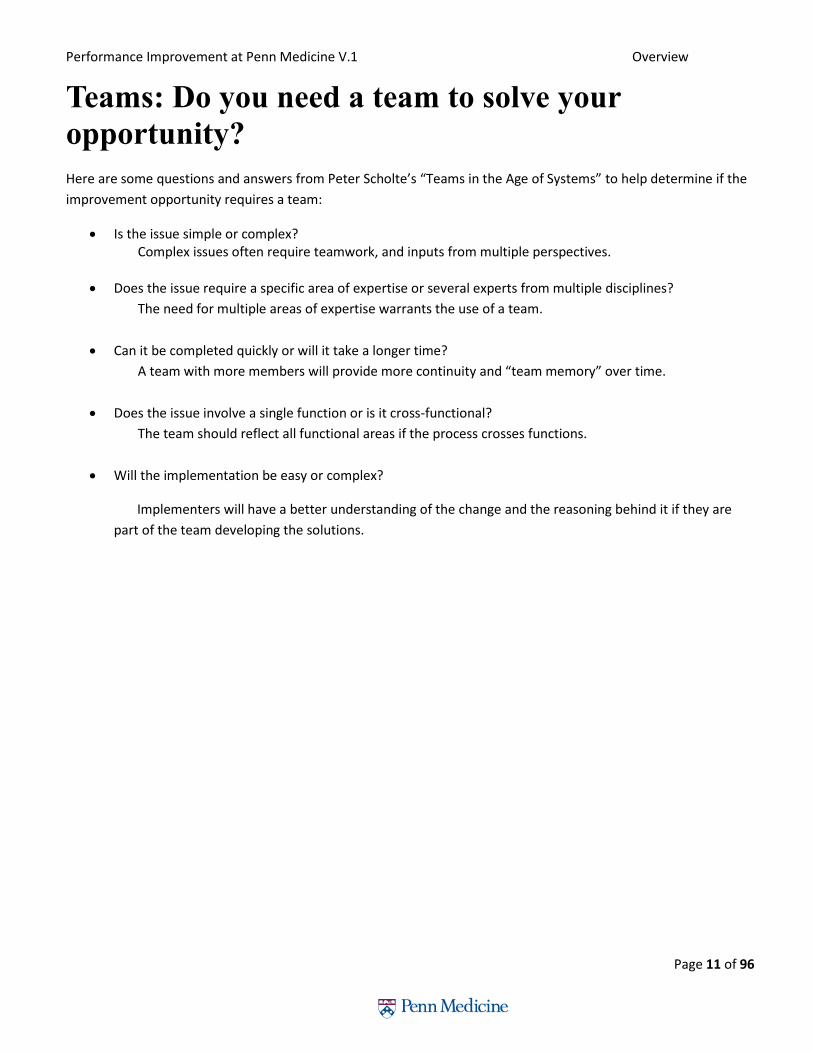
Identifying the Right Sponsor
Identifying the right project sponsor is critical to the success of a project. Sponsorship is not an appointment -
sponsors are determined by their position in the organization. The sponsorship spine is a tool to help identify the
sponsor(s):
1. Write down the areas/departments that will be impacted by this project. (I.e. Nursing, Physical Therapy,
Pharmacy, Oncology Physicians)
2. Determine who manages those areas
3. Determine who those managers flow up too

Performance Improvement at Penn Medicine V.1 Overview
Page 13 of 96
Sponsors should be able to influence the areas/departments being impacted. Areas/Departments that need to
change are most likely to be receptive to messages from their supervisor.
Having one sponsor for the project is ideal however due to the interprofessional nature and scope of most
projects in healthcare, having one sponsor is difficult. “Sponsorship by Committee” is very difficult to
manage as it poses challenges with consensus building, scheduling meetings and accountability. Many times
project teams find executives to sponsor and lead their project which has benefits but influence and long term
sustainment could be compromised.
Keep the number of sponsors on your project to a maximum of two
Changing the project scope can help manage the number or organizational level of sponsors identified by
the sponsorship spine
Depending on the change impact for an Area/Department, an identified sponsor may only need to stay
informed of the process and not be an active member of the decision making
Sponsor Check-Ins
Checking in with the project sponsor at key stages will ensure the project is moving in the right direction. The
sponsor check-ins could be conducted by the team leader and the facilitator. Sometimes the sponsor will come to
a team meeting for the check-in. There are at least 3 times to check-in with the sponsor. Additional check-ins will
be determined by the complexity of the project, challenges or availability of sponsor(s).
Set up sponsor check-ins early in the project.
Sponsor Check-In #1: Charter Review and Approval.
At the end of phase 1 of the A3 model, a sponsor check-in should be scheduled to review the charter. It is
important that each section of the charter is agreed upon. The sponsor will “sign-off” on the project with the
understanding that the charter will change over time as new information is discovered about the project.
Keep the sponsor informed whenever the charter is changed.
Sponsor Check-In #2: Review Countermeasures and Pilot.
Before Phase 5 of the A3 model, the sponsor should be informed of the countermeasures that will be piloted. The
sponsor will help to make sure that the pilot is supported and approve any resources needed.
A review of the information discovered during phase 2 and 3 of the A3 model will be necessary to show how
the countermeasures were determined.
Sponsor Check-In #3: Results and Sustainment Plan.
At the end of the project, the sponsor should be updated with the results of the pilot and any plan to expand the
pilot or disseminate.
Showing the results graphically using data is a powerful way to show impact.
Performance Improvement at Penn Medicine V.1 Overview
Page 14 of 96
Identify Process Owner
For any project, a process owner should be identified and engaged in the work. The process owner is the person
that will ultimately have to sustain the long term change as a result of the project. It is important that they are
bought into the project and understand their role. Often times the process owner is the team leader on a team.
Without a process owner, the long-term countermeasure will most likely not be sustained and the project may
never come to an end.
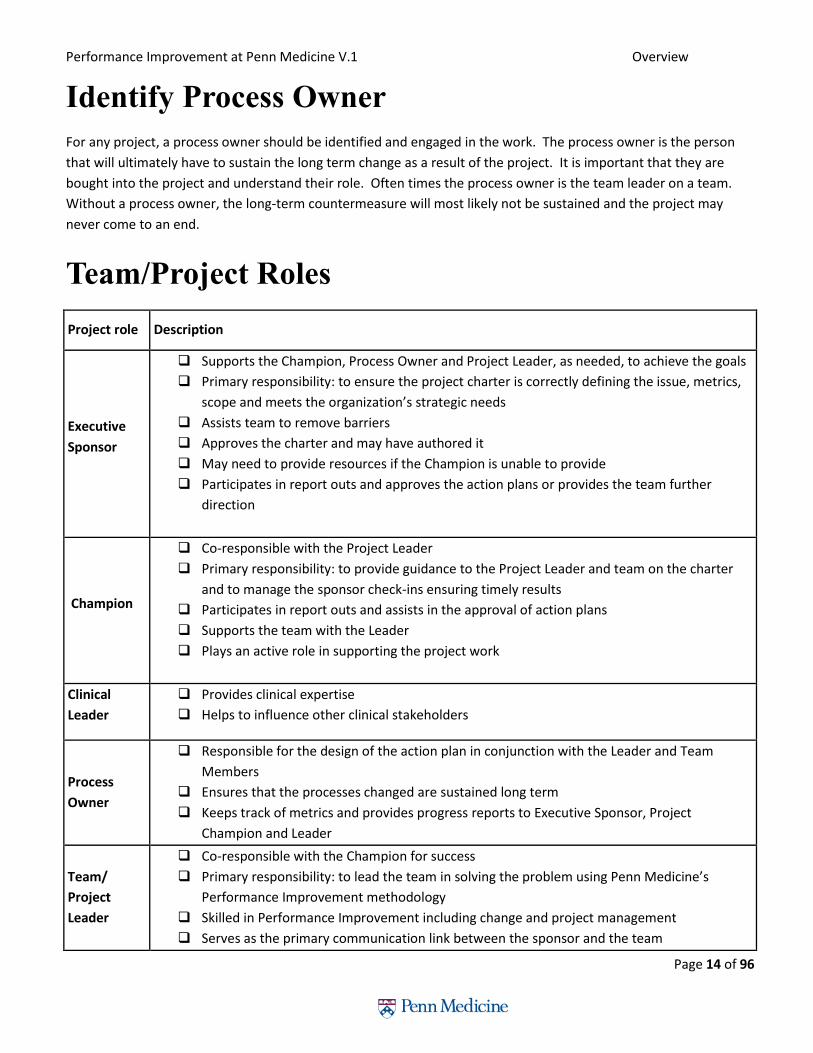
Team/Project Roles
Project role Description
Executive
Sponsor
Supports the Champion, Process Owner and Project Leader, as needed, to achieve the goals
Primary responsibility: to ensure the project charter is correctly defining the issue, metrics,
scope and meets the organization’s strategic needs
Assists team to remove barriers
Approves the charter and may have authored it
May need to provide resources if the Champion is unable to provide
Participates in report outs and approves the action plans or provides the team further
direction
Champion
Co-responsible with the Project Leader
Primary responsibility: to provide guidance to the Project Leader and team on the charter
and to manage the sponsor check-ins ensuring timely results
Participates in report outs and assists in the approval of action plans
Supports the team with the Leader
Plays an active role in supporting the project work
Clinical
Leader
Provides clinical expertise
Helps to influence other clinical stakeholders
Process
Owner
Responsible for the design of the action plan in conjunction with the Leader and Team
Members
Ensures that the processes changed are sustained long term
Keeps track of metrics and provides progress reports to Executive Sponsor, Project
Champion and Leader
Team/
Project
Leader
Co-responsible with the Champion for success
Primary responsibility: to lead the team in solving the problem using Penn Medicine’s
Performance Improvement methodology
Skilled in Performance Improvement including change and project management
Serves as the primary communication link between the sponsor and the team
Performance Improvement at Penn Medicine V.1 Overview
Page 15 of 96
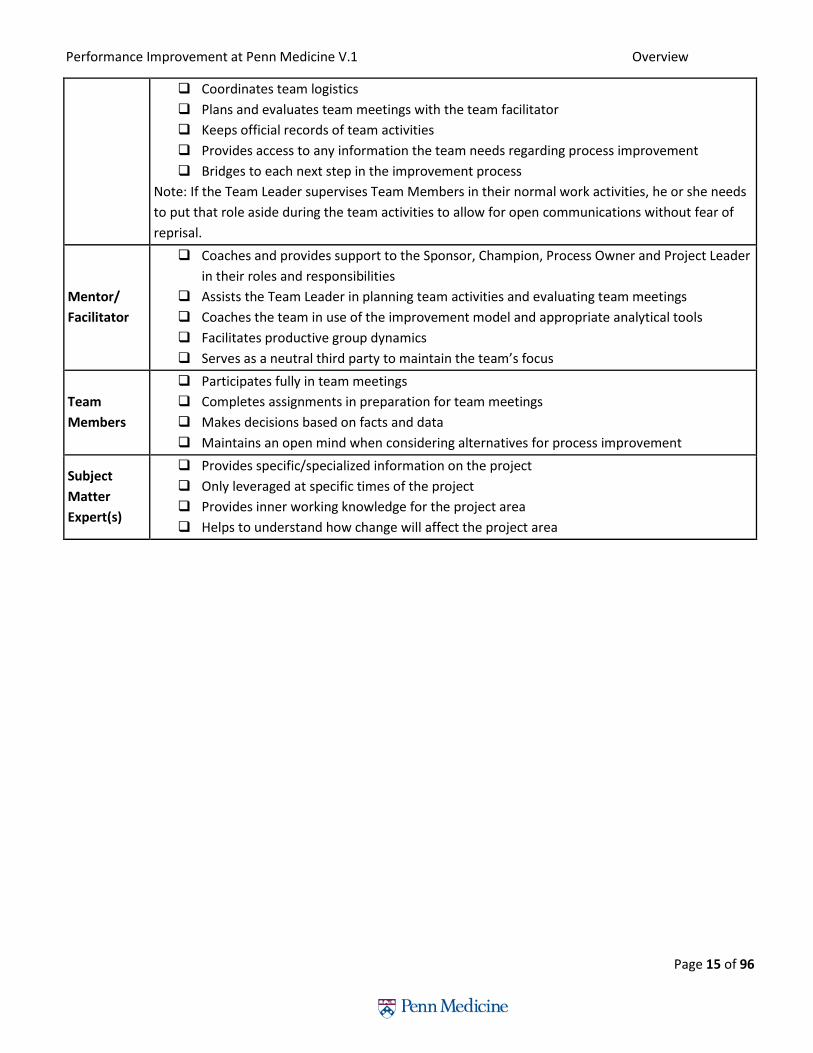
Coordinates team logistics
Plans and evaluates team meetings with the team facilitator
Keeps official records of team activities
Provides access to any information the team needs regarding process improvement
Bridges to each next step in the improvement process
Note: If the Team Leader supervises Team Members in their normal work activities, he or she needs
to put that role aside during the team activities to allow for open communications without fear of
reprisal.
Mentor/
Facilitator
Coaches and provides support to the Sponsor, Champion, Process Owner and Project Leader
in their roles and responsibilities
Assists the Team Leader in planning team activities and evaluating team meetings
Coaches the team in use of the improvement model and appropriate analytical tools
Facilitates productive group dynamics
Serves as a neutral third party to maintain the team’s focus
Team
Members
Participates fully in team meetings
Completes assignments in preparation for team meetings
Makes decisions based on facts and data
Maintains an open mind when considering alternatives for process improvement
Subject
Matter
Expert(s)
Provides specific/specialized information on the project
Only leveraged at specific times of the project
Provides inner working knowledge for the project area
Helps to understand how change will affect the project area
Performance Improvement at Penn Medicine V.1 Overview
Page 16 of 96
Does your Project need IRB approval?
Institutional Review Board (IRB) approval is required for projects that qualify as human subjects for research.
Activities that fall within the Performance Improvement (PI) domain are generally not considered to be research
and therefore, are not subject to IRB review. However, the distinction can be challenging and it is an important one
to be made. The following guidelines and review process have been created by Penn’s IRB to help faculty and staff
navigate this process.
For PI projects where the project leaders are certain that the project is PI and not human subjects research
and there is no desire for a formal IRB determination, submission to the IRB is not required. Many PI
projects fall into this category.
Similarly, for PI projects that seem to qualify as human subjects’ research, they should be submitted
directly to the IRB for review via the HS ERA online application system.
The IRB QI review process is designed to review projects in which the PI leader is unsure if IRB approval is
required or if they desire a formal determination letter by the IRB. Although IRB review may not be
required for PI activities, in some circumstances, journals or professional organizations may require
documentation that IRB review was not required before accepting a PI project for publication or
presentation.
IRB Contact information: Applications for QI review should be submitted via email to the following address:
If you require assistance with the IRB QI review process please contact Hoon Chung at [email protected], 215-
898-2881 or David Prakash at [email protected], 215-746-6268.

Performance Improvement at Penn Medicine V.1 Overview
Page 17 of 96
*Operational Leader = the leader of the unit/clinic/area where the QI work will be implemented. Examples of
operational leaders include a medical director of a unit or clinical area, division/department chief, nurse manager,
Dean, other health system or institutional leader that can approve the implementation of a quality
assurance/improvement project.
**To avoid confusion, QI projects should not be referred as research in publications/presentations. When results
from a QI project that was not submitted to the IRB for a formal determination is published, the Operational Leader
and the project team should be comfortable with including a statement along the following lines in the publication:
“This project was undertaken as a Quality Improvement Initiative and as such was not formally reviewed by the
University of Pennsylvania’s Institutional Review Board.”
***If a project is established as quality improvement by the IRB the following statement may be included in the
resulting publication: “This project was reviewed and determined to qualify as Quality Improvement by the
University of Pennsylvania’s Institutional Review Board.”

Performance Improvement at Penn Medicine V.1 Overview
Page 18 of 96
When to use Center for Evidence-based Practice
for Clinical Projects
“Evidence reviews created by hospital evidence-based practice centers are funded by their home institutions to
help inform decision making on the ground, from device purchasing and drug formulary choices to decisions
involving clinical practice. These centers can adapt reviews from outside agencies to their local settings and
develop new reviews to address their local needs. In addition, they can use local utilization, outcomes, and cost
data to fill gaps in the evidence and enhance the relevance of reviews. Most importantly, these centers can play a
critical role in implementing report findings, including integrating them into computerized clinical decision support
(CDS) or quality improvement (QI) initiatives, and measuring their impact using administrative or clinical data. Such
centers thus help to create and foster a culture of evidence-based practice at their local institutions.”
- Quote from Center for Evidence-based Practice at UPHS (J Gen Intern Med. 2010; 25(12):1352–5)
Operations The Center performs rapid evidence reviews of health care technologies defined broadly. These include
pharmaceuticals, non-pharmaceutical technologies such as medical devices, and processes of care within UPHS.
Most assessments are performed at the request of medical, nursing or administrative leaders. For each issue
evaluated, CEP performs a systematic review of the evidence, and works alongside the issue’s key stakeholders to
produce the most valid and actionable report. These reports are then used to inform a variety of decisions ranging
from formulary and purchasing decisions to those regarding medical practice. CEP policy is to base reports on the
best available evidence. When possible, reports are based on good-quality evidence-based guidelines or systematic
reviews that have already been published. If such evidence is not available, CEP will proceed to search for primary
evidence in the clinical literature. Since CEP's mission is to support the quality and safety of care at UPHS,
developing and implementing strategies for translating evidence-based conclusions into routine practice at our
hospitals is a crucial part of our work. Techniques used for this purpose include presentations of our reports to
decision makers, development of clinical practice guidelines, and creation of order sets and other electronic
decision supports and clinical pathways.
Organization The Center for Evidence-based Practice at UPHS is under the directorship of Craig Umscheid (Director) and Kendal
Williams (Co-Director), who report directly to PJ Brennan, the Chief Medical Officer of the University of
Pennsylvania Health System. The Center includes research analysts who perform evidence reviews, a health
economist, biostatistician, clinical liaisons, librarians and administrators. The Center is guided by an executive board
and an advisory board of academic and administrative leaders at Penn.
For more information go to: http://www.uphs.upenn.edu/cep/index.html
Submit A Request Medical, nursing and administrative leaders are welcomed to submit requests for rapid evidence reviews, as are
individual faculty and staff of UPHS. Requests are approved by CEP with guidance from CEP’s advisors. Please call or
email Craig Umscheid at 215 349 8098 or [email protected] for more information.

Performance Improvement at Penn Medicine Performance Improvement in Action
Page 19 of 96
Performance Improvement In Action (PIIA)
Course Description: Penn Medicine’s Performance Improvement In Action (PIIA) is a learning lab facilitated by performance
improvement (PI) specialists across Penn Medicine. The PIIA model is designed to improve patient care by teaching
clinical and non-clinical teams to use scientific methods and Quality/PI tools to problem solve, address system
issues, discover patient safety opportunities, establish process metrics, engage in continuous improvement, and
ultimately improve patient care. Projects are identified by staff and selected by entity leadership teams based on
strategic alignment. Projects initiate from corporate services, inpatient, ambulatory, and Penn homecare. Teams
go through structured 90 day training sessions with the mentorship of a PI facilitator.
The PIIA program is a highly visible and strategic component of Penn Medicine’s “Blueprint for Quality and Patient
Safety” initiative which emphasizes patient-centered care throughout the health system and strives to improve
continuity, engagement, and value.
At the conclusion of this course, you should be able to: Identify opportunities for process improvement in your location for both internal and external customers
Define the problem and assess the current state
Identify the root cause of the problem
Develop and Implement solutions that will solve the problem
Key Accomplishments as of 04/29/2015 135 Penn Medicine projects completed
14 PIIA cohorts and 1400+ participants have completed PIIA projects since 2011
Each cohort averages approximately 90 learners distributed over 8-10 projects
75%+ of the projects have been fully implemented and sustained successful outcomes
Continuing Education Units are awarded including 20 AMA PRA Credits for physicians and 25.5 contact credits for nursing
Continuing Education Credits PIIA is also proud to provide the following continuing education benefits in collaboration with the Office of
Continuing Medical Education at the Perelman School of Medicine and The Hospital of the University of
Pennsylvania, Department of Nursing Education, Innovation and Professional Development:
20 AMA PRA Category 1 Credits reserved for Performance Improvement Continuing Medical Education (PI
CME)
Up to 25.5 nursing contact hours
Performance Improvement at Penn Medicine Performance Improvement in Action
Page 20 of 96
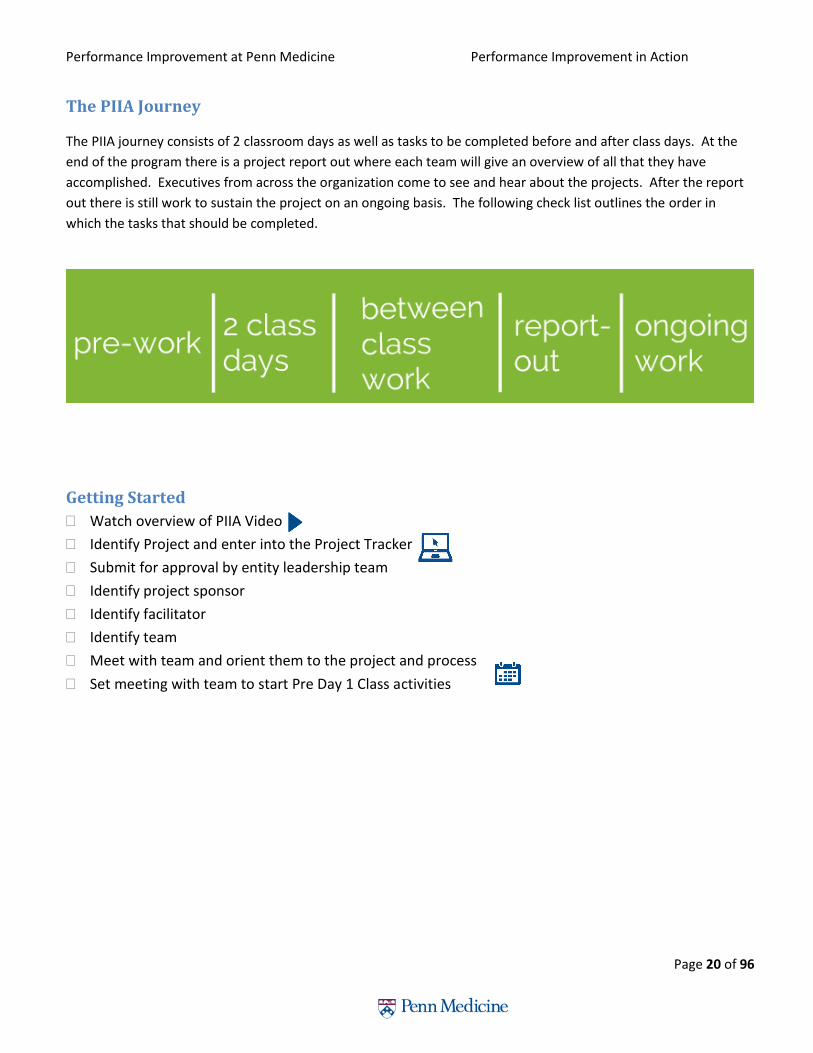
The PIIA Journey
The PIIA journey consists of 2 classroom days as well as tasks to be completed before and after class days. At the
end of the program there is a project report out where each team will give an overview of all that they have
accomplished. Executives from across the organization come to see and hear about the projects. After the report
out there is still work to sustain the project on an ongoing basis. The following check list outlines the order in
which the tasks that should be completed.
Getting Started
Watch overview of PIIA Video
Identify Project and enter into the Project Tracker
Submit for approval by entity leadership team
Identify project sponsor
Identify facilitator
Identify team
Meet with team and orient them to the project and process
Set meeting with team to start Pre Day 1 Class activities

Performance Improvement at Penn Medicine Performance Improvement in Action
Page 21 of 96
Pre Day 1 Class Develop a draft Charter in Project Tracker
Watch Phase 1 Find and Phase 2 Organize/Clarify Videos
Conduct Voice of the Customer
Conduct high-level process map
Sponsor Check-In #1: Review Charter
Set-up weekly meetings with team members
Schedule sponsor review meetings
Outline Stakeholder and Resistance Analysis
Observation Round 1: Go and see
Day 1 Class -Learning Objectives 1. Overview of PIIA and A3 roadmap 2. Preparing an Elevator Speech 3. Calculating the Financial Benefits 4. Learning to “Go and See” 5. Develop current state process map 6. Identifying Waste 7. Ideal/future State 8. Identify Gaps 9. Innovation and Rapid Validation 10. Establishing Baseline Data 11. Project Management 12. Change Management 13. Review Homework-Outline Pre Day 2 work
Pre Day 2 Class Observations Round 2: validate current state
process -“Go and See” Watch Phase 3 Understand/Select, Phase 4
Plan/Do, Phase 5 Study, and Phase 6 Act Videos Process Immersion Start collecting baseline metrics Invite a faculty member to get an outside
prospective on progress Update information in the project tracker Start to analyze data Bring work to Day 2 Class
Day 2 Class-Learning Objectives 1. Data analysis 2. Understand Cause and Effect 3. Getting Down to the Root Cause 4. Identifying countermeasures to close gap 5. Prioritize countermeasures with 2x2 matrix 6. Formulating plan for pilot 7. How to act based on pilot data 8. Change Management 9. Communication of the new process 10. Overview of Report Out 11. Outline Pre-Report out tasks 12. Sponsor Check In #2-Review Pilot
Pre Report Out Iterate on pilot
Track data
Pilot Countermeasure
Continue to collect data
Invite a faculty member to get an outside prospective on progress
Update Information in the project tracker
Sponsor Check In #2-discuss results and report out
Prepare for Report Out
Report Out 1. Executive Presence 2. Presentation Skills/video 3. Verbal Communication
Post Report Out and PIIA Program 1. Continue to measure success 2. Continue to pilot and make adjustments to
countermeasures as needed 3. Look for opportunities to disseminate project
results 4. Engage Penn Medicine leadership to share
results 5. Ongoing communication 6. Look for opportunities to publish 7. Update results in project tracker

Performance Improvement at Penn Medicine Performance Improvement in Action
Page 22 of 96

Performance Improvement at Penn Medicine A3 roadmap
Page 23 of 96
A3 Roadmap for Performance Improvement
Throughout this participant’s guide, the A3 model will be used as a roadmap for problems as they arise during this
process. An A3 is an 11x17 sheet of paper which is broken down into 6 boxes. Each box represents a phase of the
problem solving process: Find, Organize/Clarify, Understand and Select, Plan/Do, Study, and Act. The “A3 Roadmap
for Performance Improvement at Penn Medicine” below outlines key questions and tools for each phase of the A3.
The A3 is a tool from the Lean methodology (see history section for description on Lean). Six Sigma is a
complementary and popular performance improvement methodology which uses a 5 phase approach to problem
solving call DAMIC (Define, Measure, Analyze, Improve and Control). DMAIC closely aligns to the 6 phases of the
A3. The following outlines how the two methodologies align.
Define Measure Analyze Improve Control

Performance Improvement at Penn Medicine A3 roadmap
Page 24 of 96
Description of A3 Phases Phase 1 - Find
The Find Stage is the most important stage of a project. During this phase of the project, it is critical to
not only ensure that the improvement opportunity aligns with the strategy of the organization before
starting a project, but also that there is leadership buy-in for the project. Voice of the Customer and the
Charter are the main tools that will be used which will help give the project direction.
Phase 2 - Organize / Clarify
During the Organize / Clarify stage, the current state process is outlined based on how it is working today.
Before considering the future or ideal state, it is critical to first outline and understand the current state.
Comparing the current and future state allows you to determine the gaps in the process (i.e. “Current
State, Future State, Close the Gaps”). Key tools during this stage are process maps, data collection, value,
and non-value added identification.
Phase 3 - Understand and Select
Understanding the root cause of the problem is key to developing the right countermeasures. This phase
helps to focus on the critical few which allows for more rapid improvement implementation. Key tools
during this phase are the Pareto Analysis, fishbone and 5 why’s.
Performance Improvement at Penn Medicine A3 roadmap
Page 25 of 96
Phase 4 – Plan / Do
The Plan/Do phase takes action to reduce or eliminate the root causes of problems that prevent you from
reaching your goals. Effective root cause analysis often makes countermeasures self-evident. These
countermeasures should address the specific root causes.
Phase 5 -Study
Testing the Hypothesis or countermeasure is critical for understanding if the countermeasure worked.
Using data will help validate if the process worked. Teams will design rapid validation pilots to test the
countermeasure.
Phase 6 – Act
Sustaining the gains and standardizing the work is the most challenging aspect of the project. Many
projects fail at this and subsequently resort back to the old problematic process. In order to avoid failure,
the implementation of change management strategies delivered through coaching and rounding is
critical. Tea m members should be encouraged to ask powerful questions, as these will help you to better
understand the intricacies of the process.

Performance Improvement at Penn Medicine A3 roadmap
Page 26 of 96
The A3 funnel diagram illustrates how the scope of an improvement opportunity will change over the course of the
project. In the beginning of the project, the scope will be larger than at the end. The tools used throughout the
project will help to create focus on the area(s) of the process that need to be improved. Your scope will narrow as
you move through the project.

Performance Improvement at Penn Medicine Phase 1-Find
Page 27 of 96
Phase 1-Find
The Find Stage is the most important stage of a project. During this phase of the project, it is critical to
not only ensure that the improvement opportunity aligns with the strategy of the organization before
starting a project, but also that there is leadership buy-in for the project. Voice of the Customer and the
Charter are the main tools that will be used which will help give the project direction. There are three
sub-phases:
Develop Charter Analyze
Stakeholders Sponsor Check-In

Performance Improvement at Penn Medicine Phase 1-Find
Page 28 of 96
Project Charter
The project charter is one of the most important tools in Performance Improvement. The charter clearly
defines the work we are trying to accomplish and includes: Problem Statement, Business Impact, Metrics
and Goals, Roles, and the Project Plan. The charter is a living document and should change as new
information is discovered about the improvement opportunity. Changes to the charter throughout the
project should be approved by the executive sponsor at the sponsor check-ins.
Template available in Quick tools section of PI Tracker
http://pennpoint.uphs.upenn.edu/sites/contimprv/default.aspx
Develop Charter Analyze
Stakeholders
Sponsor Check-In

Performance Improvement at Penn Medicine Phase 1-Find
Page 29 of 96
Voice of the Customer In order to fully understand the problem, you first need to complete a voice of the customer (VOC). This will help
you create the problem statement in the charter.
The purpose of a VOC is to capture a customer's expectations, preferences and dissatisfaction. The Voice of the
Customer is a tool that produces a detailed set of customer wants and needs that are organized into a hierarchical
structure. These wants and needs are then prioritized in terms of relative importance and satisfaction with current
alternatives.
VOC should be use throughout the project to get feedback on the current state as well as any changes made.
However, VOC is critical at the beginning of the project to understand the current state from the eyes of the
customer.
Ask the customers in the process:
1. What works well?
2. What does not work well?
3. If you could change one thing, what would it be and why?
Capture qualitative data on the customer’s opinion of the process.
Tip: Don’t jump to solutions – capture them, but focus on defining the problem first.
Tip: Customers could be internal or external to the organization.
Problem/Opportunity Statement Problem/Opportunity statement should answer these questions:
• What is occurring or What are we missing?
• When did the problem start?
• Where is the occurrence?
• Extent (Gap) of the problem or opportunity.
Example:
• In fiscal 2008 (When), the State Medicaid Group overpaid (What) a total of XX (Extent) supplemental rebates to the 50 US states (Where).
• XX is a place holder for the actual date. Or
The Problem statement should be very specific and customer-focused:
Example:
• Mr. J received ten times the dose of pain killer ordered and required transfer to the ICU and
intubation for 24 hours.
Performance Improvement at Penn Medicine Phase 1-Find
Page 30 of 96
Business Impact The Business Impact should identify how this project aligns to the strategy of Penn Medicine. This section could
also be used to identify any financial value that the project may yield.
Project Scope The scope assists in defining the work and consists of two questions:
1. What is the earliest step in the process that might, in any way, need to be studied and what is the last step?
• Example: From patient registration through Post-Op.
• This bounds the work for the team and speeds success.
2. What is included and excluded in the work?
• All services or just Pediatrics?
• All floors or just 2 South?
Tip: Scope small to gain progress quickly.
Project Milestones (Plan) Identifying dates for when project milestones should be achieved will help the project stay on track. A milestone
for the project could be each phase of the A3.
Goal Statement/Success Metrics Goals should be identified so that project teams will know when they have accomplished a successful project.
Goals should be SMART
• Specific
• Measurable
• Attainable
• Relevant
• Time Bound
Avoid:
• Wasting time
• Frustration
• Confusion
• Unmet expectations
Example:
• Penn Medicine’s target performance goal is a 2% reduction from FY12 in observed to expected
inpatient mortality by June 30, 2013.
Team
Once you identify team members, identify their names on the Charter. This will help keep them accountable for
the project. Team members should represent all areas of the process that are being impacted.

Performance Improvement at Penn Medicine Phase 1-Find
Page 31 of 96
Elevator Speech
Now that you have a project charter, you and your team need to devise a way to communicate it clearly and
precisely.
Creating an Elevator Speech will help you:
Clearly and simply state the need for change
Describe the future state
“Sell” the project to stakeholders
Creating an Elevator Speech
The team answers these four questions:
“Here’s what our project is about…”
“Here’s why it is important to do…”
“Here’s what success will look like…”
“Here’s what we need from you…”
Then combine the four answers into one fluid statement.
The statement should be in everyday language and easy to repeat.
Example:
Department of Medicine
Discharge Assessment Tool
Our project focus is to create a script for discharge planning rounds on subspecialty services to avoid delays and
streamline discharges.
This is important because current gaps in communication have made the discharge process less efficient. We are
identifying and supporting vital resources to prepare for safe discharges for our patients and families.
Success will be improved communication among team members to enhance the efficiency of the discharge
planning process; leading to patients being discharges safely within 48 hours of predicted date. Patient and staff
satisfaction will increase as patients and their families will feel more prepared and ready for discharge.
What we ask of you is to be willing to support this initiative and provide candid feedback about the process. If you
have any questions or feedback please email Neha Patel or Marybeth O’Mailey.

Performance Improvement at Penn Medicine Phase 1-Find
Page 32 of 96
Change Management
Change management is an approach to ensure change is transitioned smoothly with lasting benefits.
Penn Medicine’s approach to change Management includes the following objectives:
Practice - What people actually do, not what they say, is what will get results. Successful change efforts
identify and develop the supports for that behavior to help sustain it
Passion – Understanding interests and what makes people want to do something accelerates change
Pull – Pushing for change can be exhausting and frustrating. Developing “pull” strategies so the team takes
action to change will lead to long-term success
There are typically three phases to change:
1. Direction and Energy
Create an early coalition to guide and support the change effort.
Understand the issues, opportunities and challenges – what is at stake?
Talk with others (inside and outside the team) to identify “Found Pilots.” Found Pilots are pieces and parts of the future that you want to create.
Clarify what the new practice (behaviors and supports) looks like that you want to create.
Locate the areas of focus to initiate change – where are the levers in the organization that will accelerate change?
Outcome: A strong foundation for change.
2. Engagement
Identify priorities – where will you direct investment of resources and energy?
Build capacity and infrastructure.
Communicate, connect and amplify momentum.
Evaluate results.
Outcome: New behaviors in action, performance gains and the supports to sustain them.
3. Reflection and Continuous Improvement
Identify what led to success/failure.
Capture and share lessons.
Document processes and results.
Develop Charter Sponsor Check-In Analyze
Stakeholders
Performance Improvement at Penn Medicine Phase 1-Find
Page 33 of 96
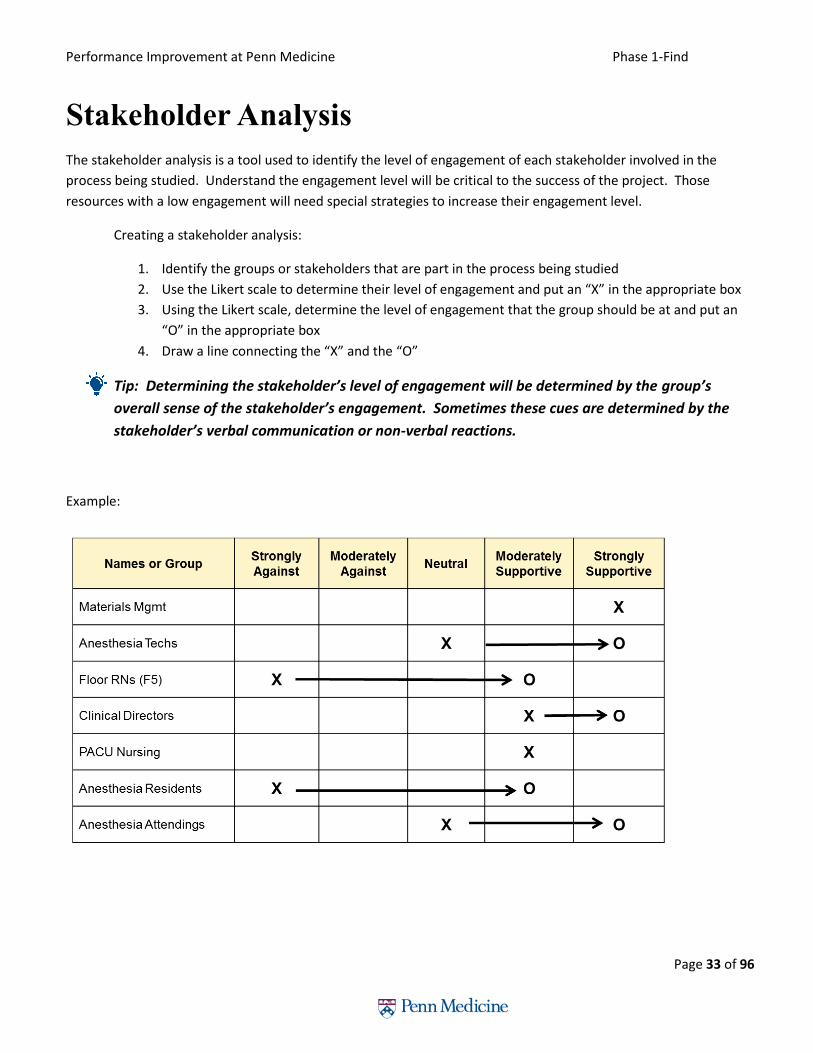
Stakeholder Analysis
The stakeholder analysis is a tool used to identify the level of engagement of each stakeholder involved in the
process being studied. Understand the engagement level will be critical to the success of the project. Those
resources with a low engagement will need special strategies to increase their engagement level.
Creating a stakeholder analysis:
1. Identify the groups or stakeholders that are part in the process being studied
2. Use the Likert scale to determine their level of engagement and put an “X” in the appropriate box
3. Using the Likert scale, determine the level of engagement that the group should be at and put an
“O” in the appropriate box
4. Draw a line connecting the “X” and the “O”
Tip: Determining the stakeholder’s level of engagement will be determined by the group’s
overall sense of the stakeholder’s engagement. Sometimes these cues are determined by the
stakeholder’s verbal communication or non-verbal reactions.
Example:

Performance Improvement at Penn Medicine Phase 1-Find
Page 34 of 96
Resistance Analysis
The resistance analysis builds off of the stakeholder analysis. The resources with a low engagement on the
stakeholder analysis can be entered into the resistance analysis to document the reason for the resistance.
Resistance comes in 3 forms:
1. Technical Resistance = Fear of the unknown
Solution:
Don’t intimidate with new words or statistics.
2. Political Resistance = “We don’t need you or continuous improvement”.
Solution:
Deal with facts – Is there a need for improvement?
3. Cultural Resistance = “This is how it has always been done”.
Solution:
Talk it out – show how their life will be easier.
To create a Resistance Analysis:
1. Identify the stakeholders from the stakeholder analysis that have a gap between the “X” and “O” and write
in the stakeholder
2. Try to identify the reasons for the resistance
3. Determine the level of resistance
Tip: The distance between the “X” and “O” will help determine the resistance level.
4. Use the three resistance types above to determine resistance type
Tip: There could be multiple resistance types.
5. Determine a strategy for dealing with resistance
Tip: If the resistance is strong - one great strategy is to make them a member of the team.

Performance Improvement at Penn Medicine Phase 1-Find
Page 35 of 96

Performance Improvement at Penn Medicine Phase 1-Find
Page 36 of 96
Sponsor Check-In #1
At the end of phase 1 of the A3 model, a sponsor check-in should be scheduled to review the charter. It is important that each section of the charter is agreed upon. The sponsor will “sign-off” on the project with the understanding that the charter will change over time as new information is discovered about the project.
Tip: Keep the sponsor informed whenever the charter is changed.
End of Find Phase Checklist:
Develop Charter
Voice of the Customer
Problem Statement
Elevator Speech
Team
Stakeholder Analysis
Sponsor Check-in
Once you have completed the tasks in this phase, you can move on to the next.
Develop Charter Sponsor Check-In Analyze
Stakeholders
Performance Improvement at Penn Medicine Phase 2-Organize/Clarify
Page 37 of 96
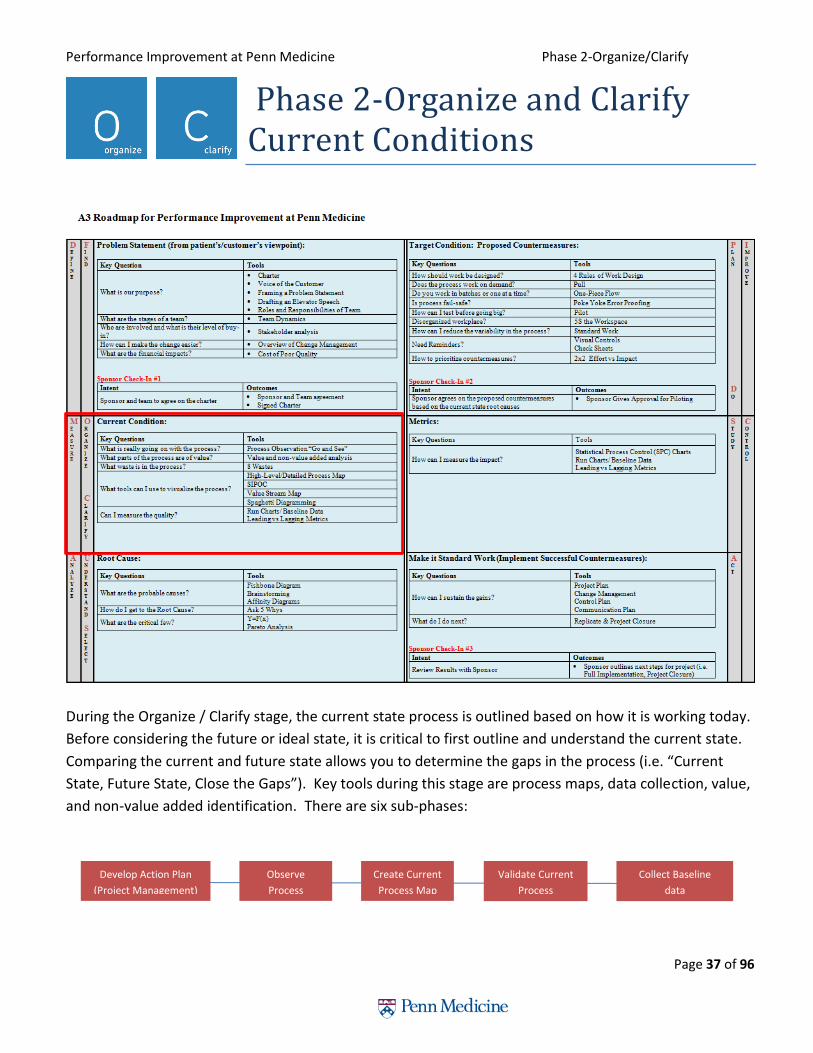
Phase 2-Organize and Clarify Current Conditions
During the Organize / Clarify stage, the current state process is outlined based on how it is working today.
Before considering the future or ideal state, it is critical to first outline and understand the current state.
Comparing the current and future state allows you to determine the gaps in the process (i.e. “Current
State, Future State, Close the Gaps”). Key tools during this stage are process maps, data collection, value,
and non-value added identification. There are six sub-phases:
Develop Action Plan
(Project Management)
Observe
Process
Create Current
Process Map
Validate Current
Process
Collect Baseline
data

Performance Improvement at Penn Medicine Phase 2-Organize/Clarify
Page 38 of 96
Project Management-Developing an Action Plan
The Project Management Institute describes project management as the “application of knowledge, skills, tools, and techniques to project activities to meet the project requirements.” A true project has a definite beginning and end, a defined scope, produces deliverables, and requires resources such as labor, materials, and other costs.
We use project management knowledge, skills, and tools to define;
A plan that shows the path to meet project goals
Responsibilities and progress
Guidelines for constant, effective communication
How we will manage staff, budget, and deliverables
High Level Steps:
Project Initiation- Overview of Project. The team must understand and agree on objectives, deliverables and risks.
Tip: This step is recorded in the Project Charter, Phase 1-Find.
Project Planning- Create a roadmap or detailed plan that is distributed to the team.
Tip: This step is recorded using the WWW, Phase 2-Organize and Clarify.
Project execution- Define tasks and activities and who is responsible for completing them. You may use tools such
as:
A work breakdown structure to identify tasks and activities
Resource analysis to determine what resources are needed
Budget to track cost of resources
Network diagram to arrange tasks in order of sequence
Gantt chart or WWW (who, what, when) to display tasks and timeline
Tip: This step is recorded using the WWW, Phase 2-Organize and Clarify.
Project control- Identify risks, have consistent checkpoint meetings with the team to review project progress,
manage budget, and schedule variances.
Tip: This step is recorded using the Control Plan and team meeting, Phase 6-Act.
Develop Action Plan
(Project Management)
Observe
Process
Create Current
Process Map
Validate Current
Process
Collect Baseline
data

Performance Improvement at Penn Medicine Phase 2-Organize/Clarify
Page 39 of 96
Project Close-Out-End product is accepted by project sponsors. Debrief, review lessons learned, recognize team,
and celebrate.
Tip: This step occurs during Phase 6-Act.
Who, What, Where (WWW) tool:
Documenting the tasks that need to be completed will help the team stay on track. Monitor, record progress
on all tasks, at least weekly – use “WWW (who, what, when)” or “Tracking Gantt Chart”.
Pay particular attention to those that are critical to implementation.
Revise plan as needed to take into account changes, adapt to meet milestones.
To Create a WWW:
1. Identify Who will be responsible for completing the task
2. What identifies the task
3. When determines the due date or the actual date
4. Update outlines any comments or status of the task
Who What When Update

Performance Improvement at Penn Medicine Phase 2-Organize/Clarify
Page 40 of 96
Observing the Process
Physically watching the process being studied is an important step to understanding what is currently happening, as
it helps to identify the process steps, behaviors, and tool/documents used during the process. If allowed, team
members should immerse themselves into the process when applicable by experiencing the process first hand.
Many times doing the process will add context that would not be determined by just watching.
Ideally it is great to observe the process prior to documenting the current state; however, availability of
resources to observe prior to current state process mapping may be limited. Prior to observing the process, a
proper interprofessional team could develop the current state process map using the collective knowledge of the
team. Validating the current state process map through observations will be a critical step in this case.
Planning for Observations and Metrics: Develop a plan to observe the process.
o Assign team members, times and shifts.
Identify questions for the voice of the customer.
Identify leading and lagging metrics to track.
Develop a plan to start gathering baseline data.
Determine a starting point for observation, for example patient enters a department.
Try to talk to patients and/or staff when they are waiting, this is to avoid prolonging the time it takes to
complete an operation.
Always stay with the product and record what the product is going through. You can note what the staff is
doing, but your observations are customer centric, if the product waits, you wait.
Do not provide too much detail – just enough.
Try to always complete multiple observation sessions.
Observers should summarize lessons learned and present them to the whole team. Discuss the results.
Tip: Look for behaviors of the people involved in the steps. Watch more than once - people will
act differently the first time you watch, keep in mind the 8 wastes.
Develop Action Plan
(Project Management)
Observe
Process
Create Current
Process Map
Validate Current
Process
Collect Baseline
data

Performance Improvement at Penn Medicine Phase 2-Organize/Clarify
Page 41 of 96
Process Mapping
The purpose of process mapping is to create a visual document of the process. Process maps will help to
understand the existing process and problems. Many times they facilitate the quick identification of
improvement opportunities within the process. Process maps are also a great communication tool to assist in
understanding the project.
Key Principles
• Documentation is not substitute for observation
• A flowchart is a means not an end
• First and last steps should come from the scope of your project charter
• Involve a cross-representation of those who work in the process to create the map
• Process maps are meant to be used
Versions of a Process Map
Develop Action Plan
(Project Management)
Observe
Process
Create Current
Process Map
Validate Current
Process
Collect Baseline
data
Performance Improvement at Penn Medicine Phase 2-Organize/Clarify
Page 42 of 96
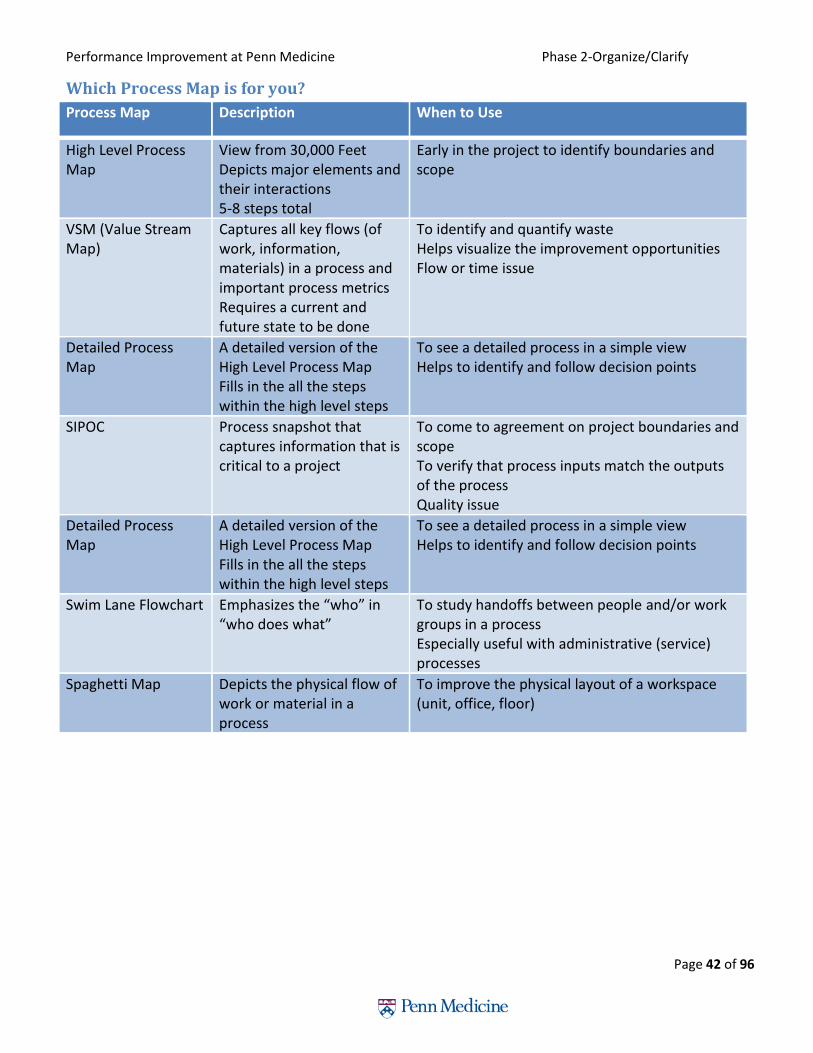
Which Process Map is for you?
Process Map Description When to Use
High Level Process Map
View from 30,000 Feet Depicts major elements and their interactions 5-8 steps total
Early in the project to identify boundaries and scope
VSM (Value Stream Map)
Captures all key flows (of work, information, materials) in a process and important process metrics Requires a current and future state to be done
To identify and quantify waste Helps visualize the improvement opportunities Flow or time issue
Detailed Process Map
A detailed version of the High Level Process Map Fills in the all the steps within the high level steps
To see a detailed process in a simple view Helps to identify and follow decision points
SIPOC
Process snapshot that captures information that is critical to a project
To come to agreement on project boundaries and scope To verify that process inputs match the outputs of the process Quality issue
Detailed Process Map
A detailed version of the High Level Process Map Fills in the all the steps within the high level steps
To see a detailed process in a simple view Helps to identify and follow decision points
Swim Lane Flowchart Emphasizes the “who” in “who does what”
To study handoffs between people and/or work groups in a process Especially useful with administrative (service) processes
Spaghetti Map Depicts the physical flow of work or material in a process
To improve the physical layout of a workspace (unit, office, floor)

Performance Improvement at Penn Medicine Phase 2-Organize/Clarify
Page 43 of 96
Commonly Used Process Maps:
High Level Process Map A high level process map gives you a 30,000 foot view. It is used early in the project to help identify boundaries and
scope. A high level process map should have 5-8 steps total.
1. Determine the start and end step of a process
2. Create a short description of the start step within a square
3. Draw arrow to second square and write a short description of step #2
4. Continue 5-8 times until end point is reached
Tip: High Level Process maps should not have decision points. Process step descriptions should
start with a verb.
Value Stream Map A value stream map looks similar to a high level process map but incorporates data. Common data elements to
include are:
Cycle time of each step
Inventory buildup between steps
Identification of value vs non-value added steps
Tack Time
Assess pump/module need
Order pump/modules
RecycledPump/module
pick-upPump/module
released
Pump/module delivery
Utilization
Performance Improvement at Penn Medicine Phase 2-Organize/Clarify
Page 44 of 96
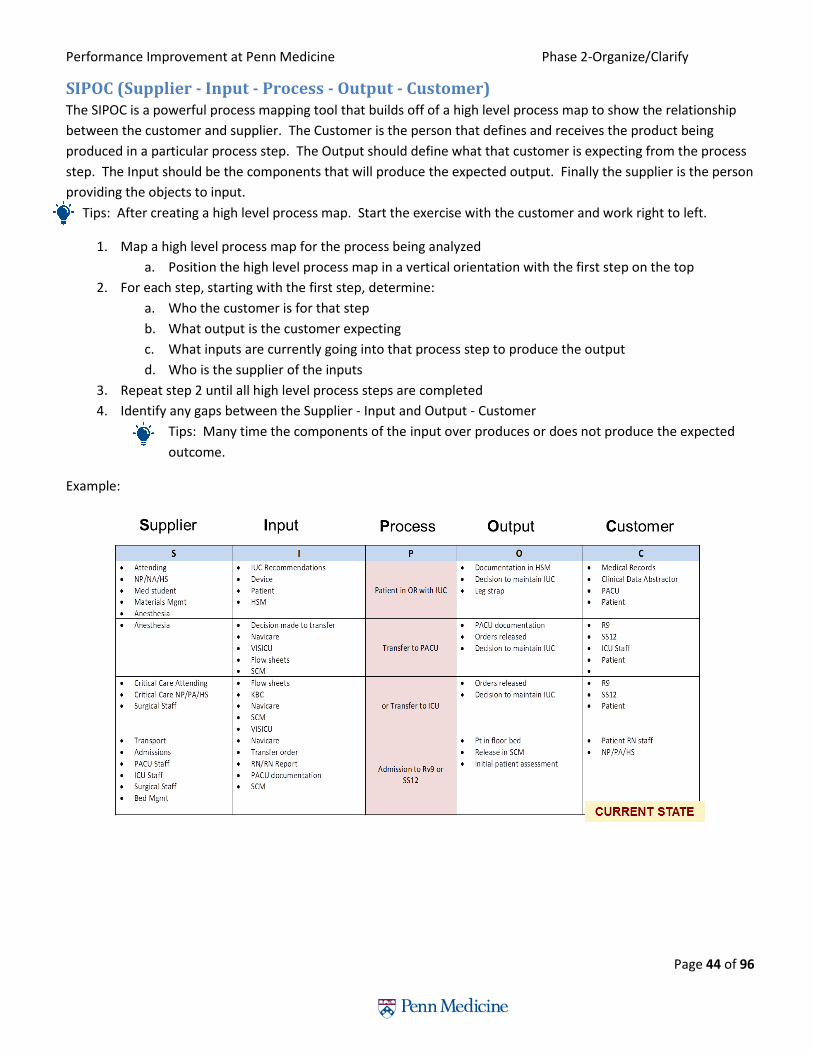
SIPOC (Supplier - Input - Process - Output - Customer) The SIPOC is a powerful process mapping tool that builds off of a high level process map to show the relationship
between the customer and supplier. The Customer is the person that defines and receives the product being
produced in a particular process step. The Output should define what that customer is expecting from the process
step. The Input should be the components that will produce the expected output. Finally the supplier is the person
providing the objects to input.
Tips: After creating a high level process map. Start the exercise with the customer and work right to left.
1. Map a high level process map for the process being analyzed
a. Position the high level process map in a vertical orientation with the first step on the top
2. For each step, starting with the first step, determine:
a. Who the customer is for that step
b. What output is the customer expecting
c. What inputs are currently going into that process step to produce the output
d. Who is the supplier of the inputs
3. Repeat step 2 until all high level process steps are completed
4. Identify any gaps between the Supplier - Input and Output - Customer
Tips: Many time the components of the input over produces or does not produce the expected
outcome.
Example:

Performance Improvement at Penn Medicine Phase 2-Organize/Clarify
Page 45 of 96
Detailed Process Map Detailed process maps are an extension of the high level process maps. Each step on a high level process map
can be broken into a detailed process map. Detailed process maps typically are unlimited in the amount of
process steps, incorporate decision points (diamond shape boxes below), and integrate qualitative and
quantitative data to specific boxes on the map.
To create a detailed process map:
1. Determine which step(s) need to by expanded from the High Level process map.
Tip: This could be determined by qualitative or quantitative data associated to the map.
2. Start creating a detailed process map by asking:
a. What is the first step in this process?
b. What is the next step?
3. Continue to build on the process map by asking “What is the next step?”
4. If this process requires a decision then use the diamond shape.
a. The words in the diamond shape should be a question.
b. Create branches from the tips of the diamond and continue to ask the question “what is the
next step?”
Tip: Make sure you close the loop on decision questions. Example: The decision questions have a Yes and
No response - build out the process for both responses - do not forget one.
5. Continue with steps 3 and 4 until process is mapped.
Tip: By asking “Who does that?” after “What is the next step?” will allow you to make a swim lane
process map.
Performance Improvement at Penn Medicine Phase 2-Organize/Clarify
Page 46 of 96
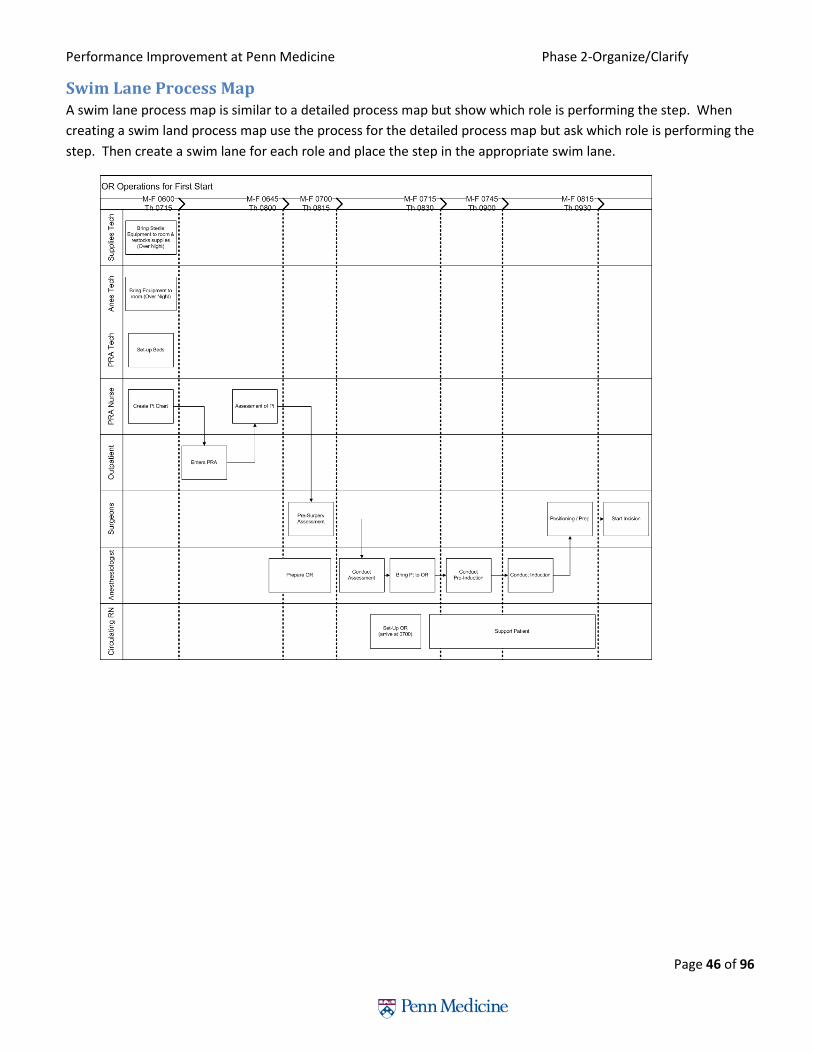
Swim Lane Process Map A swim lane process map is similar to a detailed process map but show which role is performing the step. When
creating a swim land process map use the process for the detailed process map but ask which role is performing the
step. Then create a swim lane for each role and place the step in the appropriate swim lane.
Performance Improvement at Penn Medicine Phase 2-Organize/Clarify
Page 47 of 96
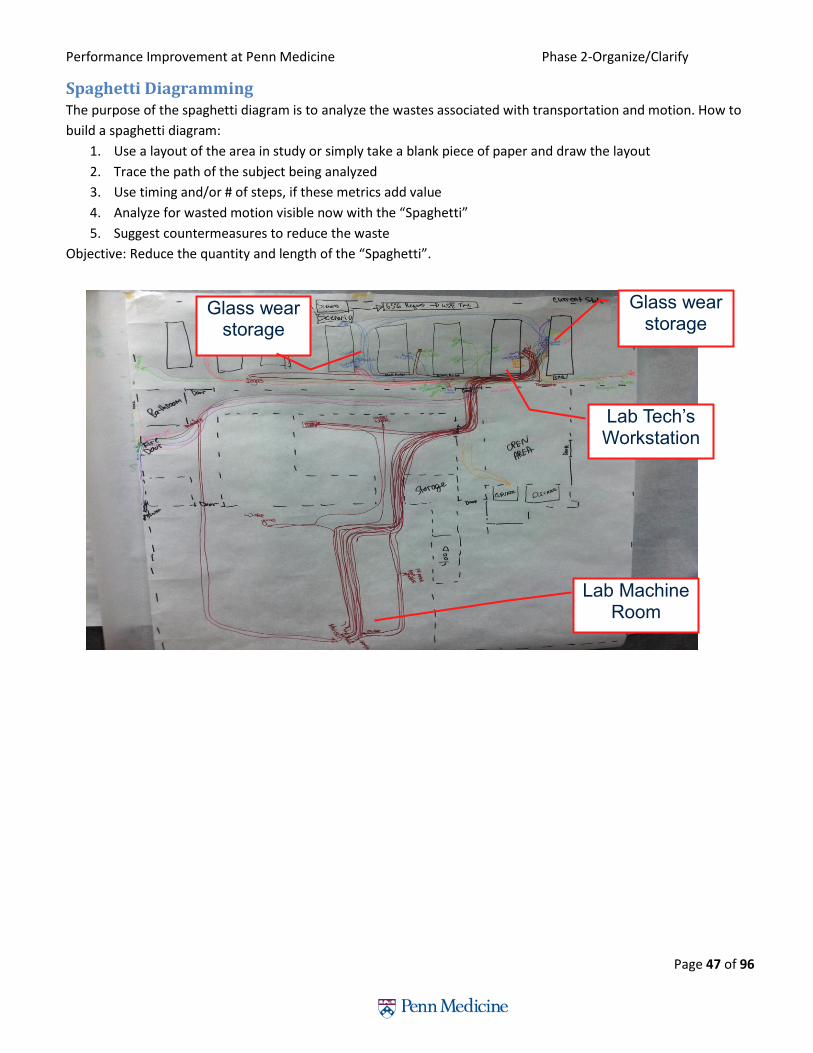
Spaghetti Diagramming The purpose of the spaghetti diagram is to analyze the wastes associated with transportation and motion. How to
build a spaghetti diagram:
1. Use a layout of the area in study or simply take a blank piece of paper and draw the layout
2. Trace the path of the subject being analyzed
3. Use timing and/or # of steps, if these metrics add value
4. Analyze for wasted motion visible now with the “Spaghetti”
5. Suggest countermeasures to reduce the waste
Objective: Reduce the quantity and length of the “Spaghetti”.
Glass wear storage
Glass wear storage
Lab Tech’s Workstation
Lab Machine Room
Performance Improvement at Penn Medicine Phase 2-Organize and Clarify
Page 48 of 96
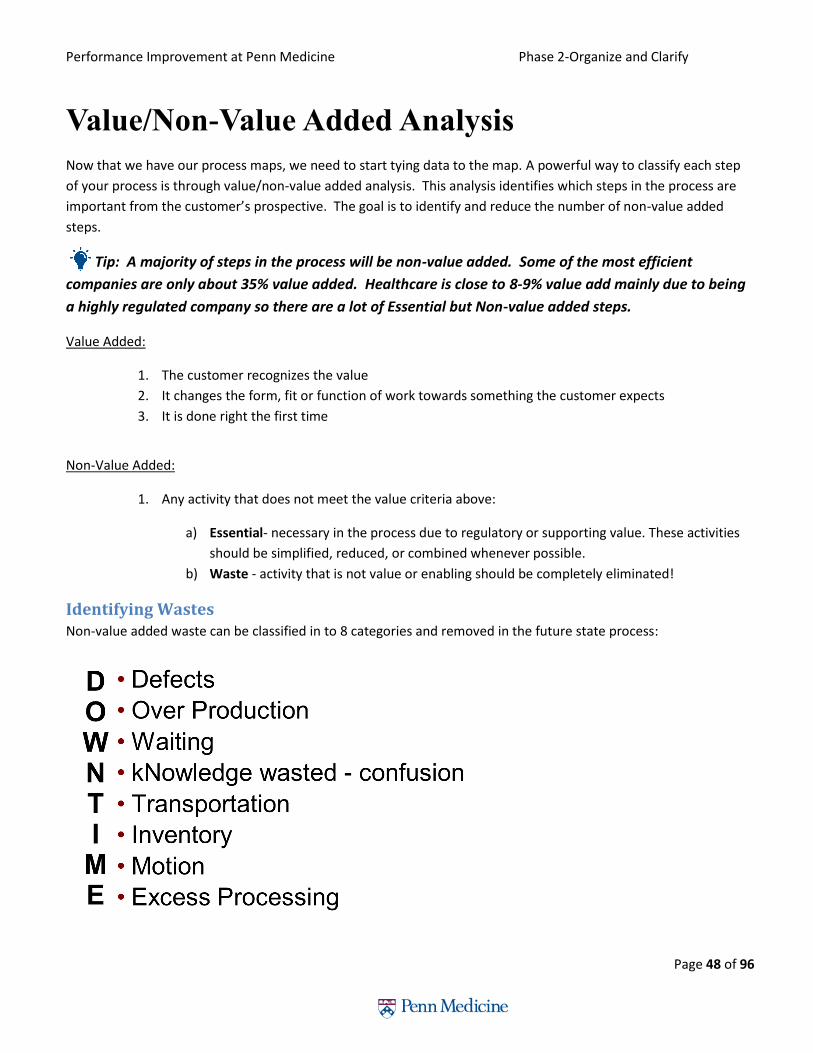
Value/Non-Value Added Analysis
Now that we have our process maps, we need to start tying data to the map. A powerful way to classify each step
of your process is through value/non-value added analysis. This analysis identifies which steps in the process are
important from the customer’s prospective. The goal is to identify and reduce the number of non-value added
steps.
Tip: A majority of steps in the process will be non-value added. Some of the most efficient
companies are only about 35% value added. Healthcare is close to 8-9% value add mainly due to being
a highly regulated company so there are a lot of Essential but Non-value added steps.
Value Added:
1. The customer recognizes the value
2. It changes the form, fit or function of work towards something the customer expects
3. It is done right the first time
Non-Value Added:
1. Any activity that does not meet the value criteria above:
a) Essential- necessary in the process due to regulatory or supporting value. These activities
should be simplified, reduced, or combined whenever possible.
b) Waste - activity that is not value or enabling should be completely eliminated!
Identifying Wastes Non-value added waste can be classified in to 8 categories and removed in the future state process:
Performance Improvement at Penn Medicine Phase 2-Organize and Clarify
Page 49 of 96
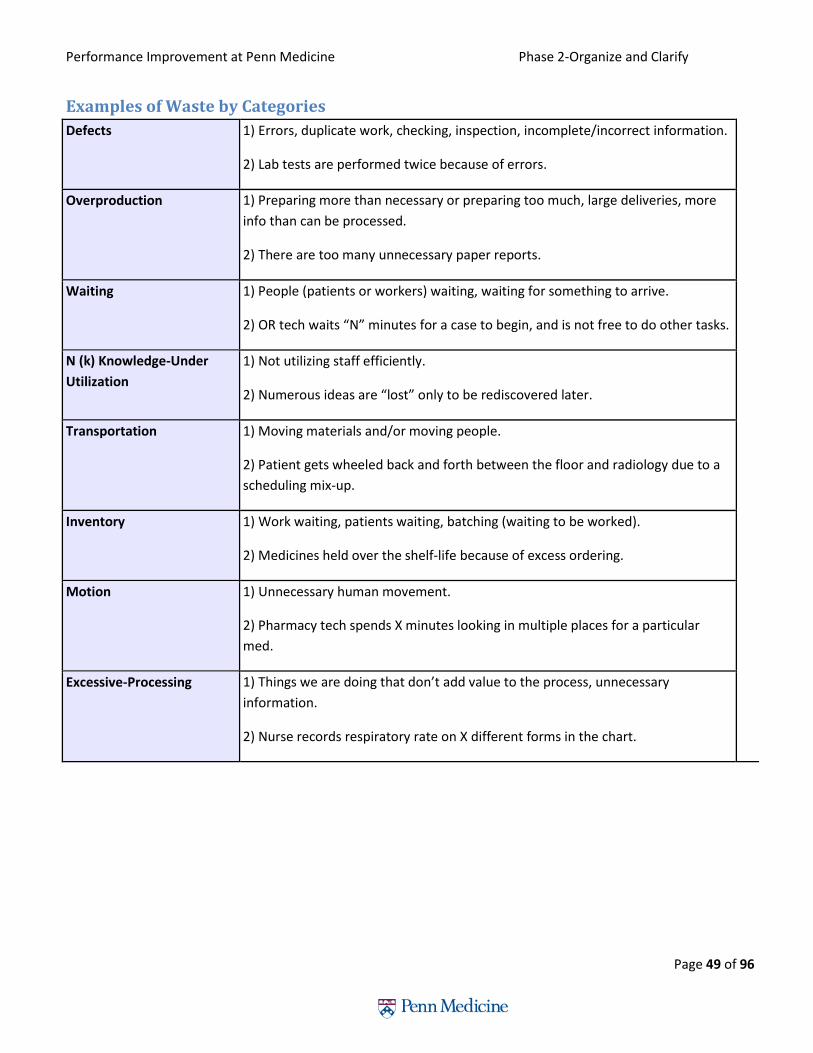
Examples of Waste by Categories
Defects 1) Errors, duplicate work, checking, inspection, incomplete/incorrect information.
2) Lab tests are performed twice because of errors.
Overproduction 1) Preparing more than necessary or preparing too much, large deliveries, more
info than can be processed.
2) There are too many unnecessary paper reports.
Waiting 1) People (patients or workers) waiting, waiting for something to arrive.
2) OR tech waits “N” minutes for a case to begin, and is not free to do other tasks.
N (k) Knowledge-Under
Utilization
1) Not utilizing staff efficiently.
2) Numerous ideas are “lost” only to be rediscovered later.
Transportation 1) Moving materials and/or moving people.
2) Patient gets wheeled back and forth between the floor and radiology due to a
scheduling mix-up.
Inventory 1) Work waiting, patients waiting, batching (waiting to be worked).
2) Medicines held over the shelf-life because of excess ordering.
Motion 1) Unnecessary human movement.
2) Pharmacy tech spends X minutes looking in multiple places for a particular
med.
Excessive-Processing 1) Things we are doing that don’t add value to the process, unnecessary
information.
2) Nurse records respiratory rate on X different forms in the chart.

Performance Improvement at Penn Medicine Phase 2-Organize and Clarify
Page 50 of 96
Baseline Data
Baseline data is essential to measure so that the project team can measure any impact that the countermeasure
has on the change.
Metrics-Output and Input (process) An output metric is an assessment of the result of a process.
An input metric is an assessment of the process and is usually assessing a key driver of the output metric.
Tip: Measuring input, or process, metrics will enable more real time tracking of the process and change.
Output metrics are typically lagging metrics.
Example and Discussion:
The output metric is patient satisfaction. This is a common output metric and is customer-centric.
Metric Baseline Finding preexisting sources to baseline data will help speed up the data collection. In some cases sources of data
do not already exist and so teams will have to create a data collection plan to collect data manually.
Develop Action Plan
(Project Management)
Observe
Process
Create Current
Process Map
Validate Current
Process
Collect Baseline
data

Performance Improvement at Penn Medicine Phase 2-Organize and Clarify
Page 51 of 96
Input Metric Baseline-Leading Data The formula Y=f(x) is an important formula to help identify all of the factors that impact a specific outcome
measure. The “Y” is the output while the “X’s” denote all the inputs that impact the output. The output is a
function of all the inputs. By measuring each input, teams can quickly focus on the inputs that have the biggest
impact on the “Y” or outcome.
1. Determine the outcome that you are trying to impact (Y)
2. Identify all the variables (x) that contribute to that outcome
3. Add measurements to the variable
4. Determine which variable(s) impacts Y the most
5. Focus improvement efforts on the high impacting variable(s)
Each of the Yellow boxes can be measured “real time”
When countermeasures are implemented – measuring change can be more real time
Performance Improvement at Penn Medicine Phase 2-Organize and Clarify
Page 52 of 96
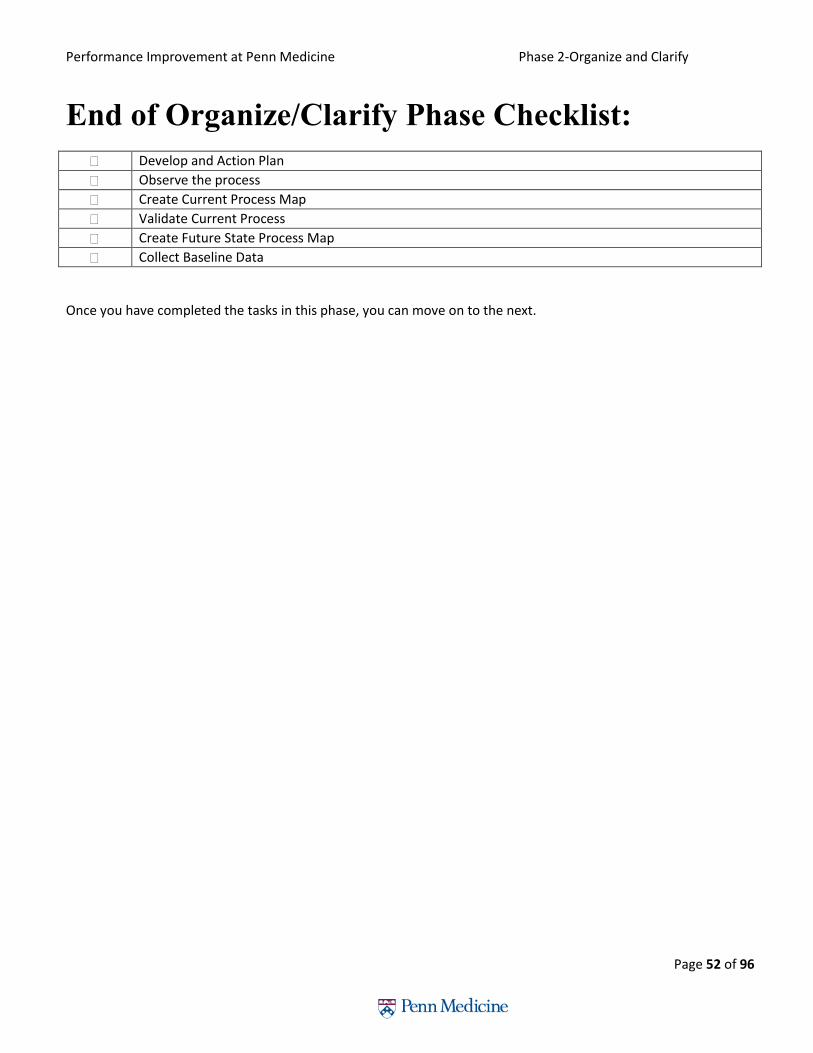
End of Organize/Clarify Phase Checklist:
Develop and Action Plan
Observe the process
Create Current Process Map
Validate Current Process
Create Future State Process Map
Collect Baseline Data
Once you have completed the tasks in this phase, you can move on to the next.

Performance Improvement at Penn Medicine Phase 3-Understand/Select
Page 53 of 96
Phase 3: Understand/Select
Understanding the root cause of the problem is key to developing the right countermeasures. This phase helps to
focus on the critical few which allows for more rapid improvement implementation. Key tools during this phase are
the Pareto Analysis, fishbone, and 5 why’s. There are three sub-phases:
Analyze Data
Identify Causes Root Cause
Analysis

Performance Improvement at Penn Medicine Phase 3-Understand/Select
Page 54 of 96
Graphing Measurements
Histogram A histogram is a graphical representation of the distribution of numerical continuous data. Histograms are used
when there is a need to compare the count of occurrences within a bin. The outcome will be a graph that could
potentially outline areas of opportunity or focus.
• Graphical representation showing a visual impression of the distribution of data
• X axis is data bin
• Y axis is frequency or count
How to create a histogram:
1. Create Bins based on continuous data (i.e. 1-5, 6-10)
2. Count the number of data points that fall within the Bin
3. Graph - the Bins should be on the x-axis and the count should be on the y-axis
Analyze Data
Identify Causes Root Cause
Analysis
Minutes Late
Count of Late 1st Starts

Performance Improvement at Penn Medicine Phase 3-Understand/Select
Page 55 of 96
0.0%10.0%20.0%30.0%40.0%50.0%60.0%70.0%80.0%90.0%100.0%
0
20
40
60
80
100
120
140
160
%
Co
un
t
Pneumatic Tube Events by "Problem Unit"
Count of Problem
Cumulative %
Graphing Measurements: Pareto A pareto chart helps identify the top causes that need to be addressed to resolve the most influential contributors
to the problem. Pareto charts commonly follow the “80/20” rule which assumes that 20% of causes determine 80%
of the problem. Once the main causes are identified, tools like the fishbone diagram are used to identify the root
cause.
• Highlights the most important among a set of factors
• X axis are the factors
• Y1 axis is frequency or count
• Y2 is the factor’s % of the total
How to create a pareto chart:
1. Create a table with 3 columns; list the causes, their frequency as a count and a percentage of the total.
2. Arrange the rows in the decreasing order of importance of the causes (i.e., the most important cause first).
3. Add a cumulative percentage column to the table.
4. Plot with causes on x axis, the count on the y1-axis and the cumulative percentage on y2-axis.
5. Join the above points to form a curve.
6. Plot (on the same graph) a bar graph with causes on x- and count on the y1-axis. Plot the cumulative
percentage on the y2-axis.
7. Draw a line at 80% on y-axis parallel to x-axis. Then drop the line at the point of intersection with the curve
on x-axis. This point on the x-axis separates the important causes (on the left) and trivial causes (on the
right).
8. Explicitly review the chart to ensure that at least 80% of the causes are captured.

Performance Improvement at Penn Medicine Phase 3-Understand/Select
Page 56 of 96
Understanding a Fishbone Diagram (Cause and
Effect)
A Fishbone analysis (Cause & Effect) helps teams to quickly focus on the most likely contributing factors.
• Start by writing the issue (Effect) at the “Head” of the fishbone.
• Categories such as Measurements, Supplies, etc., may be used to help the team brainstorm for all possible
causes to the issue.
• Feel free to use your own categories.
• Brainstorm all possible causes.
• But don’t worry about the categories yet!
• Team votes to select the most likely few factors. Using data to determine the few factors is more effective.
• Consider giving each team member 5 votes and then choose the highest counts.
• It is better to include than exclude causes at this point.
Analyze Data
Identify Causes Root Cause
Analysis

Performance Improvement at Penn Medicine Phase 3-Understand/Select
Page 57 of 96
Root Cause
Determine the root cause of the problem to facilitate the elimination of the underlying causes of the problem. The
5 whys tool is a simple and effective tool used to uncover the root cause.
5 Whys
1. The simple idea is to keep asking “Why” (usually five times) to ensure that the root cause(s) to the
effects are fully understood
2. Each time “Why” is asked, a different answer results; in essence peeling back the onion as follows:
First Why—Symptom
Second Why—Excuse
Third Why—Blame
Fourth Why—Cause
Fifth Why—Root Cause
5 Whys Example:
Drill Down from Fishbone’s Possible Causes
Problem: Cement is falling from the ceiling because it is being
washed several times a week
Why? There are lots of pigeon droppings.
Why? Pigeons come to eat the spiders.
Why? Spiders come to eat the midges.
Why? Midges fly to the flood lights of the monument.
Why? The lights come on before dusk and attract the
midges.
Solution
Analyze Data
Identify Causes Root Cause
Analysis

Performance Improvement at Penn Medicine Phase 3-Understand/Select
Page 58 of 96
End of Understand Select Phase Checklist:
Anaylze Data
Discuss Causes
Root Cause Analysis
Once you have completed the tasks in this phase, you can move on to the next.

Performance Improvement at Penn Medicine Phase 3-Understand/Select
Page 59 of 96

Performance Improvement at Penn Medicine Phase 4-Plan/do
Page 60 of 96
Phase 4: Plan/Do
The Plan/Do phase takes action to reduce or eliminate the root causes of problems that prevent you from
reaching your goals. Effective root cause analysis often makes countermeasures self-evident. These
countermeasures should address the specific root causes. There are five sub-phases:
Select Tools Prioritize
Countermeasures
Develop Pilot Communicate
Change
Sponsor check-In Create Future State
Process Map

Performance Improvement at Penn Medicine Phase 4-Plan/do
Page 61 of 96
Select Current vs. Future State
Creating a current state and future state map is important so that the project team can identify the gaps between
the two processes. Identifying the gaps will help to focus the project team. Gaps should be analyzed and closed.
Current State
• Captures the project as it works today; including waste.
• Most projects should include a current state map.
Future State
• The ideal process; waste eliminated.
• Created by asking “What would we do if we didn’t at have any of the restrictions we have today?”
• Helps see the work in a new way and generate creative ideas.
Is an innovative approach needed for your
project? The gaps and waste identified between the current and future state may require a more innovative change to the
process vs incremental adjustments. The graph below will help gauge if an innovative approach is needed. Contact
the Center for Health Care Innovation to discuss if an innovative approach is more appropriate.
http://healthcareinnovation.upenn.edu/
Select Tools Prioritize
Countermeasures
Develop Pilot Communicate
Change
Sponsor check-In Create Future State
Process Map

Performance Improvement at Penn Medicine Phase 4-Plan/do
Page 62 of 96
Translating Root Causes into Action
Selecting countermeasures, or solutions, should focus on reducing or eliminating the root causes of problems that
prevent you from reaching your goals. Effective root cause analysis often makes countermeasures self-evident.
Target your countermeasures for the specific root causes then run a rapid validation pilot to test all
countermeasures.
Countermeasure Development 1. What tools will reduce or eliminate the root cause?
2. What does the customer really need?
3. What process improvements will be necessary to achieve future state?
Standard Work The definition of standard work is "the most effective combination of manpower, materials and machinery".
Standard work outlines the steps needed to complete one cycle of work and maximizes the time for teams to do
creative work. Standard work does not equate to using a ‘cookie cutter’ approach.
Principles of Standard Work
• Directions are SIMPLE. • The directions follow a determined SEQUENCE. • Visual cues make the directions easy to follow. • The RIGHT PROCESS yields the RIGHT RESULT.
Tip: Think about the Value Added Time - don’t waste time on Non-value added.
Standard Work Visual Aide:
The standard work example below was design to help the Anesthesia team increase their on-time induction for first
starts for patients in the operating room.
Case Study: Before the below countermeasure was implemented, the anesthesia team was missing their on-time
induction in the operating room for first starts 25% of the time but they were only missing the induction time target
by an average 10 minutes. After careful observations and time studies of process, it was discovered that the
anesthesia resident spent about 10-15 minutes setting up their anesthesia equipment prior to seeing the patient
and bringing them back to the operating room. By creating standard work, the team was able to shift the
anesthesia equipment set up to the evening shift, which had capacity, so that the anesthesiologist were about to
see the patient and bring them back to the operating room sooner. This nearly eliminated any missed induction
time for first starts.
Select Tools Prioritize
Countermeasures
Develop Pilot Communicate
Change
Sponsor check-In Create Future State
Process Map

Performance Improvement at Penn Medicine Phase 4-Plan/do
Page 63 of 96
Standard Work: Job Aids, Checklists

Performance Improvement at Penn Medicine Phase 4-Plan/do
Page 64 of 96
Summary of 5S 5S is the name of a workplace organization method that uses a list of five works starting with the letter “s”, Sort,
Shine, Straighten, Standardize, and Sustain.

Performance Improvement at Penn Medicine Phase 4-Plan/do
Page 65 of 96
5S After with Visual Controls
Picture A below represents an equipment closet before 5S. In this closet, it is hard to determine where a piece of
equipment is located, if the equipment works, or if the equipment is clean. To locate, remove, check if working,
and clean takes additional time.
The picture below represents the same closet after 5S. Problems identified in the picture above have been
eliminated. The equipment is organized neatly so that other equipment does not have to be moved. Pictures on
the wall illustrate where each pieces of equipment belongs. The map with instructions outline that when
equipment is put back it must be working and clean.
Map and directions for sustaining 5S
Photo of equipment that belongs in this space
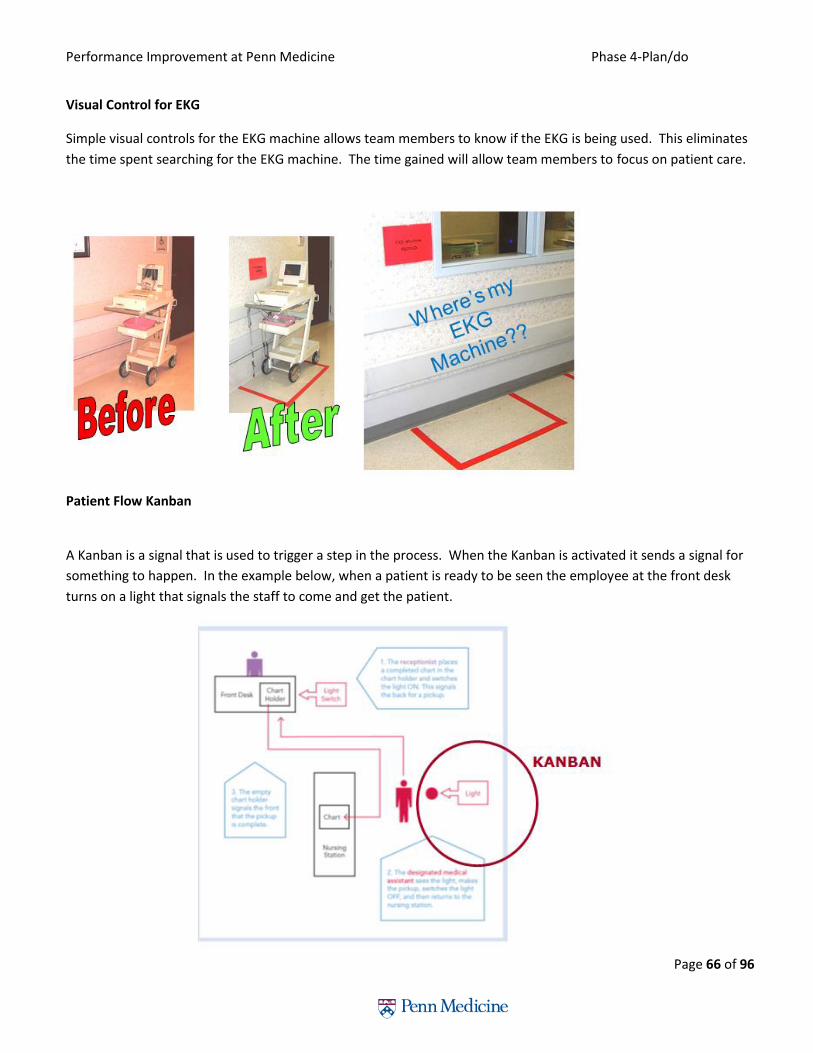
Performance Improvement at Penn Medicine Phase 4-Plan/do
Page 66 of 96
Visual Control for EKG
Simple visual controls for the EKG machine allows team members to know if the EKG is being used. This eliminates
the time spent searching for the EKG machine. The time gained will allow team members to focus on patient care.
Patient Flow Kanban
A Kanban is a signal that is used to trigger a step in the process. When the Kanban is activated it sends a signal for
something to happen. In the example below, when a patient is ready to be seen the employee at the front desk
turns on a light that signals the staff to come and get the patient.
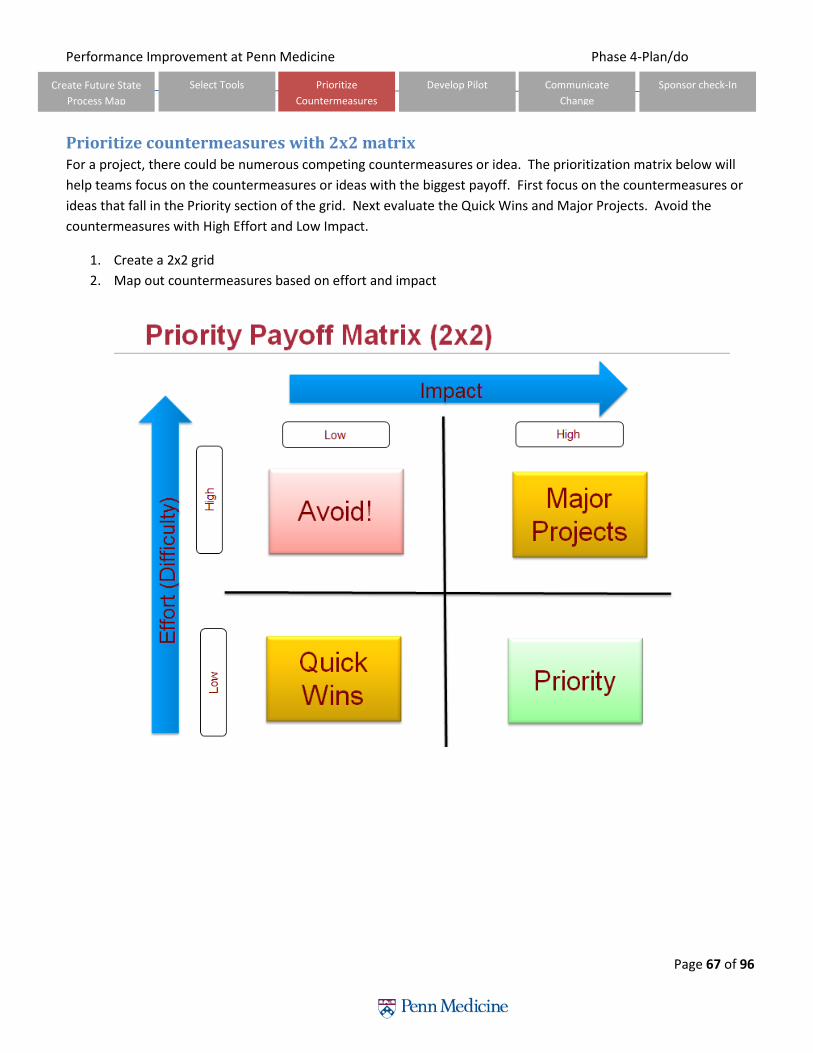
Performance Improvement at Penn Medicine Phase 4-Plan/do
Page 67 of 96
Prioritize countermeasures with 2x2 matrix For a project, there could be numerous competing countermeasures or idea. The prioritization matrix below will
help teams focus on the countermeasures or ideas with the biggest payoff. First focus on the countermeasures or
ideas that fall in the Priority section of the grid. Next evaluate the Quick Wins and Major Projects. Avoid the
countermeasures with High Effort and Low Impact.
1. Create a 2x2 grid
2. Map out countermeasures based on effort and impact
Select Tools Prioritize
Countermeasures
Develop Pilot Communicate
Change
Sponsor check-In Create Future State
Process Map

Performance Improvement at Penn Medicine Phase 4-Plan/do
Page 68 of 96
Develop a Pilot A pilot is a test of all or part of a proposed solution on a small scale in a real business environment in order to
better understand its effects and to learn about how to make full scale implementation more effective.
When to pilot?
• The scope of the change is large
• The change could cause far-reaching unintended consequences
• Implementing the change will be a costly process
• The change would be difficult to reverse
How to pilot?
• Scope pilot plan
• Create communication plan
• Implement
• Measure success
• Replication plan
• Report out
There are 5 methods of piloting to rapidly validate if the countermeasure will yield positive results. These
techniques will allow the team to collect data quickly and learn if the countermeasures are directionally correct
before spending valuable time and resources implementing the final long term version.
1. Vapor Test
A vapor test is used as a contextual demand test for new products, services or processes before actually
creating it. Users will reveal believable intentions regarding intended use. If demand is strong then more
forward with the new product, service or process otherwise stop and move to a different idea.
2. Fake Front-End
The fake front-end is used as a contextual interaction test making an idea tangible with a real interface or
tangible form. It helps to determine what people would do if presented with this new countermeasure
design, even though it doesn’t yet work to produce the desired outcome. The design will simulate the
customer facing experience/tool in order to test the feasibility and usability before creating the final
version. The mockup will allow the project team to make quick changes to the experience/tool, based on
the customer’s feedback, without adding significant time or cost to the project.
3. Fake Back-End
The fake back-end is used to simulate the backend of a countermeasure in order to test the feasibility and
usability before creating or redesigning the final version. Making an intended countermeasure real enough
Select Tools Prioritize
Countermeasures
Develop Pilot Communicate
Change
Sponsor check-In Create Future State
Process Map

Performance Improvement at Penn Medicine Phase 4-Plan/do
Page 69 of 96
with a fast, low cost structure – held together with chewing gum and a hamster on a wheel providing
electricity - so it can be deployed quickly for a short time at low scale. The goal is to contextually examine
and measure what actually happens on the backend when people use the countermeasure.
4. The Mizener (aka Mockingbird)
The Mizener is a technique used to find something already created that is close to what is the project
countermeasure requires then make adjustments to the existing countermeasure creating a prototype that
fits the needs of the project. Testing the prototype will allow for further understanding of how the
prototype could work. Adjustments to the prototype could be made quickly and cheaply before a final
design is developed.
5. The Mini-Pilot (One Night Stand)
The mini-pilot employs a fake back end or Mizener, very briefly at small scale, inserting a new
countermeasure in realistic operations to test end-to-end workflow, adoption, reactions and outcomes. At
the end of the mini-pilot there will be some data to determine if the countermeasure is having a
directionally correct impact.

Performance Improvement at Penn Medicine Phase 4-Plan/do
Page 70 of 96
Communication Plan
Before implementing a countermeasure it is critical to communicate the process so that everyone is aware of the
changes. The tool below helps to outline the communication needs.
Tip: Use your stakeholder analysis to identify resources that may need some additional communication.
• Audience: Stakeholders from Stakeholders Analysis
• Message: What do they need to know about this project; what impacts them
• Media: How you are going to communicate; email, coffee date, huddle, team meeting, etc.
• Who: Assign team member(s)
• When: Date that it must be accomplished by
Sponsor Check-In #2
Before Phase 5 of the A3 model, the sponsor should be informed of the countermeasures that will be piloted. The
sponsor will help to make sure that the pilot is supported and approve any resources needed.
Tip: A review of the information discovered during phase 2 and 3 of the A3 model will be necessary to show
how the countermeasures were determined.
Sponsor Check-In #3: Results and Sustainment Plan.
Select Tools Prioritize
Countermeasures
Develop Pilot Communicate
Change
Sponsor check-In Create Future State
Process Map
Select Tools Prioritize
Countermeasures
Develop Pilot Communicate
Change
Sponsor check-In Create Future State
Process Map

Performance Improvement at Penn Medicine Phase 4-Plan/do
Page 71 of 96
End of Plan/Do Phase Checklist:
Select Tools
Prioritize Countermeasures
Develop Pilot
Communicate Change
Sponsor Check-In
Once you have completed the tasks in this phase, you can move on to the next.

Performance Improvement at Penn Medicine Phase 5-Study
Phase 5: Study
Testing the hypothesis or countermeasure is critical for understanding if the countermeasure worked.
Using data will help validate if the process worked. Teams will design rapid validation pilots to test the
countermeasure. There are two sub-phases:
Track Data Make Decisions
based on Data
Performance Improvement at Penn Medicine Phase 5-Study
Page 73 of 96
3 M’s for Performance Improvement
When measuring the impact of the countermeasure, the 3 M’s are a great guide to follow.
1. Measure accurately and frequently
• Keep score - the more real time the better
• Ensure everyone can see the score – “the entire game”
2. Manage to the Measure - Just-In-Time
• Don’t pass up a chance to coach
• Reinforce to the charts
• Make adjustments if needed
3. Make it Easier
• To measure and to improve performance
• Make it easy to do the right things:
o Hand hygiene
o Operate on the correct knee
Statistical Process Control (SPC) Chart The Statistical Process Control (SPC) chart is a tool to measure the variability of processes and determine whether
or not the process being studied in “in control”. There are 3 main components to a SPC chart:
1. Data points - graphed similar to a line chart over time. In the example below - the data points represent
minutes to turn around an Endoscope. The y-axis represents the observations.
2. Mean - in the example below the green line represents the average or mean of all the data points.
3. Upper and Lower Control Limits - represent a specific standard deviation from the mean. The standard
deviation is derived from the data points. Typically the upper and lower control limits are +/- 2 or 3
standard deviations from the mean.
Track Data Make Decisions
based on Data

Performance Improvement at Penn Medicine Phase 5-Study
Page 74 of 96
How do you pick your control limits?
Tip: Sometimes the lower control limit will be a negative number. If it does not make sense for your
measurement to be negative then set the lower control limit at zero. In the example below - there would
not be a lower control limit with negative minutes.
Tip: Microsoft excel can easily calculate the mean and standard deviation using the following formulas.
Mean: =average (data points)
1 Standard Deviation: =stdev.p (data points)
Multiple 1 Standard Deviation by 2 or 3 depending on the desired upper and lower control
limits.
Add the number to the mean for the upper control limit.
Subtract the number from the mean for the lower control limit.
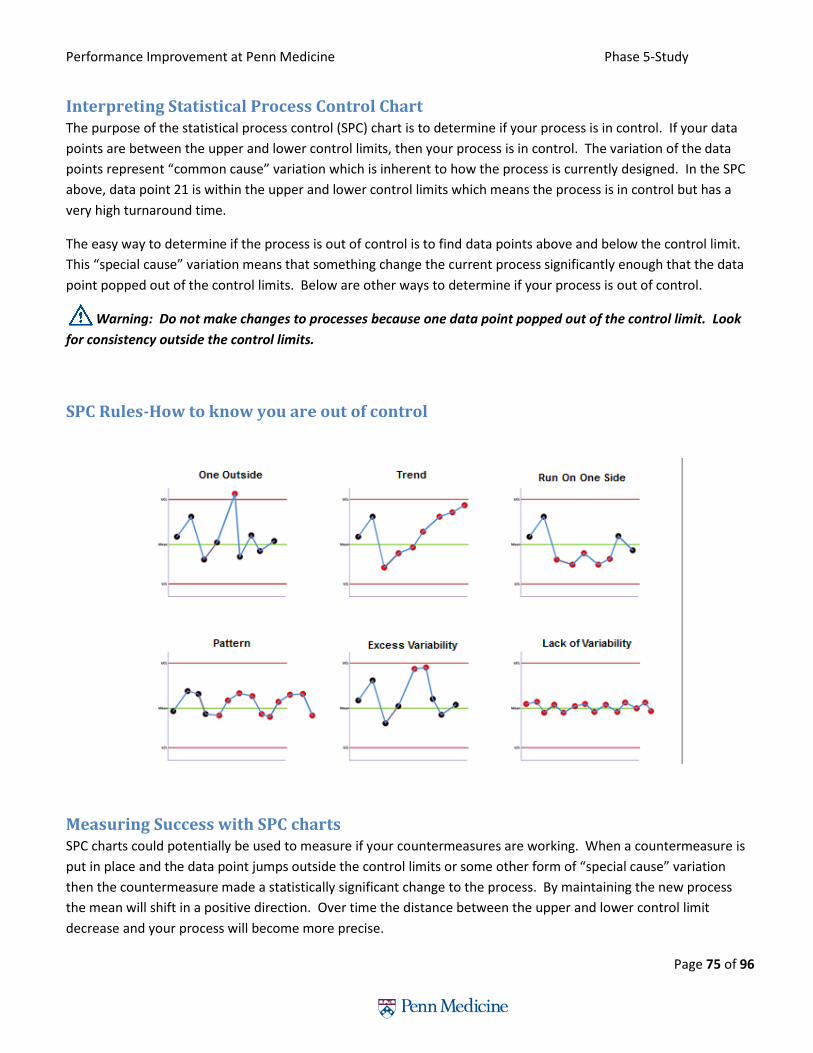
Performance Improvement at Penn Medicine Phase 5-Study
Page 75 of 96
Interpreting Statistical Process Control Chart The purpose of the statistical process control (SPC) chart is to determine if your process is in control. If your data
points are between the upper and lower control limits, then your process is in control. The variation of the data
points represent “common cause” variation which is inherent to how the process is currently designed. In the SPC
above, data point 21 is within the upper and lower control limits which means the process is in control but has a
very high turnaround time.
The easy way to determine if the process is out of control is to find data points above and below the control limit.
This “special cause” variation means that something change the current process significantly enough that the data
point popped out of the control limits. Below are other ways to determine if your process is out of control.
Warning: Do not make changes to processes because one data point popped out of the control limit. Look
for consistency outside the control limits.
SPC Rules-How to know you are out of control
Measuring Success with SPC charts SPC charts could potentially be used to measure if your countermeasures are working. When a countermeasure is
put in place and the data point jumps outside the control limits or some other form of “special cause” variation
then the countermeasure made a statistically significant change to the process. By maintaining the new process
the mean will shift in a positive direction. Over time the distance between the upper and lower control limit
decrease and your process will become more precise.

Performance Improvement at Penn Medicine Phase 5-Study
Page 76 of 96
Pilot Assessment
At this point, you have validated the problem and created and implemented a countermeasure… now you must
evaluate your success.
As you are tracking your metrics there are two things you may see:
1. Your countermeasure has shown improvement… GREAT, continue forward with sustainment plans.
2. Your countermeasure has NOT shown improvement… STOP, you are at a decision point. What next?
Decision Point 1. Revisit the Fishbone and Prioritization Matrix to determine why your countermeasure did not work.
a) If wrong root cause:
Fast failure; great learning opportunity – why didn’t it work?
Starting over from the beginning would require a lot of time and resources.
b) If wrong countermeasure:
Select another countermeasure from Prioritization Matrix.
New rapid cycle.
2. Discuss team recommendations with sponsor to confirm next steps.
Track Data Make Decisions
based on Data

Performance Improvement at Penn Medicine Phase 5-Study
Page 77 of 96
End of Study Phase Checklist:
Track Data
Make Decisions based on Data
Once you have completed the tasks in this phase, you can move on to the next.

Performance Improvement at Penn Medicine Phase 6-Act
Phase 6: Act
Sustaining the gains and standardizing the work is the most challenging aspect of the project. Many
projects fail at this and subsequently resort back to the old problematic process. In order to avoid failure,
the implementation of change management strategies delivered through coaching and rounding is
critical. Tea m members should be encouraged to ask powerful questions, as these will help you to better
understand the intricacies of the process.
Build Sustainable
Metrics
Establish Control
Chart
Transition Project to
Process Owner
Sponsor Check-In

Performance Improvement at Penn Medicine Phase 6-Act
Page 79 of 96
Sustaining the Gain
At this point, you have validated the problem and created and implemented a countermeasure that has shown
improvement… now you must manage the process.
You need to create a Control Plan to maintain and manage this new process over time
• Identify key measures that best characterize the process
• Define when and how measures will be collected
• Response actions to the data being measured
Tools to support this plan:
• Statistical Process Chart (SPC)
• Dashboard
• NaviCare Reports
Tracking Metrics
Tracking metrics is critical in measuring the process to determine if the process is stabilized or improving. Building
metrics into staff meeting, leadership meeting or posting on a metrics board in a visible area ensures that the
metrics is monitored long term. The easier it is to track the metrics the more likely the metrics will continue to be
monitored over time.
Build Sustainable
Metrics
Establish Control
Chart
Transition Project to
Process Owner
Sponsor Check-In
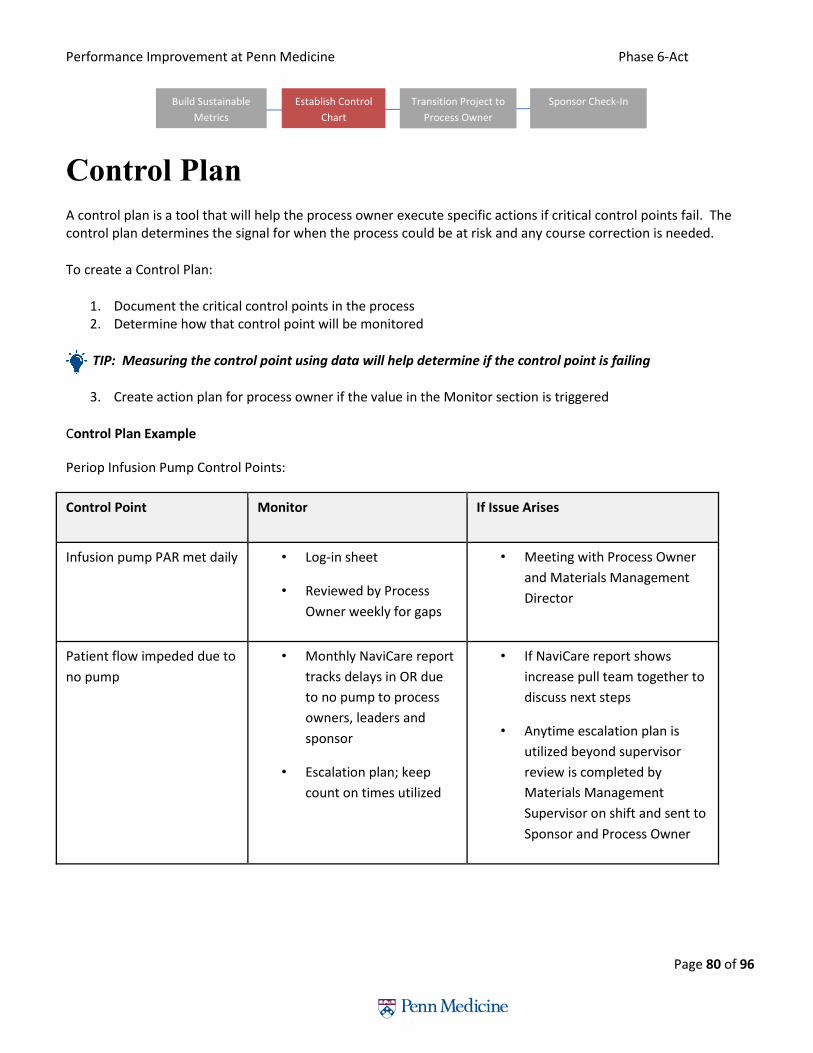
Performance Improvement at Penn Medicine Phase 6-Act
Page 80 of 96
Control Plan
A control plan is a tool that will help the process owner execute specific actions if critical control points fail. The control plan determines the signal for when the process could be at risk and any course correction is needed.
To create a Control Plan:
1. Document the critical control points in the process 2. Determine how that control point will be monitored
TIP: Measuring the control point using data will help determine if the control point is failing
3. Create action plan for process owner if the value in the Monitor section is triggered
Control Plan Example
Periop Infusion Pump Control Points:
Control Point Monitor If Issue Arises
Infusion pump PAR met daily • Log-in sheet
• Reviewed by Process
Owner weekly for gaps
• Meeting with Process Owner
and Materials Management
Director
Patient flow impeded due to
no pump
• Monthly NaviCare report
tracks delays in OR due
to no pump to process
owners, leaders and
sponsor
• Escalation plan; keep
count on times utilized
• If NaviCare report shows
increase pull team together to
discuss next steps
• Anytime escalation plan is
utilized beyond supervisor
review is completed by
Materials Management
Supervisor on shift and sent to
Sponsor and Process Owner
Build Sustainable
Metrics
Establish Control
Chart
Transition Project to
Process Owner
Sponsor Check-In
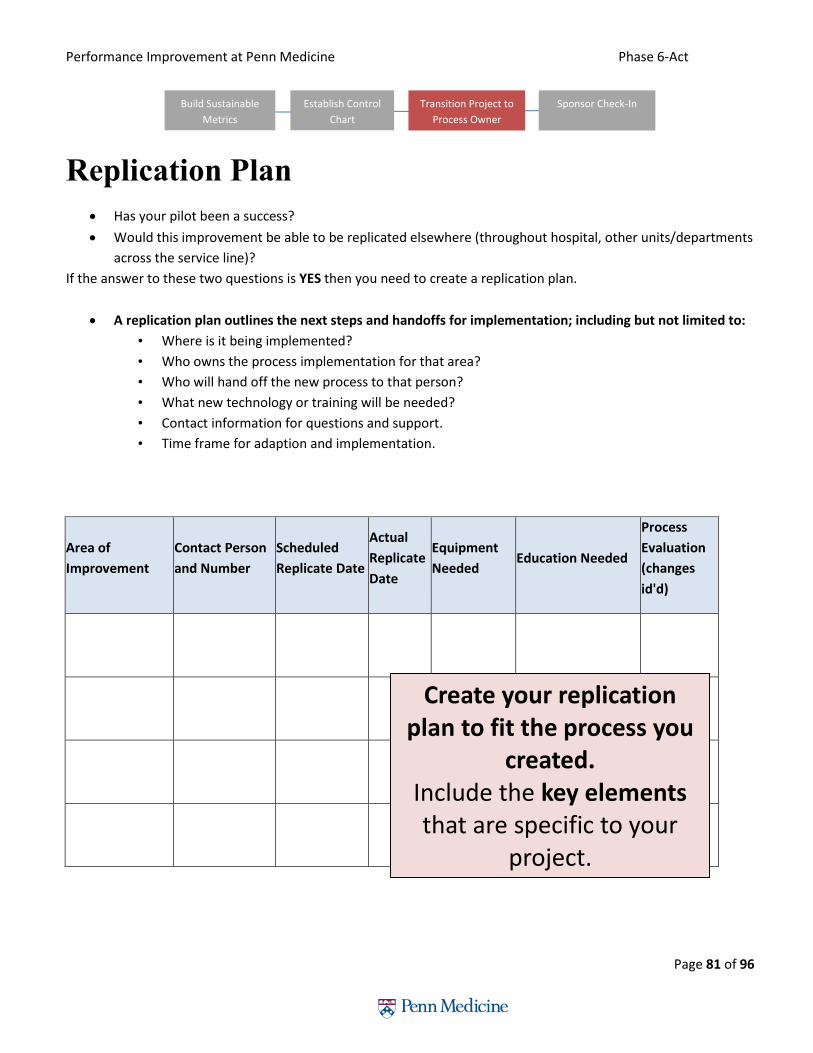
Performance Improvement at Penn Medicine Phase 6-Act
Page 81 of 96
Replication Plan
Has your pilot been a success?
Would this improvement be able to be replicated elsewhere (throughout hospital, other units/departments
across the service line)?
If the answer to these two questions is YES then you need to create a replication plan.
A replication plan outlines the next steps and handoffs for implementation; including but not limited to:
• Where is it being implemented?
• Who owns the process implementation for that area?
• Who will hand off the new process to that person?
• What new technology or training will be needed?
• Contact information for questions and support.
• Time frame for adaption and implementation.
Area of
Improvement
Contact Person
and Number
Scheduled
Replicate Date
Actual
Replicate
Date
Equipment
Needed Education Needed
Process
Evaluation
(changes
id'd)
Create your replication plan to fit the process you
created.
Include the key elements that are specific to your
project.
Build Sustainable
Metrics
Establish Control
Chart
Transition Project to
Process Owner
Sponsor Check-In

Performance Improvement at Penn Medicine Phase 6-Act
Page 82 of 96
Project Close

Performance Improvement at Penn Medicine Phase 6-Act
Page 83 of 96
Sponsor Check-In #3
At the end of the project, the sponsor should be updated with the results of the pilot and any plan to
expand the pilot or disseminate.
Tip: Showing the results graphically using data is a powerful way to show impact.
End of Act Phase Checklist:
Build Sustainable Metrics
Establish Control Chart
Transition Project to Process Owner
o Replicate/disemeniate
o Project Closure
Sponsor Check-In #3
Once you have completed the tasks in this phase, you can move on to the next.
Build Sustainable
Metrics
Establish Control
Chart
Transition Project to
Process Owner
Sponsor Check-In
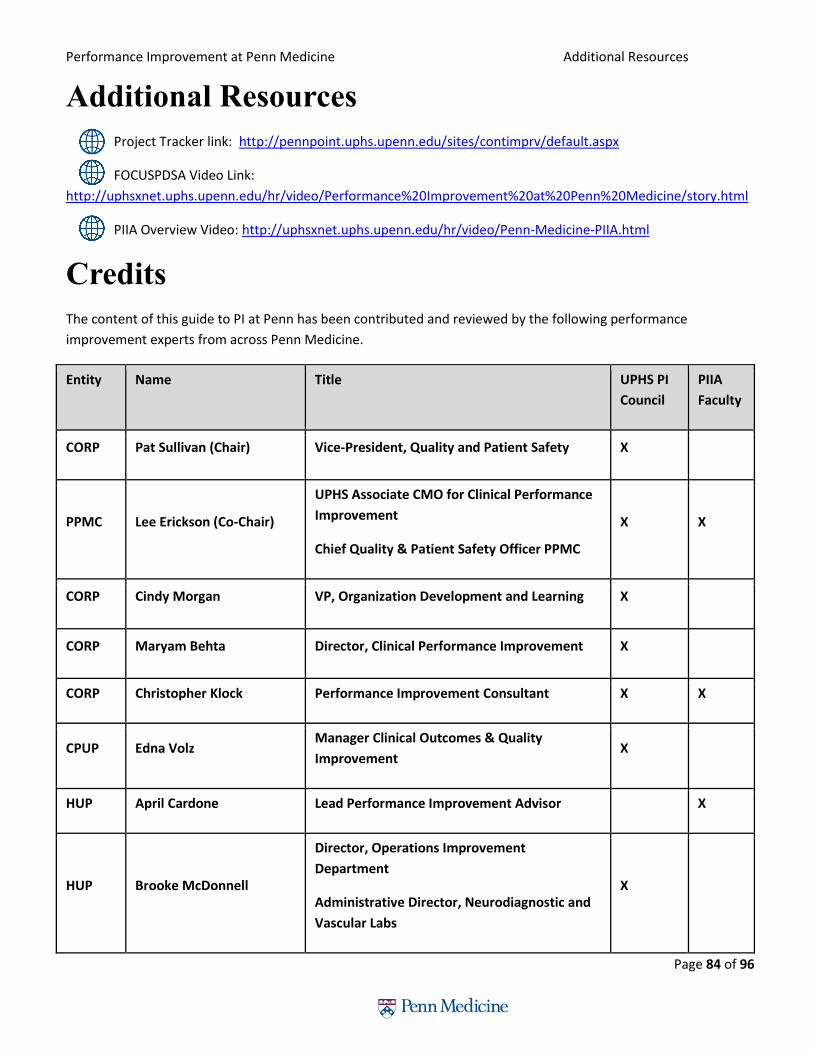
Performance Improvement at Penn Medicine Additional Resources
Page 84 of 96
Additional Resources
Project Tracker link: http://pennpoint.uphs.upenn.edu/sites/contimprv/default.aspx
FOCUSPDSA Video Link:
http://uphsxnet.uphs.upenn.edu/hr/video/Performance%20Improvement%20at%20Penn%20Medicine/story.html
PIIA Overview Video: http://uphsxnet.uphs.upenn.edu/hr/video/Penn-Medicine-PIIA.html
Credits
The content of this guide to PI at Penn has been contributed and reviewed by the following performance
improvement experts from across Penn Medicine.
Entity Name Title UPHS PI
Council
PIIA
Faculty
CORP Pat Sullivan (Chair) Vice-President, Quality and Patient Safety X
PPMC Lee Erickson (Co-Chair)
UPHS Associate CMO for Clinical Performance
Improvement
Chief Quality & Patient Safety Officer PPMC
X X
CORP Cindy Morgan VP, Organization Development and Learning X
CORP Maryam Behta Director, Clinical Performance Improvement X
CORP Christopher Klock Performance Improvement Consultant X X
CPUP Edna Volz Manager Clinical Outcomes & Quality
Improvement X
HUP April Cardone Lead Performance Improvement Advisor
X
HUP Brooke McDonnell
Director, Operations Improvement
Department
Administrative Director, Neurodiagnostic and
Vascular Labs
X

Performance Improvement at Penn Medicine Additional Resources
Page 85 of 96
Entity Name Title UPHS PI
Council
PIIA
Faculty
HUP Mike Posencheg Medical Director, Intensive Care Nursery and
Newborn Nursery X
HUP Jennifer Myers
Associate Professor of Clinical Medicine
Associate Designated Institutional Official for
Quality & Safety, GME
Director of Quality and Safety Education,
Perelman School of Medicine
X
HUP Scott Falk
Assistant Professor of Anesthesiology and
Critical Care
Director of Performance Improvement,
Quality, and Safety
X X
PAH Deborah Christopher Clinical Director, Quality X
PAH Patricia Harris Director of Patient Safety and Process
Improvement X

Performance Improvement at Penn Medicine Glossary
Page 86 of 96
Glossary of Terms
3Ms
Measure what you are interested in. Manage to the measure by educating others in what the measure means and why it is important. Make-it-easy to do the right thing. Used in performance improvement.
5 Whys Asking why numerous times to get to the root cause of a problem.
5S
Sort out what is not needed in a workplace. Straighten what remains. Shine the workplace. Standardize the workplace organization. Sustain the improved workplace organization.
8 Wastes Wastes from: defects, over-production, waiting, underutilized intellect, transportation, inventory, motion, and excess processing.
Catch-ball process A method to ensure or gain consensus. The author "tosses" the idea to a group and the group throws back consensus or modifications to the idea.
Champion Person supporting the team leader and team. May be the process owner.
Change Leadership Creating a vision of the future, engaging others, enabling them in the process of change and managing the change.
Charter High level project plan.
CI Continuous improvement.
Defect An undesirable characteristic. Example: an error in a med list.
D.O.W.N.T.I.M.E. Acronym for the 8 wastes.
Executive Sponsor Highest organization level project signatory. Responsible to define the work to be done and provide resources.
Fishbone chart/ Cause and Effect diagram
Used to identify possible root causes to an issue.
FMEA
Failure Modes and Effects Analysis. A process to Think how a process or product might fail and then prioritizing the failure modes and root causes to focus improvement efforts.
JIT
Just-In-Time. Often used as a goal for inventory management. Getting the supplies to the customer just when needed. Can be applied to coaching when the coaching is done when the behavior is occurring or just occurred.
Lean
A way of thinking and working to reduce waste. May include culture change to more productive and higher quality and safer ways.
NPS Net Promoter Score. A survey question to measure customer likelihood to recommend to a friend or colleague. Used in healthcare to measure patient satisfaction, as well as staff, physician and others' satisfaction.
PDCA Plan-Do-Check-Act. A step-by-step methodology to test improvements. Similar to PDSA (Study instead of Check).

Performance Improvement at Penn Medicine Glossary
Page 87 of 96
PDSA Plan-Do-Study-Act. A step-by-step methodology to test improvements. Similar to PDCA (Check instead of Study).
PI Performance Improvement.
PMLF - PIIA Penn Medicine Leadership Forum - Performance Improvement In Action. Opportunity for work teams, project leaders, and project facilitators to learn PI and practice using the new methodology and tools with a PI project.
Process Owner Person who owns the process involved in the performance improvement work.
Q x A = E Quality of the solution multiplied by the Acceptance of the solution will equal the Effectiveness of the solution.
RCA Root Cause Analysis. A process to investigate the root cause of an issue.
Rounding Go to the people in the process and see. Asking questions to check progress and offering assistance. A key leadership tool to successful PI.
Run Chart A time series chart used to determine if trends exist by counting the number of consecutive data points that form a pattern.
S.M.A.R.T. Specific, measurable, attainable, relevant and time-bound. Often used to assess usefulness of goal statements.
SIPOC A process map listing the Suppliers, Inputs, Process Steps, Outputs of each process and Customers of each process step. Used most often in quality and safety improvement efforts.
Six Sigma
A capability measure referring to 3.4 defects per million opportunities. A performance improvement methodology that includes defining the work to be done, measuring the baseline performance, analyzing for root causes to the issues, improving and controlling to sustain the capability.
Spaghetti Diagram A graphical method tracing the motion of people, information or equipment. Often used to show the waste of motion and transportation.
SPC Statistical Process Control. May refer to a time series chart with lines denoting the central tendency, upper limit expected in the data and a lower limit expected in the data.
Stakeholder Analysis
Identifying who might be affected or interested in a change. Preventing and reducing resistance by acknowledging stakeholders who might be affected by change and having a strategy to address to mitigate barriers.
Team Leader Person trained in PMLF-PIIA and responsible to guide the team in improvement.
VSM Value Stream Map. A process map that identifies the flow of people, products or information and is useful in identifying wastes to focus improvement efforts
What-Who-When plan
Action planning listing specifically what is to be done, by individual and by date.

Performance Improvement at Penn Medicine Appendix
Page 88 of 96
Appendix - Additional Tools
People
Change Management
Behavior Impact of Change
When a change or disruption to the current state is announced or introduced, there is a state of uncertainly which
causes dysfunction in the work environment. Effective change management will reduce the time between
disruption and recovery and minimize dysfunction.
Manage the execution for fast results
When a new process starts, there is always a dip in the baseline performance. Effective change management will
reduce the dip and get back to or above baseline performance quicker than if change management techniques
were not used.
Dysfunctional
Dysfunctional
Functional
Recovery
Dis
rupti
on
Dysfunctional
Dysfunctional
Functional
Recovery
Recovery
Dis
rupti
on
Dis
rupti
on
Dysfunctional
Dysfunctional
Functional
Recovery
Recovery
Dis
rupti
on
Dis
rupti
on
Dysfunctional
Dysfunctional
Functional
Expectations
=Perceptions
=
Recovery
Recovery
Dis
rupti
on
Dis
rupti
on
Expectations
=Perceptions
Time to Adapt
Dysfunctional
Dysfunctional
Functional
Recovery
Recovery
Dis
rupti
on
Dis
rupti
on
Dysfunctional
Dysfunctional
Functional
Recovery
Recovery
Dis
rupti
on
Dis
rupti
on
Dysfunctional
Dysfunctional
Functional
Recovery
Recovery
Dis
rupti
on
Dis
rupti
on
Dysfunctional
Dysfunctional
Functional
Expectations
=Perceptions
=Expectations
=Perceptions
=
Recovery
Recovery
Dis
rupti
on
Dis
rupti
on
Expectations
=Perceptions
Expectations
=Perceptions
Time to Adapt

Performance Improvement at Penn Medicine Appendix
Page 89 of 96
Steps
Create a sense of Urgency
Communicate why this is important to them, the organization, customers, patients
Create and Communicate a Vision
Show people what it “could” look like
Design your “future state”
Empower Teammates/Staff to act on the Vision
Remove Obstacles
Encourage Reinforcing Behaviors
Plan Short Term Wins
Set Milestone Goals along the Way
Keep Score – Make it visible
Sustain and Invigorate the Change
Creates a culture of continuous improvement
New Social norms and Shared sense of achievement among team, staff
Understand your population
Enthusiastic Cheerleaders
• Excited About the Change
• Comfortable with the Process of Change
• Usually about 10-15%
• They can Pull the Neutrals towards the change
Neutral
• Most People – 70-80%
• Will Change – Not Enthusiastic
Resistors
• 10-15%
• Dislike Change
• May Have a Good Reason – Harness the Naysayers and Skeptics on your staff

Performance Improvement at Penn Medicine Appendix
Page 90 of 96
Team Dynamics (Level of complexity: Medium) Teams naturally go through several stages of group dynamics. It is important for teams to go through each phase
so that the “performing” stage is productive.
Stages of
Group
Dynamics
Tasks of the Stage Examples of Conflicts that Might Arise Possible Approaches
to Getting Through
1. Forming • Joining
• Welcoming
• Understanding the
purpose
• Building relationships
• If purpose or membership seems exclusive, or
people don’t feel welcome, they might not
join in or might be tentative or suspicious
• If leaders set an exclusive tone, others may
follow
• Individual outreach
• Listening openly to
members
2. Norming • Setting expectations
• Establishing styles
• Learning leadership
and member roles
• Establishing processes
• Establishing goals
• If expectations are not clear people may not
meet them – if expectations are not may
frustrations may arise
• If judgments arise about styles and roles
people may act critically
• If oppressive behavior happens people may be
hurt, want apologies and/or may want to quit
• If organization's goals don’t match members
goal, members may be frustrated
• Team-building on
expectations or style
inventories
• Leaders stating
expectations
• Individual
confrontations and
listening
• Group discussions
3. Storming • Airing dissatisfaction
• Finding ways through
conflict
• Assessing leadership
• Assessing member role
• If people attack the leader or org, the leader
may be defensive
• If the leader doesn’t deal with conflict in the
manner members want, members may feel
distrust and judge the leader
• A “support the
leader” exercise
• Individual
discussions
• Group discussion
4.
Performing
• Functioning well
• Seeing conflict as
opportunity
• If there are unresolved issues, they will keep
resurfacing
• If member performance isn’t supported,
member may burn out or attack leadership
• If leadership isn’t supported, leader may burn
out, not appreciate members, not cultivate
new leaders
• Group discussions
• Appreciations for
members and
leaders
5. Adjourning • Putting closure on
tasks
• Putting closure on
relationships
• Preparing for Next
Group
• If people have unspoken feelings about
closure, they may procrastinate or otherwise
sabotage projects
• Team-building about
“closure” and the
importance of
acknowledging
feelings while taking
care of tasks

Performance Improvement at Penn Medicine Appendix
Page 91 of 96
Data
Run Chart (Level of complexity: low) The purpose of a run chart is to visually measure data over time. This tool will be used in Phase 2 and 5.
How to use:
1. Collect numerical data over time
2. Create a X and Y axis
3. Put the time intervals on the X axis
4. Put the time results on the Y axis
5. Plot the results and it relates to the time intervals
Expected Outcome: Line graph representing data over time.
Key Points:
1. Look at the data over time to see if there are seasonal trends
2. Try to have closer to 30 data points
Run Chart Example

Performance Improvement at Penn Medicine Appendix
Page 92 of 96
Bar Chart (Level of complexity: Low) The purpose of a bar chart is to visually represent a measurement of categories or groups. This tool will be used in
Phase 2 and 5.
How to use:
1. Collect Data
2. Group the data in categories or bins
3. Count the units of measures for each category or bin
4. On the x axis, list the categories or bins
5. On the y axis, list the counts
6. Draw bars representing the count of the categories
Expected Outcomes: A graphical representation of the data associated to each category or bin.
Bar Chart Example:
Performance Improvement at Penn Medicine Appendix
Page 93 of 96
Takt Time (Level of complexity: Low) The purpose of Takt Time is to determine the time frequency to complete each unit of measure with the available
time. This tool will be used on Phase 2 and 5.
How to use:
1. Determine the net time available to work (T)
2. Determine the demand (D)
3. Divide T/D to get the takt time
Example:
There are 8 hours in an available in day or 480 minutes.
A practice has 65 patients scheduled.
In a 1 room model the practice would need to see each patient every 7.5 minutes.
Hint: In this example, multiply the number of available rooms by the available hours. If there are 4 rooms than the
available minutes would be 1920 minutes making the final answer 30 minutes per patient.
Expected Outcomes: The frequency at which the units measure needs to be completed to meet the demand of the
customer
Cycle Time (Level of Complexity: Low) The purpose of this tool is to measure the total time for one unit of measurement to go through the process being
studied from beginning to the end. The tool will be used in Phase 2 and Phase 5.
How to use:
1. Determine the start point of the process
2. Determine the end point of the process
a. HINT: Look at the project scope to determine start and end points
3. Measure 1 unit of measurement going through the process
Expected Outcomes: The time that it takes one unit of measure to go through the process.
Key Points: Cycle times will most likely be different. The difference determines the variation in the process. When
measuring variation, use standard deviation. Do not just look at the average alone.
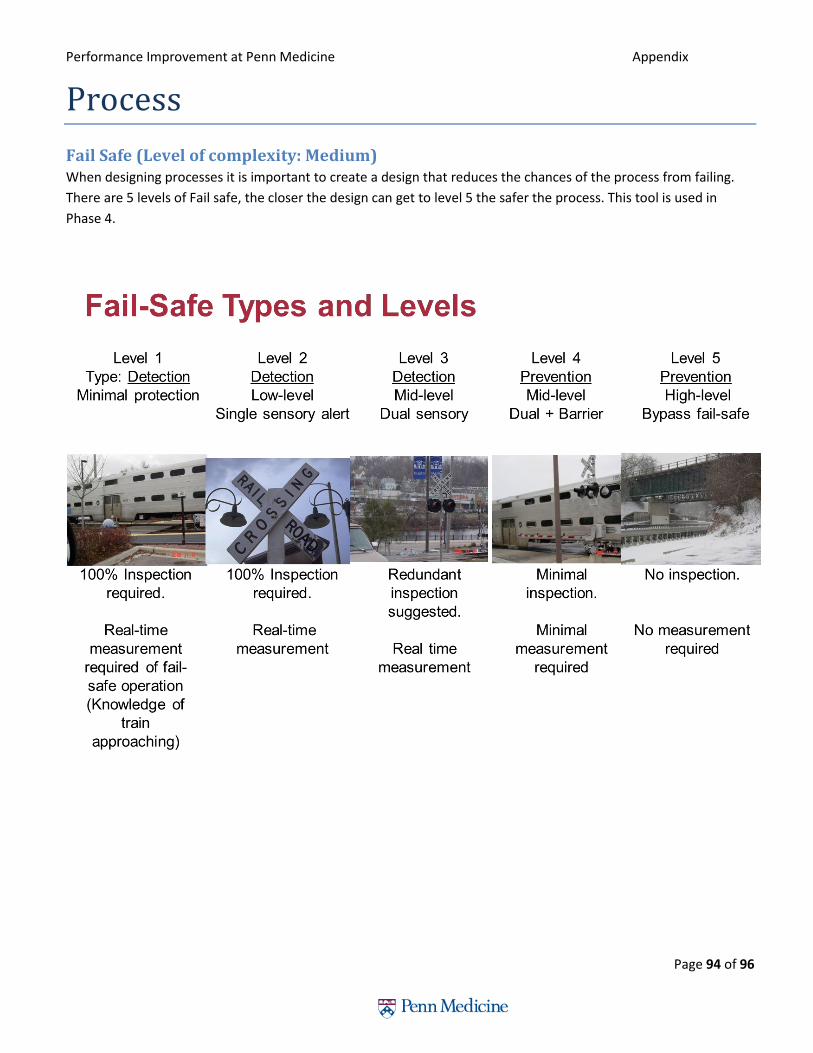
Performance Improvement at Penn Medicine Appendix
Page 94 of 96
Process
Fail Safe (Level of complexity: Medium) When designing processes it is important to create a design that reduces the chances of the process from failing.
There are 5 levels of Fail safe, the closer the design can get to level 5 the safer the process. This tool is used in
Phase 4.

Performance Improvement at Penn Medicine Appendix
Page 95 of 96
Error Proofing - Poka Yoke (Level of complexity: Medium) When designing a product it is important to create a design that reduces the chance of users causing errors. This
tool is used in Phase 4.
Expected Outcome: A product designed so that errors cannot be made.
Examples:
• Oxygen and Nitrogen valves in a hospital are design to only accept Oxygen and Nitrogen cables so they do not get mixed up.
• Car keys are one of the most widely used poka yoke devices. They can be inserted with either side up. • Overflow drains on a sink (the holes high up on the side) are examples of poka yoke devices that prevent
making a mess when filling the basin up with water. • Most computer manufacturers poka yoke their cables so the plugs only fit in one way. This prevents
damage to the system. • Printers stop printing when the paper is out. This keeps them from spreading ink all over the internal
mechanisms of the machine. • A sensor in a gas nozzle knows when your tank is full. This is a poka yoke that prevents dangerous messes
by shutting off the pump.
Pull (Level of Complexity: Hard) The purpose of this tool is to create a system were process are triggered only when requested or pulled.
How to Use:
1. Design a process that “calls” other processes
2. Design the “call” processes to only start when called
Expected Outcome: A system that is designed to only trigger processes when needed. The processes that need to
be triggered will not waste time producing unless needed.
Key Points: The concept of a Pull system is easy design and set up however the implementation is very hard.
Example: An Inpatient Consult service. If a patient needs a specific consult then an order is put in which triggers
that service to come to the patient. Otherwise the patient will not be seen by that service and the service can be
utilized by others.


![[PPT]Quality Improvement: Problem Solving - Saint …homepages.stmartin.edu/fac_staff/dstout/MEM650/Ch03... · Web viewTitle Quality Improvement: Problem Solving Subject PDCA Cycle](https://img.dokumen.tips/doc/110x75/5aeac4fc7f8b9a36698d7378/pptquality-improvement-problem-solving-saint-viewtitle-quality-improvement.jpg)