Embed Size (px)
Citation preview
A Structural Reevaluation of the Collapse of World Trade Center 7
Authors J. Leroy Hulsey, Ph.D., P.E., S.E.,
University of Alaska Fairbanks
And
Zhili Quan, Ph.D., Bridge Engineer South Carolina Department of Transportation
And
Feng Xiao, Ph.D., Associate Professor
Nanjing University of Science and Technology Department of Civil Engineering
Department of Civil and Environmental Engineering College of Engineering and Mines Institute of Northern Engineering
University of Alaska Fairbanks Fairbanks, AK 99775
Prepared for:
Architects & Engineers for 9/11 Truth
INE Report 18.17
March 2020

i
Recommended citation: Hulsey, J.L., Quan, Z., and Xiao, F., 2020. A Structural Reevaluation of the Collapse of World Trade Center 7 – Final Report. Department of Civil and Environmental Engineering, College of Engineering and Mines, Institute of Northern Engineering, University of Alaska Fairbanks, Fairbanks, AK, INE Report 18.17, 112 pp.
For additional information, write to: Publications – David Barnes, Project Manager Institute of Northern Engineering University of Alaska Fairbanks P.O. Box 755860 Fairbanks, AK 99775-5860 The University of Alaska Fairbanks is an affirmative action/equal opportunity employer and educational institution. UAF does not discriminate on the basis of race, religion, color, national origin, citizenship, age, sex, physical or mental disability, status as a protected veteran, marital status, changes in marital status, pregnancy, childbirth or related medical conditions, parenthood, sexual orientation, gender identity, political affiliation or belief, genetic information, or other legally protected status. The University’s commitment to nondiscrimination, including against sex discrimination, applies to students, employees, and applicants for admission and employment. Contact information, applicable laws, and complaint procedures are included on UA’s statement of nondiscrimination available at www.alaska.edu/nondiscrimination/
ii
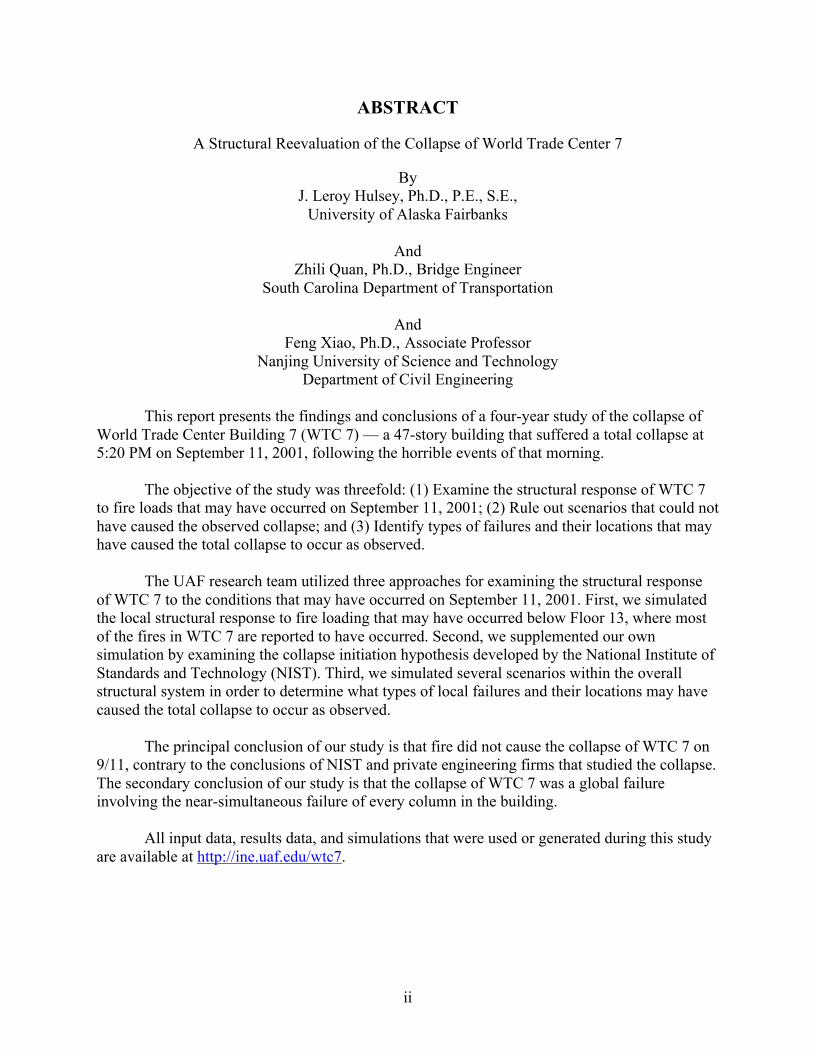
ABSTRACT
A Structural Reevaluation of the Collapse of World Trade Center 7
By J. Leroy Hulsey, Ph.D., P.E., S.E.,
University of Alaska Fairbanks
And Zhili Quan, Ph.D., Bridge Engineer
South Carolina Department of Transportation
And Feng Xiao, Ph.D., Associate Professor
Nanjing University of Science and Technology Department of Civil Engineering
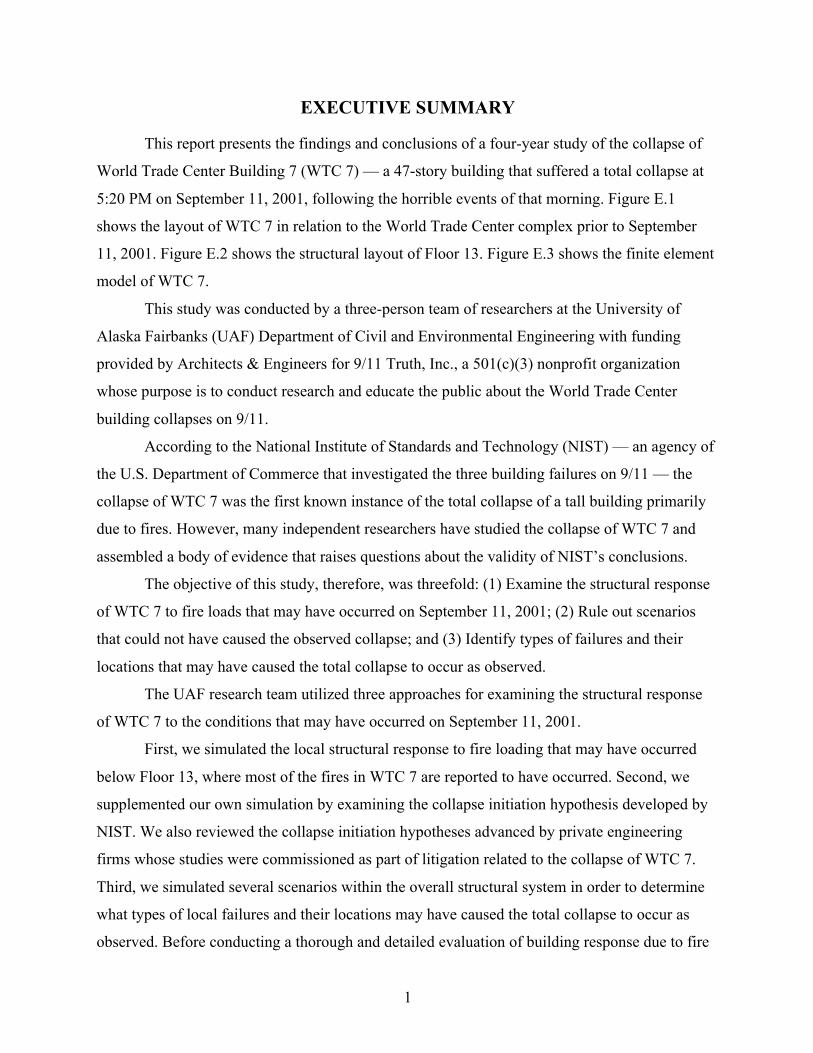
This report presents the findings and conclusions of a four-year study of the collapse of World Trade Center Building 7 (WTC 7) — a 47-story building that suffered a total collapse at 5:20 PM on September 11, 2001, following the horrible events of that morning. The objective of the study was threefold: (1) Examine the structural response of WTC 7 to fire loads that may have occurred on September 11, 2001; (2) Rule out scenarios that could not have caused the observed collapse; and (3) Identify types of failures and their locations that may have caused the total collapse to occur as observed. The UAF research team utilized three approaches for examining the structural response of WTC 7 to the conditions that may have occurred on September 11, 2001. First, we simulated the local structural response to fire loading that may have occurred below Floor 13, where most of the fires in WTC 7 are reported to have occurred. Second, we supplemented our own simulation by examining the collapse initiation hypothesis developed by the National Institute of Standards and Technology (NIST). Third, we simulated several scenarios within the overall structural system in order to determine what types of local failures and their locations may have caused the total collapse to occur as observed. The principal conclusion of our study is that fire did not cause the collapse of WTC 7 on 9/11, contrary to the conclusions of NIST and private engineering firms that studied the collapse. The secondary conclusion of our study is that the collapse of WTC 7 was a global failure involving the near-simultaneous failure of every column in the building. All input data, results data, and simulations that were used or generated during this study are available at http://ine.uaf.edu/wtc7.

iii
EXTERNAL PEER REVIEWERS
Gregory Szuladzinski, Ph.D Chartered Consulting Engineer Analytical Service Company
Robert Korol, Ph.D
Emeritus Professor of Civil Engineering McMaster University
ACKNOWLEDGEMENTS
We would like to thank Dr. Larry Hinzman, Vice Chancellor for Research, University of Alaska Fairbanks (UAF), for his encouragement and support and Marmian Grimes, Senior Public Information Officer, for her efforts to bring our research findings to the public.
We would also like to thank the College of Engineering and Mines, the Department of
Civil and Environmental Engineering (CEE), and the Institute of Northern Engineering (INE) at the University of Alaska Fairbanks. In particular, we would like to thank the school for providing the graduate student support that was instrumental in conducting this research.
We would also like to thank the personnel at INE for their help and encouragement. We
especially want to thank Sandra Boatwright (Proposals and Publications Manager); Kathy Peterson (Grant Manager); Joan Welc-LePain (Proposal Coordinator); Joel Bailey (Research Professional) for his IT support; and Melanie Rohr (Web Designer) for her posting the work on the INE website.
In addition to the university and its personnel, we would like thank Architects &
Engineers for 9/11 Truth (AE911Truth) for providing the funding to conduct this research. We also want to thank John Thiel for approaching Dr. Hulsey to conduct this research. We also want to thank independent, external reviewers and the public who provided comments during a two-month review period.
DISCLAIMER
This document is disseminated under the sponsorship of Architects & Engineers for 9/11 Truth, in the interest of information exchange. Architects & Engineers for 9/11 Truth assumes no liability for use of the information contained in this document. Architects & Engineers for 9/11 Truth does not endorse products or manufacturers. Trademarks or manufacturers’ names appear in this report only because they are considered essential to the objective of the document. Opinions and conclusions expressed or implied in the report are those of the authors. They are not necessarily those of the funding agency.
iv
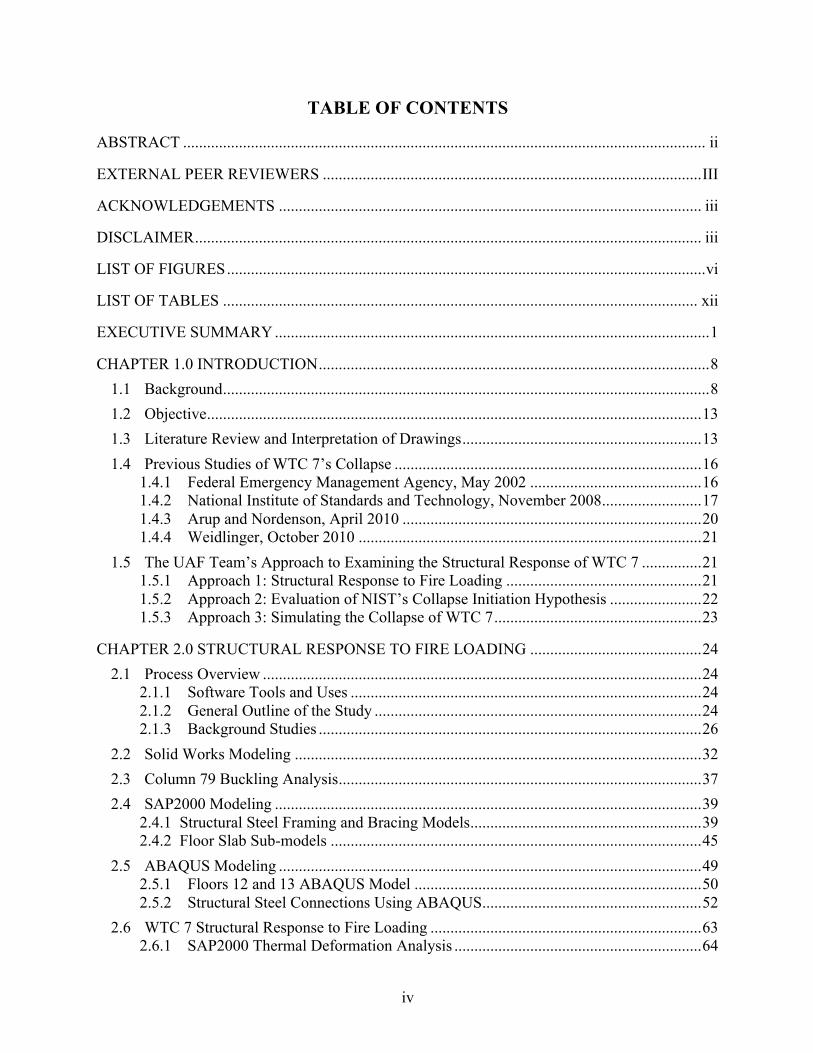
TABLE OF CONTENTS
ABSTRACT ................................................................................................................................... ii
EXTERNAL PEER REVIEWERS ............................................................................................... III
ACKNOWLEDGEMENTS .......................................................................................................... iii
DISCLAIMER ............................................................................................................................... iii
LIST OF FIGURES ........................................................................................................................ vi
LIST OF TABLES ....................................................................................................................... xii
EXECUTIVE SUMMARY ............................................................................................................. 1
CHAPTER 1.0 INTRODUCTION .................................................................................................. 8
1.1 Background .......................................................................................................................... 8
1.2 Objective ............................................................................................................................ 13
1.3 Literature Review and Interpretation of Drawings ............................................................ 13
1.4 Previous Studies of WTC 7’s Collapse ............................................................................. 16 1.4.1 Federal Emergency Management Agency, May 2002 ........................................... 16 1.4.2 National Institute of Standards and Technology, November 2008 ......................... 17 1.4.3 Arup and Nordenson, April 2010 ........................................................................... 20 1.4.4 Weidlinger, October 2010 ...................................................................................... 21
1.5 The UAF Team’s Approach to Examining the Structural Response of WTC 7 ............... 21 1.5.1 Approach 1: Structural Response to Fire Loading ................................................. 21 1.5.2 Approach 2: Evaluation of NIST’s Collapse Initiation Hypothesis ....................... 22 1.5.3 Approach 3: Simulating the Collapse of WTC 7 .................................................... 23
CHAPTER 2.0 STRUCTURAL RESPONSE TO FIRE LOADING ........................................... 24
2.1 Process Overview .............................................................................................................. 24 2.1.1 Software Tools and Uses ........................................................................................ 24 2.1.2 General Outline of the Study .................................................................................. 24 2.1.3 Background Studies ................................................................................................ 26
2.2 Solid Works Modeling ...................................................................................................... 32
2.3 Column 79 Buckling Analysis ........................................................................................... 37
2.4 SAP2000 Modeling ........................................................................................................... 39 2.4.1 Structural Steel Framing and Bracing Models .......................................................... 39 2.4.2 Floor Slab Sub-models ............................................................................................. 45
2.5 ABAQUS Modeling .......................................................................................................... 49 2.5.1 Floors 12 and 13 ABAQUS Model ........................................................................ 50 2.5.2 Structural Steel Connections Using ABAQUS ....................................................... 52
2.6 WTC 7 Structural Response to Fire Loading .................................................................... 63 2.6.1 SAP2000 Thermal Deformation Analysis .............................................................. 64
v
2.6.2 ABAQUS Analysis ................................................................................................. 68
2.7 Summary and Conclusion .................................................................................................. 73
CHAPTER 3.0 EVALUATION OF NIST’S COLLAPSE INITIATION HYPOTHESIS ........... 75
3.1 Methodology and Modeling Assumptions ........................................................................ 75 3.1.1 NIST’s Modeling Assumptions Used by UAF Team ............................................. 75
3.2 Evaluation and Discussion of NIST’s Collapse Initiation Hypothesis .............................. 77 3.2.1 Girder A2001 Trapped by Side Plate ...................................................................... 77 3.2.2 Girder A2001 Web Stiffeners Prevent Flange Failure and Girder Walk-off .......... 80 3.2.3 Lateral Support Beams Prevent Beam Buckling .................................................... 83
3.3 Evaluation of the Arup and Nordenson Collapse Initiation Hypothesis ........................... 87 3.3.1 Discussion of Arup and Nordenson’s Analysis ...................................................... 87
3.4 Evaluation of the Weidlinger Collapse Initiation Hypothesis ........................................... 91 3.4.1 Discussion of Weidlinger’s Collapse Initiation Hypothesis ................................... 91
CHAPTER 4.0 SIMULATING THE COLLAPSE OF WTC 7 .................................................... 92
4.1 Key Features of the Collapse ............................................................................................. 92 4.1.1 Discussion of NIST’s Progressive Collapse Simulation ........................................ 92
4.2 The UAF Research Team’s Approach .............................................................................. 94 4.2.1 Hypothetical Failure Mechanisms for the East Penthouse Collapse ...................... 94 4.2.2 Hypothetical Failure Mechanisms for West Penthouse and North Face Roofline
Collapse .................................................................................................................. 95
4.3 Results of the East Penthouse Collapse Analyses ............................................................. 95
4.4 Linear and Dynamic Analytical Methods .......................................................................... 99
4.5 Results from Analysis of NIST’s Horizontal Core Column Failure Scenario .................. 99
4.6 Results of Core Column/Exterior Column Failure Analysis ........................................... 105
4.7 Summary and Conclusion ................................................................................................ 109
REFERENCES ............................................................................................................................ 111
vi
LIST OF FIGURES
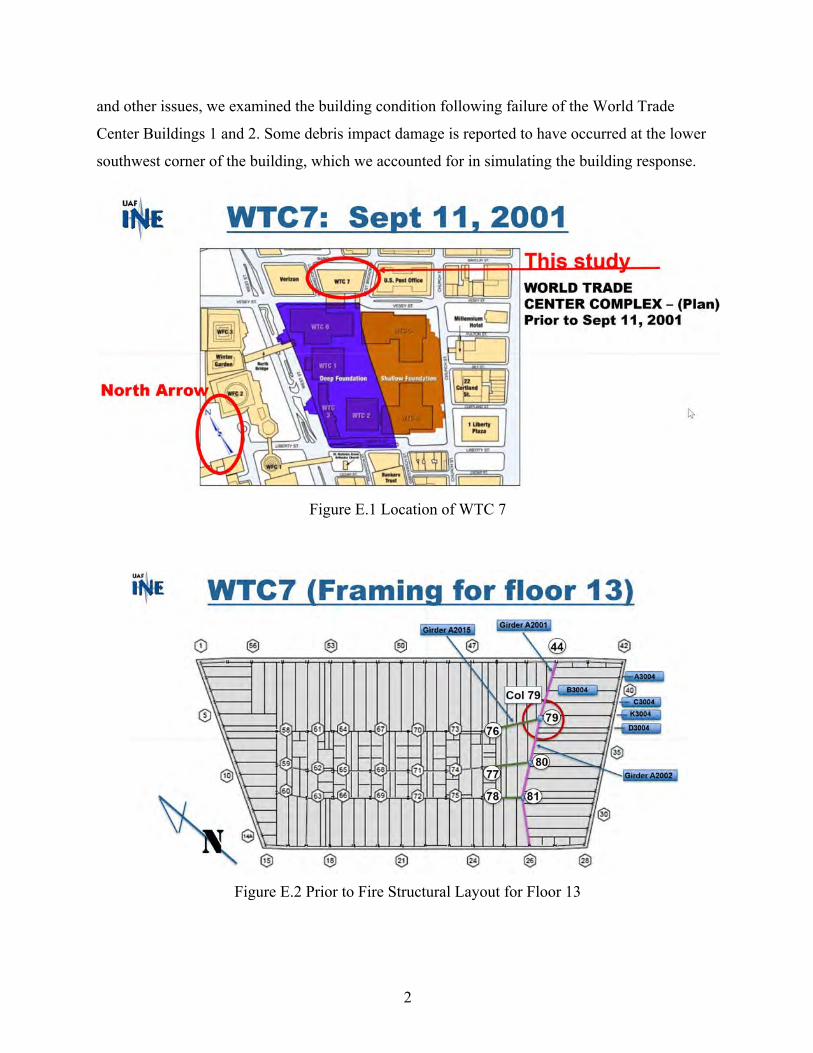
Figure E.1 Location of WTC7 ......................................................................................................... 2
Figure E.2 Prior to Fire Structural Layout for Floor 13 .................................................................. 2
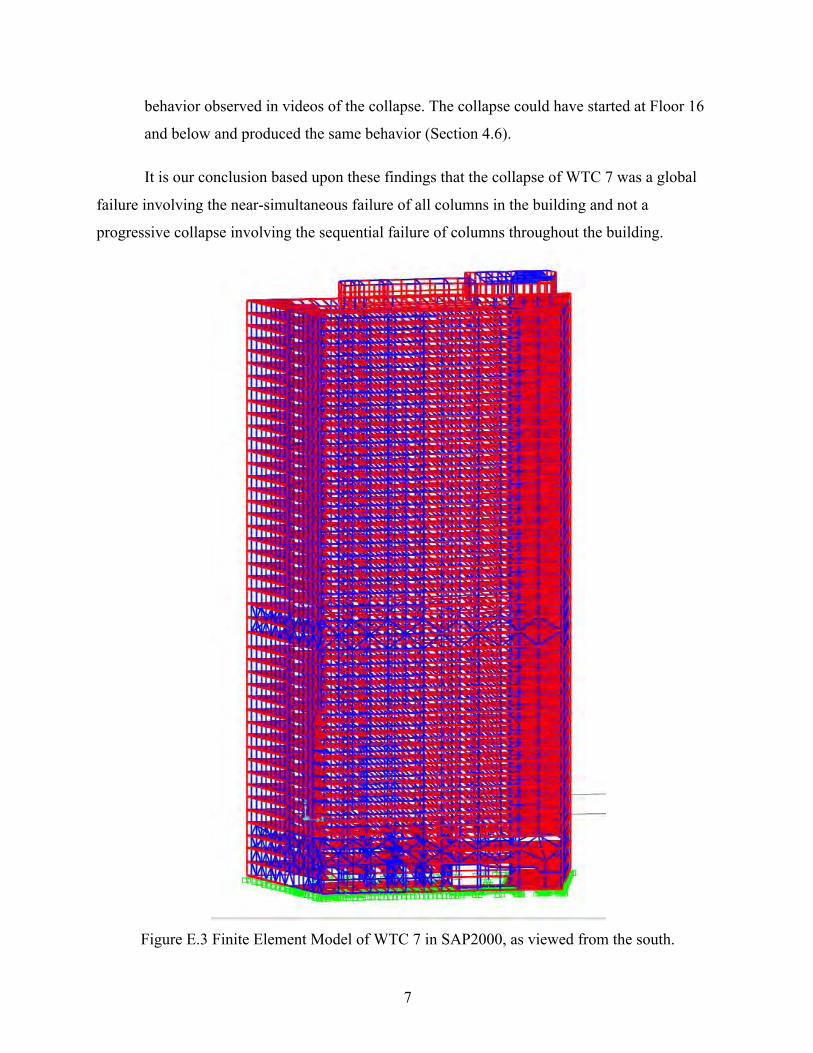
Figure E.3 Finite Element Model of WTC7 in SAP2000, as viewed from the south. .................... 7
Figure 1.1 A three-dimensional depiction of the World Center complex (FEMA, 2002). ............. 8
Figure 1.2 A plan view of the World Trade Center complex (FEMA, 2002). ................................ 9
Figure 1.3 WTC 7 seen from the north on September 11, 2001 (NYPD). ...................................... 9
Figure 1.4 WTC 7 tenants on September 11, 2001 (FEMA, 2002). .............................................. 10
Figure 1.5 The collapse of WTC 7 at 5:20 PM (source unknown). .............................................. 11
Figure 1.6 WTC 7 was in free fall for approximately 2.25 seconds over a distance of approximately 8 stories or 32.0 meters (NIST, 2008, NCSTAR 1A). ....................... 12
Figure 1.7 WTC 7 debris pile (NOAA, September 23, 2001). ...................................................... 13
Figure 1.8 Steel from WTC 7 that experienced oxidation and sulfidation (FEMA, 2002). .......... 13
Figure 1.9 WTC 7 steel frame building geometry prior to its collapse (FEMA, 2002). ............... 14
Figure 1.10 Whole framing plan view of Floors 12 and 13. ......................................................... 15
Figure 1.11 Zoomed-in view of Floors 12 and 13. ........................................................................ 15
Figure 1.12 Part of the drawing for Column 79 of Floor 13. ........................................................ 16
Figure 1.13 Floor plan for 12th and 13th floors. ............................................................................. 18
Figure 1.14 Magnified portion of the northeast corner at Floor 13. .............................................. 18
Figure 2.1 Axial spring used to simulate shear ............................................................................. 27
Figure 2.2 Rotational Nonlinear Springs ....................................................................................... 27
Figure 2.3 Approach used to model buckled beams in LS-DYNA model (NIST, 2008, NCSTAR 1-9, Vol. 2). ............................................................................................... 28
Figure 2.4 Shear connection damage; LS-DYNA model (NIST, 2008, NCSTAR 1-9, Vol. 2). ................................................................................................................................ 29
Figure 2.5 Area of floor where connection failure was modeled by NIST ................................... 30
vii
Figure 2.6 Progressive collapse separated into two parts. ............................................................. 31
Figure 2.7 Concrete with voids for welded wire fabric as reinforcement. .................................... 33
Figure 2.8 Welded wire fabric reinforcement. .............................................................................. 33
Figure 2.9 Gauge 20 metal deck. ................................................................................................... 34
Figure 2.10 Temperature distribution of the unit floor slab (the small projections are heat flux indications in the FEA program). ........................................................................ 34
Figure 2.11 Equivalent floor slab and unassembled reinforced concrete slab of WTC 7. ............ 35
Figure 2.12 Equivalent floor slab and assembled reinforced concrete slab of WTC 7. ................ 35
Figure 2.13 Heat flux of the two models (the small projections are heat flux indications in the FEA program). ...................................................................................................... 36
Figure 2.14 Small section of floor slab supported by a girder without insulation. ....................... 36
Figure 2.15 Small section of floor slab supported by a girder with insulation. ............................ 37
Figure 2.16 Cross section of Column 79. ...................................................................................... 38
Figure 2.17 Mechanical properties of steel against temperature. .................................................. 38
Figure 2.18 Load capacity of Column 79 versus effective length at different temperatures. ....... 39
Figure 2.19 SAP2000 model for Floor 3 to Floor 7 with bracing. ................................................ 40
Figure 2.20 SAP2000 model for Floors 22 to 24 with bracing and released joints. ..................... 40
Figure 2.21 SAP2000 model of entire WTC 7 without roof. ........................................................ 41
Figure 2.22 SAP2000 model for Floor 12 to Floor 47. ................................................................. 42
Figure 2.23 SAP2000 model for Floor 3 to Floor 12. ................................................................... 42
Figure 2.24 Column number layout of Floor 13 (NIST, 2008, NCSTAR 1A). ............................ 43
Figure 2.25 Typical floor detail of WTC 7. ................................................................................... 45
Figure 2.26 Small section of typical floor slab of WTC 7 with finer meshing. ............................ 46
Figure 2.27 Example of mesh used to study convergence performance for a WTC 7 floor slab. ............................................................................................................................ 47
Figure 2.28 Models of floor slabs with different meshing. ........................................................... 47
Figure 2.29 Plan View: Model of floor slabs in strong direction (parallel to flutes). ................... 48
viii
Figure 2.30. Plan View: Model of floor slabs in weak direction (perpendicular to flutes). .......... 49
Figure 2.31 Floor 12 and 13 ABAQUS model. ............................................................................. 50
Figure 2.32 The link for deck and beam. ....................................................................................... 50
Figure 2.33 Simple beam and deck. .............................................................................................. 51
Figure 2.34 Three beam decks with different numbers of links. ................................................... 51
Figure 2.35 The error between ABAQUS and hand calculation for three models. ....................... 52
Figure 2.36 Modeling process for a beam to girder shear connector, “STC.” .............................. 53
Figure 2.37 WTC 7 Type “F” beam to girder connection ............................................................. 54
Figure 2.38 The location for a Type “F” Connector ..................................................................... 54
Figure 2.39 a. Connections modeling and shear-displacement nonlinear curve ........................... 55
Figure 2.39 b. Nonlinear spring ..................................................................................................... 55
Figure 2.39 c. Nonlinear spring in WTC 7 modeling .................................................................... 55
Figure 2.40 Fin connection sample ABAQUS model. .................................................................. 56
Figure 2.41 Header connection sample ABAQUS model. ............................................................ 56
Figure 2.42 Knife connection sample ABAQUS model ............................................................... 57
Figure 2.43 Seated top plate connection sample ABAQUS model. .............................................. 57
Figure 2.44 Seated top clip connection to column ABAQUS model. ........................................... 58
Figure 2.45 Seated web clip connection to interior girder ABAQUS model. ............................... 58
Figure 2.46 Seated moment connection of exterior girders to exterior columns ABAQUS model. ......................................................................................................................... 59
Figure 2.47 Fin connection (F): a. moment-rotation, b. shear-displacement. ............................... 60
Figure 2.48 Header connection (H): a. moment-rotation, b. shear-displacement. ........................ 60
Figure 2.49 Knife connection (K): a. moment-rotation, b. shear-displacement. ........................... 61
Figure 2.50 Seated top plate connection (STP): a. moment-rotation, b. shear-displacement. ...... 61
Figure 2.51 Seated top clip connection (STC): a. moment-rotation, b. shear-displacement. ........ 62
Figure 2.52 Seated web clip connection (SWC): a. moment-rotation, b. shear-displacement. ..... 62

ix
Figure 2.53 Moment connection (MC): a. moment-rotation, b. shear-displacement. ................... 63
Figure 2.54 a. Floor 12, b. Floor 13 (NIST, 2008, NCSTAR 1-9, Vol. 2, Figures 10-36 to 10-39). ........................................................................................................................ 64
Figure 2.55 Beams on Floors 12 and 13 that had shear studs (NIST assumption). ....................... 65
Figure 2.56 Assembly of Floors 12 and 13 in SAP2000. .............................................................. 66
Figure 2.57 Displacement (inches) of Floor 13 in the east-west direction (in-the plane of the floor) ..................................................................................................................... 67
Figure 2.58 Displacement (inches) of Floor 13 in the south-north direction (in-the plane of the floor) ..................................................................................................................... 67
Figure 2.59 Displacement (inches) of the floor system surrounding Column 79. ........................ 68
Figure 2.60 ABAQUS Model for Floors 12 and 13. ..................................................................... 69
Figure 2.61 Movement (inches) in x-direction at Floor 12. .......................................................... 69
Figure 2.62 Movement (inches) in x-direction at Floor 13. .......................................................... 70
Figure 2.63 Movement (inches) in x-direction at Floor 13 around Column 79. ........................... 70
Figure 2.64 The part of the Floor 13 frame we examined is shown in red. ................................... 71
Figure 2.65 Local frame boundary conditions reported by NIST. ................................................ 72
Figure 2.66 Transverse displacement at the end of A2001 using the NIST assumptions. ............ 73
Figure 3.1 Member identification for the finite element analyses discussed below. ..................... 76
Figure 3.2 ABAQUS Solid model at northeast corner of Floor 13. .............................................. 77
Figure 3.3 Column 79 section showing side plates welded to a W14x730. .................................. 78
Figure 3.4 Plan view showing girder A2001 trapped by the Column 79 side plate. ..................... 78
Figure 3.5 Plan View for Floor 13 at Column 79 and girder A2001 seat connection (Data from Frankel Steel Limited, 1985, Drawing 9114; figure prepared by Brookman, 2012). ....................................................................................................... 79
Figure 3.6 Section view at Floor 13 of Column 79 and girder A2001 seated beam connection, which shows stiffener plates on girder A2001 (Data from Frankel Steel Limited, 1985, Drawing 9114; figure prepared by Brookman, 2012). ............. 80
Figure 3.7 Plan view shows girder A2001 being pushed laterally past notched western side plate. ........................................................................................................................... 81
x
Figure 3.8 Analysis showing girder web A2001 pushed laterally past the bearing seat at Column 79. The column is removed for clarity. ........................................................ 82
Figure 3.9 Drawing of Column 79 and girder A2001 seated beam connection shown in Figure 8-21 of the NIST report. .................................................................................. 83
Figure 3.10 Figure 8-23 of the NIST report showing NIST’s finite element analysis of the Column 79 and girder A2001 seated beam connection. ............................................. 83
Figure 3.11 UAF ABAQUS analysis shows beam G3005 does not buckle when braced by lateral support beams S3007, G3007 and K3007 (Frankel Steel Limited, 1985). ..... 84
Figure 3.12 Figure 8-22 in the NIST report shows model for girder A2001 and five beams to the east of it with no lateral bracing for beam G3005 (NIST, 2008, NCSTAR 1-9, Vol. 1, Page 350). ................................................................................................ 85
Figure 3.13 Figure 8-27 of the NIST report shows results of a finite element analysis where lateral support beams connecting to G3005 were not included (NIST, 2008, NCSTAR 1-9, Vol. 1, Page 354). ............................................................................... 85
Figure 3.14 UAF analysis of the W21x44 G3005 with no lateral support beams included. ......... 86
Figure 3.15 The relevant 0.52 Hz mode of the falling beam and girder assembly. ....................... 89
Figure 4.1(a) Illustration of NIST’s progressive collapse simulation showing significant differential movements in the exterior (NIST NCSTAR 1-9). ................................... 93
Figure 4.1(b) NIST’s progressive collapse simulation showing significant differential movements in the exterior (NIST NCSTAR 1A). ...................................................... 93
Figure 4.2 Columns 79, 80, and 81 are removed from Floor 6 to Floor 13. The key to the right is expressed in inches of movement. The building tilts to the east almost 10 inches. The penthouse does not collapse. .............................................................. 96
Figure 4.3 Columns 79, 80, and 81 are removed from Floor 13 to Floor 21. The building tilts to the east 7.2 inches. The penthouse does not collapse. ..................................... 97
Figure 4.4 Columns 79, 80, and 81 are removed from Floor 21 to Floor 29. The building tilts to the east 5.4 inches. The penthouse does not collapse, though penthouse deflection increases. ................................................................................................... 97
Figure 4.5 Columns 79, 80, and 81 are removed from Floor 29 to Floor 37. The building tilts to the east 3.85 inches. The penthouse does not collapse, thought its deflection increases .................................................................................................... 98

xi
Figure 4.6 Columns 79, 80, and 81 are removed from Floor 37 to Floor 45. Tilting of the building is now negligible, whereas the deflection of the penthouse is now much greater. .............................................................................................................. 98
Figure 4.7 Columns 79, 80, and 81 are removed from Floor 45 to the penthouse. Tilting of the building is now negligible. The penthouse now collapses, as demonstrated from the significant amount of deflection given in the figure. ................................... 99
Figure 4.8 Linear static analysis of Columns 79 to 81 (circled in green) being removed. .......... 101
Figure 4.9 Linear static analysis of Columns 76 to 78 (circled in green) also being removed. ................................................................................................................... 101
Figure 4.10 Linear static analysis results show that the failure of Columns 76 to 81 overloads 10 exterior columns (circled in red) around the southeast corner, but not the next row of core columns to the west (not circled in red). ........................... 102
Figure 4.11 Linear static analysis results show that the failure of 10 exterior columns around the southeast corner leads to numerous core and exterior columns (circled in red) being overloaded and failing. A progressive collapse triggered by the hypothetical failure of Columns 76 to 81 is underway. ................................. 102
Figure 4.12 Linear static analysis results show that the failure of additional columns (shown in Figure 4.11 above) leads to the failure of the remaining core columns and many exterior columns (circled in red). The columns with blue values are in tension rather than compression, indicating the building is tipping away from those columns. ........................................................................................ 103
Figure 4.13 Linear static analysis results show that the failure of additional columns (shown in Figure 4.12 above) leads to the failure of nearly every remaining column (circled in red). ............................................................................................ 103
Figure 4.14 A visualization of linear static analysis, from the southeast, showing movement to the southeast when Columns 76 to 81 are removed. The movement shown is highly amplified for clarity. The actual scale of the displacements are presented to the right. .................................................................. 104
Figure 4.15 Visualization of linear static analysis, from the southwest, showing the building tipping to the southeast after the hypothetical failure of Columns 76 to 81. The movement shown is highly amplified for clarity. The actual scale of the displacements are presented to the right. ............................................................ 104
Figure 4.16 Dynamic analysis results showing the building tipping to the southeast after the hypothetical failure of Columns 76 to 81. The movement shown is highly amplified for clarity. ................................................................................................. 105
xii
Figure 4.17 (a) Comparison of simulated collapse to perspective 1; (b) comparison of simulated collapse to perspective 2. ......................................................................... 106
Figure 4.18 UAF Simulation of core column-exterior column failure scenario. ........................ 107
Figure 4.19 Velocity analysis by David Chandler (Chandler, 2010). ......................................... 107
Figure 4.20 Velocity comparison between Chandler measurement (green plotted line) and UAF simulation (red plotted line). Bold green trend line illustrates free fall. ......... 108
Figure 4.21 Floors 17 to 47 falling uniformly as a unit (CBS). .................................................. 109
LIST OF TABLES
Table 2.1 Column loading for the Floor 12 and 13 assembly. ...................................................... 44
Table 2.2 Simple beam mid-point displacement. .......................................................................... 52
Table 2.3 Comparison of UAF and NIST Modeling ..................................................................... 74
1
EXECUTIVE SUMMARY
This report presents the findings and conclusions of a four-year study of the collapse of
World Trade Center Building 7 (WTC 7) — a 47-story building that suffered a total collapse at
5:20 PM on September 11, 2001, following the horrible events of that morning. Figure E.1
shows the layout of WTC 7 in relation to the World Trade Center complex prior to September
11, 2001. Figure E.2 shows the structural layout of Floor 13. Figure E.3 shows the finite element
model of WTC 7.
This study was conducted by a three-person team of researchers at the University of
Alaska Fairbanks (UAF) Department of Civil and Environmental Engineering with funding
provided by Architects & Engineers for 9/11 Truth, Inc., a 501(c)(3) nonprofit organization
whose purpose is to conduct research and educate the public about the World Trade Center
building collapses on 9/11.
According to the National Institute of Standards and Technology (NIST) — an agency of
the U.S. Department of Commerce that investigated the three building failures on 9/11 — the
collapse of WTC 7 was the first known instance of the total collapse of a tall building primarily
due to fires. However, many independent researchers have studied the collapse of WTC 7 and
assembled a body of evidence that raises questions about the validity of NIST’s conclusions.
The objective of this study, therefore, was threefold: (1) Examine the structural response
of WTC 7 to fire loads that may have occurred on September 11, 2001; (2) Rule out scenarios
that could not have caused the observed collapse; and (3) Identify types of failures and their
locations that may have caused the total collapse to occur as observed.
The UAF research team utilized three approaches for examining the structural response
of WTC 7 to the conditions that may have occurred on September 11, 2001.
First, we simulated the local structural response to fire loading that may have occurred
below Floor 13, where most of the fires in WTC 7 are reported to have occurred. Second, we
supplemented our own simulation by examining the collapse initiation hypothesis developed by
NIST. We also reviewed the collapse initiation hypotheses advanced by private engineering
firms whose studies were commissioned as part of litigation related to the collapse of WTC 7.
Third, we simulated several scenarios within the overall structural system in order to determine
what types of local failures and their locations may have caused the total collapse to occur as
observed. Before conducting a thorough and detailed evaluation of building response due to fire
2
and other issues, we examined the building condition following failure of the World Trade
Center Buildings 1 and 2. Some debris impact damage is reported to have occurred at the lower
southwest corner of the building, which we accounted for in simulating the building response.
Figure E.1 Location of WTC 7
Figure E.2 Prior to Fire Structural Layout for Floor 13
3
Fire Did Not Cause the Collapse of WTC 7
The principal conclusion of our study is that fire did not cause the collapse of WTC 7 on
9/11, contrary to the conclusions of NIST and private engineering firms that studied the collapse.
This conclusion is based upon a number of findings from our different analyses.
Together, they show that fires could not have caused weakening or displacement of structural
members capable of initiating any of the hypothetical local failures alleged to have triggered the
total collapse of the building, nor could any local failures, even if they had occurred, have
triggered a sequence of failures that would have resulted in the observed total collapse.
Near-Simultaneous Failure of Every Column Explains the Collapse
The secondary conclusion of our study is that the collapse of WTC 7 was a global failure
involving the near-simultaneous failure of every column in the building.
This conclusion is based primarily upon the finding that the simultaneous failure of all
core columns over 8 stories followed 1.3 seconds later by the simultaneous failure of all exterior
columns over 8 stories produces almost exactly the behavior observed in videos of the collapse,
whereas no other sequence of failures that we simulated produced the observed behavior. We
cannot completely rule out the possibility that an alternative scenario may have caused the
observed collapse; however, the near-simultaneous failure of every column is the only scenario
we identified that was capable of producing the observed behavior.
Key Findings Upon Which the UAF Team’s Conclusions Are Based
Approach 1 Findings
• During our nonlinear connection study (Section 2.1.3.2), we discovered that NIST over-
estimated the rigidity of the outside frame by not modeling its connections, essentially
treating the exterior steel framing as thermally fixed, which caused all thermally-induced
floor expansion to move away from the exterior. The exterior steel framing was actually
flexible, while the stiffest area resistant to thermal movements, i.e., the point of zero
thermal movement, was near the elevator shafts.
• Therefore, during our analysis of WTC 7’s response to fire loading (Section 2.6), we
found the overall thermal movements at the A2001 base plate support near Column 79
4
were not sufficient to displace girder A2001 to the point that it walked off its seat (the
initiating failure alleged by NIST). Whereas NIST asserted that the differential westward
displacement of girder A2001 relative to Column 79 was 5.5 inches and later revised its
calculation to 6.25 inches, we found that the westward displacement of girder A2001
relative to Column 79 would have been less than 1 inch under the fire conditions reported
by NIST.
Approach 2 Findings
Under our second approach, we used a solid element model to evaluate the validity of
NIST’s collapse initiation hypothesis, introducing a number of assumptions made by NIST that
we considered to be invalid or, at best, questionable (Section 3.1). These assumptions included
assuming the east exterior wall to be rigid and thermally fixed, assuming shear studs on several
beams were broken due to differential thermal movement, assuming no shear studs were installed
on girder A2001, and assuming that the bolts fastening girder A2001 to its seats at Columns 44
and 79 were broken (Section 3.1.1). Allowing for these overly generous assumptions, we found
the following:
• When girder A2001 is heated to the temperatures assumed by NIST, it expands such that
it becomes trapped behind the side plate on the western side of Column 79 as it is pushed
to the west by thermally expanding floor beams. This prevents the girder’s web from
traveling beyond the bearing seat, thus preventing the girder from walking off its seat
(Section 3.2.1).
• NIST, by its own admission, did not include the partial height web stiffeners known to be
on girder A2001. In addition to stiffening the web, these stiffeners significantly increase
the bending resistance of the flange. In a subsequent analysis where we removed the side
plate described in the previous paragraph in order to allow for further westward travel of
girder A2001, we found that the stresses in the girder flange and stiffener would not be
sufficient to cause the flange to fail, thus preventing the girder from walking off its seat
(Section 3.2.2).
• In a preliminary collapse initiation hypothesis, NIST posited that beam G3005 buckled
because its thermal expansion was restrained by girder A2001. We found that this can
5
happen only when the three lateral support beams S3007, G3007, and K3007 spanning
from beam G3005 to the north exterior wall are not included in the model. While these
short beams are observed in some of the figures in the NIST report, they are missing from
the model(s) used in the thermal and structural analysis shown in the report (Section
3.2.3).
Separate from the NIST investigation, two studies of WTC 7’s collapse were
commissioned by opposing sides in the lawsuit “Aegis Insurance Services, Inc. v. 7 World Trade
Center Company, L.P.” Experts working in connection with engineering firms Ove Arup &
Partners (Arup) and Guy Nordenson and Associates (Nordenson) were retained by the plaintiffs.
The engineering firm Weidlinger Associates Inc. (Weidlinger) was retained by the defendants.
After evaluating NIST’s collapse initiation hypothesis, we reviewed the Arup, Nordenson, and
Weidlinger reports and found the following:
• Arup’s finite element analysis corroborates our finding that girder A2001 would become
trapped behind the western side plate of Column 79. However, Arup’s analysis then goes
on to contend that the five beams to the east of girder A2001 were heated enough to sag
and pull the girder to the east and off its seat. Putting aside whether this initiating
mechanism is valid, we found that Nordenson incorrectly calculated the impact force of
the falling girder by considering it as a point load, thus implying an infinite stiffness and
no deflection. Calculating the impact force correctly, we found that it is less than 10% of
the 632,000 lb. force required to shear the girder bearing seat support welds at Floor 12.
Therefore, the northeast corner of Floor 12 would not have collapsed if the Floor 13
girder came off its seat at Column 79, and a cascade of floor failures would not ensue.
• The Weidlinger report was prepared as a rebuttal to the Arup and Nordenson reports.
Among its points of rebuttal, it corroborates our finding that the falling Floor 13 beam
and girder assembly could not break through Floor 12. The Weidlinger report contends
instead that Floors 9 and 10 were simultaneously heated to between 750° and 800°C in
the exact same area of each floor, eventually causing those floors to fail and triggering a
cascade of floor failures down to Floor 5. However, the details of the thermal analysis are
not shown in the Weidlinger report, and the thermal analysis has not been made public. It

6
is important to understand that steel structural members reaching temperatures of 750°C
due to office fires can be considered extraordinary. Without any analysis provided to
substantiate such temperatures, Weidlinger’s collapse initiation hypothesis must be
viewed skeptically and can be assumed to have a very low probability of occurrence
(Section 3.4.1).
Approach 3 Findings
Under our third approach, we simulated a number of hypothetical scenarios in order to
determine what types of local failures and their locations may have caused the total collapse to
occur as observed. Based upon a series of analyses, we found the following:
• Columns 79, 80, and 81 did not fail at the lower floors of the building, as asserted by
NIST. In order to allow for the observed collapse of the east penthouse approximately 7
seconds prior to the collapse of the rest of the structure, these columns needed to have
failed at the upper floors of the building all the way to the penthouse. Yet there were no
documented fires above Floor 30. Therefore, fire did not cause the collapse of Columns
79, 80, and 81 nor the collapse of the east penthouse (Section 4.3).
• The hypothetical failure of Columns 79, 80, and 81 — the three easternmost core
columns — would not trigger a horizontal progression of core column failures. Therefore,
the hypotheses of NIST, Arup/Nordenson, and Weidlinger that the buckling of Column
79 could trigger a progressive collapse of the entire building are invalid, and the collapse
of Columns 79, 80, and 81 high in the building was a separate and distinct event (Section
4.5).
• Even if we assume the failure of Columns 79, 80, and 81 could lead to the failure of the
next row of core columns, the hypothetical failure of Columns 76 to 81 would overload
the exterior columns around the southeast of the building, rather than overloading the
next row of core columns to the west, which would result in the building tipping to the
southeast and not in a straight-down collapse (Section 4.5).
• The simultaneous failure of all core columns over 8 stories followed 1.3 seconds later by
the simultaneous failure of all exterior columns over 8 stories produces almost exactly the
7
behavior observed in videos of the collapse. The collapse could have started at Floor 16
and below and produced the same behavior (Section 4.6).
It is our conclusion based upon these findings that the collapse of WTC 7 was a global
failure involving the near-simultaneous failure of all columns in the building and not a
progressive collapse involving the sequential failure of columns throughout the building.
Figure E.3 Finite Element Model of WTC 7 in SAP2000, as viewed from the south.
8
CHAPTER 1.0 INTRODUCTION
1.1 Background
Three structural failures of unprecedented magnitude took place on September 11, 2001,
when World Trade Center (WTC) Buildings 1, 2, and 7 each suffered total collapse at 10:28 AM,
9:59 AM, and 5:20 PM, respectively. Unlike the taller WTC 1 and WTC 2, WTC 7 was not
struck by an airplane. The cause of WTC 7’s total collapse is the subject of the present study.
Completed in 1986, WTC 7 was a 47-story building with a steel frame and reinforced
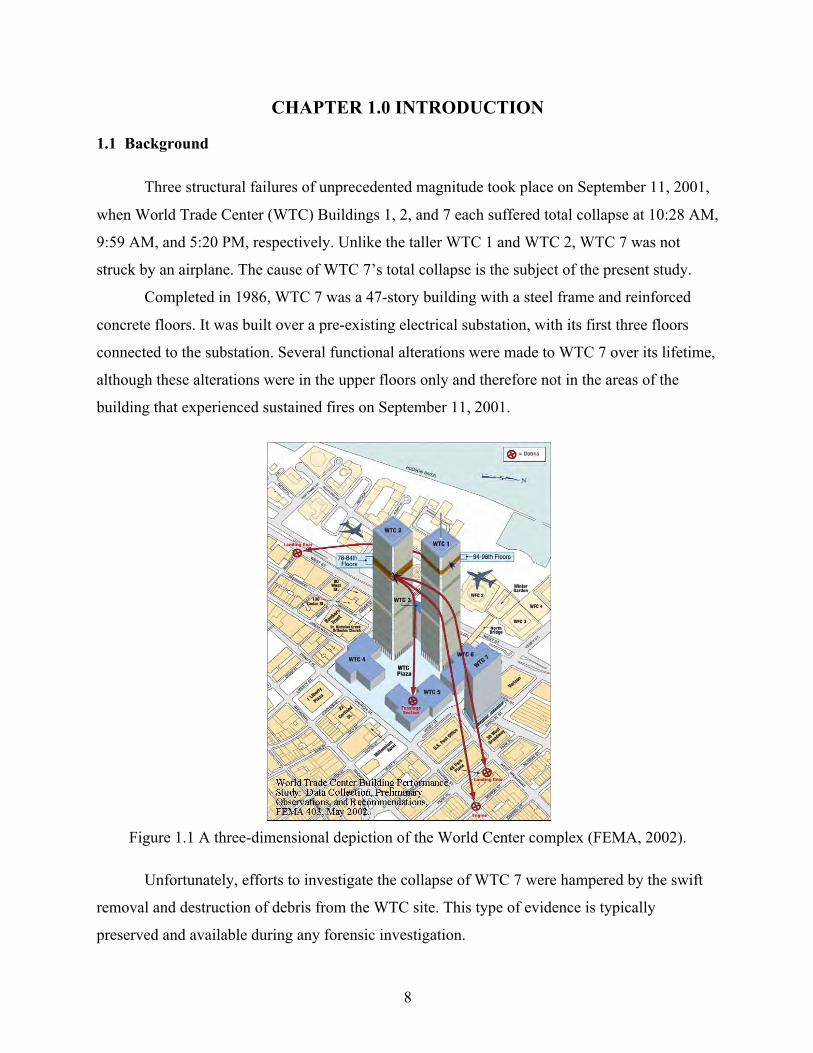
concrete floors. It was built over a pre-existing electrical substation, with its first three floors
connected to the substation. Several functional alterations were made to WTC 7 over its lifetime,
although these alterations were in the upper floors only and therefore not in the areas of the
building that experienced sustained fires on September 11, 2001.
Figure 1.1 A three-dimensional depiction of the World Center complex (FEMA, 2002).
Unfortunately, efforts to investigate the collapse of WTC 7 were hampered by the swift
removal and destruction of debris from the WTC site. This type of evidence is typically
preserved and available during any forensic investigation.

9
Figure 1.2 A plan view of the World Trade Center complex (FEMA, 2002).
Figure 1.3 WTC 7 seen from the north on September 11, 2001 (NYPD).

10
Figure 1.4 WTC 7 tenants on September 11, 2001 (FEMA, 2002).
Following the disaster, many in the engineering community hypothesized that the
collapse of WTC 7 was caused by some combination of debris impact damage from the collapse
of WTC 1 and the fires that subsequently burned in WTC 7 until its collapse. Different variations
of this hypothesis were advanced by two federal investigations: the first by the Federal
Emergency Management Agency (FEMA), which issued its final report in May 2002, and the
second by the National Institute of Standards and Technology (NIST), which issued its final
11
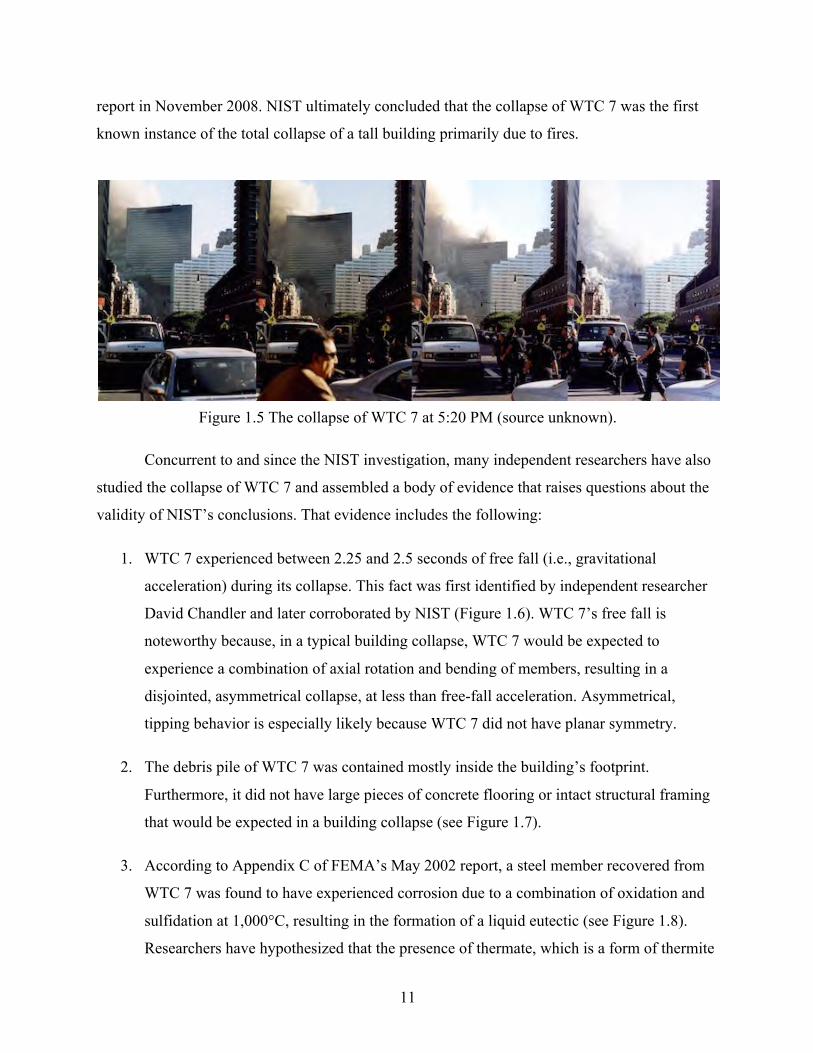
report in November 2008. NIST ultimately concluded that the collapse of WTC 7 was the first
known instance of the total collapse of a tall building primarily due to fires.
Figure 1.5 The collapse of WTC 7 at 5:20 PM (source unknown).
Concurrent to and since the NIST investigation, many independent researchers have also
studied the collapse of WTC 7 and assembled a body of evidence that raises questions about the
validity of NIST’s conclusions. That evidence includes the following:
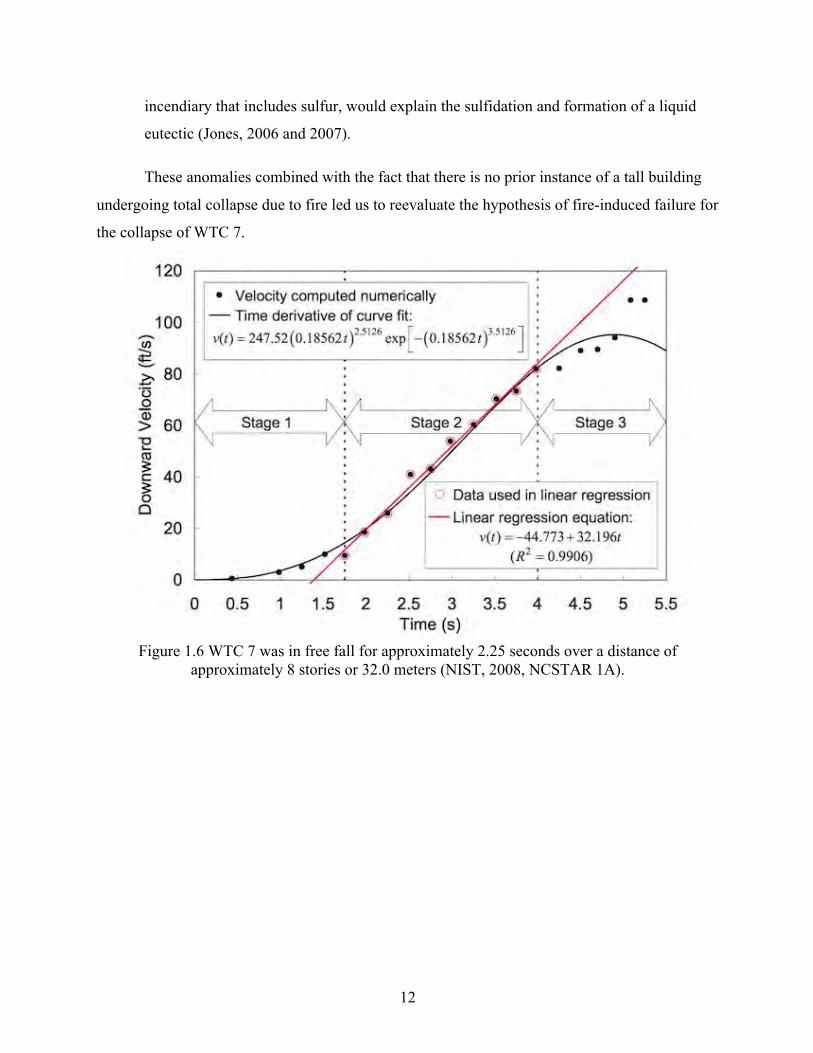
1. WTC 7 experienced between 2.25 and 2.5 seconds of free fall (i.e., gravitational
acceleration) during its collapse. This fact was first identified by independent researcher
David Chandler and later corroborated by NIST (Figure 1.6). WTC 7’s free fall is
noteworthy because, in a typical building collapse, WTC 7 would be expected to
experience a combination of axial rotation and bending of members, resulting in a
disjointed, asymmetrical collapse, at less than free-fall acceleration. Asymmetrical,
tipping behavior is especially likely because WTC 7 did not have planar symmetry.
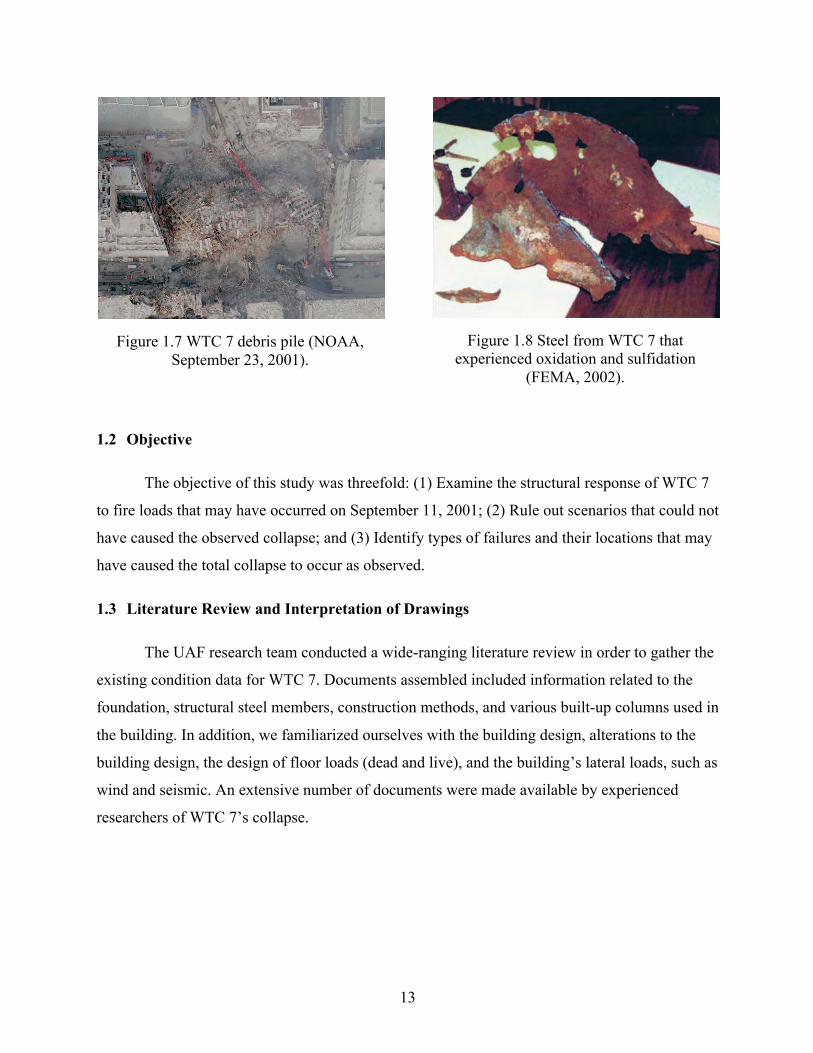
2. The debris pile of WTC 7 was contained mostly inside the building’s footprint.
Furthermore, it did not have large pieces of concrete flooring or intact structural framing
that would be expected in a building collapse (see Figure 1.7).
3. According to Appendix C of FEMA’s May 2002 report, a steel member recovered from
WTC 7 was found to have experienced corrosion due to a combination of oxidation and
sulfidation at 1,000°C, resulting in the formation of a liquid eutectic (see Figure 1.8).
Researchers have hypothesized that the presence of thermate, which is a form of thermite
12
incendiary that includes sulfur, would explain the sulfidation and formation of a liquid
eutectic (Jones, 2006 and 2007).
These anomalies combined with the fact that there is no prior instance of a tall building
undergoing total collapse due to fire led us to reevaluate the hypothesis of fire-induced failure for
the collapse of WTC 7.
Figure 1.6 WTC 7 was in free fall for approximately 2.25 seconds over a distance of
approximately 8 stories or 32.0 meters (NIST, 2008, NCSTAR 1A).
13
Figure 1.7 WTC 7 debris pile (NOAA, September 23, 2001).
Figure 1.8 Steel from WTC 7 that experienced oxidation and sulfidation
(FEMA, 2002).
1.2 Objective
The objective of this study was threefold: (1) Examine the structural response of WTC 7
to fire loads that may have occurred on September 11, 2001; (2) Rule out scenarios that could not
have caused the observed collapse; and (3) Identify types of failures and their locations that may
have caused the total collapse to occur as observed.
1.3 Literature Review and Interpretation of Drawings
The UAF research team conducted a wide-ranging literature review in order to gather the
existing condition data for WTC 7. Documents assembled included information related to the
foundation, structural steel members, construction methods, and various built-up columns used in
the building. In addition, we familiarized ourselves with the building design, alterations to the
building design, the design of floor loads (dead and live), and the building’s lateral loads, such as
wind and seismic. An extensive number of documents were made available by experienced
researchers of WTC 7’s collapse.
14
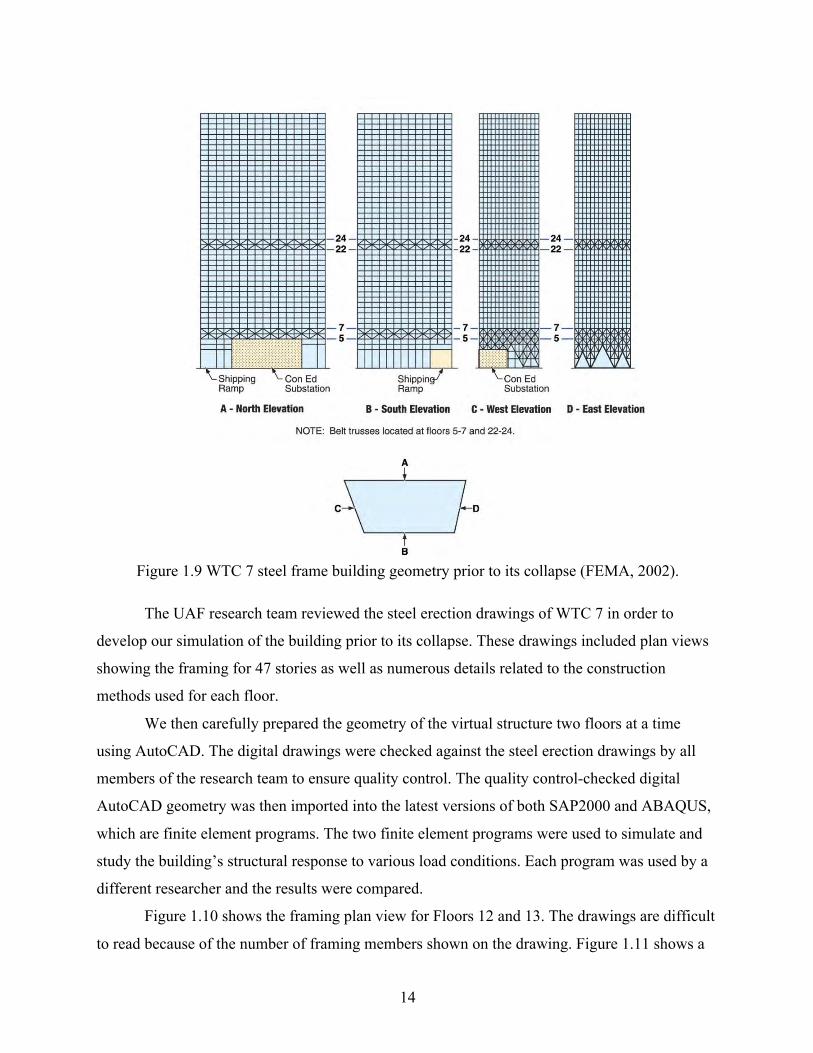
Figure 1.9 WTC 7 steel frame building geometry prior to its collapse (FEMA, 2002).
The UAF research team reviewed the steel erection drawings of WTC 7 in order to
develop our simulation of the building prior to its collapse. These drawings included plan views
showing the framing for 47 stories as well as numerous details related to the construction
methods used for each floor.
We then carefully prepared the geometry of the virtual structure two floors at a time
using AutoCAD. The digital drawings were checked against the steel erection drawings by all
members of the research team to ensure quality control. The quality control-checked digital
AutoCAD geometry was then imported into the latest versions of both SAP2000 and ABAQUS,
which are finite element programs. The two finite element programs were used to simulate and
study the building’s structural response to various load conditions. Each program was used by a
different researcher and the results were compared.
Figure 1.10 shows the framing plan view for Floors 12 and 13. The drawings are difficult
to read because of the number of framing members shown on the drawing. Figure 1.11 shows a

15
zoomed-in view of the drawing in Figure 1.10. The view is of the core area for Floors 12 and 13.
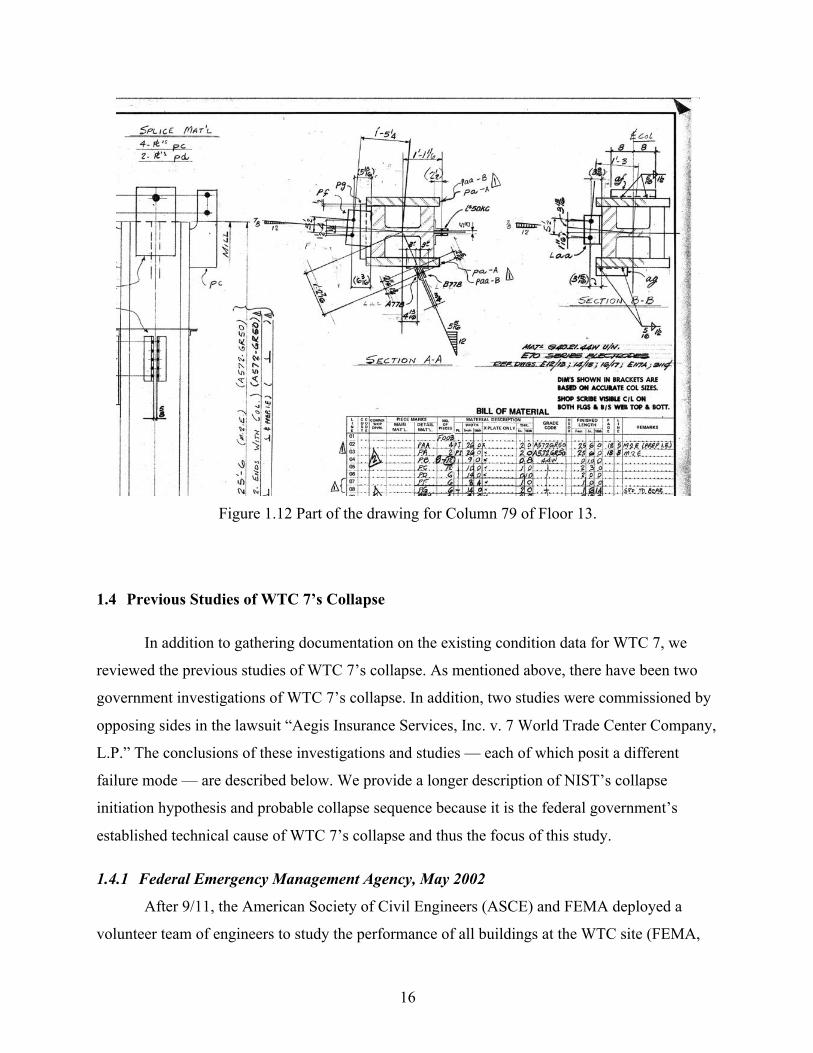
Figure 1.12 shows the details of Column 79 at Floor 13, which illustrate that Column 79 was a
built-up column.
Figure 1.10 Whole framing plan view of Floors 12 and 13.
Figure 1.11 Zoomed-in view of Floors 12 and 13.
16
Figure 1.12 Part of the drawing for Column 79 of Floor 13.
1.4 Previous Studies of WTC 7’s Collapse
In addition to gathering documentation on the existing condition data for WTC 7, we
reviewed the previous studies of WTC 7’s collapse. As mentioned above, there have been two
government investigations of WTC 7’s collapse. In addition, two studies were commissioned by
opposing sides in the lawsuit “Aegis Insurance Services, Inc. v. 7 World Trade Center Company,
L.P.” The conclusions of these investigations and studies — each of which posit a different
failure mode — are described below. We provide a longer description of NIST’s collapse
initiation hypothesis and probable collapse sequence because it is the federal government’s
established technical cause of WTC 7’s collapse and thus the focus of this study.
1.4.1 Federal Emergency Management Agency, May 2002
After 9/11, the American Society of Civil Engineers (ASCE) and FEMA deployed a
volunteer team of engineers to study the performance of all buildings at the WTC site (FEMA,
17
2002). In May 2002, FEMA published the World Trade Center Building Performance Study
(FEMA, 2002). The purpose of the study was “to examine the damage caused by the events,
collect data, develop an understanding of the response of each affected building, identify causes
of observed behavior, and suggest studies that should be performed.”
The FEMA Report was inconclusive as to the cause of WTC 7’s collapse, but it proposed
a number of scenarios for further investigation. Based on the fact that the east penthouse fell
approximately 7 seconds before the rest of the building fell, the FEMA Report suggested that the
collapse initiated on the east side of the building on the interior, most likely at the transfer trusses
between floors 5 and 7. FEMA also suggested that there were not enough combustibles on these
floors to sufficiently weaken the structural members. Thus, FEMA hypothesized that diesel fuel
stored in the lower levels of the building was somehow pumped and discharged through severed
pipes and this somehow fed fires for several hours. The report noted that its best hypothesis had
“only a low probability of occurrence” and that further investigation was needed. NIST would
later rule out the diesel fuel hypothesis.
1.4.2 National Institute of Standards and Technology, November 2008
NIST began a more in-depth investigation into the collapse of WTC 1, WTC 2, and WTC
7 in August 2002. This effort was conducted under the mandate of the National Construction
Safety Team Act (NCSTA), which was signed into law on October 1, 2002. NIST put its WTC 7
investigation on hold in 2005 to focus on completing its report on the collapse of WTC 1 and
WTC 2 that year. Eventually, in November 2008, NIST released its final report on WTC 7
(NIST, 2008, NCSTAR 1A). Below is a moderately detailed description of NIST’s collapse
initiation hypothesis, which will be examined in the following chapters.
1.4.2.1 Floors with Fires
The NIST report provides photographic evidence of fires occurring on Floors 7 to 9, 11 to
13, 19, 22, 29, and 30 (NIST, 2008, NCSTAR 1A). The report states that fires on the four upper
floors (19, 22, 29, and 30) were of relatively short duration and inconsequential in terms of
causing the collapse. The NIST report claims that the fire on the 12th floor in the northeast corner
of the building was primarily responsible for initiating the collapse by causing heat-induced
failures of the 13th floor structure.
18
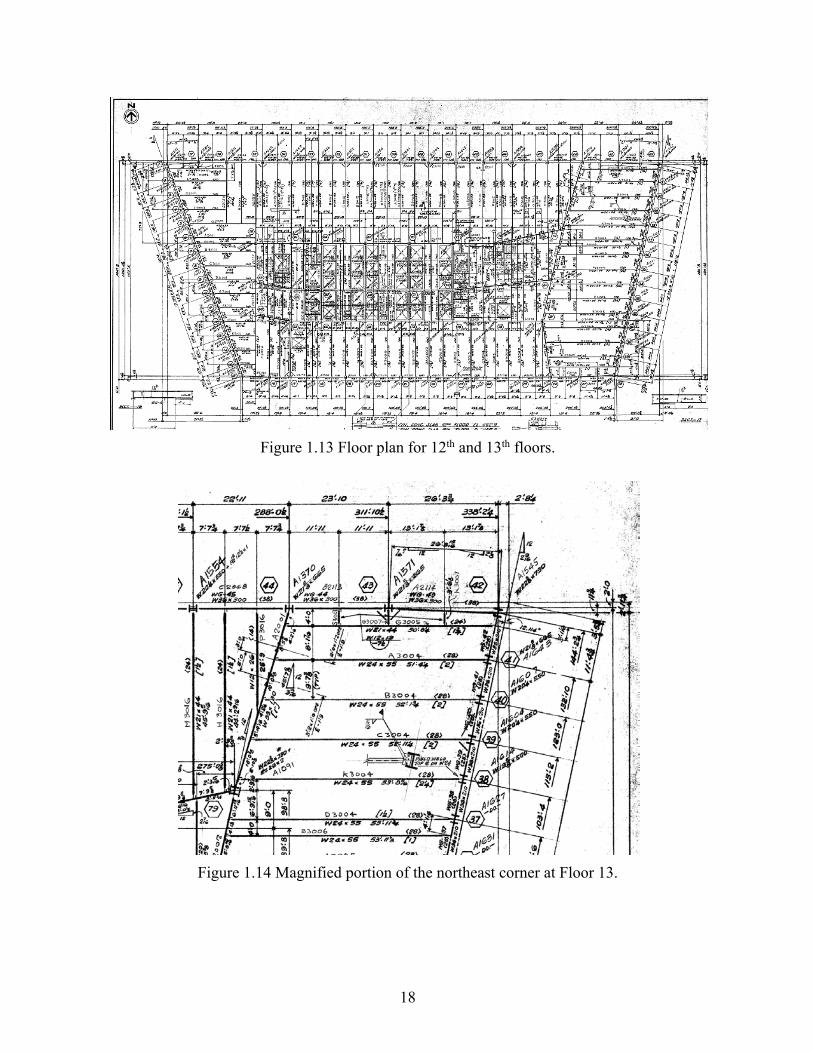
Figure 1.13 Floor plan for 12th and 13th floors.
Figure 1.14 Magnified portion of the northeast corner at Floor 13.
19
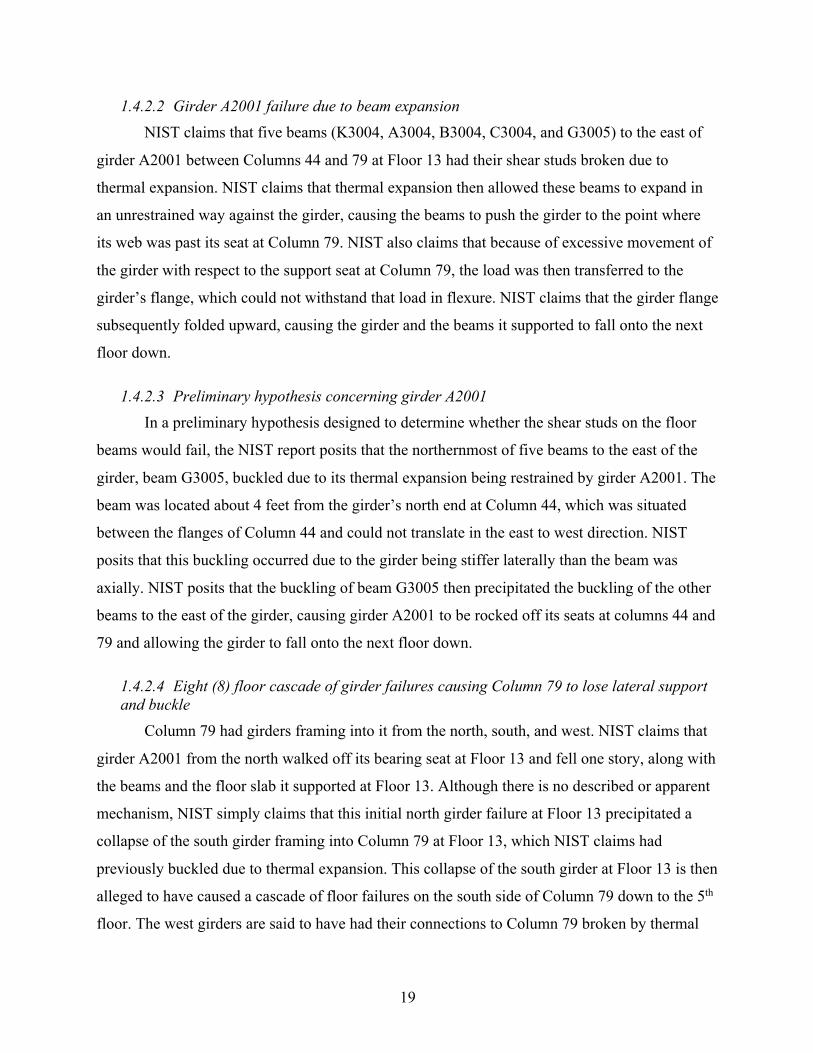
1.4.2.2 Girder A2001 failure due to beam expansion NIST claims that five beams (K3004, A3004, B3004, C3004, and G3005) to the east of
girder A2001 between Columns 44 and 79 at Floor 13 had their shear studs broken due to
thermal expansion. NIST claims that thermal expansion then allowed these beams to expand in
an unrestrained way against the girder, causing the beams to push the girder to the point where
its web was past its seat at Column 79. NIST also claims that because of excessive movement of
the girder with respect to the support seat at Column 79, the load was then transferred to the
girder’s flange, which could not withstand that load in flexure. NIST claims that the girder flange
subsequently folded upward, causing the girder and the beams it supported to fall onto the next
floor down.
1.4.2.3 Preliminary hypothesis concerning girder A2001 In a preliminary hypothesis designed to determine whether the shear studs on the floor
beams would fail, the NIST report posits that the northernmost of five beams to the east of the
girder, beam G3005, buckled due to its thermal expansion being restrained by girder A2001. The
beam was located about 4 feet from the girder’s north end at Column 44, which was situated
between the flanges of Column 44 and could not translate in the east to west direction. NIST
posits that this buckling occurred due to the girder being stiffer laterally than the beam was
axially. NIST posits that the buckling of beam G3005 then precipitated the buckling of the other
beams to the east of the girder, causing girder A2001 to be rocked off its seats at columns 44 and
79 and allowing the girder to fall onto the next floor down.
1.4.2.4 Eight (8) floor cascade of girder failures causing Column 79 to lose lateral support and buckle
Column 79 had girders framing into it from the north, south, and west. NIST claims that
girder A2001 from the north walked off its bearing seat at Floor 13 and fell one story, along with
the beams and the floor slab it supported at Floor 13. Although there is no described or apparent
mechanism, NIST simply claims that this initial north girder failure at Floor 13 precipitated a
collapse of the south girder framing into Column 79 at Floor 13, which NIST claims had
previously buckled due to thermal expansion. This collapse of the south girder at Floor 13 is then
alleged to have caused a cascade of floor failures on the south side of Column 79 down to the 5th
floor. The west girders are said to have had their connections to Column 79 broken by thermal

20
expansion earlier and then also collapsed at this time. There was no fire on the 10th floor, which
means that heating could not have caused the west girder under the 11th floor to have lost its
connection to Column 79. In this case, NIST claimed that the same girder under Floor 13 pushed
Column 79 to the east enough to break the knife connection to Column 79 two stories below on
the girder under the 11th floor. It is then alleged that this series of failures left Column 79
laterally unsupported from the south and west for 9 stories, causing it to buckle.
1.4.2.5 Collapse Propagation
According to NIST, the buckling of Column 79 caused by the loss of lateral support over
9 stories triggered a progressive collapse of the entire building, starting with the subsequent
buckling of nearby Columns 80 and 81, the subsequent collapse of the east penthouse above
Columns 79, 80 and 81, and then a westward progression of core column failures that
redistributed loads to the shell of exterior columns.
1.4.3 Arup and Nordenson, April 2010
Experts working in connection with engineering firms Ove Arup & Partners (Arup) and
Guy Nordenson and Associates (Nordenson) were retained by the plaintiffs in “Aegis Insurance
Services, Inc. v. 7 World Trade Center Company, L.P.” to perform structural analysis in support
of the claim that the collapse of WTC 7 resulted from deficient design, thus making the
defendants liable for the destruction of the electrical substation over which WTC 7 was built.
The Arup and Nordenson reports, as they are referred to hereafter, were filed with the court in
April 2010.
The Arup report concluded that girder A2001 (the same girder that NIST reported was
pushed off its seat by thermally expanding beams to the east of the girder) was actually pulled
off its seat by the sagging of beams to the east of the girder. The largest displacement of the
beams east of girder A2001 was analyzed by UAF to be 3.2 inches in the gravitational direction
in SAP2000. This girder walk-off, according to the Nordenson report, then caused the same
cascade of floor failures and buckling of Column 79 reported by NIST. However, contrary to
NIST’s findings, Nordenson found that the alleged failure of other girder connections framing
into Column 79 on lower floors, which was necessary along with the aforementioned cascade of
floor failures in order for Column 79 to buckle, could not have been caused by thermal
21
expansion. The Nordenson report instead put forth the idea that the welds of these girder
connections failed due to stress raisers (cracking) caused by repeated heating and cooling cycles.
1.4.4 Weidlinger, October 2010
The engineering firm Weidlinger Associates Inc. (Weidlinger) was retained by the
defendants in “Aegis Insurance Services, Inc. v. 7 World Trade Center Company, L.P.” to
perform structural analysis in support of their defense that the collapse of WTC 7 did not result
from deficient design and was instead caused by the extraordinary events of September 11, 2001.
The Weidlinger report, as it is referred to hereafter, was completed in October 2010 but was
never filed with the court. The Weidlinger report was made public in June 2016.
The Weidlinger report found fault with various aspects of the Arup and Nordenson
reports, in particular with Nordenson’s alleged failure of girder connections at lower floors and
with Nordenson’s analysis of the impact of the unseated girder on the floor below. The
Weidlinger report noted that the impact of the unseated girder would not be sufficient to break
through the floor below. The Weidlinger report instead postulated, based on fire modeling
performed by Dr. Craig Beyler, that Floors 9 and 10 were simultaneously heated to between 750°
and 800°C in the exact same area of each floor. This extreme heating eventually caused Floor 10
to give way and break through Floor 9, which was possible only because of the extreme heating
of Floor 9. Weidlinger then claims that the falling debris from these initial floor failures was
sufficient to cause a cascade of floor failures through the unheated floors down to Floor 5,
diminishing the lateral support for Column 79 and two nearby columns, Column 80 and Column
81, thus causing the columns to buckle and trigger a progressive collapse of the entire building.
1.5 The UAF Team’s Approach to Examining the Structural Response of WTC 7
The UAF research team utilized three approaches for examining the structural response
of WTC 7 to the conditions that may have occurred on September 11, 2001. The findings and
conclusions of each approach are described in Chapters 2, 3, and 4 respectively.
1.5.1 Approach 1: Structural Response to Fire Loading
First, we modeled the structural framing and simulated the local structural response to
fire loading that may have occurred below Floor 13. Several factors warranted extra technical
examination:
22
a. WTC 7 was not symmetrical. Therefore, during collapse it would naturally sway
towards the mass center for the floors. The mass center for the floors were initially
evaluated and then used to examine the building’s response during collapse.
b. The lack of combustibles was critically examined, as was the idea that primary
damage by fires could occur on floors where financial centers were located. The
questions we addressed were: Would this type of business have paper lying around or
would privacy be most important and therefore paper stock locked in a fireproof safe?
Why was a fire in this building so significant?
c. We simulated fires in the building. The heat transfer characteristics for the steel
framing with and without fireproofing was examined. We also studied how fire may
have interacted with the concrete floors (in the flutes) and between flutes. We
examined the steel frame response where the drop-down ceilings (acoustical tile)
were hung below the floor system. We also studied the thermal conductivity of the
concrete floors and their interaction with the steel beams and girders that made up the
floor systems. The worst case for structural response to fire was to consider steel
members without fireproofing and this was subsequently used to evaluate structural
response.
d. We prepared a detailed simulation of the floor slab connection to the beams and floor
slab connection to the girders. These connections included non-composite (no shear
connectors), fully composite case 1 (shear connectors between the floor slab and the
girders only), fully composite case 2 (shear connectors between the concrete floor
slab and both beams and girders), and a partially composite condition. We also
simulated the connections between beams and girders, the connections between
girders and columns, and the connections between beams and columns. These
connection details are important as the connectivity significantly affects the structural
response during fire and the deformation response due to self-weight and dynamic
forces that occur during collapse.
1.5.2 Approach 2: Evaluation of NIST’s Collapse Initiation Hypothesis
Second, we supplemented our own simulation by evaluating the validity of NIST’s
collapse initiation hypothesis and probable collapse sequence. In particular, we focused on
23
identifying aspects of NIST’s simulation that caused it to a reach a conclusion different from
ours.
1.5.3 Approach 3: Simulating the Collapse of WTC 7
Finally, we simulated various scenarios within the overall structural system to determine
what types of local failures and their locations may have caused the total collapse to occur as
observed.
24
CHAPTER 2.0 STRUCTURAL RESPONSE TO FIRE LOADING
This chapter presents the analysis and findings of the UAF research team based on its
finite element modeling and simulation of WTC 7’s structural response to fire loads.
2.1 Process Overview
2.1.1 Software Tools and Uses
The research team used AUTOCAD to create a virtual geometry for each floor and a
three-dimensional depiction of the 47-story building based primarily on the erection drawings.
We then imported the AUTOCAD data into ABAQUS and SAP2000 and used it to model the
floor framing at the 12th and 13th floors separately in each program, while SAP2000 was later
used to model all the floors for which we had floor plans. To ensure the accuracy and
consistency of the results of the models, we compared the two-story modeling results in
ABAQUS and SAP2000 by applying horizontal structural and heat loads. Next, we developed
ABAQUS nonlinear models of the connections. We then used both ABAQUS and SAP2000 to
evaluate the fire damage to the floor framing at Floors 12 and 13. Wire elements for beams and
girders and shell elements for concrete slabs were then used to simulate the interaction between
the concrete floor and beams and girders using both ABAQUS and SAP2000. In total, the 47-
story SAP2000 model had 39,978 joints, 44,507 frame elements, and 7,832 area elements. The
number of SAP2000 frame elements for Floors 12 and 13 alone was 2,026 and the number of
area elements was 4,390. In addition to using wire elements for the steel framing, we examined
the floor expansion characteristics and response using ABAQUS solid elements (discussed in
Chapter 3).
2.1.2 General Outline of the Study
The study was started in late spring of 2015. It was conducted by a three-member team
comprising two Ph.D. students who have since graduated (Feng Xiao and Zhili Quan) and one
professor as the principal investigator (J. Leroy Hulsey). In the fall of 2016, Dr. Feng Xiao
graduated with a Ph.D. and took a research position in Mississippi at the end of the year,
reducing the research team to two members.
We began this study by formulating a quality control plan so that all work — in
particular, all details that could affect our findings — would be scientifically examined and
25
subjected to logic tests based on “what-if(s).” The research plan we formulated is presented
below:
Step 1: Formulate a Quality Control Plan;
Step 2: Gather all available technical data;
Step 3: Prepare a constructed building simulation using AUTOCAD in three dimensions;
Step 4: Determine the mass center for Floors 12 and 13;
Step 5: Import the building geometry (AUTOCAD data) into ABAQUS and SAP2000;
Step 6: Examine the mechanical and thermal properties of the building materials, including:
a. The mechanical properties of the steel at moderate and high temperatures,
b. The steel thermal properties,
c. The probable aggregate type for concrete floors at the building site, and
d. The thermal properties of the concrete, once the aggregate type was established;
Step 7: Examine the influence of structural steel installation details on structural response,
including:
a. The connections for beams and girders as well as girders and columns, using
ABAQUS,
b. The thermal expansion of the floor system, using ABAQUS,
c. A non-composite floor system with no interface friction between the concrete floor
and supporting members;
d. A non-composite floor system with friction between the concrete floor and
supporting members;
e. A partially composite floor system;
f. A composite floor system; and
g. The effectiveness of the installed shear connectors at girders and beams as well as
the resistance of girders and beams without shear connectors when subjected to a
fire load.
Step 8: Prepare a 3-dimensional SAP2000 computer model to simulate the erected steel building.
Prior to evaluating possible modes of failure that could lead to the collapse of this
building, we conducted quality control checks by simulating progressive collapses for
steel building systems using both ABAQUS and SAP2000.
26
2.1.3 Background Studies
During this investigation, the research team studied several topics related to the collapse
of WTC 7, including progressive collapse, nonlinear connection response, and heat transfer
analysis through the concrete and steel floor system. The findings of these studies are briefly
described in the following sections.
2.1.3.1 Progressive Collapse
Progressive collapse is a failure sequence where local failure leads to large-scale collapse
in a structure (Lim, 2004). There are three types of local failures: material failure, buckling
failure, and connection failure. Two types of propagation failure can occur: spread upwards and
spread downwards. Propagation failure might spread upwards and/or sideways through the
removal of supports and the impairment of the stability of the immediately superincumbent
and/or adjacent structure. It might spread downwards primarily as a result of the impact loads of
falling debris (Mainstone, 1973).
Two types of approaches are used to simulate and evaluate progressive collapse. The
direct design method uses the actual loads that initiate collapse of a primary structural member in
order to evaluate whether collapse will be initiated. The alternate load path method removes one
or several major structural bearing elements (i.e., introducing initiating damage) and analyzes the
remaining structure to determine if this initiating damage propagates. The advantage of the
alternate load path method is that it is independent of the initiating load, so the solution is valid
for any type of hazard that causes member loss.
Four analysis methods may be used for progressive collapse: linear-elastic static analysis,
nonlinear static analysis, linear-elastic dynamic analysis, and nonlinear dynamic analysis. In
progressive collapse analysis, a structure’s response is evaluated by starting with a simpler static
methodology and then proceeding to increasingly complex analysis methods as necessary, until it
is determined that the possibility of progressive collapse is low or until all available engineering
methodologies are exhausted (Marjanishvili, 2004).
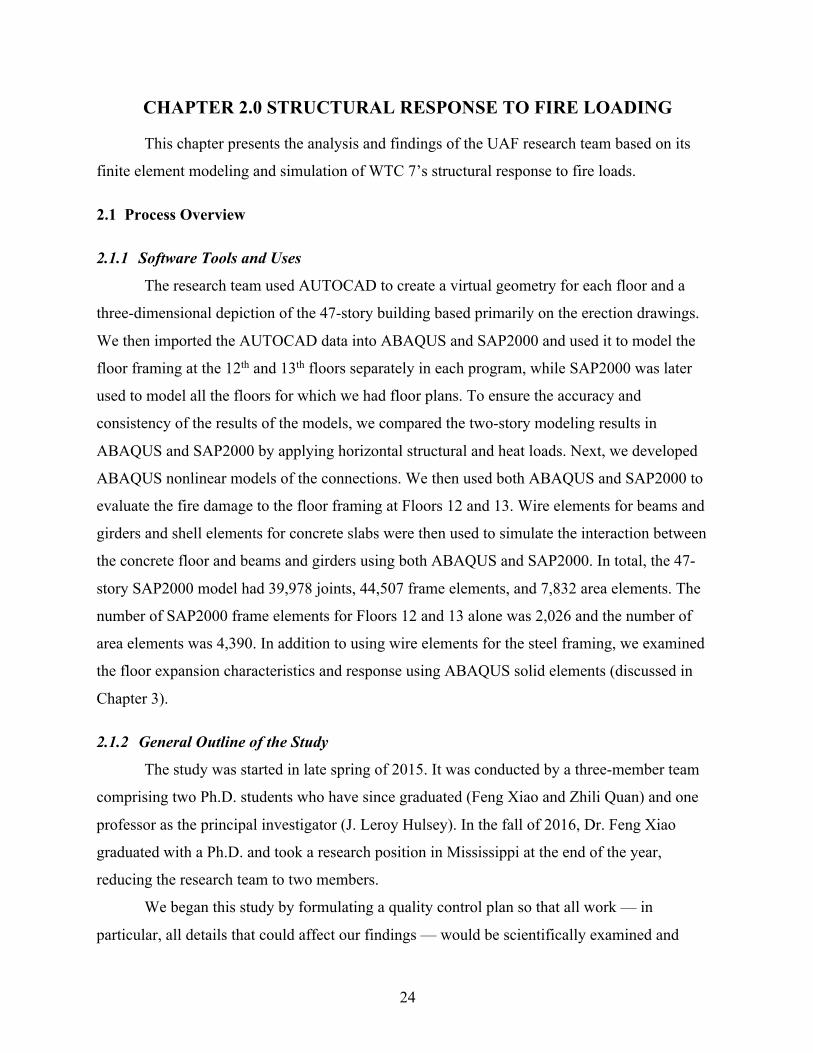
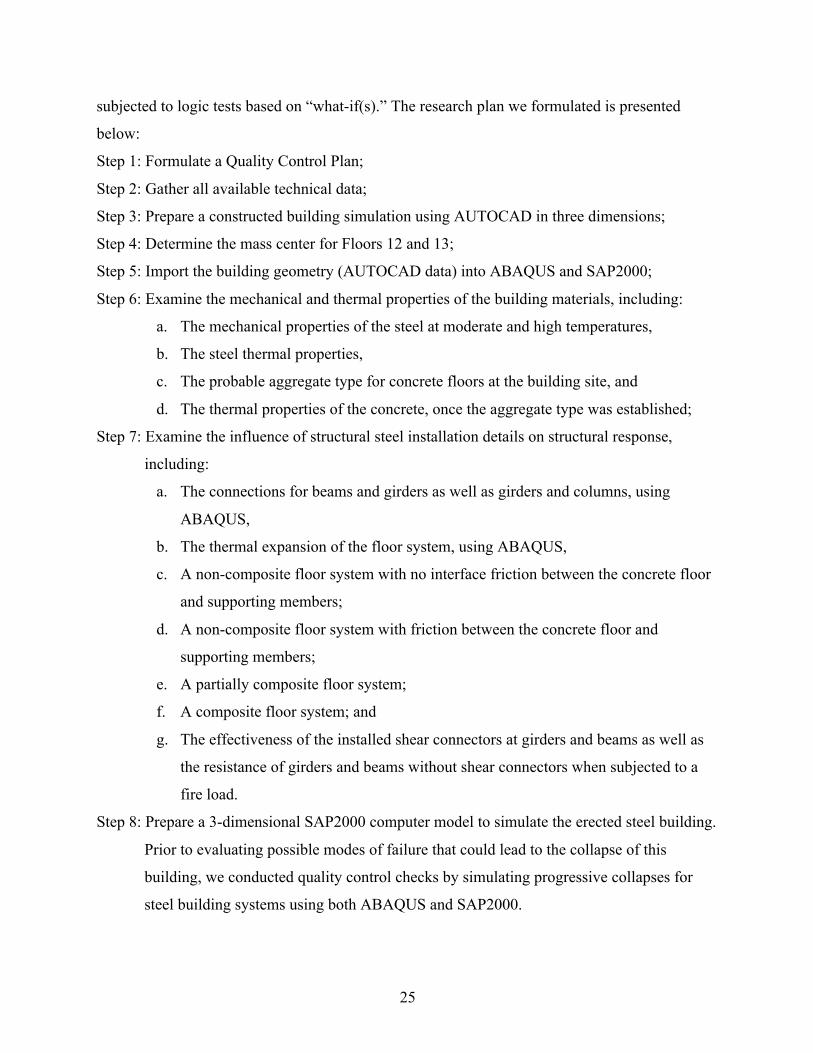
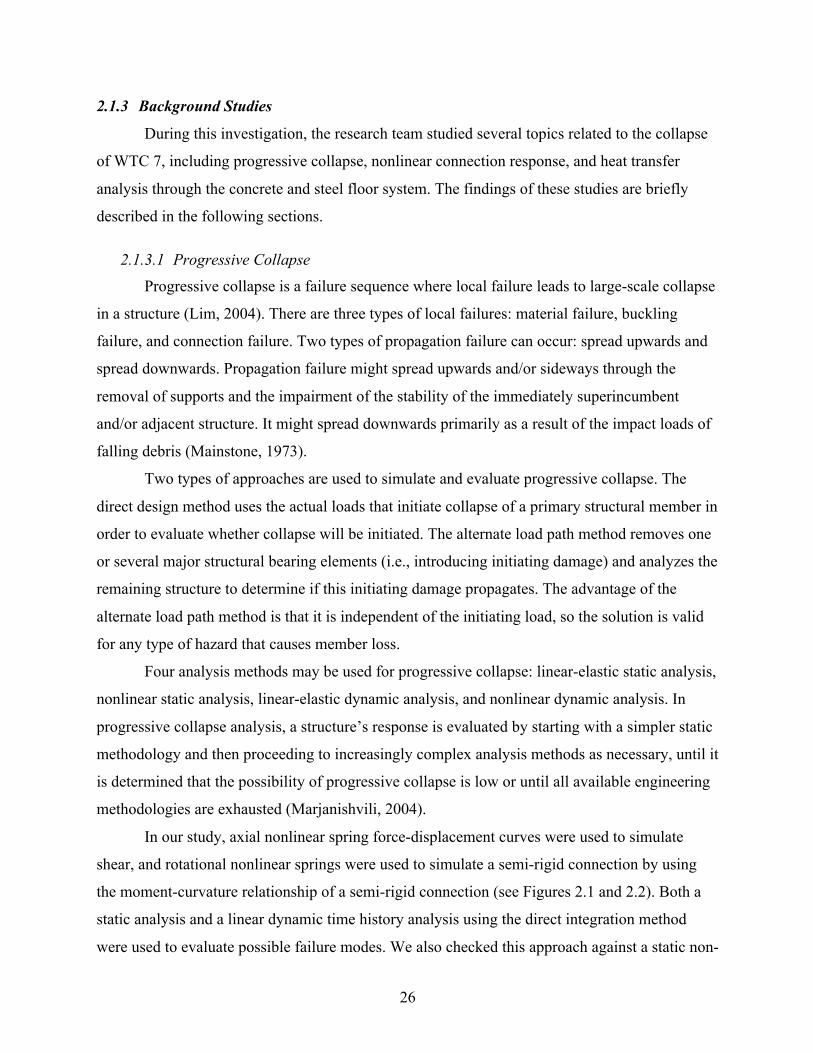
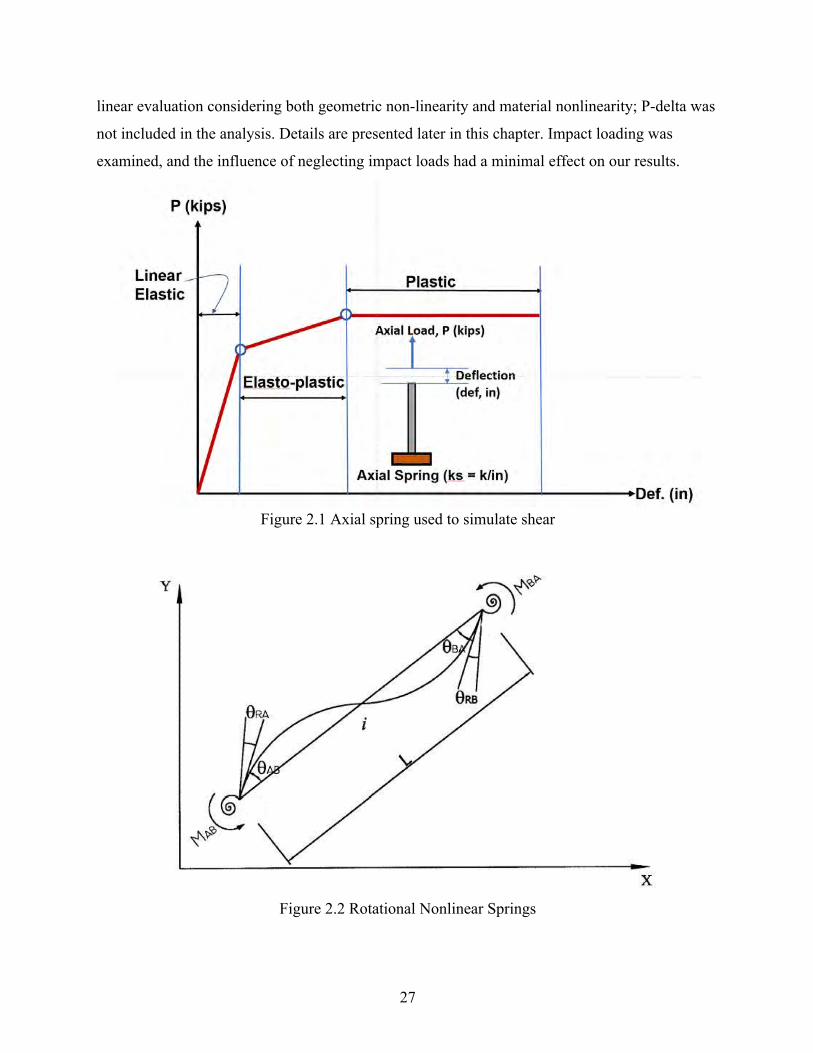
In our study, axial nonlinear spring force-displacement curves were used to simulate
shear, and rotational nonlinear springs were used to simulate a semi-rigid connection by using
the moment-curvature relationship of a semi-rigid connection (see Figures 2.1 and 2.2). Both a
static analysis and a linear dynamic time history analysis using the direct integration method
were used to evaluate possible failure modes. We also checked this approach against a static non-
27
linear evaluation considering both geometric non-linearity and material nonlinearity; P-delta was
not included in the analysis. Details are presented later in this chapter. Impact loading was
examined, and the influence of neglecting impact loads had a minimal effect on our results.
Figure 2.1 Axial spring used to simulate shear
Figure 2.2 Rotational Nonlinear Springs

28
In the NIST investigation, ANSYS was used to model local failures and LS-DYNA was
used to model large-scale collapse. When column buckling appeared to be imminent in ANSYS,
the analyses were continued in the LS-DYNA 47-story model (NIST, 2008, NCSTAR 1-9, Vol.
2). The damage was applied in LS-DYNA as a sudden removal of damaged or failed elements as
calculated in the ANSYS analysis. Buckled beams were modeled by removing flange and web
elements, such that the beam would lose its axial and flexural strength, but the weight of the
beam would remain in the calculation (see Figure 2.3). The connection damage data from
ANSYS was transferred to the LS-DYNA global model using a damage index. Horizontal
support and vertical support were specified separately (see Figure 2.4 and Figure 2.5).
Figure 2.3 Approach used to model buckled beams in LS-DYNA model (NIST, 2008, NCSTAR
1-9, Vol. 2).
29
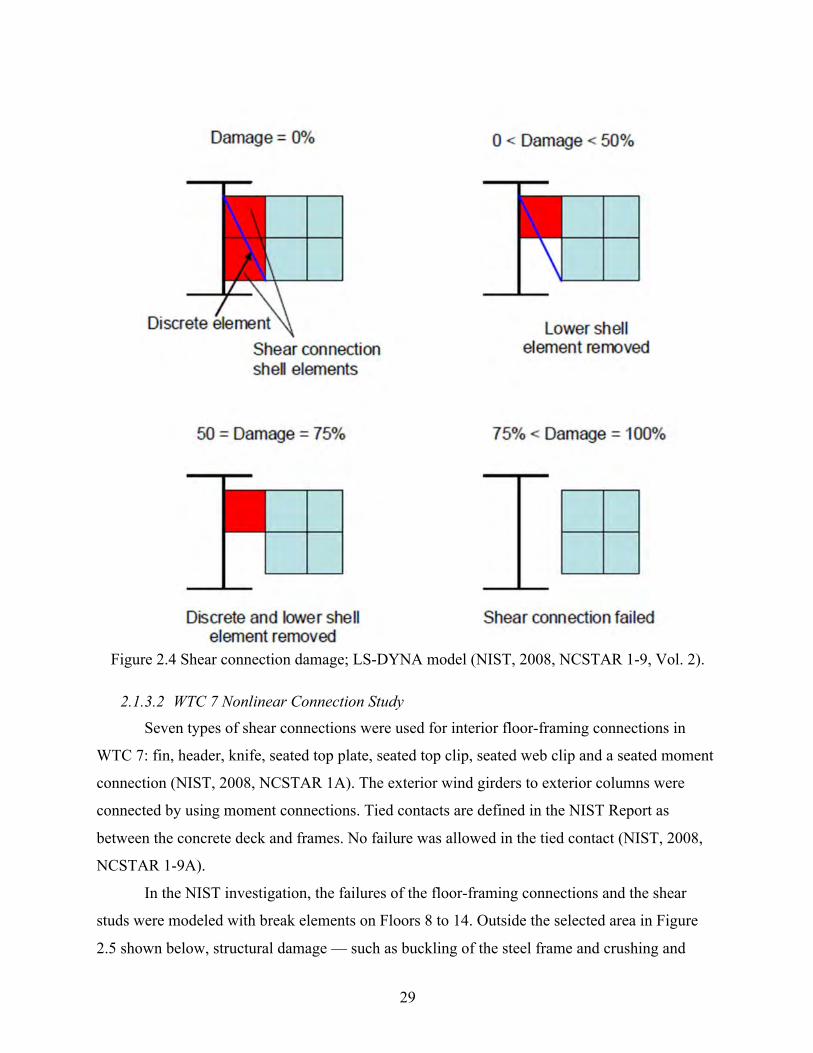
Figure 2.4 Shear connection damage; LS-DYNA model (NIST, 2008, NCSTAR 1-9, Vol. 2).
2.1.3.2 WTC 7 Nonlinear Connection Study
Seven types of shear connections were used for interior floor-framing connections in
WTC 7: fin, header, knife, seated top plate, seated top clip, seated web clip and a seated moment
connection (NIST, 2008, NCSTAR 1A). The exterior wind girders to exterior columns were
connected by using moment connections. Tied contacts are defined in the NIST Report as
between the concrete deck and frames. No failure was allowed in the tied contact (NIST, 2008,
NCSTAR 1-9A).
In the NIST investigation, the failures of the floor-framing connections and the shear
studs were modeled with break elements on Floors 8 to 14. Outside the selected area in Figure
2.5 shown below, structural damage — such as buckling of the steel frame and crushing and
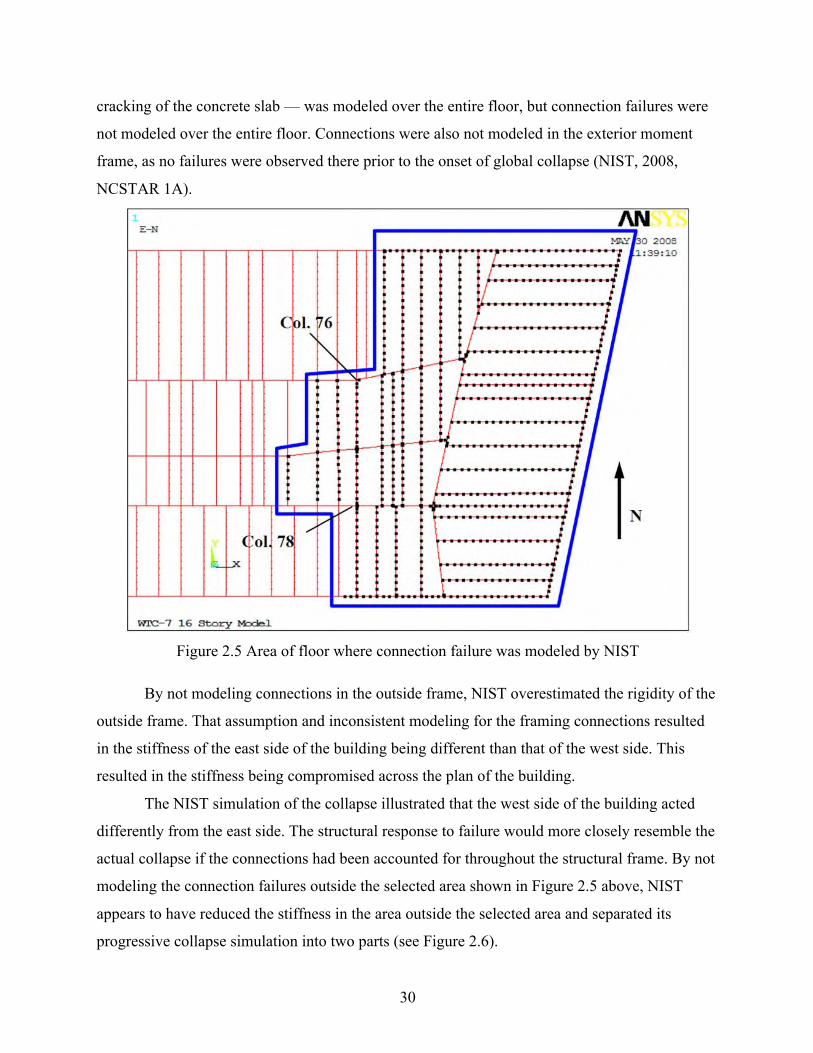
30
cracking of the concrete slab — was modeled over the entire floor, but connection failures were
not modeled over the entire floor. Connections were also not modeled in the exterior moment
frame, as no failures were observed there prior to the onset of global collapse (NIST, 2008,
NCSTAR 1A).
Figure 2.5 Area of floor where connection failure was modeled by NIST
By not modeling connections in the outside frame, NIST overestimated the rigidity of the
outside frame. That assumption and inconsistent modeling for the framing connections resulted
in the stiffness of the east side of the building being different than that of the west side. This
resulted in the stiffness being compromised across the plan of the building.
The NIST simulation of the collapse illustrated that the west side of the building acted
differently from the east side. The structural response to failure would more closely resemble the
actual collapse if the connections had been accounted for throughout the structural frame. By not
modeling the connection failures outside the selected area shown in Figure 2.5 above, NIST
appears to have reduced the stiffness in the area outside the selected area and separated its
progressive collapse simulation into two parts (see Figure 2.6).
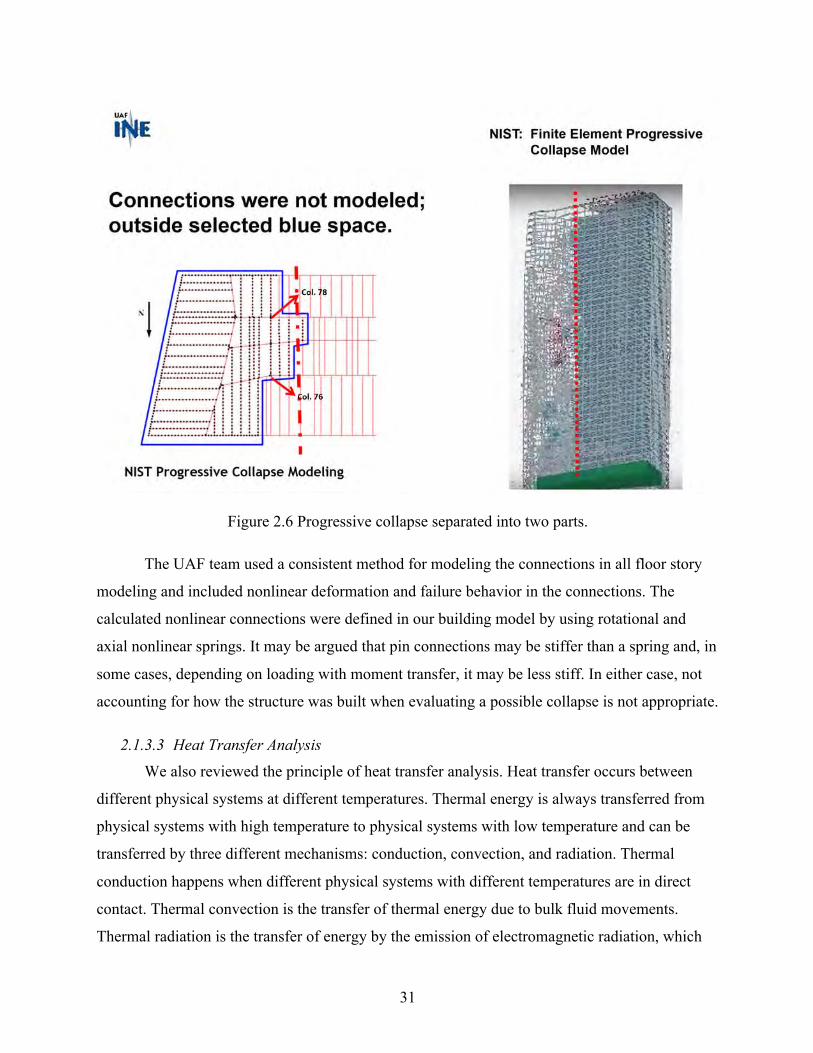
31
Figure 2.6 Progressive collapse separated into two parts.
The UAF team used a consistent method for modeling the connections in all floor story
modeling and included nonlinear deformation and failure behavior in the connections. The
calculated nonlinear connections were defined in our building model by using rotational and
axial nonlinear springs. It may be argued that pin connections may be stiffer than a spring and, in
some cases, depending on loading with moment transfer, it may be less stiff. In either case, not
accounting for how the structure was built when evaluating a possible collapse is not appropriate.
2.1.3.3 Heat Transfer Analysis
We also reviewed the principle of heat transfer analysis. Heat transfer occurs between
different physical systems at different temperatures. Thermal energy is always transferred from
physical systems with high temperature to physical systems with low temperature and can be
transferred by three different mechanisms: conduction, convection, and radiation. Thermal
conduction happens when different physical systems with different temperatures are in direct
contact. Thermal convection is the transfer of thermal energy due to bulk fluid movements.
Thermal radiation is the transfer of energy by the emission of electromagnetic radiation, which
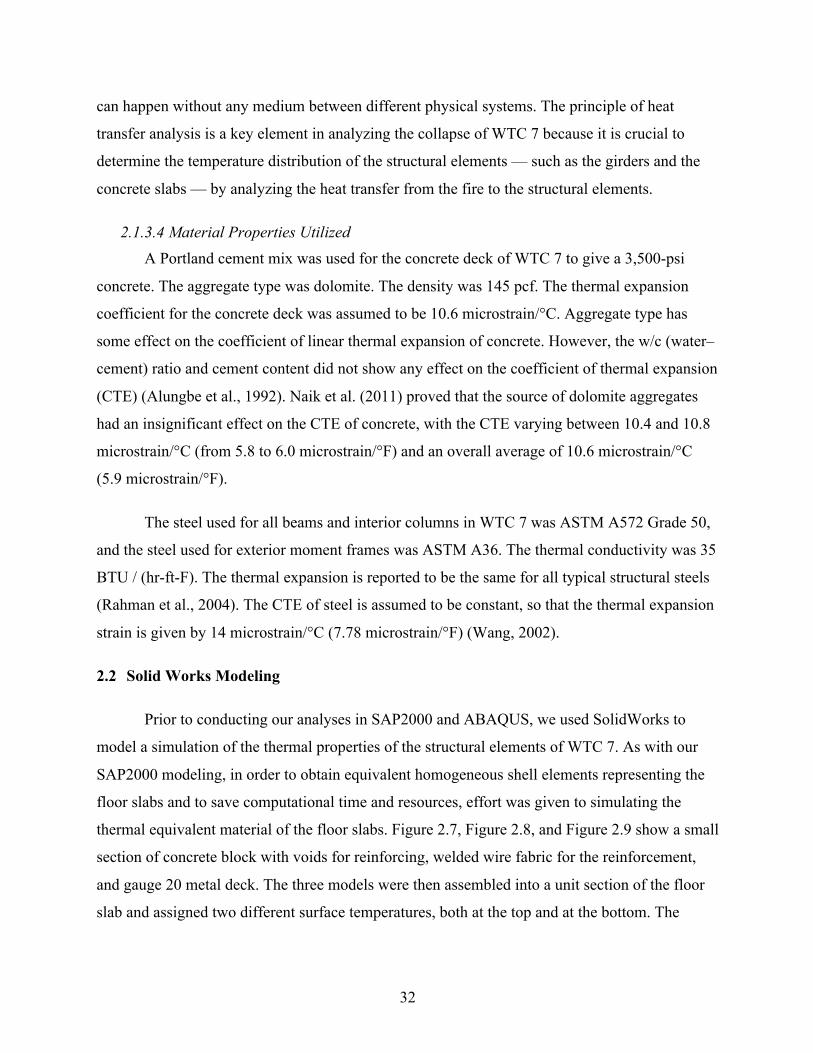
32
can happen without any medium between different physical systems. The principle of heat
transfer analysis is a key element in analyzing the collapse of WTC 7 because it is crucial to
determine the temperature distribution of the structural elements — such as the girders and the
concrete slabs — by analyzing the heat transfer from the fire to the structural elements.
2.1.3.4 Material Properties Utilized A Portland cement mix was used for the concrete deck of WTC 7 to give a 3,500-psi
concrete. The aggregate type was dolomite. The density was 145 pcf. The thermal expansion
coefficient for the concrete deck was assumed to be 10.6 microstrain/°C. Aggregate type has
some effect on the coefficient of linear thermal expansion of concrete. However, the w/c (water–
cement) ratio and cement content did not show any effect on the coefficient of thermal expansion
(CTE) (Alungbe et al., 1992). Naik et al. (2011) proved that the source of dolomite aggregates
had an insignificant effect on the CTE of concrete, with the CTE varying between 10.4 and 10.8
microstrain/°C (from 5.8 to 6.0 microstrain/°F) and an overall average of 10.6 microstrain/°C
(5.9 microstrain/°F).
The steel used for all beams and interior columns in WTC 7 was ASTM A572 Grade 50,
and the steel used for exterior moment frames was ASTM A36. The thermal conductivity was 35
BTU / (hr-ft-F). The thermal expansion is reported to be the same for all typical structural steels
(Rahman et al., 2004). The CTE of steel is assumed to be constant, so that the thermal expansion
strain is given by 14 microstrain/°C (7.78 microstrain/°F) (Wang, 2002).
2.2 Solid Works Modeling
Prior to conducting our analyses in SAP2000 and ABAQUS, we used SolidWorks to
model a simulation of the thermal properties of the structural elements of WTC 7. As with our
SAP2000 modeling, in order to obtain equivalent homogeneous shell elements representing the
floor slabs and to save computational time and resources, effort was given to simulating the
thermal equivalent material of the floor slabs. Figure 2.7, Figure 2.8, and Figure 2.9 show a small
section of concrete block with voids for reinforcing, welded wire fabric for the reinforcement,
and gauge 20 metal deck. The three models were then assembled into a unit section of the floor
slab and assigned two different surface temperatures, both at the top and at the bottom. The
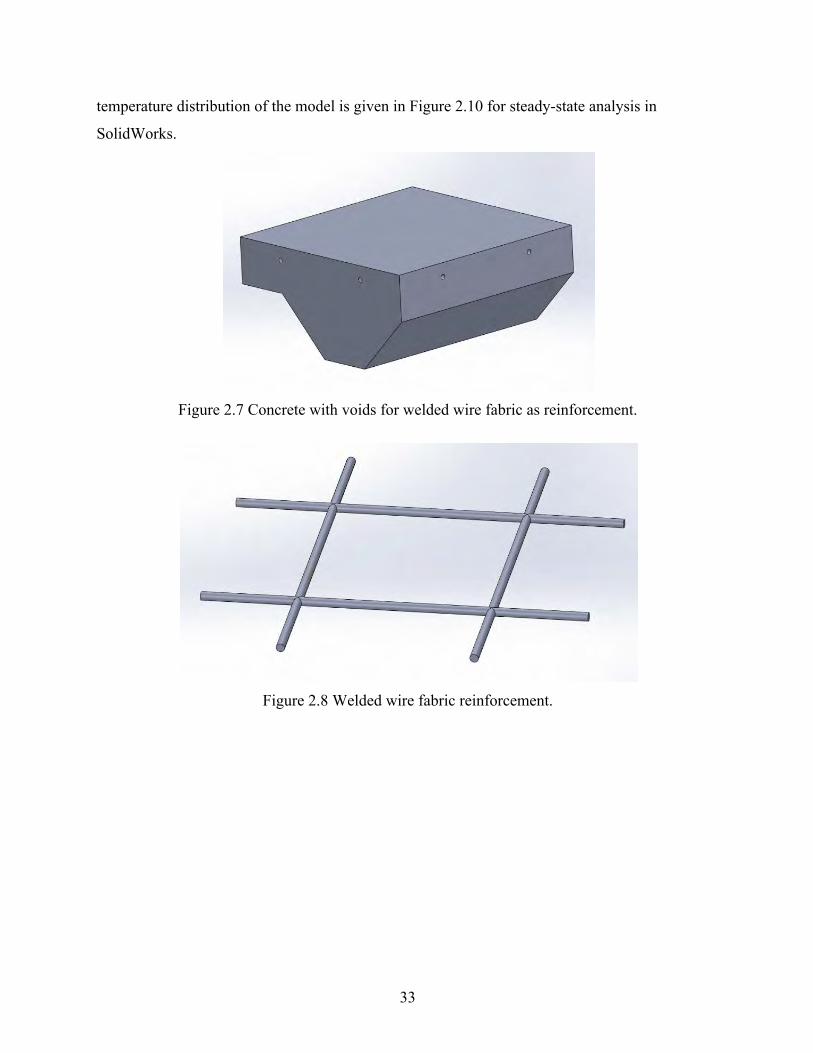
33
temperature distribution of the model is given in Figure 2.10 for steady-state analysis in
SolidWorks.
Figure 2.7 Concrete with voids for welded wire fabric as reinforcement.
Figure 2.8 Welded wire fabric reinforcement.
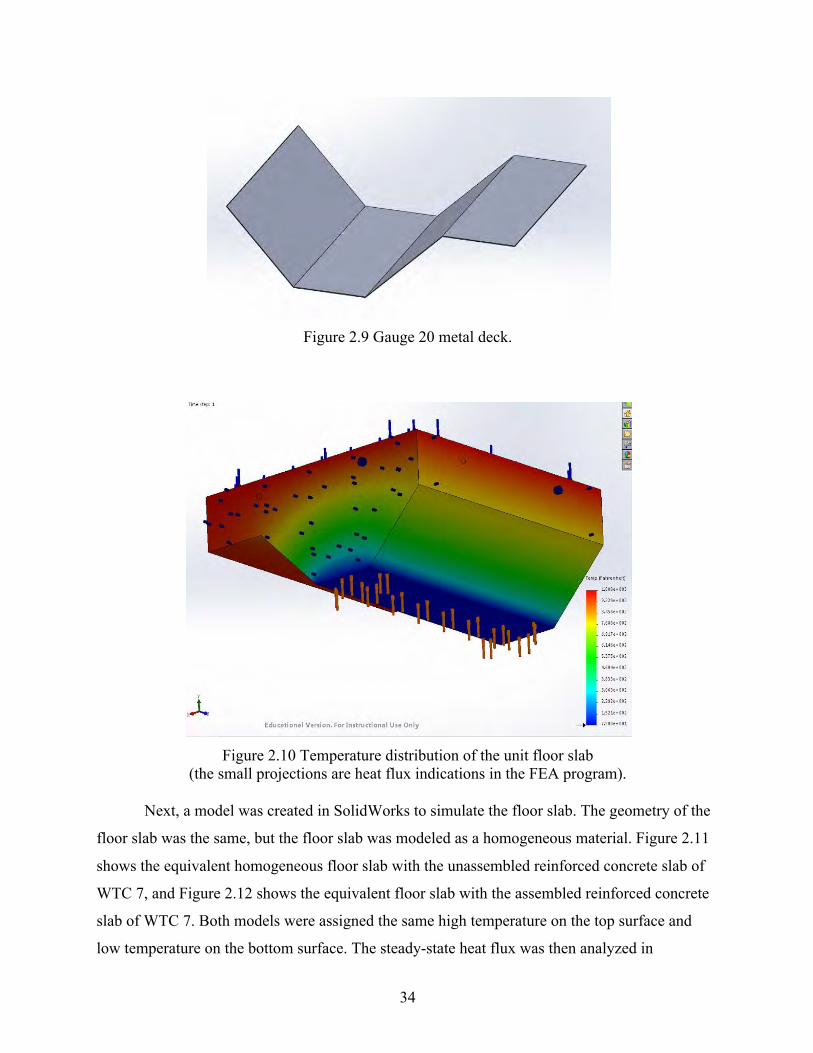
34
Figure 2.9 Gauge 20 metal deck.
Figure 2.10 Temperature distribution of the unit floor slab
(the small projections are heat flux indications in the FEA program).
Next, a model was created in SolidWorks to simulate the floor slab. The geometry of the
floor slab was the same, but the floor slab was modeled as a homogeneous material. Figure 2.11
shows the equivalent homogeneous floor slab with the unassembled reinforced concrete slab of
WTC 7, and Figure 2.12 shows the equivalent floor slab with the assembled reinforced concrete
slab of WTC 7. Both models were assigned the same high temperature on the top surface and
low temperature on the bottom surface. The steady-state heat flux was then analyzed in
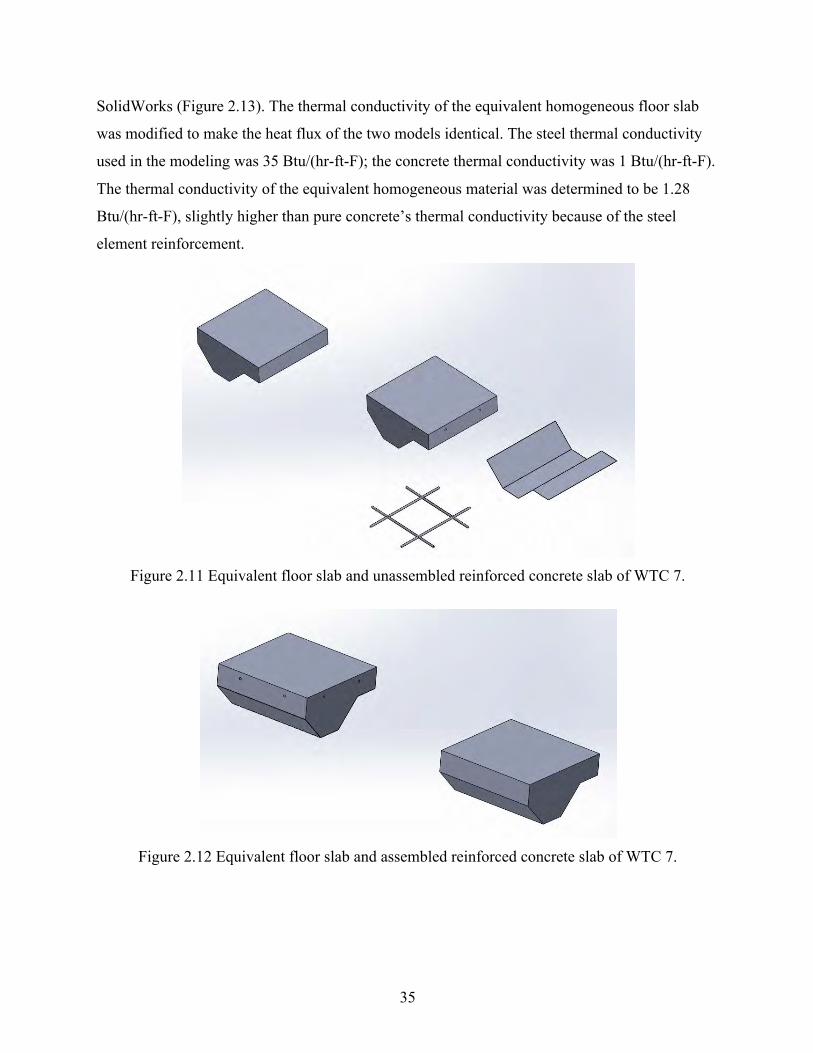
35
SolidWorks (Figure 2.13). The thermal conductivity of the equivalent homogeneous floor slab
was modified to make the heat flux of the two models identical. The steel thermal conductivity
used in the modeling was 35 Btu/(hr-ft-F); the concrete thermal conductivity was 1 Btu/(hr-ft-F).
The thermal conductivity of the equivalent homogeneous material was determined to be 1.28
Btu/(hr-ft-F), slightly higher than pure concrete’s thermal conductivity because of the steel
element reinforcement.
Figure 2.11 Equivalent floor slab and unassembled reinforced concrete slab of WTC 7.
Figure 2.12 Equivalent floor slab and assembled reinforced concrete slab of WTC 7.
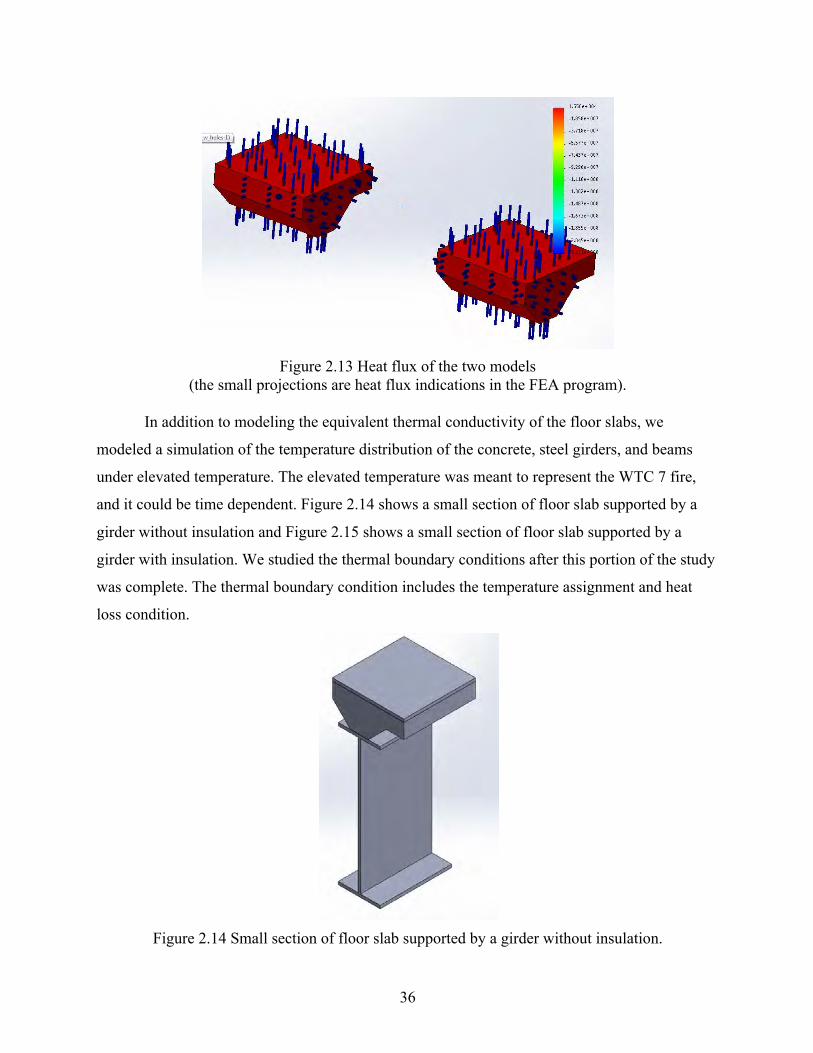
36
Figure 2.13 Heat flux of the two models
(the small projections are heat flux indications in the FEA program).
In addition to modeling the equivalent thermal conductivity of the floor slabs, we
modeled a simulation of the temperature distribution of the concrete, steel girders, and beams
under elevated temperature. The elevated temperature was meant to represent the WTC 7 fire,
and it could be time dependent. Figure 2.14 shows a small section of floor slab supported by a
girder without insulation and Figure 2.15 shows a small section of floor slab supported by a
girder with insulation. We studied the thermal boundary conditions after this portion of the study
was complete. The thermal boundary condition includes the temperature assignment and heat
loss condition.
Figure 2.14 Small section of floor slab supported by a girder without insulation.
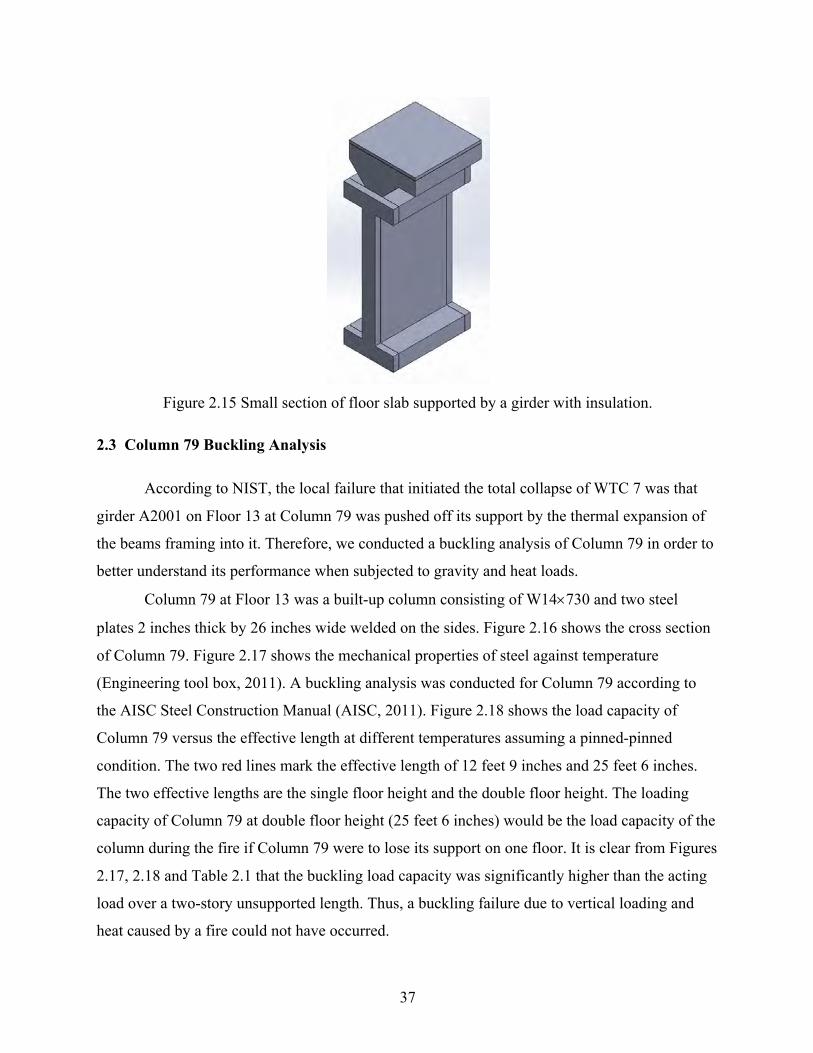
37
Figure 2.15 Small section of floor slab supported by a girder with insulation.
2.3 Column 79 Buckling Analysis
According to NIST, the local failure that initiated the total collapse of WTC 7 was that
girder A2001 on Floor 13 at Column 79 was pushed off its support by the thermal expansion of
the beams framing into it. Therefore, we conducted a buckling analysis of Column 79 in order to
better understand its performance when subjected to gravity and heat loads.
Column 79 at Floor 13 was a built-up column consisting of W14´730 and two steel
plates 2 inches thick by 26 inches wide welded on the sides. Figure 2.16 shows the cross section
of Column 79. Figure 2.17 shows the mechanical properties of steel against temperature
(Engineering tool box, 2011). A buckling analysis was conducted for Column 79 according to
the AISC Steel Construction Manual (AISC, 2011). Figure 2.18 shows the load capacity of
Column 79 versus the effective length at different temperatures assuming a pinned-pinned
condition. The two red lines mark the effective length of 12 feet 9 inches and 25 feet 6 inches.
The two effective lengths are the single floor height and the double floor height. The loading
capacity of Column 79 at double floor height (25 feet 6 inches) would be the load capacity of the
column during the fire if Column 79 were to lose its support on one floor. It is clear from Figures
2.17, 2.18 and Table 2.1 that the buckling load capacity was significantly higher than the acting
load over a two-story unsupported length. Thus, a buckling failure due to vertical loading and
heat caused by a fire could not have occurred.

38
Figure 2.16 Cross section of Column 79.
Figure 2.17 Mechanical properties of steel against temperature.
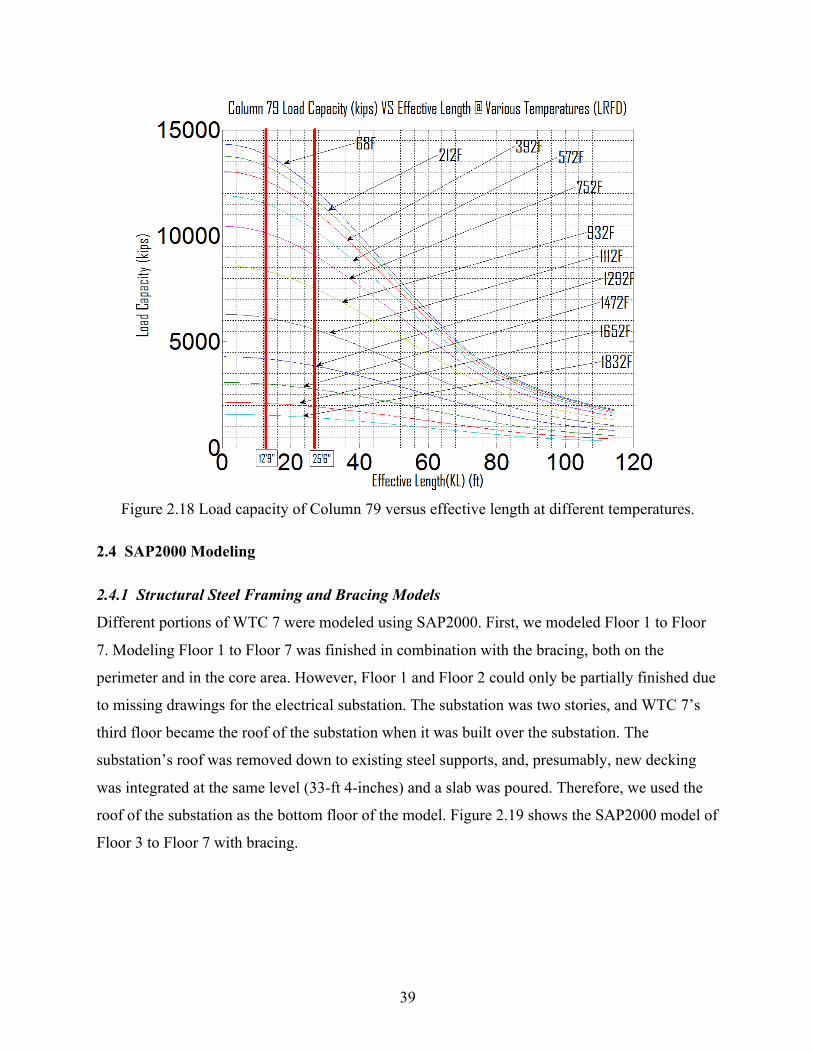
39
Figure 2.18 Load capacity of Column 79 versus effective length at different temperatures.
2.4 SAP2000 Modeling
2.4.1 Structural Steel Framing and Bracing Models
Different portions of WTC 7 were modeled using SAP2000. First, we modeled Floor 1 to Floor
7. Modeling Floor 1 to Floor 7 was finished in combination with the bracing, both on the
perimeter and in the core area. However, Floor 1 and Floor 2 could only be partially finished due
to missing drawings for the electrical substation. The substation was two stories, and WTC 7’s
third floor became the roof of the substation when it was built over the substation. The
substation’s roof was removed down to existing steel supports, and, presumably, new decking
was integrated at the same level (33-ft 4-inches) and a slab was poured. Therefore, we used the
roof of the substation as the bottom floor of the model. Figure 2.19 shows the SAP2000 model of
Floor 3 to Floor 7 with bracing.
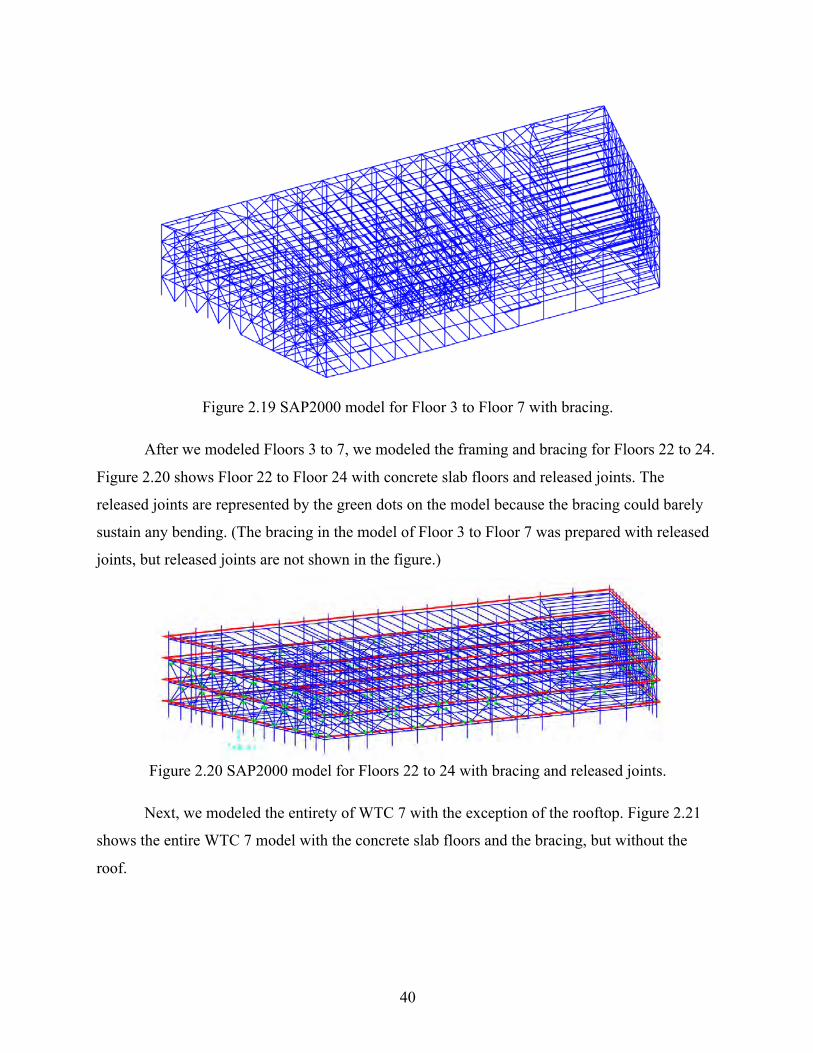
40
Figure 2.19 SAP2000 model for Floor 3 to Floor 7 with bracing.
After we modeled Floors 3 to 7, we modeled the framing and bracing for Floors 22 to 24.
Figure 2.20 shows Floor 22 to Floor 24 with concrete slab floors and released joints. The
released joints are represented by the green dots on the model because the bracing could barely
sustain any bending. (The bracing in the model of Floor 3 to Floor 7 was prepared with released
joints, but released joints are not shown in the figure.)
Figure 2.20 SAP2000 model for Floors 22 to 24 with bracing and released joints.
Next, we modeled the entirety of WTC 7 with the exception of the rooftop. Figure 2.21
shows the entire WTC 7 model with the concrete slab floors and the bracing, but without the
roof.
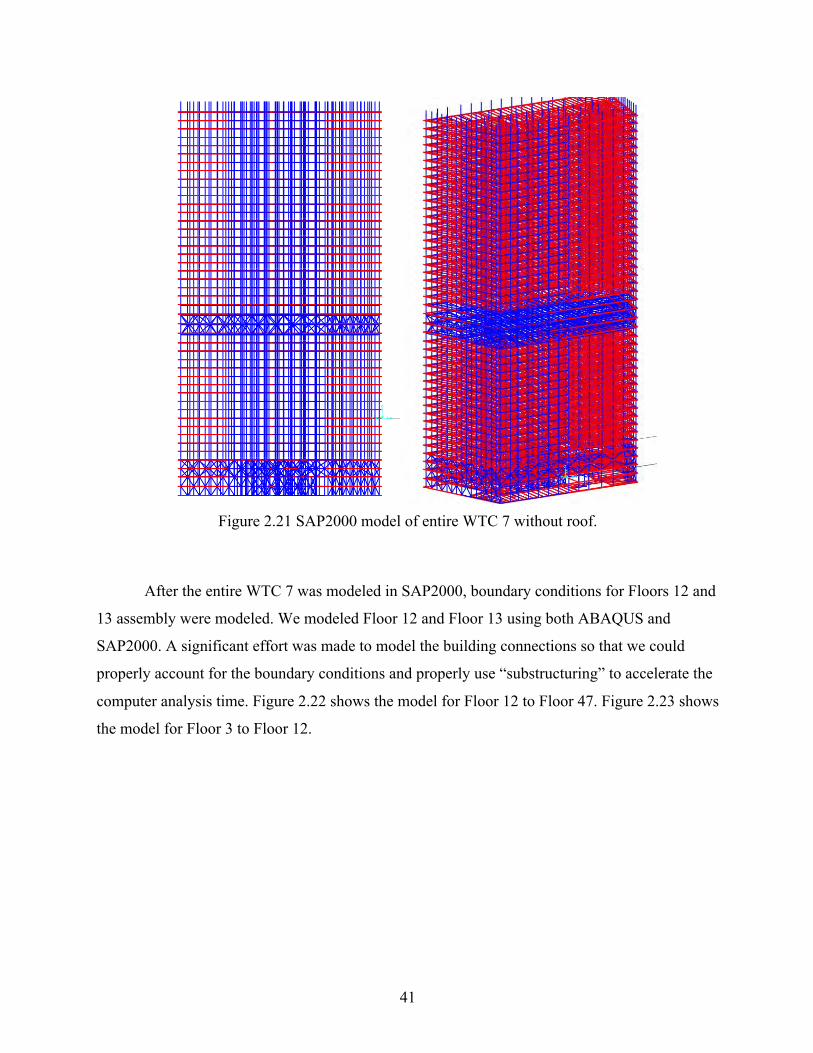
41
Figure 2.21 SAP2000 model of entire WTC 7 without roof.
After the entire WTC 7 was modeled in SAP2000, boundary conditions for Floors 12 and
13 assembly were modeled. We modeled Floor 12 and Floor 13 using both ABAQUS and
SAP2000. A significant effort was made to model the building connections so that we could
properly account for the boundary conditions and properly use “substructuring” to accelerate the
computer analysis time. Figure 2.22 shows the model for Floor 12 to Floor 47. Figure 2.23 shows
the model for Floor 3 to Floor 12.
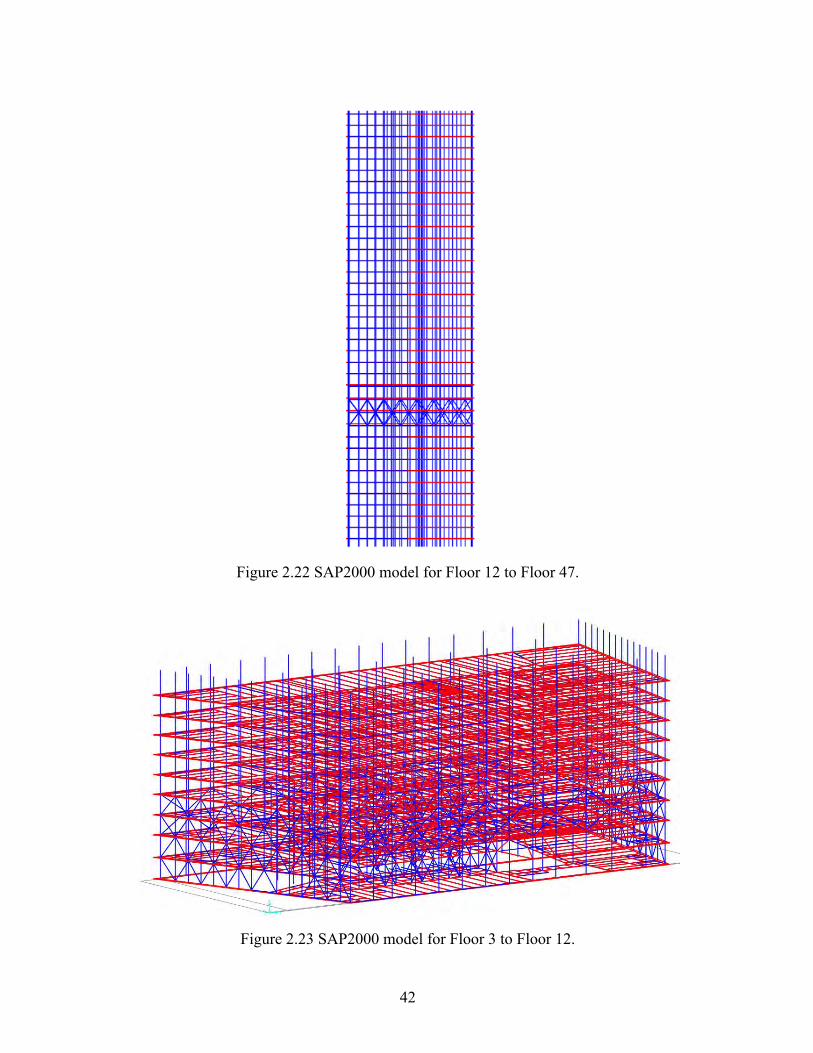
42
Figure 2.22 SAP2000 model for Floor 12 to Floor 47.
Figure 2.23 SAP2000 model for Floor 3 to Floor 12.
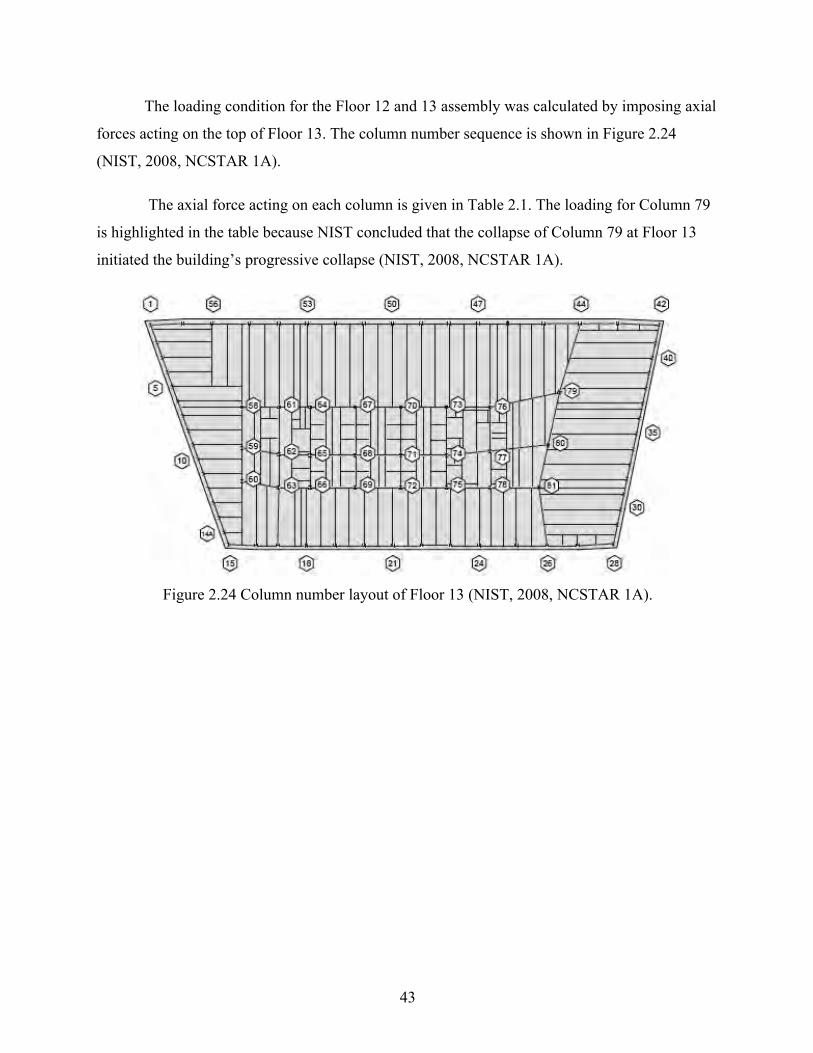
43
The loading condition for the Floor 12 and 13 assembly was calculated by imposing axial
forces acting on the top of Floor 13. The column number sequence is shown in Figure 2.24
(NIST, 2008, NCSTAR 1A).
The axial force acting on each column is given in Table 2.1. The loading for Column 79
is highlighted in the table because NIST concluded that the collapse of Column 79 at Floor 13
initiated the building’s progressive collapse (NIST, 2008, NCSTAR 1A).
Figure 2.24 Column number layout of Floor 13 (NIST, 2008, NCSTAR 1A).
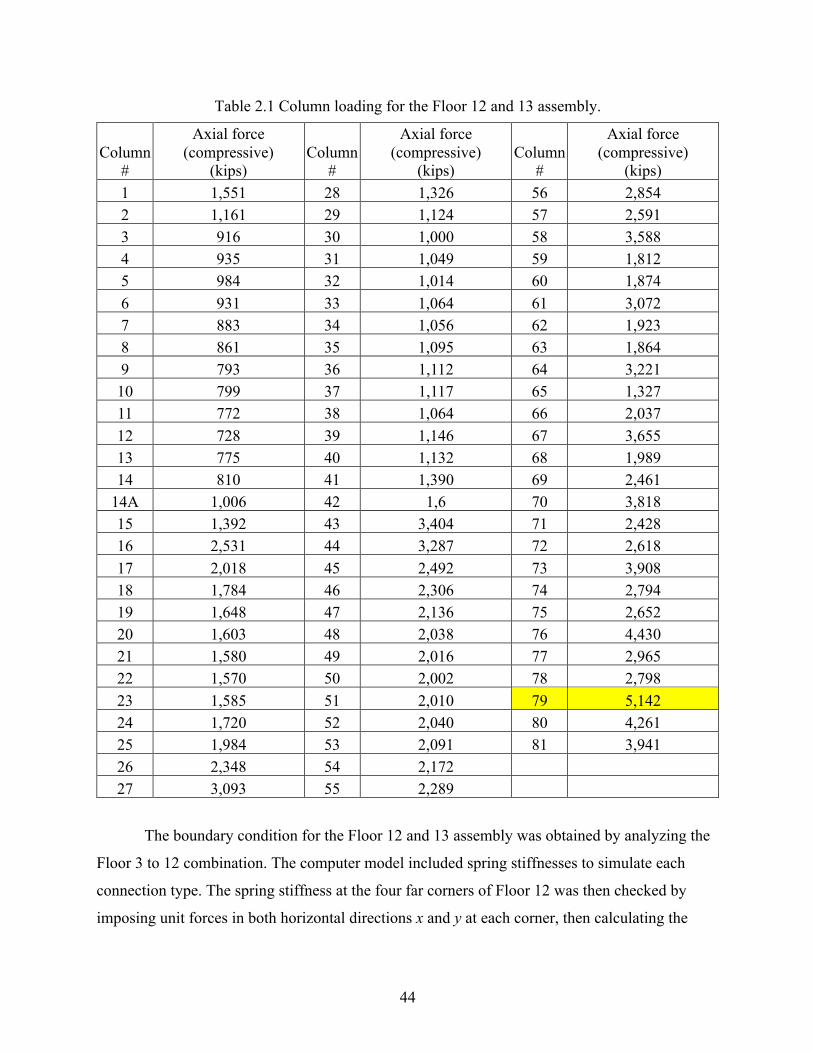
44
Table 2.1 Column loading for the Floor 12 and 13 assembly.
Column #
Axial force (compressive)
(kips) Column
#
Axial force (compressive)
(kips) Column
#
Axial force (compressive)
(kips) 1 1,551 28 1,326 56 2,854 2 1,161 29 1,124 57 2,591 3 916 30 1,000 58 3,588 4 935 31 1,049 59 1,812 5 984 32 1,014 60 1,874 6 931 33 1,064 61 3,072 7 883 34 1,056 62 1,923 8 861 35 1,095 63 1,864 9 793 36 1,112 64 3,221 10 799 37 1,117 65 1,327 11 772 38 1,064 66 2,037 12 728 39 1,146 67 3,655 13 775 40 1,132 68 1,989 14 810 41 1,390 69 2,461
14A 1,006 42 1,6 70 3,818 15 1,392 43 3,404 71 2,428 16 2,531 44 3,287 72 2,618 17 2,018 45 2,492 73 3,908 18 1,784 46 2,306 74 2,794 19 1,648 47 2,136 75 2,652 20 1,603 48 2,038 76 4,430 21 1,580 49 2,016 77 2,965 22 1,570 50 2,002 78 2,798 23 1,585 51 2,010 79 5,142 24 1,720 52 2,040 80 4,261 25 1,984 53 2,091 81 3,941 26 2,348 54 2,172 27 3,093 55 2,289
The boundary condition for the Floor 12 and 13 assembly was obtained by analyzing the
Floor 3 to 12 combination. The computer model included spring stiffnesses to simulate each
connection type. The spring stiffness at the four far corners of Floor 12 was then checked by
imposing unit forces in both horizontal directions x and y at each corner, then calculating the
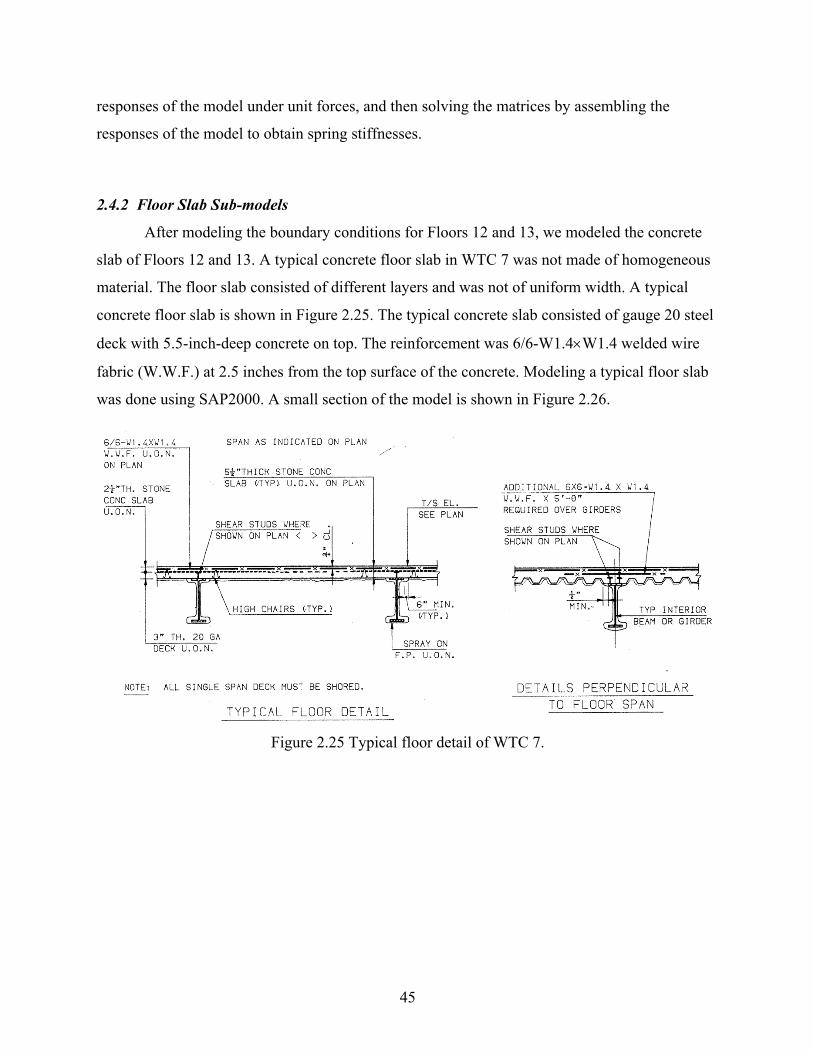
45
responses of the model under unit forces, and then solving the matrices by assembling the
responses of the model to obtain spring stiffnesses.
2.4.2 Floor Slab Sub-models
After modeling the boundary conditions for Floors 12 and 13, we modeled the concrete
slab of Floors 12 and 13. A typical concrete floor slab in WTC 7 was not made of homogeneous
material. The floor slab consisted of different layers and was not of uniform width. A typical
concrete floor slab is shown in Figure 2.25. The typical concrete slab consisted of gauge 20 steel
deck with 5.5-inch-deep concrete on top. The reinforcement was 6/6-W1.4´W1.4 welded wire
fabric (W.W.F.) at 2.5 inches from the top surface of the concrete. Modeling a typical floor slab
was done using SAP2000. A small section of the model is shown in Figure 2.26.
Figure 2.25 Typical floor detail of WTC 7.
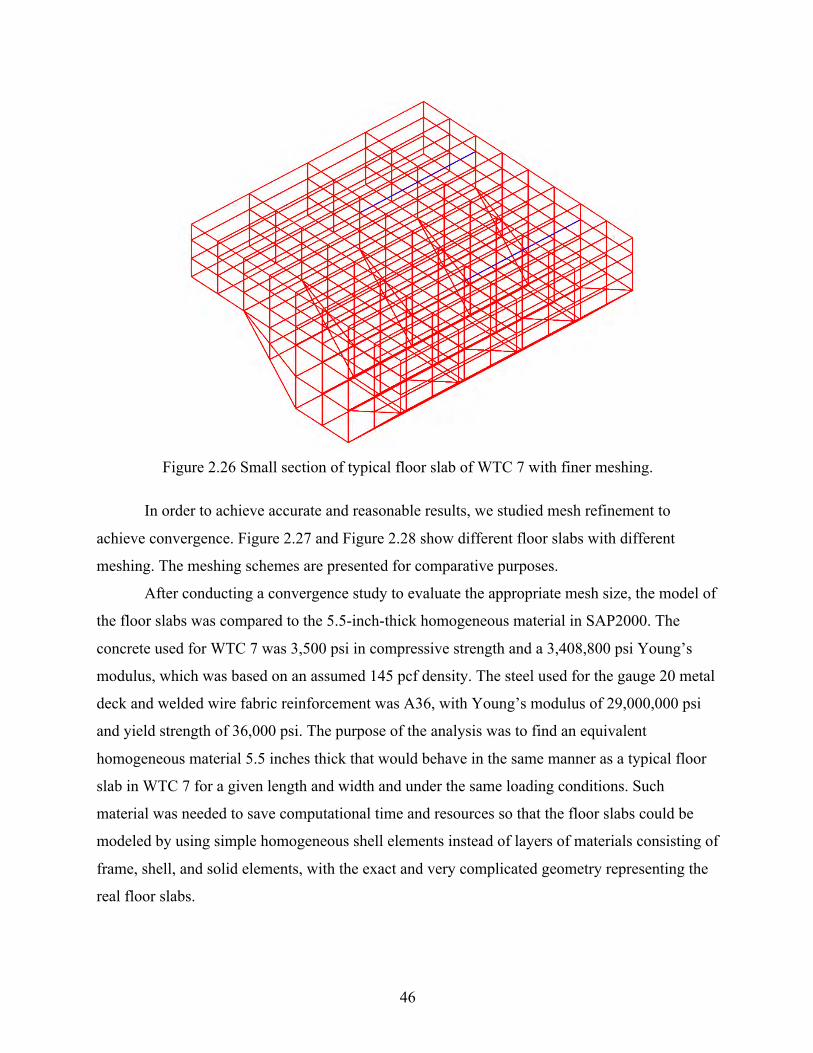
46
Figure 2.26 Small section of typical floor slab of WTC 7 with finer meshing.
In order to achieve accurate and reasonable results, we studied mesh refinement to
achieve convergence. Figure 2.27 and Figure 2.28 show different floor slabs with different
meshing. The meshing schemes are presented for comparative purposes.
After conducting a convergence study to evaluate the appropriate mesh size, the model of
the floor slabs was compared to the 5.5-inch-thick homogeneous material in SAP2000. The
concrete used for WTC 7 was 3,500 psi in compressive strength and a 3,408,800 psi Young’s
modulus, which was based on an assumed 145 pcf density. The steel used for the gauge 20 metal
deck and welded wire fabric reinforcement was A36, with Young’s modulus of 29,000,000 psi
and yield strength of 36,000 psi. The purpose of the analysis was to find an equivalent
homogeneous material 5.5 inches thick that would behave in the same manner as a typical floor
slab in WTC 7 for a given length and width and under the same loading conditions. Such
material was needed to save computational time and resources so that the floor slabs could be
modeled by using simple homogeneous shell elements instead of layers of materials consisting of
frame, shell, and solid elements, with the exact and very complicated geometry representing the
real floor slabs.

47
Figure 2.27 Example of mesh used to study convergence performance for a WTC 7 floor slab.
Figure 2.28 Models of floor slabs with different meshing.
Figure 2.28 above shows how we modeled the floor slabs to determine a calculated
equivalent homogeneous material in the flute direction. The left side is the 5.5-inch-thick
homogeneous shell elements acting as the equivalent floor slabs. The right side is the model that
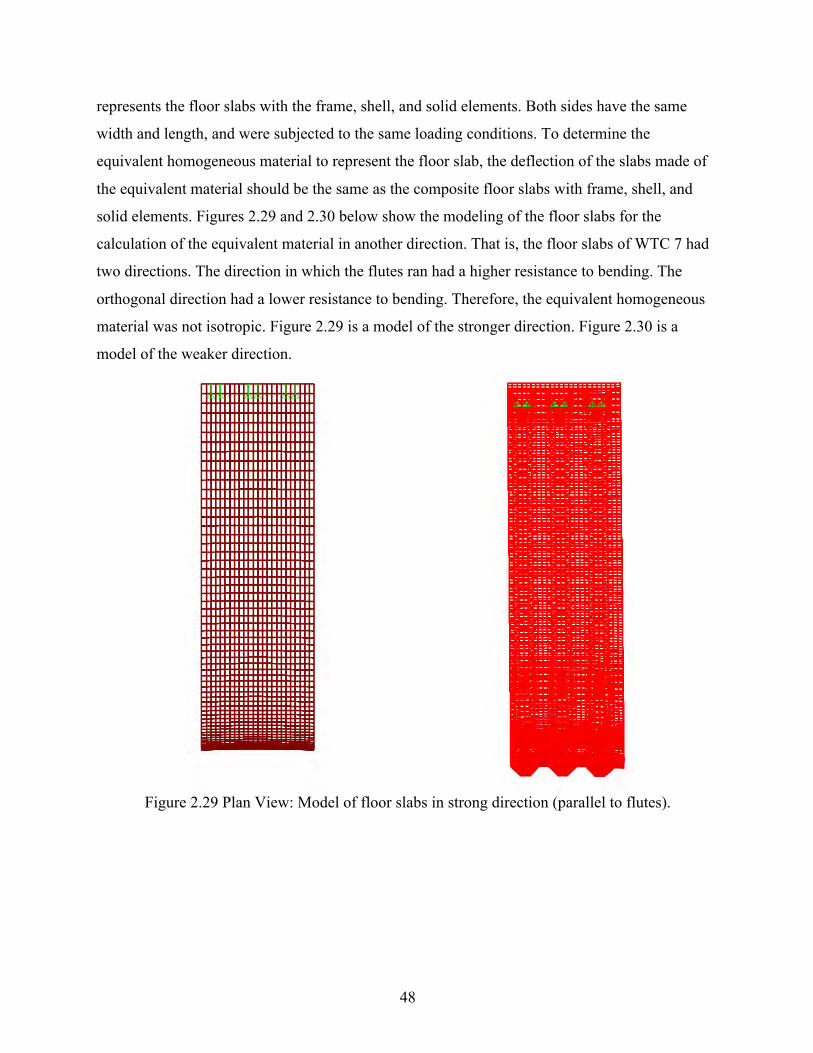
48
represents the floor slabs with the frame, shell, and solid elements. Both sides have the same
width and length, and were subjected to the same loading conditions. To determine the
equivalent homogeneous material to represent the floor slab, the deflection of the slabs made of
the equivalent material should be the same as the composite floor slabs with frame, shell, and
solid elements. Figures 2.29 and 2.30 below show the modeling of the floor slabs for the
calculation of the equivalent material in another direction. That is, the floor slabs of WTC 7 had
two directions. The direction in which the flutes ran had a higher resistance to bending. The
orthogonal direction had a lower resistance to bending. Therefore, the equivalent homogeneous
material was not isotropic. Figure 2.29 is a model of the stronger direction. Figure 2.30 is a
model of the weaker direction.
Figure 2.29 Plan View: Model of floor slabs in strong direction (parallel to flutes).
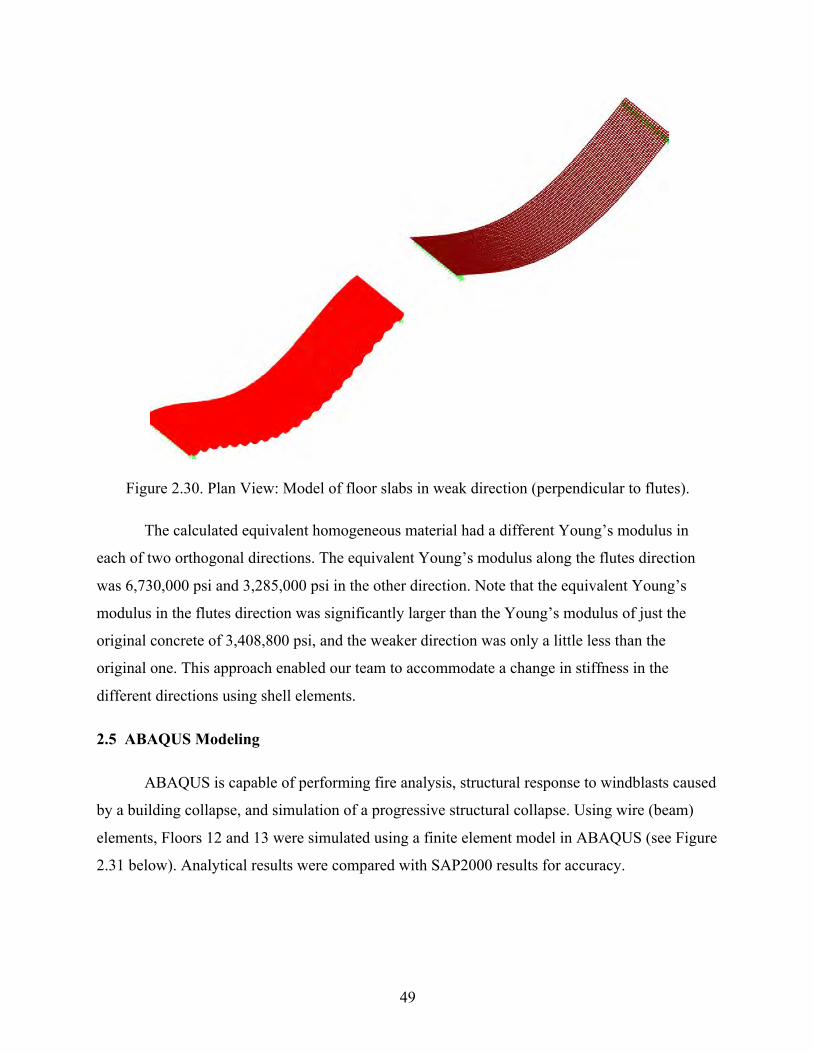
49
Figure 2.30. Plan View: Model of floor slabs in weak direction (perpendicular to flutes).
The calculated equivalent homogeneous material had a different Young’s modulus in
each of two orthogonal directions. The equivalent Young’s modulus along the flutes direction
was 6,730,000 psi and 3,285,000 psi in the other direction. Note that the equivalent Young’s
modulus in the flutes direction was significantly larger than the Young’s modulus of just the
original concrete of 3,408,800 psi, and the weaker direction was only a little less than the
original one. This approach enabled our team to accommodate a change in stiffness in the
different directions using shell elements.
2.5 ABAQUS Modeling
ABAQUS is capable of performing fire analysis, structural response to windblasts caused
by a building collapse, and simulation of a progressive structural collapse. Using wire (beam)
elements, Floors 12 and 13 were simulated using a finite element model in ABAQUS (see Figure
2.31 below). Analytical results were compared with SAP2000 results for accuracy.

50
2.5.1 Floors 12 and 13 ABAQUS Model
The concrete decks of Floors 12 and 13 were approximated using shell elements. The
frames were approximated using beam elements. Decks and frames (beams and girders) were
modeled as composite behavior.
Figure 2.31 Floor 12 and 13 ABAQUS model.
2.5.1.1 Simple Beam Test Using ABAQUS (comparison to SAP2000 model) To study the deck (concrete floor slab) and frame connection, we conducted a simple
beam test to simulate slab-frame composite behavior. Preliminary studies using ABAQUS
showed that the WTC 7 slab could be simulated by using shell elements and frame sections by
beam elements. Beams and shells were drawn so the elevation of the concrete slab’s vertical
centroid shared the same joints. Frame joint offsets and top center insertion points were used to
place the deck above the frame (see Figure 2.32)
Figure 2.32 The link for deck and beam.
To evaluate the required number of links, we studied three simple beams (Figure 2.33),
built by using 3, 9, and 17 links (Figure 2.34). The beam was approximated using beam
elements. The slab (deck) was modeled with shell elements. The beam span was 52.75 feet; the
specified uniformly distributed load was 0.657 kip/ft. The effective width of the slab (deck) was

51
114.25 inches, and the thickness was 5.5 inches. The steel section was W24´55. It was the
objective of this study to assure that the interactive behavior between beam and slab were
properly accounted for. Dead load was accounted based on the material density and the geometry
of the sections. Live load was introduced as an external load.
Figure 2.33 Simple beam and deck.
a. 3-link simple beam
b. 9-link beam and deck
c. 17-link beam and deck
Figure 2.34 Three beam decks with different numbers of links.

52
Mid-point displacements of each beam deck analyzed using ABAQUS were compared
with a hand calculation. The details for ABAQUS and hand calculation results converged with
an increase in the number of links between the deck and beam (Table 2.2). The results show that
the error drops significantly at the 9-link condition (Figure 2.35).
Table 2.2 Simple beam mid-point displacement.
Hand
Calculation
ABAQUS Analysis
3 Connections 9 Connections 17 Connections
Non-composite
(in.) -3.03 - - -
Composite (in.) -0.94 -1.96 -1.03 -0.97
Error (%) None -108.5 -9.6 -3.2
Figure 2.35 The error between ABAQUS and hand calculation for three models.
2.5.2 Structural Steel Connections Using ABAQUS
WTC 7 is a steel-framed structure with numerous connections. To accurately evaluate the
stiffness of the structure, we modeled the structural framing member, each connection type, and
their attachment to the appropriate beams, girders, and columns. Each connection type was
modeled using nonlinear coil and nonlinear axial springs that provided for axial, shear and
3Connections
9Connections
17Connections
Error -108.5 -9.6 -3.2
-120.0
-100.0
-80.0
-60.0
-40.0
-20.0
0.0
Err
or (%
)
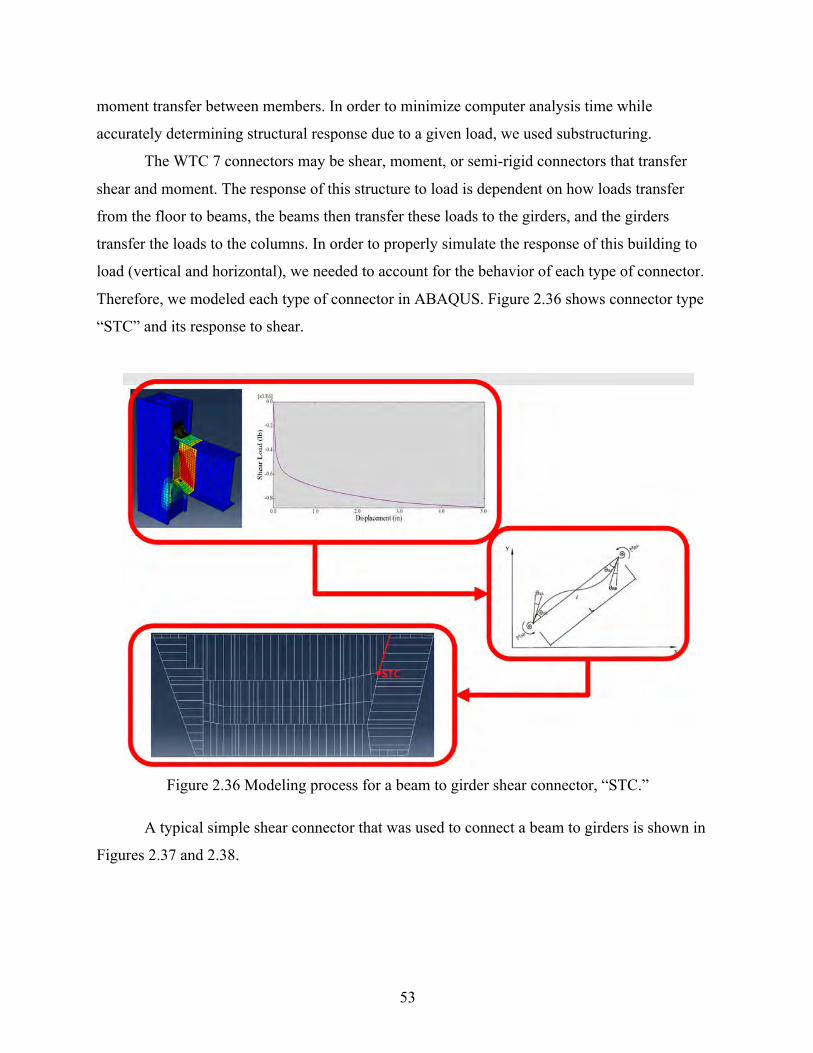
53
moment transfer between members. In order to minimize computer analysis time while
accurately determining structural response due to a given load, we used substructuring.
The WTC 7 connectors may be shear, moment, or semi-rigid connectors that transfer
shear and moment. The response of this structure to load is dependent on how loads transfer
from the floor to beams, the beams then transfer these loads to the girders, and the girders
transfer the loads to the columns. In order to properly simulate the response of this building to
load (vertical and horizontal), we needed to account for the behavior of each type of connector.
Therefore, we modeled each type of connector in ABAQUS. Figure 2.36 shows connector type
“STC” and its response to shear.
Figure 2.36 Modeling process for a beam to girder shear connector, “STC.”
A typical simple shear connector that was used to connect a beam to girders is shown in
Figures 2.37 and 2.38.
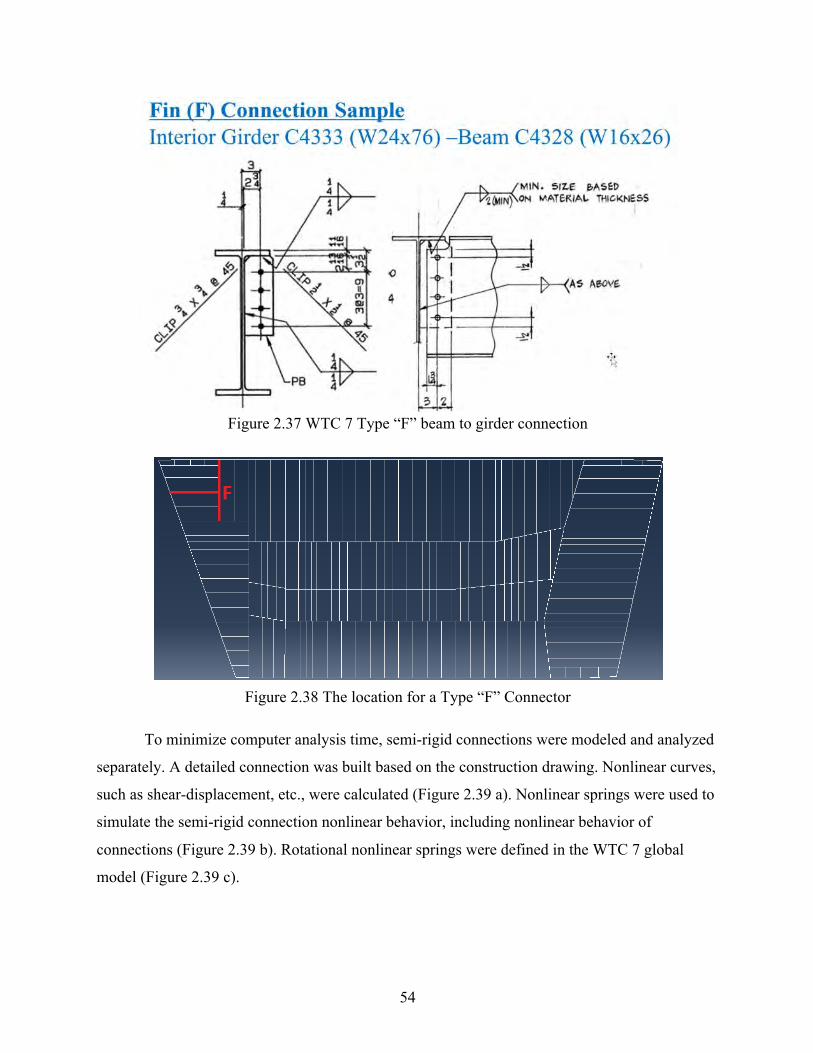
54
Figure 2.37 WTC 7 Type “F” beam to girder connection
Figure 2.38 The location for a Type “F” Connector
To minimize computer analysis time, semi-rigid connections were modeled and analyzed
separately. A detailed connection was built based on the construction drawing. Nonlinear curves,
such as shear-displacement, etc., were calculated (Figure 2.39 a). Nonlinear springs were used to
simulate the semi-rigid connection nonlinear behavior, including nonlinear behavior of
connections (Figure 2.39 b). Rotational nonlinear springs were defined in the WTC 7 global
model (Figure 2.39 c).
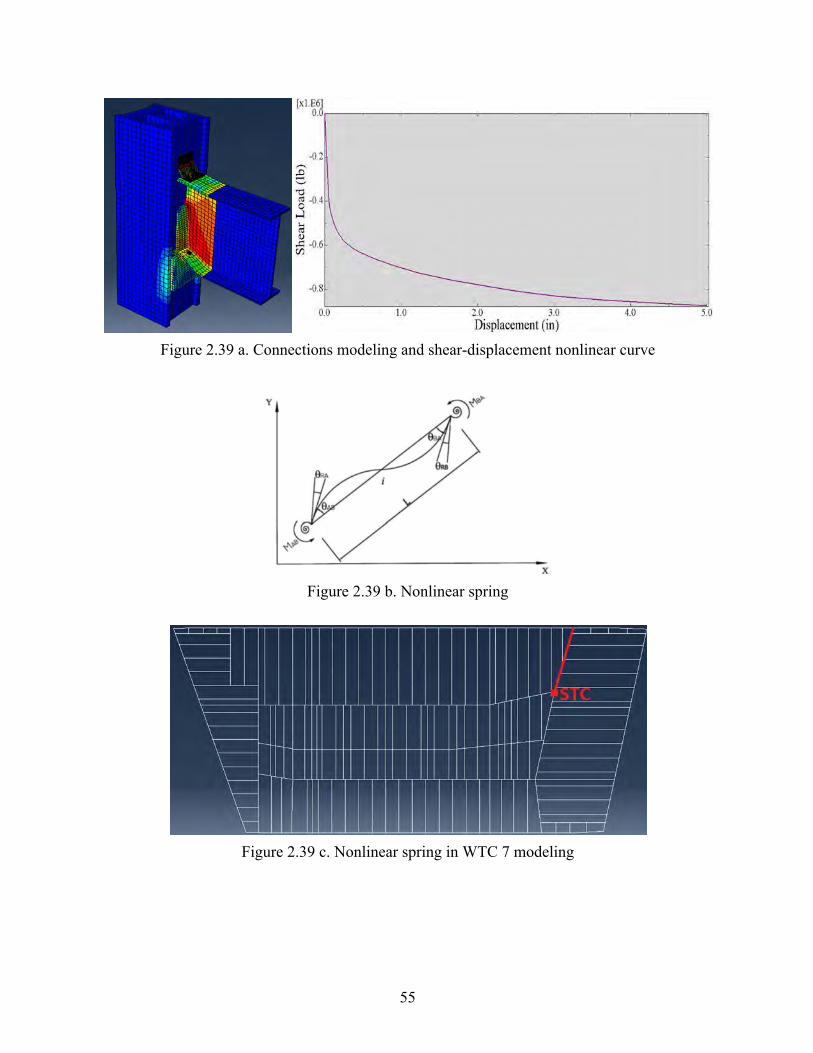
55
Figure 2.39 a. Connections modeling and shear-displacement nonlinear curve
Figure 2.39 b. Nonlinear spring
Figure 2.39 c. Nonlinear spring in WTC 7 modeling
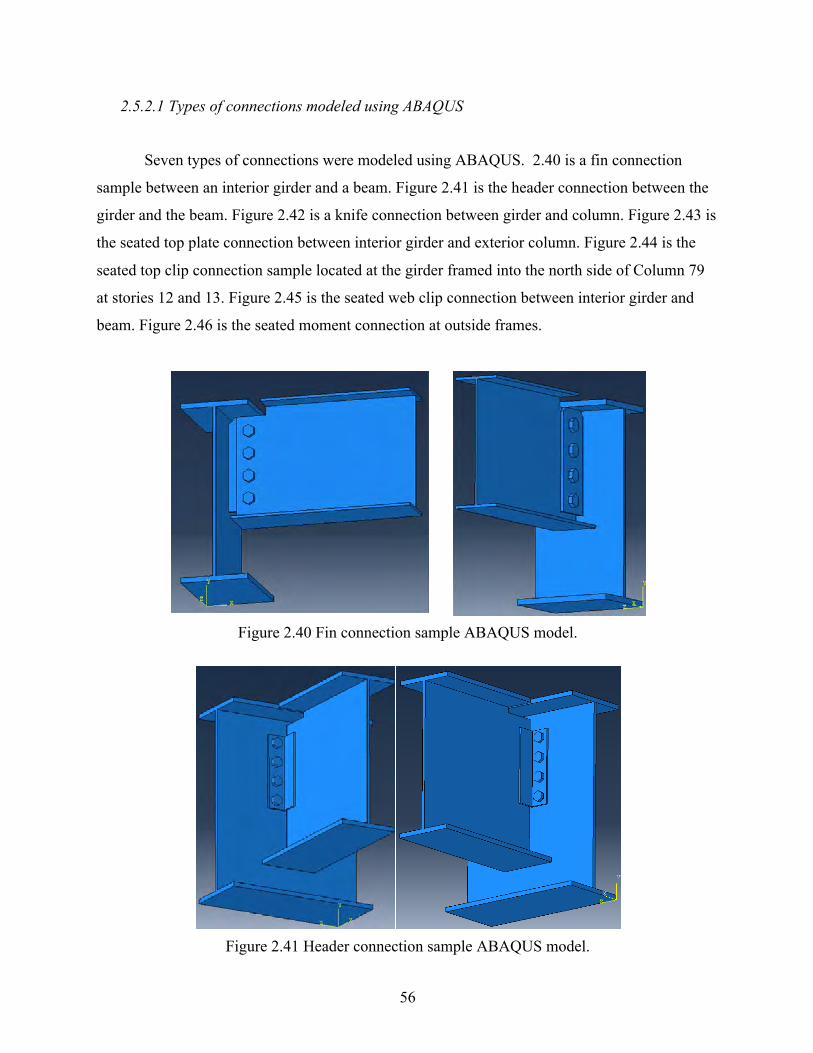
56
2.5.2.1 Types of connections modeled using ABAQUS
Seven types of connections were modeled using ABAQUS. 2.40 is a fin connection
sample between an interior girder and a beam. Figure 2.41 is the header connection between the
girder and the beam. Figure 2.42 is a knife connection between girder and column. Figure 2.43 is
the seated top plate connection between interior girder and exterior column. Figure 2.44 is the
seated top clip connection sample located at the girder framed into the north side of Column 79
at stories 12 and 13. Figure 2.45 is the seated web clip connection between interior girder and
beam. Figure 2.46 is the seated moment connection at outside frames.
Figure 2.40 Fin connection sample ABAQUS model.
Figure 2.41 Header connection sample ABAQUS model.
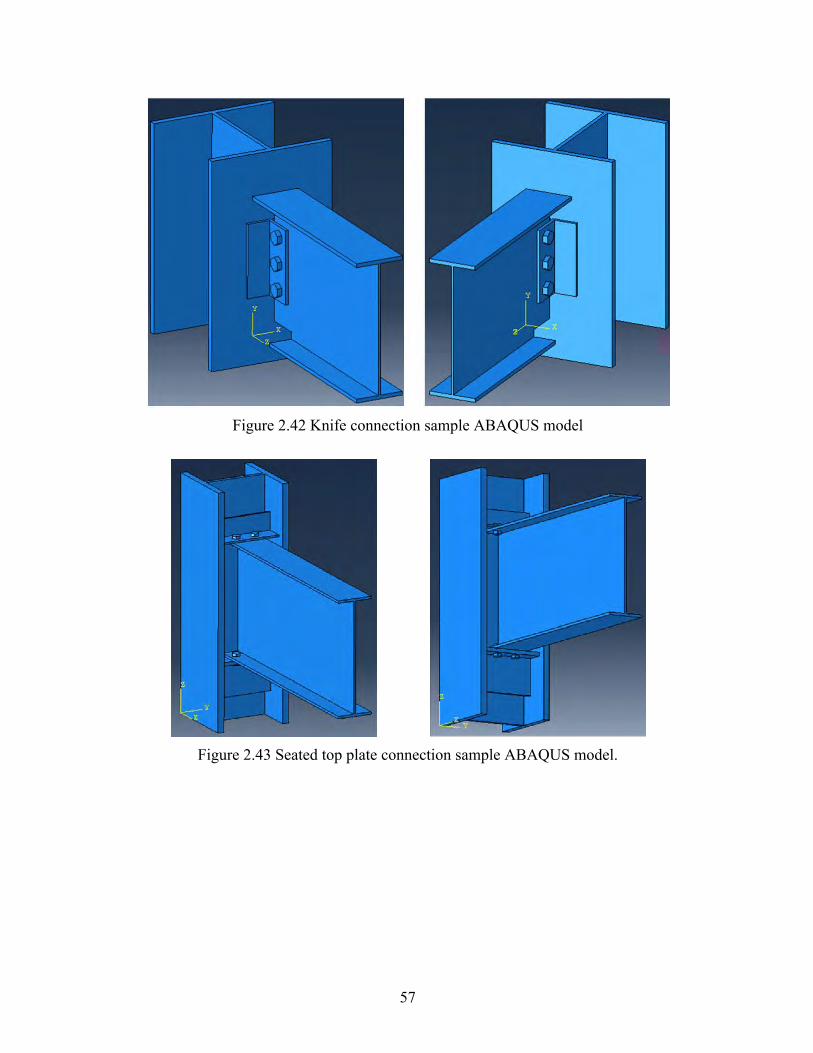
57
Figure 2.42 Knife connection sample ABAQUS model
Figure 2.43 Seated top plate connection sample ABAQUS model.
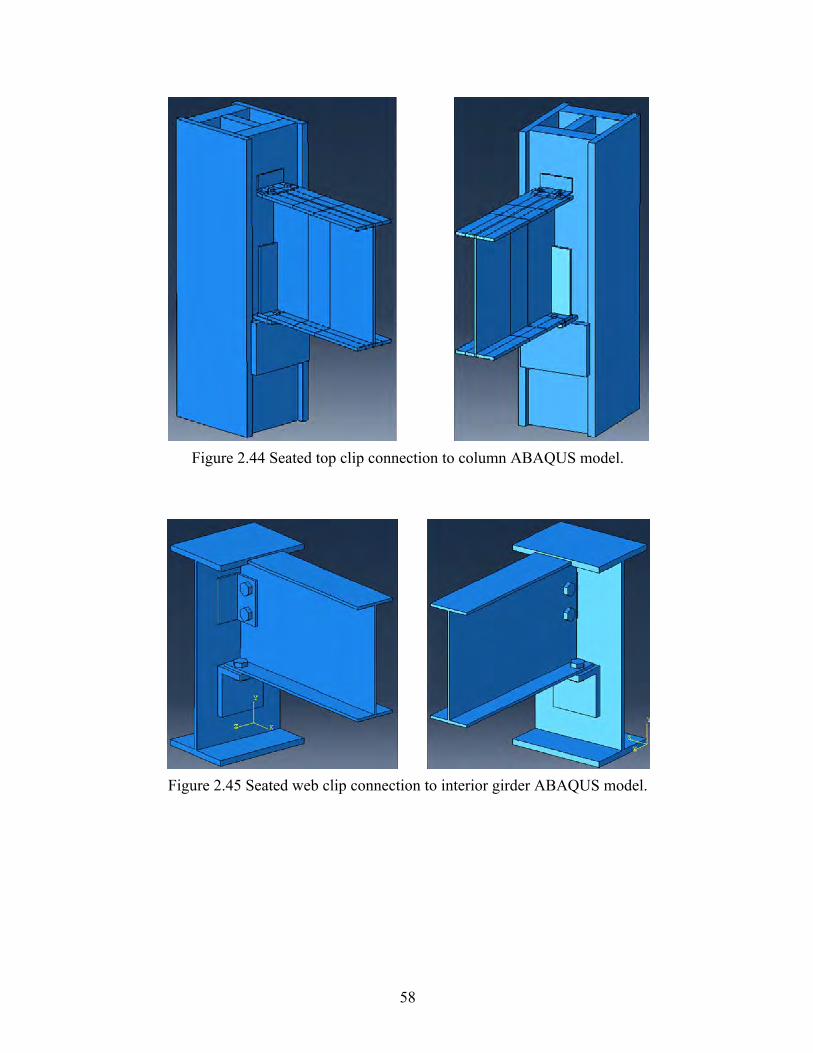
58
Figure 2.44 Seated top clip connection to column ABAQUS model.
Figure 2.45 Seated web clip connection to interior girder ABAQUS model.

59
Figure 2.46 Seated moment connection of exterior girders to exterior columns ABAQUS model.
2.5.2.2 Connection Nonlinear Analysis Results
Figure 2.47 through
Figure 2.53 show our connection nonlinear analysis results. Figure 2.47a through
Figure 2.53a show the moment-rotation response, and Figure 2.47b through
Figure 2.53b show the shear-displacement response. In each figure, the blue line is the
actual behavior of the connection and the red dotted line is an approximation of the actual
(nonlinear) behavior to enable us to mathematically approximate the behavior under load with a
high degree of computational efficiency.
a.
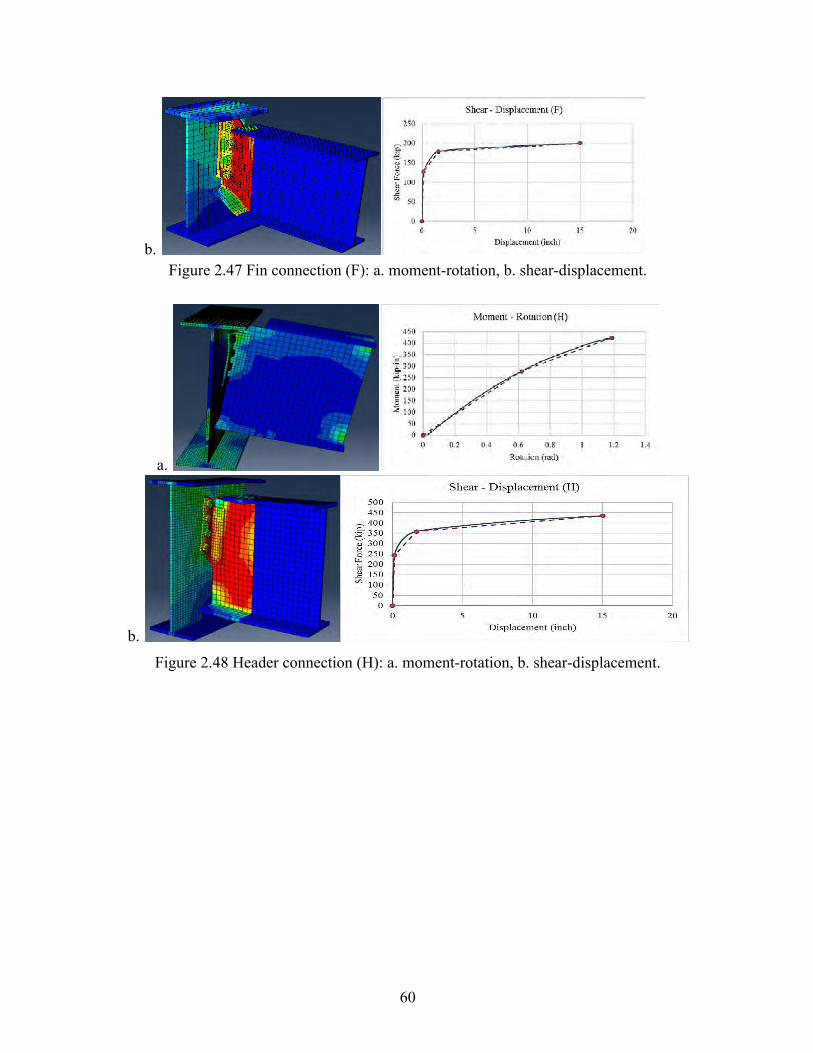
60
b. Figure 2.47 Fin connection (F): a. moment-rotation, b. shear-displacement.
a.
b.
Figure 2.48 Header connection (H): a. moment-rotation, b. shear-displacement.

61
a.
b.
Figure 2.49 Knife connection (K): a. moment-rotation, b. shear-displacement.
a.
b.
Figure 2.50 Seated top plate connection (STP): a. moment-rotation, b. shear-displacement.

62
a.
b.
Figure 2.51 Seated top clip connection (STC): a. moment-rotation, b. shear-displacement.
a.
b.
Figure 2.52 Seated web clip connection (SWC): a. moment-rotation, b. shear-displacement.
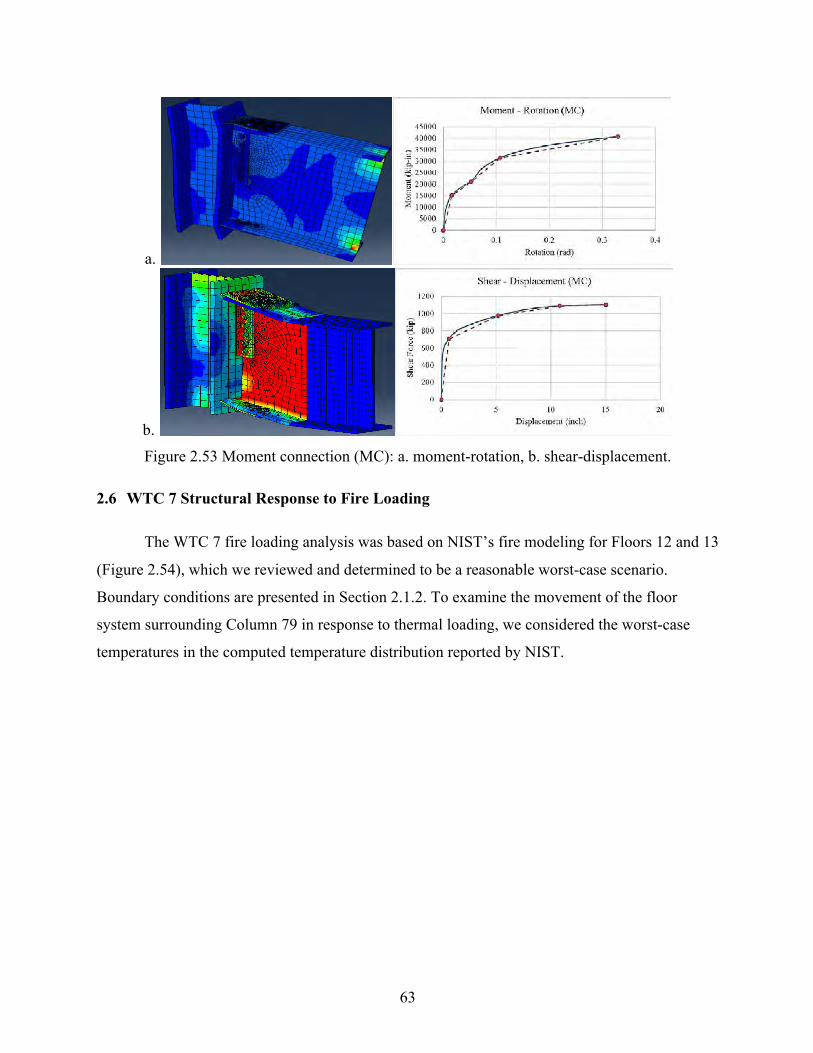
63
a.
b.
Figure 2.53 Moment connection (MC): a. moment-rotation, b. shear-displacement.
2.6 WTC 7 Structural Response to Fire Loading
The WTC 7 fire loading analysis was based on NIST’s fire modeling for Floors 12 and 13
(Figure 2.54), which we reviewed and determined to be a reasonable worst-case scenario.
Boundary conditions are presented in Section 2.1.2. To examine the movement of the floor
system surrounding Column 79 in response to thermal loading, we considered the worst-case
temperatures in the computed temperature distribution reported by NIST.
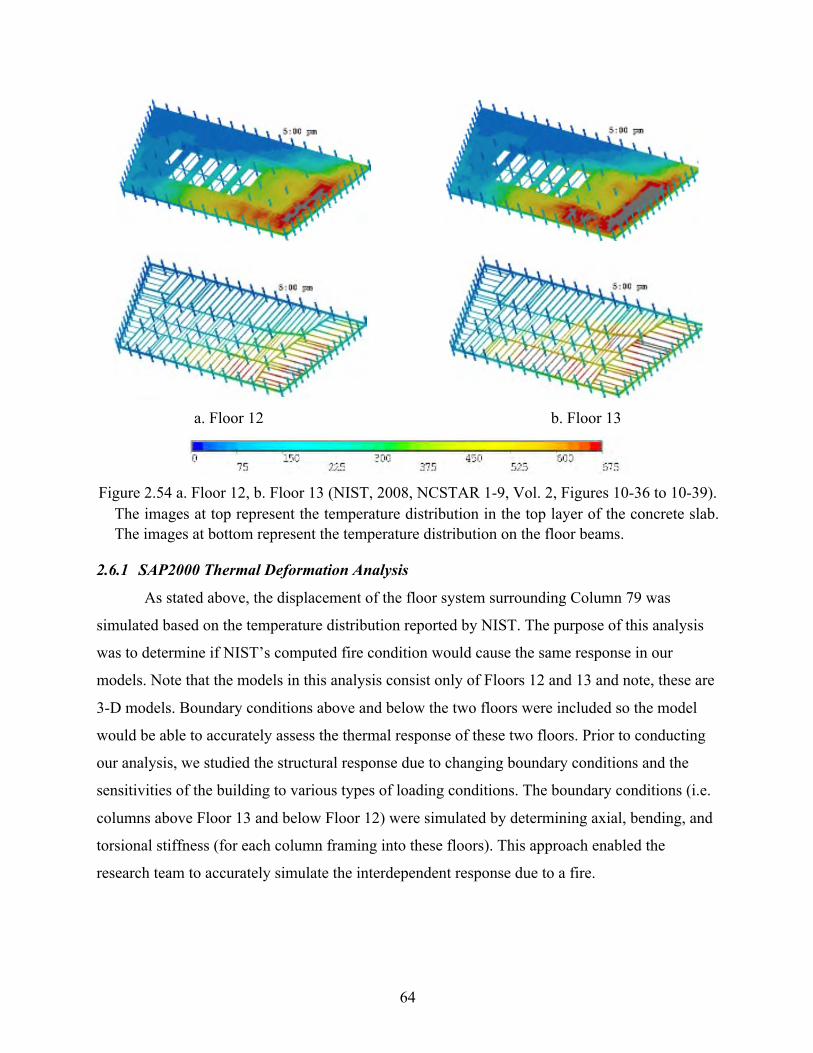
64
a. Floor 12 b. Floor 13
Figure 2.54 a. Floor 12, b. Floor 13 (NIST, 2008, NCSTAR 1-9, Vol. 2, Figures 10-36 to 10-39).
The images at top represent the temperature distribution in the top layer of the concrete slab. The images at bottom represent the temperature distribution on the floor beams.
2.6.1 SAP2000 Thermal Deformation Analysis
As stated above, the displacement of the floor system surrounding Column 79 was
simulated based on the temperature distribution reported by NIST. The purpose of this analysis
was to determine if NIST’s computed fire condition would cause the same response in our
models. Note that the models in this analysis consist only of Floors 12 and 13 and note, these are
3-D models. Boundary conditions above and below the two floors were included so the model
would be able to accurately assess the thermal response of these two floors. Prior to conducting
our analysis, we studied the structural response due to changing boundary conditions and the
sensitivities of the building to various types of loading conditions. The boundary conditions (i.e.
columns above Floor 13 and below Floor 12) were simulated by determining axial, bending, and
torsional stiffness (for each column framing into these floors). This approach enabled the
research team to accurately simulate the interdependent response due to a fire.
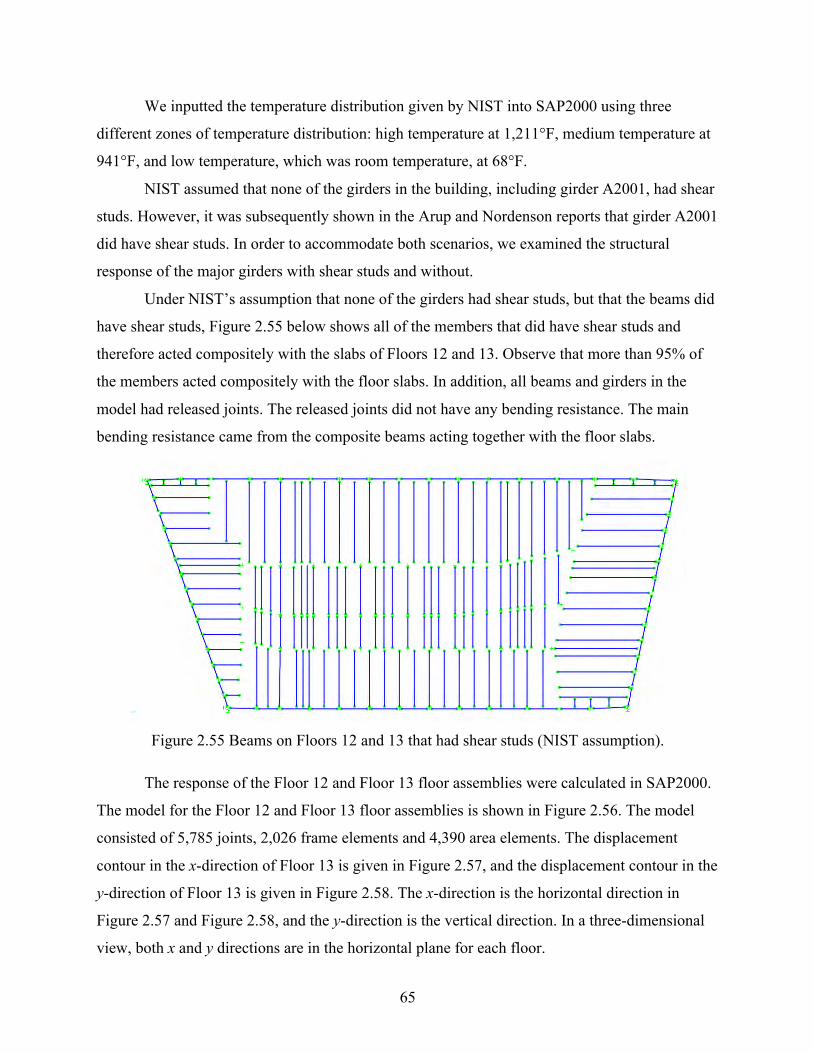
65
We inputted the temperature distribution given by NIST into SAP2000 using three
different zones of temperature distribution: high temperature at 1,211°F, medium temperature at
941°F, and low temperature, which was room temperature, at 68°F.
NIST assumed that none of the girders in the building, including girder A2001, had shear
studs. However, it was subsequently shown in the Arup and Nordenson reports that girder A2001
did have shear studs. In order to accommodate both scenarios, we examined the structural
response of the major girders with shear studs and without.
Under NIST’s assumption that none of the girders had shear studs, but that the beams did
have shear studs, Figure 2.55 below shows all of the members that did have shear studs and
therefore acted compositely with the slabs of Floors 12 and 13. Observe that more than 95% of
the members acted compositely with the floor slabs. In addition, all beams and girders in the
model had released joints. The released joints did not have any bending resistance. The main
bending resistance came from the composite beams acting together with the floor slabs.
Figure 2.55 Beams on Floors 12 and 13 that had shear studs (NIST assumption).
The response of the Floor 12 and Floor 13 floor assemblies were calculated in SAP2000.
The model for the Floor 12 and Floor 13 floor assemblies is shown in Figure 2.56. The model
consisted of 5,785 joints, 2,026 frame elements and 4,390 area elements. The displacement
contour in the x-direction of Floor 13 is given in Figure 2.57, and the displacement contour in the
y-direction of Floor 13 is given in Figure 2.58. The x-direction is the horizontal direction in
Figure 2.57 and Figure 2.58, and the y-direction is the vertical direction. In a three-dimensional
view, both x and y directions are in the horizontal plane for each floor.
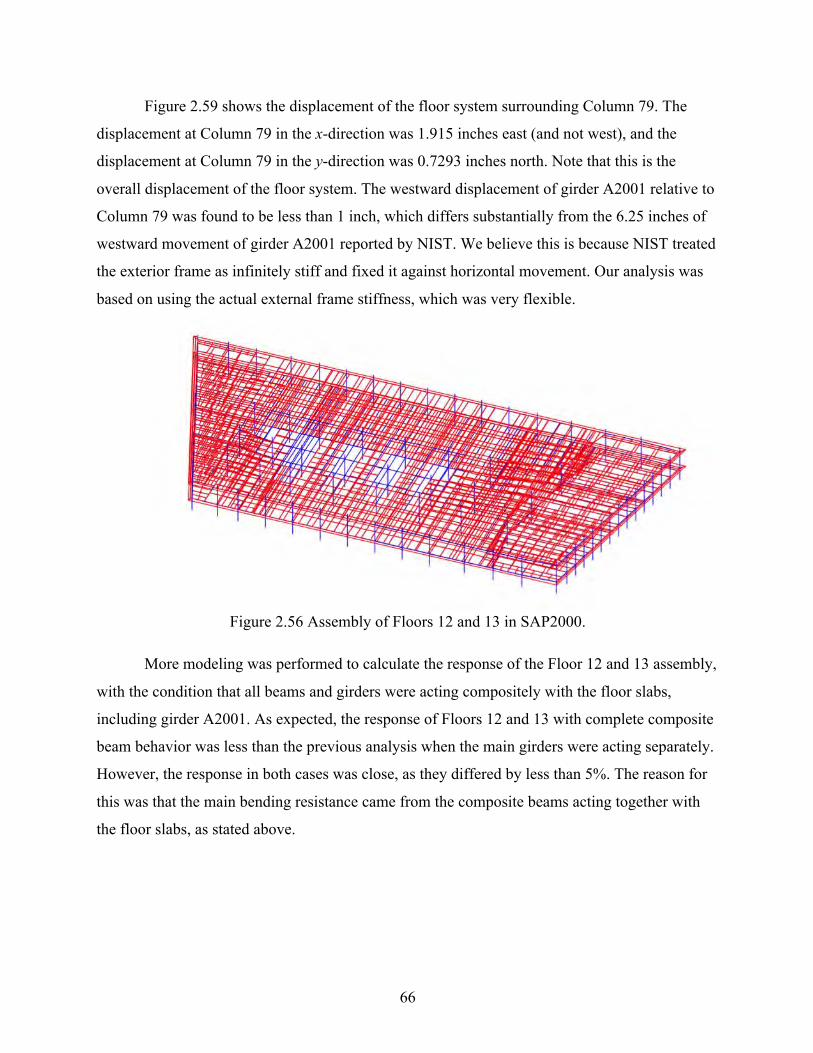
66
Figure 2.59 shows the displacement of the floor system surrounding Column 79. The
displacement at Column 79 in the x-direction was 1.915 inches east (and not west), and the
displacement at Column 79 in the y-direction was 0.7293 inches north. Note that this is the
overall displacement of the floor system. The westward displacement of girder A2001 relative to
Column 79 was found to be less than 1 inch, which differs substantially from the 6.25 inches of
westward movement of girder A2001 reported by NIST. We believe this is because NIST treated
the exterior frame as infinitely stiff and fixed it against horizontal movement. Our analysis was
based on using the actual external frame stiffness, which was very flexible.
Figure 2.56 Assembly of Floors 12 and 13 in SAP2000.
More modeling was performed to calculate the response of the Floor 12 and 13 assembly,
with the condition that all beams and girders were acting compositely with the floor slabs,
including girder A2001. As expected, the response of Floors 12 and 13 with complete composite
beam behavior was less than the previous analysis when the main girders were acting separately.
However, the response in both cases was close, as they differed by less than 5%. The reason for
this was that the main bending resistance came from the composite beams acting together with
the floor slabs, as stated above.
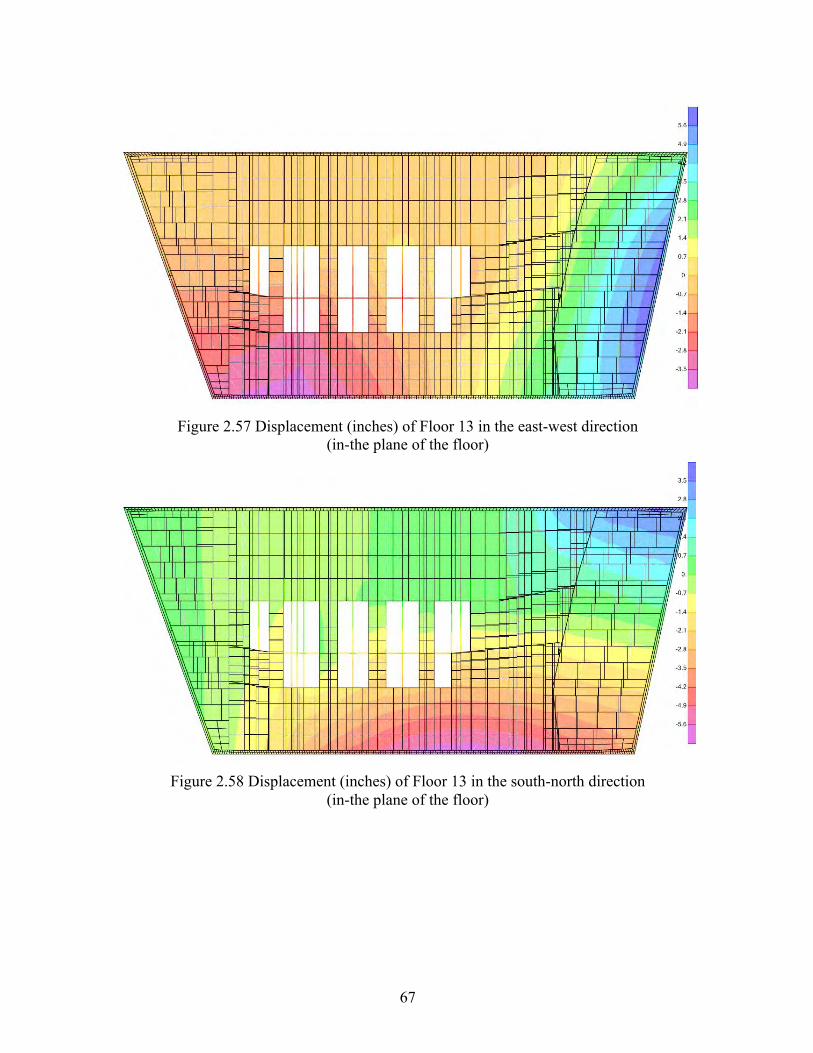
67
Figure 2.57 Displacement (inches) of Floor 13 in the east-west direction
(in-the plane of the floor)
Figure 2.58 Displacement (inches) of Floor 13 in the south-north direction
(in-the plane of the floor)
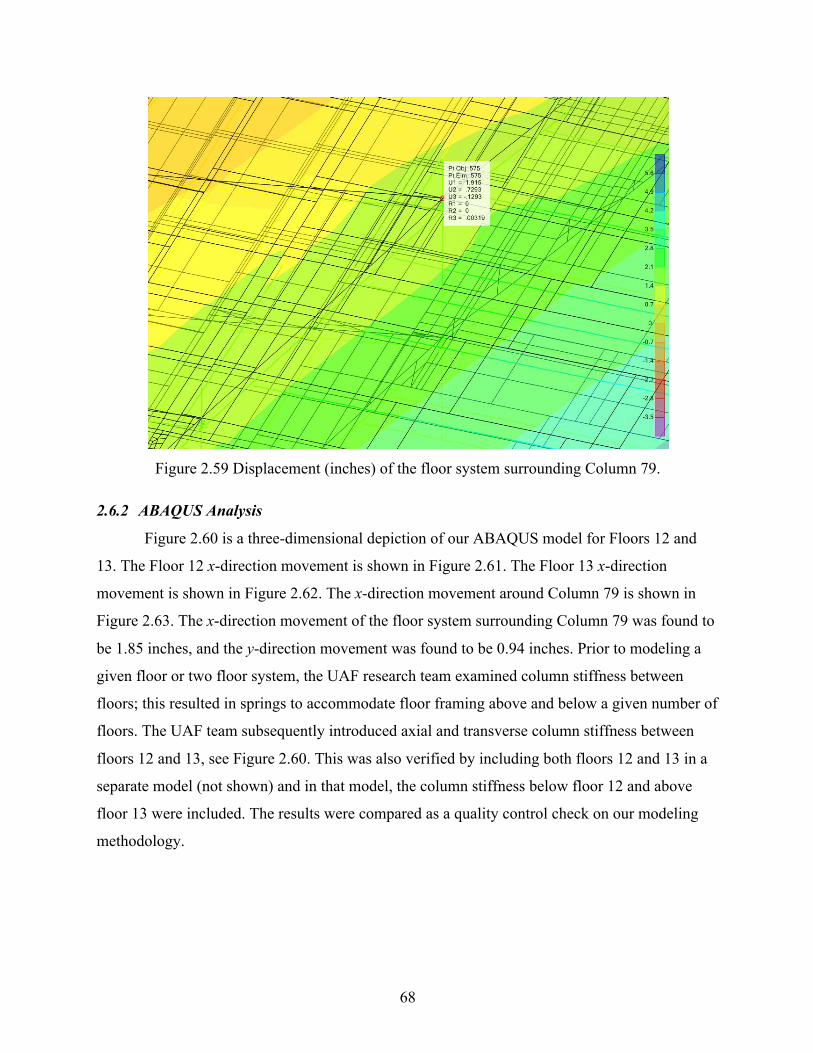
68
Figure 2.59 Displacement (inches) of the floor system surrounding Column 79.
2.6.2 ABAQUS Analysis
Figure 2.60 is a three-dimensional depiction of our ABAQUS model for Floors 12 and
13. The Floor 12 x-direction movement is shown in Figure 2.61. The Floor 13 x-direction
movement is shown in Figure 2.62. The x-direction movement around Column 79 is shown in
Figure 2.63. The x-direction movement of the floor system surrounding Column 79 was found to
be 1.85 inches, and the y-direction movement was found to be 0.94 inches. Prior to modeling a
given floor or two floor system, the UAF research team examined column stiffness between
floors; this resulted in springs to accommodate floor framing above and below a given number of
floors. The UAF team subsequently introduced axial and transverse column stiffness between
floors 12 and 13, see Figure 2.60. This was also verified by including both floors 12 and 13 in a
separate model (not shown) and in that model, the column stiffness below floor 12 and above
floor 13 were included. The results were compared as a quality control check on our modeling
methodology.
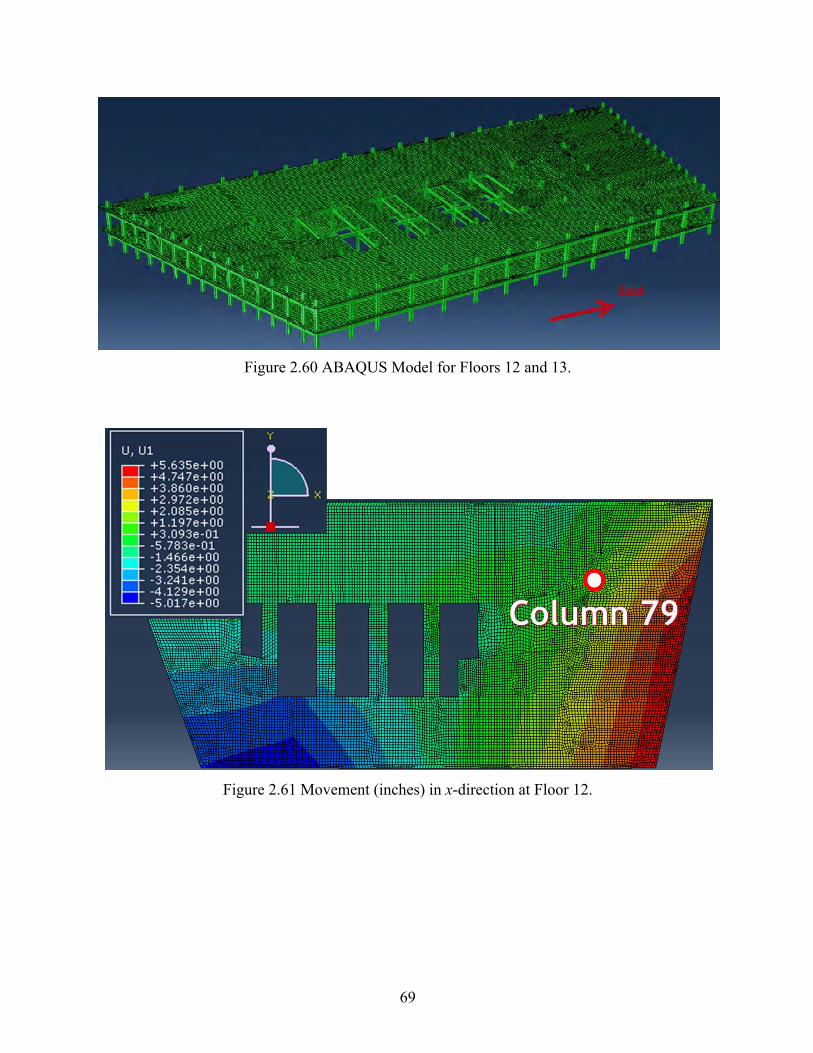
69
Figure 2.60 ABAQUS Model for Floors 12 and 13.
Figure 2.61 Movement (inches) in x-direction at Floor 12.
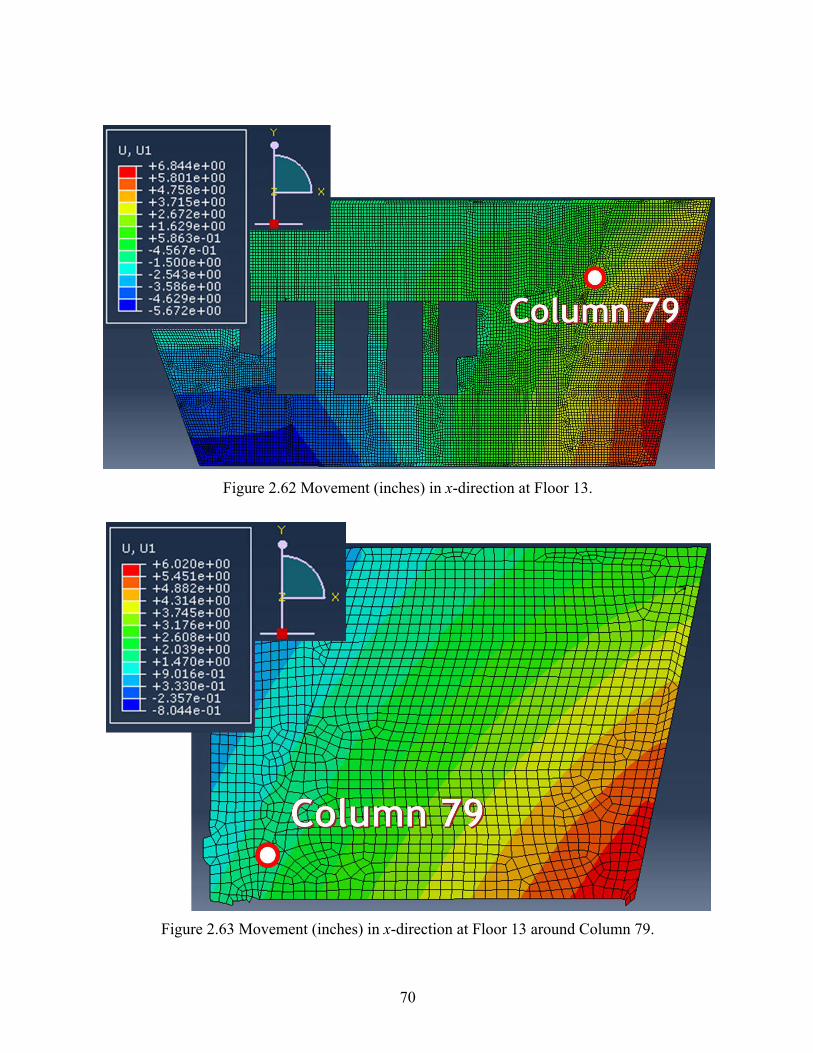
70
Figure 2.62 Movement (inches) in x-direction at Floor 13.
Figure 2.63 Movement (inches) in x-direction at Floor 13 around Column 79.

71
According to NIST, the initiating failure occurred at the connection between Column 79
and girder A2001 at Floor 13 due to a relative displacement of girder A2001 of 6.25 inches. Our
ABAQUS analysis corroborated the findings of our SAP2000 analysis, showing that girder
A2001 would undergo less than one inch of westward displacement relative to Column 79 under
the worst-case fire condition. Examining all possible conditions, our analysis found that the
westward movement of girder A2001 relative to the base plate on Column 79 was 3.68” for non-
composite, 2.18” for partially composite and less than 1” for composite behavior (the condition
at time of the fire).
2.6.2.1 ABAQUS Analysis with NIST Boundary Conditions and No Spatial Restrictions Subsequently, we studied the relative movement between Column 79 and girder A2001
in the worst-case condition to identify the maximum relative displacement at this connection in a
higher temperature environment and without restriction from other frames, columns, and the
deck. The part of the Floor 13 frame we examined is shown in red in Figure 2.64.
Figure 2.64 The part of the Floor 13 frame we examined is shown in red.
The boundary conditions reported by NIST and the assigned temperature distribution are
shown in Figure 2.65 below. The concrete deck was not included in this model to ensure free
expansion of the steel frame. The assigned temperature is also higher than the expected fire
condition.
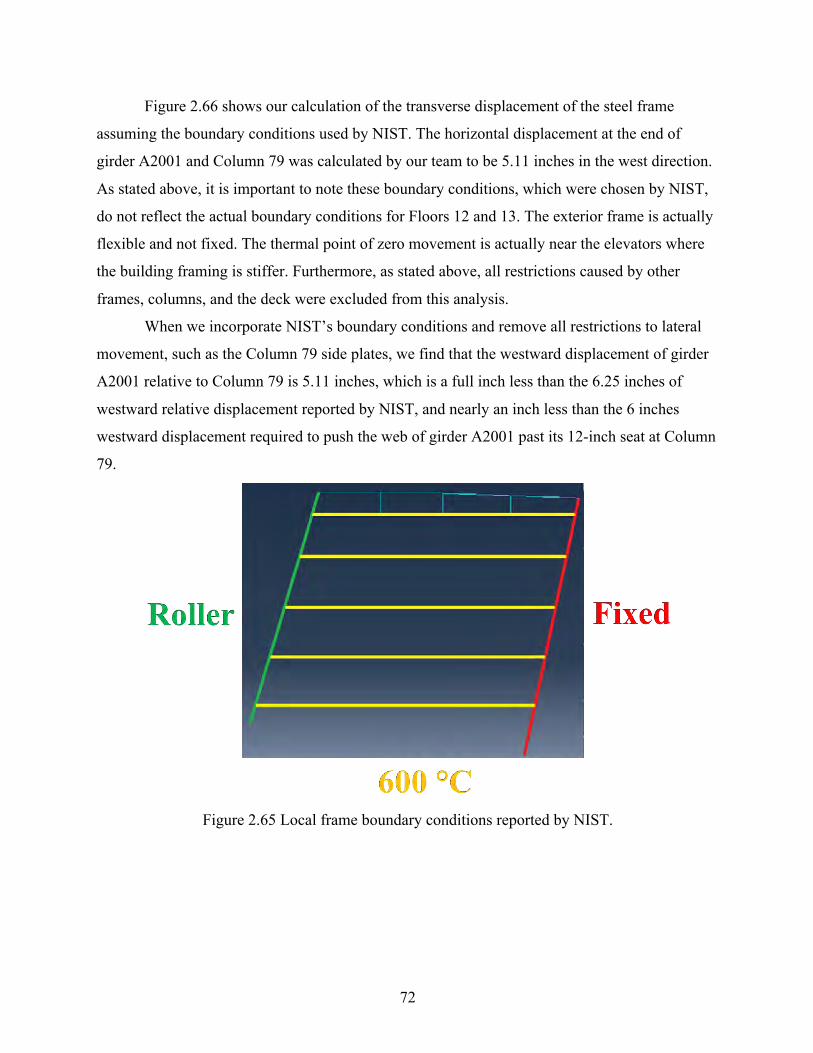
72
Figure 2.66 shows our calculation of the transverse displacement of the steel frame
assuming the boundary conditions used by NIST. The horizontal displacement at the end of
girder A2001 and Column 79 was calculated by our team to be 5.11 inches in the west direction.
As stated above, it is important to note these boundary conditions, which were chosen by NIST,
do not reflect the actual boundary conditions for Floors 12 and 13. The exterior frame is actually
flexible and not fixed. The thermal point of zero movement is actually near the elevators where
the building framing is stiffer. Furthermore, as stated above, all restrictions caused by other
frames, columns, and the deck were excluded from this analysis.
When we incorporate NIST’s boundary conditions and remove all restrictions to lateral
movement, such as the Column 79 side plates, we find that the westward displacement of girder
A2001 relative to Column 79 is 5.11 inches, which is a full inch less than the 6.25 inches of
westward relative displacement reported by NIST, and nearly an inch less than the 6 inches
westward displacement required to push the web of girder A2001 past its 12-inch seat at Column
79.
Figure 2.65 Local frame boundary conditions reported by NIST.

73
Figure 2.66 Transverse displacement at the end of A2001 using the NIST assumptions.
2.7 Summary and Conclusion
During our study, we examined local structural response of WTC 7 to fire loading at
Floor 13. Table 2.3 shows a comparison of the steps we took in our modeling in order to
accurately simulate the building’s behavior. The table attempts to illustrate the comprehensive
methodology used versus that used in the NIST investigation. For example, the building had
several different connections (seven different connections) between beams and girders, and
girders and columns. These were carefully examined to ensure we modeled the connections to
simulate how the building was built; NIST however only modeled some of the connections (see
Table 2.3). We modeled the exterior framing by finding the stiffness of the connecting springs;
NIST assumed under thermal loading that the exterior framing was rigid.
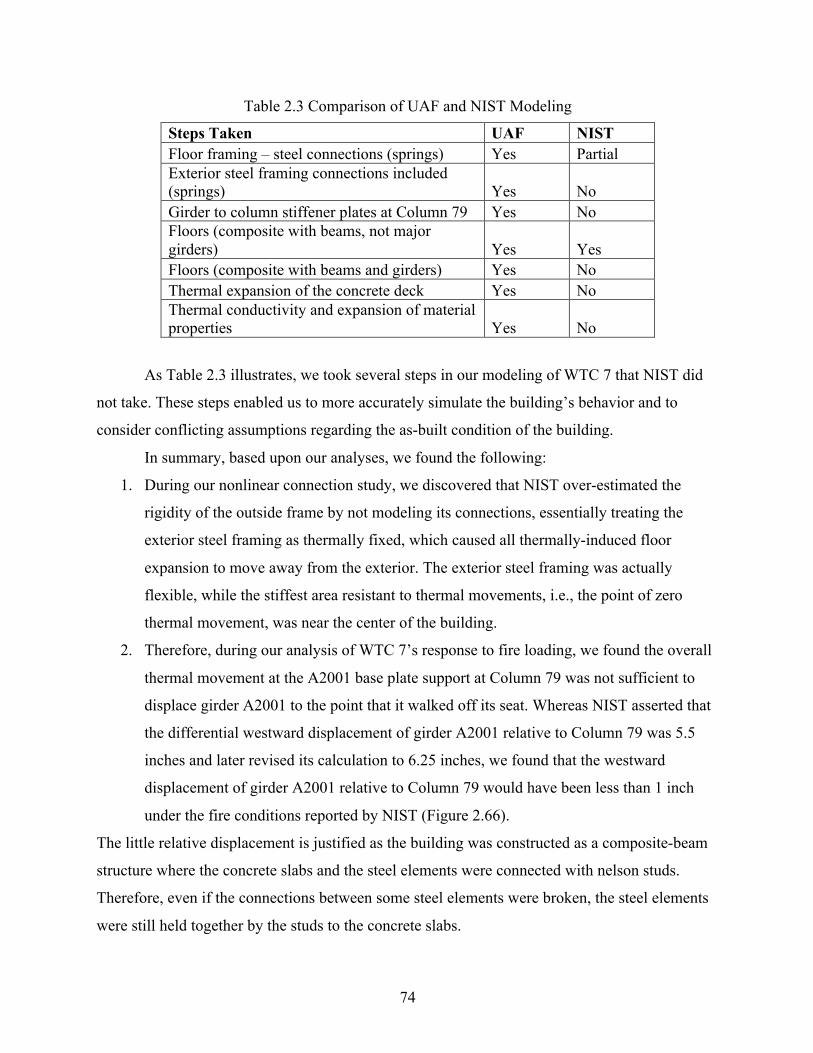
74
Table 2.3 Comparison of UAF and NIST Modeling
Steps Taken UAF NIST Floor framing – steel connections (springs) Yes Partial Exterior steel framing connections included (springs) Yes No Girder to column stiffener plates at Column 79 Yes No Floors (composite with beams, not major girders) Yes Yes Floors (composite with beams and girders) Yes No Thermal expansion of the concrete deck Yes No Thermal conductivity and expansion of material properties Yes No
As Table 2.3 illustrates, we took several steps in our modeling of WTC 7 that NIST did
not take. These steps enabled us to more accurately simulate the building’s behavior and to
consider conflicting assumptions regarding the as-built condition of the building.
In summary, based upon our analyses, we found the following:
1. During our nonlinear connection study, we discovered that NIST over-estimated the
rigidity of the outside frame by not modeling its connections, essentially treating the
exterior steel framing as thermally fixed, which caused all thermally-induced floor
expansion to move away from the exterior. The exterior steel framing was actually
flexible, while the stiffest area resistant to thermal movements, i.e., the point of zero
thermal movement, was near the center of the building.
2. Therefore, during our analysis of WTC 7’s response to fire loading, we found the overall
thermal movement at the A2001 base plate support at Column 79 was not sufficient to
displace girder A2001 to the point that it walked off its seat. Whereas NIST asserted that
the differential westward displacement of girder A2001 relative to Column 79 was 5.5
inches and later revised its calculation to 6.25 inches, we found that the westward
displacement of girder A2001 relative to Column 79 would have been less than 1 inch
under the fire conditions reported by NIST (Figure 2.66).
The little relative displacement is justified as the building was constructed as a composite-beam
structure where the concrete slabs and the steel elements were connected with nelson studs.
Therefore, even if the connections between some steel elements were broken, the steel elements
were still held together by the studs to the concrete slabs.
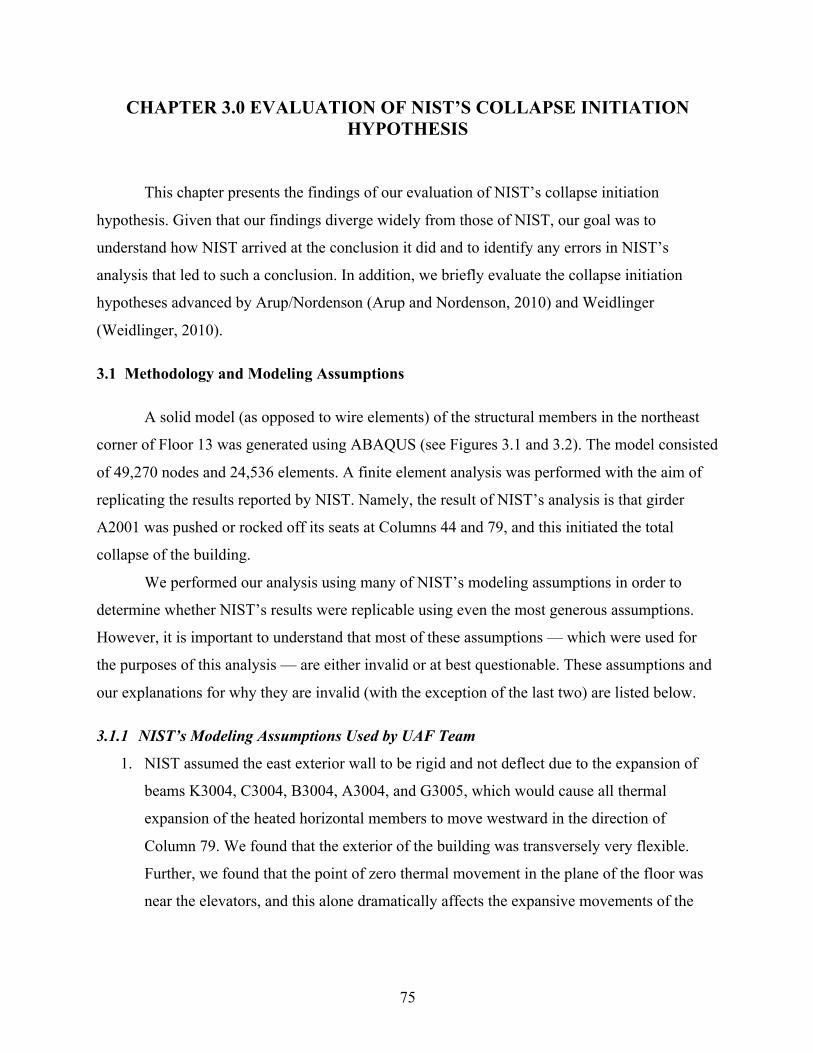
75
CHAPTER 3.0 EVALUATION OF NIST’S COLLAPSE INITIATION HYPOTHESIS
This chapter presents the findings of our evaluation of NIST’s collapse initiation
hypothesis. Given that our findings diverge widely from those of NIST, our goal was to
understand how NIST arrived at the conclusion it did and to identify any errors in NIST’s
analysis that led to such a conclusion. In addition, we briefly evaluate the collapse initiation
hypotheses advanced by Arup/Nordenson (Arup and Nordenson, 2010) and Weidlinger
(Weidlinger, 2010).
3.1 Methodology and Modeling Assumptions
A solid model (as opposed to wire elements) of the structural members in the northeast
corner of Floor 13 was generated using ABAQUS (see Figures 3.1 and 3.2). The model consisted
of 49,270 nodes and 24,536 elements. A finite element analysis was performed with the aim of
replicating the results reported by NIST. Namely, the result of NIST’s analysis is that girder
A2001 was pushed or rocked off its seats at Columns 44 and 79, and this initiated the total
collapse of the building.
We performed our analysis using many of NIST’s modeling assumptions in order to
determine whether NIST’s results were replicable using even the most generous assumptions.
However, it is important to understand that most of these assumptions — which were used for
the purposes of this analysis — are either invalid or at best questionable. These assumptions and
our explanations for why they are invalid (with the exception of the last two) are listed below.
3.1.1 NIST’s Modeling Assumptions Used by UAF Team
1. NIST assumed the east exterior wall to be rigid and not deflect due to the expansion of
beams K3004, C3004, B3004, A3004, and G3005, which would cause all thermal
expansion of the heated horizontal members to move westward in the direction of
Column 79. We found that the exterior of the building was transversely very flexible.
Further, we found that the point of zero thermal movement in the plane of the floor was
near the elevators, and this alone dramatically affects the expansive movements of the
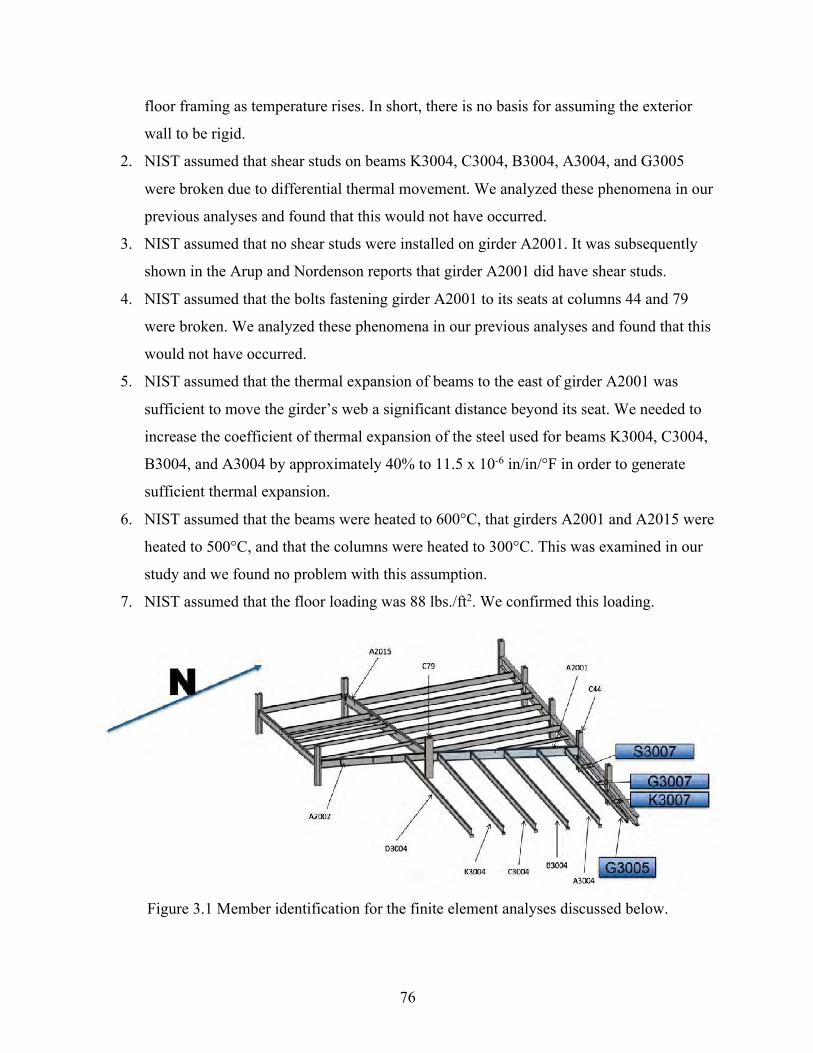
76
floor framing as temperature rises. In short, there is no basis for assuming the exterior
wall to be rigid.
2. NIST assumed that shear studs on beams K3004, C3004, B3004, A3004, and G3005
were broken due to differential thermal movement. We analyzed these phenomena in our
previous analyses and found that this would not have occurred.
3. NIST assumed that no shear studs were installed on girder A2001. It was subsequently
shown in the Arup and Nordenson reports that girder A2001 did have shear studs.
4. NIST assumed that the bolts fastening girder A2001 to its seats at columns 44 and 79
were broken. We analyzed these phenomena in our previous analyses and found that this
would not have occurred.
5. NIST assumed that the thermal expansion of beams to the east of girder A2001 was
sufficient to move the girder’s web a significant distance beyond its seat. We needed to
increase the coefficient of thermal expansion of the steel used for beams K3004, C3004,
B3004, and A3004 by approximately 40% to 11.5 x 10⁻⁶ in/in/°F in order to generate
sufficient thermal expansion.
6. NIST assumed that the beams were heated to 600°C, that girders A2001 and A2015 were
heated to 500°C, and that the columns were heated to 300°C. This was examined in our
study and we found no problem with this assumption.
7. NIST assumed that the floor loading was 88 lbs./ft2. We confirmed this loading.
Figure 3.1 Member identification for the finite element analyses discussed below.
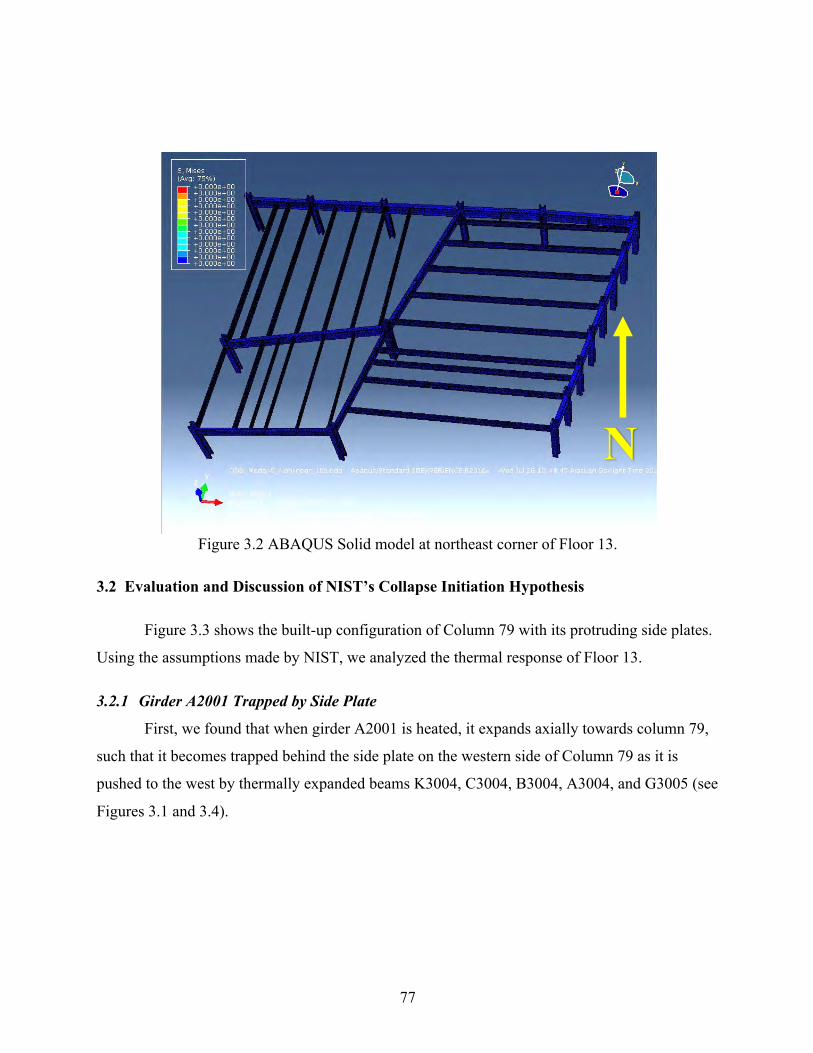
77
Figure 3.2 ABAQUS Solid model at northeast corner of Floor 13.
3.2 Evaluation and Discussion of NIST’s Collapse Initiation Hypothesis
Figure 3.3 shows the built-up configuration of Column 79 with its protruding side plates.
Using the assumptions made by NIST, we analyzed the thermal response of Floor 13.
3.2.1 Girder A2001 Trapped by Side Plate
First, we found that when girder A2001 is heated, it expands axially towards column 79,
such that it becomes trapped behind the side plate on the western side of Column 79 as it is
pushed to the west by thermally expanded beams K3004, C3004, B3004, A3004, and G3005 (see
Figures 3.1 and 3.4).
N
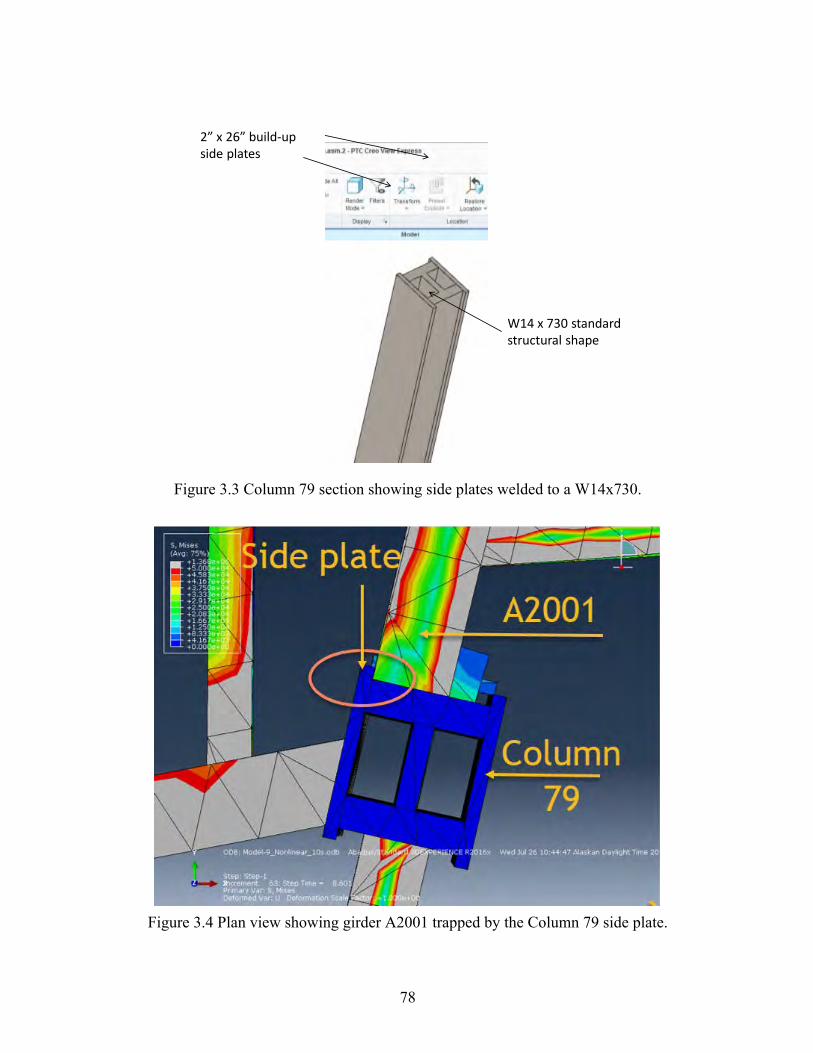
78
Figure 3.3 Column 79 section showing side plates welded to a W14x730.
Figure 3.4 Plan view showing girder A2001 trapped by the Column 79 side plate.
2” x 26” build-upside plates
W14 x 730 standardstructural shape
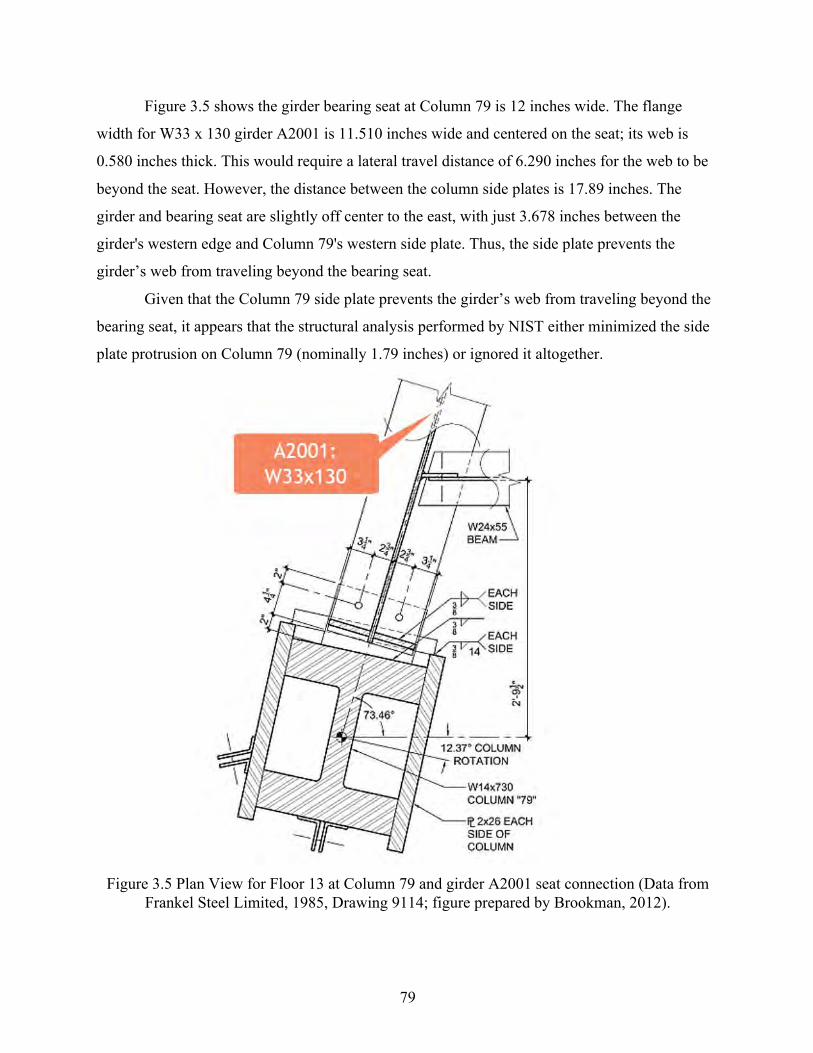
79
Figure 3.5 shows the girder bearing seat at Column 79 is 12 inches wide. The flange
width for W33 x 130 girder A2001 is 11.510 inches wide and centered on the seat; its web is
0.580 inches thick. This would require a lateral travel distance of 6.290 inches for the web to be
beyond the seat. However, the distance between the column side plates is 17.89 inches. The
girder and bearing seat are slightly off center to the east, with just 3.678 inches between the
girder's western edge and Column 79's western side plate. Thus, the side plate prevents the
girder’s web from traveling beyond the bearing seat.
Given that the Column 79 side plate prevents the girder’s web from traveling beyond the
bearing seat, it appears that the structural analysis performed by NIST either minimized the side
plate protrusion on Column 79 (nominally 1.79 inches) or ignored it altogether.
Figure 3.5 Plan View for Floor 13 at Column 79 and girder A2001 seat connection (Data from
Frankel Steel Limited, 1985, Drawing 9114; figure prepared by Brookman, 2012).
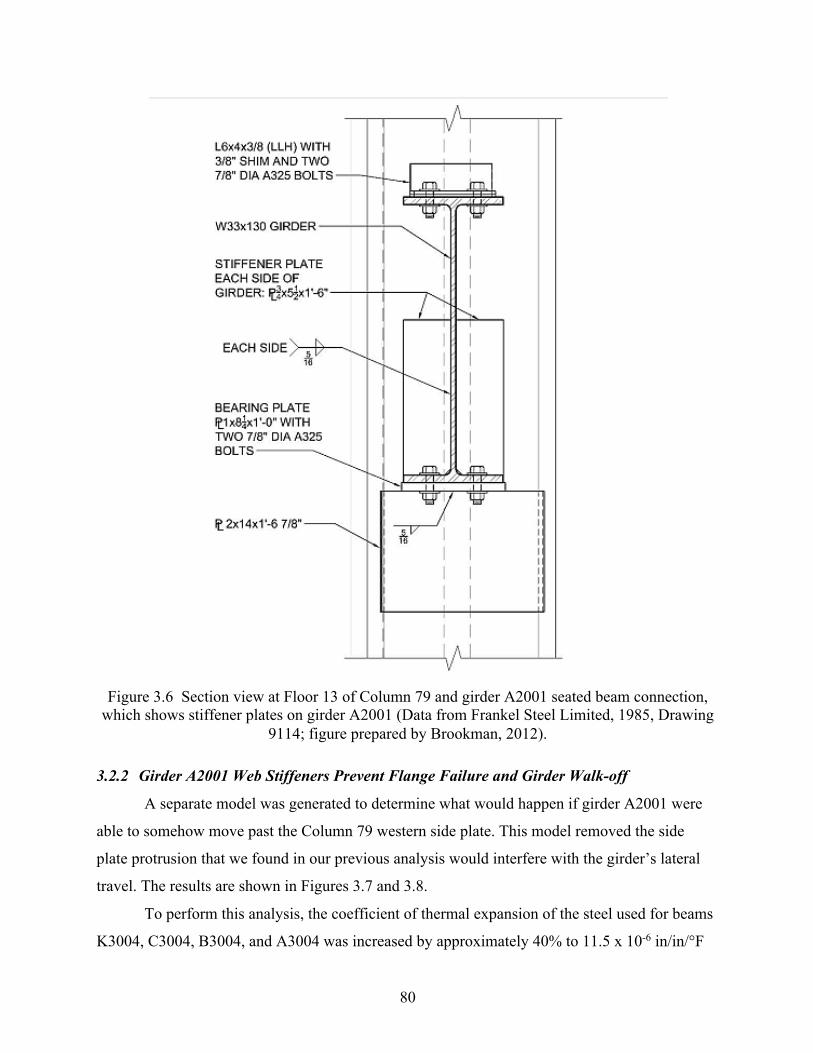
80
Figure 3.6 Section view at Floor 13 of Column 79 and girder A2001 seated beam connection,
which shows stiffener plates on girder A2001 (Data from Frankel Steel Limited, 1985, Drawing 9114; figure prepared by Brookman, 2012).
3.2.2 Girder A2001 Web Stiffeners Prevent Flange Failure and Girder Walk-off
A separate model was generated to determine what would happen if girder A2001 were
able to somehow move past the Column 79 western side plate. This model removed the side
plate protrusion that we found in our previous analysis would interfere with the girder’s lateral
travel. The results are shown in Figures 3.7 and 3.8.
To perform this analysis, the coefficient of thermal expansion of the steel used for beams
K3004, C3004, B3004, and A3004 was increased by approximately 40% to 11.5 x 10⁻⁶ in/in/°F
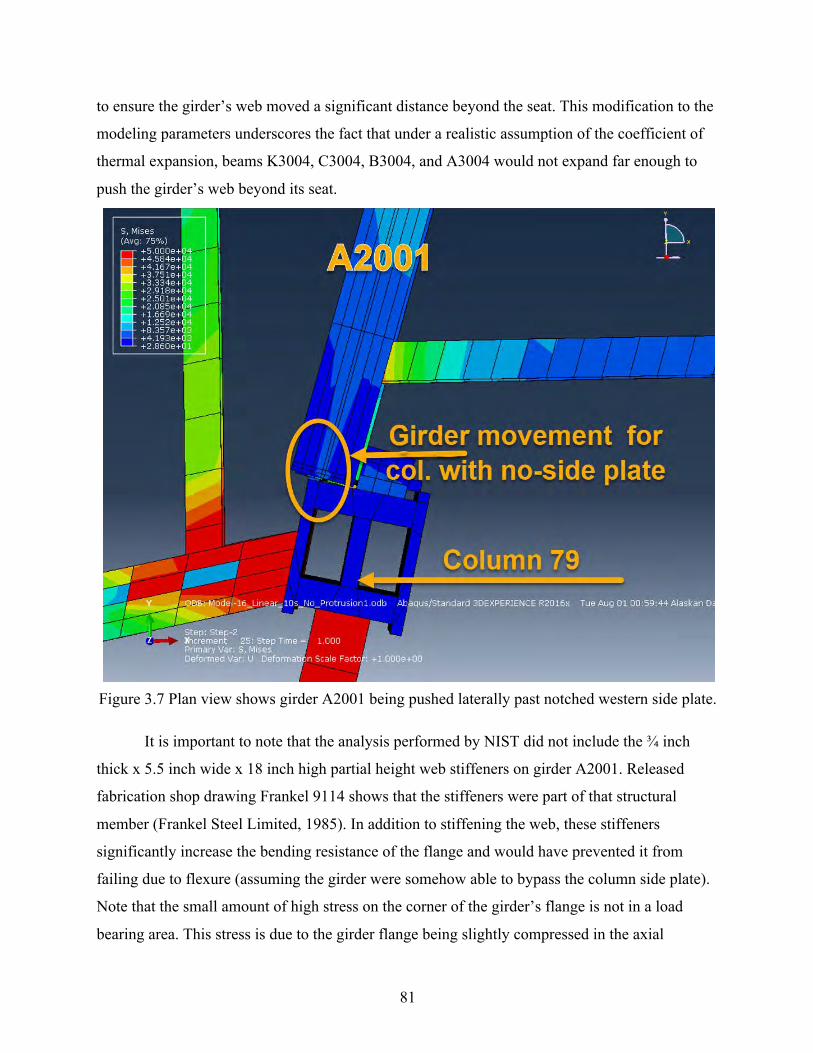
81
to ensure the girder’s web moved a significant distance beyond the seat. This modification to the
modeling parameters underscores the fact that under a realistic assumption of the coefficient of
thermal expansion, beams K3004, C3004, B3004, and A3004 would not expand far enough to
push the girder’s web beyond its seat.
Figure 3.7 Plan view shows girder A2001 being pushed laterally past notched western side plate.
It is important to note that the analysis performed by NIST did not include the ¾ inch
thick x 5.5 inch wide x 18 inch high partial height web stiffeners on girder A2001. Released
fabrication shop drawing Frankel 9114 shows that the stiffeners were part of that structural
member (Frankel Steel Limited, 1985). In addition to stiffening the web, these stiffeners
significantly increase the bending resistance of the flange and would have prevented it from
failing due to flexure (assuming the girder were somehow able to bypass the column side plate).
Note that the small amount of high stress on the corner of the girder’s flange is not in a load
bearing area. This stress is due to the girder flange being slightly compressed in the axial
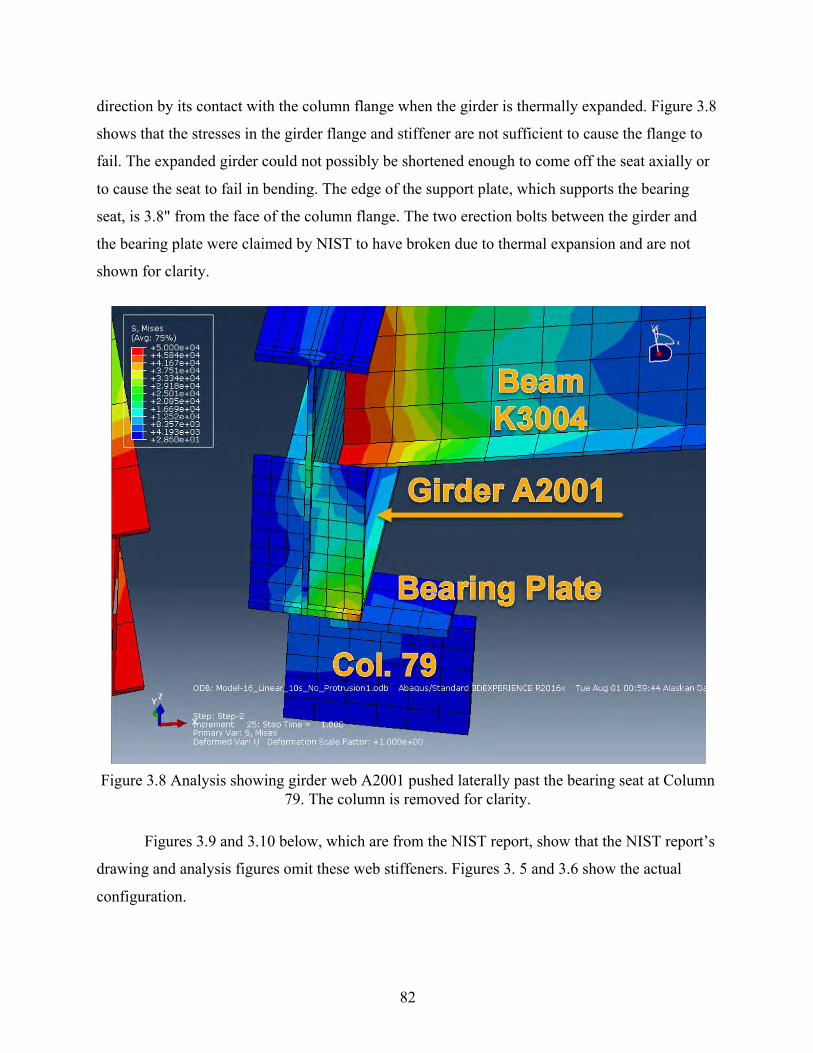
82
direction by its contact with the column flange when the girder is thermally expanded. Figure 3.8
shows that the stresses in the girder flange and stiffener are not sufficient to cause the flange to
fail. The expanded girder could not possibly be shortened enough to come off the seat axially or
to cause the seat to fail in bending. The edge of the support plate, which supports the bearing
seat, is 3.8" from the face of the column flange. The two erection bolts between the girder and
the bearing plate were claimed by NIST to have broken due to thermal expansion and are not
shown for clarity.
Figure 3.8 Analysis showing girder web A2001 pushed laterally past the bearing seat at Column
79. The column is removed for clarity.
Figures 3.9 and 3.10 below, which are from the NIST report, show that the NIST report’s
drawing and analysis figures omit these web stiffeners. Figures 3. 5 and 3.6 show the actual
configuration.
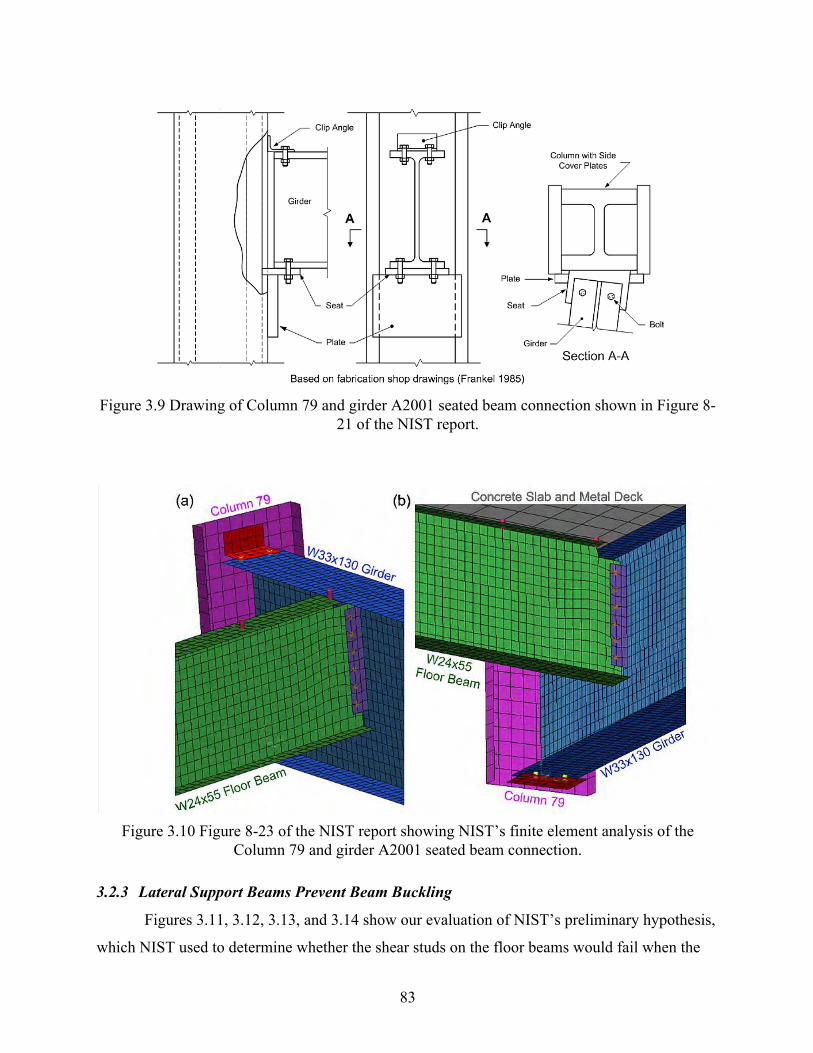
83
Figure 3.9 Drawing of Column 79 and girder A2001 seated beam connection shown in Figure 8-
21 of the NIST report.
Figure 3.10 Figure 8-23 of the NIST report showing NIST’s finite element analysis of the
Column 79 and girder A2001 seated beam connection.
3.2.3 Lateral Support Beams Prevent Beam Buckling
Figures 3.11, 3.12, 3.13, and 3.14 show our evaluation of NIST’s preliminary hypothesis,
which NIST used to determine whether the shear studs on the floor beams would fail when the
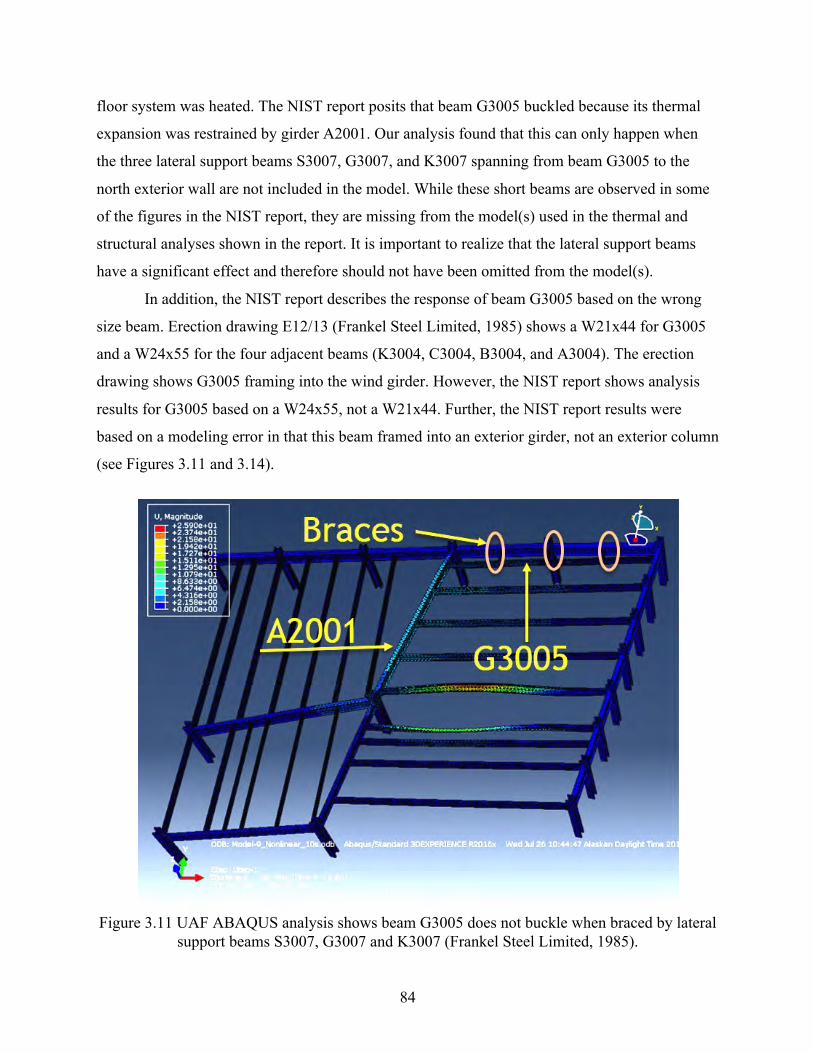
84
floor system was heated. The NIST report posits that beam G3005 buckled because its thermal
expansion was restrained by girder A2001. Our analysis found that this can only happen when
the three lateral support beams S3007, G3007, and K3007 spanning from beam G3005 to the
north exterior wall are not included in the model. While these short beams are observed in some
of the figures in the NIST report, they are missing from the model(s) used in the thermal and
structural analyses shown in the report. It is important to realize that the lateral support beams
have a significant effect and therefore should not have been omitted from the model(s).
In addition, the NIST report describes the response of beam G3005 based on the wrong
size beam. Erection drawing E12/13 (Frankel Steel Limited, 1985) shows a W21x44 for G3005
and a W24x55 for the four adjacent beams (K3004, C3004, B3004, and A3004). The erection
drawing shows G3005 framing into the wind girder. However, the NIST report shows analysis
results for G3005 based on a W24x55, not a W21x44. Further, the NIST report results were
based on a modeling error in that this beam framed into an exterior girder, not an exterior column
(see Figures 3.11 and 3.14).
Figure 3.11 UAF ABAQUS analysis shows beam G3005 does not buckle when braced by lateral
support beams S3007, G3007 and K3007 (Frankel Steel Limited, 1985).
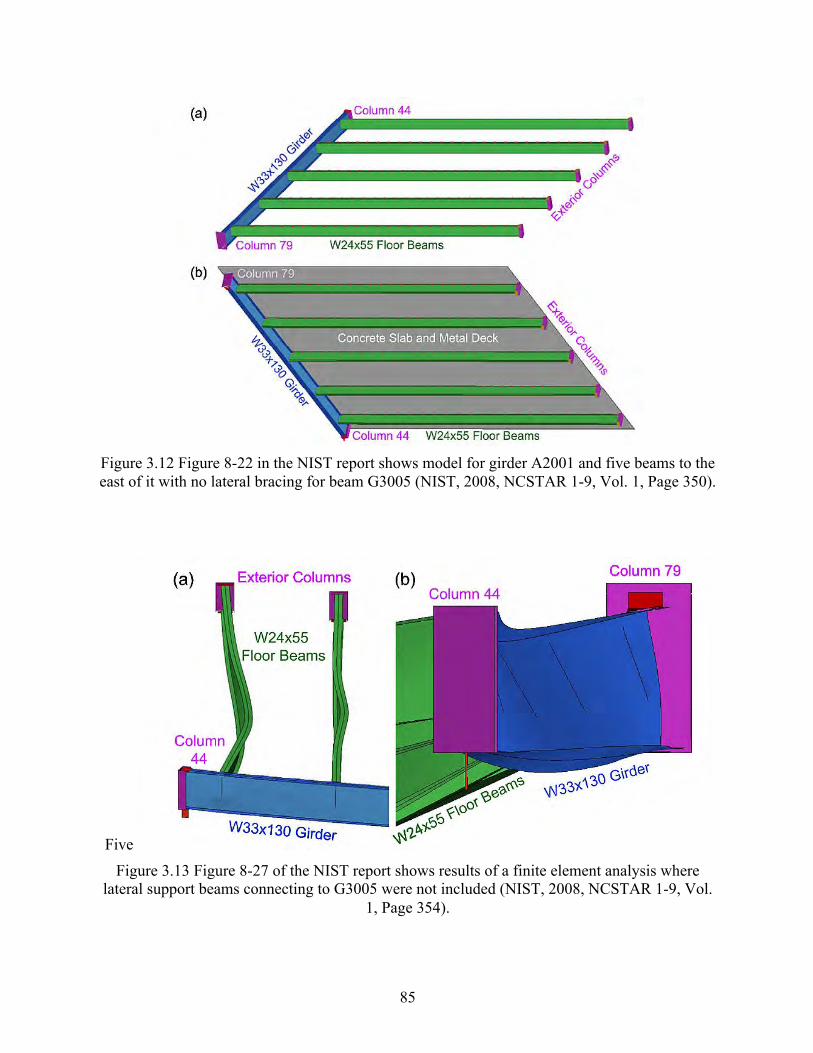
85
Figure 3.12 Figure 8-22 in the NIST report shows model for girder A2001 and five beams to the east of it with no lateral bracing for beam G3005 (NIST, 2008, NCSTAR 1-9, Vol. 1, Page 350).
Five Figure 3.13 Figure 8-27 of the NIST report shows results of a finite element analysis where
lateral support beams connecting to G3005 were not included (NIST, 2008, NCSTAR 1-9, Vol. 1, Page 354).
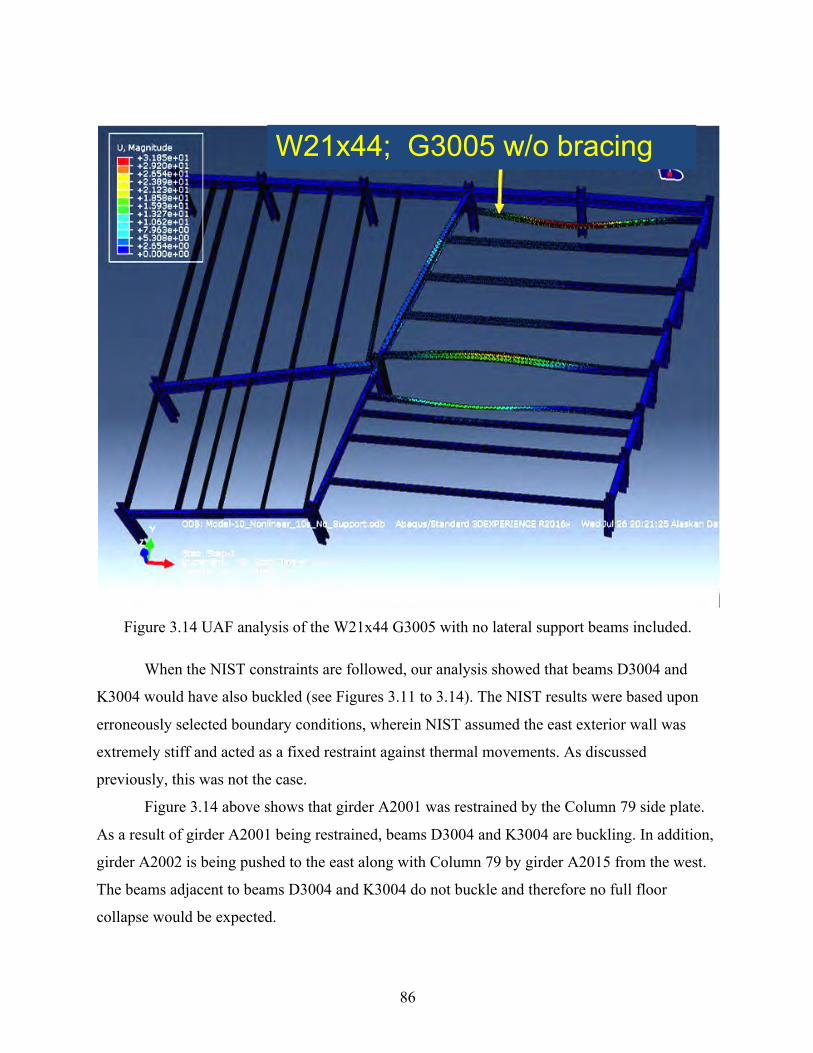
86
Figure 3.14 UAF analysis of the W21x44 G3005 with no lateral support beams included.
When the NIST constraints are followed, our analysis showed that beams D3004 and
K3004 would have also buckled (see Figures 3.11 to 3.14). The NIST results were based upon
erroneously selected boundary conditions, wherein NIST assumed the east exterior wall was
extremely stiff and acted as a fixed restraint against thermal movements. As discussed
previously, this was not the case.
Figure 3.14 above shows that girder A2001 was restrained by the Column 79 side plate.
As a result of girder A2001 being restrained, beams D3004 and K3004 are buckling. In addition,
girder A2002 is being pushed to the east along with Column 79 by girder A2015 from the west.
The beams adjacent to beams D3004 and K3004 do not buckle and therefore no full floor
collapse would be expected.
W21x44; G3005 w/o bracing

87
It should also be noted that the lateral travel of Column 79 to the east due to the thermal
expansion of girder A2015 would be reduced if the concrete floor slabs had been included in the
model.
3.3 Evaluation of the Arup and Nordenson Collapse Initiation Hypothesis
Experts working in connection with engineering firms Ove Arup & Partners (Arup) and
Guy Nordenson and Associates (Nordenson) were retained by the plaintiffs in “Aegis Insurance
Services, Inc. v. 7 World Trade Center Company, L.P.” to perform structural analysis in support
of the claim that the collapse of WTC 7 resulted from deficient design, thus making the
defendants liable for the destruction of the electrical substation over which WTC 7 was built.
The Arup and Nordenson reports were filed with the court in April 2010. The Arup report
concluded that the girder (A2001) that NIST reported was pushed off its seat by thermally
expanding beams to the east of the girder was actually pulled off its seat by the sagging of beams
to the east of the girder. This girder walk-off, according to the Nordenson report, then caused the
same cascade of floor failures and buckling of Column 79 reported by NIST. However, contrary
to NIST’s findings, Nordenson found that the alleged failure of other girder connections framing
into Column 79 on lower floors, which was necessary along with the aforementioned cascade of
floor failures in order for Column 79 to buckle, could not have been caused by thermal
expansion. The Nordenson report instead put forth the idea that these girder connections failed
due to stress raisers (cracking) caused by repeated heating and cooling cycles. However, this
structure did not experience heating and cooling cycles anywhere near sufficient to allow stress
raisers to cause fatigue failure.
3.3.1 Discussion of Arup and Nordenson’s Analysis
The Arup analysis was performed in a serial way with a fire simulation, heat transfer
analysis, finite element analysis of the northeast corner of Floor 13, and a global collapse
analysis (which was performed primarily using traditional hand calculations).
The Arup finite element analysis corroborates our finding that girder A2001 would
become trapped behind the western side plate of Column 79 after less than 4 inches of lateral
travel when pushed to the west, and that its web could not have been pushed beyond its bearing
seat in that direction. However, the Arup analysis then goes on to contend that the five beams to
88
the east of girder A2001 (K3004, C3004, B3004, A3004, and G3005) were heated enough to sag
and pull the girder to the east and off of its seats, creating the same situation as claimed by NIST
where the girder and the flooring it supported fell onto Floor 12 below. The global collapse
analysis (the Nordenson section of the report) then attempts to show how the load from the
impact between the falling Floor 13 girder and Floor 12 girder below was sufficient to cause the
lower floor to fail, which then precipitated a multi-story cascade similar to that claimed in the
NIST report.
In Appendix B of his section of the report (Floor Collapse Analysis), Nordenson correctly
shows that it would take a 632,000 lb. load to shear the welds of the 2” thick x 14” high x 18”
wide support plate under the bearing seat of girder A2001 at Column 79. Nordenson also
correctly determines the stiffness of girder A2001 on the 12th floor at a point 10 inches from its
support at Column 79 to be K = 7,627 kips/inch using the equation K = (3*E* I* L)/ (1 kip * a2
b2) with “a” and “b” being the distances to the impact point from opposite sides of the girder,
which was considered to be 547 inches long.
However, there was an error in Nordenson’s calculation of the impact force of 4,133 kips,
which resulted from considering the above girder as a point load, thus implying it had an infinite
stiffness and no deflection. The magnitude of the force experienced in an impact is directly
proportional to the stiffness and deflection of the impacting items. By default, the use of a point
load for the upper girder makes the high stiffness of the girder below at 10 inches away from its
support the only stiffness used in the calculation, resulting in a correspondingly high, but
inaccurate, force. In reality, the girder falling from above would also have a stiffness, with the
relevant stiffness for the calculation of the impact load being that of two springs in series using
the equation 1/Kt = 1/K1 + 1/K2.
To determine the stiffness of the falling Floor 13 beam and girder assembly, a finite
element modal analysis was performed with the assembly constrained at the north and east
exterior walls and the girder sitting on its bearing seat at Column 44 with the bolts at the girder
seat broken there. The results are shown in Figure 3.15. The first mode of 22 Hz involved only
the beams moving in a transverse direction and was not relevant. The second mode of 0.52 Hz
involved the participation of the entire beam and girder assembly in the vertical direction and
was relevant.

89
Figure 3.15 The relevant 0.52 Hz mode of the falling beam and girder assembly.
The analysis shown in this figure and related text below was originally performed by mechanical engineer Anthony Szamboti and is reproduced here with permission
The natural frequency of mode 2 in the vertical direction is 0.52 Hz. The weight of the
beam and girder assembly is approximately 20,000 lbs. The concrete was not considered by
Nordenson to act with the steel during the impact to amplify the load. This would be appropriate
as the shear studs were broken and the welded wire fabric in the slab and the floor pans would
keep it suspended to some degree. Knowing the natural frequency of the beam and girder
assembly (fn), along with its weight, the following equation
𝑓! =12𝜋
'𝐾𝑔"𝑊
can be used to find the stiffness (K) of the falling beam and girder assembly where
K=(fnx2π)2xW/gc
K=(0.52Hzx2π)2x(20,000lbs.)/(386.4in/s2)=552.53lbs./inch
90
The stiffness that is used in the impact calculations is the combined stiffness of both the
falling beam and girder assembly (K1) and that of the girder on Floor 12 below at 10 inches from
its support at Column 79 (K2). It is
1𝐾#=
1𝐾$+1𝐾%
= F1
552.53G + F1
7,627,000G = 0.00181
Thus,
𝐾# = I1 0.00181J K = 552.48lbs/in
Using Nordenson's potential energy (P.E.) of 3,473,000 in-lbs. and the calculated
stiffness, in the same standard equation he uses to find deflection (D)
𝑃. 𝐸. =𝐾#𝐷%
2
𝐷 = '2𝑃. 𝐸.𝐾#
= 112.13in
and finally using the standard equation Nordenson uses to find force (F)
𝐹 = 𝐾#𝐷 = (552.48lb/in)(112.13in) = 61,950lbs
This 61,950 lb. impact force is less than 10% of the 632,000 lb. force required to shear the girder
bearing seat support welds and is thus quite insufficient to do so. This analysis was performed at
room temperature; higher temperatures would soften the girders, causing even lower impact
forces.
Therefore, the northeast corner of Floor 12 would not have collapsed if a girder from
Floor 13 came off its seat at Column 79 and fell onto it. As a result, the Nordenson portion of the
Arup analysis does not demonstrate that propagation could occur after the supposed initiating
failure, even if the girder were to fall off its seat at Column 79. This is a fatal flaw in the Arup
and Nordenson analysis.
91
3.4 Evaluation of the Weidlinger Collapse Initiation Hypothesis
The engineering firm Weidlinger Associates Inc. (Weidlinger) was retained by the
defendants in “Aegis Insurance Services, Inc. v. 7 World Trade Center Company, L.P.” to
perform structural analysis in support of their defense that the collapse of WTC 7 did not result
from deficient design and was instead caused by the extraordinary events of September 11, 2001.
The Weidlinger report was completed in October 2010 but was never filed with the court. It was
then made public in June 2016.
3.4.1 Discussion of Weidlinger’s Collapse Initiation Hypothesis
As would be expected, the Weidlinger report attempts to rebut the Arup and Nordenson
reports. Among its points of rebuttal, it corroborates our finding that the falling Floor 13 beam
and girder assembly could not break through the next floor down.
The collapse initiation hypothesis presented in the Weidlinger report, which is based on
fire modeling performed by Dr. Craig Beyler of Hughes Associates, is that Floors 9 and 10 were
simultaneously heated to between 750° and 800°C in the exact same area of each floor. This
extreme heating eventually caused Floor 10 to give way and break through Floor 9, which was
possible only because of the extreme heating of Floor 9. The falling debris from these initial
floor failures was sufficient to cause a cascade of floor failures through the unheated floors down
to Floor 5, diminishing the lateral support for Column 79 and two nearby columns, Column 80
and Column 81, thus causing the columns to buckle and trigger a progressive collapse of the
entire building.
However, the details of the thermal analysis by Dr. Beyler are not shown in the
Weidlinger report, and Beyler’s analysis has not been made public, despite its central importance
to Weidlinger’s hypothesis. It is important to understand that steel structural members reaching
temperatures of 750°C due to office fires can be considered extraordinary. Without any analysis
provided to substantiate such temperatures, Weidlinger’s collapse initiation hypothesis must be
viewed skeptically and can only be assumed to have a very low probability of occurrence.
92
CHAPTER 4.0 SIMULATING THE COLLAPSE OF WTC 7
This chapter presents the findings of our collapse analysis for the collapse of WTC 7. The
goal of our analysis was to determine what types of local failures and their locations may have
caused the total collapse to occur as observed.
4.1 Key Features of the Collapse
Based on our review of video footage and of the NIST and FEMA Reports, we identified
three key features that occurred during the collapse of WTC 7, which we then attempted to
replicate in our simulations of the collapse. These three key features are as follows:
1. The collapse of the east penthouse, which begins approximately 6.9 seconds prior to the
descent of the north face roofline;
2. The collapse of the screen wall and west penthouse, which begins approximately 0.5 to 1
second prior to the descent of the north face roofline; and
3. The descent of the north face roofline, which progresses at a rate of free fall for
approximately 2.25 to 2.5 seconds over a distance of approximately 105 feet or 8 stories,
during which the building’s sheathing remains attached to the exterior steel framing and
does not experience visible differential movements.
4.1.1 Discussion of NIST’s Progressive Collapse Simulation
During our nonlinear connection study (Section 2.1.3.2), wherein we examined NIST’s
modeling of WTC 7’s structural connections and its effect on NIST’s progressive collapse
simulation, we also observed that NIST’s progressive collapse simulation did not closely
resemble the observed collapse. While NIST’s progressive collapse simulation does show the
three key features listed above, it also predicts significant differential movements in the exterior,
both before and during the fall of the roofline, that were not observed in the video (see Figures
4.1a and 4.1b). Such differential movements in the exterior would be extremely likely to have
caused window breakage, cracking of the façade, and exterior deformation, none of which were
observed. A major goal of our analysis was to identify failure mechanisms that would predict the
minimal differential movement of the exterior seen in videos of the collapse. However, it should
be noted that after the east penthouse collapse, window breakage did occur for 12 to 15 floors
down from the top of the building under the penthouse. This was most likely caused by shock
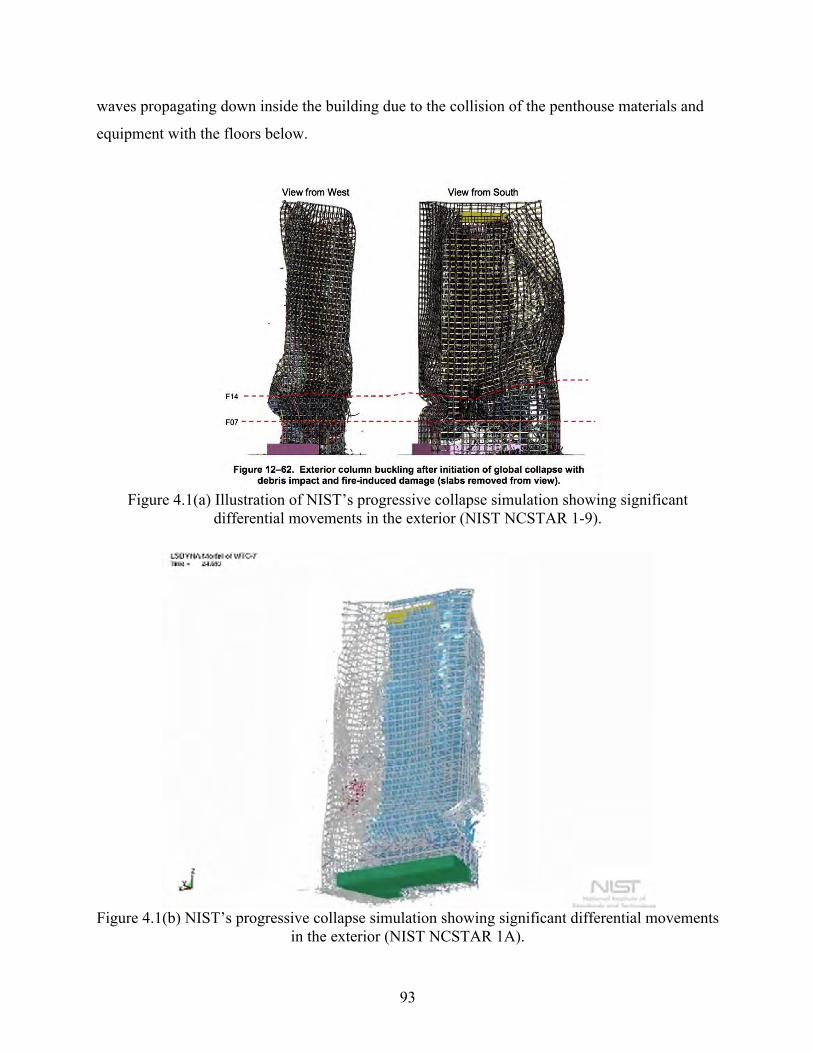
93
waves propagating down inside the building due to the collision of the penthouse materials and
equipment with the floors below.
Figure 4.1(a) Illustration of NIST’s progressive collapse simulation showing significant
differential movements in the exterior (NIST NCSTAR 1-9).
Figure 4.1(b) NIST’s progressive collapse simulation showing significant differential movements
in the exterior (NIST NCSTAR 1A).
94
4.2 The UAF Research Team’s Approach
We used both ABAQUS and SAP2000 finite element software to simulate various types
of failures. Subsequently, several hypothetical scenarios were examined in order to determine
what types of local failures could and could not produce the key features described above. One
set of analyses was performed for the collapse of the east penthouse. A second set of analyses
was performed for the collapse of the west penthouse and north face roofline (i.e., the main
observed collapse event). The column beam framing connections for the penthouse were
considered rigid as it shortened modeling time while minimally affecting the response and
resulting behavior of the structure. However, it did affect the appearance at the bottom corners of
the penthouse. For all collapse models and analyses, we included the debris damage assumed by
NIST, which involved six exterior columns on the southwest face of the building reportedly
being severed by falling debris from the collapse of WTC 1. In all cases, failure simulations were
based on finite element analysis results and the deformations presented were scaled by the
software to help the reader visualize direction and relative magnitude for the displaced shape(s).
Displaced magnitudes in each figure are exaggerated and are not scaled to the building geometry.
Displacement values are typically given in inches within each figure.
4.2.1 Hypothetical Failure Mechanisms for the East Penthouse Collapse
The east penthouse was supported by Columns 79, 80, and 81. Therefore, like NIST, we
hypothesized that the collapse of the east penthouse resulted from these three columns failing.
The main question we sought to address in our simulations — and where our findings
diverge from NIST’s — was the height at which Columns 79, 80, and 81 most likely failed.
NIST hypothesized that these columns failed due to Column 79 losing lateral support from Floor
5 to 14, i.e., the columns failed relatively low in the building (the local failures alleged by NIST
to have caused the loss of lateral support for Column 79 are examined in the preceding chapters).
We simulated the failure of Columns 79, 80, and 81 at different floor intervals throughout the
building — starting from Floors 6 to 13 and continuing all the way to the uppermost part (Floor
45 to the penthouse) — and examined the resulting behavior of the east penthouse as well as the
behavior of the building’s exterior.
95
4.2.2 Hypothetical Failure Mechanisms for West Penthouse and North Face Roofline
Collapse
In the progressive collapse scenario advanced by NIST, the failure of Columns 79, 80,
and 81 that directly caused the collapse of the east penthouse also initiated a horizontal
progression of core column failures that took out every core column. According to NIST, this
redistributed loads to the shell of exterior columns, which gave way shortly after the core
columns failed (in NIST’s scenario, the collapse of the exterior shell is what was observed and
captured on video).
First, we simulated NIST’s scenario. Finding that NIST’s scenario was not feasible, we
simulated another scenario: the simultaneous failure of all core columns over the 8 stories
between floors 12 and 19 followed 1.3 seconds later by the simultaneous failure of all exterior
columns over the same 8 stories. Further, we attempted to verify a kink in the north face. This
kink shows up in the video as the structure begins to collapse. It is argued that the kink was a
result of inner core columns failing first and the remaining exterior columns pulled in (i.e.
buckling inward) shortly after. However, we were unable to simulate this phenomenon with the
software. The limitations of the software in modeling buckling with time is based on needing
small time steps and small incremental deformations within each time step.
4.3 Results of the East Penthouse Collapse Analyses
The linear static analysis results for the simulations where we removed Columns 79, 80,
and 81 at different floor intervals are shown in Figures 4.2 to 4.7 below.
Based on these analyses, we found that Columns 79, 80, and 81 did not fail at the lower
floors of the building (e.g., from Floor 6 to 13 or Floor 13 to 21). We found that the failure of
Columns 79, 80, and 81 at the lower floors of the building would cause the building to tilt
dramatically to the east, which would have been observed in the videos but was not, and that it
would not cause the east penthouse to collapse, because the intact portions of Columns 79, 80,
and 81 above where the columns failed would still support the penthouse.
On the other hand, we found that the failure of Columns 79, 80, and 81 at the upper floors
of the building, especially at Floor 45 all the way up to the penthouse, would cause the penthouse
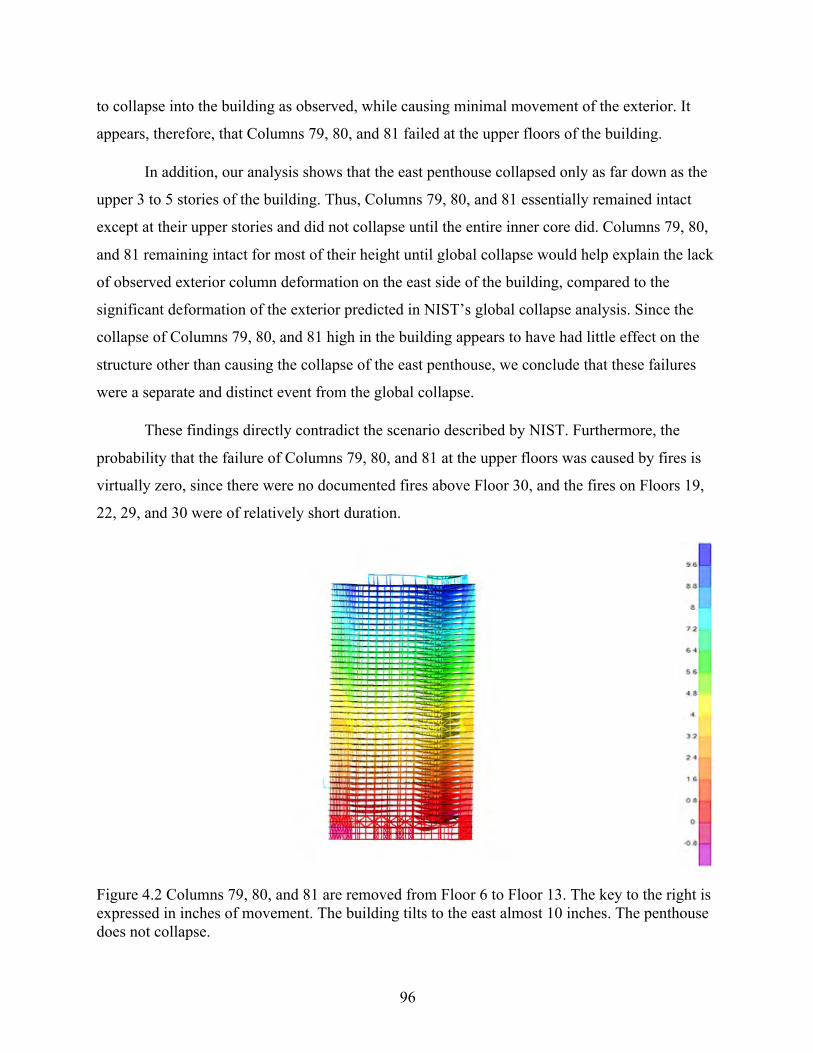
96
to collapse into the building as observed, while causing minimal movement of the exterior. It
appears, therefore, that Columns 79, 80, and 81 failed at the upper floors of the building.
In addition, our analysis shows that the east penthouse collapsed only as far down as the
upper 3 to 5 stories of the building. Thus, Columns 79, 80, and 81 essentially remained intact
except at their upper stories and did not collapse until the entire inner core did. Columns 79, 80,
and 81 remaining intact for most of their height until global collapse would help explain the lack
of observed exterior column deformation on the east side of the building, compared to the
significant deformation of the exterior predicted in NIST’s global collapse analysis. Since the
collapse of Columns 79, 80, and 81 high in the building appears to have had little effect on the
structure other than causing the collapse of the east penthouse, we conclude that these failures
were a separate and distinct event from the global collapse.
These findings directly contradict the scenario described by NIST. Furthermore, the
probability that the failure of Columns 79, 80, and 81 at the upper floors was caused by fires is
virtually zero, since there were no documented fires above Floor 30, and the fires on Floors 19,
22, 29, and 30 were of relatively short duration.
Figure 4.2 Columns 79, 80, and 81 are removed from Floor 6 to Floor 13. The key to the right is expressed in inches of movement. The building tilts to the east almost 10 inches. The penthouse does not collapse.

97
Figure 4.3 Columns 79, 80, and 81 are removed from Floor 13 to Floor 21. The building tilts to the east 7.2 inches. The penthouse does not collapse.
Figure 4.4 Columns 79, 80, and 81 are removed from Floor 21 to Floor 29. The building tilts to the east 5.4 inches. The penthouse does not collapse, though penthouse deflection increases.
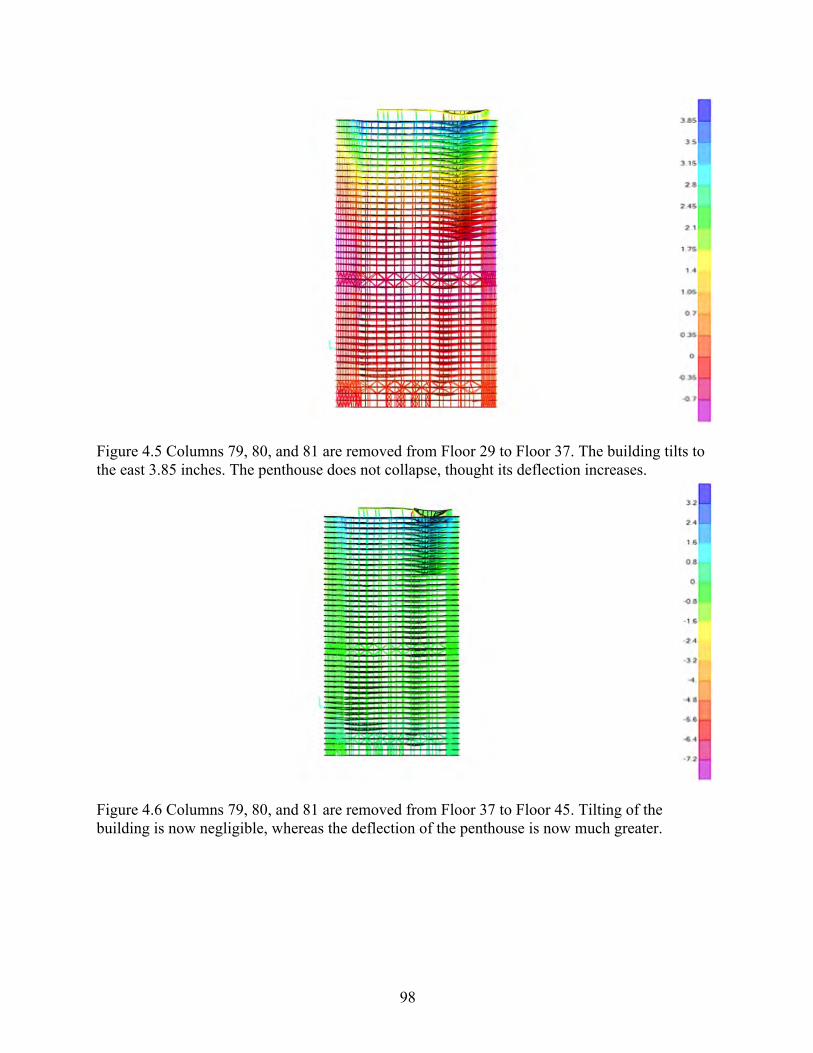
98
Figure 4.5 Columns 79, 80, and 81 are removed from Floor 29 to Floor 37. The building tilts to the east 3.85 inches. The penthouse does not collapse, thought its deflection increases.
Figure 4.6 Columns 79, 80, and 81 are removed from Floor 37 to Floor 45. Tilting of the building is now negligible, whereas the deflection of the penthouse is now much greater.
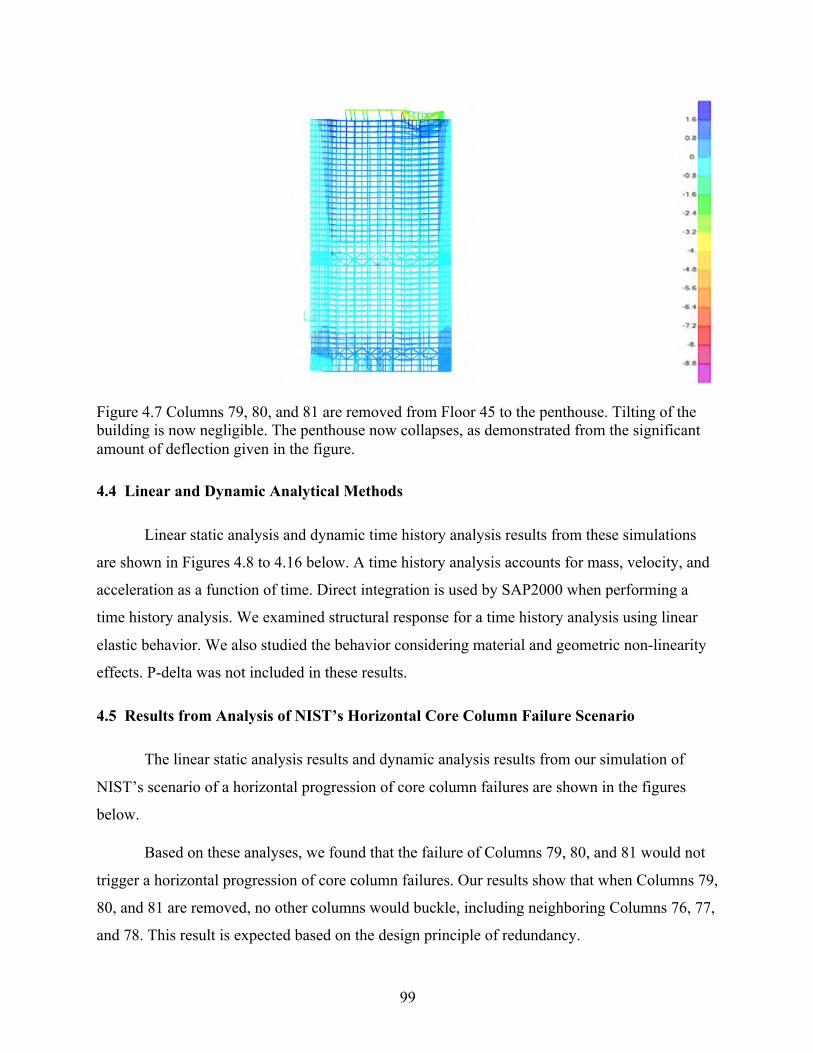
99
Figure 4.7 Columns 79, 80, and 81 are removed from Floor 45 to the penthouse. Tilting of the building is now negligible. The penthouse now collapses, as demonstrated from the significant amount of deflection given in the figure.
4.4 Linear and Dynamic Analytical Methods
Linear static analysis and dynamic time history analysis results from these simulations
are shown in Figures 4.8 to 4.16 below. A time history analysis accounts for mass, velocity, and
acceleration as a function of time. Direct integration is used by SAP2000 when performing a
time history analysis. We examined structural response for a time history analysis using linear
elastic behavior. We also studied the behavior considering material and geometric non-linearity
effects. P-delta was not included in these results.
4.5 Results from Analysis of NIST’s Horizontal Core Column Failure Scenario
The linear static analysis results and dynamic analysis results from our simulation of
NIST’s scenario of a horizontal progression of core column failures are shown in the figures
below.
Based on these analyses, we found that the failure of Columns 79, 80, and 81 would not
trigger a horizontal progression of core column failures. Our results show that when Columns 79,
80, and 81 are removed, no other columns would buckle, including neighboring Columns 76, 77,
and 78. This result is expected based on the design principle of redundancy.
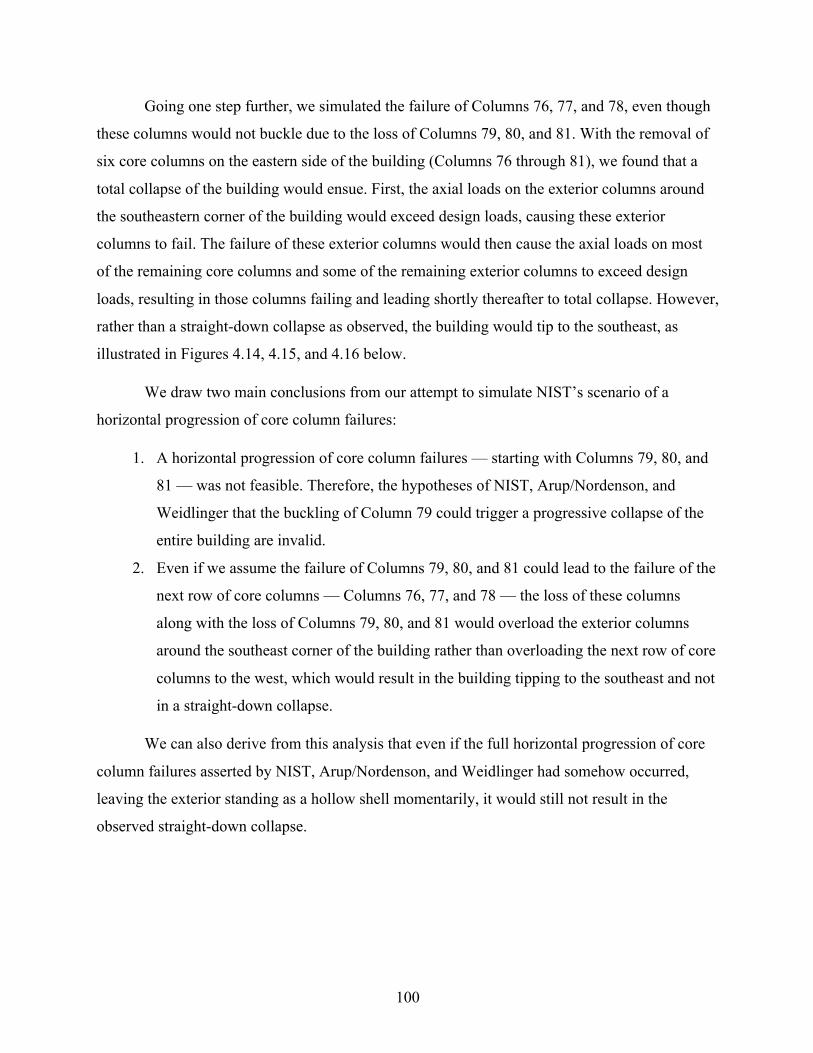
100
Going one step further, we simulated the failure of Columns 76, 77, and 78, even though
these columns would not buckle due to the loss of Columns 79, 80, and 81. With the removal of
six core columns on the eastern side of the building (Columns 76 through 81), we found that a
total collapse of the building would ensue. First, the axial loads on the exterior columns around
the southeastern corner of the building would exceed design loads, causing these exterior
columns to fail. The failure of these exterior columns would then cause the axial loads on most
of the remaining core columns and some of the remaining exterior columns to exceed design
loads, resulting in those columns failing and leading shortly thereafter to total collapse. However,
rather than a straight-down collapse as observed, the building would tip to the southeast, as
illustrated in Figures 4.14, 4.15, and 4.16 below.
We draw two main conclusions from our attempt to simulate NIST’s scenario of a
horizontal progression of core column failures:
1. A horizontal progression of core column failures — starting with Columns 79, 80, and
81 — was not feasible. Therefore, the hypotheses of NIST, Arup/Nordenson, and
Weidlinger that the buckling of Column 79 could trigger a progressive collapse of the
entire building are invalid.
2. Even if we assume the failure of Columns 79, 80, and 81 could lead to the failure of the
next row of core columns — Columns 76, 77, and 78 — the loss of these columns
along with the loss of Columns 79, 80, and 81 would overload the exterior columns
around the southeast corner of the building rather than overloading the next row of core
columns to the west, which would result in the building tipping to the southeast and not
in a straight-down collapse.
We can also derive from this analysis that even if the full horizontal progression of core
column failures asserted by NIST, Arup/Nordenson, and Weidlinger had somehow occurred,
leaving the exterior standing as a hollow shell momentarily, it would still not result in the
observed straight-down collapse.
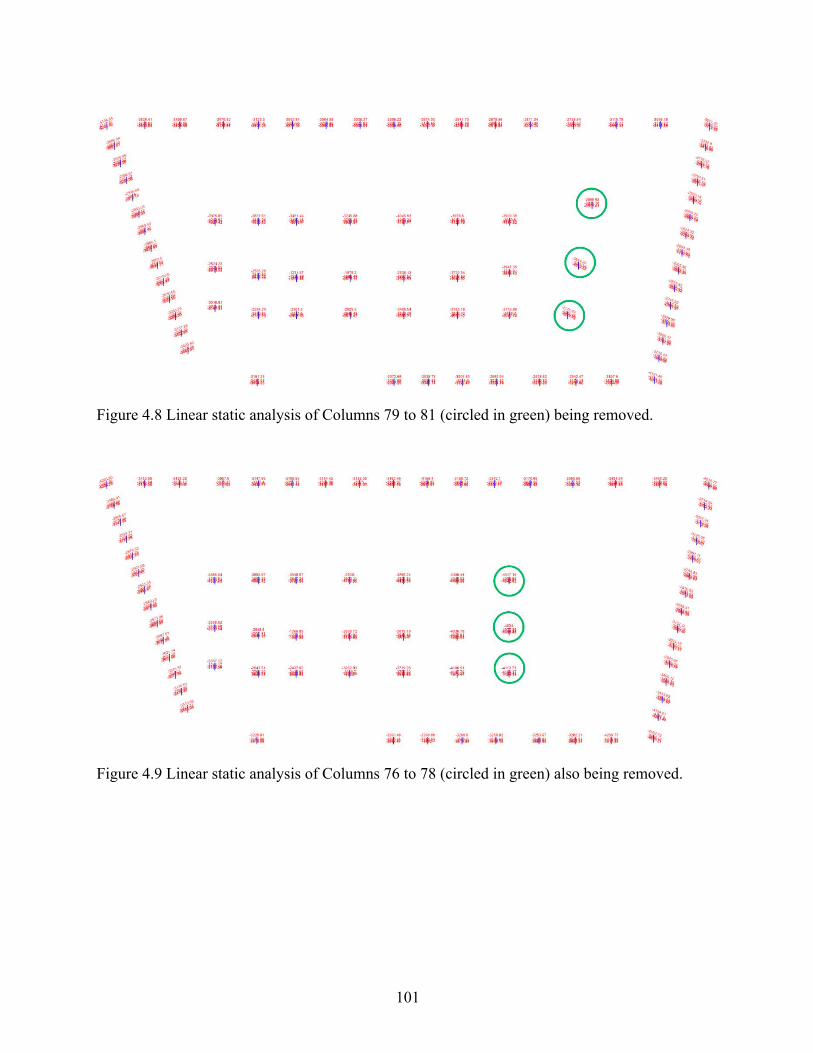
101
Figure 4.8 Linear static analysis of Columns 79 to 81 (circled in green) being removed.
Figure 4.9 Linear static analysis of Columns 76 to 78 (circled in green) also being removed.

102
Figure 4.10 Linear static analysis results show that the failure of Columns 76 to 81 overloads 10 exterior columns (circled in red) around the southeast corner, but not the next row of core columns to the west (not circled in red).
Figure 4.11 Linear static analysis results show that the failure of 10 exterior columns around the southeast corner leads to numerous core and exterior columns (circled in red) being overloaded and failing. A progressive collapse triggered by the hypothetical failure of Columns 76 to 81 is underway.
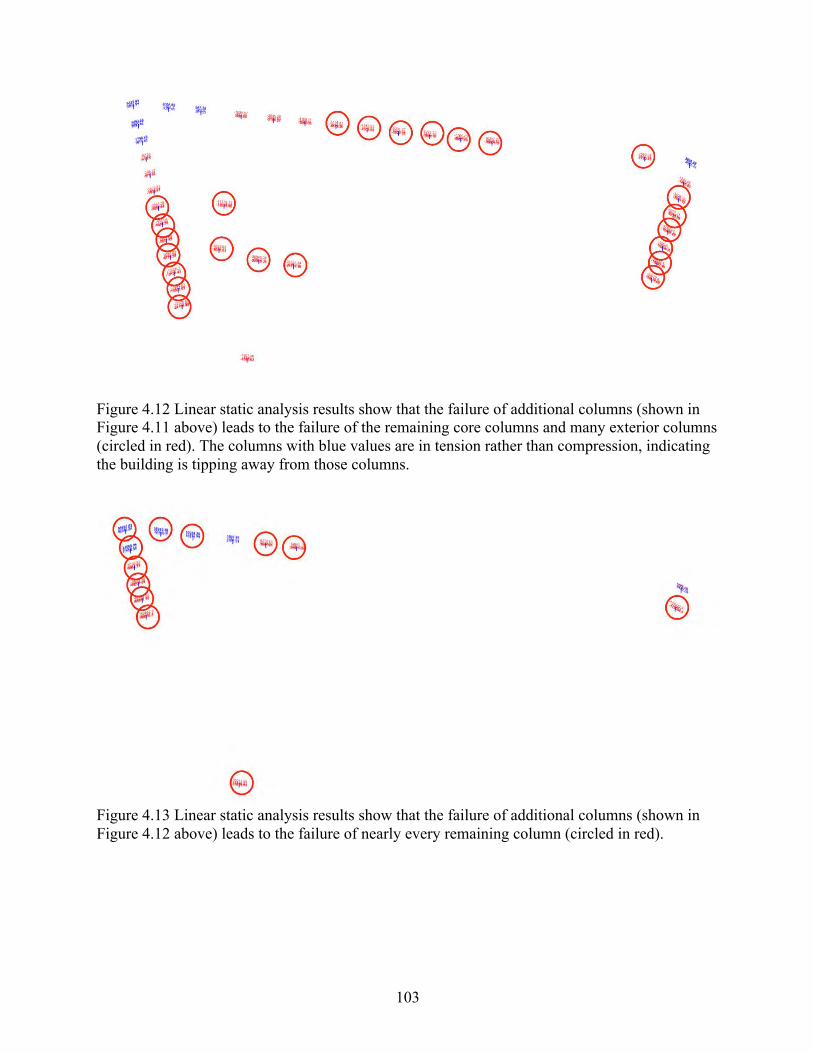
103
Figure 4.12 Linear static analysis results show that the failure of additional columns (shown in Figure 4.11 above) leads to the failure of the remaining core columns and many exterior columns (circled in red). The columns with blue values are in tension rather than compression, indicating the building is tipping away from those columns.
Figure 4.13 Linear static analysis results show that the failure of additional columns (shown in Figure 4.12 above) leads to the failure of nearly every remaining column (circled in red).

104
Figure 4.14 A visualization of linear static analysis, from the southeast, showing movement to the southeast when Columns 76 to 81 are removed. The movement shown is highly amplified for clarity. The actual scale of the displacements are presented to the right.
Figure 4.15 Visualization of linear static analysis, from the southwest, showing the building tipping to the southeast after the hypothetical failure of Columns 76 to 81. The movement shown is highly amplified for clarity. The actual scale of the displacements are presented to the right.
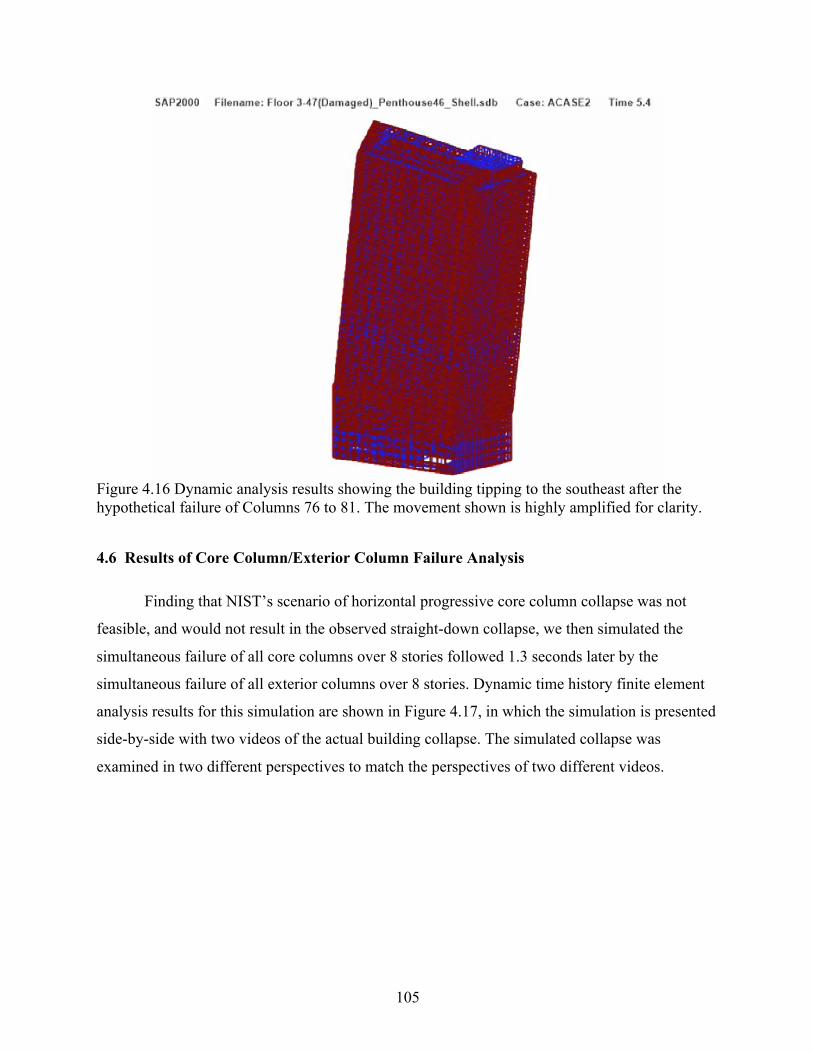
105
Figure 4.16 Dynamic analysis results showing the building tipping to the southeast after the hypothetical failure of Columns 76 to 81. The movement shown is highly amplified for clarity.
4.6 Results of Core Column/Exterior Column Failure Analysis
Finding that NIST’s scenario of horizontal progressive core column collapse was not
feasible, and would not result in the observed straight-down collapse, we then simulated the
simultaneous failure of all core columns over 8 stories followed 1.3 seconds later by the
simultaneous failure of all exterior columns over 8 stories. Dynamic time history finite element
analysis results for this simulation are shown in Figure 4.17, in which the simulation is presented
side-by-side with two videos of the actual building collapse. The simulated collapse was
examined in two different perspectives to match the perspectives of two different videos.
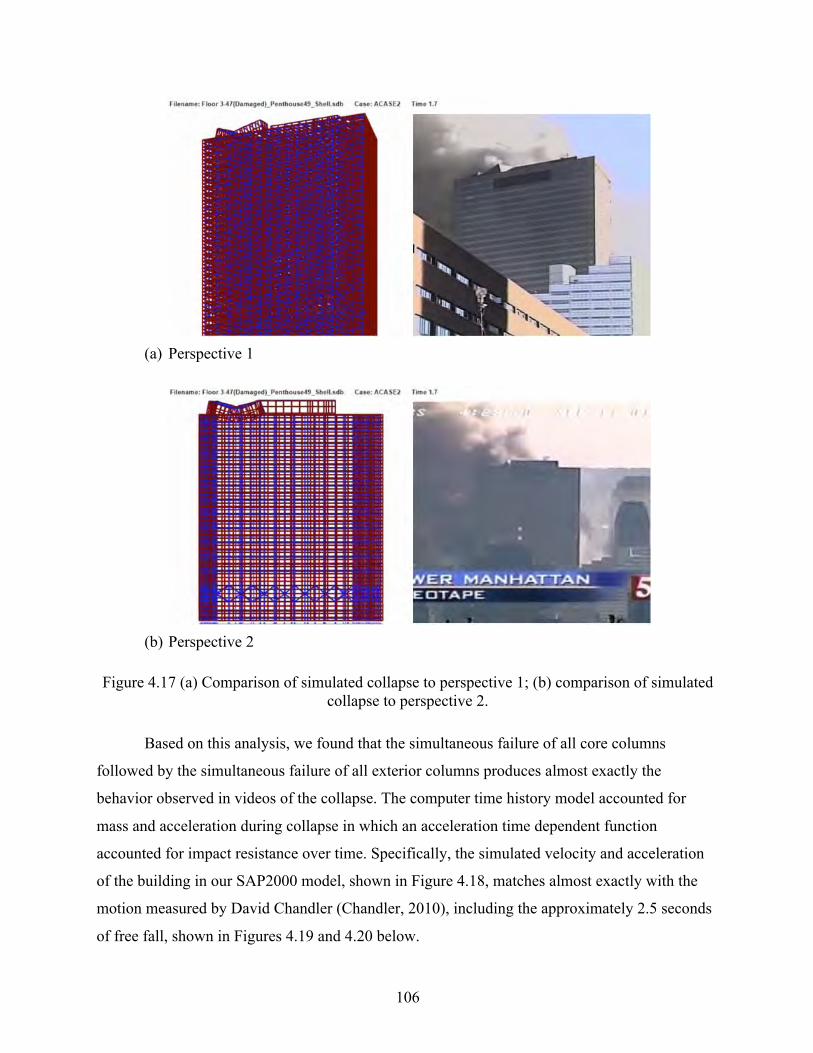
106
(a) Perspective 1
(b) Perspective 2
Figure 4.17 (a) Comparison of simulated collapse to perspective 1; (b) comparison of simulated collapse to perspective 2.
Based on this analysis, we found that the simultaneous failure of all core columns
followed by the simultaneous failure of all exterior columns produces almost exactly the
behavior observed in videos of the collapse. The computer time history model accounted for
mass and acceleration during collapse in which an acceleration time dependent function
accounted for impact resistance over time. Specifically, the simulated velocity and acceleration
of the building in our SAP2000 model, shown in Figure 4.18, matches almost exactly with the
motion measured by David Chandler (Chandler, 2010), including the approximately 2.5 seconds
of free fall, shown in Figures 4.19 and 4.20 below.

107
Figure 4.18 UAF Simulation of core column-exterior column failure scenario.
Figure 4.19 Velocity analysis by David Chandler (Chandler, 2010).
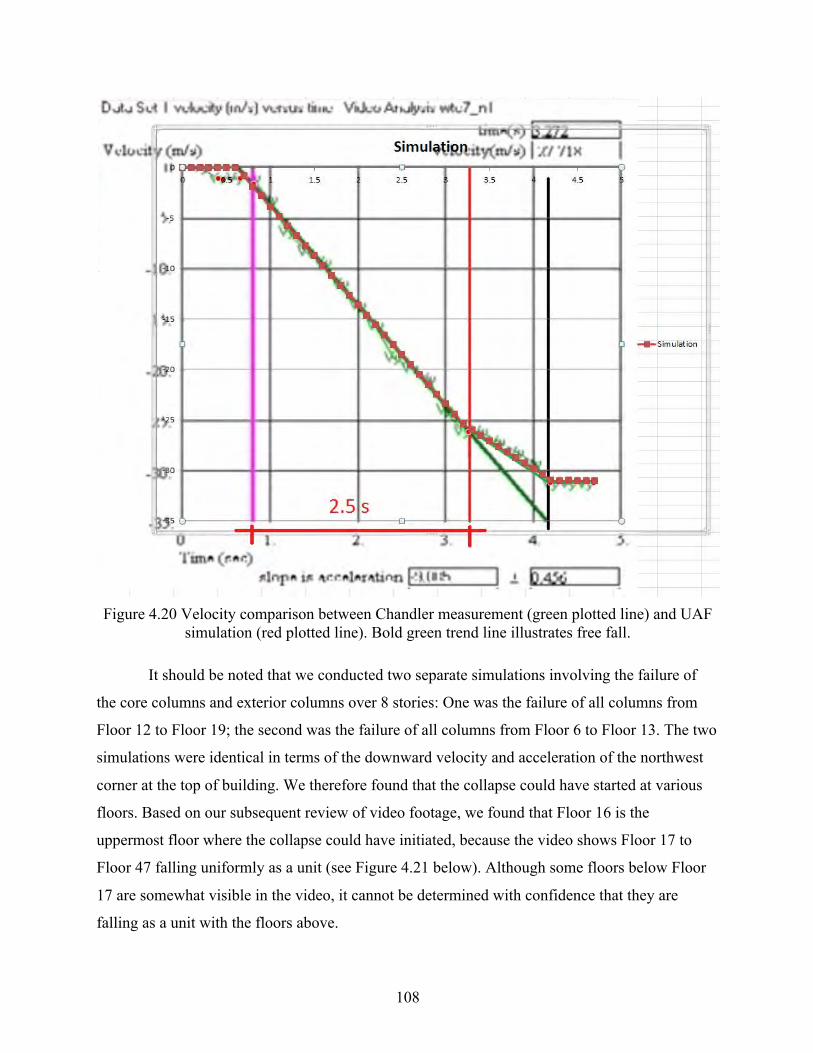
108
Figure 4.20 Velocity comparison between Chandler measurement (green plotted line) and UAF
simulation (red plotted line). Bold green trend line illustrates free fall.
It should be noted that we conducted two separate simulations involving the failure of
the core columns and exterior columns over 8 stories: One was the failure of all columns from
Floor 12 to Floor 19; the second was the failure of all columns from Floor 6 to Floor 13. The two
simulations were identical in terms of the downward velocity and acceleration of the northwest
corner at the top of building. We therefore found that the collapse could have started at various
floors. Based on our subsequent review of video footage, we found that Floor 16 is the
uppermost floor where the collapse could have initiated, because the video shows Floor 17 to
Floor 47 falling uniformly as a unit (see Figure 4.21 below). Although some floors below Floor
17 are somewhat visible in the video, it cannot be determined with confidence that they are
falling as a unit with the floors above.
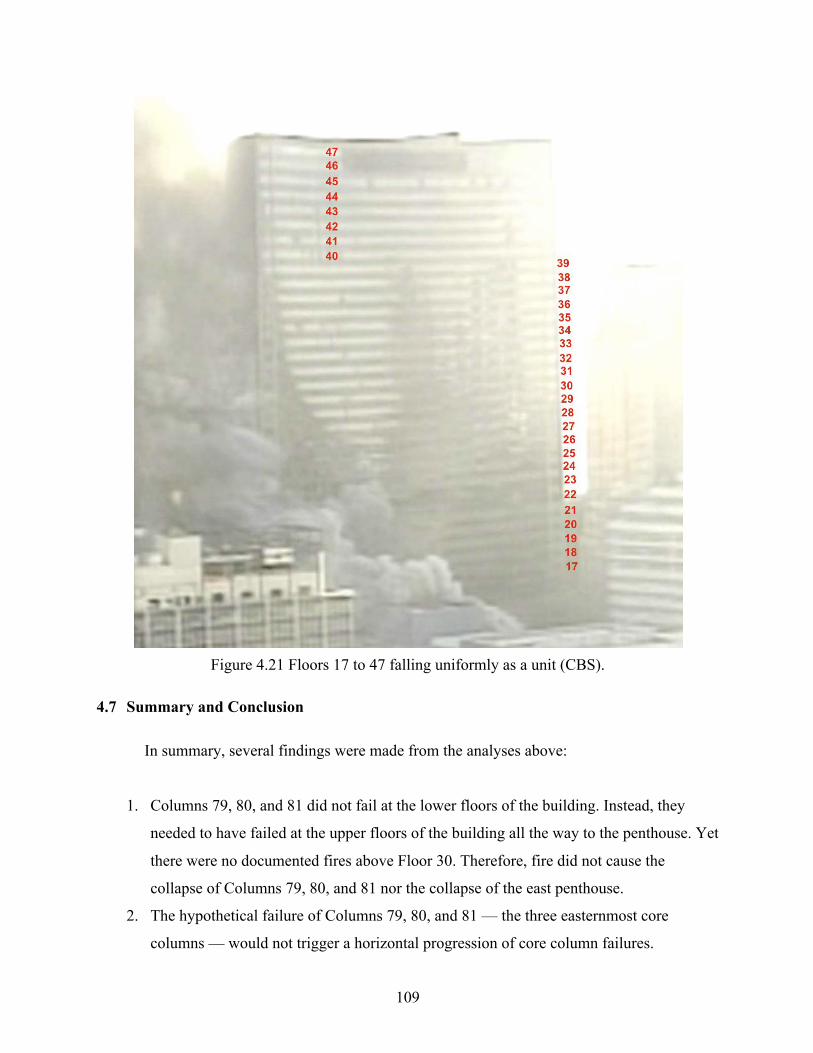
109
Figure 4.21 Floors 17 to 47 falling uniformly as a unit (CBS).
4.7 Summary and Conclusion
In summary, several findings were made from the analyses above:
1. Columns 79, 80, and 81 did not fail at the lower floors of the building. Instead, they
needed to have failed at the upper floors of the building all the way to the penthouse. Yet
there were no documented fires above Floor 30. Therefore, fire did not cause the
collapse of Columns 79, 80, and 81 nor the collapse of the east penthouse.
2. The hypothetical failure of Columns 79, 80, and 81 — the three easternmost core
columns — would not trigger a horizontal progression of core column failures.
110
Therefore, the hypotheses of NIST, Arup/Nordenson, and Weidlinger that the buckling
of Column 79 would trigger a progressive collapse of the entire building are invalid, and
the collapse of Columns 79, 80, and 81 high in the building was a separate and distinct
event.
3. Even if we assume the failure of Columns 79, 80, and 81 could lead to the failure of the
next row of core columns, the hypothetical failure of Columns 76 to 81 would overload
the exterior columns around the southeast corner of the building, rather than overloading
the next row of core columns to the west, which would result in the building tipping to
the southeast and not in a straight-down collapse.
4. The simultaneous failure of all core columns over 8 stories followed 1.3 seconds later by
the simultaneous failure of all exterior columns over 8 stories produces almost exactly
the behavior observed in videos of the collapse. The collapse could have started at
various floors starting at Floor 16 and below and produced the same behavior.
It is our conclusion that the collapse of WTC 7 was a global failure involving the near-
simultaneous failure of all columns in the building and not a progressive collapse involving the
sequential failure of columns throughout the building.
Despite simulating a number of hypothetical scenarios, we were unable to identify any
progressive sequence of failures that could have taken place on September 11, 2001, and caused
a total collapse of the building, let alone the observed straight-down collapse with approximately
2.5 seconds of free fall and minimal differential movement of the exterior.

111
REFERENCES
AISC, 2011, AISC Steel Construction Manual, 14th Edition.
Alungbe, Gabriel D. et al., 2011, Effects of Aggregate, Water/cement ratio, and Curing on the Coefficient of Linear Thermal Expansion of Concrete.
Arup & Nordenson, United States Court of Appeals for the 2nd Circuit, Case #11-4403, 2010.
Brookman, 2012, Discussion of "Analysis of Structural Response of WTC 7 to Fire and Sequential Failures Leading to Collapse." Journal of 9/11 Studies.
CENTURION: Fire Suppression Equipment Specialists, 2012, http://www.centurionfire.ca/resources/chemistry-and-physics-of.pdf
Chandler, David, 2010, Physics – WTC7 Freefall. https://youtube/CpAp8eCEqNA.
Cheng, Hao and George V. Hadjisophocleous, 2011, Dynamic Modeling of Fire Spread in Building.
Dassault Systèmes, 2014, ABAQUS Analysis User’s Manual, Version 6.7.
Engineeringtoolbox, 2011, http://www.engineeringtoolbox.com/steel-pipes-temperature-expansion-d_38.html.
FEMA, 2002, World Trade Center Building Performance Study.
FEMA, 2014, Practical Applications of Fire Dynamics and Modeling.
Frankel Steel Limited, 1985, World Trade Center 7 Drawings.
Hurley, Morgan J., and Richard W. Bukowski, 2008, Fire Hazard Analysis Techniques.
Jones, Steven, 2006, Why Indeed Did the WTC Buildings Collapse Completely? Journal of 9/11 Studies.
Jones, Steven, 2007, Revisiting 9/11/2001 — Applying the Scientific Method. Journal of 9/11 Studies.
Kameshki, E.S., and Saka, M.P., 2003, Genetic algorithm based optimum design of nonlinear planar steel frames with various semi-rigid connections. Journal of Constructional Steel Research 59: 109–134.
112
Lim, J., 2004, Progressive Collapse Analysis of Steel Framed Moment Resisting Structures. The Pennsylvania State University.
Mainstone, R.J., 1973, The Hazard of Internal Blast in Buildings. Building Research Establishment Current Paper, Building Research Station, Garston, Watford, WD2 7JR, April.
Marjanishvili, S., M., 2004, Progressive analysis procedure for progressive collapse. Journal of Performance of Constructed Facilities, ASCE.
Naik, Tarun R., 2011, et al., Influence of Types of Coarse Aggregates on the Coefficient of Thermal Expansion of Concrete.
NIST, 2008, NCSTAR 1A, Final Report on the Collapse of World Trade Center Building 7.
NIST, 2008, NCSTAR 1-9, Structural Fire Response and Probable Collapse Sequence of World Trade Center Building 7, Vol. 1.
NIST, 2008, NCSTAR 1-9, Structural Fire Response and Probable Collapse Sequence of World Trade Center Building 7, Vol. 2.
NIST, 2009, NCSTAR 1-9A, Global Structural Analysis of the Response of World Trade Center Building 7 to Fires and Debris Impact Damage.
Oak Ridge Fire Department, Oct, 2013, Flashover Demonstration, https://www.youtube.com/watch?v=BtMmymOxdjc.
Rahman et al., 2004, The effect of fire loading on a steel frame and connection.
Sparky sword science, 2014, http://sparkyswordscience.blogspot.com/2014/01/the-temper-of-iron.html.
Wang, 2002, Steel and Composite Structures: Behaviour and Design for Fire Safety.
Weidlinger Associates, 2010, WTC 7 Collapse Analysis and Assessment Report.
Zareh, Hormoz and Jenna Bell, 2012, ABAQUS/CAE Material Nonlinearity Tutorial, Portland State University.