Embed Size (px)
Citation preview
2009
Sunayna Ali
Gabriel A. Huppé
Yat Hong Sin
For: Professor Robert Forbes
BUSI 4709B
Strategic Management in International
Business
A Strategic Analysis

2 | P a g e
Table of Contents Executive Summary ....................................................................................................................................... 5
Firm Overview – British American Tobacco (BAT) .................................................................................... 5
External Environment Overview ............................................................................................................... 5
Industry Analysis ....................................................................................................................................... 5
Corporate and Business Level Strategy .................................................................................................... 6
Introductory Summary .................................................................................................................................. 7
Macro Environmental Analysis ..................................................................................................................... 9
Foreword .................................................................................................................................................. 9
Technological Trends ................................................................................................................................ 9
Trends Centering around Operative Efficiency. .................................................................................... 9
Trends Centering around New Product Innovation ............................................................................ 12
Economic Environment Trend ................................................................................................................ 15
North America (US as a Proxy) ............................................................................................................ 15
Europe (The European Union as a Proxy) ........................................................................................... 18
Asia (Japan as a Proxy) ........................................................................................................................ 20
Socio-Cultural Environment Trend ......................................................................................................... 22
North America (US as a Proxy) ............................................................................................................ 22
Europe (The European Union as a Proxy) ........................................................................................... 25
Asia (Japan as a Proxy) ........................................................................................................................ 27
Political-Legal Environment Trend.......................................................................................................... 30
North America (US as a Proxy) ............................................................................................................ 30
Europe (The European Union as a Proxy) ........................................................................................... 34
Asia (Japan as a Proxy) ........................................................................................................................ 39
Macro Environmental Summary ............................................................................................................. 41
Industry Analysis ......................................................................................................................................... 43
Strategic Group Map .............................................................................................................................. 45
Porter’s Five Forces ................................................................................................................................ 47
Direct Competitors (LOW 3) ................................................................................................................ 47
Threat of Entry .................................................................................................................................... 52
Threat of Substitutes (VERY LOW 2) ................................................................................................... 55

3 | P a g e
Power of Suppliers (LOW 2) ................................................................................................................ 59
Power of Buyers .................................................................................................................................. 60
Five Forces Summary .............................................................................................................................. 63
Driving Forces ......................................................................................................................................... 64
Socio-Cultural Impacts ........................................................................................................................ 65
Shift to Emerging Markets .................................................................................................................. 66
Mergers and Acquisitions ................................................................................................................... 66
Effect on Direct Competition .............................................................................................................. 66
Effect on Buyer-Power ........................................................................................................................ 66
Summary of Industry Analysis ................................................................................................................ 67
Business Unit Analysis ................................................................................................................................. 69
Introduction to Value Chain Analysis ..................................................................................................... 69
Supply Chain Management (Strength) ................................................................................................... 71
Procurement ....................................................................................................................................... 72
Logistics ............................................................................................................................................... 75
Cash Conversion Cycle ........................................................................................................................ 77
Operations (Weakness) .......................................................................................................................... 78
Distribution (Strength) ............................................................................................................................ 83
Marketing and Sales (Strength) .............................................................................................................. 86
Market Share....................................................................................................................................... 87
Sales Trends ........................................................................................................................................ 88
BAT Regional Review ........................................................................................................................... 89
BAT Marketing Mix ............................................................................................................................. 90
Customer Service (Strength) ................................................................................................................... 99
Human Resource Management (Weakness) ........................................................................................ 102
Research and Development /New Product Development (Weakness) ............................................... 104
Corporate Leadership ........................................................................................................................... 107
Performance Incentives: ................................................................................................................... 110
Corporate Governance Accountability: ............................................................................................ 110
Measuring Corporate Performance: ................................................................................................. 111
Summary (Relatively Attractive) ........................................................................................................... 115

4 | P a g e
Corporate Level Strategy .......................................................................................................................... 119
Introduction: ......................................................................................................................................... 119
Corporate Strategy Analysis ................................................................................................................. 122
Vertical Integration ........................................................................................................................... 122
Horizontal integration ....................................................................................................................... 123
Geographic Diversification ................................................................................................................ 127
Issues/Problems.................................................................................................................................... 130
Strategy Recommendations ................................................................................................................. 132
Acquiring Imperial Tobacco .............................................................................................................. 132
Benefits and synergies from the merger: ......................................................................................... 139
Potential Whiteknight: ...................................................................................................................... 141
Business-Functional Strategy Analysis ...................................................................................................... 144
Issues/Problems.................................................................................................................................... 147
Business Level Strategy Recommendations ......................................................................................... 150
Implementing Flexible Manufacturing Systems (FMS) ..................................................................... 151
Better Supply Chain Management Systems ...................................................................................... 151
Roll Out Strategy for the E-cigarette and Snus ................................................................................. 155
Business Level Strategy Summary ........................................................................................................ 158
Strategic Analysis Summary ...................................................................................................................... 158
Bibliography .............................................................................................................................................. 161
Appendices ................................................................................................................................................ 172

5 | P a g e
Executive Summary
Firm Overview – British American Tobacco (BAT)
BAT, founded in 1902, is the world’s second largest tobacco company (excluding the Chinese
Monopoly CNTC) with a market capitalization of $66.7 billion. It produces and markets a diverse range
of brands to suit consumers’ preferences, with a particular focus on its four Global Drive Brands (GDBs),
which are Dunhill, Kent, Lucky Strike and Pall Mall. The Company has over 300 brands in its portfolio
and its brands are sold in over 180 markets.
External Environment Overview
The tobacco industry enjoys a resilient
market for its product. Contrary to most modern
goods, the cigarette as we know it today will not
be easily replaced by advances in technology.
Furthermore, smokers are not tempted to smoke
less in times of economic difficulty or in times of
stress. Therefore, the economic crisis should have little nominal impact on the market for tobacco
products. The social perception of smoking, on the other hand, has changed dramatically since the
Surgeon General’s report in the early 1960’s and a swarm of anti-smoking regulations, bans, and taxes
has ensued in developed countries. The prevalence of smoking has consequently decreased at a
constant rate in these affected countries while this prevalence has increased in developing countries.
This global trend has led to a wave of acquisitions from large Multinational Tobacco Companies,
targeting local companies in developing countries (see adjacent figure).
Industry Analysis

6 | P a g e
The tobacco industry is highly consolidated, the top five international firms accounting for 68.5%
of total sales in year 2007, barriers to entry are therefore relatively high as one should expect heavy
retaliatory behaviour. Cigarette brands enjoy the highest brand loyalty of all consumer products, with
less than 10% of users changing brands annually. Moreover, smokers are addicted to tobacco because it
contains nicotine and the only substitute products available are sold at a significantly higher cost (ie.
nicotine gum, nicotine inhalers, etc.). The tobacco industry functions as a sort of oligopoly with millions
of tobacco leaf suppliers and only few large buyers.
Corporate and Business Level Strategy
Since the market for cigarettes in developed (historically most profitable) countries is shrinking,
BAT’s strategy is to increase margins while maintaining sales volume. The company achieves this by
increasing the price of its products while improving cost efficiency. In line with this, we propose that
BAT acquire Imperial Tobacco, the fourth largest competitor in the market thereby allowing BAT to
overtake Philip Morris International and gain leadership of the industry along with valuable market and
pricing power. BAT should also accelerate its number of acquisitions in emerging economies, thus
gaining an advantage as the markets are shifting towards the global south. BAT’s major weakness in its
current business strategy resides in weak brand positioning, which is critical as today’s cigarette sales
are driven by brands. None of BAT’s brands were able to capture over 1% of the market share whereas
both PMI and JTI have at least 2 brands that have a market share over 1%. BAT must also enhance its
R&D department to counter emerging socio-political trends by focusing on healthier alternatives, such
as snus and the e-cigarette to capture greater market share. BAT should also target R&D efforts towards
operative efficiency by striving to emulate the JTI system of flexible manufacturing to ensure that its
operations are as productive and efficient as possible.

7 | P a g e
Introductory Summary
Firm: British American Tobacco plc. (Public, LON:BATS)
Market Capitalization: $50.5 billion
Description: The Company is an international tobacco company engaged in the sale of cigarettes, cigars,
leaf and other tobacco products. It produces and markets a diverse range of brands to suit consumers’
preferences, with a particular focus on its four Global Drive Brands (GDBs), which are Dunhill, Kent,
Lucky Strike and Pall Mall. Its cigar portfolio includes the handmade Dunhill Signed Range. The Company
has over 300 brands in its portfolio and its brands are sold in over 180 markets.
NAICS: 312221 (Cigarette Manufacturing)
We chose the tobacco industry because of the simplicity of the nature of its product and its
global reach. We are interested to see how the competitive context of this industry is changing as social
perceptions towards smoking shift and anti-smoking regulation gets heavier. British American Tobacco is
the second largest player in this industry, behind Philip Morris International. We chose British American
Tobacco because we all had previous knowledge of many of its brand.
In terms of sources of information that we will use to complete the research, we have found
that Euromonitor International (GMID) provides the most comprehensive data on the tobacco industry.
We intend to use it as our primary database. It contains region specific information on everything from
demographic trends to the regulatory environment and company specific reports. Mergent Online and
Bloomberg are valuable tools when it comes to financial analysis. We intend to use them extensively.
Business Source Online and Factiva provide a wide array of industry specific news and reports that are
useful for understanding the industry’s macro environment.
Our group is comprised of three fourth year Bachelor of International Business students.

8 | P a g e
Gabriel Huppé is an International Investment, Finance, and Banking major who has strong
quantitative skills. He has experience serving both the private and public sector in Canada and abroad
including a recent internship at the Canadian Chamber of Commerce in Japan, work term at Osaka City
Revitalization board, and summer employment in the constituency office of the Hon. Lawrence Cannon
(MP, Minister of Foreign Affairs). Gabriel will be in charge of the North-American region because of his
understanding of the multiple environmental aspects that affect the tobacco industry.
Ricky Sin is a Strategic Management and International Human Resources major who has strong
analytical skill. He is native of Hong Kong and has worked in various Asian countries including Singapore,
Hong Kong and China and has studied in Japan. He has a deep knowledge of Asian culture, business
environment, and trends and will therefore be in charge of the Asian region.
Sunayna Ali is an International Marketing and Trade major who has strong critical thinking and
presentation skills. She has studied in Europe (Madrid, Spain), where she has travelled and studied
extensively. Therefore she will be in charge of the European region, as she has had the opportunity to
adapt to the European lifestyle as well as been exposed to the business environment there.

9 | P a g e
Only 10.8% of total cigarette revenue comes from Africa, the Middle East, and South America.1
Therefore we have chosen to focus our environmental analysis on the most important regions: North-
America, Europe, and Asia.
Macro Environmental Analysis
Foreword
The tobacco industry enjoys a resilient market for its product. Contrary to most modern goods,
the cigarette as we know it today will not be easily replaced by advances in technology due to the
addictive nature of the product. The technological trends that center on new product innovations are
therefore of minor importance compared to those trends which centre around operative efficiency.
Furthermore, smokers are not tempted to smoke less in times of economic difficulty or in times of
stress. So the fact that we are in a global economic crisis should have little nominal impact on the
market for tobacco products, especially because of the fact that as smokers earn less money they do not
smoke less. This point is easily demonstrated through the big five tobacco companies’ performance in
the last six month. As a case in point, British American Tobacco’s stock on the London Stock Exchange
has seen a modest increase in price in the last six months, compared with a 30% decrease for the S&P
500 index for the same period.2 The most important macro trends affecting the tobacco industry are
therefore socio-cultural and political-legal in nature. As will be investigated throughout this paper, these
latter trends pose a significant challenge – a challenge that is expected to endure in the future.
Technological Trends
Trends Centering around Operative Efficiency.
1 GMID. Tobacco: World. 5 June 2008. 4 February 2009
<http://www.portal.euromonitor.com.proxy.library.carleton.ca/passport/ResultsList.aspx>. 2 Google . Google Finance. 23 January 2009. January 2009 <http://www.google.com/finance>.
10 | P a g e
Global Positioning Systems (GPS) and Geographic Information Systems (GIS) Enabled Radio
Frequency Identification Distribution (RFID)
Efficient Cigarette Distribution Systems (CDS) are critical to the success of tobacco companies. It
is essential that CDS strategies continuously adapt to the trends that affect manufacturing and
distribution operations. Cigarette production chains are currently expanding, as tobacco companies are
expanding in ever more remote areas in the midst of specialization in the social division of labor. Hence
it is increasingly difficult to implement efficient CDS.
RFID was first used in the military to complete the input and processing of information by means
of optical visualization without the need for direct contact or manual intervention.3,4 Typical RFID
systems consist of radio frequency labels, readers, and application systems.
Presently, RFID could have two applications in the tobacco industry: logistics and inventory.
RFID automates processes and optimizes supply-chain processes thereby improving efficiency, reducing
mistakes in transport routes, and reducing packaging errors. RFID also enables the optimization of
inventory levels which may reduce costs and enable more flexibility in the production process.5
Using RFID technology integrated with GPS, GIS, and routing technology, tobacco companies
could keep track of cigarette merchandise handling with real-time visual tracking by linking businesses,
distributors, and retailers to their central information systems.6 This could provide significant assistance
in inventory planning. It could also help ensure a safer distribution of cigarettes, and improve the return
on fixed assets, such as transportation equipment. By integrating such a system, tobacco companies
could achieve vast improvements in the operational efficiency of their entire supply chain and enhance
3 Qiang, Qiao. "The Application of RFID ." Modern Information (2005): 150-151.
4 Fallon, M. "Traceability of poultry and poultry products." Revscitech Offint Epiz (2001): 538-546.
5 Hu, Hongchun, et al. "Research on the Application of Radio Frequency Identification in Cigarette-Distribution
Systems." International Conference on Automation and Logistics (2007): 2586-2591. 6 Zhang Danyu, Liaoli. "Logistics System Course." Shandong University Press (2004).

11 | P a g e
their industry competitiveness. It could also facilitate the fight against cigarette contraband (a
threatening trend that will be discussed in the socio-cultural section) since customers could authenticate
their products with the use of encrypted product information contained on RFID labels.
Logistics Information Systems (LIS)
Logistic Information Systems are based on the creation of logistic data warehouses concerning
delivery documents and stock control. It concerns the implementation of a global system. The big five
tobacco companies each operate in over 100 countries, with various local subsidiaries. Many of these
subsidiaries operate on dissimilar systems, and staff at head office need to collect data manually from
the company’s existing management solution. This makes it difficult to efficiently trace or collect
information for purposes such as data entry, balance sheets, sales orders, and the reporting and
analyzing of accounting data. It also creates lengthy administrative processes and obstructs
collaboration between staff on day-to-day projects. All of this affects staff productivity and the quality
and reliability of important data. Presently, most of the big five tobacco companies are integrating
customizable solutions that automatically consolidate data and simplify reporting and analysis
processes. By implementing a collaborative workflow, they can integrate all of their offices and simplify
data entry, consolidation, and information management. They opt for a solution that offers flexibility,
fast deployment but does not require a lot of employee training. Such systems could be based on
AS/400, JD Edwards, Formula Group, or UNIX, among others. And an integrated environment creates a
collaborative workflow for the rest of the subsidiaries. New systems can automatically retrieve and
consolidate business data. Such technological strategies require a massive amount of investment. The
scale of big tobacco companies can make it very difficult to implement LIS. Once implemented,
however, a tobacco company can achieve a significant competitive advantage by reacting to information
rapidly and effectively. This is both a threat and an opportunity.
Manufacturing and Packaging

12 | P a g e
Tobacco companies must optimize the utilization of resources in the manufacturing and
packaging processes. Specifically, by using cutting-edge machinery, they can free manpower from the
process of sampling, better preventative maintenance, and better product hygiene. All of which benefit
the business in tangibly measurable ways. Because of their economies of scale and their ability to spend
more on R&D, the big five tobacco companies have an advantage over their smaller counterparts in this
technical area. This is an opportunity.
Trends Centering around New Product Innovation
The E-cigarette
The e-cigarette is an alternative to the traditional tobacco product. As its name suggests, it is a
battery-powered device that provides inhaled doses of nicotine in the form of vapor. In addition to
nicotine, this vapor also provides a flavor and physical sensation similar to that of inhaled tobacco
smoke. However, no tobacco, smoke, or combustion is involved. Liquid nicotine solutions for electronic
cigarettes are available in different flavors and nicotine concentrations. Some varieties attempt to
resemble traditional cigarette types, such as regular tobacco and menthol, and some even attempt to
mimic specific cigarette brands, such as Marlboro or Camel. Solutions are also available with candy-type
flavoring, such as strawberry, orange, mint, vanilla, caramel, coffee, etc. Toxicological studies of the
electronic cigarettes have been conducted, with some reporting that electronic cigarettes are less
harmful than traditional tobacco cigarettes.7,8 This technology allows users to attain some of the
benefits of smoking wherever they want, since smoking bans are making it more difficult to fulfill their
nicotine craving in public places. A notable example: Crown7 sells their reusable HYDRO e-cigarette at
7 Health New Zealand Ltd Information. The Ruyan E-cigarette. New Zealand, 31 March 2008.
8 Chemical & Engineering News. "Newscripts." Chemical & Engineering News (2008): 56.

13 | P a g e
$79.95 per unit with replacement cartridges, claimed to be the nicotine equivalent of two packs of 20,
that at $10 each.9 This is a threat to the tobacco industry.
The “Healthier” Cigarette
For decades the fast-moving consumer goods and food industries have seen the enhancement
of products through vitamins and other value-added substances. In June 2007, the German Tobacco
Group AG partnered with a US firm that produced vitamin enhanced water to market the world’s first
vitamin-E enhanced cigarette.10 According to the U.S. patent owner and research firm, the vitamin-E
enhanced cigarette features an improved and soothing flavor and also minimizes the irritation that
usually occurs when using conventional cigarettes.11 The new product addresses the international trend
of consumers becoming increasingly aware and more responsible when using tobacco products (as will
be discussed in the socio-cultural section). This is both a threat and an opportunity.
A number of companies are in search of ways to manufacture a safer cigarette by attempting to
lessen the health risks associated with long-term tobacco use. For example, British American Tobacco
markets a cigarette that uses tobacco that is treated to produce lower levels of cancer-causing
chemicals (carcinogens). It also incorporates a new type of filter said to remove more of the remaining
toxins.12 There is talk that BAT is on the verge of developing a “risk free” or low-risk cigarettes, which
some suggest might cut the chance of disease by as much as 90%.13
The Odorless Cigarette
9 Crown7 . Crown7 Announces New HYDRO Electronic Cigarette Product Line . 12 March 2008. January 2009
<http://www.tobacco.org/news/275473.html>. 10
World Tobacco. Vitamin E cigarette by German Tobacco Group . 9 October 2007. January 2009 <http://www.worldtobacco.co.uk/shownews.asp?secid=&pubid=27&nav=1&newstype=0&key=distribution&page=0&newsid=12988>. 11
Lugmayr, Luigi. World's First Vitamin E Cigarette. 21 September 2007. January 2009 <http://www.i4u.com/article11644.html>. 12
Leake, Jonathan. 'Safe cigarette' claimed to cut cancer by 90%. 6 November 2005. January 2009 <http://www.timesonline.co.uk/tol/news/uk/article587130.ece>. 13
Jha, Alok. Tobacco Firm Plays Down Reports of Safer Cigarette. 7 November 2006. January 2009 <http://www.guardian.co.uk/society/2005/nov/07/health.smoking>.
14 | P a g e
Japan Tobacco International is now marketing a cigarette called Mirage which uses LSS (Less
Smoke Smell), an odor-reducing technology developed in response to consumer demands for the
reduction of the unpleasant smell of smoke.14 Their patent states “a method of fixing flavourant, which
improves sidestream smoke smell of tobacco and cigarette.”15 A "smell-improving agent" comprising of
an ethanol or propylene glycol solution would be applied to the cigarette paper. The final cigarette
product uses two-layer cigarette paper that encloses special citrus capsules which considerably reduce
tobacco smell in the air. This is a threat since the patent is owned by another company.
Internet Retailing
The internet sales of tobacco products are gaining popularity. As an example, the American
Lung Association estimates that there are more than 500 websites that sell tobacco products to U.S.
customers.16 Currently, such sales are largely unregulated. Many companies that sell cigarettes online
do not ensure that only adults can enter and purchase from their websites. They don’t check that their
customers pay all customs duties, excise and other taxes. Some of them even sell counterfeit products.
The U.S. Government Accountability Office has reported that three-quarters of all Internet tobacco
sellers explicitly state that they will not report cigarette sales to tax collection officials, thus violating
federal law.17 This is a major threat to the tobacco industry.
Nicotine Replacement Products
There are a number of recently emerging technologies that can temporarily satisfy a smoker’s
urge for nicotine. These include patches, gums, lozenges, inhalers, nasal sprays, and nicotine water,
14 Japan Tobacco. JT to Release New Camel Product Nationwide. 15 February 2007. January 2009
<http://www.jti.co.jp/JTI_E/Release/2007/02/20070213_01.html>. 15
CanWest News Service. Critics raise stink about cigarettes with less tobacco smell. 7 December 2007. January 2009 <http://www.canada.com/topics/news/national/story.html?id=d522153b-fa74-4f2e-a458-bca6df756cb7&k=74191>. 16
American Lung Association . Curbing Internet Sales of Tobacco Products. 2009. January 2009 <http://www.lungusa.org/site/c.dvLUK9O0E/b.3914925/>. 17
IBID.

15 | P a g e
among others. Such have gained popularity in the last decade as a way to help smokers deal with the
withdrawal symptoms of not obtaining nicotine from cigarettes. These products deliver nicotine to the
smoker's brain in a much slower way than cigarettes do. This helps to damp down the urges to smoke
that most smokers have in the early days and weeks after quitting, rather than remove them totally. It
may provide a more comfortable exit from the smoking habit, thus posing a threat.
Economic Environment Trend
North America (US as a Proxy)
In January, forecasting US macro environmental trends, especially those of economic and
political-legal nature, was exceptionally challenging because of the uncertainty surrounding the impacts
of the still developing economic crisis and the inauguration of a new, celebrated, President. Today, it is
still difficult to accurately forecast these trends but there are signs that the economy might rebound,
although remaining relatively bleak, in the near future: consumer spending is growing again, while
inventories are being wound down.18
To recapitulate: In December 2008, the NBER declared that the United States had been in
recession since December 2007, and would continue to plummet further with no end in sight, in what
was being called the worst recession since the Great Depression.19 As of mid-November 2008, it was
estimated that the new loans, purchases, and liabilities of the Federal Reserve, the US Treasury, and
FDIC, brought on by the financial crisis, totaled over $5 trillion.20 To make matters even worse, as of the
same time, the total U.S. federal debt was $10.6 trillion and the current account deficit was $731.2
billion. This dangerous combination of mounting debt and economic turmoil has led many economists to
18 US Economy Could Recover Much Sooner Than Expected. CNBC. 9 April 2009.
<http://www.cnbc.com/id/30111906> 19
Isidore, Chris. “It's official: Recession since Dec. '07.” CNNMoney.com. December 1, 2008 <http://money.cnn.com/2008/12/01/news/economy/recession/?postversion=2008120115> 20
Moyer, Elizabeth. “Washington's $5 Trillion Tab.” Forbes.com. December 11, 2008. <http://www.forbes.com/2008/11/12/paulson-bernanke-fed-biz-wall-cx_lm_1112bailout.html>
16 | P a g e
believe that a dollar crisis is looming. Speculation aside, there is a wide ranging consensus that the next
five years will be marked by declining US global affluence.
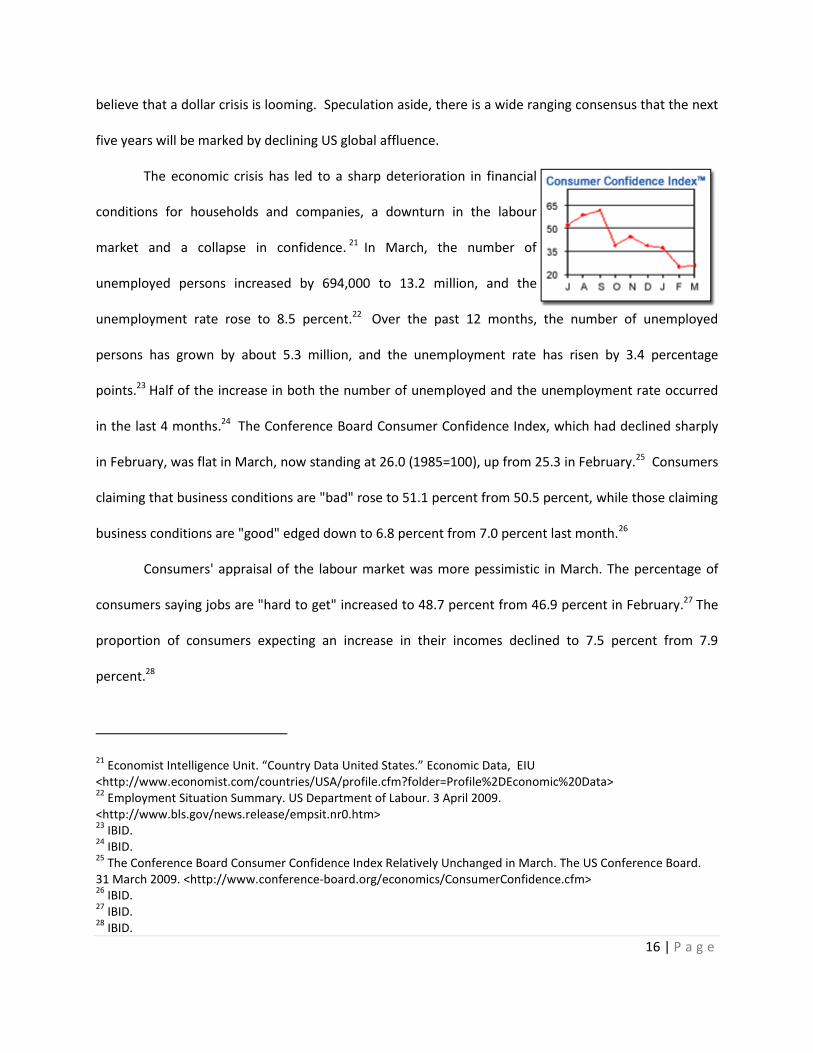
The economic crisis has led to a sharp deterioration in financial
conditions for households and companies, a downturn in the labour
market and a collapse in confidence. 21 In March, the number of
unemployed persons increased by 694,000 to 13.2 million, and the
unemployment rate rose to 8.5 percent.22 Over the past 12 months, the number of unemployed
persons has grown by about 5.3 million, and the unemployment rate has risen by 3.4 percentage
points.23 Half of the increase in both the number of unemployed and the unemployment rate occurred
in the last 4 months.24 The Conference Board Consumer Confidence Index, which had declined sharply
in February, was flat in March, now standing at 26.0 (1985=100), up from 25.3 in February.25 Consumers
claiming that business conditions are "bad" rose to 51.1 percent from 50.5 percent, while those claiming
business conditions are "good" edged down to 6.8 percent from 7.0 percent last month.26
Consumers' appraisal of the labour market was more pessimistic in March. The percentage of
consumers saying jobs are "hard to get" increased to 48.7 percent from 46.9 percent in February.27 The
proportion of consumers expecting an increase in their incomes declined to 7.5 percent from 7.9
percent.28
21 Economist Intelligence Unit. “Country Data United States.” Economic Data, EIU
<http://www.economist.com/countries/USA/profile.cfm?folder=Profile%2DEconomic%20Data> 22
Employment Situation Summary. US Department of Labour. 3 April 2009. <http://www.bls.gov/news.release/empsit.nr0.htm> 23
IBID. 24
IBID. 25
The Conference Board Consumer Confidence Index Relatively Unchanged in March. The US Conference Board. 31 March 2009. <http://www.conference-board.org/economics/ConsumerConfidence.cfm> 26
IBID. 27
IBID. 28
IBID.
17 | P a g e
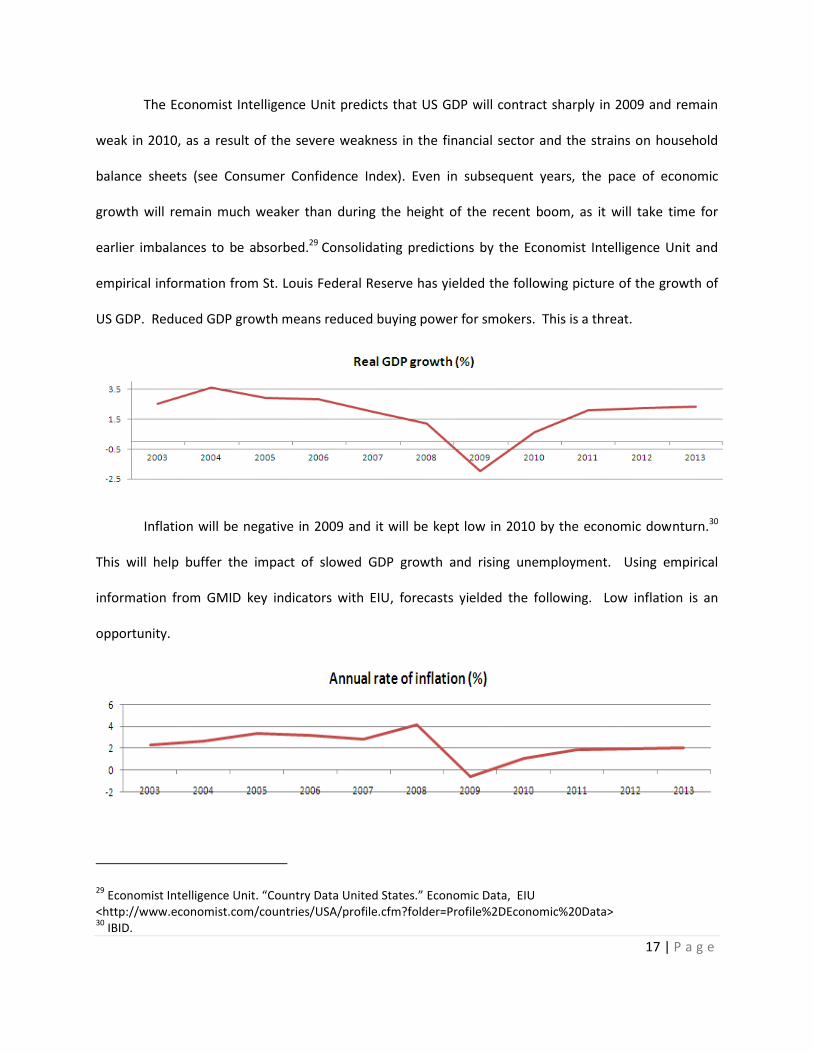
The Economist Intelligence Unit predicts that US GDP will contract sharply in 2009 and remain
weak in 2010, as a result of the severe weakness in the financial sector and the strains on household
balance sheets (see Consumer Confidence Index). Even in subsequent years, the pace of economic
growth will remain much weaker than during the height of the recent boom, as it will take time for
earlier imbalances to be absorbed.29 Consolidating predictions by the Economist Intelligence Unit and
empirical information from St. Louis Federal Reserve has yielded the following picture of the growth of
US GDP. Reduced GDP growth means reduced buying power for smokers. This is a threat.
Inflation will be negative in 2009 and it will be kept low in 2010 by the economic downturn.30
This will help buffer the impact of slowed GDP growth and rising unemployment. Using empirical
information from GMID key indicators with EIU, forecasts yielded the following. Low inflation is an
opportunity.
29 Economist Intelligence Unit. “Country Data United States.” Economic Data, EIU
<http://www.economist.com/countries/USA/profile.cfm?folder=Profile%2DEconomic%20Data> 30
IBID.

18 | P a g e
The US dollar is expected to remain at around US$1.30-1.40:€1 in coming years, which is a
significant recovery from its estimated average of US$1.47:€1 in 2008.31 Using data from EIU and
OANDA, FXHistory has yielded the following. An expensive US dollar translates into higher profits for
non-US tobacco firms, since US smokers pay more in terms of foreign currency for their product. This is
an opportunity because it increases BAT’s revenue.
Europe (The European Union as a Proxy)
The European Union (EU), which has currently integrated 27 countries, aspires to bring its
citizens peace, prosperity and freedom.32 Since the amalgamation, it has indeed been prosperous and
successful. This is evident when assessing its single market, adoption of the Euro, incorporation of an
economic and monetary union and enlargement into eastern European countries.
The European Union’s Gross Domestic Product (GDP) (purchasing power parity) as of 2008 was
$14.82 trillion.33 However, the economic growth rate has been decelerating in the EU since early 2007.
This slow down seems to have been caused by rising oil prices and the aggravation of financial
circumstances.34 The European GDP growth rate, which has been generally rising, has been forecasted
31 IBID.
32 Europa. Panorama of the European Union. 2009. January 2009
<http://europa.eu/abc/panorama/index_en.htm>. 33
Central Intelligence Agency. European Union. 2 April 2009. 1 April 2009 <https://www.cia.gov/library/publications/the-world-factbook/geos/ee.html>. 34
International Monetary Fund. "Country and Regional Perspectives." 2008. International Monetary Fund. 31 March 2009 <http://www.imf.org/external/pubs/ft/weo/2008/02/pdf/c2.pdf>.

19 | P a g e
to drop dramatically from 2.8% in 2007 to 0.9% in 2008.35 The GDP per capita in 2008 was $33,400;
however, the EU is currently having trouble concocting and implementing policies amongst its states,
due to the fact that they greatly differ in per capita income ($7,000 to $69,000).36 These are both seen
to be threats.
Source: Economic Intelligence Unit
Inflation
An area of specific interest is inflation. As international commodity prices increased, inflation
climaxed to 4% in mid-2008. However, with the economy slowing down, the rate dropped to 2.1% in
November. It is also estimated that it will keep dropping in 2009.37 This is a definite opportunity in the
market, as in the US, lower inflation will help buffer the impact of slower GDP growth and rising
unemployment.
35 Economist Intelligence Unit. Country Report - European Union . March 2009. 9 April 2009
<http://www.eiu.com.proxy.library.carleton.ca/index.asp?layout=displayIssueArticle&issue_id=1814375966&opt=full>. 36
Central Intelligence Agency. European Union. 2 April 2009. 1 April 2009 <https://www.cia.gov/library/publications/the-world-factbook/geos/ee.html>. 37
Economist Intelligence Unit. Country Report - European Union . March 2009. 9 April 2009 <http://www.eiu.com.proxy.library.carleton.ca/index.asp?layout=displayIssueArticle&issue_id=1814375966&opt=full>.
-5
0
5
2003 2004 2005 2006 2007 2008* 2009* 2010* 2011e
Real GDP Growth Rate (%)

20 | P a g e
Asia (Japan as a Proxy)
Japan’s GDP as of 2008 was 4.348 trillion.38 It is the third largest economy in the world, just after
China and US. When the global financial crisis hit Japan; this led the import sector’s sales to decline due
to the rise of the yen’s value and slow down of the world economy.39 Export and investment, the main
engines of economic growth in 2002-07, have now become the weakest components of the GDP. The
economy of Japan currently continues to decline, such that the GDP forecast for Japan in 2009 is said to
contract by 6.4%.40 The current economic conditions in Japan have created a threat to local businesses
in that many of them have had to stop their plans for capital investment, especially when credit is
tightening.41 At the same time, private consumption has and will continue to be constricted by falling
wages and an increase in unemployment. In 2009, the private consumption is predicated to shrink by
1.6%.42 This also creates a threat to the industry.
38 Central Intelligence Agency. Japan. 2 April 2009. 1 April 2009 < https://www.cia.gov/library/publications/the-
world-factbook/geos/ja.html l>. 39
The Japan Times. "Financial crisis hits home." 12 November 2008. The Japan Time Online. 22 01 2009 <http://search.japantimes.co.jp/cig-bin/ed20081112a1.html>. 40
Economist Intelligence Unit. “Country Data Japan.” Economic Data, EIU 41
IBID. 42
IBID.
0
1
2
3
4
2003 2004 2005 2006 2007 2008 2009* 2010* 2011e
Consumer Price Inflation

21 | P a g e
Unlike other countries, the financial crisis has heavily impacted Japan’s exchange rate. The
global financial meltdown, since September, has led to a strengthening of the yen against all other major
currencies. The key reason for this is that investors across the globe are deleveraging and reducing their
risk exposure (by opting for the safest liquid assets that they can find) in huge volumes.43 As the
Japanese Yen is one of the safest currencies, vast amounts of loans have been lent, in Yen, over the past
few years to foreign markets. As a result, the demand for the yen is surging. 44
The strengthening of the Yen has created a major threat for domestic manufacturers, while
creating an opportunity to foreign manufacturers. As the Yen strengthens against all major currencies,
such as the USD and the Euro, the cost to import tobacco products will decrease relatively, in
comparison to the past. In other words, the product margin for importing cigarettes into Japan will
increase compared to the domestic product that has remained stable. Therefore, it creates an
opportunity for foreign firms to increase their revenue.
43 Economist Intelligence Unit(EIU). Japan--country report. Country Report. United Kingdom: EIU, 2009.
44 IBID.
-4
-2
0
2
4
2003 2004 2005 2006 2007 2008 2009 2010 2011
Real GDP Growth
Source: EIU. 2008
100
120
140
160
180
2003 2004 2005 2006 2007 2008 2009 2010
Exchange rate Yen:Euro

22 | P a g e
Socio-Cultural Environment Trend
North America (US as a Proxy)
Social Attitudes towards Tobacco Consumption
Customers are increasingly drawn to
businesses and products that are green, organic,
natural, clean and sustainable. According to the
2007 ImagePower Green Brands Survey, “nearly all
Americans display green attitudes and behaviours
versus a year ago; when asked what their
perceptions were of green brands, respondents said
they are often seen as better quality, though at a higher cost.” Current research suggests that 72% of
the US population believes that smoking one or more packs of cigarettes a day is a great health risk.45 In
line with this popular mindset there have been many court filings, state laws, and public health
awareness campaigns around smoking that have resulted in negative social attitudes to smoking in the
US. This has led to a resilient decline in cigarette consumption. As a result, over the past 40 years, the
prevalence of smokers in the United States has declined
sharply, from 42% in 1965 to 20% today.46,47 This is a threat.
Youth Demographics
45 StateMaster. “Perception of Cigarette Smoking Risk (most recent) by state” Office of Applied Studies. January 10,
2008. <http://www.statemaster.com/graph/hea_per_of_cig_smo_ris-health-perception-cigarette-smoking-risk> 46
Government Printing Office. “Cigarette smoking and health characteristics: United States” . Vital and health statistics. Series 10. No. 34. Center for Disease Control and Prevention. July 1964–June 1965. <http://www.cdc.gov/nchs/data/series/sr_10/sr10_034acc.pdf> 47
Heyman KM, Schiller JS, Barnes P. “Early release of selected estimates based on data from the 2007 National Health Interview Survey.” National Center for Health Statistics, June 2008. <http://www.cdc.gov/nchs/about/major/nhis/released200806.htm.>
23 | P a g e
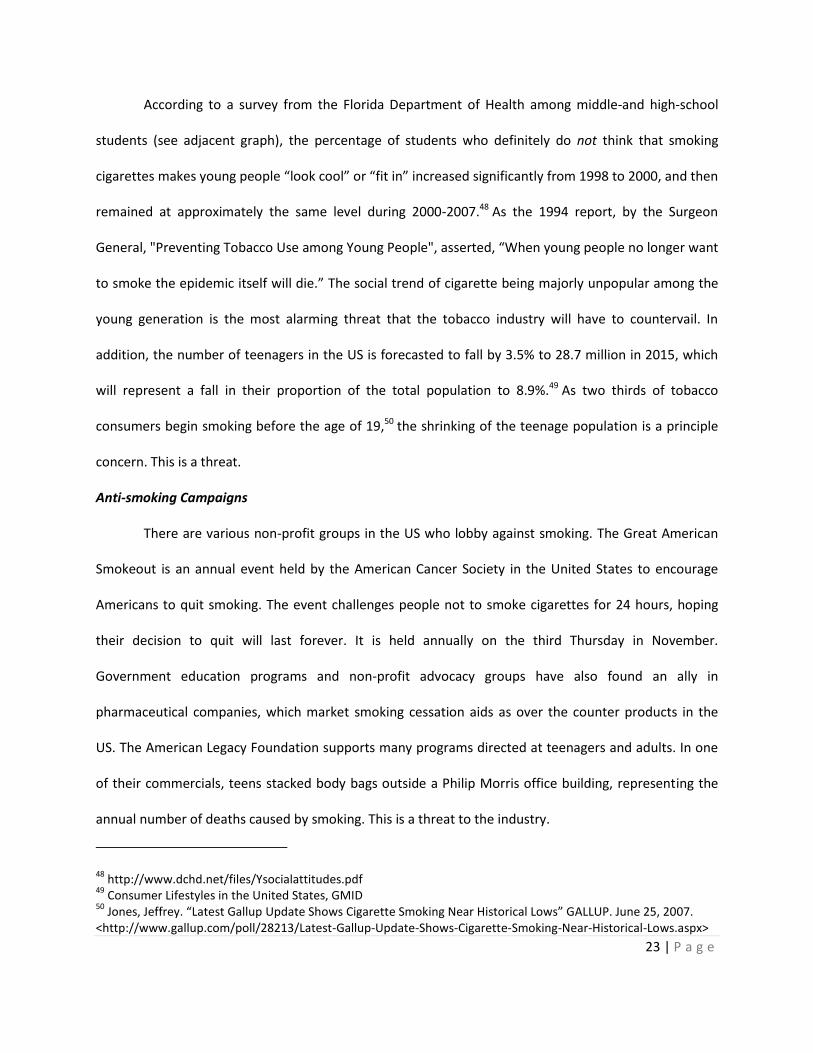
According to a survey from the Florida Department of Health among middle-and high-school
students (see adjacent graph), the percentage of students who definitely do not think that smoking
cigarettes makes young people “look cool” or “fit in” increased significantly from 1998 to 2000, and then
remained at approximately the same level during 2000-2007.48 As the 1994 report, by the Surgeon
General, "Preventing Tobacco Use among Young People", asserted, “When young people no longer want
to smoke the epidemic itself will die.” The social trend of cigarette being majorly unpopular among the
young generation is the most alarming threat that the tobacco industry will have to countervail. In
addition, the number of teenagers in the US is forecasted to fall by 3.5% to 28.7 million in 2015, which
will represent a fall in their proportion of the total population to 8.9%.49 As two thirds of tobacco
consumers begin smoking before the age of 19,50 the shrinking of the teenage population is a principle
concern. This is a threat.
Anti-smoking Campaigns
There are various non-profit groups in the US who lobby against smoking. The Great American
Smokeout is an annual event held by the American Cancer Society in the United States to encourage
Americans to quit smoking. The event challenges people not to smoke cigarettes for 24 hours, hoping
their decision to quit will last forever. It is held annually on the third Thursday in November.
Government education programs and non-profit advocacy groups have also found an ally in
pharmaceutical companies, which market smoking cessation aids as over the counter products in the
US. The American Legacy Foundation supports many programs directed at teenagers and adults. In one
of their commercials, teens stacked body bags outside a Philip Morris office building, representing the
annual number of deaths caused by smoking. This is a threat to the industry.
48 http://www.dchd.net/files/Ysocialattitudes.pdf
49 Consumer Lifestyles in the United States, GMID
50 Jones, Jeffrey. “Latest Gallup Update Shows Cigarette Smoking Near Historical Lows” GALLUP. June 25, 2007.
<http://www.gallup.com/poll/28213/Latest-Gallup-Update-Shows-Cigarette-Smoking-Near-Historical-Lows.aspx>
24 | P a g e
Contraband and Counterfeit Cigarettes
The trade in counterfeit cigarettes is a rapidly growing problem. And it costs tobacco
manufacturers hundreds of millions of dollars each year.51 It is impossible to know exactly how many
illicit cigarettes are bought each year since it is an illegal market, but the numbers are significant. As an
indication, the U.S. Bureau of Customs and Border Protection at the Port of Los Angeles recently seized a
shipment of 47,378 counterfeit Marlboro cartons.52 Philip Morris USA has under covered 30 such US
cases in the past four years!53 Since 2002, PM USA has identified the existence of contraband cigarettes
at retail outlets in 44 states and the District of Columbia.54 This is a significant threat to the industry.
Smokeless Snus
The smokeless snus is increasing in popularity in developed countries, while cigarettes are
declining in popularity.55 A snus is a form of tobacco that isn’t smoked. It consists of finely ground
tobacco that is packaged in tiny sachets. These tobacco filled sachets are placed under the upper lip. A
snus contains nicotine in similar quantities to cigarettes. Each sachet contains from 0.4 to 1.5 grams of
tobacco and is held in the mouth, without chewing or sucking.56 It is acknowledged by several
independent health experts to be at least 90 per cent less harmful than smoking cigarettes.57 A
particular review suggests that snus is notably less harmful to health than cigarettes, and that, in
Sweden, snus has served as a pathway away from smoking, rather than a gateway to smoking among
51 Philip Morris International Management SA. “The trade in fake cigarettes” Philip Morris International. Accessed
on January 20, 2008. <http://www.philipmorrisinternational.com/PMINTL/pages/eng/busenv/Counterfeiting.asp> 52
Philip Morris USA Media Relations. “Philip Morris USA Files Additional Lawsuits to Stop Importation of Counterfeit Cigarettes” Philip Morris USA. April 9, 2008. <http://www.philipmorrisusa.com/en/cms/Media/Company_Announcements/2008/Philip_Morris_USA_Files_Additional_Lawsuits_to_Stop_Importation_of_Counterfeit_Cigarettes.aspx?src=search> 53
IBID. 54
IBID. 55
GMID. “Tobacco – World.” 2007. 56
http://www.bat.com/group/sites/uk__3mnfen.nsf/vwPagesWebLive/DO6CKJNP?opendocument&SKN=1 57
http://www.bat.com/group/sites/uk__3mnfen.nsf/vwPagesWebLive/DO6CKJNP?opendocument&SKN=1

25 | P a g e
Swedish men.58 In Sweden particularly, snus gained popularity from the 1970s and overtook cigarettes
by the mid 1990s. There is a ban on snus in certain areas of the EU, claiming that it could appeal to
youth. Snus is an appealing alternative to cigarettes because it offers the same benefits of tobacco
without the harm of second-hand smoke. There is a widening market for this product among smokers
who concentrate in public areas where smoking is banned. Snus is more appealing than chewing
tobacco because of the ease of disposability that it offers. Snus maintains its composure, eliminating the
need to spit and facilitating its disposition.
Europe (The European Union as a Proxy)
According to the World Health Organization, there are about 606 billion cigarettes consumed by
Western Europeans every year59. It is also estimated that second-hand smoke killed 79,000 EU citizens
in 2006.60 However, trends in smoking related deaths are decreasing. In 2005, 30% of deaths were
attributable to smoking. This range varies from country to country as well as between genders. In 2006,
32% of Europeans were smokers, and 21% used to smoke; the majority of the smokers smoked
packaged cigarettes, these numbers are not taking much change. This is an opportunity as it often
means that the market is stable and consistent. It is said that 85% of Europeans who smoke, smoke
regularly, whereas only a mere 14% smoke occasionally.61 This is an opportunity to the industry, for as
most smokers smoke regularly, they are purchasing more cigarettes.
Socio-Economic Inequalities
58 Effect of smokeless tobacco (snus) on smoking and public health in Sweden: J. Foulds, L. Ramstrom, M. Burke, K.
Fagerstrom. Review, Tobacco Control, 2003. 59
World Health Organization. Cigarette Consumption. 2007. 2 April 2009 <http://www.who.int/tobacco/en/atlas8.pdf>. 60
Diethelm, Pascal and Martin Mckeen. Lifting the Smokescreen. France, February 2006. 61
European Comission. Attitudes of Europeans towards Tobacco. May 2007.

26 | P a g e
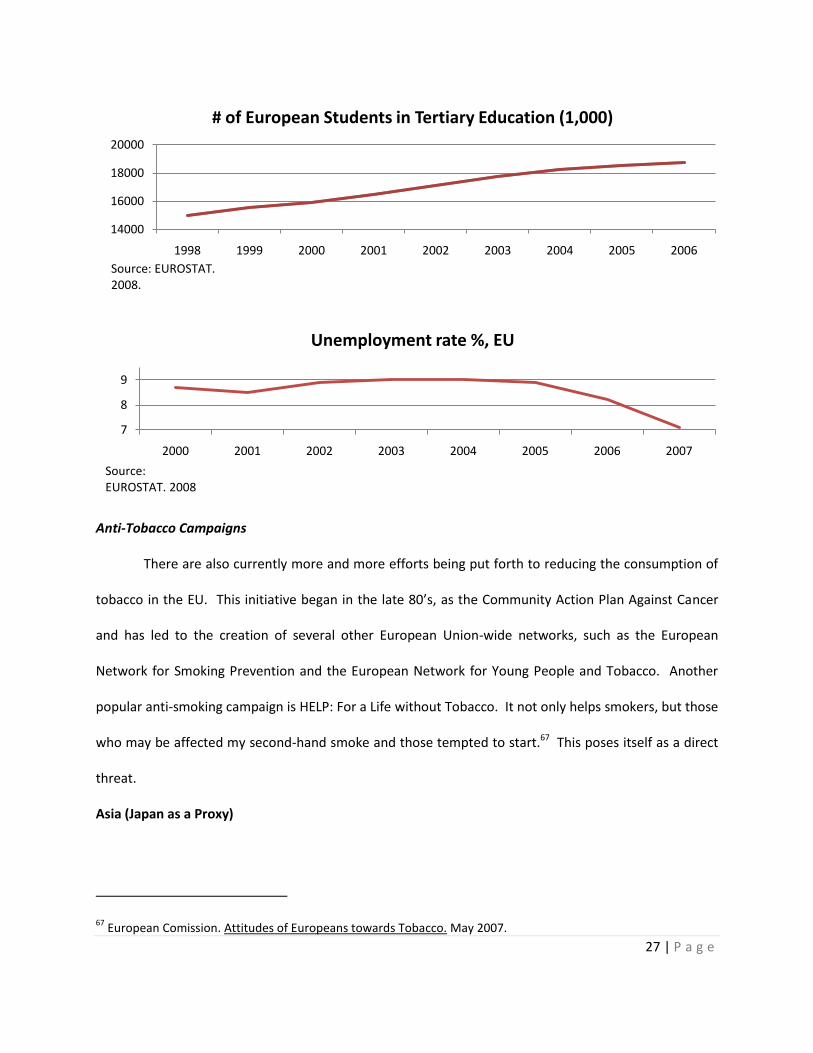
In general, women smoke less than men in the EU, but the number of women smokers are on
the rise, which is a definite opportunity. Smoking is also more popular amongst younger generations
than older ones; European youth have the highest smoking rates in the world. This may pose itself as a
threat because the European population is aging.62 Trends also show that smoking is more prevalent in
those who are less educated and that those with lower education levels are less likely to quit than those
with higher education levels63; this may also be seen as a threat, as more and more Europeans are now
heading towards higher education.64 There is also a higher rate of smokers amongst lower socio-
economic classes.65 The unemployed are 91% more likely to smoke regularly, which is a threat as
unemployment has decreased over the past few years.66
62 European Commission. EuroStat. 2009. January 2009
<http://epp.eurostat.ec.europa.eu/portal/page?_pageid=1996,45323734&_dad=portal&_schema=PORTAL&screen=welcomeref&open=/t_popula/t_pop/t_demo_pop&language=en&product=REF_TB_population&root=REF_TB_population&scrollto=160>. 63
European Union Public Health Information System. Smoking policies. 14 April 2008. January 2009 <http://www.euphix.org/object_document/o4899n27110.html>. 64
European Commission. EuroStat. 2009. January 2009 <http://epp.eurostat.ec.europa.eu/portal/page?_pageid=1996,45323734&_dad=portal&_schema=PORTAL&screen=welcomeref&open=/t_popula/t_pop/t_demo_pop&language=en&product=REF_TB_population&root=REF_TB_population&scrollto=160>. 65
European Union Public Health Information System. Smoking policies. 14 April 2008. January 2009 <http://www.euphix.org/object_document/o4899n27110.html>. 66
Scott, Andrew G. Economic Survey of Western Europe and the European Union. April 2009. April 2009 <http://www.europaworld.com.proxy.library.carleton.ca/entry/we.essay.4>.
64
66
68
70
2000 2001 2002 2003 2004 2005 2006 2007
% Population aged 25 to 64 with at least upper secondary education, EU
Source: EUROSTAT. 2008
27 | P a g e
Anti-Tobacco Campaigns
There are also currently more and more efforts being put forth to reducing the consumption of
tobacco in the EU. This initiative began in the late 80’s, as the Community Action Plan Against Cancer
and has led to the creation of several other European Union-wide networks, such as the European
Network for Smoking Prevention and the European Network for Young People and Tobacco. Another
popular anti-smoking campaign is HELP: For a Life without Tobacco. It not only helps smokers, but those
who may be affected my second-hand smoke and those tempted to start.67 This poses itself as a direct
threat.
Asia (Japan as a Proxy)
67 European Comission. Attitudes of Europeans towards Tobacco. May 2007.
14000
16000
18000
20000
1998 1999 2000 2001 2002 2003 2004 2005 2006
# of European Students in Tertiary Education (1,000)
Source: EUROSTAT. 2008.
7
8
9
2000 2001 2002 2003 2004 2005 2006 2007
Unemployment rate %, EU
Source: EUROSTAT. 2008

28 | P a g e
In Japan, there are three major social trends that are affecting the cigarette industry: the aging
population, changing tastes and changes in the consumer segments.
Aging population
The aging population is one of the
most serious problems in Japan. This is
caused by lower birth rates and longer life
expectancies. In the year 2050, about 40%,
of the Japanese population will be 65 or older
compared to 2008, where around 25% of the
population was 65 or older. 68 The aging
population has two major affects on society.
The first is that with the increase in retired
workers, the current government will
experience trouble supporting the current
pension plans in place. The current debt of
the government already sits at $849 trillion;
to accommodate this, the government will
have to find new sources of revenue.69 One possible way to generate this income is to increase cigarette
sales taxes. In order words, this will create a threat to the industry, for an increase in taxes of cigarettes,
will decrease the sales margins. Secondly, the aging population has increased health awareness in the
68 Yamaguchi, Mari. One Fifth of Japanese population age 65 or Older in Rapidly aging Japan. 20 May 2008. 22 01
2009 <http://www.globalaging.org/elderrights/world/2008/japan.htm>. 69
Tabuchi, Hiroko. "Japan eyes new cigarette tax." The Wall Street Journal (2008).

29 | P a g e
society and has put smokers under greater pressure to quit smoking.70 This also presents itself as a
threat to the industry, as an increase in health awareness will inevitably lead to a decrease in demand
for cigarettes.
Changing taste and shift in consumer segments
Health awareness is not only a popular topic amongst the aging population, but also in the
younger generation as well. There is a trend of a shifting in preference towards tar levels. Smoking
cigarettes with high levels of tar is considered to be out of fashion and chauvinistic for the new
generation.71 In 2008, ultra low-tar cigarette sales overtook mid-tar cigarettes to become the biggest
category in sales, in Japan. It is forecasted that in 2012, the ultra low tar cigarettes are expected to
account for 31% share of retail volume sales. Moreover, there is also a trend stating that more smokers
prefer using premium products. This presents an opportunity to the industry which would allow
companies to develop new products to capture this part of the market share.
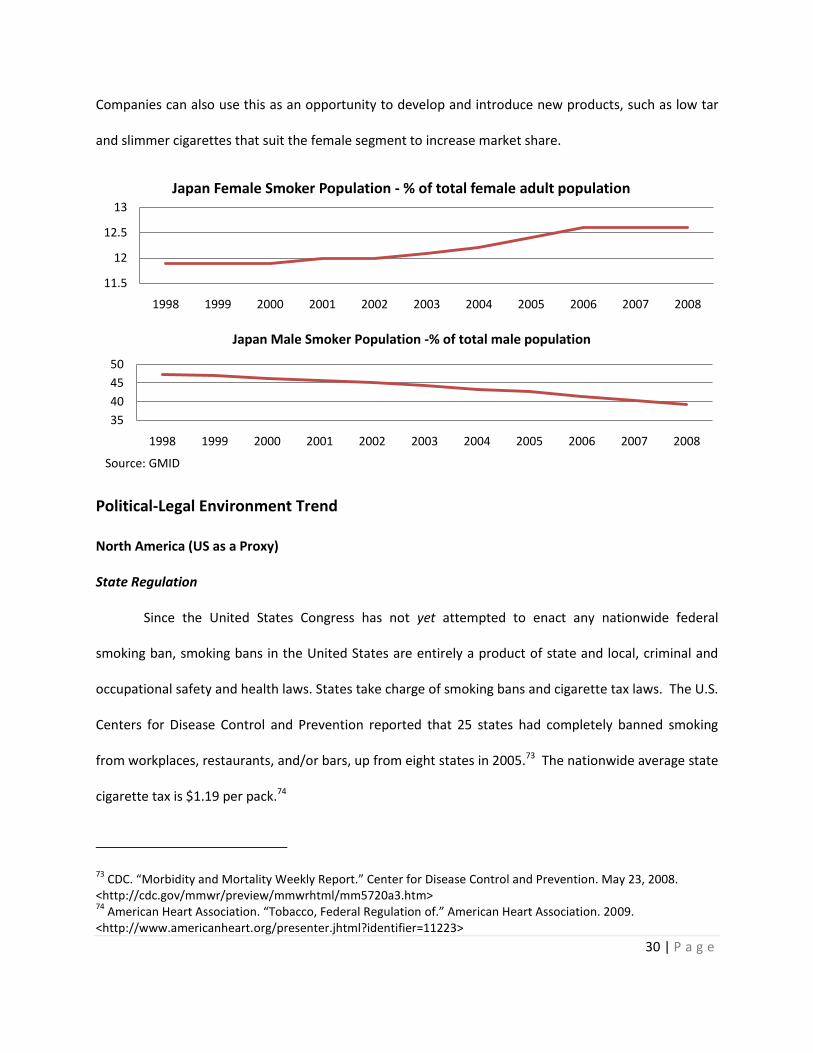
Furthermore, there is a trend in the market showing that the number of female smokers is
increasing, while the number of male smokers is decreasing.72 In other words, this is both an
opportunity and a threat for the industry, as the needs of female and male smokers are different.
70 GMID. "Consumer lifestyles--Japan." Country Report. 2006.
71 GMID. "Tobacco-Japan." Country Report. 2008.
72 IBID.
242526272829
1998 1999 2000 2001 2002 2003 2004 2005 2006 2007 2008
Japan Total Smoker Population -% of total adult population
Source: GMID
30 | P a g e
Companies can also use this as an opportunity to develop and introduce new products, such as low tar
and slimmer cigarettes that suit the female segment to increase market share.
Political-Legal Environment Trend
North America (US as a Proxy)
State Regulation
Since the United States Congress has not yet attempted to enact any nationwide federal
smoking ban, smoking bans in the United States are entirely a product of state and local, criminal and
occupational safety and health laws. States take charge of smoking bans and cigarette tax laws. The U.S.
Centers for Disease Control and Prevention reported that 25 states had completely banned smoking
from workplaces, restaurants, and/or bars, up from eight states in 2005.73 The nationwide average state
cigarette tax is $1.19 per pack.74
73 CDC. “Morbidity and Mortality Weekly Report.” Center for Disease Control and Prevention. May 23, 2008.
<http://cdc.gov/mmwr/preview/mmwrhtml/mm5720a3.htm> 74
American Heart Association. “Tobacco, Federal Regulation of.” American Heart Association. 2009. <http://www.americanheart.org/presenter.jhtml?identifier=11223>
11.5
12
12.5
13
1998 1999 2000 2001 2002 2003 2004 2005 2006 2007 2008
Japan Female Smoker Population - % of total female adult population
35
40
45
50
1998 1999 2000 2001 2002 2003 2004 2005 2006 2007 2008
Japan Male Smoker Population -% of total male population
Source: GMID
31 | P a g e
Tobacco Advertising
Tobacco advertising is regulated by the federal Cigarette Labelling and Advertising Act of 1965
and advertisements for cigarettes, like any other ads, are scrutinized under Section 5 of the FTC Act.
There are severe restrictions on advertising and packaging for cigarette manufacturers. The Tobacco
Master Settlement Agreement (MSA) places restrictions on tobacco product marketing, including a ban
on all outdoor advertising; transit advertising; the promotion of tobacco products in films and TV shows;
brand name sponsorship of team sports or other events with a significant youth audience; and the use
of cartoons in the advertising, promotion, packaging, or labelling of tobacco products (as youth are
particularly vulnerable to these).75 This is a threat.
Tobacco Packaging
The Comprehensive Smoking Education Act of 1984 requires that Surgeon General's Warnings
be printed on cigarette packages76. An example of these is "cigarette smoke contains carbon monoxide".
In July 2004, the Senate passed a bill that would make the health warnings larger, with more details
concerning the health risks of smoking. The House of Representatives is expected to approve the bill
before these changes become effective. This is a threat.
Cigarette Chemical Content
The Federal Trade Commission (FTC) also ensures a strict cap on cigarette chemical contents by
regularly testing for tar and nicotine through its outdated 1966 Cambridge Filter Method. As seen in the
current developments below, this regulation is being revised to ensure tighter control of cigarette
content. This is a threat.
Current Legal Developments
75 National Association of Attorneys General. "Master Settlement Agreement." National Association of Attorneys
General. 2008-07-30. < http://www.naag.org/backpages/naag/tobacco/msa/msa pdf/1109185724_1032468605_cigmsa.pdf> 76
Gochman. “Handbook of Health Behavior Research IV” Kluwer Academic Publishers. 2001

32 | P a g e
The FTC has long advocated for the development of a new test for tar and nicotine and has
sought assistance from the scientific community to determine what changes should be made to the
testing method.77 As a result, many have urged the reintroduction of S. 625, the Family Smoking
Prevention and Tobacco Control Act.78 The bill would allow the FDA, which has lacked any authority in
this area for decades, to regulate tobacco products. The bill would authorize FDA scientists to track,
analyze, and regulate the components of tobacco products. If such a bill is passed, the FDA would be
allowed to issue certain regulations concerning tar and nicotine yields, including requirements governing
the methodology for determining tar and nicotine yields and the public disclosure of information about
such yields or other constituents of tobacco smoke. The bill would also coordinate the FTC and the FDA
in enforcing labelling and marketing requirements. It is expected that such legislation will be supported
by the Obama administration. This is a threat.
The Obama Presidency
Barack Obama was inaugurated on January 20th 2008, as the first black president. The event
marks not only the installation of a widely acclaimed Democratic President, but also the leave of an
unpopular Georges W. Bush, as Republican President. This transition in US presidency is a momentous
event. According to experts, “the election of President Obama changes everything *…+ the year 2009 has
the potential to be the most historic year in making progress on tobacco at the federal level since the
first surgeon general’s report in 1964.”79 Quick action is expected on Food and Drug Administration
(FDA) regulation along with a 60% federal tax increase on tobacco and ratification of the above
77 Federal Trade Commission. “Prepared Statement of the Federal Trade Commission Before the Committee on
Commerce, Science, and Transportation, United States Senate” Federal Trade Commission. November 13, 2007, <http://www.ftc.gov/os/testimony/P064508tobacco.pdf> 78
Pamela Jones Harbour. “CONCURRING STATEMENT OF COMMISSIONER PAMELA JONES HARBOUR” Federal Trade Commission. November 26, 2008. < http://www.ftc.gov/os/2008/11/P944509cambridgefiltermethodharbourstmnt.pdf> 79
Wilson, Duff. “Democrats Plan an Early Push Against Tobacco.” New York Times. January 6, 2009. < http://www.nytimes.com/2009/01/06/business/06smoke.html>

33 | P a g e
Framework Convention.80 The proposed H.R. 1108 FDA legislation would set up a new office to deal
especially with tobacco, financed entirely by new industry fees. It also would allow further restraints on
sales and marketing to young people and provide for stronger warning labels, similar to ones in Canada
with graphic depictions of smoking-related illnesses.81 This is a threat.
Besides Obama’s direct impact on cigarette manufacturers, there are various political trends
that can be expected to have indirect effects on the tobacco industry. Contrasted with defunct President
Bush, President Obama seems to be more socially conscious. The Sierra Club has described Obama as
having a "strong record of support for clean air, wetlands protection, and clean energy." Obama believes
that the burning of fossil fuels has contributed significantly to global warming.82 Such a liberal view on
social issues will have a strengthening effect on the US collective social consciousness, of which cigarette
smoking is unfavorably perceived. This is a threat.
President Obama has been quoted saying “I think we need to rethink and decriminalize our
marijuana laws.”83 His campaign says that "he does not believe in legalization of marijuana, but agrees
with President Bush that long minimum sentences for first-time drug users may not be the best way to
occupy jail space or heal people from their disease."84 A temporary decrease in cigarette consumption is
to be expected as marijuana laws become more lenient.85 This is a threat.
Obama's health care plan includes implementing guaranteed eligibility for affordable health care
for all Americans, paid for by insurance reform, reducing costs, removing patent protection for
80 IBID.
81 IBID.
82 Willet, David. “Sierra Club Endorses Obama for President Joins United Steelworkers in Call for Clean Energy
Future” Sierra Club. June 19, 2008. <http://www.sierraclub.org/pressroom/releases/pr2008-06-19.asp> 83
WashingtonTimes.com “Obama: Decriminalize pot” The Washington Times. January 31, 2008. < http://www.washingtontimes.com/news/2008/jan/31/obama-decriminalize-pot/> 84
IBID. 85
Study relates marijuana and tobacco use. Yale Daily News. 19 January 2005. <http://www.yaledailynews.com/articles/view/12772?badlink=1>

34 | P a g e
pharmaceuticals, and required employer contributions.86 Such a policy will reduce healthcare costs for
cigarette smokers. However, it is also expected that the federal government will be more interested in
halting smoking prevalence in order to cut down health costs. This is both an opportunity and a threat.
Europe (The European Union as a Proxy)
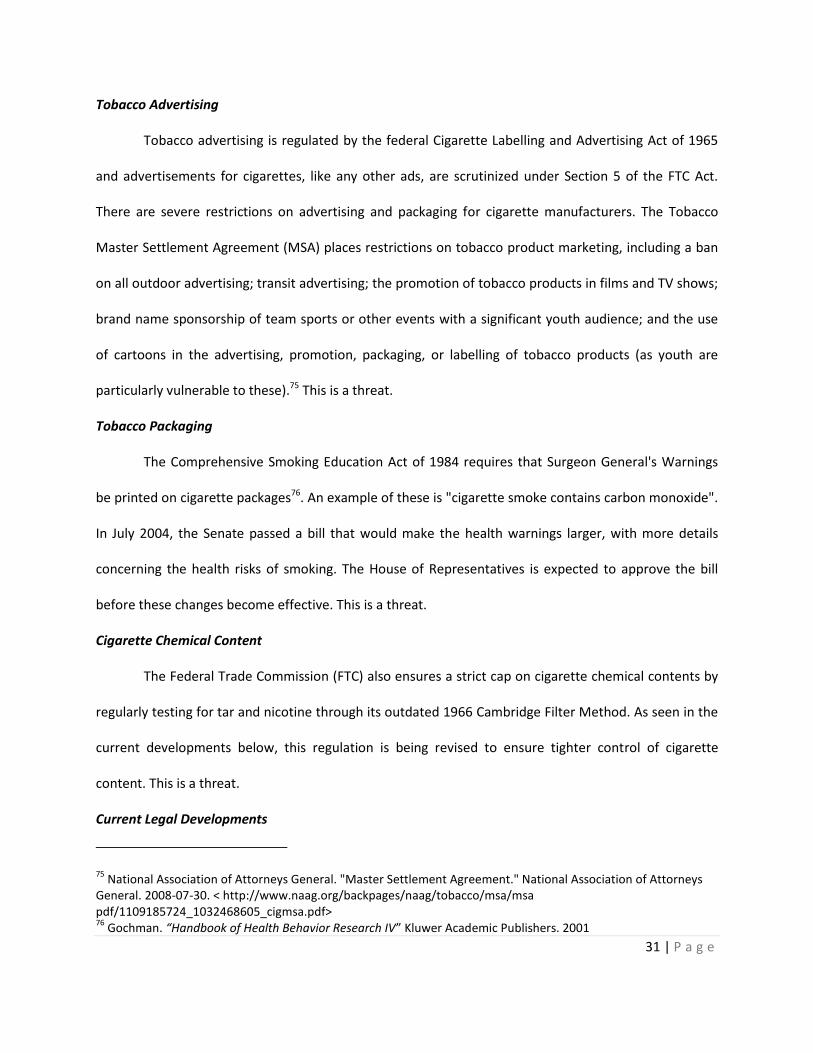
Cigarette Distribution Restrictions
The EU has come a long way in trying to prevent smoking within its boundaries. There have
been many laws, regulations as well as bans passed to ensure that citizens are leading a healthier and
longer life; and that nonsmokers are not impacted by the habits of those who do smoke. The EU has
banned the distribution of tobacco products, for the most part (80%), by way of single or unpacked
cigarettes and free samples. About 25% of the EU has banned the sale of cigarettes through vending
machines, but almost 60% have restricted it. Mail order or Electronic sales, along with the sale of duty
free tobacco, have also been restricted by nearly 90% of the EU. The majority have absolutely no
restriction on self-service displays.87 Restrictions on the sale of cigarettes definitely are a threat because
it limits their availability to the public.
86 Barack Obama. “Health Care.” Barrack Obama and Joe Biden. Januray 27, 2008.
<http://www.barackobama.com/issues/healthcare/> 87
World Health Organization Regional Office for Europe. Data and Publications. 2009. April 2009 <http://data.euro.who.int/tobacco/?TabID=93302>.
35 | P a g e
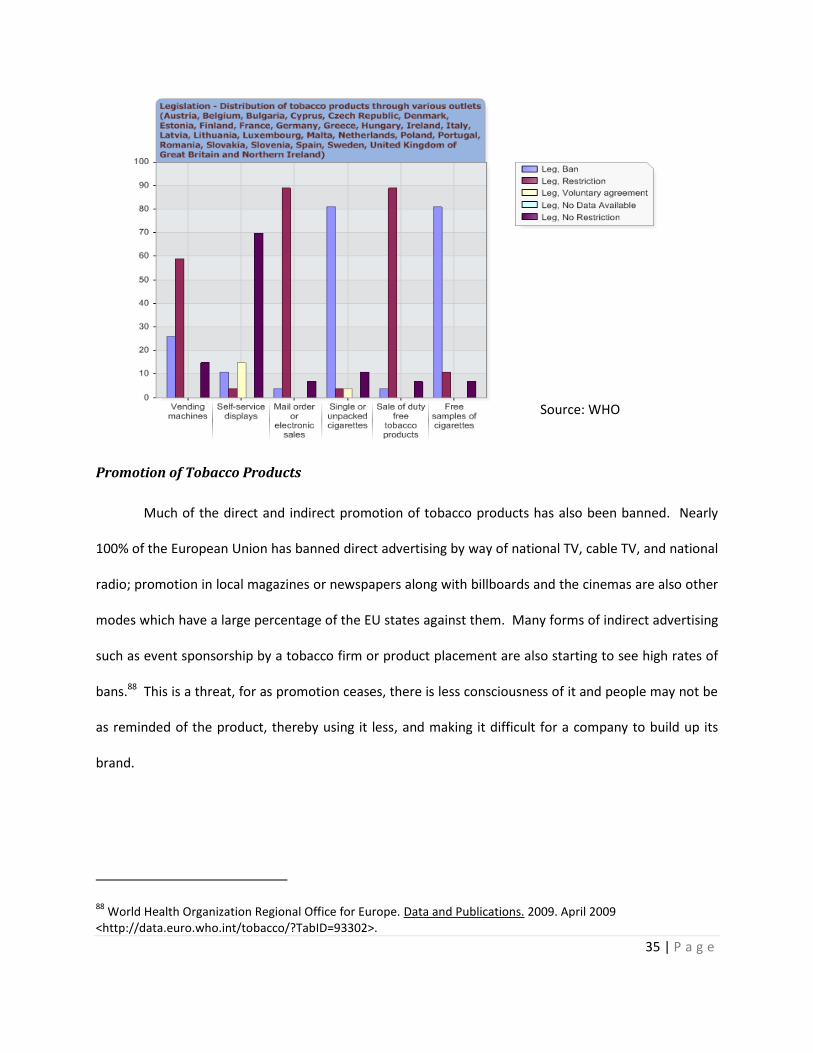
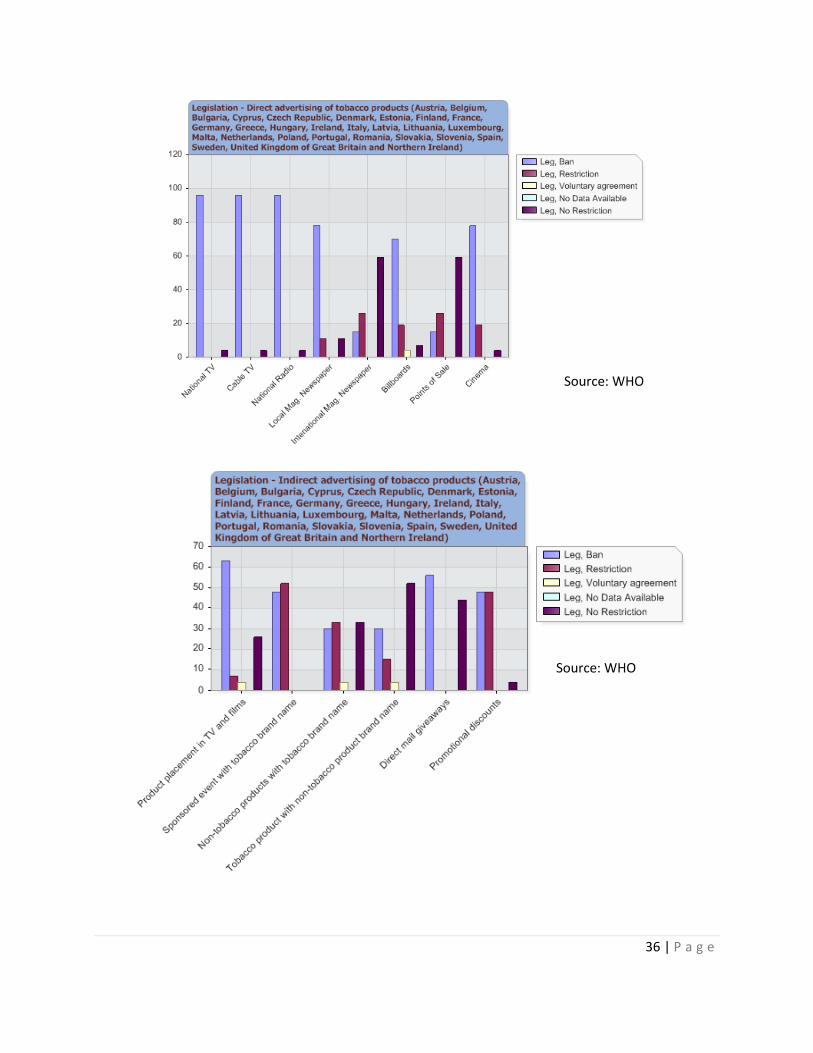
Promotion of Tobacco Products
Much of the direct and indirect promotion of tobacco products has also been banned. Nearly
100% of the European Union has banned direct advertising by way of national TV, cable TV, and national
radio; promotion in local magazines or newspapers along with billboards and the cinemas are also other
modes which have a large percentage of the EU states against them. Many forms of indirect advertising
such as event sponsorship by a tobacco firm or product placement are also starting to see high rates of
bans.88 This is a threat, for as promotion ceases, there is less consciousness of it and people may not be
as reminded of the product, thereby using it less, and making it difficult for a company to build up its
brand.
88 World Health Organization Regional Office for Europe. Data and Publications. 2009. April 2009
<http://data.euro.who.int/tobacco/?TabID=93302>.
Source: WHO
36 | P a g e
Source: WHO
Source: WHO
37 | P a g e
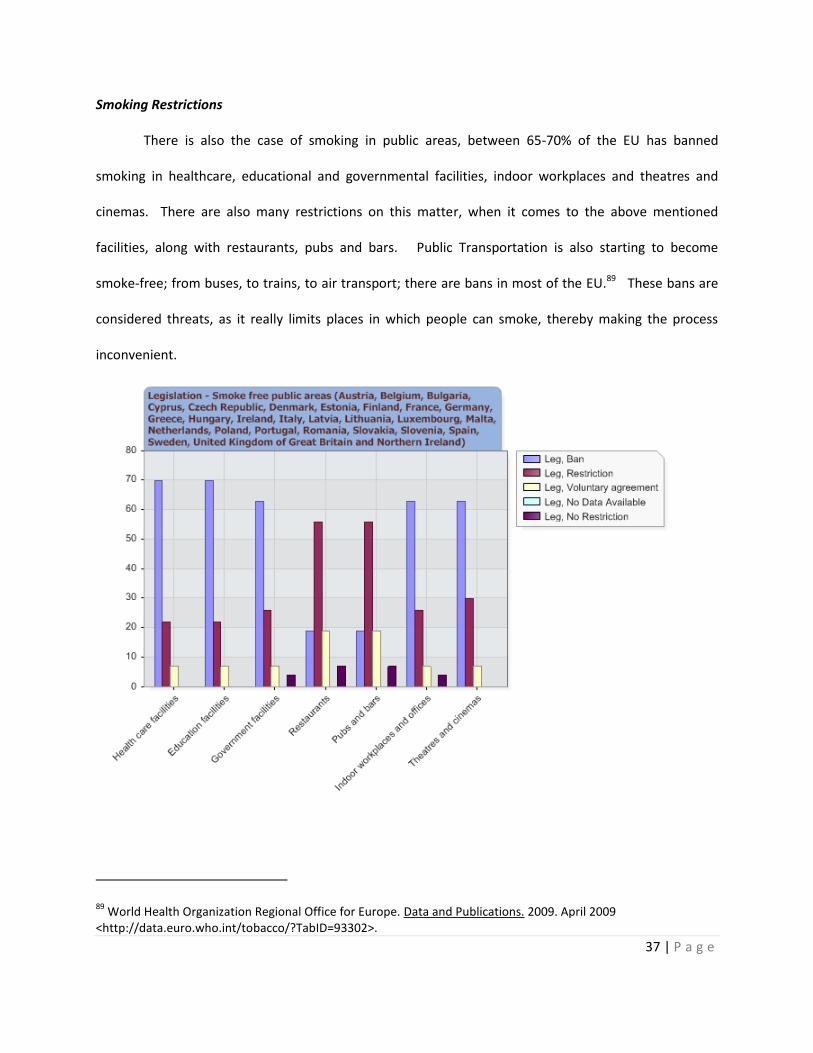
Smoking Restrictions
There is also the case of smoking in public areas, between 65-70% of the EU has banned
smoking in healthcare, educational and governmental facilities, indoor workplaces and theatres and
cinemas. There are also many restrictions on this matter, when it comes to the above mentioned
facilities, along with restaurants, pubs and bars. Public Transportation is also starting to become
smoke-free; from buses, to trains, to air transport; there are bans in most of the EU.89 These bans are
considered threats, as it really limits places in which people can smoke, thereby making the process
inconvenient.
89 World Health Organization Regional Office for Europe. Data and Publications. 2009. April 2009
<http://data.euro.who.int/tobacco/?TabID=93302>.

38 | P a g e
Packaging Restrictions
In May of 2001, it was law that tobacco products must have tobacco warnings covering 30% of
the front of the package and 40% of the back. The use of the words light or mild to describe tobacco
was also stopped, as it demoted the dangers of the product.90 These also pose as a threat as consumers
may be hesitant to purchase such a product.
Tobacco Taxation
The EU has also brought about taxation policies on tobacco products. All member states must
place at least a 57% tax on the retail price of the product. This has increased retail prices by a lot. This
has also led to the promotion of cigarette smuggling and counterfeit.91 Heavy taxation is a threat to the
industry.
Cigarette Smuggling and Counterfeit
Cigarette Smuggling and Counterfeit are becoming more and more popular in recent times.
They are leading to the loss in tobacco sales and taxes worldwide. In 2007, five of the EU member states
reported to having over 12% incidences of illicit trade.92 More and more are beginning to report the
same in Europe and this is also leading to nations losing out on income tax collection as many sellers do
not declare their earnings. These crimes are bringing about more problems as well. Consumers are not
getting the product they paid for and due to the lower cost; they are not seeing it as a crime but rather a
way to save money. There is also the question of civil rights for their workers; this type of business
often promotes child labour and poor working conditions.93
90 Corporate Social Responsibility (and the FMCG Market Response) GMID
91 Corporate Social Responsibility (and the FMCG Market Response) GMID
92 British American Tobacco. Africa and Middle East illicit trade map. 9 April 2009. 2 April 2009
<http://www.bat.com/group/sites/uk__3mnfen.nsf/vwPagesWebLive/DO6TNLJ9?opendocument&SKN=1&TMP=1>. 93
Phillip Morris International . Counterfeiting. 2009. 2 April 2009 <http://www.philipmorrisinternational.com/PMINTL/pages/eng/busenv/Counterfeiting.asp>.

39 | P a g e
Asia (Japan as a Proxy)
Japan has one of the biggest economies in the world; their regulations on smoking however, are
lagging behind. On the other hand, because of the increase in health awareness, international pressures
have influenced their policies significantly. This can further be demonstrated by the fact that Japan
joined the FCTC (The Framework Convention for Tobacco Control) in 2003.94 In order to comply with
FCTC, Japanese governments have continued to revise and implement law relating to the sale and
consumption of cigarettes. 95,96
Packaging
In 2003, the Japanese government imposed a Health Protection Law to implement larger health
warning signs on the packaging of cigarettes.97 The warning labels need to cover 30% of the main
surface area of the package.98 There are eight types of warning labels that will be used by the firms. This
is one of the major threats to the tobacco industry, as the demand of the product may decline, when
consumers see warnings about the health-related problems associated with smoking.
This new regulation has affected the sales of cigarette products; the company's cigarette sales
decreased by 5% in 2006 and by 4% in 2007 in retail volume terms.99
Advertisements
For a long time, Japan had no formal rules for or against advertisement on tobacco products.
There were only voluntary codes that were written by Tobacco Institute of Japan (TIOJ).100 In April of
94 Kazunari Satomura, Suketaka Iwanaga and Megumi Noami. “The Framework Convention on Tobacco Control
(FCTC) and Japnese anti-tobacco measures.” Report. 2008. 95
GMID. "Tobacco-Japan." Country Report. 2008. 96
Kazunari Satomura, Suketaka Iwanaga and Megumi Noami. “The Framework Convention on Tobacco Control (FCTC) and Japnese anti-tobacco measures.” Report. 2008 97
GMID. "Cigaratte--Japan." Country Report. 2008. 98
IBID. 99
GMID. "Tobacco-Japan." Country Report. 2008. 100
Kazunari Satomura, Suketaka Iwanaga and Megumi Noami. “The Framework Convention on Tobacco Control (FCTC) and Japnese anti-tobacco measures.” Report. 2008.

40 | P a g e
2005, because of the FCTC, the Japanese government imposed a law prohibiting selling tobacco
products to minors; the sponsorship of sporting and culturing events by tobacco firms and outdoor
billboards were also all banned. This creates a major threat to the industry for new companies, for it will
be harder for them to establish their brands in Japan.101
Distribution Network
In order to sell cigarettes in Japan, one needs to have been approved by the Ministry of Finance
to obtain a license. From July 2008, the Japanese government has further tightened regulations on
distribution channels, stating that now all vending machines require an electronic ID for purchasing
cigarette.102 Vending machines are one of the major distribution channels in Japan, they account for
more than 60.4% of total sales in the year of 2007.103 This increase in restriction is to support its strategy
for reducing the numbers of minors smoking in order to comply with the FCTC agreement, but this has
created a major threat, in that cigarettes sales will decline. At the same time, there is a trend in the
increase in sales in convenience stores by 6.7%, this is due to the fact that most individuals think it is
inconvenient to apply for the electronic ID. This has created an opportunity for the industry, in that the
company can capture market share by using this new trend as a tool. 104,105
Smoking Bans
In terms to smoking bans, Japan is lagging behind in comparison to Western countries. The only
example of an enstated smoking ban is the Chiyoda Ward, in Tokyo, in 2002. Bans on smoking in public
places are usually launched by local authorities or private companies. However, most initiatives would
101 Japanese Government. Tobacco industrial law. 2007.
102 Kazunari Satomura, Suketaka Iwanaga and Megumi Noami. “The Framework Convention on Tobacco Control
(FCTC) and Japnese anti-tobacco measures.” Report. 2008. 103
GMID. "Tobacco-Japan." Country Report. 2008. 104
Shiraki, Toru Fujioka and Maki. "Japan's Convenience-Store Sales Rise the Most in Eight Years." Bloomberg News (2009). 105
Ikkki Yamakawa. “22% of smokers carry taspo ID card” Asahi Shimbum(2008)
41 | P a g e
prefer to not compelely ban smoking, but rather create a segregated smoking section within a
vecinity.106
Also, most resturants and bars allow smoking and there usually are no restricitions. Yet, fast
food outlets and coffee shops have provide clients with designated smoking areas, as more customers
are becoming intolerant of smokers.107 Japan, as a whole, is also becoming increasingly intolerant of
smokers and there is a trend that more local government authorities will ban smoking on the streets and
in the workplace. This presents a threat to the tobacco industry.108
Local Industry Policy
Japan, likes many other Asian countries, has created a monopolistic market for the tobacco industry,
that being that there is only one local firm allowed to manufacture cigarettes, Japan Tobacco Inc. This is
used to secure government revenue, which generates US $20billion in taxes annually. Also, the
government is one of the biggest shareholders of Japan Tobacco. This has led the Japanese government
to be more protective towards the tobacco industry. Furthermore, since the government has tightened
restrictions on advertisements, this has made the establishment of new brands harder in Japan. This has
created a threat to the industry for only strong global brands will be able to enter the market.109
Macro Environmental Summary
Considering the above assessment of the US macro environment and the forecast of key
economic figures, it seems that the North-American economic prospect will be bleak. Europe, as well is
beginning to see a downturn in terms to its economic stability, however, its current state has not led to
complete consumer withdrawal. Nevertheless, the tobacco market has been exceptionally resilient to
economic downturns and loss of consumer confidence over the years. Tobacco companies are regarded
106 GMID. "Tobacco-Japan." Country Report. 2008.
107 IBID.
108 GMID. "Tobacco-Japan." Country Report. 2008.
109 Smith, Glenn. "Sector Insight...Japanese tobacco gaints focus on point-of-sales." Brand Republic Asia (2008).
42 | P a g e
as among the safest of defensive stocks for investors and this has been demonstrated by the behaviour
of the stocks during the huge falls in the world's stock exchanges since November 2008. The first reason
for this resilience is that consumers do not tend to smoke less in times of trouble and stress. Another
main reason is that the traditional strength of tobacco brands means that prices generally tend to
remain robust. And, as we will see in the industry analysis, this robust characteristic of the tobacco
industry is not expected to change in the near future. Also, unlike many other products, cigarettes are
relatively much less likely to be overtaken by new technology.110 The technologies that tend to affect
the industry are concerned with operational efficiency, rather than new product innovation. This gives
rise to internal efficiencies of scale and translates as a competitive advantage for the Big Five tobacco
companies, as will be examined in later sections. Therefore, although adverse macro economic trends
are expected to have a marginal negative effect on the bottom line and technological trends are of some
(minor) importance, the most important threats affecting the tobacco industry are socio-cultural and
political-legal in nature. Ever since the Surgeon General’s report on smoking in the 1960’s, the social
perception of smoking has been degrading yearly and such has been reflected in the cigarette volume
sales of developed countries. Major studies have demonstrated that the youth demographic of
developed countries sees smoking in a more negative light than they did about 10 years ago. Anti-
smoking campaigns and cigarette counterfeit and contraband pose a large threat to the industry.
Because of the pressure posed by these eminent social trends, the governments are imposing policies
that are unfriendly to the tobacco industry. Notably, smoking bans, bans on advertising, and product
packaging laws are creating a savage and shifting competitive environment. Certain companies such as
Philip Morris take it upon themselves to pressure governments to relegate certain regulations or
intensify the fight against contraband and counterfeit cigarettes. In other countries, such as Japan, the
110 Market Watch. “Market Watch: How will recession impact the tobacco market in 2009?” MarketWatch. 2009.

43 | P a g e
government creates a paternalistic environment for the domestic tobacco firms(s). Overall, there are
many looming macro environmental trends that threaten the tobacco industry.
Industry Analysis
There were 62 firms in the tobacco industry at the end of year 2007,111 but the top five firms
accounted for 68.5% of total sales. These leading firms were Philip Morris International, Philip Morris
USA (Altria Group), British American Tobacco, Japan Tobacco, and Imperial Tobacco. As can be seen by
the table below, the market has enjoyed from 4.1% to 4.6% of steady annual growth from year 2003 to
2007. It is forecasted that the market will continue to prosper in the following five years, achieving no
lower than 3.9% growth.
Global Tobacco Market Value: $ billion, 2003-2012
Year $ billion % Growth
2003 318.4 --
2005 346.1 4.10%
2006 361.3 4.40%
2007 378 4.60%
2008* 396.5 4.90%
2009* 413.5 4.30%
2010* 430.2 4.00%
2011* 446.9 3.90%
2012*
*Forecasted
464.4 3.90%
111 Bloomberg. January 20, 2009
300
350
400
450
500
2003 2005 2006 2007 2008e 2009e 2010e 2011e 2012e
Global Tobacco Market Value: $ billion, 2003-2012

44 | P a g e
The tobacco industry is notorious for realizing outstanding returns year after year, and
remaining relatively unaffected by economic tribulations. This is reflected by excellent industry
performance ratios (see table below).
Year Return on Assets Return on Equity Return on Investment
2005 9.410424 24.64856 31.97343
2006 7.556216 18.83797 27.69167
2007 9.450731 30.6605 38.15
Average 8.80579 24.71568 32.60503
In year 2007, there were 743,883 people employed in the tobacco industry. Over 400,000 of
them were employed by the Big Five companies.
Year Number of Employees % Growth
2005 777495 --
2006 841360 0.082142
2007 743883 -0.11586
Average 787579.3 -0.01686
Although the above analysis of the global tobacco industry might seem optimistic, it is important
to note that while the annual growth in cigarette volumes grew by 4% over the period 2001-6, the
number of cigarettes smoked in nearly all developed markets fell because of stricter regulations, more
smoking bans, higher tobacco taxes, health concerns, and other social trends. Over 90% of the actual
3.50%
4.00%
4.50%
5.00%
2004 2005 2006 2007 2008e 2009e 2010e 2011e 2012e
% Growth Global Tobacco Market Value

45 | P a g e
volume growth came from China.112 The future success of individual tobacco companies will therefore
depend on their ability to harness the potential of developing countries into their strategies.
Strategic Group Map
The tobacco industry is highly globalized with British American Tobacco (10 top 50 brands), Philip
Morris (10 top 50 brands), and Japan Tobacco (6 top 50 brands), each competing in over one hundred
countries and dominating the international market for cigarettes. These three companies form the
“Multinational Tobacco Companies (MTC)” strategic group. The MTCs have the most global orientation
of all the tobacco companies. Their main strategy is focused on marketing their premium global brands,
112 IBID.
46 | P a g e
such as Marlboro for Philip Morris and Mild Seven for Japan Tobacco. The total market share of the 26
top 50 brands of the MTC segment represents 42.6% of total global cigarette stick volume!
In the two extremities of the map, are local tobacco companies or state monopolies. In the upper
right corner, is the leading tobacco company in the world, in terms of sales volume, CNTC (China
National Tobacco Corporation). CNTC has 11 top 50 brands, the most of any tobacco company in the
world. Its top 11 brands represent 32.7% of global sales volume. This is because one in three cigarettes
smoked in the world are from China and the CNTC has almost total control on that market, with 99.7%
domestic market share.113 It is important to note, however, that the CNTC has only a modest share of
total tobacco industry revenue, since cigarettes sold in China are cheaper to produce and sell at a level
well below the world average.
In the lower left corner, are “Local Tobacco Companies and Small State Monopolies (LTCSSM)” and
Imperial Tobacco. Loews (now known as Lorillard) and General Tobacco are local US companies,
Hongyun Tobacco Group is a Chinese company, KT&C Corp is a Korean company, and Eastern Company
SAE is an Indian company, each are big local players in their respective markets, but virtually inactive
internationally. Their respective markets are usually ones in which they hold a major domestic market
share and where the MTCs are therefore at a relative disadvantage. Their respective domestic markets
might be characterized by paternalistic regulation.
Imperial Tobacco is part of the LTCSSM strategic group, although the company is technically an
MNE. Its main markets are the UK and the US in particular and the EU in general; strictly regulated
markets. Imperial Tobacco has failed to diversify globally, as the MTC group has done and it seems to
follow a localized specialization strategy, dominating the MTC group internationally, in terms of
113 GMID, “ Cigarette—China” Country Report (2008)
47 | P a g e
economy-class brands market share. It owns 3 top 50 brands which represent a total of 2.9% of global
tobacco sales volume.
Porter’s Five Forces
Direct Competitors (LOW 3)
The Big Five tobacco companies (less British American Tobacco and its subsidiary, Reynolds American)
The tobacco industry is clearly dominated by the Big Five, as they account for 68.5% of total
sales. Upon close examination, it is clear that Philip Morris and British American Tobacco are the leaders
of the pack because they account for 43% of global tobacco sales. Imperial Tobacco is too heavily
invested in North-America and Europe, the two most strictly regulated regions in the world and this has
had a negative impact on performance. It tobacco failed to diversify globally, as Philip Morris and British
American Tobacco have done. Japan Tobacco is also lagging behind because it lacks local brand focus in
foreign markets. Although tobacco products are commodities, smokers develop strong brand
preference and are usually quite reticent to switching brands. Moreover, as seen above, the tobacco
industry is relatively unaffected by improvement in technology and can be said to be in the mature
phase of its life cycle.
Philip Morris recently completed the spin-off of Philip Morris International. From the end of
2007, the former Altria business has functioned as two separate entities: Philip Morris USA (PM USA)
and Philip Morris International. Since then, Philip Morris USA and Philip Morris International have been
more corporately active as independent entities and this can be seen in their acquisitions and product
strategies. The new company now has greater freedom to pursue sales growth in emerging markets
since it has been detached from the legal and regulatory constraints that face Philip Morris USA.114
114 GMID. Tobacco – World: COMPANY STRATEGIES. 2008
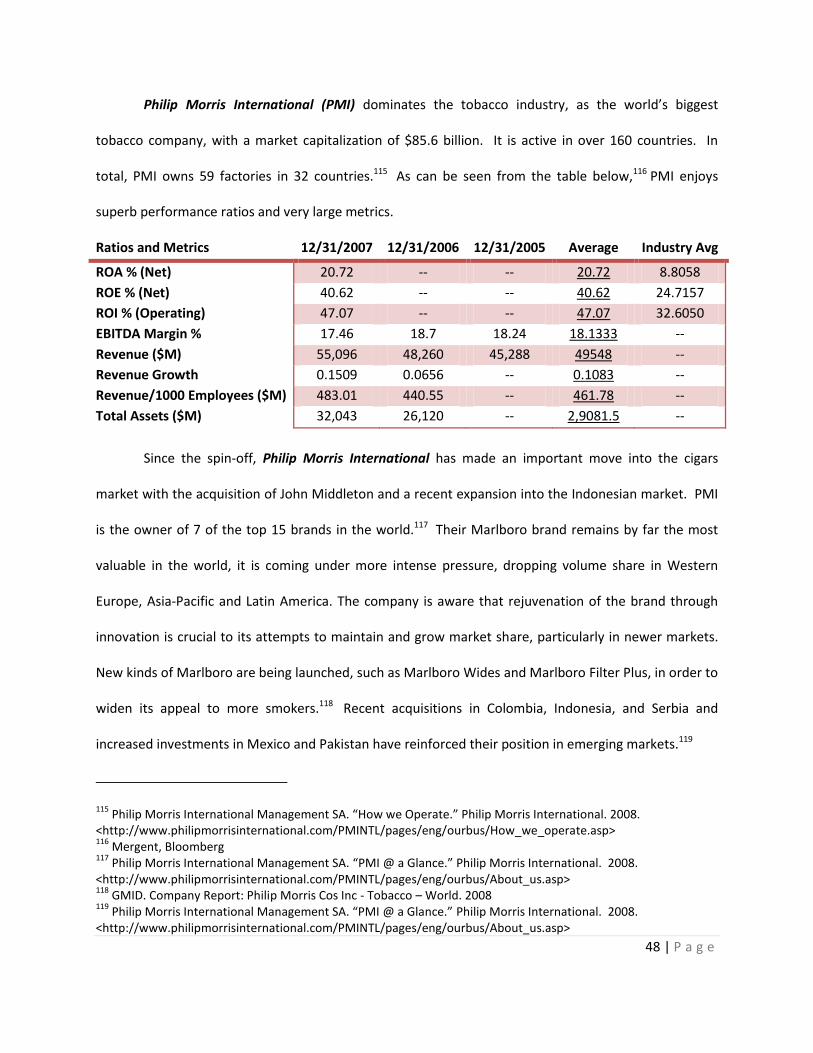
48 | P a g e
Philip Morris International (PMI) dominates the tobacco industry, as the world’s biggest
tobacco company, with a market capitalization of $85.6 billion. It is active in over 160 countries. In
total, PMI owns 59 factories in 32 countries.115 As can be seen from the table below,116 PMI enjoys
superb performance ratios and very large metrics.
Ratios and Metrics 12/31/2007 12/31/2006 12/31/2005 Average Industry Avg
ROA % (Net) 20.72 -- -- 20.72 8.8058
ROE % (Net) 40.62 -- -- 40.62 24.7157
ROI % (Operating) 47.07 -- -- 47.07 32.6050
EBITDA Margin % 17.46 18.7 18.24 18.1333 --
Revenue ($M) 55,096 48,260 45,288 49548 --
Revenue Growth 0.1509 0.0656 -- 0.1083 --
Revenue/1000 Employees ($M) 483.01 440.55 -- 461.78 --
Total Assets ($M) 32,043 26,120 -- 2,9081.5 --
Since the spin-off, Philip Morris International has made an important move into the cigars
market with the acquisition of John Middleton and a recent expansion into the Indonesian market. PMI
is the owner of 7 of the top 15 brands in the world.117 Their Marlboro brand remains by far the most
valuable in the world, it is coming under more intense pressure, dropping volume share in Western
Europe, Asia-Pacific and Latin America. The company is aware that rejuvenation of the brand through
innovation is crucial to its attempts to maintain and grow market share, particularly in newer markets.
New kinds of Marlboro are being launched, such as Marlboro Wides and Marlboro Filter Plus, in order to
widen its appeal to more smokers.118 Recent acquisitions in Colombia, Indonesia, and Serbia and
increased investments in Mexico and Pakistan have reinforced their position in emerging markets.119
115 Philip Morris International Management SA. “How we Operate.” Philip Morris International. 2008.
<http://www.philipmorrisinternational.com/PMINTL/pages/eng/ourbus/How_we_operate.asp> 116
Mergent, Bloomberg 117
Philip Morris International Management SA. “PMI @ a Glance.” Philip Morris International. 2008. <http://www.philipmorrisinternational.com/PMINTL/pages/eng/ourbus/About_us.asp> 118
GMID. Company Report: Philip Morris Cos Inc - Tobacco – World. 2008 119
Philip Morris International Management SA. “PMI @ a Glance.” Philip Morris International. 2008. <http://www.philipmorrisinternational.com/PMINTL/pages/eng/ourbus/About_us.asp>

49 | P a g e
Because the world market (excluding China) is contracting, the principle strategy of PMI is to maintain or
increase a strong margin while holding on to sales volume. In 2007, major profit growth was achieved
through strong pricing in Russia, Turkey, and Ukraine, in spite of lower sales volumes. The company is
building an important portfolio of successful local brands through acquisitions.
Philip Morris USA (Altria Group) is a minor player in the industry with a market capitalization of
$31.9 billion. It is primarily active in the US market and thus faces a strict legal environment. It is at a
constantly high risk of litigations, which have eroded its profits. We can notice the short term impact of
the PMI spin-off. As is evident when comparing PMI’s current performance ratios with those of Altria
Group, PMI has benefitted enormously from its independence. Altria group has also seen a modest
improvement in its performance ratios.
Ratios and Metrics 12/31/2007 12/31/2006 12/31/2005 Average Industry Avg
ROA % 12.12 11.33 9.96 11.1367 8.80579
ROE % 33.64 31.92 31.42 32.3267 24.71568
ROI % 31.09 30.77 30.68 30.8467 32.60503
EBITDA Margin % 19.26 18.95 18.67 18.96 --
Revenue ($M) 73,801 101,407 97,854 91020.667 --
Revenue Growth -0.2722 0.0363 -- -0.1180 --
Revenue/1000 Employees ($M) 878 579.5 491.7 649.7333 --
Total Assets ($M) 57,211 104,270 107,949 89810 --
Its principle strategy is to free itself from these legal constraints, to expand in markets which
offer scope for increased sales and profits through new products, organic growth and acquisitions.120
The company seeks to leverage its principle resources, such as its powerful distribution network and
strong field sales force, across an array of tobacco products including acquisitions like John Middleton
and UST Inc. PM USA enjoys a strong balance sheet while maintaining necessary financial flexibility. The
company continues to take legal action against companies involved in contraband and counterfeiting.
120 GMID. Tobacco – World: COMPANY STRATEGIES. 2008
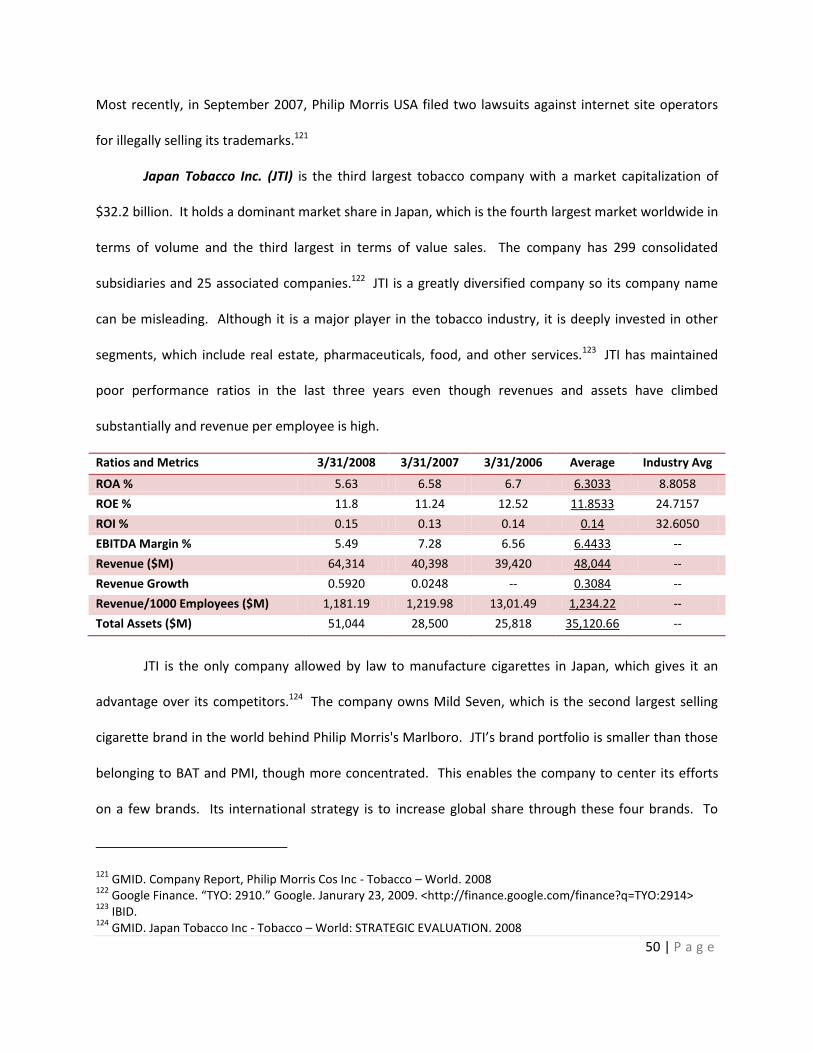
50 | P a g e
Most recently, in September 2007, Philip Morris USA filed two lawsuits against internet site operators
for illegally selling its trademarks.121
Japan Tobacco Inc. (JTI) is the third largest tobacco company with a market capitalization of
$32.2 billion. It holds a dominant market share in Japan, which is the fourth largest market worldwide in
terms of volume and the third largest in terms of value sales. The company has 299 consolidated
subsidiaries and 25 associated companies.122 JTI is a greatly diversified company so its company name
can be misleading. Although it is a major player in the tobacco industry, it is deeply invested in other
segments, which include real estate, pharmaceuticals, food, and other services.123 JTI has maintained
poor performance ratios in the last three years even though revenues and assets have climbed
substantially and revenue per employee is high.
Ratios and Metrics 3/31/2008 3/31/2007 3/31/2006 Average Industry Avg
ROA % 5.63 6.58 6.7 6.3033 8.8058
ROE % 11.8 11.24 12.52 11.8533 24.7157
ROI % 0.15 0.13 0.14 0.14 32.6050
EBITDA Margin % 5.49 7.28 6.56 6.4433 --
Revenue ($M) 64,314 40,398 39,420 48,044 --
Revenue Growth 0.5920 0.0248 -- 0.3084 --
Revenue/1000 Employees ($M) 1,181.19 1,219.98 13,01.49 1,234.22 --
Total Assets ($M) 51,044 28,500 25,818 35,120.66 --
JTI is the only company allowed by law to manufacture cigarettes in Japan, which gives it an
advantage over its competitors.124 The company owns Mild Seven, which is the second largest selling
cigarette brand in the world behind Philip Morris's Marlboro. JTI’s brand portfolio is smaller than those
belonging to BAT and PMI, though more concentrated. This enables the company to center its efforts
on a few brands. Its international strategy is to increase global share through these four brands. To
121 GMID. Company Report, Philip Morris Cos Inc - Tobacco – World. 2008
122 Google Finance. “TYO: 2910.” Google. Janurary 23, 2009. <http://finance.google.com/finance?q=TYO:2914>
123 IBID.
124 GMID. Japan Tobacco Inc - Tobacco – World: STRATEGIC EVALUATION. 2008
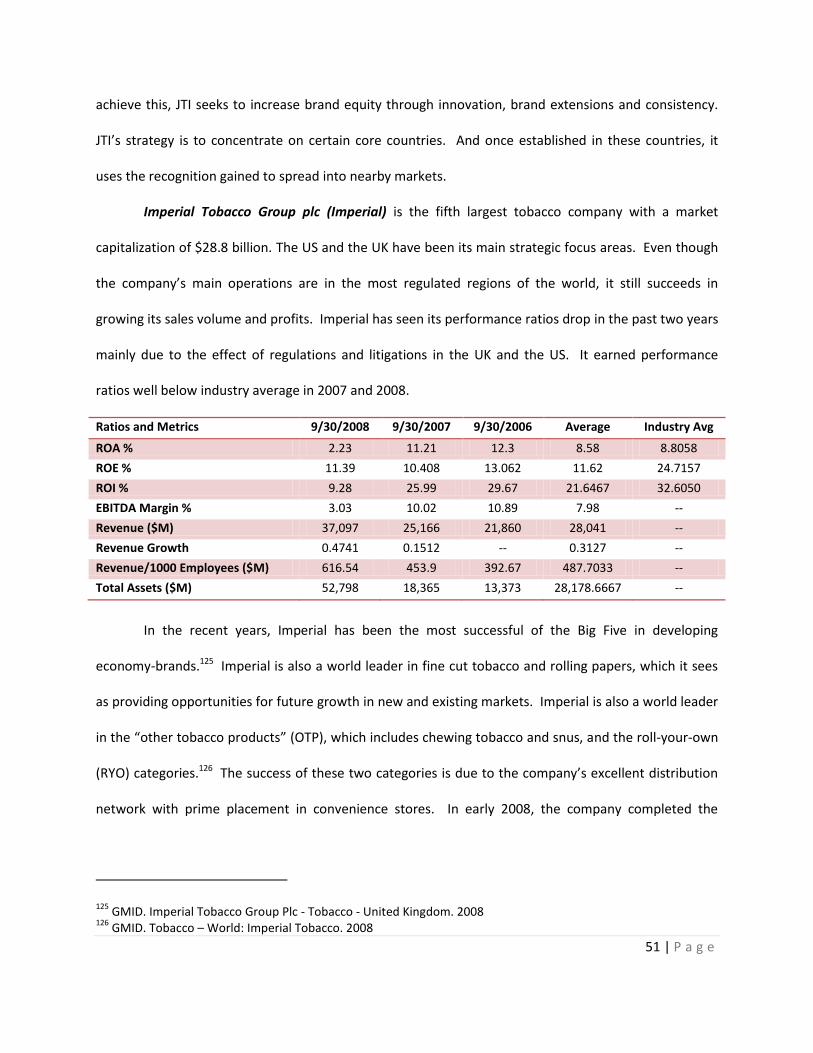
51 | P a g e
achieve this, JTI seeks to increase brand equity through innovation, brand extensions and consistency.
JTI’s strategy is to concentrate on certain core countries. And once established in these countries, it
uses the recognition gained to spread into nearby markets.
Imperial Tobacco Group plc (Imperial) is the fifth largest tobacco company with a market
capitalization of $28.8 billion. The US and the UK have been its main strategic focus areas. Even though
the company’s main operations are in the most regulated regions of the world, it still succeeds in
growing its sales volume and profits. Imperial has seen its performance ratios drop in the past two years
mainly due to the effect of regulations and litigations in the UK and the US. It earned performance
ratios well below industry average in 2007 and 2008.
Ratios and Metrics 9/30/2008 9/30/2007 9/30/2006 Average Industry Avg
ROA % 2.23 11.21 12.3 8.58 8.8058
ROE % 11.39 10.408 13.062 11.62 24.7157
ROI % 9.28 25.99 29.67 21.6467 32.6050
EBITDA Margin % 3.03 10.02 10.89 7.98 --
Revenue ($M) 37,097 25,166 21,860 28,041 --
Revenue Growth 0.4741 0.1512 -- 0.3127 --
Revenue/1000 Employees ($M) 616.54 453.9 392.67 487.7033 --
Total Assets ($M) 52,798 18,365 13,373 28,178.6667 --
In the recent years, Imperial has been the most successful of the Big Five in developing
economy-brands.125 Imperial is also a world leader in fine cut tobacco and rolling papers, which it sees
as providing opportunities for future growth in new and existing markets. Imperial is also a world leader
in the “other tobacco products” (OTP), which includes chewing tobacco and snus, and the roll-your-own
(RYO) categories.126 The success of these two categories is due to the company’s excellent distribution
network with prime placement in convenience stores. In early 2008, the company completed the
125 GMID. Imperial Tobacco Group Plc - Tobacco - United Kingdom. 2008
126 GMID. Tobacco – World: Imperial Tobacco. 2008

52 | P a g e
acquisition of Altadis127, a major European tobacco logistics platform, and Compañía de Distribución
Integral Logista, another logistics company. The company thus probably seeks to build upon their
distribution successes and establish a stronger European presence in the RYO and OTP segments.
Imperial plans to continue its current programme of growth through acquisition, which has seen it pick
up major brands across the world, including the high-profile Davidoff brand in 2006.128 Acquisition,
especially outside the Euro zone is a priority in order for Imperial to retain its global position.129
Threat of Entry
The barriers to entry for the tobacco industry are high. Although tobacco products are
commodities in nature, smokers exhibit significant brand preference. Cigarette brands enjoy the highest
brand loyalty of all consumer products, with less than 10% of users changing brands annually.130 Brand
choices are usually made early during the life of a smoker, with a high concordance between the brand
first smoked and the brand eventually selected as a usual brand.131 Therefore, a new entrant would
have to provide a large investment of time to establish local brand loyalty.
There are major regulatory obstacles in most large markets that make it difficult for new
entrants to compete. Advertising bans make it hard for a company to penetrate or even expand into a
market. Established companies enjoy favorable relationships with retailers and wholesalers and they
are in a privileged position to maintain premium shelf space. Retailers might be reticent to stock
products of a relatively new and unproven brand. Areas where prominent displays of cigarettes are
disallowed, obliging retailers to keep packs hidden under the counter, make for an especially difficult
market to enter. A penetrating company would therefore have to compete on price, an almost
127 Google Finance. “IMT.” Google. January 23, 2009. <http://finance.google.com/finance?q=LON:IMT>
128 GMID. Imperial Tobacco Group Plc - Tobacco - United Kingdom. 2008.
129 IBID.
130 DesignBoom. Cigarette Pack Graphics. DesignBoom. January 2009.
<http://www.designboom.com/history/cigarettes.html> 131
IBID.

53 | P a g e
impossible task because of excise taxes on tobacco products. Moreover, a new company competing on
price would be at a strong disadvantage against established companies with large cash reserves who
could retaliate by decreasing their prices even lower.
In certain markets such as Japan, national governments provide a biased legal environment,
favoring domestic tobacco companies. Fifteen countries have major state run tobacco companies,
which together account for some 40% of world cigarette volume sales (excluding the China National
Tobacco Company).132 State monopolies, such as the CNTC in China, which dominate local markets,
pose high barriers in their respective countries.
The Big Five tobacco companies are in the mature phase of their life cycle and enjoy large
economies of scale. This leads to lower production costs and also makes it harder for younger firms to
meet the capital requirements of the industry. Companies that engage in the contraband of cigarettes
or those that sell counterfeits represent a threat of entry to established companies as it is estimated
that 7% of the global market for tobacco product is already supplied by these companies.133 Such
companies succeed by competing on price by countervailing the strict regulations on packaging, tar
content, and excise taxes.
North-America (US as a proxy)(LOW 2)
The US tobacco market is concentrated among three local brands – Philip Morris USA, Reynolds
American (British American Tobacco subsidiary) and Lorillard – which collectively hold 88.5% share of
the total US tobacco market.134 This market domination by domestic companies represents the largest
barrier to entry for prospective competitors. For example, the Lorillard Tobacco Company was founded
in 1760, while Reynolds was founded in 1890. Throughout these years, these companies were able to
132 GMID. Tobacco – World Monopolies – The Next Stage in Consolidation. 2008
133 GMI. Global Tobacco: Survival Strategies for a Savage Market. 2008
134 Datamonitor. Tobacco Industry – Global. December 2008.

54 | P a g e
develop strong distribution channels, which could allow them to exercise pressure on their prospective
rivals. Philip Morris is well-known for its “Retail Leaders” program, in which retailers agree to devote a
certain percentage of shelf space (usually around 50%, and always the most desirable “eye-level”
section) and signage to Philip Morris brands in exchange for increased promotional allowances, which, in
turn, leads to lower prices for participating retailers.135
Europe (The European Union as a Proxy) (LOW 3)
The European Union has imposed several laws and regulations against certain forms of sales and
also the advertisement of tobacco. There are strict procedures that a company must follow, if it wants
to have its products distributed into retail stores. Tobacco companies cannot advertise by way of
television, radio nor print ads. They are also restricted in the packaging and sale of their product. Many
of these matters would deter newcomers from entering the market. Without proper knowledge of such
a product, it would be hard to make users switch brands or even to attract new users.
Asia (Japan as a proxy)(LOW 1)
Japan has extremely high barriers to entry for two major reasons: the existence of strong brands
and unfriendly government policy. Japan Tobacco used to be a fully-owned state monopoly. Presently,
the government of Japan still applies substantial influence on the industry through its 50% ownership of
the company and paternal tobacco regulations. By law Japan Tobacco is the only company that is
allowed to manufacture tobacco products in Japan. Any other company wishing to market tobacco
products in Japan must get its prices approved by the Ministry of Finance. This situation creates a host
of disadvantages for foreign tobacco companies even though the Japanese government claims to have a
policy that favors the import of cigarettes. Moreover, the Japanese government requires that strict
protocols be followed for cigarette packaging and manufacturing. In Japan, 98% of total market share is
135GMID. Tobacco - World, point of sales. 2008

55 | P a g e
accounted by Japan Tobacco; Philip Morris and British American Tobacco are also present, but operate
under an extremely low product margin.136
Threat of Substitutes (VERY LOW 2)
Contrary to popular belief, cannabis and alcohol are NOT substitutes for tobacco products. In
fact, most smokers find it hard to stop consuming tobacco because they are addicted to nicotine and
harmane, substances that are not present in cannabis and alcohol. Smokers find it difficult to stop
smoking and get withdrawal symptoms when they try to stop.137 Nicotine disturbs the metabolism and
suppresses appetite therefore some people might gain weight when trying to quit and might be
compelled to resume the habit to lose the weight gained. According to studies by Henningfield and
Benowitz, nicotine is more addictive than cannabis, caffeine, ethanol, cocaine, and heroin when
considering both somatic and psychological dependence.138139 Below is a list of the nine closest
substitutes of tobacco products, all of which are inadequate to provide the complete offerings of a
cigarette. Most of them can potentially damage ones health, and all of them are addictive and more
expensive than cigarettes.
Introduction to Nicotine Replacement Products
There are a number of recently emerging technologies that can temporarily satisfy a smoker’s
urge for nicotine. These products come in the usual form of patches, gums, lozenges, inhalers, nasal
sprays, and nicotine water. These tobacco substitute products have gained popularity in the last decade
as a way to help smokers deal with the withdrawal symptoms of not obtaining nicotine from cigarettes.
Nicotine replacement products deliver nicotine to the smoker's brain in a much slower way than
136IBID.
137 BMJ Group. What is Nicotine Addiction? 6 March 2009. March 2009
<http://www.guardian.co.uk/lifeandstyle/besttreatments/smoking-description>. 138
Hilts, Phillip J. Relative Addictiveness of Drugs . 12 August 1994. January 2009 <http://www.tfy.drugsense.org/tfy/addictvn.htm>.

56 | P a g e
cigarettes do, which helps to damp down the urges to smoke. It may provide a more comfortable exit
from the smoking habit. Ex-smokers might become addicted to nicotine replacement products, which
are more expensive than cigarettes, and might be compelled to start smoking again in order to save
money. Nicotine replacement products result in 7% of quitters quitting for at least six months.140
The Nicotine Patch
The nicotine patch was the first nicotine replacement product, introduced in 1993. It is the
most popular form of nicotine replacement. The patch is available over the counter in several doses,
designed to be consumed in stages, according to the individual’s progression. The patch delivers a small
dose of nicotine throughout the day. Some individuals wearing the patch while sleeping experience
nightmares.141 It costs from $30 for a week’s supply of nicotine patches.142
The Nicotine Gum
The nicotine gum is a kind of chewing gum that delivers nicotine to the body. It is available over
the counter. The gum delivers a large amount of nicotine rapidly. Symptoms such as hiccups and a
constriction of throat muscles can be derived from chewing the gum. Another potential side effect of
prolonged nicotine gum use is gum disease. It costs from $30 for a week’s supply of nicotine gum.143
The Nicotine Inhaler
The nicotine inhaler delivers nicotine relatively quickly and is available by prescription only. Like
a cigarette, it delivers nicotine by inhalation. It mimics the hand to mouth habit of smoking which might
140 J R Hughes, S Shiffman, P Callas and J Zhang. "A meta-analysis of the efficacy of over-the-counter nicotine
replacement." Tob. Control (2003): 12;21-27. <http://tc.bmjjournals.com/cgi/content/full/12/1/21?ijkey=5.ko5/Oz4yutI> 141
IBID. 142
Tobacco Solution Online. Nicotine Transdermal Patch. 2009. 1 March 2009 <http://stores.tobaccosolutionsonline.com/Search.bok?category=Nicotine+Transdermal+Patch>. 143
Tobacco Solutions Online Home. Tobacco Solutions Online Product List. 2009. 2009 April 1 <http://stores.tobaccosolutionsonline.com/Categories.bok>.

57 | P a g e
provide some comfort. The most common side effect of the inhaler is irritation of the lining of the
mouth (40% of users), coughing, runny nose, and stomachache. The treatment costs from $6 per day.144
The Nicotine Lozenges
Nicotine lozenges are a type of candy that dissolves in the mouth, releasing nicotine into the
body. They are available over the counter. The most common side effects are sore teeth and gums,
indigestion, and throat irritation. They cost from $6 per day.145
The Nicotine Nasal Spray
The nicotine nasal spray provides a rapid "hit" of nicotine therefore it is attractive to highly
addicted smokers. The most common side effects are nose and throat irritation. It costs from $5 per
day and is only available by prescription.146
Other Drugs
Buproprion
In 2007, buproprion was the fourth-most prescribed antidepressant in the United States retail
market, with 20.184 million retail prescriptions. Although it was initially developed as an anti-
depressant, it was subsequently found to be an effective anti-smoking aid.147 This prescription drug can
help a smoker quit even if he is not depressed. Bupropion reduces the severity of nicotine cravings and
withdrawal symptoms. After a seven-week treatment, only 27% of subjects who receive bupropion
144 American Lung Assoication. Nicotine Replacement Therapy (NRT) and Other Medications Which Aid Smoking
Cessation. July 2006. 1 April 2009 <http://www.lungusa.org/site/pp.asp?c=dvLUK9O0E&b=33566>. 145
IBID. 146
IBID. 147
After sertraline, escitalopram and fluoxetine. The bupropion prescriptions were calculated as a total of prescriptions for Wellbutrin XL, Budeprion XL, Budeprion SR, Bupropion SR and Bupropion ER using data from the charts for generic and brand-name drugs, see: "Top 200 Generic Drugs by Units in 2007" (PDF). Drug Topics (2008-02-18). Retrieved on 2008-03-30. and Verispan (2008-02-18). "Top 200 Brand Drugs by Units in 2007" (PDF). Drug Topics. Retrieved on 2008-03-30.

58 | P a g e
retain a problematic urge to smoke.148 Bupropion lowers seizure threshold and its potential to cause
seizures is widely publicized.
Varenicline
A newer drug called varenicline that is marketed by Pfizer may work better than bupropion. It
both reduces cravings for and decreases the pleasurable effects of cigarettes and other tobacco
products, and through these mechanisms it can assist some patients to stop smoking. In November
2007, the FDA announced it had received post-marketing reports that patients using Chantix for smoking
cessation had experienced several serious symptoms, including suicidal ideation and occasional suicidal
behavior, erratic behavior, and drowsiness.149
The Closest Substitutes for Tobacco Products
Nicotine Water
Nicotine water is the newest nicotine replacement product, introduced in the US in 2008 as an
over the counter product. Like the nicotine inhaler, it mimics the hand to mouth habit of a smoker.
Moreover, the physical volume of water helps the person feel full, which helps prevent weight gain.
NicLite sell their six pack of nicotine water for $20.85. One NicLite bottle lasts for approximately 3
hours.150 This product could be sold in areas, such as restaurants and hospitals, where smoking is
banned, to help temporarily reduce a smoker’s urge to smoke.
The E-Cigarette
The e-cigarette is an emerging technological trend. It is the closest substitute to the cigarette.
As its name suggests, it is a battery-powered device that provides inhaled doses of nicotine in the form
148 Tonnesen P, Tonstad S, Hjalmarson A, Lebargy F, Van Spiegel P I, Hider A, Sweet R, Townsend J (2003). "A
multicentre, randomized, double-blind, placebo-controlled, 1-year study of bupropion SR for smoking cessation". J Intern Med 254 (2): 184–192. doi:10.1046/j.1365-2796.2003.01185.x. PMID 12859700. 149
U.S. Food and Drug Administration. Early Communication About an Ongoing Safety Review. 1 February 2008. 1 April 2009 <http://www.fda.gov/Cder/Drug/early_comm/varenicline.htm>. 150
NICLite®. Smoke Free Choice. 2008. 1 April 2009 <http://www.smokefreechoice.com/question-answer.html>.

59 | P a g e
of vapor. In addition to nicotine, this vapor also provides a flavor and physical sensation similar to that
of inhaled tobacco smoke. Liquid nicotine solutions for electronic cigarettes are available in different
flavors and nicotine concentrations. Some varieties attempt to resemble traditional cigarette types,
such as regular tobacco and menthol, and some even attempt to mimic specific cigarette brands, such as
Marlboro or Camel. A notable example: Crown7 sells their reusable HYDRO e-cigarette at $79.95 per
unit with replacement cartridges, claimed to be the nicotine equivalent of two packs of 20, that at $10
each.151 This product, like nicotine water can be used in areas where smoking is banned.
All nine proposed substitutes for tobacco products are inadequate in terms of their offerings.
None of them can truly succeed in matching the satisfaction that smoking a cigarette renders to an
addicted smoker. All nicotine replacement products have a weak success rate and drugs such as
buproprion and varenicline, although more effective, have dangerous side effects that can be lethal.
Buyer power in the tobacco industry is very low.
Power of Suppliers (LOW 2)
Within the tobacco industry, suppliers often tend to have low bargaining power. This is because
they purchase products that are highly substitutable, such as tobacco, cardboard boxes and paper
products. These products tend not to be highly differentiated, and therefore tobacco companies can
easily switch suppliers based on prices.
Although tobacco is produced in over 120 countries all over the world152, four countries
definitely take the lead in total quantities produced. China is by far the number one producer of
tobacco, accounting for about 37.1% of world production.153 In 2004 alone, China produced 2,410
151 Market Watch. New Crown7 Device Allows Smokers to Puff Without Smoke. 3 December 2008. February 2009
<http://www.tobacco.org/news/275473.html>. 152
World Health Organization. Cigarette Consumption. 2007. 2 April 2009 <http://www.who.int/tobacco/en/atlas8.pdf>. 153
IBID.
60 | P a g e
thousands of metric tonnes. Second in production is Brazil, accounting for about 14.3% of the total
world tobacco produced. Third is India with 9.2% of the share and last the United States with 6.1%.
Together, these four alone account for a little over two-thirds of the tobacco produced world-wide.
Amongst these four nations, a substantial amount of land is dedicated to the growth of tobacco.
China devotes 0.24% of agricultural land to the production of tobacco, Brazil 0.13%, India 0.19%, and the
United States with 0.04%.154 By this sort of assessment it is plain to see that the supplier industry is
fragmented. It is forecasted that world tobacco production will continue to increase, along with that of
the developing world. However, it is also foreseen that tobacco production in developing nations will
decrease.155
China has a grave number of tobacco producing farmers, while Brazil houses about 135,000156
farmers. There are about 850,000157 tobacco growers in India and about 56,977 in the United States.158
Overall, it is evident to see that suppliers in the tobacco industry are in a weak position and
therefore are price-takers not makers. They submit to the demands of the major five tobacco firms and
rely on them immensely for revenues.
Power of Buyers
As previously discussed, a smoker cannot easily get rid of his tobacco consumption habits
because he is addicted and available tobacco substitutes are less than perfect and more costly than
cigarettes or other tobacco products. Moreover, a smoker exhibits strong cigarette brand preference
154 IBID.
155 Food and Agriculture Organization of the United Nation. PROJECTIONS OF PRODUCTION OF TOBACCO LEAF. 1
April 2009 <http://www.fao.org/DOCREP/006/Y4956E/y4956e08.htm>. 156
Food and Agriculture Organization of the United Nation. Overview. 2009. <http://www.fao.org/DOCREP/006/Y4997E/y4997e03.htm#TopOfPage>. 157
IBID. 158
Capehart, Tom. Trends in U.S. Tobacco. November 2004. 1 April 2009 <http://www.ers.usda.gov/publications/tbs/nov04/tbs25702/tbs25702.pdf>.

61 | P a g e
due to psychological associations with certain brands and he is therefore reluctant to switch brands.
The power of the end consumer is obviously very low when compared to that of most other goods.
As the Big Five tobacco companies dominate the tobacco industry, in what might be called an
oligopoly, distributors and retailers have minimal bargaining power when it comes to prices. Ultimately,
it is the end buyer who decides which brand he prefers to buy and he will therefore abstain from
purchasing tobacco products from retailers which do not carry his preferred brand. In certain countries,
such as Japan, tobacco companies will sell directly to the end consumer with street level vending
machines.
North America (US as a Proxy) (LOW 3)
In North America, gas stations,
tobacconists and convenience stores are
the primary channels of distribution for
cigarettes. The share of supermarkets has
been falling because Americans associate
an unhealthy image with cigarettes while
the marketing objective of supermarkets
has been to promote healthy eating. Gas stations and convenience stores are not reliant on tobacco
sales because cigarettes are one of many goods they sale so they should have higher bargaining power
than tobacconists.
Asia (Japan as Proxy) (LOW 1)
Unlike most markets, the bulk of
cigarette distribution in Japan is
accomplished via vending machines that
7%2%
15%
4%
1%
21%
47%
3%
Cigarette Distribution Channels,US
Supermarkets/hypermarkets
Independent food stores
Convenience stores
Discounters
Drugstores
Tobacconists/specialists
Petrol/gas/service station
Others
Source: Euromonitor International
8%
20%
10%61%
1%
Cigarette Distrubution Channels, Japan
Supermarkets/ hypermarketsConvenience stores
Tobacconists/ specialists
Vending machines
Other
Source: Euromonitor International
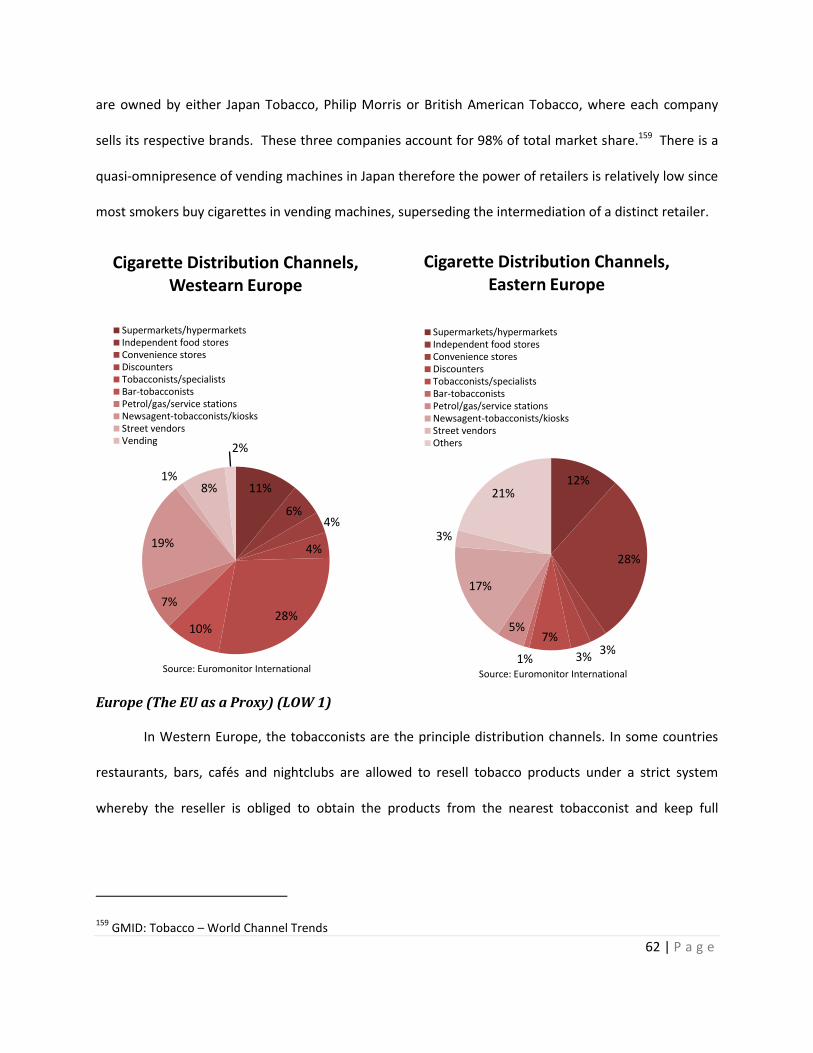
62 | P a g e
are owned by either Japan Tobacco, Philip Morris or British American Tobacco, where each company
sells its respective brands. These three companies account for 98% of total market share.159 There is a
quasi-omnipresence of vending machines in Japan therefore the power of retailers is relatively low since
most smokers buy cigarettes in vending machines, superseding the intermediation of a distinct retailer.
Europe (The EU as a Proxy) (LOW 1)
In Western Europe, the tobacconists are the principle distribution channels. In some countries
restaurants, bars, cafés and nightclubs are allowed to resell tobacco products under a strict system
whereby the reseller is obliged to obtain the products from the nearest tobacconist and keep full
159 GMID: Tobacco – World Channel Trends
12%
28%
3%3%
7%
1%
5%
17%
3%
21%
Cigarette Distribution Channels, Eastern Europe
Supermarkets/hypermarketsIndependent food storesConvenience storesDiscountersTobacconists/specialistsBar-tobacconistsPetrol/gas/service stationsNewsagent-tobacconists/kiosksStreet vendorsOthers
Source: Euromonitor International
11%
6%4%
4%
28%10%
7%
19%
1%8%
2%
Cigarette Distribution Channels,Westearn Europe
Supermarkets/hypermarketsIndependent food storesConvenience storesDiscountersTobacconists/specialistsBar-tobacconistsPetrol/gas/service stationsNewsagent-tobacconists/kiosksStreet vendorsVending
Source: Euromonitor International

63 | P a g e
records of the purchase including evidence of the tobacconist's stamp.160 In Eastern Europe, distribution
is dominated by unclassified outlets such as street kiosks, open markets and tobacconists, mostly due to
the low prices that cigarettes from these outlets command and the convenience of their extended
working hours.161 This method of product delievry to tobacco consumers undermines buyer power since
distributors are highly fragmented and thus have low bargaining power.
In Conclusion
There are over one billion smokers spread across the globe. This situation is deffinately one in
which tobacco consumers are fragmented. With low cohesion among distributors, tobacco retailers
have low bargaining power. Moreover, as individual smokers are price takers as they are addicted to
tobacco products and exhibit strong brand preference, making them reluctant to switch cigarette brand
or to substitute tobacco with an alternate product.
Five Forces Summary
The power of buyers on the aggregate scale is the lowest of five forces mainly because tobacco is a
highly addictive product and buyers are segmented, more so in Japan and the EU. This force is therefore
the most important. The threat of substitutes and the power of suppliers are equally low on a global
scale since suppliers are fragmented all over the world and there are neither perfect nor cheaper
substitutes. The threat of entry and direct competition are the lowest in Japan because of paternal
policy that favors the domestic tobacco company. The average of the Five Forces is lower in Japan and
higher in the US.
Country Direct Competition
Threat of Entry
Threat of Substitute
Power of Suppliers
Power of Buyers
Average
US 3 2 2 2 3 2.4
160 GMID: Tobacco – World Channel Trends
161 IBID.
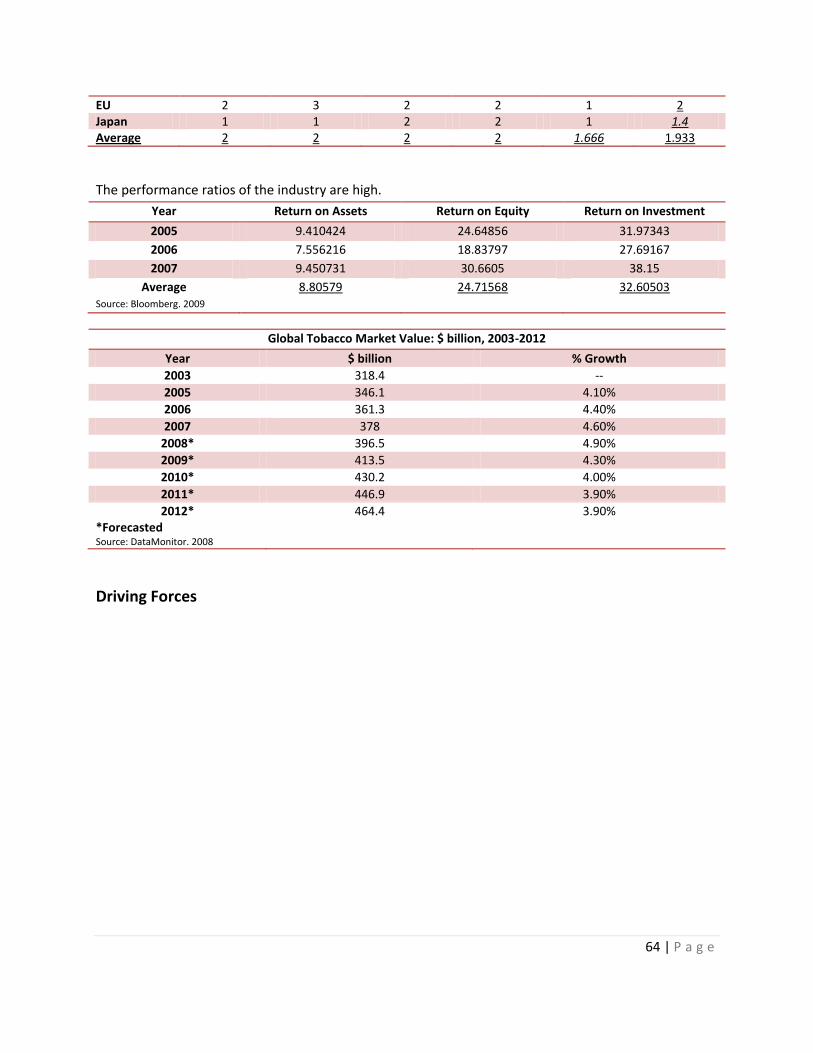
64 | P a g e
EU 2 3 2 2 1 2 Japan 1 1 2 2 1 1.4 Average 2 2 2 2 1.666 1.933
The performance ratios of the industry are high.
Year Return on Assets Return on Equity Return on Investment
2005 9.410424 24.64856 31.97343
2006 7.556216 18.83797 27.69167
2007 9.450731 30.6605 38.15
Average Source: Bloomberg. 2009
8.80579 24.71568 32.60503
Global Tobacco Market Value: $ billion, 2003-2012
Year $ billion % Growth
2003 318.4 --
2005 346.1 4.10%
2006 361.3 4.40%
2007 378 4.60%
2008* 396.5 4.90%
2009* 413.5 4.30%
2010* 430.2 4.00%
2011* 446.9 3.90%
2012* *Forecasted Source: DataMonitor. 2008
464.4 3.90%
Driving Forces

65 | P a g e
Socio-Cultural Impacts
Socio-cultural concerns are the driving forces of the tobacco industry. These concerns vary in
nature between developed and developing regions. Social concerns in developing nations are driving
the tobacco industry away from them and pressuring them to penetrate developing markets. Particular
social concerns include the aging population of developing countries. This variable leads one to believe
that over time, populations will begin to demise, which will directly impact the number of current and
prospective consumers within the tobacco industry. Rising health concerns in developed nations are
also raising a concern for the tobacco industry, as there is more health awareness being made; the
attractiveness of tobacco products is diminishing. Increasing number of anti-smoking campaigns are
also working against the tobacco industry and thereby making developed nations less attractive for the
Big Five tobacco companies.
66 | P a g e
Most of these concerns have advanced into political context as more anti-smoking campaigns
are coming about. Politicians are levering public opinion on tobacco to gain public interest and trust.
This in turn, has led to the creation of new, stricter, laws and regulations. Most developed countries are
raising bans towards the advertisement of tobacco products, thereby limiting their exposure to those
who may be influenced by them. Developing countries, on the other hand, are slowly decentralizing
allowing partnerships or even acquisition of small domestic tobacco companies by the Big Five tobacco
companies.
Shift to Emerging Markets
All these factors have made it extremely difficult for the tobacco industry to profit in developed
markets, which has led them to seek a refuge in new locations. Developing nations are not as socially
minded and provide potentially colossal markets for the tobacco industry. Moreover, few of these
markets are afflicted with anti-smoking regulations, which allows tobacco firms to gain better
recognition through advertising and to lower production costs.
Mergers and Acquisitions
The competitive context of the tobacco industry has been largely affected by the above
mentioned trends, due to relative shifts in market attractiveness. Since the barriers to entry are usually
high in established tobacco markets, the Big Five tobacco companies are proceeding in a global wave of
mergers and acquisition, targeting small companies in developing countries thereby gaining global
market share. The pressure to enter developing markets is intensifying the threat of entry in those
developing countries.
Effect on Direct Competition
As the Big Five tobacco companies get even bigger by acquisition, British American Tobacco and
Philip Morris in particular, the threat of direct competition gets smaller (less intense).
Effect on Buyer-Power

67 | P a g e
Consolidation in the tobacco industry also means that end buyers of tobacco products have less
‘suppliers’ (Big Five tobacco companies) to buy their product from. The less ‘suppliers’ there are, the
less buyers are able to bargain on prices. This degrades the power of buyers.
Summary of Industry Analysis
Considering the above assessment of the macro environment and the forecast of key economic
figures, it seems that the North-American, European, and Japanese economic prospect will be bleak.
However, the fact that we are in a global economic crisis should have little nominal impact on the
market for tobacco products. Tobacco companies are regarded as among the safest of defensive stocks
for investors and this has been demonstrated by the behaviour of the stocks during the huge falls in the
world's stock exchanges since November 2008. The most important macro trends affecting the tobacco
industry are therefore socio-cultural and political-legal in nature. Smokers are not tempted to smoke
less in times of economic difficulty or in times of stress and are highly fragmented therefore their power
is low.
Contrary to most modern goods, the cigarette as we know it today will not be easily replaced by
advances in technology. The technologies that tend to affect the industry are concerned with
operational efficiency, rather than new product innovation. This gives rise to internal efficiencies of
scale and translates as a competitive advantage for the Big Five tobacco companies, resulting in low
barrier to entry and low direct competition.
Anti-smoking campaigns and cigarette counterfeit and contraband pose a large threat to the
industry. Because of the pressure posed by these eminent social trends, the governments are imposing
policies that are unfriendly to the tobacco industry. Notably, smoking bans, bans on advertising, and
product packaging laws are creating a savage and shifting competitive environment. This shift in
competitive context has pushed the Big Five companies on a wave of merger and acquisition with
68 | P a g e
smaller tobacco companies in developing countries. This will further heighten barriers to entry and
reduce direct competition. Since fewer companies will have charge of the majority of tobacco products,
buyer power will decrease.
All of the above describe a great state of affairs for the already established Big Five tobacco
companies. However, the industry is certainly NOT attractive for smaller or younger tobacco companies
who lack internal economies of scale and the resources to diversify internationally.
The industry performance ratio are indeed very high and very attractive for an investor and the
market for tobacco product is forecasted to continue growing around 4% annually for the near future.
However, the attractiveness of the tobacco industry for investors is separate from the fact that the
industry is NOT attractive from the view point of an organization wishing to venture into the tobacco
industry.

69 | P a g e
Business Unit Analysis
Introduction to Value Chain Analysis
BAT was the product of a joint venture between the United Kingdom’s Imperial Tobacco Group
(ITG) and the United States’ American Tobacco Group (ATG) in 1902. The venture was created to
disallow the two firms from trading in the other’s respective country, so BAT did not operate in the UK
or the US; but instead it operated in Canada, Germany, Australia and etc. For 9 years, BAT went about
entering in different markets such as India, Malaysia and East Africa; but in 1911, ATG sold its shares of
BAT and BAT was listed on the London Stock Exchange; thereby enabling it to penetrate into the US
market. Between 1913 and 1921, BAT continued to expand its operations further into Latin America; in
countries such as Argentina, Venezuela, and Mexico. In 1927, BAT bought Brown & Williamson, allowing
it to enter the US. In 1956, it also acquired Benson & Hedges and a cigar manufacturer in 1966.162
Around this time up until the 80s, BAT began to diversify its operations and entered the food,
paper and pulp, retail, financial services and cosmetics industries. These diversifications lead BAT to
becoming the industry leader of cosmetics in the UK, as British American Cosmetics, and the acquisition
of Saks Fifth Avenue in the US. In 1976, BAT reorganized its operations and created BAT Industries,
which focused on financial services. This restructuring lead the group to limiting its focus into the
tobacco and finance industries, leaving the others behind. 163
BAT attained ownership of the Lucky Strike and Pall Mall cigarette brands when it purchased the
ATG In 1994. In 1998, BAT Industries sold off its financial services sector and attained Mexico’s Cigarrera
La Moderna. Dunhill along with other international brands were added to BAT’s brand portfolio when it
162 Datamonitor. British American Tobacco PLC - Company Profile. 13 October 2008.
163 IBID.

70 | P a g e
merged with Rothmans International, in 2000. BAT acquired the Canadian Business of Imperial Tobacco
in the same year, allowing it to extensively immerse itself into the Canadian market.164
BAT continued to acquire firms in Australia, Turkey, Italy, Serbia and other countries and also
combined Brown & Williamson with RJ Reynolds in 2004, becoming Reynolds America. Also in 2004,
BAT agreed to deal with the Chinese government to collaborate with China Eastern Investments
Corporation for a $1.5 billion joint venture to produce and sell cigarettes in China. BAT is the first and
only foreign company to manufacture cigarettes in the country. In 2005, BAT sold off Benson & Hedges
and Silk Cut trademarks and stopped producing cigarettes in the UK, moving to Korea Mexico and
Singapore. In the subsequent years, BAT continued to increase its stake in firms such as Skandinavisk
Tobakskompagni (STK). In 2008, BAT acquired Tekel, a Turkish tobacco company, and STK; allowing it to
enter into the Roll Your Own cigarettes (RYO) and Snus.165
Today, British American Tobacco (BAT) is the second largest tobacco company with a market
capitalization of $66.7 billion. As a result of the Philip Morris spin-off, BAT is the world's largest tobacco
company in terms of volume sales (excluding China National Tobacco Company). It operates in 180
countries through a large number of subsidiaries and associate companies. The group companies
produce about 684 billion cigarettes through 47 cigarette factories in 40 countries. The BAT group owns
a portfolio of more than 300 brands.166 The company enjoys above industry performance ratios.
Ratios and Metrics 12/31/2007 12/31/2006 12/31/2005 Average Industry Avg
ROA % 11.67 10.3 9.62 10.53 8.8058
ROE % 30.9 27.95 27.26 28.70333 24.7157
ROI % 39.58 34.85 28.12 34.18333 32.6050
EBITDA Margin % 34.08 32.42 31.86 32.78667 --
Revenue ($M) 52,556 49,347 41,286 47,729.67 --
Revenue Growth 0.0494 0.1914 -- 0.1204 --
164 IBID.
165 IBID.
166 Datamonitor, Global Tobacco: Industry Profile, Reference Code: 0199-0817, Publication date: December 2008
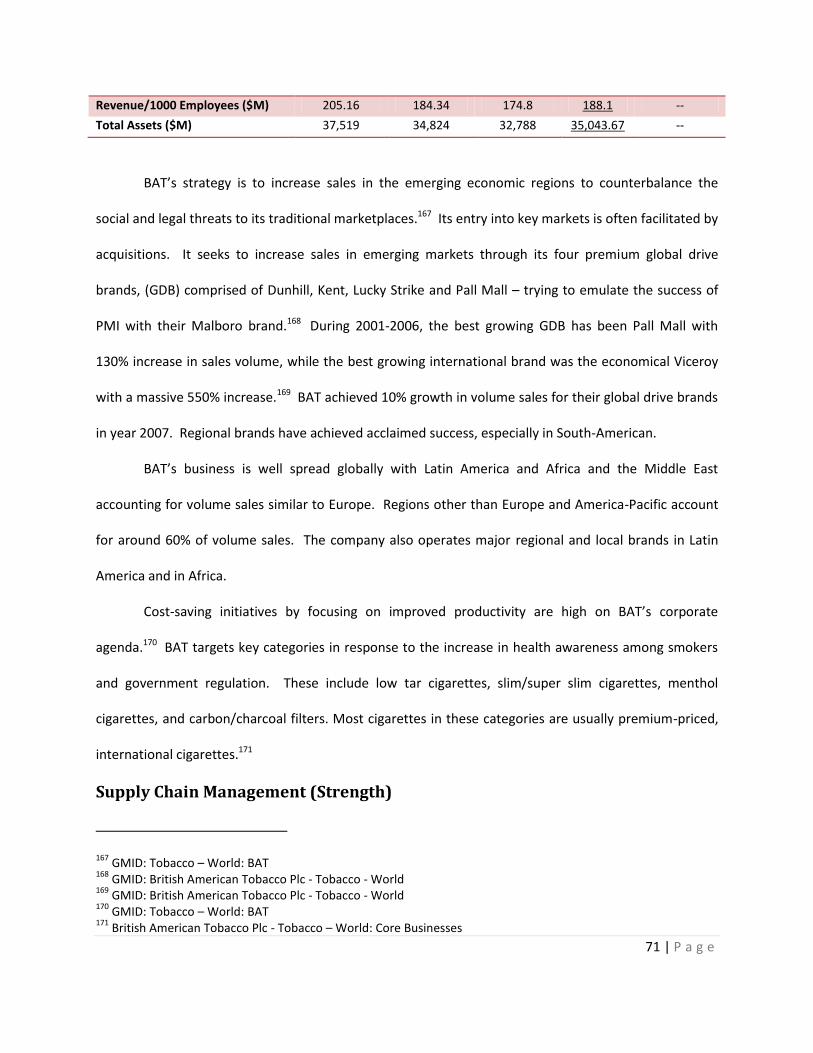
71 | P a g e
Revenue/1000 Employees ($M) 205.16 184.34 174.8 188.1 --
Total Assets ($M) 37,519 34,824 32,788 35,043.67 --
BAT’s strategy is to increase sales in the emerging economic regions to counterbalance the
social and legal threats to its traditional marketplaces.167 Its entry into key markets is often facilitated by
acquisitions. It seeks to increase sales in emerging markets through its four premium global drive
brands, (GDB) comprised of Dunhill, Kent, Lucky Strike and Pall Mall – trying to emulate the success of
PMI with their Malboro brand.168 During 2001-2006, the best growing GDB has been Pall Mall with
130% increase in sales volume, while the best growing international brand was the economical Viceroy
with a massive 550% increase.169 BAT achieved 10% growth in volume sales for their global drive brands
in year 2007. Regional brands have achieved acclaimed success, especially in South-American.
BAT’s business is well spread globally with Latin America and Africa and the Middle East
accounting for volume sales similar to Europe. Regions other than Europe and America-Pacific account
for around 60% of volume sales. The company also operates major regional and local brands in Latin
America and in Africa.
Cost-saving initiatives by focusing on improved productivity are high on BAT’s corporate
agenda.170 BAT targets key categories in response to the increase in health awareness among smokers
and government regulation. These include low tar cigarettes, slim/super slim cigarettes, menthol
cigarettes, and carbon/charcoal filters. Most cigarettes in these categories are usually premium-priced,
international cigarettes.171
Supply Chain Management (Strength)
167 GMID: Tobacco – World: BAT
168 GMID: British American Tobacco Plc - Tobacco - World
169 GMID: British American Tobacco Plc - Tobacco - World
170 GMID: Tobacco – World: BAT
171 British American Tobacco Plc - Tobacco – World: Core Businesses

72 | P a g e
The definition of supply chain varies from one organization to another, even varying within an
organization. The association for operations management (APICS) defines supply chain as “the global
network used to deliver products and services from raw material to end customers through an
engineered flow of information, physical distribution, and cash.” Thus, supply chain management (SCM)
can be defined as the design, planning, execution, control and monitoring of supply chain activities with
the objective of creating net value, building a competitive infrastructure, leveraging worldwide logistics,
synchronizing supply with demand, and measuring performance globally. 172 In order to analyze SCM
effectively, this section is divided in three different sub-categories: procurement, inbound logistics, and
cash flow activities.
British American Tobacco manages the tobacco supply chain from the seed to the smoke,
sourcing the required product from more than 40 countries173 and purchasing some 460,000 tonnes of
tobacco leaf a year. 174 Around 80 per cent of tobacco leaf supply comes from farmers and suppliers in
emerging economies.175 280,000 farmers supply all the leaf they buy.176 British American Tobacco
companies supplies these farmers with seeds, fertilizer and technical advice.177
Procurement
172 Ayers, James B. "SCM Assessment Tools ." Ayers, James B. Handbook of supply chain management. Boca Raton:
Auerbach Publications, 2006. 57. 173
British American Tobacco. Leaf Operations. 2008. February 2009 <http://www.bat.com/group/sites/uk__3mnfen.nsf/vwPagesWebLive/DO52AGLL?opendocument&SKN=1>. 174
Responsible leaf production. British American Tobacco. February 2009. <http://www.britishamericantobacco.com/group/sites/UK__3MNFEN.nsf/vwPagesWebLive/97E247DD4B43ED16C1257314004EF5E7?opendocument&SKN=1> 175
IBID. 176
IBID. 177
Crop to Consumer. British American Tobacco. February 2009. <http://www.britishamericantobacco.com/group/sites/UK__3MNFEN.nsf/vwPagesWebLive/DAA7099C52BE7BABC125734B0049A77F?opendocument&SKN=1>

73 | P a g e
5
5.5
6
6.5
7
7.5
8
8.5
9
9.5
10
2005 2006 2007
COGS over revenue(exise taxes excluded)
BAT
PMI
Procurement for a company such as British American Tobacco is an extremely critical supply
chain management activity. The optimal goal is to spend the least amount of money to purchase the
highest quality of raw material.
The metric that is most often used to determine the effectiveness of procurement is revenues in
terms of cost of goods sold (COGS). Due to accounting practice differences amongst countries, some
countries have included excise taxes in their COGS while some have not, in order to accurately compare
the three companies, two set of COGS have been used: COGS including excise tax and COGS excluding
excise tax. From both of these two ratios, we can conclude that, in the area of procurement, BAT is the
leading tobacco company as their cost of procurement and manufacturing is much lower compared to
that of other MTC strategic group companies.
Furthermore, the efficiency of BAT’s procurement is also revealed in their work in progress (WIP)
account. BAT has the lowest WIP inventory level compared to the other two companies which
demonstrates the efficiency of their production line. A journal article from Warren H. Hausamn
1.15
1.2
1.25
1.3
1.35
1.4
2005 2006 2007
COGS over Revenue (excise taxes included)
BAT
PMI
JTI
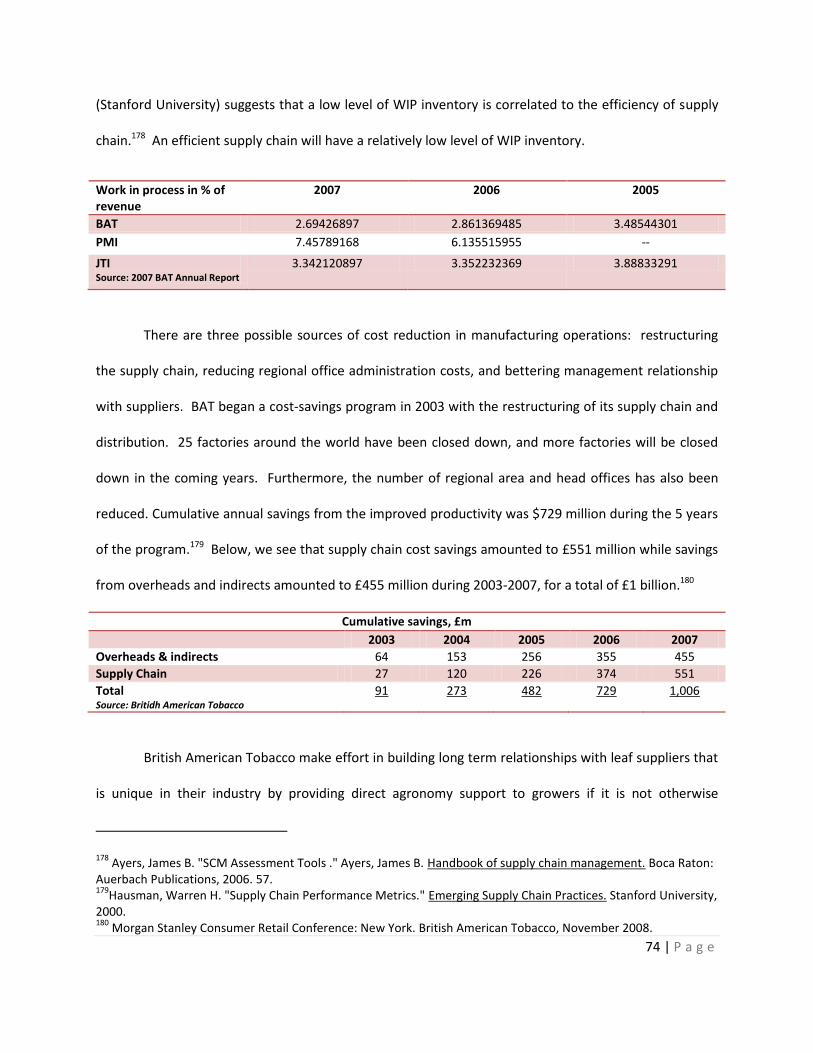
74 | P a g e
(Stanford University) suggests that a low level of WIP inventory is correlated to the efficiency of supply
chain.178 An efficient supply chain will have a relatively low level of WIP inventory.
Work in process in % of revenue
2007 2006 2005
BAT 2.69426897 2.861369485 3.48544301
PMI 7.45789168 6.135515955 --
JTI Source: 2007 BAT Annual Report
3.342120897 3.352232369 3.88833291
There are three possible sources of cost reduction in manufacturing operations: restructuring
the supply chain, reducing regional office administration costs, and bettering management relationship
with suppliers. BAT began a cost-savings program in 2003 with the restructuring of its supply chain and
distribution. 25 factories around the world have been closed down, and more factories will be closed
down in the coming years. Furthermore, the number of regional area and head offices has also been
reduced. Cumulative annual savings from the improved productivity was $729 million during the 5 years
of the program.179 Below, we see that supply chain cost savings amounted to £551 million while savings
from overheads and indirects amounted to £455 million during 2003-2007, for a total of £1 billion.180
Cumulative savings, £m
2003 2004 2005 2006 2007
Overheads & indirects 64 153 256 355 455
Supply Chain 27 120 226 374 551
Total Source: Britidh American Tobacco
91 273 482 729 1,006
British American Tobacco make effort in building long term relationships with leaf suppliers that
is unique in their industry by providing direct agronomy support to growers if it is not otherwise
178 Ayers, James B. "SCM Assessment Tools ." Ayers, James B. Handbook of supply chain management. Boca Raton:
Auerbach Publications, 2006. 57. 179
Hausman, Warren H. "Supply Chain Performance Metrics." Emerging Supply Chain Practices. Stanford University, 2000. 180
Morgan Stanley Consumer Retail Conference: New York. British American Tobacco, November 2008.

75 | P a g e
available. This involves providing seed and giving training, advice and support on all aspects of crop
production and environmental best practice.181 For many years, leaf staff in their companies have
worked in the field alongside farmers, many of whom are small producers in scattered rural
communities. This benefits both the farmers and us in improving crop yields and quality, while helping
growers to address the environmental and social issues associated with tobacco growing and processing.
In 2007 these agronomy services ran in 19 countries, reaching around 200,000 growers and covering
some 193,000 hectares under cultivation.182 Two thirds of the Group’s leaf, on average, is bought under
contract from growers who receive their direct agronomy support.183
Dow Jones has validated BAT’s effort in supplier relationship management by attributing them
with top scores relative to their industry counterparts, which have continuously improved over the year.
Dow Jones Sustainability Index Rating
Dow Jones Criteria Was 2007 score better than 2006?
Was score higher than sector average?
Social Standards for Suppliers ✔ ✔
Raw Material Sourcing Source: 2007 BAT Annual Report
✘ ✔
Procurement is a strength for British American Tobacco.
Logistics
Logistics in supply chain is a function that ensuring the movement of inventory is smoothly flow
and its storage level is in optimal capacity.
One of the most frequently used metric is inventory turnover. On the other hand, Warren H.
Hausamn, has stated that the use of this metric alone is a dangerous mistake often performed by
181 Responsible leaf production. British American Tobacco. February 2009.
<http://www.britishamericantobacco.com/group/sites/UK__3MNFEN.nsf/vwPagesWebLive/DO52APTT?opendocument&SKN=1&TMP=1> 182
IBID. 183
IBID.

76 | P a g e
accountant because the inventory turnover rate can be easily manipulated near the end of an
accounting period. For example, the manager responsible for WIP inventory can pull very little material
from raw materials inventory while rushing to liquidate costly products. Thus, the best way to
determine the efficiency of inbound logistic is to use multi-metric (service, financial) to determine the
efficiency of inbound logistic.184
Using WIP inventory levels, average days of inventory and inventory turnover rate, one can
clearly see that PMI is the laggard in this area of logistic. On the other hand, JTI and BAT both have a
sufficiently high inventory turnover rate. The high inventory turnover rate indicates a better logistic
system that is supportive of the high inventory turnover. Yet, the significantly high inventory turnover
can also represent an internal weakness – that risk of running out-of-stock, which may cause the lost of
customers. Furthermore, BAT has a lower level of work in process inventory than the other two
companies, while PMI is the laggard.
184Hausman, Warren H. "Supply Chain Performance Metrics." Emerging Supply Chain Practices. Stanford University,
2000.
0
2
4
6
8
10
2005 2006 2007
Inventory Turnover Rate (COGS with excise taxes)
BAT
PMI
JTI
0
10
20
30
40
50
60
70
80
2005 2006 2007
In D
ays
Average Inventory Holding Days
BAT
PMI
JTI
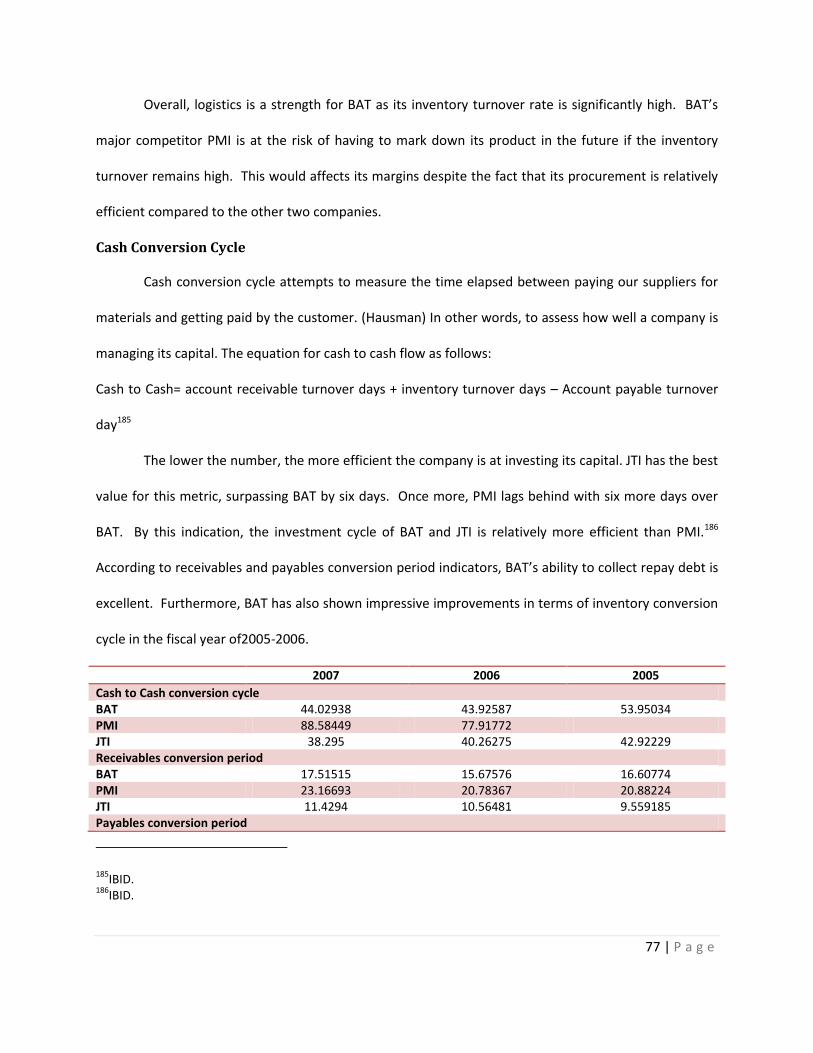
77 | P a g e
Overall, logistics is a strength for BAT as its inventory turnover rate is significantly high. BAT’s
major competitor PMI is at the risk of having to mark down its product in the future if the inventory
turnover remains high. This would affects its margins despite the fact that its procurement is relatively
efficient compared to the other two companies.
Cash Conversion Cycle
Cash conversion cycle attempts to measure the time elapsed between paying our suppliers for
materials and getting paid by the customer. (Hausman) In other words, to assess how well a company is
managing its capital. The equation for cash to cash flow as follows:
Cash to Cash= account receivable turnover days + inventory turnover days – Account payable turnover
day185
The lower the number, the more efficient the company is at investing its capital. JTI has the best
value for this metric, surpassing BAT by six days. Once more, PMI lags behind with six more days over
BAT. By this indication, the investment cycle of BAT and JTI is relatively more efficient than PMI.186
According to receivables and payables conversion period indicators, BAT’s ability to collect repay debt is
excellent. Furthermore, BAT has also shown impressive improvements in terms of inventory conversion
cycle in the fiscal year of2005-2006.
2007 2006 2005
Cash to Cash conversion cycle BAT 44.02938 43.92587 53.95034 PMI 88.58449 77.91772 JTI 38.295 40.26275 42.92229 Receivables conversion period BAT 17.51515 15.67576 16.60774 PMI 23.16693 20.78367 20.88224 JTI 11.4294 10.56481 9.559185 Payables conversion period
185IBID.
186IBID.

78 | P a g e
BAT 19.37823 18.62444 23.81604 PMI 35.66284 30.08463 JTI 12.3176 13.43163 10.9439 Inventory conversion cycle ( using COGS included exercising tax on the product) BAT 38.3456 40.45481 48.84926 PMI 72.99911 64.02026 56.73466 JTI 39.1832 43.12957 44.307
Overall, supply chain management is a strength for BAT. Over the years, the company has been
successful in improving its cost structure. This has improved its ability to compete with competitors.
Operations (Weakness)
In 2007, BAT produced 684 billion cigarettes in 39 cigarette factories in over 30 countries. In the
same year, BAT Group companies (including Reynolds American, ITC Group, and Skandinavisk
Tobakskompagni A/S) shipped 914 Billion sticks.187 That makes BAT the number one producer of
cigarettes, ever since the spinoff of Philip Morris International, in late 2007 (excluding CNTC).188
187 Altria annual Report, BAT annual report, Reynolds American Annual Report, ITC Annual Report, Skandinavisk
Tobakskompagni Annual Report. 188
GMID. Tobacco: World. 5 June 2008. 4 February 2009 <http://www.portal.euromonitor.com.proxy.library.carleton.ca/passport/ResultsList.aspx>.
400,000.00
500,000.00
600,000.00
700,000.00
800,000.00
900,000.00
1,000,000.00
2001 2002 2003 2004 2005 2006 2007
Number of Cigarettes Produced&Sold (Mn Sticks)
British American Tobacco Plc Philip Morris Cos Inc Japan Tobacco Inc Source: Euromonitot International

79 | P a g e
British American Tobacco has the most obvious global orientation of the MTC (Multinational
Tobacco Company) strategic group companies, as it operates in over 180 countries.189 BAT has a long
established presence in many emerging markets, notably Latin America and sub-Saharan Africa, and
thereby is better able than its competitors, to offset difficulties in one market by a good performance in
many others.190 Its main strategy in these countries is to promote its four global drive brands, as will be
discussed in the marketing and sales section, but BAT also follows a relatively high local orientation with
many of their brands focused solely on local markets. Because of its local focus, BAT has accumulated a
portfolio of 300 brands. That is twice as many brands as PMI and six times as many as JTI! To
complement this local orientation of their product strategy, BAT has 39 location specific company
websites, which is over seven times the combined number of PMI and JTI websites! Because the
business of BAT is globally spread while pursuing a heavy local product focus, it has 93 subsidiaries in 59
countries,191 which is between twice and three times the number of subsidiaries of the other MTC
companies.
Company Number of countries in which
it operates
Number of subsidiaries
Number of brands in portfolio
Number of company websites
British American Tobacco
>180 93 300 39
Philip Morris International
160 57 150 3
Japan Tobacco International Source: Euromonitor International
120 36 50 2
189 GMID. British American Tobacco Plc: Company Factfile . 2008. 4 February 2009
<http://www.portal.euromonitor.com.proxy.library.carleton.ca/passport/DocumentView.aspx>. 190
GMID. British American Tobacco PLC - World. 2008. 12 February 2009 <http://www.portal.euromonitor.com.proxy.library.carleton.ca/passport/ResultsList.aspx>. 191
Mergent Online. British American Tobacco Plc (ASE: BTI): 2009

80 | P a g e
Evidently, the global spread of BAT’s operations is truly remarkable. To cater to its local
strategies and brands, BAT has 39 production facilities, the most of its strategic group. BAT is the only
MTC constituent with production facilities in every region of the world.
Number of Production Facilities Per Region
Bri
tish
Am
eri
can
To
bac
co
Europe (10) Asia (10) South-America (10) Africa (5) Middle-East (3) North-America (1) Total (39)
Source: GMID, Tobacco - World
Ph
ilip
Mo
rris
In
tern
atio
nal
Europe (15) Asia (10) South-America (4) North-America (3) Total (32)
Jap
an T
ob
acco
In
tern
atio
nal
Asia (7) Europe (6) Middle-East (1) Total (14)
Although following such a specialized local strategy has its merits from the standpoint of
marketing and diversification, it does represent a significant operational challenge. As can be seen
below, BAT is producing only 16.8 Billion sticks per production facility, only half that of Philip Morris
International and about one third that of Japan Tobacco International. We believe that this is a
consequence of carrying such a large number of location specific brands. For example, JTI, which holds
only 50 brands, is able to produce about three times the volume of cigarettes per production facility as
BAT. PMI, which holds only half as many brands as BAT, can produce almost twice the volume of
cigarette per production facility as BAT.
Number of Brands and Number of Sticks as a Multiple of the Number of Production Facilities
Brands Sticks (Mn)
0
2
4
6
8
10
12
14
16
BAT
PMI
JTI

81 | P a g e
British American Tobacco 7.692307692 16,831.14615
Philip Morris International 4.6875 31,897.59688
Japan Tobacco International Source: GMID, Tobacco World
3.571428571 42,296.83571
One of the downsides of producing so many local brands in so many facilities around the world
is that it reduces operational efficiency. As can be seen by the graph below, British American Tobacco
has constantly held an inventory turnover ratio about three times smaller than that of Japan Tobacco.
This situation might be attributed to the fact that it is easier for a company to keep an efficient level of
inventory when it holds a small amount of brands. Because BAT holds 300 brands sold in so many
countries, it must operate a large number of factories and warehouses across the world thus
complicating inventory management.
According to its annual report, “BAT is saving money by turning a multinational business
operating in over 180 markets into an integrated global enterprise that can take advantage of its scale.”
BAT is in the process of running its “Product Complexity Reduction Programme,” which centers on
ensuring the efficient use of resources. Through this program, the company has successfully eliminated,
streamlined and optimized various specifications and practices in business. Notably, 452 specifications
for different cigarettes manufactured around the world were streamlined to 159, increasing sourcing
4
6
8
10
12
2005 2006 2007
Revenue as a Multiple of Average Inventory
BAT PMI JTISource: Factiva

82 | P a g e
opportunities and allowing hub planning to reduce costs.192 Also, the number of stock keeping units has
been reduced by 35% and the number of input materials by 40%, leaving a more focused, consumer
relevant portfolio.193 In the past five years, 400 Billion sticks of capacity was moved or removed as BAT
optimizes their factory footprint and delivers efficiencies.194 Since 2003, 25 factories around the world
have been closed down and the number of regional and head offices has been reduced. 195 Five factories
were closed down in year 2007, and several others are pending including one in Europe and one in
Africa.196 The company’s 2002 five year cost saving program reached over $1.4 Billion in annual savings,
with a new target set for annual savings of $1.1 Billion by 2012.197 The BAT Group has reduced their
factory footprint by one third from year 2003 to 2007.198 BAT sees more opportunities for savings
through back office integration and more efficient management structures.199
BAT Group Factory Footprint
2003 2004 2005 2006 2007
Cigarette factories 72 67 64 52 47
Countries Source: BAT
61 58 55 45 40
Although BATs earnest efforts to optimize operational efficiency have resulted in modest
payoffs, catching up to PMI in terms of inventory turnover, the company is experiencing noticeable
difficulties integrating its operations. Because of the global complexity of BAT’s business and because of
192 British American Tobacco. Bristish American Tobacco 2007 Annual Report. 2007.
193 IBID.
194 IBID.
195 GMID. British American Tobacco PLC - World. 2008. 12 February 2009
<http://www.portal.euromonitor.com.proxy.library.carleton.ca/passport/ResultsList.aspx>. 196
British American Tobacco. Bristish American Tobacco 2007 Annual Report. 2007. 197
IBID. 198
Morgan Stanley Consumer Retail Conference: New York. British American Tobacco. November 2008 <http://www.bat.com/group/sites/uk__3mnfen.nsf/vwPagesWebLive/DO6FKEVZ/$FILE/medMD7LJDQT.pdf?openelement> 199
IBID.
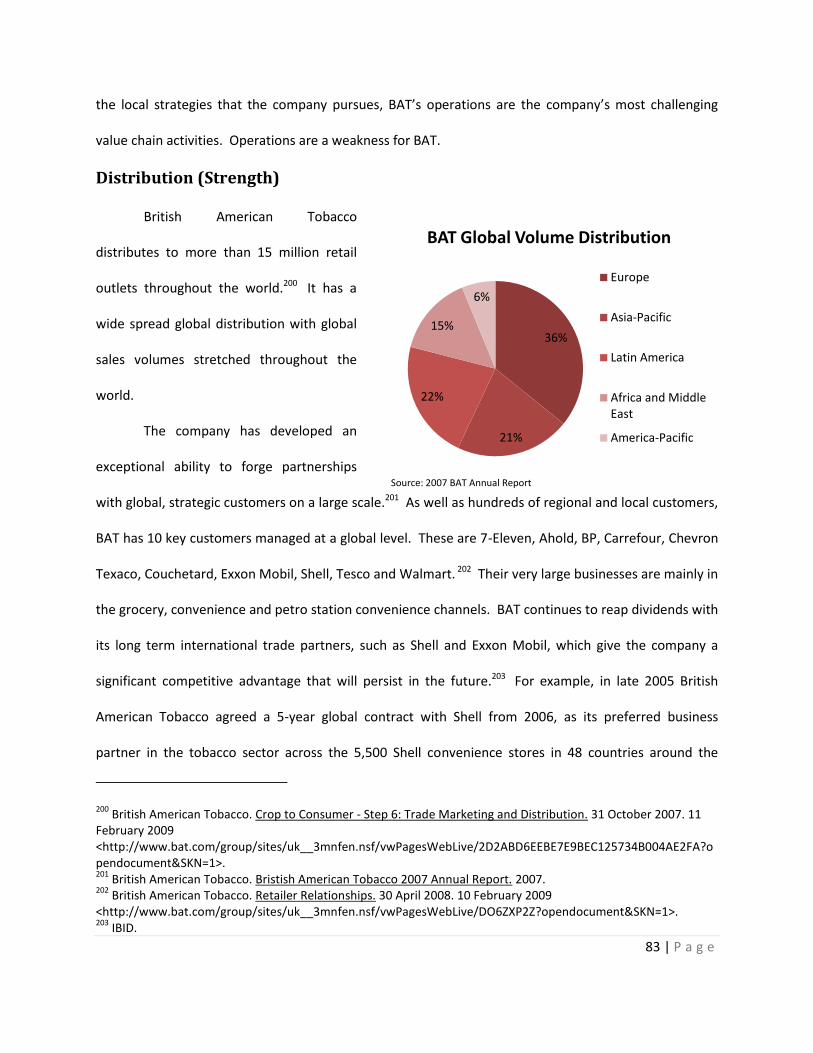
83 | P a g e
the local strategies that the company pursues, BAT’s operations are the company’s most challenging
value chain activities. Operations are a weakness for BAT.
Distribution (Strength)
British American Tobacco
distributes to more than 15 million retail
outlets throughout the world.200 It has a
wide spread global distribution with global
sales volumes stretched throughout the
world.
The company has developed an
exceptional ability to forge partnerships
with global, strategic customers on a large scale.201 As well as hundreds of regional and local customers,
BAT has 10 key customers managed at a global level. These are 7-Eleven, Ahold, BP, Carrefour, Chevron
Texaco, Couchetard, Exxon Mobil, Shell, Tesco and Walmart. 202 Their very large businesses are mainly in
the grocery, convenience and petro station convenience channels. BAT continues to reap dividends with
its long term international trade partners, such as Shell and Exxon Mobil, which give the company a
significant competitive advantage that will persist in the future.203 For example, in late 2005 British
American Tobacco agreed a 5-year global contract with Shell from 2006, as its preferred business
partner in the tobacco sector across the 5,500 Shell convenience stores in 48 countries around the
200 British American Tobacco. Crop to Consumer - Step 6: Trade Marketing and Distribution. 31 October 2007. 11
February 2009 <http://www.bat.com/group/sites/uk__3mnfen.nsf/vwPagesWebLive/2D2ABD6EEBE7E9BEC125734B004AE2FA?opendocument&SKN=1>. 201
British American Tobacco. Bristish American Tobacco 2007 Annual Report. 2007. 202
British American Tobacco. Retailer Relationships. 30 April 2008. 10 February 2009 <http://www.bat.com/group/sites/uk__3mnfen.nsf/vwPagesWebLive/DO6ZXP2Z?opendocument&SKN=1>. 203
IBID.
36%
21%
22%
15%
6%
BAT Global Volume Distribution
Europe
Asia-Pacific
Latin America
Africa and Middle East
America-Pacific
Source: 2007 BAT Annual Report

84 | P a g e
world.204 The relationship offers significant benefits to their business in growing their brands and will
benefit Shell through the sharing of tobacco consumer insights. Shell and Exxon Mobil alone give BAT
priority access to over 10,500 outlets, selling over 13 billion cigarettes in over 48 countries – outlets
whose customers largely match the profile of their Global Drive Brand consumers.205
To compensate for increasingly stringent restrictions on advertising, BAT has switched to Direct
Store Distribution (DSD) in many of its markets.206 Under DSD, distributors deliver products directly to
stores, enabling one-on-one contact with retailers, and so the company is able to influence how
products are displayed. It also helps to reduce "out of stocks" as retailers would be unlikely to run out of
product, and increases the speed to market.207 BAT aims to become the benchmark partner to the trade
in the strategic channels where they do business. They work to operate in the most efficient and
effective way so that retailers can offer the products that their consumers want, where they want them,
when they want them, at the right quantity and quality.208
About every two years, British American Tobacco commissions an annual customer satisfaction
measurement amongst key distribution and retail partners. The survey benchmarks British American
Tobacco against its major local tobacco competitor and the Fast Moving Consumer Goods (FMCG)
supplier seen as the best locally in serving the same retailers. It is run by independent research
consultants who select the customers at random from the businesses they serve.209 The most recent
results rate British American Tobacco as the best tobacco supplier in 12 of the 19 markets covered. The
204 British American Tobacco. Adding Value to the Relationship. 31 October 2007. 10 February 2009
<http://www.bat.com/group/sites/uk__3mnfen.nsf/vwPagesWebLive/DO6ZXPMX?opendocument&SKN=1&TMP=1>. 205
IBID. 206
GMID. British American Tobacco PLC - World. 2008. 12 February 2009 <http://www.portal.euromonitor.com.proxy.library.carleton.ca/passport/ResultsList.aspx>. 207
IBID. 208
British American Tobacco. Retailer Relationships. 30 April 2008. 10 February 2009 <http://www.bat.com/group/sites/uk__3mnfen.nsf/vwPagesWebLive/DO6ZXP2Z?opendocument&SKN=1>. 209
IBID.

85 | P a g e
company surpassed every of its domestic competitors 111 times out of a possible 143 times! This is the
hallmark of excellent distribution methods and a favoured customer oriented approach.
Customer Survey Results210
,211
Asia-Pacific: Best tobacco company 5 out of 7 markets Africa and the Middle East: Best tobacco company 2 out of 3 markets Europe: Best tobacco company 1 out of 5 markets Latin America: Best tobacco company 4 out of 4 markets World: Best tobacco company overall in the convenience channel 12 out of 16 markets World: Best tobacco company overall in the grocery channel 10 out of 16 markets World: Best tobacco company in trade marketing in the convenience channel 11 out of 16 markets World: Best tobacco company in trade marketing in the grocery channel 10 out of 16 markets World: Best tobacco company for product distribution in the grocery channel 11 out of 14 markets World: Best tobacco company for product distribution in the convenience channel 12 out of 13 markets World: Best tobacco company overall in the HORECA channel 12 out of 12 markets World: Best tobacco company in trade marketing in the HORECA channel 12 out of 12 markets World: best tobacco company for product distribution in the HORECA channel 9 out of 9 markets
Total 111 (77%) best scores out of a possible 143
British American Tobacco usually seeks to expand distribution channels in key markets by
acquiring major local players. For example, the 2008 acquisition of Tekel takes BAT to second place in
the Turkish market, with a share of approximately 38 per cent from roughly about 7 per cent before the
acquisition. In addition to all Tekel’s cigarette brands, BAT gained six factories, around two years’ stock
of tobacco leaf, and strong distribution channels.212
In comparison, Japan Tobacco and Philip Morris International fall short of optimizing their global
distribution strategies. Japan Tobacco has a very strong domestic distribution network, owning more
than one third of cigarette vending machines in a country in which about 60% of all tobacco sales are
210 British American Tobacco. Customer Satisfaction. 6 June 2008. 7 February 2009
<http://www.bat.com/group/sites/uk__3mnfen.nsf/vwPagesWebLive/DO6ZXPHB?opendocument&SKN=1&TMP=1>. 211
Note: Some of the 19 markets did not participate in particular categories where it was felt that meaningful detailed points of comparison do not exist. 212
GMID. British American Tobacco Plc: Company Factfile . 2008. 4 February 2009 <http://www.portal.euromonitor.com.proxy.library.carleton.ca/passport/DocumentView.aspx>.
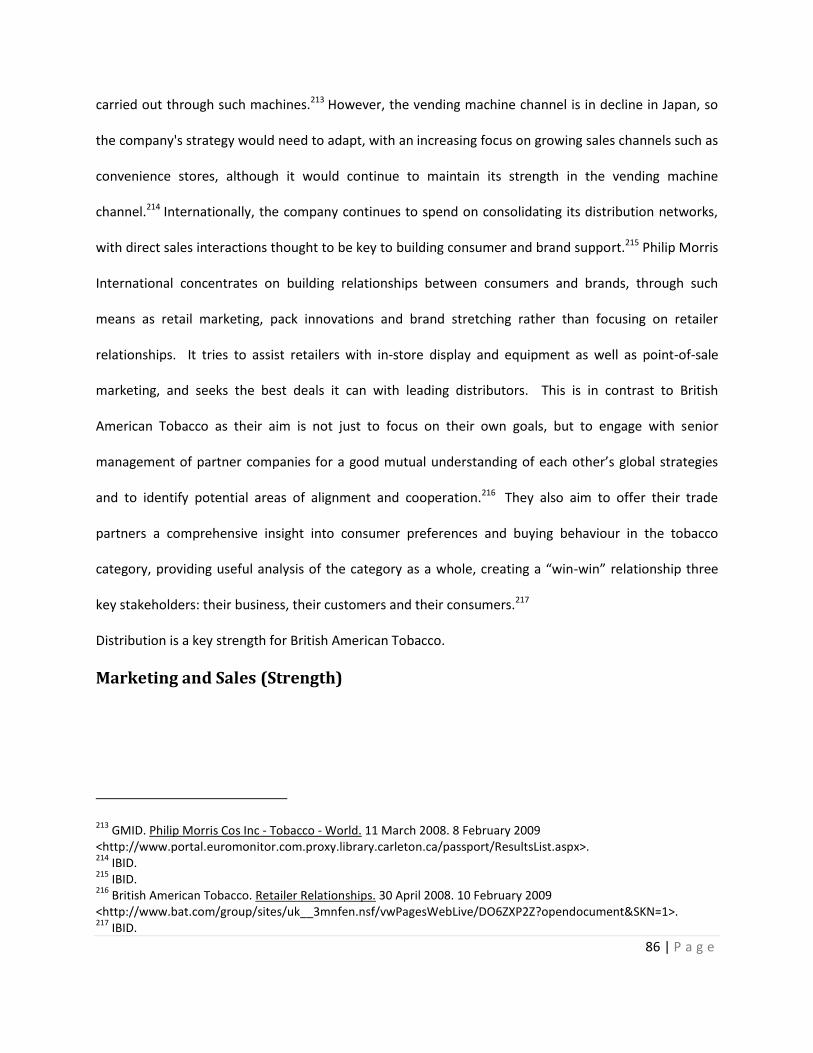
86 | P a g e
carried out through such machines.213 However, the vending machine channel is in decline in Japan, so
the company's strategy would need to adapt, with an increasing focus on growing sales channels such as
convenience stores, although it would continue to maintain its strength in the vending machine
channel.214 Internationally, the company continues to spend on consolidating its distribution networks,
with direct sales interactions thought to be key to building consumer and brand support.215 Philip Morris
International concentrates on building relationships between consumers and brands, through such
means as retail marketing, pack innovations and brand stretching rather than focusing on retailer
relationships. It tries to assist retailers with in-store display and equipment as well as point-of-sale
marketing, and seeks the best deals it can with leading distributors. This is in contrast to British
American Tobacco as their aim is not just to focus on their own goals, but to engage with senior
management of partner companies for a good mutual understanding of each other’s global strategies
and to identify potential areas of alignment and cooperation.216 They also aim to offer their trade
partners a comprehensive insight into consumer preferences and buying behaviour in the tobacco
category, providing useful analysis of the category as a whole, creating a “win-win” relationship three
key stakeholders: their business, their customers and their consumers.217
Distribution is a key strength for British American Tobacco.
Marketing and Sales (Strength)
213 GMID. Philip Morris Cos Inc - Tobacco - World. 11 March 2008. 8 February 2009
<http://www.portal.euromonitor.com.proxy.library.carleton.ca/passport/ResultsList.aspx>. 214
IBID. 215
IBID. 216
British American Tobacco. Retailer Relationships. 30 April 2008. 10 February 2009 <http://www.bat.com/group/sites/uk__3mnfen.nsf/vwPagesWebLive/DO6ZXP2Z?opendocument&SKN=1>. 217
IBID.

87 | P a g e
British American Tobacco has been a very profitable company in its time. It has become an
international brand name, sustaining global existence for over a hundred years, with over 300
recognizable brands in more than 180 markets.218
Market Share
Sales Volume Comparison (2007)219
Source: http://www.jti.com
British American Tobacco is the world’s second largest tobacco company in regards to its global
market share and is a current market leader in over 50 markets.220 Philip Morris International leads the
international market with the highest market share; however the biggest share is held by China’s China
National Tobacco Corp (CNTC), which is a state-owned monopoly and therefore not included in
218 British American Tobacco. Who We Are. 07 July 2008. 02 February 2009
<http://www.bat.com/group/sites/UK__3MNFEN.nsf/vwPagesWebLive/DO52ADCY?opendocument&SKN=1>. 219
Japan Tobacco Inc. Facts and Figures. 16 June 2008. 10 February 2009 <http://www.jti.com/about/facts>. 220
British American Tobacco. Who We Are. 07 July 2008. 02 February 2009 <http://www.bat.com/group/sites/UK__3MNFEN.nsf/vwPagesWebLive/DO52ADCY?opendocument&SKN=1>.

88 | P a g e
assessing the market shares. The following graph displays the market share breakdown for BAT, PMI
and JTI.
This graph presents the market
share as of 2007, however the 2008 Phillip
Morris International spin-off into Altria,
changed the scope of the company as it
was no longer one entity. This Change led
BAT to have a higher market share; thereby
making it a leader.
Sales Trends
Company 2007 2006 2005
Revenue British American Tobacco 52,556 49,347 41,286 Philip Morris International 55,096 48,260 45,288
Japan Tobacco Inc 40398 39420 43,567
Change in Retail Volume
British American Tobacco 6.5% 16.9% Philip Morris International 14.16% 6.56%
Japan Tobacco Inc 59.20% 2.48%
0
5
10
15
20
2001 2002 2003 2004 2005 2006 2007
Company Shares - Retail Volume (% Breakdown)
British American Tobacco Plc Philip Morris Cos Inc Japan Tobacco Inc
Source: Euromonitor International
11.7
18.3
10.6
1715
11
4
0
5
10
15
20
Global Market Share - % Volume Sales after the PMI
Spin-Off
2007
2008
Source: GMID
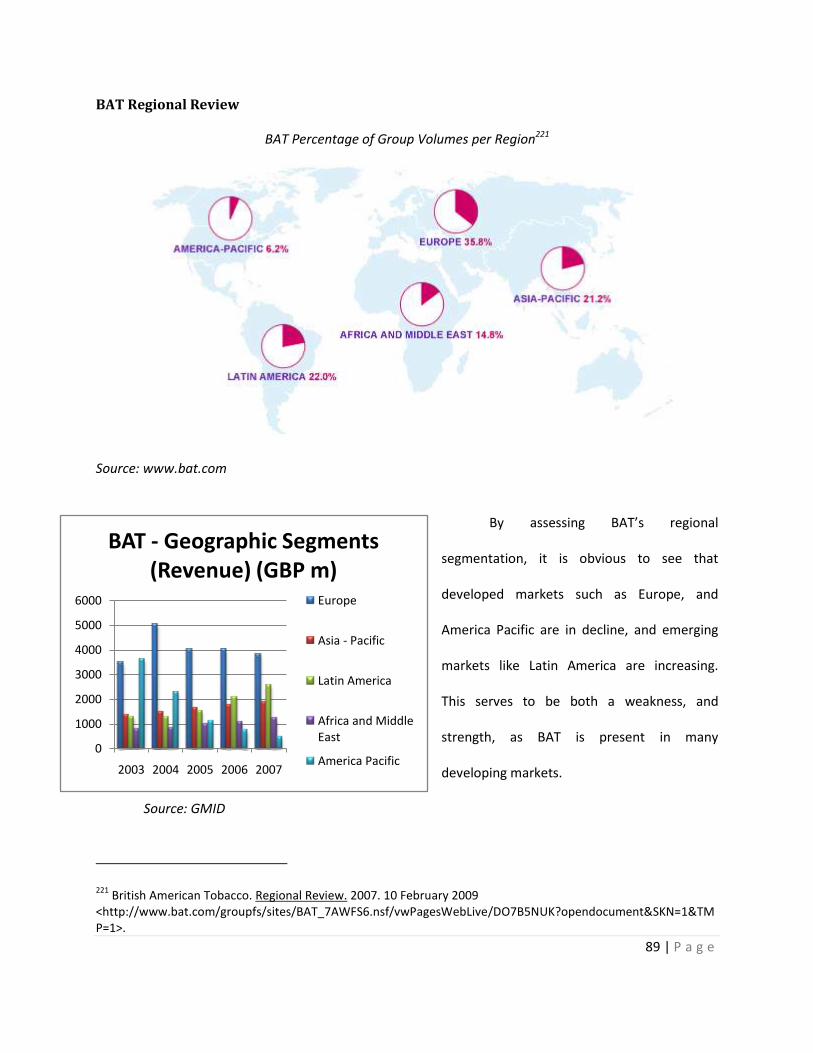
89 | P a g e
BAT Regional Review
BAT Percentage of Group Volumes per Region221
Source: www.bat.com
By assessing BAT’s regional
segmentation, it is obvious to see that
developed markets such as Europe, and
America Pacific are in decline, and emerging
markets like Latin America are increasing.
This serves to be both a weakness, and
strength, as BAT is present in many
developing markets.
Source: GMID
221 British American Tobacco. Regional Review. 2007. 10 February 2009
<http://www.bat.com/groupfs/sites/BAT_7AWFS6.nsf/vwPagesWebLive/DO7B5NUK?opendocument&SKN=1&TMP=1>.
0
1000
2000
3000
4000
5000
6000
2003 2004 2005 2006 2007
BAT - Geographic Segments (Revenue) (GBP m)
Europe
Asia - Pacific
Latin America
Africa and Middle East
America Pacific

90 | P a g e
PMI and JTI on the other hand, show an increase in developing markets. This may serve to be a
threat to them as the general shift in the tobacco industry, with FCTC regulations and increased health
awareness, is a decline in these markets. It is clear to see that within these two companies as well,
there is an increase in revenue from developing markets as well.
Source: GMID
BAT Marketing Mix
Product
Typical tobacco products amongst users are seen to be generally alike, with similar ingredients
as well as packaging. However, this area has become increasingly differentiated as new products and
innovations are being developed and introduced to the market. To stay competitive, companies are
having to stay on top of their research and development teams and promote innovation. This has led
the tobacco industry to ensure their current products are the best of the best, whether that means
0
5000
10000
15000
20000
25000
30000
35000
2005 2006 2007 2008
PMI - Geographic Segments (Revenue)
(USD m)
European Union
Eastern Europe, Middle East and Africa
Asia 0
1000
2000
3000
4000
5000
2004 2005 2006 2007 2008
JTI - Geographic Segments (Revenue)
(JPY b)
Japan
Western Europe
Others

91 | P a g e
improved tastes or better filters. There is also an advantage in having the best cut and refined
ingredients.222 This of course is an opportunity, if used correctly.
BAT has managed to attract not only the cigarette market, but also other tobacco markets with
the wide range of tobacco products it offers; it is also starting to include new and diverse products in its
lines. BAT offers cigarettes, cigars, fine-cut tobacco, pipe tobacco, roll-you-own cigarettes (RYO,stix),
snuff and snus. PMI on the other hand only produces cigarettes, cigars and RYO cigarettes, thereby
limiting its scope. Lastly, JTI has diversified into cigarettes, food and beverages, and pharmaceuticals,
which allows it to differentiate its products but in a very dissimilar way to BAT.223 This serves as an
opportunity to BAT, as even if cigarette smokers switch to a substitute like snus or RYO cigarettes, they
can remain with the same company, or switch to BAT brands.
There is also another opportunity present in selling a product like snus to the public. Smokeless
Swedish-style snus is seen to be less harmful than traditional cigarettes, and therefore presents itself as
an excellent substitute to cigarettes. This demonstrates BAT’s compassion and concern for the public
and enhances its image.
Global Drive Brands
BAT has a portfolio of over 300 brands, which differentiate based on segments, geographic
locations and consumer needs. Of those, BAT’s drive brands include Kent, Dunhill, Lucky Strike and Pall
Mall. Each have shown strong performances over the past years and have also shown growth on a
world-wide level.
222 British American Tobacco. Modern Tobacco Marketing. 7 November 2007. 10 February 2009
<http://www.bat.com/group/sites/UK__3MNFEN.nsf/vwPagesWebLive/DO78BDW6?opendocument&SKN=1&TMP=1>. 223
Dow Jones. British American Tobacco PLC. Factiva, 2009.
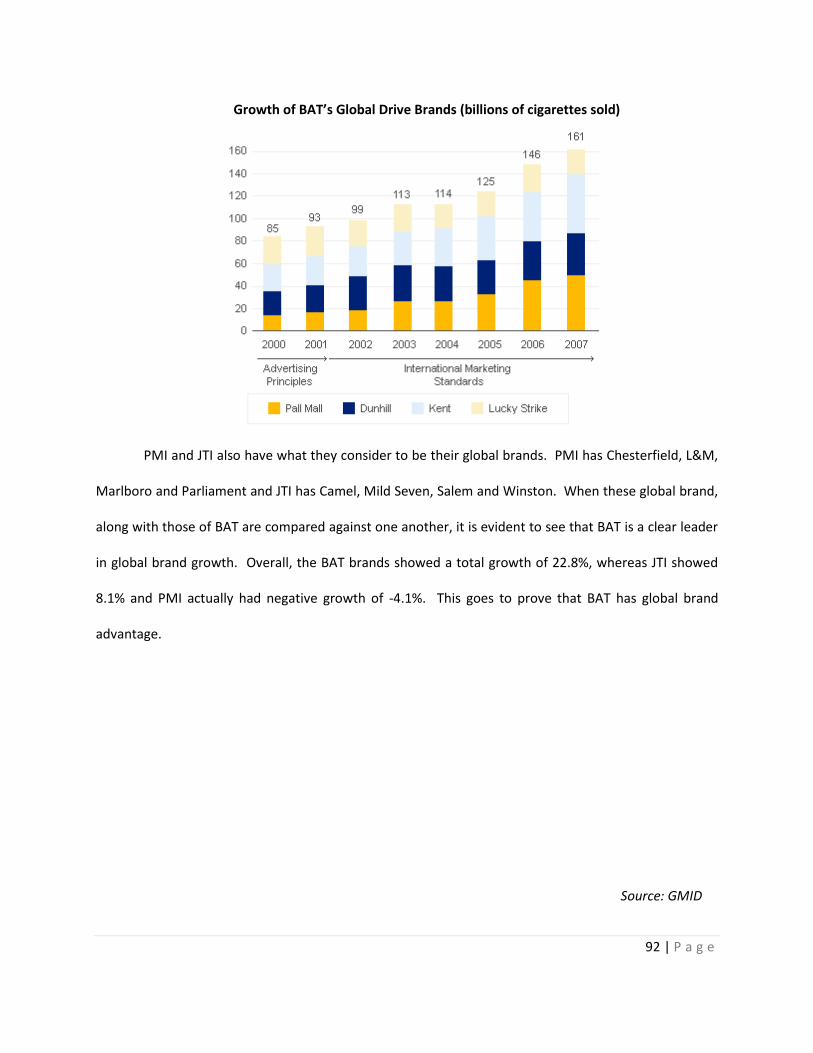
92 | P a g e
PMI and JTI also have what they consider to be their global brands. PMI has Chesterfield, L&M,
Marlboro and Parliament and JTI has Camel, Mild Seven, Salem and Winston. When these global brand,
along with those of BAT are compared against one another, it is evident to see that BAT is a clear leader
in global brand growth. Overall, the BAT brands showed a total growth of 22.8%, whereas JTI showed
8.1% and PMI actually had negative growth of -4.1%. This goes to prove that BAT has global brand
advantage.
Growth of BAT’s Global Drive Brands (billions of cigarettes sold)
Source: GMID
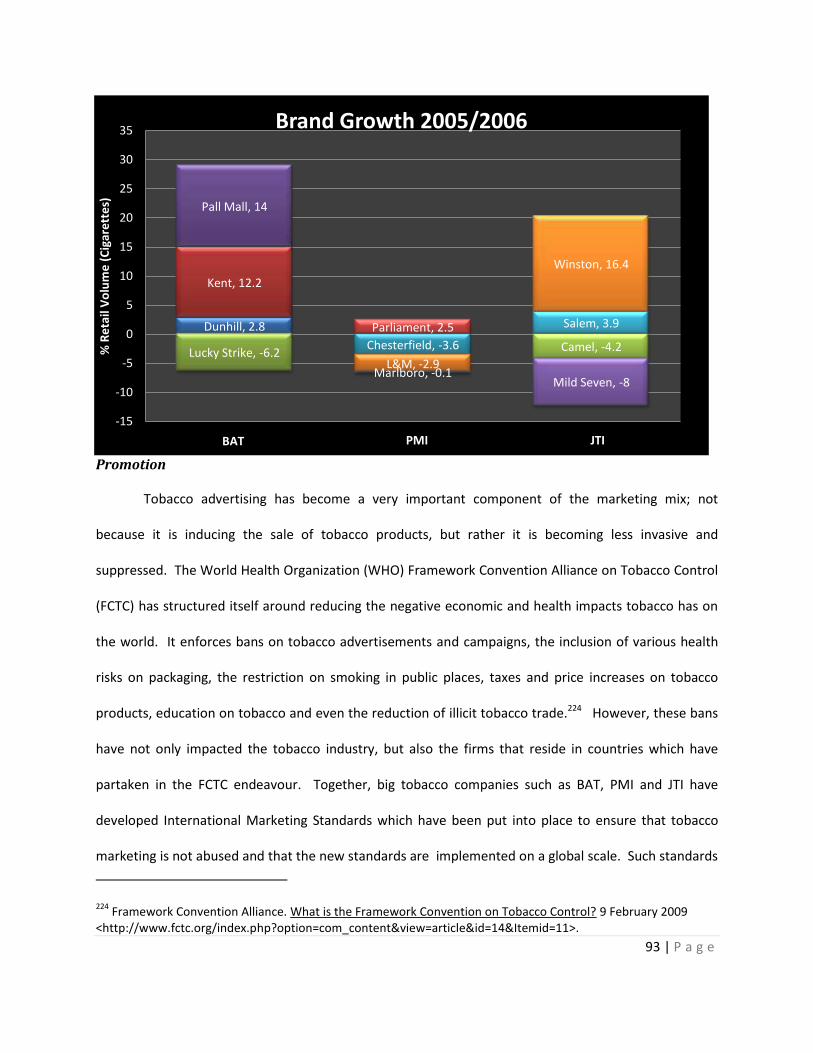
93 | P a g e
Promotion
Tobacco advertising has become a very important component of the marketing mix; not
because it is inducing the sale of tobacco products, but rather it is becoming less invasive and
suppressed. The World Health Organization (WHO) Framework Convention Alliance on Tobacco Control
(FCTC) has structured itself around reducing the negative economic and health impacts tobacco has on
the world. It enforces bans on tobacco advertisements and campaigns, the inclusion of various health
risks on packaging, the restriction on smoking in public places, taxes and price increases on tobacco
products, education on tobacco and even the reduction of illicit tobacco trade.224 However, these bans
have not only impacted the tobacco industry, but also the firms that reside in countries which have
partaken in the FCTC endeavour. Together, big tobacco companies such as BAT, PMI and JTI have
developed International Marketing Standards which have been put into place to ensure that tobacco
marketing is not abused and that the new standards are implemented on a global scale. Such standards
224 Framework Convention Alliance. What is the Framework Convention on Tobacco Control? 9 February 2009
<http://www.fctc.org/index.php?option=com_content&view=article&id=14&Itemid=11>.
Dunhill, 2.8
Kent, 12.2
Lucky Strike, -6.2
Pall Mall, 14
Chesterfield, -3.6
L&M, -2.9Marlboro, -0.1
Parliament, 2.5
Camel, -4.2
Mild Seven, -8
Salem, 3.9
Winston, 16.4
-15
-10
-5
0
5
10
15
20
25
30
35
% R
eta
il V
olu
me
(C
igar
ett
es)
Brand Growth 2005/2006
BAT PMI JTI

94 | P a g e
abide by the FCTC guidelines and include, the prohibition of marketing to minors, packaging and
sponsorship guidelines, and etc. As these standards are being placed, the tobacco industry is finding it
harder and harder to infiltrate new markets and new clientele.
Although this can be a threat to the firm, as it can become more difficult to increase awareness
of new BAT brands, strategies and innovations. However, this serves itself as an opportunity as well, as
BAT is a well-known company with several renowned brands world-wide and therefore does not need to
worry about promoting their brands as much as new competitors would. This also serves as an
advantage, as it improves the company’s image and shows corporate social responsibility towards the
society.
In the past, BAT used several modes of advertising,
before the FCTC regulations came into place. BAT’s different
brands promoted different values, allowing them to capture
diverse audiences. Their Pall Mall brand has been advertised in
various countries, representing different audiences. A billboard
advertisement for the brand’s light cigarettes, in Poland, shows
off a woman walking away with the cigarette in her hand, trailing smokeand being admired by both men
and women.225
BAT used its Voyage of Discovery campaign to inject its Gold Leaf brand in several African and
Asian countries, displaying several water-related sports and activities.226
225 Campaign for Tobacco-Free Kids. Tobacco Advertising Gallery. 2004. 10 February 2009
<http://www.tobaccofreekids.org/adgallery/index.php3?Brand=1>. 226
IBID.
Source: http://www.tobaccofreekids.org

95 | P a g e
Source: http://www.tobaccofreekids.org
The Lucky Strike brand on the other hand used sex appeal to attain its crowd. Also, the brand
used an acronym in the late 40s, L.S./M.F.T., signifying Lucky Strike Means Fine Tobacco, yet another
promotional tactic, as kids took this acronym and made it into funny sayings, thereby always being
reminded of the brand.227
Source: http://www.tobaccofreekids.org
All these advertisements can be used to determine a BAT consumer, although vast in their types
and segments. Their products are seen to be liberated, sexy and hip as were the consumers smoking
227 YouTube. 1948 - Lucky Strike Marching Cigarettes Ad. 18 March 2006. 10 February 2009
<http://www.youtube.com/watch?v=BU49DSS1ibc&feature=related>.

96 | P a g e
them. This image is still present in BAT consumers, as BAT is seen to be a mature company with widely
known brands.
BAT’s advertising strategies are of course different for every market. There are general global
strategies and campaigns used by the company, but the company has done a magnificient job at
ensuring each market is being appropriately marketed to. Of course this has changed dynamically since
the imposition of the FCTC regulations; BAT has had to change its marketing strategy in many markets.
BAT now offers a different form of advertising, which does not involve the mass media. It allows
those adults who wish to gain more information about their products either mailed information on
brands and etc or a face-to-face, one-on-one interaction in age-controlled locations. This allows the
tobacco firm to maintain its control over who is the intended receiver of the message, and prevents the
message from reaching under-aged or uninterested audiences.
BAT has also initiated several youth smoking prevention campaigns to ensure its products are
not targeting under-aged youths. There have been several advertising campaigns put forth to ensure
this initiative follows through by way of television commercials, websites, education programs and etc.
Dow Jones Sustainability Index Rating
Dow Jones Criteria Was 2007 score better than 2006?
Was score higher than sector average?
Corporate Citizenship/Philanthropy ✔ ✔
Responsible Marketing Policies Source: 2007 BAT Annual Report
✔ ✔
The Dow Jones Sustainability Index showed that BAT scored very high in terms to its corporate
citizenship/philanthropy and even responsible marketing policies. In addition to this, BAT spent $32.21

97 | P a g e
million USD on community spending initiatives.228 This goes to show that BAT is not only interested in
community needs, but is doing its best to maintain that connection with them. This is an opportunity.
Place
In today’s era of fast-moving products, it is important for a company to properly distribute its
products, so as not to harm the image of the product, and ensure its sales are 100% in that channel.
Tobacco companies must maintain great relationships with their distributors and ensure they are placing
their products appropriately.
FCTC regulations have limited tobacco distribution channels as well in Europe. Many EU states
have either banned or restricted the sale of cigarettes through vending machines and nearly 90% of the
EU has restricted the sale of cigarettes through electronic sale or mail order.229 This is a threat; as fewer
channels of distribution may represent fewer sales for BAT. There have also been restrictions in
countries like Canada in terms to displays in retail locations.230 Tobacco products are not allowed to be
displayed by any means within stores, so as not to attract new attention. Although traditionally seen as
a threat, this may present itself as an opportunity to BAT, as it would increase the barriers to entry for a
new firm. On a world-wide level, however, Internet sales are on the rise, as new technology and the
wider availability of this technology is facilitating it. This is an opportunity.
BAT prides itself on its trade-marketing team and feels it is excellent at managing its
relationships with its vast distributors. BAT has hundreds of local and regional distributors, but its top
228 British American Tobacco. Bristish American Tobacco 2007 Annual Report. 2007.
229 http://data.euro.who.int/tobacco/?TabID=93302
230 Health Canada. A Proposal to Regulate the Display and Promotion of Tobacco and Tobacco-Related Products at
Retail. 8 January 2008. 10 February 2009 <http://www.hc-sc.gc.ca/hl-vs/tobac-tabac/commun/consultation/_tob-ret/6-eng.php>.

98 | P a g e
10 global ones are: 7-Eleven, Ahold, BP, Carrefour, Chevron Texaco, Couchetard, Exxon Mobil, Shell,
Tesco and Walmart; all of which are based in the convenience, grocery and gas station channels.231
British American Tobacco also participates in direct store sales (DDS). Retail stores account for many
sales for the company and BAT maintains these sales by selling to them directly.232 BAT currently
distributes to over 15 million retailers world-wide.233 By following DDS, BAT is at an advantage as its
products get delivered directly to the stores by distributors. These distributors also clean the display
and ensure that the products are properly priced and it also allows BAT to maintain in direct contact
with its retailers.234
Price
Prices within the tobacco industry tend to remain the same amongst competitors; but because it
is a very price-competitive industry, tobacco companies are constantly having to keep their eyes on this
matter to ensure that the price they offer remains competitive.
Keeping that in mind, most tobacco companies offer a variety of brands to try and fit nearly
every segment of the market. BAT prides itself on its wide-range of tobacco products which offers
brands at super premium, premium, mid-price and value-for-money prices.235 This is an advantage, as
BAT can attract consumers from several markets.
232
British American Tobacco. Retailer Relationships. 30 April 2008. 10 February 2009 <http://www.bat.com/group/sites/uk__3mnfen.nsf/vwPagesWebLive/DO6ZXP2Z?opendocument&SKN=1>. 233
British American Tobacco. Crop to Consumer - Step 6: Trade Marketing and Distribution. 31 October 2007. 11 February 2009 <http://www.bat.com/group/sites/uk__3mnfen.nsf/vwPagesWebLive/2D2ABD6EEBE7E9BEC125734B004AE2FA?opendocument&SKN=1>. 234
GMID. British American Tobacco - PLC. 2008. 12 February 2009 <http://www.portal.euromonitor.com.proxy.library.carleton.ca/passport/ResultsList.aspx>. 235
British American Tobacco. Modern Tobacco Marketing. 7 November 2007. 10 February 2009 <http://www.bat.com/group/sites/UK__3MNFEN.nsf/vwPagesWebLive/DO78BDW6?opendocument&SKN=1&TMP=1>.

99 | P a g e
Excise taxes also have a grave impact on prices. They increase the price of the tobacco product
and when such tobacco products are already high in price, such as premium cigarettes, then consumers
may no longer wish to purchase them, and rather opt for a cheaper brand. This could also lead to an
increase in illicit tobacco sales as well. Most tobacco products are heavily taxed to discourage their use;
they also bring in tax revenue for governments. This is a threat.
Customer Service (Strength)
British American Tobacco has upheld strong relationships with their customers; both
distributors and retailers. They have prided themselves on these relationships and uses them as a form
of competitive advantage. British American Tobacco’s Win-Win-Win approach allows their consumers,
customers and shareholders to benefit and win, as the company ensures each party’s interests are kept
in mind. BAT ensures that its customers are happy with the products they are receiving and have the
knowledge to efficiently sell the product. As previously discussed, BAT uses a direct-store-distribution
(DSD) approach. Under DSD, distributors deliver products directly to stores, enabling one-on-one
contact with retailers. This helps to reduce "out of stocks" as retailers would be unlikely to run out of
product, and increases the speed to market. BAT aims to become the benchmark partner to the trade
in the strategic channels where they do business. As seen below, the Dow Jones Sustainability Index has
consistently given BAT top customer service scores.
Dow Jones Sustainability Index Rating
Dow Jones Criteria Was 2007 score better than 2006?
Was score higher than sector average?
Customer Relationship Management ✔ ✔
Combat Smuggling Source: 2007 BAT Annual Report
✔ ✔
BAT maintains its great relationship with its customers by regularly providing them with
customer satisfaction surveys in order to assess its own performance and implement the changes that

100 | P a g e
they conclude would best serve their customers. This has enabled BAT to improve and better their
service standards. In 2005, out of 19 markets surveyed, BAT’s customers awarded 79 (74%) best
customer service scores out of a possible 107.
BAT Customer Satisfaction Survey Results[1] 236
Asia-Pacific: Best tobacco company 5 out of 7 markets
Africa and the Middle East: Best tobacco company 2 out of 3 markets
Europe: Best tobacco company 1 out of 5 markets
Latin America: Best tobacco company 4 out of 4 markets
World: Best tobacco company overall in the convenience channel 12 out of 16 markets
World: Best tobacco company overall in the grocery channel 10 out of 16 markets
World: Best tobacco company in trade marketing in the convenience channel 11 out of 16 markets
World: Best tobacco company in trade marketing in the grocery channel 10 out of 16 markets
World: Best tobacco company overall in the HORECA channel 12 out of 12 markets
World: Best tobacco company in trade marketing in the HORECA channel 12 out of 12 markets
Total 79 (74%) best scores out of a possible 107
British American Tobacco management proudly claims to have no significant concentrations of
customer credit risk. The large number of BAT subsidiaries have policies in place requiring appropriate
credit checks on potential customers before the commencement of sales. The process for monitoring
and managing credit risk once sales to customers have been made varies depending on local practice in
the countries concerned. Certain territories have bank guarantees, other guarantees and credit
insurance provided in BAT’s favour. In respect to trade receivables, the issuance and terms are
dependent on local practices in the countries concerned. Unfortunately, BAT’s receivables turnover is
significantly lower than that of competitors. This might be due to BAT’s relatively strong presence in
emerging markets where they deal with unaccommodating administration. Throughout the last years,
no improvement has been made to this ratio. This therefore represents a challenge for the company.
236 British American Tobacco. Customer Satisfaction. 6 June 2008. 7 February 2009
<http://www.bat.com/group/sites/uk__3mnfen.nsf/vwPagesWebLive/DO6ZXPHB?opendocument&SKN=1&TMP=1>.

101 | P a g e
On the other hand, a low receivables turnover signifies an important benefit to the customers of BAT,
hinting at a greater tolerance for accounts receivables on the part of the company.
BAT is also trying its best to combat illicit trade as it erodes the sales of its distributors and
retailers. For example, BAT Nigeria awards wholesalers and retailers’ trade performance rewards on the
basis that they are providing genuine products. These rewards not only prevent illicit trade, but also
help build a tighter bond between BAT and its customers. 237
BAT also tries to maintain and enhance its relationship with consumers by providing them
various forms in which they can contact the company. The main BAT website, www.bat.com, offers
assistance in browsing with the site and with the technology needed to do so, a frequently asked
questions (FAQ) section, and external links. BAT has 39 group websites in total, whereas PMI has 3 and
JTI only 2.
BAT also has a contact us section in which consumers can send inquiries directly to head office;
it also has a phone number for the main location, and a 24-hour line for media questions. Both JTI and
237 British American Tobacco. Adding Value to the Relationship. 31 October 2007. 10 February 2009
<http://www.bat.com/group/sites/uk__3mnfen.nsf/vwPagesWebLive/DO6ZXPMX?opendocument&SKN=1&TMP=1>.
05
10152025303540
2005 2006 2007
Receivables Turnover
BAT
PMI
JTI

102 | P a g e
PMI offer an address to which consumers can send their inquiries along with products, which they are
unhappy with. All three companies have an investor contact phone number.
Overall, British American Tobacco provides its customers with outstanding service. Customer
Service is an ambivalent strength for BAT.
Human Resource Management (Weakness)
Human capital is one of the most important factors that affect the company success in long-run.
No organization can function properly without people. Britisah American Tobacco has the most
employees of the MTC strategic group companies with almost three times the number of employees of
Japan Tobacco. Despite restructuring their supply chain by closing down factories, BAT’s workforce
continues to increase. Some of this increase is a result of acquisitions.
Numbers of employee 2007 2006 2005
British American 97696 97431 96952 Philip Morris 75500 N/A N/A Japan Tobacco 33428 31476 32640
BAT has a low net income and revenue per employee. This has indicates that the company is
suffering from a relative lack of productivity. While PMI is the leader in terms of income per employee,
JTI’s operation income is relatively unstable. BAT’s employee productivity has increased over the years.
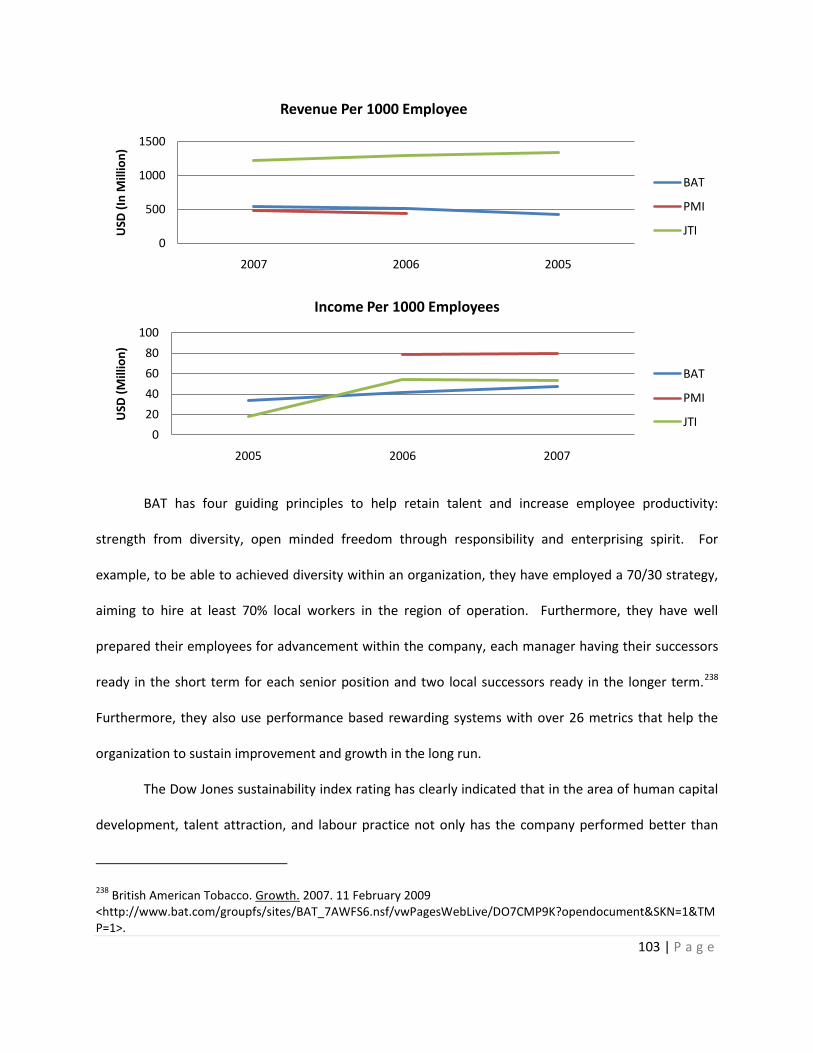
103 | P a g e
BAT has four guiding principles to help retain talent and increase employee productivity:
strength from diversity, open minded freedom through responsibility and enterprising spirit. For
example, to be able to achieved diversity within an organization, they have employed a 70/30 strategy,
aiming to hire at least 70% local workers in the region of operation. Furthermore, they have well
prepared their employees for advancement within the company, each manager having their successors
ready in the short term for each senior position and two local successors ready in the longer term.238
Furthermore, they also use performance based rewarding systems with over 26 metrics that help the
organization to sustain improvement and growth in the long run.
The Dow Jones sustainability index rating has clearly indicated that in the area of human capital
development, talent attraction, and labour practice not only has the company performed better than
238 British American Tobacco. Growth. 2007. 11 February 2009
<http://www.bat.com/groupfs/sites/BAT_7AWFS6.nsf/vwPagesWebLive/DO7CMP9K?opendocument&SKN=1&TMP=1>.
0
500
1000
1500
2007 2006 2005
USD
(In
Mill
ion
)Revenue Per 1000 Employee
BAT
PMI
JTI
0
20
40
60
80
100
2005 2006 2007
USD
(M
illio
n)
Income Per 1000 Employees
BAT
PMI
JTI
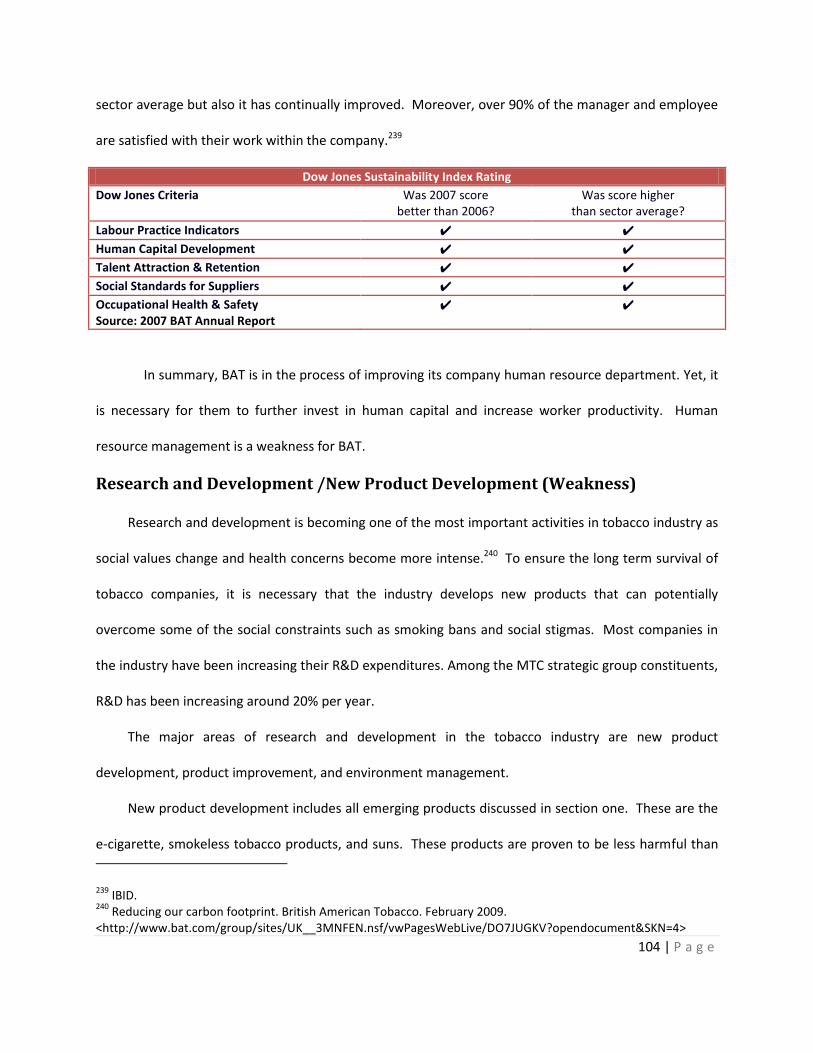
104 | P a g e
sector average but also it has continually improved. Moreover, over 90% of the manager and employee
are satisfied with their work within the company.239
Dow Jones Sustainability Index Rating
Dow Jones Criteria Was 2007 score better than 2006?
Was score higher than sector average?
Labour Practice Indicators ✔ ✔
Human Capital Development ✔ ✔
Talent Attraction & Retention ✔ ✔
Social Standards for Suppliers ✔ ✔
Occupational Health & Safety Source: 2007 BAT Annual Report
✔ ✔
In summary, BAT is in the process of improving its company human resource department. Yet, it
is necessary for them to further invest in human capital and increase worker productivity. Human
resource management is a weakness for BAT.
Research and Development /New Product Development (Weakness)
Research and development is becoming one of the most important activities in tobacco industry as
social values change and health concerns become more intense.240 To ensure the long term survival of
tobacco companies, it is necessary that the industry develops new products that can potentially
overcome some of the social constraints such as smoking bans and social stigmas. Most companies in
the industry have been increasing their R&D expenditures. Among the MTC strategic group constituents,
R&D has been increasing around 20% per year.
The major areas of research and development in the tobacco industry are new product
development, product improvement, and environment management.
New product development includes all emerging products discussed in section one. These are the
e-cigarette, smokeless tobacco products, and suns. These products are proven to be less harmful than
239 IBID.
240 Reducing our carbon footprint. British American Tobacco. February 2009.
<http://www.bat.com/group/sites/UK__3MNFEN.nsf/vwPagesWebLive/DO7JUGKV?opendocument&SKN=4>

105 | P a g e
cigarettes and many countries have already started to ban them (i.e. Australia has already banned the e-
cigarette).241 Tobacco companies are also trying to improve their product by seeking to find ways to
manufacture a healthier cigarette, spending
In terms of environment management, tobacco companies are continuously looking for ways to
ameliorate such activities as packing, manufacturing and harm reduction. As consumers become more
environmentally conscious, most tobacco companies, including BAT and JTI, have devoted themselves to
improve the environmental impact of operation processes in order to create a better corporate
image.242 For example, BAT has launched a program called environment resource management program
(ERM) to research how to reduce their carbon footprint.243 Their long term goal is to reduce carbon
dioxide emissions by 50% by 2030 and 85% by 2050 using year 2000 as a baseline.244 In order to achieve
the set goals BAT not only increases effort in controlling its own manufacture. They also monitor their
supplier to reduce the overall supplier chain’s carbon footprint. On the other hand, JTI has launched a
program called Climate Change program. This program is a continuously improvement process that
seeking to eliminate waste and help prevent climate change.245
Philip Morris International has the largest research and development expenditure, spending about
4.5 times what BAT does. Historically, BAT has spent extremely low amounts on research and
development, rather preferring to focus on marketing its plethora of brands and adding new ones to
their portfolio.
R&D expenditure (In USD; million)
2007 2006 2005
241 SAV. Despite a Ban, E-cigarettes are Available Online. 20 January 2009. 12 February 2009
<http://www.medindia.net/news/Despite-a-Ban-E-cigarettes-are-Available-Online-46537-1.htm> . 242
Japan Tobacco. Climate for Change. 2007. 243
Reducing our carbon footprint. British American Tobacco. February 2009. <http://www.bat.com/group/sites/UK__3MNFEN.nsf/vwPagesWebLive/DO7JUGKV?opendocument&SKN=4> 244
IBID. 245
Japan Tobacco. Climate for Change. 2007.

106 | P a g e
BAT 86.03 66.23 52.7
PMI 362 304 N/A
JTI Source: Bloomberg.
329.24 317.85 317.85
As a result of low research and development investment, BAT has only issued one third as many
patents as PMI.
Number of patent filed 2007 2006 2005
BAT 116 101 90
PMI 309 327 243
JTI Source: European Patent Office.
250 305 321
On the other hand, the amount of money that BAT spends per patent is significantly lower than
that of the other two companies. In 2007, BAT spent 56% less per patent than PMI while it spent 63%
less per patent than JTI. This hints at BAT’s apparent relative efficiency in the area of research and
development.
Cost of patents (In USD; million) 2007 2006 2005
BAT 0.741638 0.655743 0.585556
PMI 1.171521 0.929664
JTI Source: European Patent Office.
1.31696 1.042131 0.990187
BAT’s Research and development
expenditure per sales is 3 times and 4 times less
than PMI and JTI respectively. To remain
competitive and sustain growth, the company
must spend more on research and development.
Despite its leading position in return on
0
0.2
0.4
0.6
0.8
1
2005 2006 2007
Research & Development over Revenue
BAT
PMI
JTI
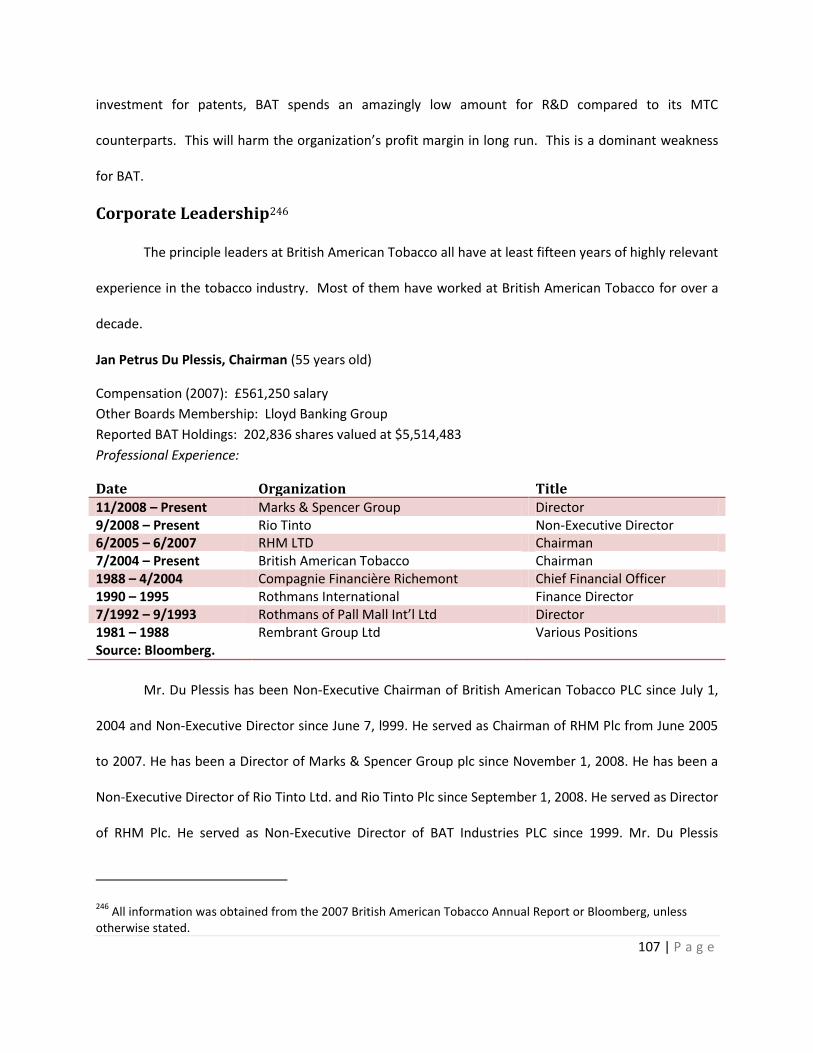
107 | P a g e
investment for patents, BAT spends an amazingly low amount for R&D compared to its MTC
counterparts. This will harm the organization’s profit margin in long run. This is a dominant weakness
for BAT.
Corporate Leadership246
The principle leaders at British American Tobacco all have at least fifteen years of highly relevant
experience in the tobacco industry. Most of them have worked at British American Tobacco for over a
decade.
Jan Petrus Du Plessis, Chairman (55 years old)
Compensation (2007): £561,250 salary
Other Boards Membership: Lloyd Banking Group
Reported BAT Holdings: 202,836 shares valued at $5,514,483
Professional Experience:
Date Organization Title
11/2008 – Present Marks & Spencer Group Director 9/2008 – Present Rio Tinto Non-Executive Director 6/2005 – 6/2007 RHM LTD Chairman 7/2004 – Present British American Tobacco Chairman 1988 – 4/2004 Compagnie Financière Richemont Chief Financial Officer 1990 – 1995 Rothmans International Finance Director 7/1992 – 9/1993 Rothmans of Pall Mall Int’l Ltd Director 1981 – 1988 Source: Bloomberg.
Rembrant Group Ltd Various Positions
Mr. Du Plessis has been Non-Executive Chairman of British American Tobacco PLC since July 1,
2004 and Non-Executive Director since June 7, l999. He served as Chairman of RHM Plc from June 2005
to 2007. He has been a Director of Marks & Spencer Group plc since November 1, 2008. He has been a
Non-Executive Director of Rio Tinto Ltd. and Rio Tinto Plc since September 1, 2008. He served as Director
of RHM Plc. He served as Non-Executive Director of BAT Industries PLC since 1999. Mr. Du Plessis
246 All information was obtained from the 2007 British American Tobacco Annual Report or Bloomberg, unless
otherwise stated.

108 | P a g e
obtained BCom (Law) and LLB from the University of Stellenbosch in South Africa in 1977. Mr. Du Plessis
Qualified as a Chartered Accountant (South Africa) in 1980.247
Paul Nicholas Adams, Chief Executive Officer (55 years old)
Compensation (2007): £1,076,641 salary and £487,230 bonus
Other Board Membership: Allied Democq Financial
Reported BAT holdings: 250,698 shares valued at $6,749,333
Professional Experience:
Date Organization Title 1/2004 – Present BAT Industries Chief Executive Officer 1/2004 – Present British American Tobacco Chief Executive Officer 1/2002 – 12/2004 British American Tobacco Managing Director 6/2001 – 1/2002 British American Tobacco Deputy Managing Director 7/1991 – 6/2001 Source: Bloomberg.
British American Tobacco Various positions including regional director of Asia-Pacific and Europe
Paul N. Adams has been Chief Executive Officer of British American Tobacco since January 2004.
Mr. Adams served as Regional Director of Asia-Pacific of British American Tobacco from 1991 and
Managing Director from 2002. In 1999, he was appointed Regional Director of Europe. Mr. Adams also
served as European Vice-President of Marketing with Pepsi Cola International, based in London. During
his time at Pepsi, he served as Managing Director of Pepsi Cola de France and Area Vice-President of
Scandinavia. Mr. Adams began his business career with Shell UK before moving on to Colgate Palmolive
and Beecham Products International. He has been an Executive Director of British American Tobacco PLC
since March 1, 2001 and is a member of the Nominations Committee.248
Nicandro Durante, Chief Operating Officer (48 years old)
247 Business Week. British American Tobacco PLC (BTI:AMEX). Invest.BusinessWeek.com. February5, 2009
<http://investing.businessweek.com/research/stocks/people/people.asp?symbol=BTI> 248
IBID.
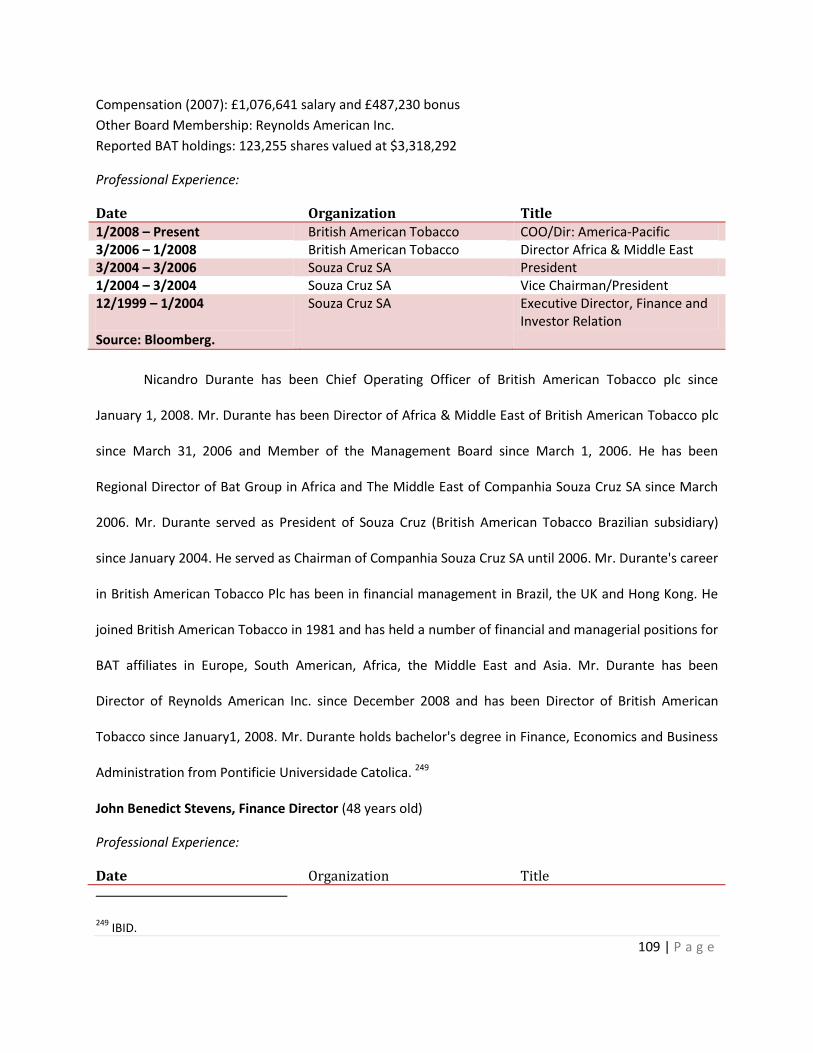
109 | P a g e
Compensation (2007): £1,076,641 salary and £487,230 bonus
Other Board Membership: Reynolds American Inc.
Reported BAT holdings: 123,255 shares valued at $3,318,292
Professional Experience:
Date Organization Title 1/2008 – Present British American Tobacco COO/Dir: America-Pacific 3/2006 – 1/2008 British American Tobacco Director Africa & Middle East 3/2004 – 3/2006 Souza Cruz SA President 1/2004 – 3/2004 Souza Cruz SA Vice Chairman/President 12/1999 – 1/2004
Source: Bloomberg.
Souza Cruz SA Executive Director, Finance and Investor Relation
Nicandro Durante has been Chief Operating Officer of British American Tobacco plc since
January 1, 2008. Mr. Durante has been Director of Africa & Middle East of British American Tobacco plc
since March 31, 2006 and Member of the Management Board since March 1, 2006. He has been
Regional Director of Bat Group in Africa and The Middle East of Companhia Souza Cruz SA since March
2006. Mr. Durante served as President of Souza Cruz (British American Tobacco Brazilian subsidiary)
since January 2004. He served as Chairman of Companhia Souza Cruz SA until 2006. Mr. Durante's career
in British American Tobacco Plc has been in financial management in Brazil, the UK and Hong Kong. He
joined British American Tobacco in 1981 and has held a number of financial and managerial positions for
BAT affiliates in Europe, South American, Africa, the Middle East and Asia. Mr. Durante has been
Director of Reynolds American Inc. since December 2008 and has been Director of British American
Tobacco since January1, 2008. Mr. Durante holds bachelor's degree in Finance, Economics and Business
Administration from Pontificie Universidade Catolica. 249
John Benedict Stevens, Finance Director (48 years old)
Professional Experience:
Date Organization Title
249 IBID.

110 | P a g e
3/2008 - Present British American Tobacco Finance Director 1/2004 – 3/2008 British American Tobacco Director: Europe 4/2001 – 2003 British American Tobacco Director of Development 1999 – 4/2001 British American Tobacco Head of Merger Integration 1997 – 1999 British American Tobacco Head of Russian Division 1995 – 1997 British American Tobacco Head of Pakistan Tobacco
Company 1994 – 1995 British American Tobacco Various positions including
Marketing in Switzerland 1990 – 1994 Source: Bloomberg.
British American Tobacco Controler, Regional Finance
Ben Stevens has been Member of Management Board of British American Tobacco PLC since
2001 and also has been its Director of Europe since January 2004 and finance Director since April 30,
2008. Mr. Stevens served as Director of Development at British American Tobacco since 2001. He joined
British American Tobacco in 1990 and covered a number of senior marketing, finance and management
roles particularly in Europe, Pakistan and Russia. Mr. Stevens has been Finance Director of British
American Tobacco PLC since March 3, 2008.250
Performance Incentives:
Performance related bonuses for BAT executives are based on five common measures:
underlying operating profit, market share of key players, Global Drive Brand volume, net revenue and
cash flow. For 2007, the ‘on target’ bonus opportunity for Executive Directors was 100% of the base
salary with a maximum award of 150% of salary. For the Management Board, the ‘on target’ bonus
opportunity was 67 % of the base salary with a maximum of 100%. During 2007, an award of shares of
250% of salary was made to the Chief Executive and 200% of salary to the Finance Director and the Chief
Operating Officer. Members of the Management Board received awards of shares of 150% of salary.
Corporate Governance Accountability:
250 IBID.

111 | P a g e
The Dow Jones Sustainability Index has consistently evaluated BAT’s corporate governance as
best in tobacco industry.
Dow Jones Sustainability Index Rating
Dow Jones Criteria Was 2007 score better than 2006?
Was score higher than sector average?
Corporate Governance ✔ ✔
Risk & Crisis Management ✔ ✔
Codes of Conduct/Compliance Corruption & Bribery Source: 2007 BAT Annual Report
✔ ✔
Measuring Corporate Performance:
British American Tobacco’s revenues have grown 27.3% from year to 2005 to 2007. This is
compared to 21.6% growth for that of Philip Morris International and 63% growth for that of Japan
Tobacco International. Japan Tobacco International’s 59% jump in revenue in 2007 is due to the
acquisition of Gallagher, which occupied the fifth place in terms of world tobacco market share, in that
same year. The reason for the divergence in annual growth rates in respective periods for BAT and PMI
are mainly due to the inverse impact of exchange rates on these two companies. Moreover, BAT went
through a minor wave of divestments in 2007 while PMI went through a wave of acquisitions, which also
impacted the revenue differentials. Overall, the organic growth of BAT’s revenue relative to that of its
competitors has been very good with a geometric average of 12% per year. Since BAT has subsequently
acquired Turkish Tekel, a large tobacco company, while exchange rates have moved in its favor, we can
expect revenue growth to continue in following years.
British American Tobacco’s EBITDA Margin, has grown 5% from year 2005 to 2007 while that of
PMI has dropped by 4.3% and that of JTI dropped by 16.3%. Although British American Tobacco’s
EBITDA Margin is 5% lower than that of Philip Morris International, an average margin of 13% is still very
impressive. The BAT management’s ability to maintain efficient processes is a commanding sign of
sound corporate leadership.

112 | P a g e
BAT’s revenue per employee has seen a large amelioration over the two periods (26.3%). The
large amelioration in the ratio was mainly due to numerous plant closures. This represents the
management’s efforts to drive production efficiency.251
Ratios and Metrics Firm 2007 2006 2005 Average %Growth
(07-06) %Growth
(06-05)
Revenue ($M) BAT 52,556 49,347 41,286 47,730 6.5 16.9 PMI 55,096 48,260 45,288 49,548 14.16 6.56 JTI 40,398 39,420 43,567 48,044 59.20 2.48
EBITDA Margin % BAT 13.014 12.564 12.39 13 3.58 1.4 PMI 17.46 18.7 18.24 18.1333 -6.63 2.52 JTI 5.49 7.28 6.56 6.4433 -24.59 10.98
Revenue/1000 Employees ($M)
BAT 537.95 506.48 425.84 490 6.21 16.45 PMI 696.11 -- -- 696.11 -- -- JTI 1,220.0 1,301.5 1,334.77 1,234.22 -6.26 -2.49
British American Tobacco enjoys above industry average performance ratios. The company’s
ROA has grown 21.3% in two years while Japan Tobacco’s has fallen 16% over the same period. This
trend in ROA is magnified in British American Tobacco’s ROI with a 40.7% amelioration! British
American Tobacco’s ROE is also growing while being clearly above industry average. These are all
indications of strong fundamental management.
ROE and ROA for the tobacco industry (2007)
(BAT is in aqua)
251 British American Tobacco. Bristish American Tobacco 2007 Annual Report. 2007.

113 | P a g e
Source: Bloomberg.
Ratios and Metrics
Firm 2007 2006 2005 Average Industry Variation
%Growth (07-06)
%Growth (06-05)
ROA % BAT 11.67 10.3 9.62 10.53 1.7242 13.30 7.07 PMI 20.72 -- -- 20.72 11.9142 -- -- JTI 5.63 6.58 6.7 6.3033 -2.5025 -14.44 -1.79
ROE %
BAT 30.9 27.95 27.26 28.70333 3.98763 10.55 2.53 PMI 40.62 -- -- 40.62 15.9043 -- -- JTI 11.8 11.24 12.52 11.8533 -12.8624 4.98 -10.22
ROI %
BAT 39.58 34.85 28.12 34.18333 1.57833 13.57 23.93 PMI 47.07 -- -- 47.07 14.465 -- -- JTI 0.15 0.13 0.14 0.14 -32.465 15.38 -7.14
British American Tobacco has a decent capacity to pay off short-term debt obligations relative to
other MTC strategic group constituents despite a relatively lower ratio of net current assets to total
assets. This is because British American Tobacco’s operations are much less dependent on external
processes, compared to those of Japan Tobacco and Philip Morris International, which results in a
smaller amount of debt to creditors. Moreover, the long term prospects of tobacco companies are
typically high therefore British American Tobacco’s current ratio of 1.174 is not particularly alarming. By
liquidity accounting measures, management appropriately manages the company’s resources.
Liquidity Indicators Firm 2007 2006 2005 Average
Quick Ratio BAT 0.68 0.68 0.646667 0.67

114 | P a g e
PMI 0.57 0.55 -- 0.56 JTI 0.87 0.73 0.77 0.79
Current Ratio BAT 1.18 1.21 1.133333 1.174 PMI 1.76 1.71 -- 1.735 JTI 2.26 2.57 2.286667 2.372
Net Current Assets % TA Source: Mergent Online
BAT 4.34 5.28 3.326667 4.316 PMI 20.29 18.9 -- 19.595 JTI
30.54 32.32 29.47333 30.778
As this is being written, British American Tobacco’s market capitalization is £37.01B ($52.90B).252
From year 2004 to 2008, this metric has experienced stellar growth, both in nominal and actual terms.
Nominally, the business has grown £24B ($34.3B) or £6B ($8.6B) annually from year 2004 to 2008. In
actual terms, that is 150% growth or a geometric average of 25.7% per year! For a company the size of
British American Tobacco, these figures are massive. Although some of that growth is attributed to
acquisitions, most of it is organic in nature. During the year 2007, 45 Million shares were repurchased
and almost £3B ($4.3B) was returned to shareholders. The growth in market capitalization is an effect
of management’s superior ability to create wealth for shareholders (see Relative Stock Performance).
252 Google Finance. Google. Accessed on February 4
th 2009.
1,940,000,000
2,040,000,000
2,140,000,000
2,240,000,000
2,340,000,000
2,440,000,000
0
5000
10000
15000
20000
25000
30000
35000
40000
45000
1/1/2004 1/1/2005 1/1/2006 1/1/2007 1/1/2008
Nu
mb
er
of
Shar
es
Ou
tsta
nd
ing
Mar
ket
Cap
ital
izat
ion
(£
M)
British American Tobacco MCAP
MCAP (£M) Shares Outstanding
Source: BAT annual reports, Google FinanceSource: BAT annual reports, Google FinanceSource: BAT annual reports, Google Finance
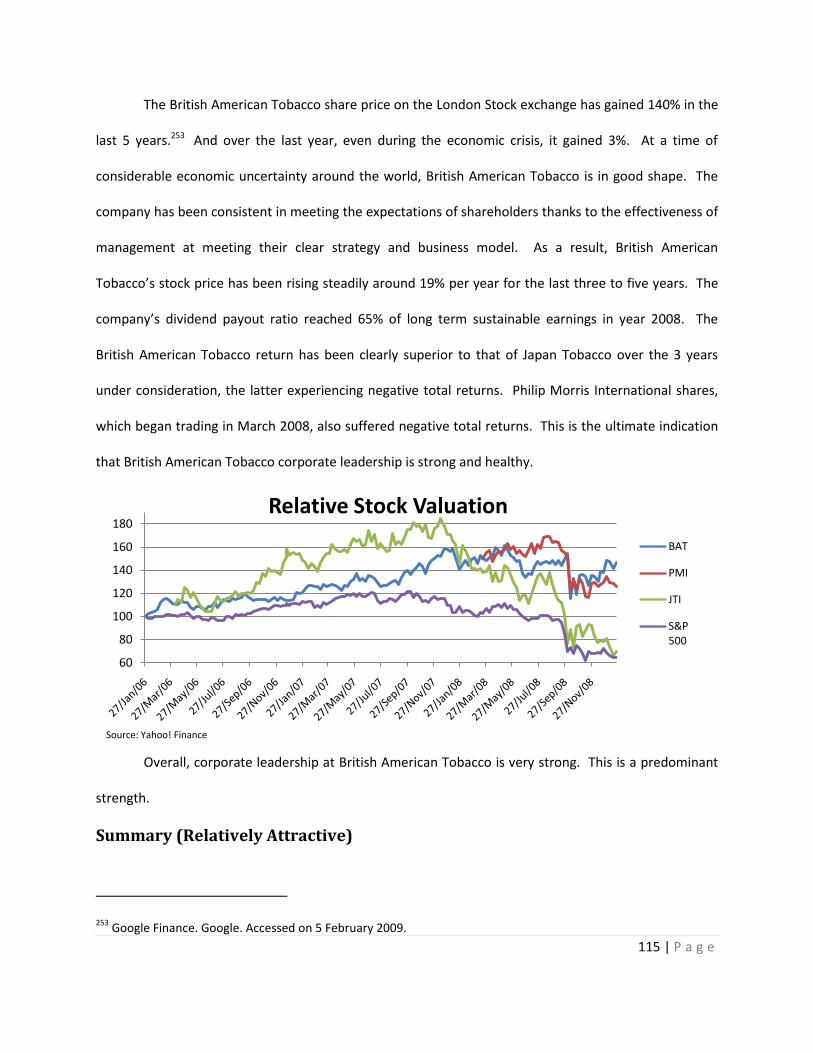
115 | P a g e
The British American Tobacco share price on the London Stock exchange has gained 140% in the
last 5 years.253 And over the last year, even during the economic crisis, it gained 3%. At a time of
considerable economic uncertainty around the world, British American Tobacco is in good shape. The
company has been consistent in meeting the expectations of shareholders thanks to the effectiveness of
management at meeting their clear strategy and business model. As a result, British American
Tobacco’s stock price has been rising steadily around 19% per year for the last three to five years. The
company’s dividend payout ratio reached 65% of long term sustainable earnings in year 2008. The
British American Tobacco return has been clearly superior to that of Japan Tobacco over the 3 years
under consideration, the latter experiencing negative total returns. Philip Morris International shares,
which began trading in March 2008, also suffered negative total returns. This is the ultimate indication
that British American Tobacco corporate leadership is strong and healthy.
Overall, corporate leadership at British American Tobacco is very strong. This is a predominant
strength.
Summary (Relatively Attractive)
253 Google Finance. Google. Accessed on 5 February 2009.
60
80
100
120
140
160
180Relative Stock Valuation
BAT
PMI
JTI
S&P 500
Source: Yahoo! Finance
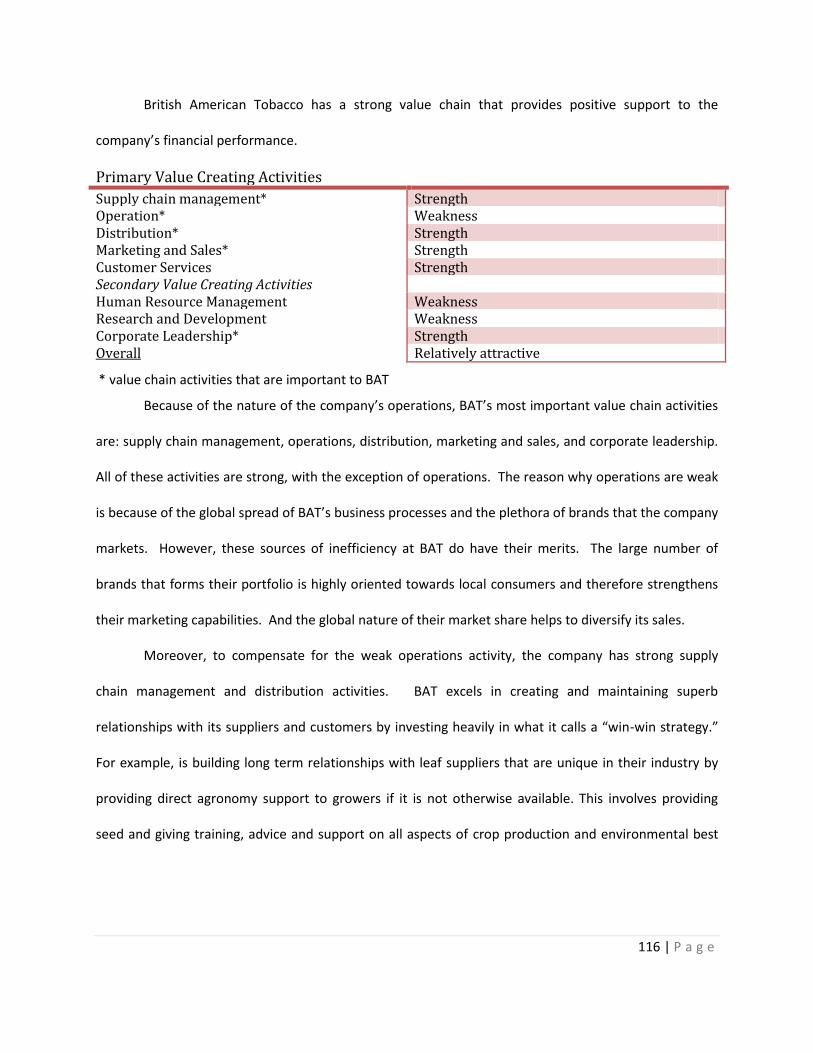
116 | P a g e
British American Tobacco has a strong value chain that provides positive support to the
company’s financial performance.
Primary Value Creating Activities
Supply chain management* Strength Operation* Weakness Distribution* Strength Marketing and Sales* Strength Customer Services Strength Secondary Value Creating Activities Human Resource Management Weakness Research and Development Weakness Corporate Leadership* Strength Overall Relatively attractive
Because of the nature of the company’s operations, BAT’s most important value chain activities
are: supply chain management, operations, distribution, marketing and sales, and corporate leadership.
All of these activities are strong, with the exception of operations. The reason why operations are weak
is because of the global spread of BAT’s business processes and the plethora of brands that the company
markets. However, these sources of inefficiency at BAT do have their merits. The large number of
brands that forms their portfolio is highly oriented towards local consumers and therefore strengthens
their marketing capabilities. And the global nature of their market share helps to diversify its sales.
Moreover, to compensate for the weak operations activity, the company has strong supply
chain management and distribution activities. BAT excels in creating and maintaining superb
relationships with its suppliers and customers by investing heavily in what it calls a “win-win strategy.”
For example, is building long term relationships with leaf suppliers that are unique in their industry by
providing direct agronomy support to growers if it is not otherwise available. This involves providing
seed and giving training, advice and support on all aspects of crop production and environmental best
* value chain activities that are important to BAT

117 | P a g e
practice.254 For many years, leaf staff in their companies have worked in the field alongside farmers,
many of whom are small producers in scattered rural communities. This benefits both the farmers and
us in improving crop yields and quality, while helping growers to address the environmental and social
issues associated with tobacco growing and processing. In 2007 these agronomy services ran in 19
countries, reaching around 200,000 growers and covering some 193,000 hectares under cultivation.255
Two thirds of the Group’s leaf, on average, is bought under contract from growers who receive their
direct agronomy support.256 Similar relationships are also being built in their distribution channels. For
example, company has developed an exceptional ability to forge partnerships with global, strategic
customers on a large scale.257 As well as hundreds of regional and local customers, BAT has 10 key
customers managed at a global level. These are 7-Eleven, Ahold, BP, Carrefour, Chevron Texaco,
Couchetard, Exxon Mobil, Shell, Tesco and Walmart. 258 BAT continues to reap dividends with its long
term international trade partners, such as Shell and Exxon Mobil, which give the company a significant
competitive advantage that will persist in the future.259 For example, in late 2005 British American
Tobacco agreed a 5-year global contract with Shell from 2006, as its preferred business partner in the
tobacco sector across the 5,500 Shell convenience stores in 48 countries around the world.260 The
relationship offers significant benefits to their business in growing their brands and will benefit Shell
through the sharing of tobacco consumer insights. Shell and Exxon Mobil alone give BAT priority access
254 Responsible leaf production. British American Tobacco. February 2009.
<http://www.britishamericantobacco.com/group/sites/UK__3MNFEN.nsf/vwPagesWebLive/DO52APTT?opendocument&SKN=1&TMP=1> 255
IBID. 256
IBID. 257
British American Tobacco. Bristish American Tobacco 2007 Annual Report. 2007. 258
British American Tobacco. Retailer Relationships. 30 April 2008. 10 February 2009 <http://www.bat.com/group/sites/uk__3mnfen.nsf/vwPagesWebLive/DO6ZXP2Z?opendocument&SKN=1>. 259
IBID. 260
British American Tobacco. Adding Value to the Relationship. 31 October 2007. 10 February 2009 <http://www.bat.com/group/sites/uk__3mnfen.nsf/vwPagesWebLive/DO6ZXPMX?opendocument&SKN=1&TMP=1>.

118 | P a g e
to over 10,500 outlets, selling over 13 billion cigarettes in over 48 countries – outlets whose customers
largely match the profile of their Global Drive Brand consumers.261
By following Direct Store Distribution, BAT is at an advantage as its products get delivered
directly to the stores by distributors. These distributors also clean the display and ensure that the
products are properly priced and it also allows BAT to maintain in direct contact with its retailers.262
This creates a competitive advantage when it comes to marketing because the company gets greater
control over how their products are displayed.
Corporate leadership is very strong. British American Tobacco’s share price on the London Stock
exchange has gained 140% in the last 5 years.263 And over the last year, even during the economic crisis,
it gained 3%. At a time of considerable economic uncertainty around the world, British American
Tobacco is in good shape. The company has been consistent in meeting the expectations of
shareholders thanks to the effectiveness of management at meeting their clear strategy and business
model. British American Tobacco has consistently enjoyed the best EBITDA Margin of the MTC strategic
group, its ratio being twice as high as that of PMI and over six times as high as that of JTI. BAT’s EBITDA
Margin has grown 7% from the year 2005 to 2007 while that of PMI has dropped by 4.3% and that of JTI
dropped by 16%. BAT management’s continued ability to maintain efficient processes is a commanding
sign of sound corporate leadership.
BAT’s weaknesses are in customer service, human resource management, and research and
development. Fortunately, these activities are of secondary importance to the value chain and should
have only a minor impact on the financial bottom line. We would however suggest that the BAT
261 IBID.
262 GMID. British American Tobacco - PLC. 2008. 12 February 2009
<http://www.portal.euromonitor.com.proxy.library.carleton.ca/passport/ResultsList.aspx>. 263
Google Finance. Google. Accessed on 5 February 2009.
119 | P a g e
management should spend more on R&D to develop potentially less harmful products in order to avoid
smoking bans and the negative social stigma of smoking.
Overall, the company is relatively attractive.
Corporate Level Strategy
Introduction264:
British American Tobacco was established over one hundred years ago as a tobacco
company and went through many incarnations throughout its life cycle. In the early 1960s, it began
to diversify into paper and pulp, cosmetics, and the food industry. In early 1970’s, it also diversified
into retailing where acquisitions included Argos in the UK and Saks Fifth Avenue in the United
States. These strategies were implemented to attain industrial prowess as size was a major
competitive advantage in that period. In 1976, the Group underwent radical reorganization and
operations were coordinated under a new holding company, B.A.T. Industries. Within two years,
B.A.T. Industries became UK’s third largest company and the largest tobacco manufacturer in the
world with annual sales of 500 billion cigarettes. By the end of the decade, with its acquisition of
Lorillard’s international business, the Group acquired several more key brands, including Kent. By
1981, trading profits from the tobacco operations tripled over the previous decade to more than
£463 million as production capacity steadily increased. And, with the acquisition of Eagle Star in
1984, Allied Dunbar the following year, and the Farmers Group in 1988, BAT Industries also
became the largest UK-based insurance group by 1989.
In 1990, with a 24 per cent pre-tax profit increase to more than £2 billion and confronted by
a hostile takeover bid, BAT Industries decided to re-focus exclusively on tobacco and financial
services and dispose of almost everything else. British American Tobacco then decided to grow
264 Most of the historical information on the company was taken from the following sources:
British American Tobacco. Our History. 31 October 2007. February 2009 <http://www.bat.com/group/sites/uk__3mnfen.nsf/vwPagesWebLive/DO52ADGE?opendocument&SKN=1>.
Source: Mergent Online

120 | P a g e
their business by focusing solely on tobacco - a decision which regalvanised and transformed the
Group. In 1995, the company set a new vision of regaining leadership of the global tobacco industry
and established a strategy to get there. The company subsequently went on to take advantage of
the economic liberalisation and the break-up of state monopolies by expanding their operations in
Central and Eastern Europe and the Far East. In 1998, BAT Industries finally divested its financial
services businesses and became a separately quoted company on the London Stock Exchange.
In 2008, BAT won its $1.72 billion bid for the assets of Tekel, a Turkish state tobacco
company, and it also acquired the cigarette and snus businesses of Skandinavisk Tobakskompagni.
Over the last decade, the company’s market share has increased by nearly 50 %. BAT is now the
second largest international tobacco Group, accounting for some 17 per cent of the global market.265
British American Tobacco is the world's most international tobacco group, and their high quality
brands are chosen by one in eight of the world's smokers.266
British American Tobacco has grown 68.4% in market capitalization over the last three
years under consideration. Some of that growth was due to acquisitions (as will be seen in the
horizontal integration section), but a large part of that growth was organic as market cap as a
multiple of revenue grew 32.3% over the same period. This is in contrast to Japan Tobacco`s poor
13.1% decrease in market cap as a multiple of revenue, mostly due to poor returns as a result of
acquiring Gallagher in year 2006. As it was explored repeatedly in previous sections of this paper,
BAT has enjoyed wonderful ROI and ROE, typical of a company in the tobacco industry, although
Philip Morris International does seem to have taken the lead in that respect. Moreover, BAT has
also enjoyed the best growth in earnings per share with a 44.5% growth over the three years over
consideration. This is contrasted with 7.2% growth for PMI and 72% decline for JTI. BAT is in the
265 British American Tobacco. Where We Are Going. 31 March 2007. February 2009 <
http://www.bat.com/group/sites/uk__3mnfen.nsf/vwPagesWebLive/DO52ADBZ?opendocument&SKN=1>. 266
CNBC. Paul Adams, Cheif Executive. 26 February 2009. February 2009 <http://www.executiveinterviews.com/UK03356-bat-cnbceu/>.
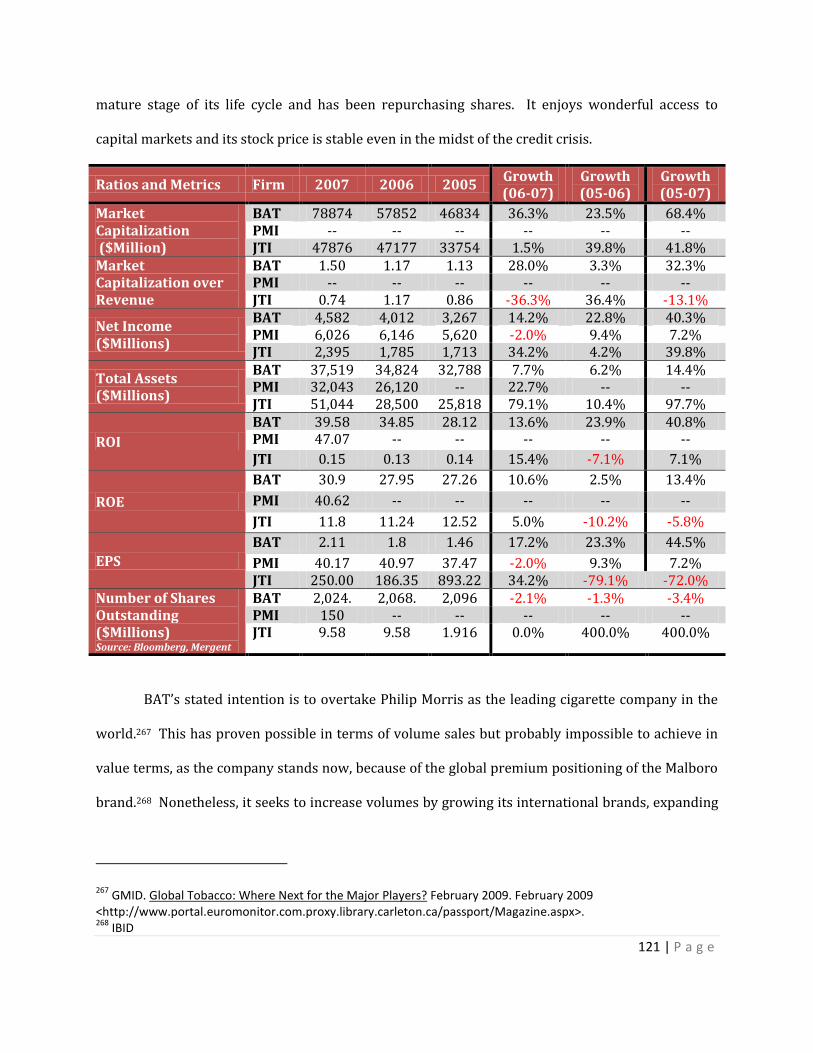
121 | P a g e
mature stage of its life cycle and has been repurchasing shares. It enjoys wonderful access to
capital markets and its stock price is stable even in the midst of the credit crisis.
Ratios and Metrics Firm 2007 2006 2005 Growth (06-07)
Growth (05-06)
Growth (05-07)
Market Capitalization ($Million)
BAT 78874 57852 46834 36.3% 23.5% 68.4% PMI -- -- -- -- -- -- JTI 47876 47177 33754 1.5% 39.8% 41.8%
Market Capitalization over Revenue
BAT 1.50 1.17 1.13 28.0% 3.3% 32.3% PMI -- -- -- -- -- -- JTI 0.74 1.17 0.86 -36.3% 36.4% -13.1%
Net Income ($Millions)
BAT 4,582 4,012 3,267 14.2% 22.8% 40.3% PMI 6,026 6,146 5,620 -2.0% 9.4% 7.2% JTI 2,395 1,785 1,713 34.2% 4.2% 39.8%
Total Assets ($Millions)
BAT 37,519 34,824 32,788 7.7% 6.2% 14.4% PMI 32,043 26,120 -- 22.7% -- -- JTI 51,044 28,500 25,818 79.1% 10.4% 97.7%
ROI
BAT 39.58 34.85 28.12 13.6% 23.9% 40.8% PMI 47.07 -- -- -- -- --
JTI 0.15 0.13 0.14 15.4% -7.1% 7.1%
ROE
BAT 30.9 27.95 27.26 10.6% 2.5% 13.4%
PMI 40.62 -- -- -- -- --
JTI 11.8 11.24 12.52 5.0% -10.2% -5.8%
EPS
BAT 2.11 1.8 1.46 17.2% 23.3% 44.5%
PMI 40.17 40.97 37.47 -2.0% 9.3% 7.2% JTI 250.00 186.35 893.22 34.2% -79.1% -72.0%
Number of Shares Outstanding ($Millions) Source: Bloomberg, Mergent
BAT 2,024. 2,068. 2,096 -2.1% -1.3% -3.4% PMI 150 -- -- -- -- -- JTI 9.58 9.58 1.916 0.0% 400.0% 400.0%
BAT’s stated intention is to overtake Philip Morris as the leading cigarette company in the
world.267 This has proven possible in terms of volume sales but probably impossible to achieve in
value terms, as the company stands now, because of the global premium positioning of the Malboro
brand.268 Nonetheless, it seeks to increase volumes by growing its international brands, expanding
267 GMID. Global Tobacco: Where Next for the Major Players? February 2009. February 2009
<http://www.portal.euromonitor.com.proxy.library.carleton.ca/passport/Magazine.aspx>. 268
IBID

122 | P a g e
into emerging markets, and selling alternatives to cigarettes. The company seeks to grow its
margins by improved productivity and cost savings.
Corporate Strategy Analysis
Vertical Integration
Since 1998, British American Tobacco has participated in only one major core business,
which is the manufacturing and distribution of cigarettes and other tobacco products (OTP) such as
cigars and roll-your-own cigarettes, with low diversification. Although the company had diversified
into two other core businesses in the mid 1900’s, which included the retailing and financial services
sector, 269 it has since returned to its roots to mid-stream operations. The majority of its resources
are based on the manufacturing and distribution of its core business.
Productivity is a major part of BAT’s strategy. The company strives to augment profits and
generate resources for reinvesting back into the company by utilizing its worldwide resources.270
BAT is trying to ensure that its entire supply chain remains productive and generates as much
efficiency as possible to remain competitive. This implies cost management, improved service to
clientele and reliable products on a global scale.271 Thus far, British American Tobacco has been
very successful at achieving its goal as it has experienced over £ 1 billion in savings from increased
productivity over the past 5 years.272 Profit margins also augmented 6%, over this period of time.
BAT has also been trying to uphold its efficiency by completing an entire supply chain
restructuring. This has involved the closure of several factories along with regional and head
offices. These closures have resulted in over half of the savings from productivity.273
269 Datamonitor. British American Tobacco PLC - Company Profile. 13 October 2008.
270 British American Tobacco. Productivity. 10 July 2008. 1 March 2009
<http://www.bat.com/group/sites/UK__3MNFEN.nsf/vwPagesWebLive/DO65AC5N?opendocument&SKN=1>. 271
IBID 272
British American Tobacco. Chief Executive Q&A. 31 March 2008. 1 March 2009 <http://www.bat.com/group/sites/UK__3MNFEN.nsf/vwPagesWebLive/DO6Z2FT3?opendocument&SKN=1>. 273
GMID: British American Tobacco Plc - Tobacco - World
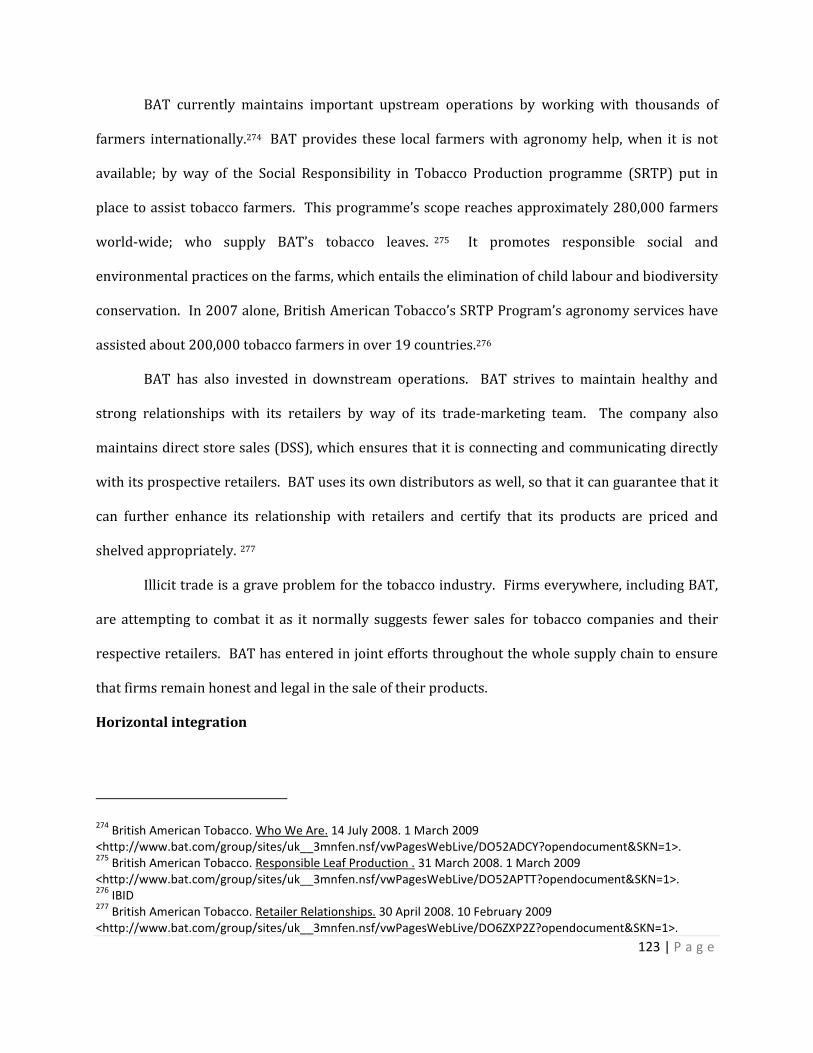
123 | P a g e
BAT currently maintains important upstream operations by working with thousands of
farmers internationally.274 BAT provides these local farmers with agronomy help, when it is not
available; by way of the Social Responsibility in Tobacco Production programme (SRTP) put in
place to assist tobacco farmers. This programme’s scope reaches approximately 280,000 farmers
world-wide; who supply BAT’s tobacco leaves. 275 It promotes responsible social and
environmental practices on the farms, which entails the elimination of child labour and biodiversity
conservation. In 2007 alone, British American Tobacco’s SRTP Program’s agronomy services have
assisted about 200,000 tobacco farmers in over 19 countries.276
BAT has also invested in downstream operations. BAT strives to maintain healthy and
strong relationships with its retailers by way of its trade-marketing team. The company also
maintains direct store sales (DSS), which ensures that it is connecting and communicating directly
with its prospective retailers. BAT uses its own distributors as well, so that it can guarantee that it
can further enhance its relationship with retailers and certify that its products are priced and
shelved appropriately. 277
Illicit trade is a grave problem for the tobacco industry. Firms everywhere, including BAT,
are attempting to combat it as it normally suggests fewer sales for tobacco companies and their
respective retailers. BAT has entered in joint efforts throughout the whole supply chain to ensure
that firms remain honest and legal in the sale of their products.
Horizontal integration
274 British American Tobacco. Who We Are. 14 July 2008. 1 March 2009
<http://www.bat.com/group/sites/uk__3mnfen.nsf/vwPagesWebLive/DO52ADCY?opendocument&SKN=1>. 275
British American Tobacco. Responsible Leaf Production . 31 March 2008. 1 March 2009 <http://www.bat.com/group/sites/uk__3mnfen.nsf/vwPagesWebLive/DO52APTT?opendocument&SKN=1>. 276
IBID 277
British American Tobacco. Retailer Relationships. 30 April 2008. 10 February 2009 <http://www.bat.com/group/sites/uk__3mnfen.nsf/vwPagesWebLive/DO6ZXP2Z?opendocument&SKN=1>.

124 | P a g e
British American Tobacco’s primary
business is Cigarette Manufacturing (NAICS
312221) while their secondary business Other
Tobacco Product Manufacturing (NAICS
312229). Over 95% of their revenues come
from cigarette sales therefore it is evident that
BAT follows a single business strategy. 278
Although research shows that diversification increases the performance of firms affiliated with
large diversified business groups, this is not the case currently the case in the tobacco industry.
Philip Morris International follows the same single business strategy with an equal amount of
success while Japan Tobacco has diversified in the Pharmaceutical and Food industries at a
significant detriment to its profitability. BAT’s focused orientation is mainly due to the fact that it
operates in a slow standard-cycle market, where its products are shielded from accurate
reproduction from another company, as loyal smokers are reluctant to switch consumption from
their preferred brand. The company instead competes for large market share and market power.
Since the tobacco industry volume sales are declining in every region aside from Asia, pricing and
market power is very important for profit growth. As a case in point, see the adjacent graph
(Source: GMID). Although BAT’s sales volume increased by 1.2% in the six months to June 30th
2008, operating profits increased 15.5 % (7.7% at constant exchange rates.279 In accordance with
the market power strategy, BAT has acquired a large number of companies and now accounts for
17% of the world market for their products. 280
278 Factiva. "British American Tobacco PLC." Dow Jones Insider (2009).
279 GMID. Global Tobacco: Where Next for the Major Players? February 2009. February 2009
<http://www.portal.euromonitor.com.proxy.library.carleton.ca/passport/Magazine.aspx>. 280
British American Tobacco. Where We Are Going. 31 March 2007. February 2009 < http://www.bat.com/group/sites/uk__3mnfen.nsf/vwPagesWebLive/DO52ADBZ?opendocument&SKN=1>.

125 | P a g e
In the past 5 years, the company has been very active horizontally, engaging in a string of
important divestments and acquisitions. The company has divested many of its resources and
businesses that were in the cigar or pipe tobacco in order to focus on its cigarette business instead.
The company has also sold many of its businesses that operated in environments that proved to be
too challenging or unprofitable. Its acquisition strategy has been to buy companies in emerging
markets, often benefiting from the privatization process in these countries and choosing to
diversify its single business internationally in order to take advantage of growing disposable
income in these regions, and more relaxed regulations and social stigmas (See Geographic
Diversification). The recent acquisitions of Tekel and Skandinavisk Tobakskompagni (ST) in 2008
suggested a more proactive attitude towards growth by acquisition. ST brought volumes of 30
billion cigarette sticks across Denmark, Norway and Sweden (including Poland) plus another
premium international brand. The Tekel purchase was a strategic move into the eighth largest
strategic market and increased BAT’s share of that market fivefold to 36%. The company is also in
a continuous process to improve the efficiency of its operations. In line with this, it has completed
several important restructuring initiatives mostly in the goal of ameliorating production costs.
British American Tobacco History of Important Horizontal Activities
Year Topic Description
2008 Acquisitions British American Tobacco, which already owned a third of the shares in ST, said that it would acquire the group outright for slightly more than £2 billion, including the cost of buying out the group’s snus smokeless tobacco joint venture partner.
2008 Acquisitions British American Tobacco won the auction for the cigarette business assets of Turkish state-owned tobacco company Tekel with a bid of $1.72bn.
2007 Divestments and demergers
British American Tobacco agrees in principle to sell its share in Taesong BAT, a joint venture cigarette business in Pyongyang with the Korea Sogyong Chonyonmul Trading Corporation, a state-owned company. The agreement provides for British American Tobacco to license its Craven A brand for manufacture and sale by the new owner in the DPRK domestic market.

126 | P a g e
2007 Divestments and demergers
British American Tobacco sells Belgian cigar business. The company says it has agreed to sell its Belgian cigar factory and associated brands to the cigars division of Skandinavisk Tobakskompagni. The business had gross assets of EUR31 million as at 31 December 2006. The sale includes a factory in Leuven as well as the trademarks Corps Diplomatique, Schimmelpennick, Don Pablo and Mercator – among others.
2007 Divestments and demergers
British American Tobacco announces that it has agreed to sell its pipe tobacco trademarks to the Danish company, Orlik Tobacco Company, for EUR24 million. The trademarks – which are sold in 24 countries – include Erinmore, Clan, Sail, Danske Club and Kentucky Bird. British American Tobacco will continue to sell pipe tobacco under the Dunhill and Captain Black brands.
2006 Acquisitions Inversiones Precis Limitada, a wholly-owned subsidiary of British American Tobacco, intends to make an offer to acquire the 29.63% of the shares in Chiletabacos .
2006 Divestments and demergers
British American Tobacco Italia, a member of the British American Tobacco Group, agrees to sell its TOSCANO cigar business to the Bologna-based Maccaferri Group for EUR95 million.
2006 Restructuring British American Tobacco announces factory closure proposal. British American Tobacco says that its operating company in the Netherlands has announced that it is to initiate consultations on a proposal to cease manufacture at its factory in Zevenaar and transfer production to Germany and Poland, following the strategic decision by British American Tobacco's Europe Region to concentrate EU manufacturing investment in its plants in Germany and Poland.
2005 Restructuring British American Tobacco will move its Asian headquarters to Hong Kong from Kuala Lumpur in the third quarter of this year.
2005 Restructuring British American Tobacco announces plans to move production from its main UK factory to Asia, putting hundreds of jobs at risk. BAT, the world's second biggest cigarette maker, said it had started a review of its factory in Southampton and would look at a range of options – including possible closure – for the site.
2005 Acquisitions BARH Limited, the new 55/45 joint venture between British American Tobacco and Honda Motor, completes the acquisition of the B.A.R Formula One racing team from administrators Grant Thornton.
2005 Acquisitions British American Tobacco increases its shareholding in Skandinavisk Tobakskompagni. As a result, the Group's shareholding in STK will increase from 26.6% to 32.3%.
2004 Divestments and demergers
British American Tobacco agrees to sell Etinera, the distribution business of its Italian subsidiary BAT Italia (formerly state-owned Ente Tabacchi Italiani), for EUR590 million in cash.
2003 Acquisitions British American Tobacco completes its EUR2.32 billion (US$2.88 billion) purchase of Italy's state-owned Ente Tabacchi Italiani.
2003 Divestments and demergers
British American Tobacco withdraws from Burma, bowing to moral pressure from the government and human rights campaigners.

127 | P a g e
2003 Mergers RJ Reynolds Tobacco and British American Tobacco agree to merge their American tobacco businesses. British American Tobacco is the parent company of rival Brown & Williamson Tobacco Corp.
2003 Acquisitions BAT buys 93.8% stake in Peru's Tabacalera Nacl, Peru's leading tobacco company.
2003 Divestments and demergers
British American Tobacco to divest the Sportsman, Cameo, Pacific, Topaz, Northpole, Matinee and Three Castle cigarette brands in New Zealand.
Source: GMID
British American Tobacco presently has 93 subsidiaries and continues to be on the lookout
for strategic acquisitions. 281 Because it owns so many companies, British American Tobacco is
sometimes described as a holding company that owns, directly or indirectly, investments in the
numerous companies, and that, through its subsidiaries, is engaged in activities related to the
manufacture, distribution or sale of tobacco products.282 Therefore, its secondary business can be
classified as a holding company (NAICS 551112), which, because of the large market capitalization
of the company, can be deemed as a significant necessary secondary business. Interestingly, British
American Tobacco also has an important capacity in the financial service sector as its portfolio used
to include important insurance and financial companies such as Eagle Star, Farmers, and Canada
Trust Financial Services (which was divested to Toronto Dominion Bank in June 2000). This
capacity will be the object of a potential corporate level strategy. This will be elaborated in later
sections.
Geographic Diversification
281 GMID. British American Tobacco PLC - World. 2008. 12 February 2009
<http://www.portal.euromonitor.com.proxy.library.carleton.ca/passport/ResultsList.aspx>. 282
Mergent Online. British American Tobacco Plc (ASE: BTI). Company Details.

128 | P a g e
15%
20%
4%24%
23%
2% 12%
Global Sales for BAT
Western Europe Eastern Europe
North America Latin America
Asia-Pacific Australasia
Africa and the Middle East
Since its establishment, BAT has always been a global company. Within the first decade of
its operation BAT has expanded its company to india, Ceylon, Belgium, Africa and Malaysia.283
Today, the company has operations in more than 180 markets in Europe, Asia, Latin America,
Africa, the Middle East and American regions through a large number of subsidiaries and assoicate
companies.284 The company targets geographies which are considered to be “priority markets”,
espically aiming at emerging economic such as China and Russia. Furthrmore, BAT aims to have the
right mix of brands with which it can deal with price increases and the changing regulatory
environment.285 In these emerging markets, BAT has performed extremelly well and they make up
for 75-80% of its total world volumes. These emering markets are ones with strong population
growth and with a constant precentage of somkers. In shorts, the number of somker is still rising.286
Of all the international tobacco companies, BAT
is the best placed to capitalize from the growing
volume of smokers. BAT has grwn its volume
share from 8% in 2001 to 17% in 2006,
primarily due to its strategy of innovation and
presence in key categories such as slim and
lower tar cigarettes, which are expected to grow
worldwide over the next several years.287 In
contrast to PMI and JTI, it can easy be observed
that BAT is the most internationally diverse
283 Company website
http://www.bat.com/group/sites/UK__3MNFEN.nsf/vwPagesWebLive/DO52ADJ8?opendocument&SKN=3 284
Datamointer. British American Tobacco-company report. January 2008. February 2009 285
GMID. British American Tobacco in Tobacco. February 2009. February 2009 286
GMID. British American Tobacco in Tobacco. February 2009. February 2009 287
GMID. Tobacco—World. Feburary 2009. February 2009

129 | P a g e
24%
23%
19%
9%
20%
1% 4%
Global sales for PMI
Western Europe
Eastern Europe
North American
Latin American
company and that PMI is only slightly behind BAT. Yet, in terms of regional ranking, PMI is the
leader in most areas.288 Both of these companies share the common characteristic that they are only
companies which are solely in the tobacco industry. 289
Operation Strategy
BAT has always maintained a local focus and it has used a muliti-domestic strategy in the
past in order to grow and expands globally. BAT group has a portfolio of more than 300 brands of
which the leading international brands include Dunhill, Lucky Strike, Kent, State Express 555,
Rothmans, Peter Stuyvesant, Kool, Pall Mall, Viceroy, and John Player Gold Leaf.290 In 2002, the
company changed its strategy to focus on a few international brands, many of which are located in
the higher end categories.
Mode of entry
BAT has used three different methods to enter the market: fully own subsidiaries;
acquisition of subsidiaries; and joint ventures and strategic alliances.
Since BAT merged with Rothmans in 2001, the company announced a series of new direct
investments in countries such as Turkey, Egypt, Vietnam, South Korea and Nigeria. Furthermore,
288 IBID
289 IBID
290 Datamointer. British American Tobacco-company report. January 2008. February 2009
12%
23%
1%
2%
58%
4%
Global sales for JTI
Western Europe
Eastern Europe
North American
Latin American

130 | P a g e
many companies in the tobacco industry have commonly used strategic alliances. This has helped
BAT enter a new market without having to develop their own distribution channel within an area
and market that has trade barriers. In 2004 the company formed a strategic alliance with Wuhan
Tobacco Group in China. This allowed the company to gain access to the Chinese market and better
establish a relationship with the local government.291
One of the biggest joint venture was with R.J Reynolds (RJR). BAT reached an agreement
with RJR to combine BAT’s Brown & Williamson line in the US with RJR to form a new holding
company called Reynolds American Inc. The company has also manage to expand its market share
by acquire many other companies. In 2003 BAT acquired Ente Tabacchi Italiani S.p.A (ETI), making
BAT the second largest company in the Italian tobacco market.292 However, the company actively
seeks out strategically relevant acquisitions and BAT representatives have stated that they will only
look for acquisitions at the right price. For this reason BAT has chosen not to enter the bidding for
Altadis. Like BAT, JTI has chosen to acquire companies in order to improve its market position.
Their most recent acquisition of Gallaher has help JTI increase its presence in the European market
and solidified its position as the third largest tobacco company.293
Issues/Problems
The tobacco industry is in decline as the global population of smokers is decreasing. The
tobacco product business is the only business that BAT is involved in therefore its bottom line is at
risk due not only to a decreasing population of smokers but also to intensifying competition for
BAT’s customers.
The company is in a standard cycle market where there are very few competitors. Because
of large volumes that characterize the tobacco industry, the size of mass markets, and the need to
291 http://www1.cei.gov.cn/ce/doc/cend/200403170862.htm
292 GMID. British American Tobacco in Tobacco. February 2009. February 2009
293 IBID

131 | P a g e
develop scale economies, the current competition for market share is intense. Philip Morris
International, Japan Tobacco, and Imperial Tobacco are BAT’s three main rivals which compete for
large market share, customer loyalty, and product consistency.
As it has been frequently discussed in this report, the typical strategy for dealing with a
declining smoking population is to incrementally increase the price of tobacco products while
improving production efficiency.
British American Tobacco executives have affirmed their continued confidence in the future
of the tobacco as a dynamic, evolving business with real growth prospects. 294 Their goal is “to
achieve leadership of the global tobacco industry through the growth of their share – more
specifically, the value of their share – among those adults who choose to consume tobacco.”295 We
do not disagree with the CEO, Paul Adams, when he states that “practically speaking, the global
adult population is expected to grow - keeping the industry’s volumes above 5,000 billion cigarettes
a year over the next decade – and we also have the advantages of a very broad geographic spread
and a focused, innovative brand portfolio.” However, in the long term, as their most lucrative
markets (developed markets) fade at a very fast rate due to a decreasing smoker population, and
increased regulation and excise taxes, it is evident that the company as it stands now would find
itself in a very tough spot.
British American Tobacco does have a long established presence in many emerging
markets, notably Latin America and Sub-Saharan Africa, and is therefore better able than its
competitors to offset difficulties in one market by a good performance in many others. These
markets present the best opportunities for future growth in the tobacco industry, and the company
294 British American Tobacco . Does British American Tobacco have any plans to diversify? 29 January 2008.
February 2009 <http://www.bat.com/group/sites/uk__3mnfen.nsf/vwPagesWebLive/F8B353934A020CBEC12573140052EE9A?opendocument&SKN=1>. 295
IBID

132 | P a g e
has a greater presence in these markets than its competitors. In fact, more than half of BAT's
profits come from emerging markets and it has well-balanced revenue.296
British American Tobacco’s vision is to “achieve volume in value leadership of the global
tobacco industry in order to create long term shareholder value.”297 We affirm that British
American Tobacco is in a favourable position in the global cigarette industry in but the company
must evolve through acquisitions in order to maintain its competitive position in the future. BAT’s
stock performance has surpassed that of its competitors in the last three years, and, over the past
five years, they have delivered significant shareholder value with a total return of 294 per cent,
compared to 89 per cent for the FTSE 100 as a whole.298 Moreover, BAT’s stock performance
during the present economic crisis has been nothing short of impressive. In light of this, our
corporate strategy recommendations will focus on using BAT`s large stable cash flows from the
notorious tobacco industry to acquire companies that will support the company in attaining a
sustainable competitive advantage.
Strategy Recommendations
Our proposed corporate-level strategies addresses the declining smoking prevalence in
developed markets by increasing BAT’s market and pricing power in these regions and by
increasing its presence in emerging markets, which will become more lucrative as disposable
income grows in these regions.
Acquiring Imperial Tobacco
296 GMID. British American Tobacco PLC - World. 2008. 12 February 2009
<http://www.portal.euromonitor.com.proxy.library.carleton.ca/passport/ResultsList.aspx>. 297
British American Tobacco. Our Vision. 31 October 2007. February 2009 < http://www.bat.com/group/sites/UK__3MNFEN.nsf/vwPagesWebLive/DO659LCX?opendocument&SKN=1>. 298
British American Tobacco. Where We Are Going. 31 March 2007. February 2009 < http://www.bat.com/group/sites/uk__3mnfen.nsf/vwPagesWebLive/DO52ADBZ?opendocument&SKN=1>.

133 | P a g e
The first building block our proposed corporate-level strategy is to acquire Imperial
Tobacco to become the world volume and value of sales leader in the tobacco industry.
Imperial Tobacco was ranked the fourth largest player in the global tobacco market in 2007,
with a comprehensive portfolio of cigarettes, cigars, smoking tobacco and peripheral goods such as
rolling papers.299 In the UK, also BAT’s home market, Imperial Tobacco ranked as the leading
player in 2007, with a 44% share of volume sales of cigarette. Moreover, Imperial has been the
most successful tobacco company in developing international economy brands over recent years,
with the highest margins in the industry.
Imperial has a strong distribution network, which enables it to achieve a leading position
through the core channels of multiples, convenience stores and forecourt retailers. Imperial
Tobacco is the most vulnerable of the international tobacco companies because of its smaller size
and the limited geographical spread of its operations. The company is also involved in the logistics
business since January 2008. The logistics business has so far accounted for 15% of the company’s
profits and 25% of its revenue.300
Interestingly, British American Tobacco was formed when, in 1902, Imperial Tobacco and
the American Tobacco Company of the USA agreed to form a joint venture, the British-American
Tobacco Company Ltd. 301 The parent companies agreed not to trade in each other's domestic
territory and to assign trademarks, export businesses and overseas subsidiaries to the joint
venture.302 In 1911, the American Tobacco Company sold its share of BAT and Imperial Tobacco
299 GMID. Imperial Tobacco Group Plc - Tobacco - United Kingdom. 7 January 2009. February 2009
<http://www.portal.euromonitor.com.proxy.library.carleton.ca/passport/ResultsList.aspx>. 300
Imperial Tobacco . Group Financial Performance. 2009. February 2009 <http://www.imperial-tobacco.com/files/financial/results/ir2008/index.asp?pageid=4>. 301
British American Tobacco. Our History. 31 October 2007. February 2009 <http://www.bat.com/group/sites/uk__3mnfen.nsf/vwPagesWebLive/DO52ADGE?opendocument&SKN=1>. 302
IBID
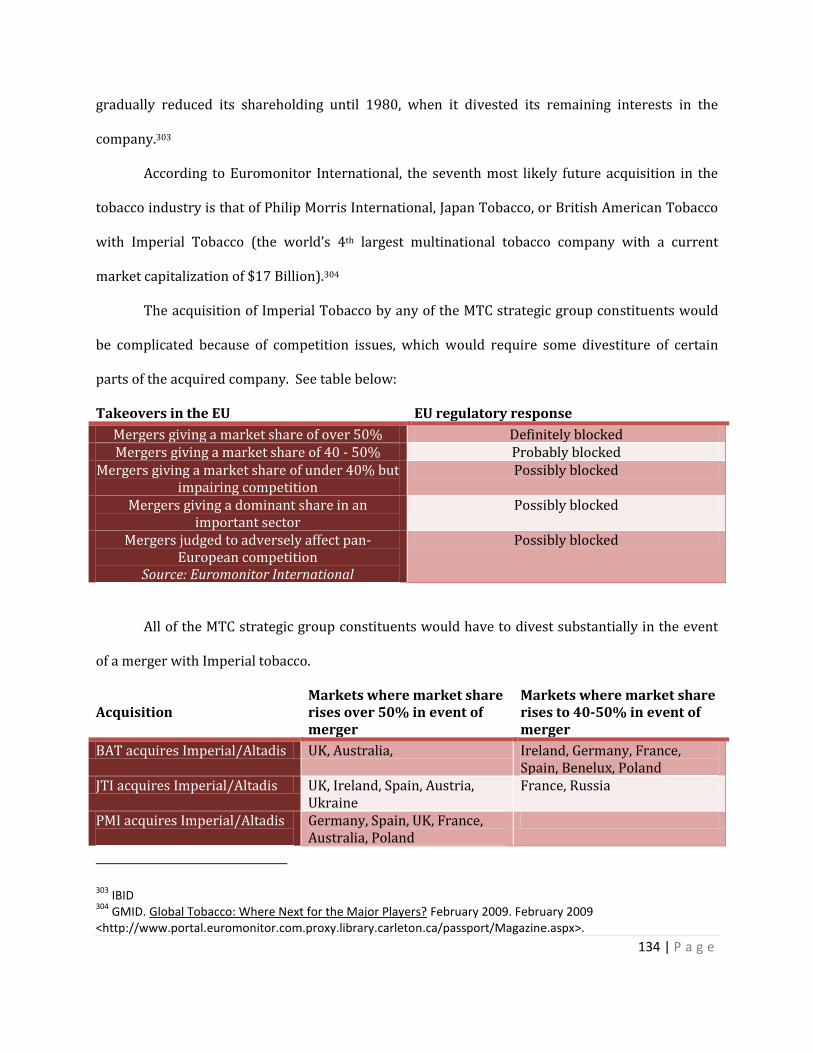
134 | P a g e
gradually reduced its shareholding until 1980, when it divested its remaining interests in the
company.303
According to Euromonitor International, the seventh most likely future acquisition in the
tobacco industry is that of Philip Morris International, Japan Tobacco, or British American Tobacco
with Imperial Tobacco (the world’s 4th largest multinational tobacco company with a current
market capitalization of $17 Billion).304
The acquisition of Imperial Tobacco by any of the MTC strategic group constituents would
be complicated because of competition issues, which would require some divestiture of certain
parts of the acquired company. See table below:
Takeovers in the EU EU regulatory response
Mergers giving a market share of over 50% Definitely blocked Mergers giving a market share of 40 - 50% Probably blocked
Mergers giving a market share of under 40% but impairing competition
Possibly blocked
Mergers giving a dominant share in an important sector
Possibly blocked
Mergers judged to adversely affect pan-European competition
Source: Euromonitor International
Possibly blocked
All of the MTC strategic group constituents would have to divest substantially in the event
of a merger with Imperial tobacco.
Acquisition Markets where market share rises over 50% in event of merger
Markets where market share rises to 40-50% in event of merger
BAT acquires Imperial/Altadis UK, Australia, Ireland, Germany, France, Spain, Benelux, Poland
JTI acquires Imperial/Altadis UK, Ireland, Spain, Austria, Ukraine
France, Russia
PMI acquires Imperial/Altadis
Germany, Spain, UK, France, Australia, Poland
303 IBID
304 GMID. Global Tobacco: Where Next for the Major Players? February 2009. February 2009
<http://www.portal.euromonitor.com.proxy.library.carleton.ca/passport/Magazine.aspx>.
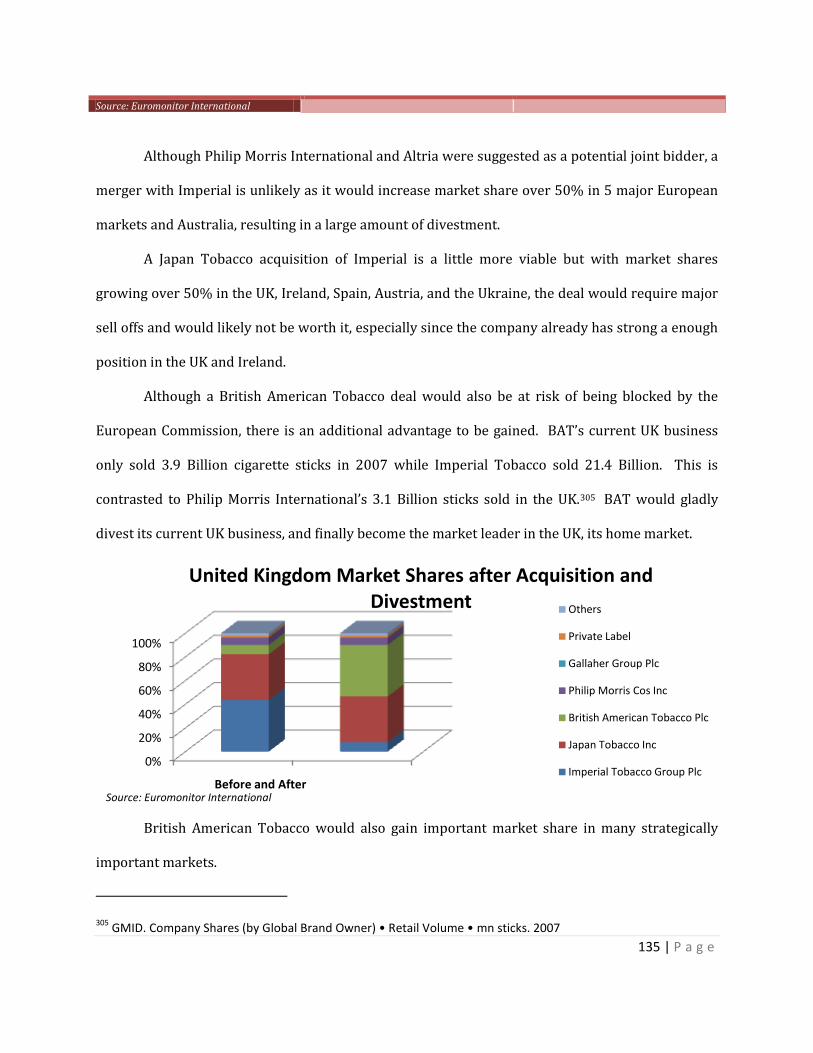
135 | P a g e
Source: Euromonitor International
Although Philip Morris International and Altria were suggested as a potential joint bidder, a
merger with Imperial is unlikely as it would increase market share over 50% in 5 major European
markets and Australia, resulting in a large amount of divestment.
A Japan Tobacco acquisition of Imperial is a little more viable but with market shares
growing over 50% in the UK, Ireland, Spain, Austria, and the Ukraine, the deal would require major
sell offs and would likely not be worth it, especially since the company already has strong a enough
position in the UK and Ireland.
Although a British American Tobacco deal would also be at risk of being blocked by the
European Commission, there is an additional advantage to be gained. BAT’s current UK business
only sold 3.9 Billion cigarette sticks in 2007 while Imperial Tobacco sold 21.4 Billion. This is
contrasted to Philip Morris International’s 3.1 Billion sticks sold in the UK.305 BAT would gladly
divest its current UK business, and finally become the market leader in the UK, its home market.
British American Tobacco would also gain important market share in many strategically
important markets.
305 GMID. Company Shares (by Global Brand Owner) • Retail Volume • mn sticks. 2007
0%
20%
40%
60%
80%
100%
1 2Before and After
United Kingdom Market Shares after Acquisition and Divestment Others
Private Label
Gallaher Group Plc
Philip Morris Cos Inc
British American Tobacco Plc
Japan Tobacco Inc
Imperial Tobacco Group Plc
Source: Euromonitor International

136 | P a g e
BAT’s Change in Market Share in Key Markets as a Result of the Imperial Acquisition
0%
20%
40%
60%
80%
100%
1 2Before and After
Germany Market Shares after Acquisition and Divestment Others
Private Label
Heintz van Landewyck Sarl
Japan Tobacco Inc
Imperial Tobacco Group Plc
British American Tobacco Plc
Philip Morris Cos Inc
Source: Euromonitor International
0%
20%
40%
60%
80%
100%
1 2Before and After
Russia Market Shares after Acquisition and Divestment Bulgartabac Holding
Group
Nevo-Tabak ZAO
KT&G Corp
Tabakprom
Donskoi Tabak OAO
Imperial Tobacco Group Plc
British American Tobacco Plc
Source: Euromonitor International
0%
20%
40%
60%
80%
100%
1 2Before and After
Australia Market Shares after Acquisition and Divestment
Others
Imperial Tobacco Group Plc
Philip Morris Cos Inc
British American Tobacco Plc
Source: Euromonitor International
0%
20%
40%
60%
80%
100%
1 2Before and After
Ireland Market Shares after Acquisition and Divestment Others
Private Label
Philip Morris Cos Inc
British American Tobacco Plc
Imperial Tobacco Group Plc
Japan Tobacco Inc
Source: Euromonitor International
0%
20%
40%
60%
80%
100%
1 2Before and After
France Market Shares after Acquisition and Divestment
Others
Gallaher Group Plc
Imperial Tobacco Group Plc
Japan Tobacco Inc
British American Tobacco Plc
Philip Morris Cos Inc
Source: Euromonitor International
0%
20%
40%
60%
80%
100%
1 2Before and After
Poland Market Shares after Acquisition and Divestment Others
Zaklady Tytoniowe w Lublinie SA
Japan Tobacco Inc
British American Tobacco Plc
Imperial Tobacco Group Plc
Philip Morris Cos Inc
Source: Euromonitor International

137 | P a g e
Even after possible necessary divestments of about 20 %, BAT would still overtake PMI as
the global leader in the tobacco industry.306
With the acquisition of Imperial Tobacco, BAT would finally achieve its goal of overtaking
PMI as the global leader in terms of both value and volume of sales. This position in the market is
very important mostly because it will give the company more market and pricing power.
Imperial’s current market capitalization is $24B therefore it is forecasted that BAT would
acquire Imperial for $32.4B (accounting for a 35% hostile takeover premium). BAT has the
capacity to acquire Imperial Tobacco because it has a strong balance sheet and amazing capital
market access coupled with a valuable reputation for stockholder wealth creation, not to mention a
relatively strong stock price.
British American Tobacco Selected Balance Sheet Elements ($Millions)
2007 2006 2005 2004 Retained earnings 3,676 3,211 2,148 1,731
Cash & cash equivalents 2,520 2,852 3,081 3,551
Total current assets Source: Mergent Online
10,750 10,561 10,163 10,898
306 GMID. Global Tobacco: Where Next for the Major Players? February 2009. February 2009
<http://www.portal.euromonitor.com.proxy.library.carleton.ca/passport/Magazine.aspx>.
0200000400000600000800000
100000012000001400000160000018000002000000
CNTC Philip Morris Cos BAT and Associates with Imperial Merger
BAT and Associates
BAT JTI Imperial
Retail Volume by Company in 2007 (Mn sticks)
Source: Euromonitor International

138 | P a g e
Moreover, we believe that Imperial Tobacco is a prime target for acquisition for the
following reasons.
i. Imperial Tobacco has performed very well in the last years with an average return on
equity surpassing that of the industry by 92.7%.
2007 2006 2005 Ave. Industry Ave.
ROE % Source: Mergent
104.1 130.6 -- 117.4 24.7
ii. Imperial Tobacco has an adequate level of debt for acquisition as total liabilities over
shareholder’s equity is 3.6.307 This is acceptable because the industry is in the mature stage of its
life cycle and is characterized by large stable cash flows.
iii. Imperial Tobacco enjoys large, stable profit margins.
2007 2006 2005 05-07 Growth
NI/Sales% Source: Mergent
7.4 7.35 7 5%
iv. Imperial Tobacco has been in the industry for over a century and therefore has loyal
customers and suppliers.
307 Mergent Online. Imperial Tobacco (LON: IMT): 2009
0
50
100
150
200Relative Stock Valuation
BAT
PMI
JTI
S&P 500
Imperial
Source: Yahoo! Finance
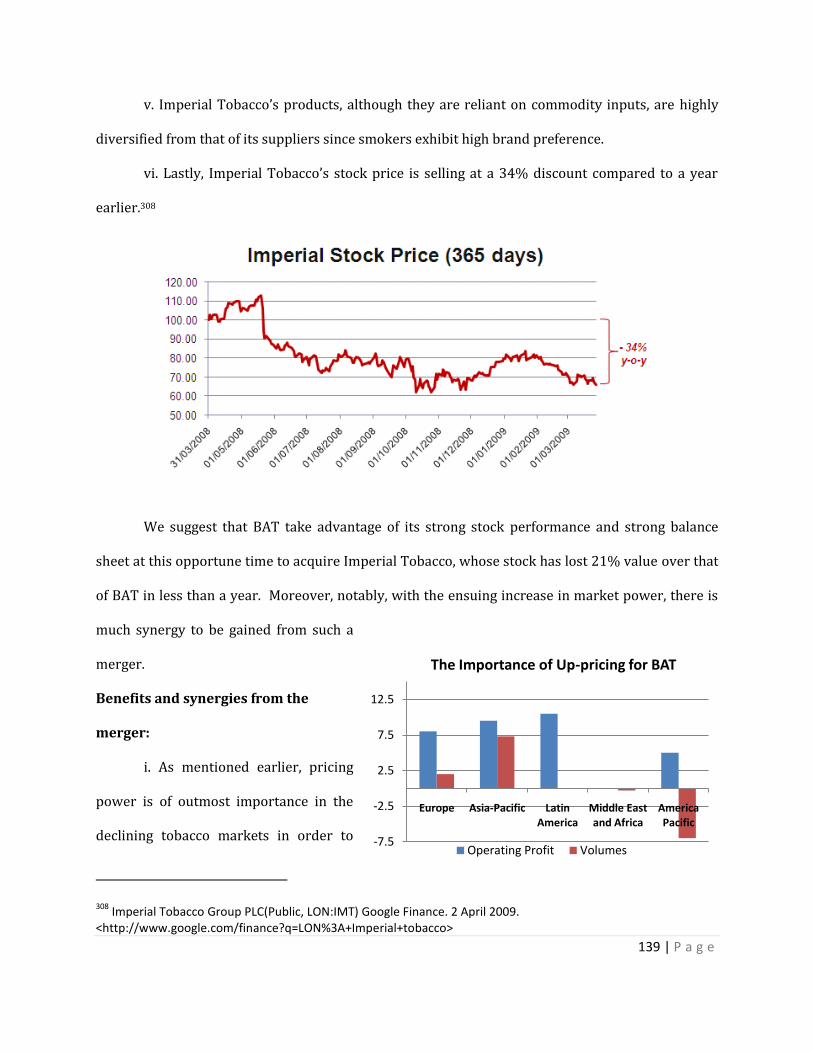
139 | P a g e
v. Imperial Tobacco’s products, although they are reliant on commodity inputs, are highly
diversified from that of its suppliers since smokers exhibit high brand preference.
vi. Lastly, Imperial Tobacco’s stock price is selling at a 34% discount compared to a year
earlier.308
We suggest that BAT take advantage of its strong stock performance and strong balance
sheet at this opportune time to acquire Imperial Tobacco, whose stock has lost 21% value over that
of BAT in less than a year. Moreover, notably, with the ensuing increase in market power, there is
much synergy to be gained from such a
merger.
Benefits and synergies from the
merger:
i. As mentioned earlier, pricing
power is of outmost importance in the
declining tobacco markets in order to
308 Imperial Tobacco Group PLC(Public, LON:IMT) Google Finance. 2 April 2009.
<http://www.google.com/finance?q=LON%3A+Imperial+tobacco>
-7.5
-2.5
2.5
7.5
12.5
Europe Asia-Pacific Latin America
Middle East and Africa
America Pacific
The Importance of Up-pricing for BAT
Operating Profit Volumes
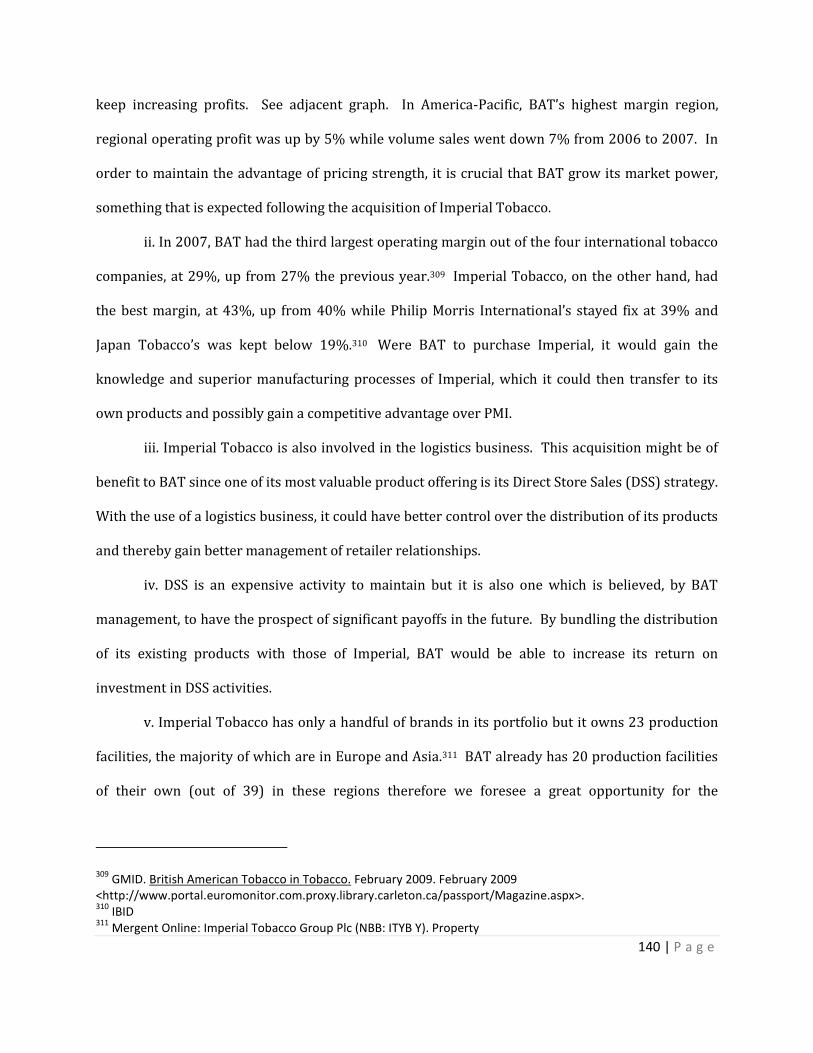
140 | P a g e
keep increasing profits. See adjacent graph. In America-Pacific, BAT’s highest margin region,
regional operating profit was up by 5% while volume sales went down 7% from 2006 to 2007. In
order to maintain the advantage of pricing strength, it is crucial that BAT grow its market power,
something that is expected following the acquisition of Imperial Tobacco.
ii. In 2007, BAT had the third largest operating margin out of the four international tobacco
companies, at 29%, up from 27% the previous year.309 Imperial Tobacco, on the other hand, had
the best margin, at 43%, up from 40% while Philip Morris International’s stayed fix at 39% and
Japan Tobacco’s was kept below 19%.310 Were BAT to purchase Imperial, it would gain the
knowledge and superior manufacturing processes of Imperial, which it could then transfer to its
own products and possibly gain a competitive advantage over PMI.
iii. Imperial Tobacco is also involved in the logistics business. This acquisition might be of
benefit to BAT since one of its most valuable product offering is its Direct Store Sales (DSS) strategy.
With the use of a logistics business, it could have better control over the distribution of its products
and thereby gain better management of retailer relationships.
iv. DSS is an expensive activity to maintain but it is also one which is believed, by BAT
management, to have the prospect of significant payoffs in the future. By bundling the distribution
of its existing products with those of Imperial, BAT would be able to increase its return on
investment in DSS activities.
v. Imperial Tobacco has only a handful of brands in its portfolio but it owns 23 production
facilities, the majority of which are in Europe and Asia.311 BAT already has 20 production facilities
of their own (out of 39) in these regions therefore we foresee a great opportunity for the
309 GMID. British American Tobacco in Tobacco. February 2009. February 2009
<http://www.portal.euromonitor.com.proxy.library.carleton.ca/passport/Magazine.aspx>. 310
IBID 311
Mergent Online: Imperial Tobacco Group Plc (NBB: ITYB Y). Property
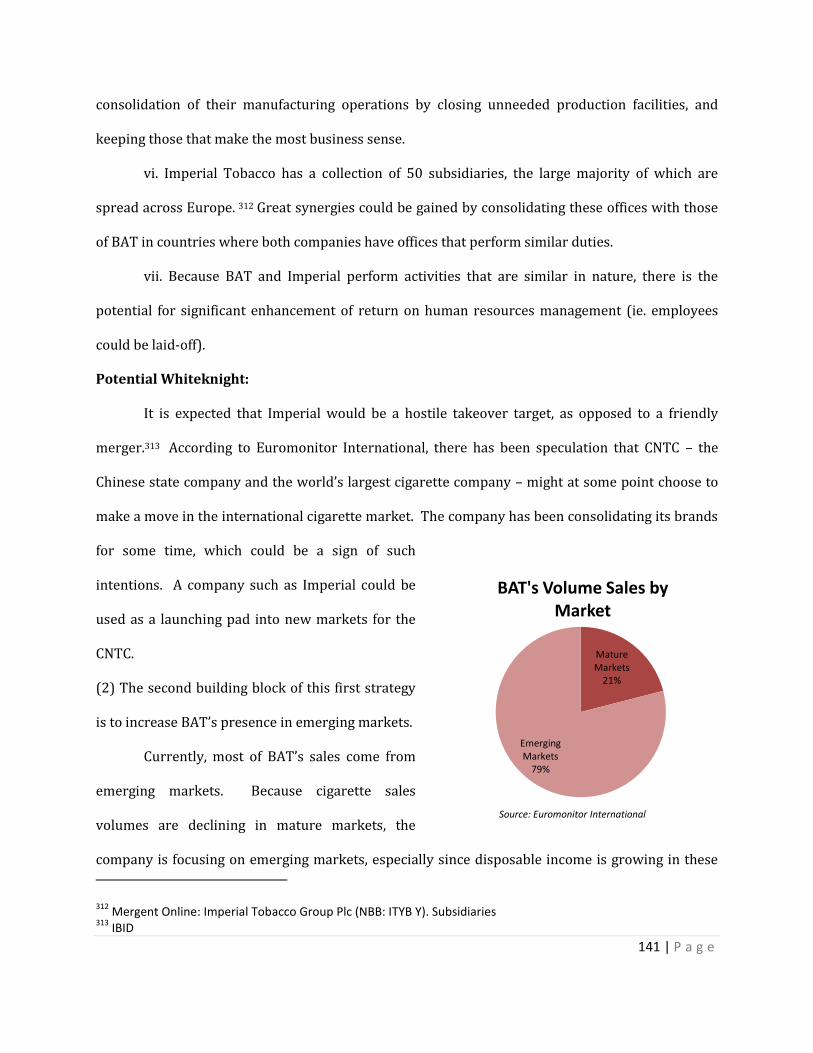
141 | P a g e
consolidation of their manufacturing operations by closing unneeded production facilities, and
keeping those that make the most business sense.
vi. Imperial Tobacco has a collection of 50 subsidiaries, the large majority of which are
spread across Europe. 312 Great synergies could be gained by consolidating these offices with those
of BAT in countries where both companies have offices that perform similar duties.
vii. Because BAT and Imperial perform activities that are similar in nature, there is the
potential for significant enhancement of return on human resources management (ie. employees
could be laid-off).
Potential Whiteknight:
It is expected that Imperial would be a hostile takeover target, as opposed to a friendly
merger.313 According to Euromonitor International, there has been speculation that CNTC – the
Chinese state company and the world’s largest cigarette company – might at some point choose to
make a move in the international cigarette market. The company has been consolidating its brands
for some time, which could be a sign of such
intentions. A company such as Imperial could be
used as a launching pad into new markets for the
CNTC.
(2) The second building block of this first strategy
is to increase BAT’s presence in emerging markets.
Currently, most of BAT’s sales come from
emerging markets. Because cigarette sales
volumes are declining in mature markets, the
company is focusing on emerging markets, especially since disposable income is growing in these
312 Mergent Online: Imperial Tobacco Group Plc (NBB: ITYB Y). Subsidiaries
313 IBID
Mature Markets
21%
Emerging Markets
79%
BAT's Volume Sales by Market
Source: Euromonitor International

142 | P a g e
regions. Although margins are smaller in emerging markets, there is the possibility for up-trading
in the future as these markets get more prosperous, by leveraging BAT’s premium brands. In the
past years, savings from improved productivity have been used to support entry into several new
markets such as Bulgaria and Algeria.314
British American Tobacco’s top near-term prospects are the state-owned tobacco
companies liberalizing in emerging markets. We recommend that BAT seriously consider buying
these state owned monopolies as they represent the best method to enter these markets, where
there are often no major competitors. This is the best way to grow market share locally, and even
internationally, if the company has a brand with expansion potential. Moreover, BAT has the
flexibility, knowledge, and technology to improve the productivity and profits of these companies
through synergies and better work practices.315
The four leading target prospects for British American Tobacco are summarized below.
BAT is in competition with PMI for the acquisition of these companies but BAT has a clear lead over
PMI in Vietnam, in the case of Vietnam National Tobacco, but it is unlikely that the government
would sell-off the company in the next 5 years, while PMI has a clear lead in Thailand in the case of
Thailand Tobacco Monopoly, where it is reasonably likely that the Thai government would decide
to sell off the company. Bulgartabak of Bulgaria is clearly on the market to be acquired as it has
failed to sell itself on several occasions. Bulgaria is a small market for cigarettes but Bulgartabak
has a substantial share of the market. It might be an interesting acquisition for BAT. We strongly
recommend that BAT aggressively try to acquire the Eastern Tobacco Company of Egypt as Egypt is
a significant emerging market with great future prospects. In 2007, there were 69.5 Billion
cigarettes (1.4% of world volume) sold in Egypt and the Eastern Tobacco Company accounted for
314 GMID. Global Tobacco: Where Next for the Major Players? February 2009. February 2009
<http://www.portal.euromonitor.com.proxy.library.carleton.ca/passport/Magazine.aspx>. 315
IBID

143 | P a g e
83% of that volume. Following the acquisition of Tekel by BAT in 2008, the acquisition of the
Eastern Tobacco Company of Egypt would be the biggest in the world.316
State-owned company
Country Chance of sell-off
(scale 0-10)
BAT% volume share
PMI% volume share
Firm% volume share
Home market volume
(Bn sticks) Eastern Tobacco
Egypt 8 5.1% 11.1% 83% 69.5
Vietnam National Tobacco
Vietnam 2 25.4% 0 43.7% 80.8
Thailand Tobacco Monopoly
Thailand 5 2.8% 23.8% 71.9% 39.7
Bulgar-tabak
Bulgaria 10 6.2% 8.5% 85.8% 20.8
Source: Euromonitor International
Egypt is close to Turkey, one of BAT’s dominant markets, so there is the possibility of cost
sharing. The company also has a strong portfolio of brands which it exports to other countries,
mostly in Africa and the Middle-East therefore there is potential for the expansion of these brands
elsewhere, South-America for example.317 The market capitalization of Eastern Tobacco is $650
million dollars, which is about one third of what BAT paid for Tekel in 2008.
Unfortunately, JTI and PMI have both beaten BAT to the lucrative market of China (although
production and marketing is restricted). In 2004 BAT was the first company to sign a joint venture
deal with the Chinese government but, apparently, it later came down to nothing.318 The Chinese
now seem to be more open to foreign partnerships and we think that this is a good time for BAT to
see that it gets its share of the potentially extremely lucrative market.
Conclusion to our proposed corporate-level strategies:
316 IBID
317 Eastern Company. Eastern Company S.A.E. 2006. February 2009
<http://www.easternegypt.com/cigaretsexport.html>. 318
IBID

144 | P a g e
BAT would be fully invested in its stated strategy were they to follow our recommendations.
These recommendations might be bold, but we are quite confident that, with faith in BAT
management’s philosophy, they would ensure long-term sustainability in the tobacco industry,
taken that the required restructuring and cost-cutting measures are done effectively.
Business-Functional Strategy Analysis
British American Tobacco is currently applying the integrated cost
leadership/differentiation strategy. Thereby it is focusing on both efficiently producing the product
with differentiated attributes, but also produce it at a relatively low cost.
BAT has focused on such a strategy for several reasons. First and foremost, cigarettes are a
price sensitive product, and exist in a market in which competitors price their products based on its
quality. Therefore, in such a market, the only plausible form of increasing profit margin is to lower
the price of the product. 319 Cigarettes are also a unique product with loyal customers. A person
who smokes one specific brand of a cigarette, is very unlikely to change it as each provides a unique
taste, tar-level and style, unless of course there are some social or health related concerns relevant
to the switch.320
The star on the above graph represents BAT’s position in regards to its business strategy.
BAT is more skewed towards differentiation as opposed to a cost-leadership strategy. This signifies
that although its stance is integrated, it has given more of an importance to differentiating its
product than lowering the cost to produce it.
BAT is also a very brand-driven company. It has focused on four specific global drive
brands (GDB) – Dunhill, Kent, Lucky Strike and Pall Mall. Each GDB is very well represented across
319 http://www.imo.ie/attachment.php?nAttId=558&doc_id=4039
320 IBID
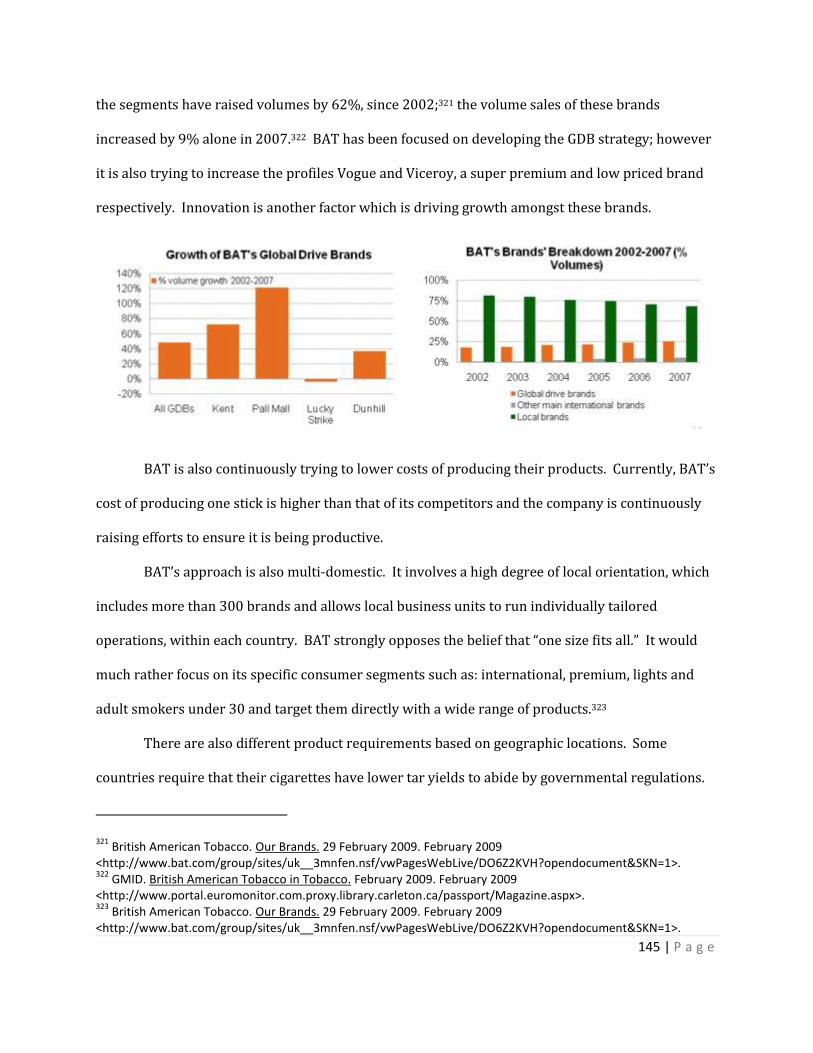
145 | P a g e
the segments have raised volumes by 62%, since 2002;321 the volume sales of these brands
increased by 9% alone in 2007.322 BAT has been focused on developing the GDB strategy; however
it is also trying to increase the profiles Vogue and Viceroy, a super premium and low priced brand
respectively. Innovation is another factor which is driving growth amongst these brands.
BAT is also continuously trying to lower costs of producing their products. Currently, BAT’s
cost of producing one stick is higher than that of its competitors and the company is continuously
raising efforts to ensure it is being productive.
BAT’s approach is also multi-domestic. It involves a high degree of local orientation, which
includes more than 300 brands and allows local business units to run individually tailored
operations, within each country. BAT strongly opposes the belief that “one size fits all.” It would
much rather focus on its specific consumer segments such as: international, premium, lights and
adult smokers under 30 and target them directly with a wide range of products.323
There are also different product requirements based on geographic locations. Some
countries require that their cigarettes have lower tar yields to abide by governmental regulations.
321 British American Tobacco. Our Brands. 29 February 2009. February 2009
<http://www.bat.com/group/sites/uk__3mnfen.nsf/vwPagesWebLive/DO6Z2KVH?opendocument&SKN=1>. 322
GMID. British American Tobacco in Tobacco. February 2009. February 2009 <http://www.portal.euromonitor.com.proxy.library.carleton.ca/passport/Magazine.aspx>. 323
British American Tobacco. Our Brands. 29 February 2009. February 2009 <http://www.bat.com/group/sites/uk__3mnfen.nsf/vwPagesWebLive/DO6Z2KVH?opendocument&SKN=1>.
146 | P a g e
Throughout these specifications, BAT strives to maintain its consistency, quality and standards in
its international brands worldwide. 324
A large part of this strategy for BAT is direct store sales (DSS). This allows the firm to
personalize its sales locations, to ensure that the pricing and shelving of the products are up to par
with the company standards.
British American Tobacco is also trying to manage pricing power strategies by way of its
upscale market through “premiumization”. The company is beginning to focus more widely on
premium products. This form of up-trading will initially result in a drop in sales volume; however,
selling these cigarettes at higher prices will lead to an overall increase in profits for the company.
In developed nations such as Japan, there is a rising trend shifting towards premium cigarette
brands. As shown in the graph below, although minor, there is a general shift in retail volume sales,
towards premium, from an original mid-priced consumption trend.
Many countries have already begun to implement this sort of strategy and it has proved to
be beneficial and successful. Europe, for example, has seen an increase in profits of 31.2% with
only a 1.7% increase in volume.325
However, such a strategy could also have negative impacts. Excise taxes on cigarettes have
been rising for years now. For example, Hong Kong has just finished releasing a 50% increase in
the tax rate; 326 and the US government has also raised taxes, leading manufacturers to raise prices
to ensure profits. 327 Illicit trade has also raised the price of cigarettes.328 About 7% of the global
324 IBID
325 GMID. Global Tobacco: Survival Strategies for a Savage Market. 5 June 2008. 4 February 2009
<http://www.portal.euromonitor.com.proxy.library.carleton.ca/passport/ResultsList.aspx>. 326
Bryony, Taylor. HK$10 Rise In Price Of A Packet Of Cigarettes. 27 February 2009. February 2009 <http://tobacco.cleartheair.org.hk/2009/02/27/hk10-rise-in-price-of-a-packet-of-cigarettes/>. 327
Yahoo Finance. Cigarette prices rise ahead of looming taxes. 11 February 2009. February 2009 <http://biz.yahoo.com/ap/090211/cigarette_prices.html>. 328
IBID
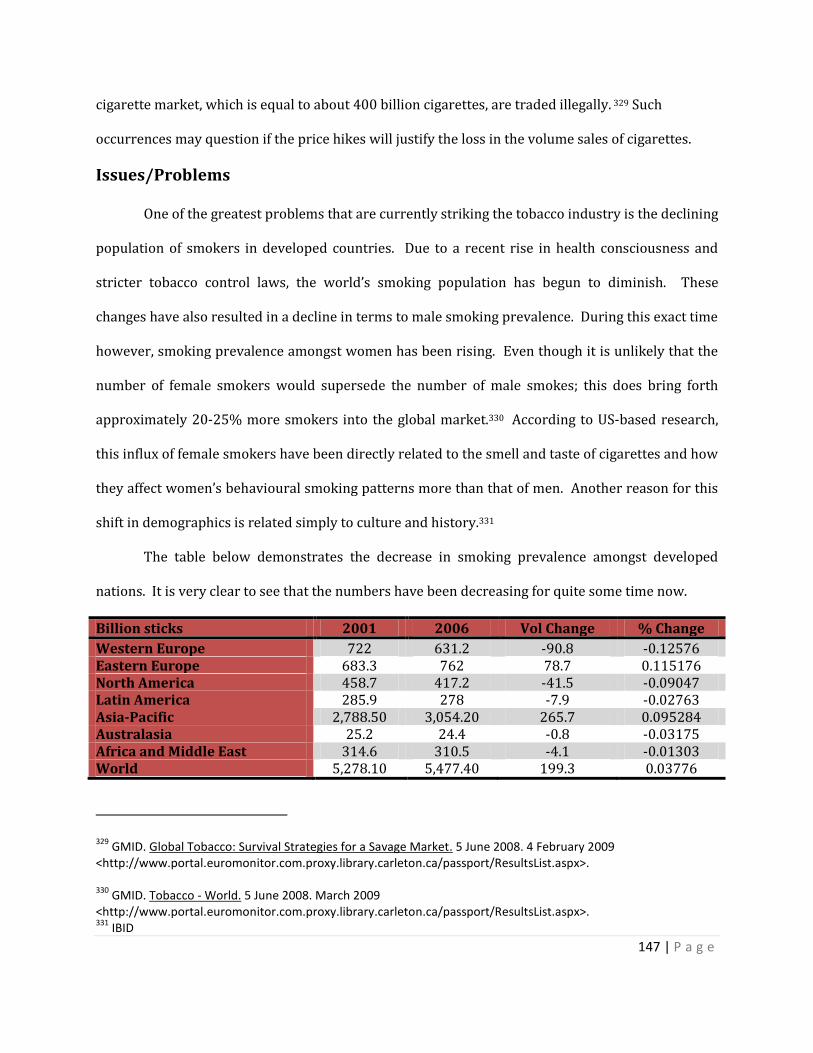
147 | P a g e
cigarette market, which is equal to about 400 billion cigarettes, are traded illegally. 329 Such
occurrences may question if the price hikes will justify the loss in the volume sales of cigarettes.
Issues/Problems
One of the greatest problems that are currently striking the tobacco industry is the declining
population of smokers in developed countries. Due to a recent rise in health consciousness and
stricter tobacco control laws, the world’s smoking population has begun to diminish. These
changes have also resulted in a decline in terms to male smoking prevalence. During this exact time
however, smoking prevalence amongst women has been rising. Even though it is unlikely that the
number of female smokers would supersede the number of male smokes; this does bring forth
approximately 20-25% more smokers into the global market.330 According to US-based research,
this influx of female smokers have been directly related to the smell and taste of cigarettes and how
they affect women’s behavioural smoking patterns more than that of men. Another reason for this
shift in demographics is related simply to culture and history.331
The table below demonstrates the decrease in smoking prevalence amongst developed
nations. It is very clear to see that the numbers have been decreasing for quite some time now.
Billion sticks 2001 2006 Vol Change % Change
Western Europe 722 631.2 -90.8 -0.12576 Eastern Europe 683.3 762 78.7 0.115176 North America 458.7 417.2 -41.5 -0.09047 Latin America 285.9 278 -7.9 -0.02763 Asia-Pacific 2,788.50 3,054.20 265.7 0.095284 Australasia 25.2 24.4 -0.8 -0.03175 Africa and Middle East 314.6 310.5 -4.1 -0.01303 World 5,278.10 5,477.40 199.3 0.03776
329 GMID. Global Tobacco: Survival Strategies for a Savage Market. 5 June 2008. 4 February 2009
<http://www.portal.euromonitor.com.proxy.library.carleton.ca/passport/ResultsList.aspx>. 330
GMID. Tobacco - World. 5 June 2008. March 2009 <http://www.portal.euromonitor.com.proxy.library.carleton.ca/passport/ResultsList.aspx>. 331
IBID

148 | P a g e
Another major problem facing the tobacco industry regards health concerns along with
concerns regarding the regulatory environment.
In today’s day and age, health and healthy living is of great concern. Since cigarettes and
tobacco are generally associated with an unhealthy lifestyle, this presents a problem to BAT. A
research study displayed about 72% of the US population believing that smoking one or more packs
of cigarettes a day is a great health risk.332 Anti-smoking campaigns have also begun to surge in
many parts of the world; especially those targeted towards youth.
Many countries are beginning to introduce higher tax rates on the retail sale price of
cigarettes. The European Union, for example, has made it so each member state must place at least
a 57% tax on the retail price of a tobacco product, thereby highly increasing the sales price for
consumers.333
Marketing efforts have also been inhibited due to increased governmental control policies.
FCTC regulations are making it very difficult for tobacco companies to market their brands and
merchandise to the general public, especially through forms of mass media communications. In the
United States, tobacco advertising outdoors, in movies, in cartoons, and even sponsorship by a
tobacco company is banned.334 In Europe, many EU states have begun to ban the distribution of
cigarettes through vending machines and e-sales.335 Japan, as well, has been trying to meet FCTC
332 StateMaster. “Perception of Cigarette Smoking Risk (most recent) by state” Office of Applied Studies. January
10, 2008. <http://www.statemaster.com/graph/hea_per_of_cig_smo_ris-health-perception-cigarette-smoking-risk> 333
Corporate Social Responsibility (and the FMCG Market Response) GMID 334
National Association of Attorneys General. "Master Settlement Agreement." National Association of Attorneys General. 2008-07-30. < http://www.naag.org/backpages/naag/tobacco/msa/msa pdf/1109185724_1032468605_cigmsa.pdf> 335
World Health Organization. Query Builder. 2009. February 2009 <http://data.euro.who.int/tobacco/?TabID=93302>.

149 | P a g e
standards. For instance, now cigarette packaging must have 30% of them covered in warning
labels.336
Some regulatory movements have also banned snus. This proves to be a problem for BAT
as it has recently begun to market it to the general public. If there are bans and restrictions
preventing its sale, then this will result in a decline in profits for the company.
BAT is also facing problems trying to keep up with its large brand portfolio. Having about
300 brands can be of great advantage to a company, as this would mean that it is able to target and
attract a wide-array of different consumer segments. However, this level of differentiation has led
to inventory build-up and thereby made the company less-efficient. BAT also had several factory
locations thereby making it difficult to increase the earnings per employee ratio. BAT also has the
highest number of factories used to manufacture its cigarettes, far greater than JTI and PMI.
British American Tobacco also has a weak point in research and development. BAT has had
significantly lower R&D expenditures in relation to other tobacco firms, even though the numbers
have been increasing. Although the tobacco industry is a mature market, this lack of investment in
R&D could prevent the company from sustainable growth and present it with lower profit margins.
R&D expenditure (In USD; million)
2007 2006 2005
BAT 86.03 66.23 52.7 PMI 362 304 N/A JTI Source: Bloomberg.
329.24 317.85 317.85
A notable shortcoming for the company in R&D is that it is weaker than its rivals in its
cigarette alternative products. The cigarette alternative products, otherwise known as other
tobacco products, are the only segments of the industry that are growing in developed markets.
Because R&D is a weakness for the company, it chooses to develop this market segment by
336 GMID. "Cigaratte--Japan." Country Report. 2008.

150 | P a g e
acquisitions such as ST which had an annual volume of 60 Million tonnes of roll-your own tobacco
sales in Europe.337
Lastly, illicit trade has become very important and a direct threat to the tobacco industry.
Illicit trade is still on the rise and has been having a grave impact on tobacco sales. Five members of
the EU alone reported to having experienced 12% illicit trade activity in 2007.338
Illicit trade has not only impacted sales and growth, but counterfeit has been impacting
brand image. When a counterfeit model of a brand is made, it often does not have the same factors
put into it, such as tar-levels, taste and etc. This often proves to consumers assuming the company
has changed their product, or could even be dangerous (as tar-levels may not be monitored).
Business Level Strategy Recommendations
British American Tobacco has incurred several problems related to its external; environment,
ie. the rising concerns in relation to health problems caused by cigarettes. Many regulations have
been imposed by governments everywhere to try and control the tobacco industry and BAT must
find alternatives to overcome these problems. Internally, BAT is wean in research and
development. This might harm its prospect of sustainability in the future. The company must
address these issues and utilize market opportunities to create sustainable competitive advantage.
R&D expenditure ($M) 2007 2006 2005
BAT 86.03 66.23 52.7 PMI 362 304 N/A JTI Source: Bloomberg.
329.24 317.85 317.85
337 GMID. Global Tobacco: Where Next for the Major Players? February 2009. February 2009
<http://www.portal.euromonitor.com.proxy.library.carleton.ca/passport/Magazine.aspx>. 338
British American Tobacco. Europe illicit trade map. 31 March 2008. February 2009 <http://www.bat.com/group/sites/uk__3mnfen.nsf/vwPagesWebLive/DO6TNLJ9?opendocument&SKN=1&TMP=1>.

151 | P a g e
Despite its similar size, BAT has the lowest R&D expenditure of the MTC strategic group. This
has been reflected in some of its value-chain activities. For example, BAT has inefficient
manufacturing systems, high employee numbers and high levels of inventory. These three
weaknesses will be addressed in turn as part of our first set of business-level strategy.
Implementing Flexible Manufacturing Systems (FMS)
BAT holds a “no one-size fits all strategy”, meaning that the company believes that a large
portfolio of local brands is necessary to sustain and attract the “must-win” consumer segments.339
Because the company produces over 300 brands,340 it has relatively inefficient operations. BAT
must address its inefficient internal manufacturing systems by increasing spending on flexible
manufacturing systems research and development. We foresee that improvement in manufacturing
systems will help to reduce the number of factories needed to produce their high number of brands.
Furthermore, it will also help reduce their high number of employees, since the shutting down of
factories will help the company layoff unnecessary workforce.
Better Supply Chain Management Systems
BAT’s supply chain management might be seen as an internal strength however, overall, BAT’s
supply-chain is weaker than that of the other companies. The company should benchmark the JTI
and imperial tobacco strategies, develop a better supply-chain system and streamline the
production process.341 For example, BAT should implement a centralized forecasting system to
manage the master production-scheduling tool to reduce the possibility of producing too much
inventory and limited waste of finished product. A strengthened supply-chain will help improve
BAT’s position especially if this creates a synergy effects with cost leadership. The implementation
339IBID
340British American Tobacco. Our Brands. 29 February 2009. February 2009
<http://www.bat.com/group/sites/uk__3mnfen.nsf/vwPagesWebLive/DO6Z2KVH?opendocument&SKN=1>. 341
Imperial Tobacco. Storage and distribution. 2009. February 2009 <http://www.imperial-tobacco.com/files/environment/cr2007/index.asp?pageid=21>.
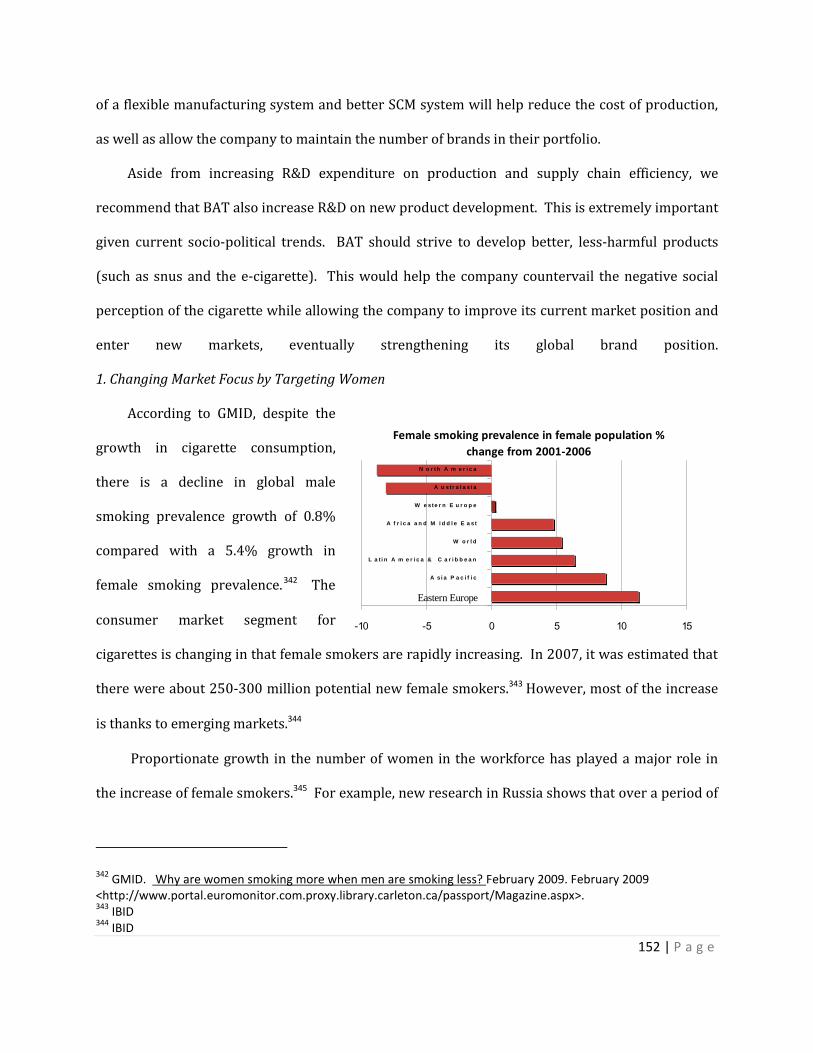
152 | P a g e
of a flexible manufacturing system and better SCM system will help reduce the cost of production,
as well as allow the company to maintain the number of brands in their portfolio.
Aside from increasing R&D expenditure on production and supply chain efficiency, we
recommend that BAT also increase R&D on new product development. This is extremely important
given current socio-political trends. BAT should strive to develop better, less-harmful products
(such as snus and the e-cigarette). This would help the company countervail the negative social
perception of the cigarette while allowing the company to improve its current market position and
enter new markets, eventually strengthening its global brand position.
1. Changing Market Focus by Targeting Women
According to GMID, despite the
growth in cigarette consumption,
there is a decline in global male
smoking prevalence growth of 0.8%
compared with a 5.4% growth in
female smoking prevalence.342 The
consumer market segment for
cigarettes is changing in that female smokers are rapidly increasing. In 2007, it was estimated that
there were about 250-300 million potential new female smokers.343 However, most of the increase
is thanks to emerging markets.344
Proportionate growth in the number of women in the workforce has played a major role in
the increase of female smokers.345 For example, new research in Russia shows that over a period of
342 GMID. Why are women smoking more when men are smoking less? February 2009. February 2009
<http://www.portal.euromonitor.com.proxy.library.carleton.ca/passport/Magazine.aspx>. 343
IBID 344
IBID
Female smoking prevalence in female population %
change from 2001-2006
-10 -5 0 5 10 15
Eastern Europe
A si a P a c i f i c
L a t i n A m e r i c a & C a r i b b e a n
W o r l d
A f r i c a a n d M i d d l e E a s t
W e ste r n E u r o p e
A u s t r a l a s i a
N o r th A m e r i c a
153 | P a g e
11 years there was an approximate 7%-15% rise in the number of female smokers.346 In developed
countries, there is a decreasing trend in female smokers mainly due to a rise in health concerns.347
Furthermore, there is variation in smoking prevalence in developed countries. Developed countries
including United States, Canada, Australia, and Germany are the countries with a significant
decrease in female smoker due to the influence of anti-smoking groups and health concerns.348 On
the other hand, counties like Japan, France and Italy, the number of female smokers has
continuously increased.349
We recommend that BAT take advantage of the increase in female smokers in emerging
markets by developing products that tailored to the wants of these female smokers. According to
US-based research, the smell and taste of the cigarette plays a major role in attracting a female to
smoking.350 Furthermore, cigarette innovations, such as slimmer and lower-tar cigarettes, often
attract female consumers better.351 For example, BAT could develop a product that has a feminine
taste (ie. Menthol) and that is slim and low-tar in order to appeal to this particular market.
2. The Need for Premiumisation and for Strengthening BAT’s Global Flagship Position.
International branding, which consists of the aggressive ‘marketing’ of a handful of
international brands, is a major strategy in the tobacco industry. Concentrating a company’s
resources on only a few brands allows for more effective branding. Secondly, it also allows for
more efficient research and development since it is easier to improve a handful of products rather
345 BBC News. Female Smokers: Doubles in Russia. 27 January 2008. February 2009
<http://news.bbc.co.uk/2/hi/health/7209551.stm>. 346
IBID 347
GMID. Why are women smoking more when men are smoking less? February 2009. February 2009 <http://www.portal.euromonitor.com.proxy.library.carleton.ca/passport/Magazine.aspx>. 348
IBID 349
IBID 350
IBID. 351
IBID
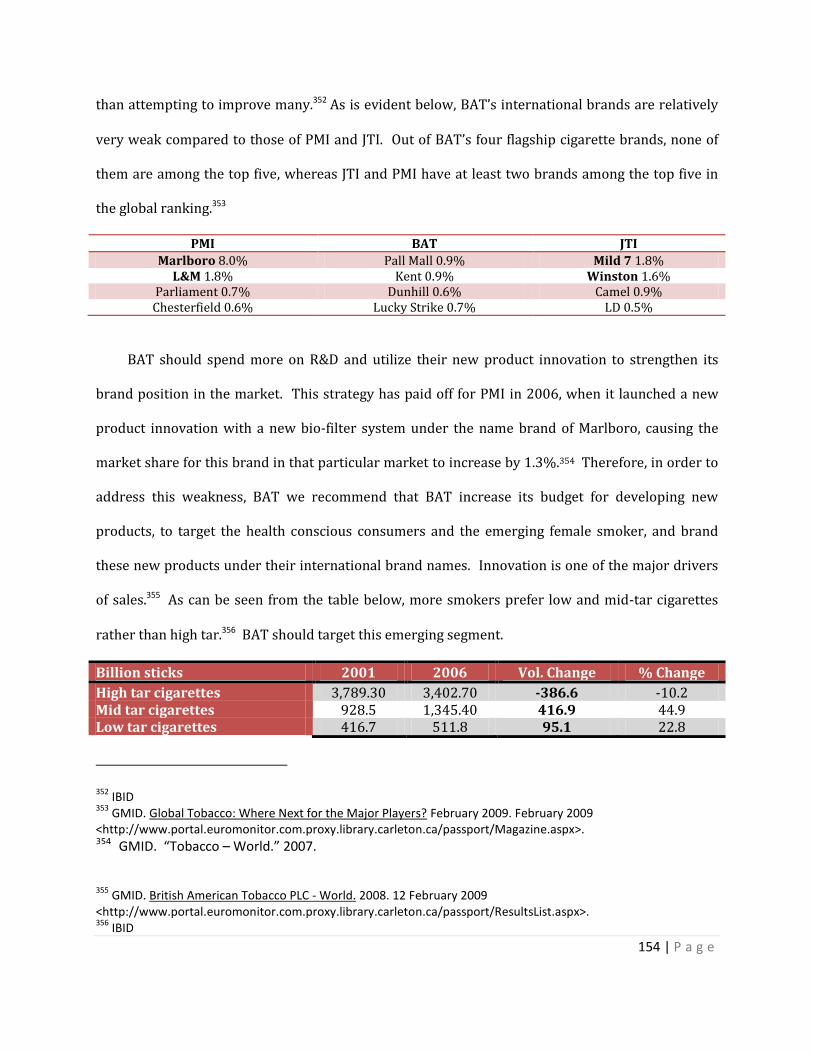
154 | P a g e
than attempting to improve many.352 As is evident below, BAT’s international brands are relatively
very weak compared to those of PMI and JTI. Out of BAT’s four flagship cigarette brands, none of
them are among the top five, whereas JTI and PMI have at least two brands among the top five in
the global ranking.353
PMI BAT JTI
Marlboro 8.0% Pall Mall 0.9% Mild 7 1.8% L&M 1.8% Kent 0.9% Winston 1.6%
Parliament 0.7% Dunhill 0.6% Camel 0.9% Chesterfield 0.6% Lucky Strike 0.7% LD 0.5%
BAT should spend more on R&D and utilize their new product innovation to strengthen its
brand position in the market. This strategy has paid off for PMI in 2006, when it launched a new
product innovation with a new bio-filter system under the name brand of Marlboro, causing the
market share for this brand in that particular market to increase by 1.3%.354 Therefore, in order to
address this weakness, BAT we recommend that BAT increase its budget for developing new
products, to target the health conscious consumers and the emerging female smoker, and brand
these new products under their international brand names. Innovation is one of the major drivers
of sales.355 As can be seen from the table below, more smokers prefer low and mid-tar cigarettes
rather than high tar.356 BAT should target this emerging segment.
Billion sticks 2001 2006 Vol. Change % Change
High tar cigarettes 3,789.30 3,402.70 -386.6 -10.2 Mid tar cigarettes 928.5 1,345.40 416.9 44.9 Low tar cigarettes 416.7 511.8 95.1 22.8
352 IBID
353 GMID. Global Tobacco: Where Next for the Major Players? February 2009. February 2009
<http://www.portal.euromonitor.com.proxy.library.carleton.ca/passport/Magazine.aspx>. 354 GMID. “Tobacco – World.” 2007.
355 GMID. British American Tobacco PLC - World. 2008. 12 February 2009
<http://www.portal.euromonitor.com.proxy.library.carleton.ca/passport/ResultsList.aspx>. 356
IBID
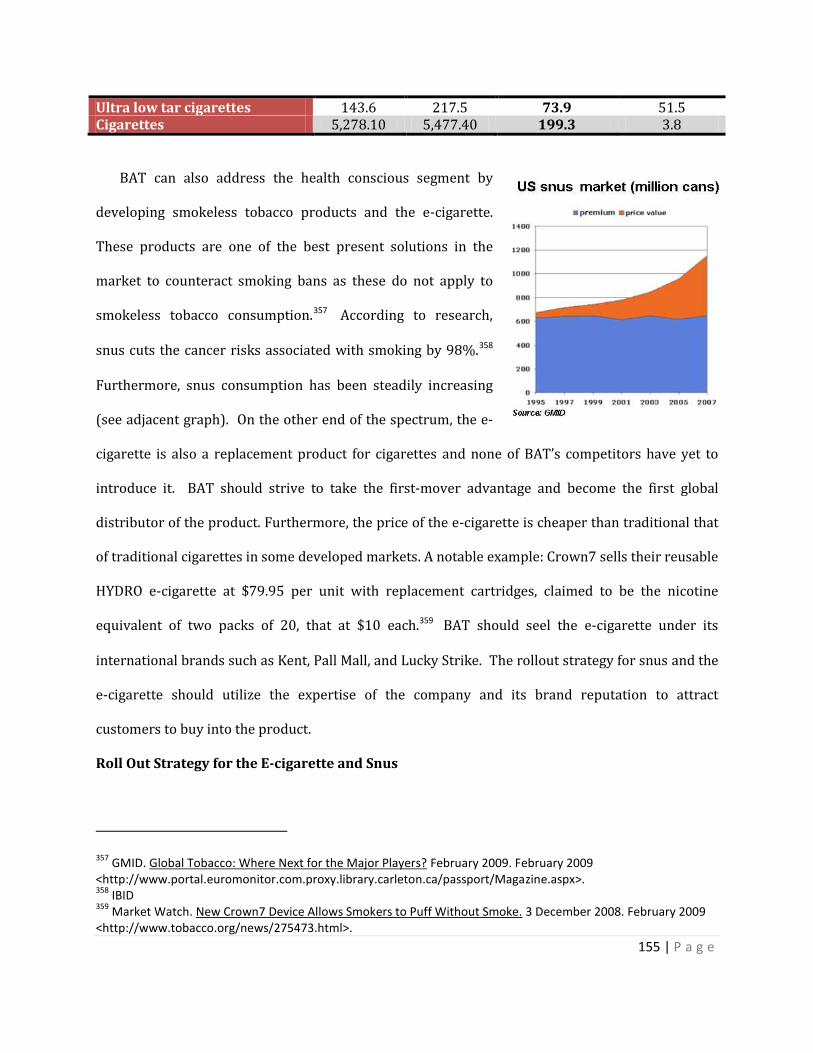
155 | P a g e
Ultra low tar cigarettes 143.6 217.5 73.9 51.5 Cigarettes 5,278.10 5,477.40 199.3 3.8
BAT can also address the health conscious segment by
developing smokeless tobacco products and the e-cigarette.
These products are one of the best present solutions in the
market to counteract smoking bans as these do not apply to
smokeless tobacco consumption.357 According to research,
snus cuts the cancer risks associated with smoking by 98%.358
Furthermore, snus consumption has been steadily increasing
(see adjacent graph). On the other end of the spectrum, the e-
cigarette is also a replacement product for cigarettes and none of BAT’s competitors have yet to
introduce it. BAT should strive to take the first-mover advantage and become the first global
distributor of the product. Furthermore, the price of the e-cigarette is cheaper than traditional that
of traditional cigarettes in some developed markets. A notable example: Crown7 sells their reusable
HYDRO e-cigarette at $79.95 per unit with replacement cartridges, claimed to be the nicotine
equivalent of two packs of 20, that at $10 each.359 BAT should seel the e-cigarette under its
international brands such as Kent, Pall Mall, and Lucky Strike. The rollout strategy for snus and the
e-cigarette should utilize the expertise of the company and its brand reputation to attract
customers to buy into the product.
Roll Out Strategy for the E-cigarette and Snus
357 GMID. Global Tobacco: Where Next for the Major Players? February 2009. February 2009
<http://www.portal.euromonitor.com.proxy.library.carleton.ca/passport/Magazine.aspx>. 358
IBID 359
Market Watch. New Crown7 Device Allows Smokers to Puff Without Smoke. 3 December 2008. February 2009 <http://www.tobacco.org/news/275473.html>.
156 | P a g e
In this final section, we suggest a roll out strategy, as know as the 4Ps, for the e-cigarette and
snus products. The e-cigarette is relatively attractive for BAT, especially if BAT enters the market
and become the first mover in the global market.
Product:
E-cigarette
The company should sell its product under the brand name of existing popular BAT Russian
products, for example, Vogue, which is popular with female smokers, strong brand names can help
BAT market its new product. The company should also modify the look of the e-cigarette to imitate
the traditional product and reduce reticence from the smoker.
Snus
The company should also sell snus under famous BAT brand names, although it should choose
those that are more popular with male smokers (ie. Pall Mall, Lucky Strike).
Price:
The price of the product should be set similar to that of traditional cigarettes. The product
cannot be lower than 80% of the price of the original product because this would create a threat for
BAT as customers could down trade to the e-cigarette and might reduce profits.360
Place:
The location in which the company chooses to first launch these new products should be
strategic as well, as location is a key success factor to a firm. One major market for initial launching
is Russia. Russia is the third largest market for cigarette consumption. Not only are there increasing
consumer trends for smoking, but the country is also experiencing premiumisation; meaning that
more consumers are up trading to premium products allowing an excellent opportunity for BAT to
enter the market.
360 GMID. Global Tobacco: Where Next for the Major Players? February 2009. February 2009
<http://www.portal.euromonitor.com.proxy.library.carleton.ca/passport/Magazine.aspx>.

157 | P a g e
The graphs below show cigarette consumption from 2001-2007, which has increased by 15%.
However, what is more significant to see is that the value of cigarettes sold has increased by over
75%. BAT could utilize this growth to capture more sales.
Also, the company should first launch the product in locations according to those in which the
brand name already exists. For example, Vogue is a super premium brand selling in more than 50
countries.361 Key markets include Russia, South Korea, France and Japan branded cigarette. 362
Promotion:
In order to attract new customers, BAT should use market penetration methods and mark
down the price of the product in the beginning thereby making the price more appealing to
smokers. Secondly, to attract more consumers the product must be sold close to the existing
361British American Tobacco. Our International Brands. 29 February 2009. February 2009
<http://www.bat.com/group/sites/uk__3mnfen.nsf/vwPagesWebLive/DO6Z2KVH?opendocument&SKN=1>. 362
IBID

158 | P a g e
product lines, to catch more attention. BAT can utilize its advantage of having good relationships
with their suppliers, to get the best display shell possible.
Business Level Strategy Summary
British American Tobacco currently has two major business level weaknesses, the first being
operational inefficiency and the second being weak brand positioning. Both problems are a result of the
fact that BAT is lacking in research and development expenditure. In order to address these problems, it
is necessary for BAT to increase its R&D expenditures to levels similar to those of its competitors. They
should invest in R&D in two ways. Firstly, by implementing flexible manufacturing systems within their
supply chain process, this will increase the firm’s manufacturing efficiency, which in turn will result in
higher profit margins for the firm. Secondly, by increasing expenditure in new product development;
this will help enhance BAT’s global brand positioning, since innovation is a major driver to sales.
Strategic Analysis Summary
British American Tobacco is a successful firm, especially in terms to its performance. Since its
creation it has managed to exceed industry standards in many aspects and continues to grow
steadily.
BAT is currently using a single business strategy that has allowed it to not only differentiate its
products but also try and maintain low costs; thereby allowing it to position itself in the integrated
cost-leadership/differentiation strategy. BAT has used its brand market portfolio of over 300
brands along with its multi-domestic strategy to define its business; however has managed to
ensure that costs are low. The company has tried to serve a wide array of consumer segments
ranging from low-cost to premium with its multitudes of brands. However the firm is truly driven
by its global drive brands and its international brands. They have been constantly showing
extensive growth and have proved to be very successful for the firm. By maintaining its midstream

159 | P a g e
operations; the firm has managed to uphold its efficiency and this has led it to flow upstream and
downstream in its endeavours; thus strengthening the supply chain.
The firm has also focused on delivering cigarettes, although it has also been participating in
the other tobacco products sector as well. Its current strategy is to acquire firms in the emerging
markets, as these are seen to be up and coming; and a very strong potential strength for firm and its
operations, as smoking in developed nations is dropping. BAT has also been trying to restructure
its firm to ensure that it is being as efficient as possible, therefore allowing it to further its profit
margins and not fall into a weak position.
BAT is also the most international tobacco company, which has many advantages. It is most
present in emerging economies and has presence on nearly every continent. This allows it to
increase its scope and thereby lead in places where there are currently no leaders; by forming
acquisitions, wholly-owned subsidiaries, strategic alliances and joint ventures.
BAT is currently faced with several problems and concerns. Firstly, the general smoking
population is at a decline. The firm is serving this issue by entering emerging markets and
incrementally increasing the costs of cigarettes. There is also intense competition in the global
tobacco industry as there are not many players present.
Our recommendation to assist with these issues is that BAT acquire Imperial Tobacco, the
fourth largest competitor in the market. This would allow BAT to overtake PMI as a competitor and
place it as the leader. BAT would also increase its presence in emerging markets, thereby gaining
leadership in an unexplored part of the world in terms to the industry.
The next recommendation is for BAT to enter the financial services sector as this would allow
the firm to diversify its options and gain status as another mode of conducting business.
BAT’s problems in the business functional respect are somewhat similar. A decrease in the
consumption of cigarettes by males has led BAT to venture into the female market, thereby
160 | P a g e
allowing it to cater to a new segment and thereby increase its share. There is also the question of
research and development expenditure. BAT is lagging far behind the industry in this endeavor and
in order to succeed in such an industry, innovation is key. BAT must begin to enhance its R&D
department thereby venturing into healthier alternatives to cigarettes, snus and the e-cigarette.
BAT also needs to focus its operations and ensure that they are being as productive and efficient as
possible. Their 300 brands brand portfolio is causing them the firm to have lower levels of
efficiency and thereby limiting employee productivity. BAT must close its factories and ensure that
they are focusing on their global drive brands and increasing their exposure.
We believe that British American Tobacco has the potential to be a leader in the global tobacco
market and feel that with the help of these new strategies, the company will be on its way to the
top.

161 | P a g e
Bibliography American Heart Association. “Tobacco, Federal Regulation of.” American Heart Association. 2009. <http://www.americanheart.org/presenter.jhtml?identifier=11223> American Lung Association . Curbing Internet Sales of Tobacco Products. 2009. January 2009 <http://www.lungusa.org/site/c.dvLUK9O0E/b.3914925/>. American Lung Assoication. Nicotine Replacement Therapy (NRT) and Other Medications Which Aid Smoking Cessation. July 2006. 1 April 2009 <http://www.lungusa.org/site/pp.asp?c=dvLUK9O0E&b=33566>. Answers.com. British American Tobacco. 2009. February 2009 <http://www.answers.com/topic/british-american-tobacco-adr>. Ayers, James B. ""SCM Assessment Tools ."" Ayers, James B. Handbook of supply chain management. Boca Raton: Auerbach Publications, 2006. 57." Barack Obama. “Health Care.” Barrack Obama and Joe Biden. Januray 27, 2008. <http://www.barackobama.com/issues/healthcare/>" BBC News. Female Smokers: Doubles in Russia. 27 January 2008. February 2009 <http://news.bbc.co.uk/2/hi/health/7209551.stm>. BMJ Group. What is Nicotine Addiction? 6 March 2009. March 2009 <http://www.guardian.co.uk/lifeandstyle/besttreatments/smoking-description>. British American Tobacco . Does British American Tobacco have any plans to diversify? 29 January 2008. February 2009 <http://www.bat.com/group/sites/uk__3mnfen.nsf/vwPagesWebLive/F8B353934A020CBEC12573140052EE9A?opendocument&SKN=1>. British American Tobacco Plc - Tobacco – World: Core Businesses British American Tobacco. Adding Value to the Relationship. 31 October 2007. 10 February 2009 <http://www.bat.com/group/sites/uk__3mnfen.nsf/vwPagesWebLive/DO6ZXPMX?opendocument&SKN=1&TMP=1>. British American Tobacco. Africa and Middle East illicit trade map. 9 April 2009. 2 April 2009 <http://www.bat.com/group/sites/uk__3mnfen.nsf/vwPagesWebLive/DO6TNLJ9?opendocument&SKN=1&TMP=1>. British American Tobacco. British American Tobacco 2007 Annual Report. 2007.
162 | P a g e
British American Tobacco. Chief Executive Q&A. 31 March 2008. 1 March 2009 <http://www.bat.com/group/sites/UK__3MNFEN.nsf/vwPagesWebLive/DO6Z2FT3?opendocument&SKN=1>. British American Tobacco. Crop to Consumer - Step 6: Trade Marketing and Distribution. 31 October 2007. 11 February 2009 <http://www.bat.com/group/sites/uk__3mnfen.nsf/vwPagesWebLive/2D2ABD6EEBE7E9BEC125734B004AE2FA?opendocument&SKN=1>. British American Tobacco. Customer Satisfaction. 6 June 2008. 7 February 2009 <http://www.bat.com/group/sites/uk__3mnfen.nsf/vwPagesWebLive/DO6ZXPHB?opendocument&SKN=1&TMP=1>. British American Tobacco. Europe illicit trade map. 31 March 2008. February 2009 <http://www.bat.com/group/sites/uk__3mnfen.nsf/vwPagesWebLive/DO6TNLJ9?opendocument&SKN=1&TMP=1>. British American Tobacco. Growth. 2007. 11 February 2009 <http://www.bat.com/groupfs/sites/BAT_7AWFS6.nsf/vwPagesWebLive/DO7CMP9K?opendocument&SKN=1&TMP=1>. British American Tobacco. Leaf Operations. 2008. February 2009 <http://www.bat.com/group/sites/uk__3mnfen.nsf/vwPagesWebLive/DO52AGLL?opendocument&SKN=1>. British American Tobacco. Modern Tobacco Marketing. 7 November 2007. 10 February 2009 <http://www.bat.com/group/sites/UK__3MNFEN.nsf/vwPagesWebLive/DO78BDW6?opendocument&SKN=1&TMP=1>. British American Tobacco. Our Brands. 29 February 2009. February 2009 <http://www.bat.com/group/sites/uk__3mnfen.nsf/vwPagesWebLive/DO6Z2KVH?opendocument&SKN=1>. British American Tobacco. Our History. 31 October 2007. February 2009 <http://www.bat.com/group/sites/uk__3mnfen.nsf/vwPagesWebLive/DO52ADGE?opendocument&SKN=1>. British American Tobacco. Our International Brands. 29 February 2009. February 2009 <http://www.bat.com/group/sites/uk__3mnfen.nsf/vwPagesWebLive/DO6Z2KVH?opendocument&SKN=1>. British American Tobacco. Our Vision. 31 October 2007. February 2009 < http://www.bat.com/group/sites/UK__3MNFEN.nsf/vwPagesWebLive/DO659LCX?opendocument&SKN=1>.
163 | P a g e
British American Tobacco. Productivity. 10 July 2008. 1 March 2009 <http://www.bat.com/group/sites/UK__3MNFEN.nsf/vwPagesWebLive/DO65AC5N?opendocument&SKN=1>. British American Tobacco. Regional Review. 2007. 10 February 2009 <http://www.bat.com/groupfs/sites/BAT_7AWFS6.nsf/vwPagesWebLive/DO7B5NUK?opendocument&SKN=1&TMP=1>. British American Tobacco. Responsible Leaf Production . 31 March 2008. 1 March 2009 <http://www.bat.com/group/sites/uk__3mnfen.nsf/vwPagesWebLive/DO52APTT?opendocument&SKN=1>. British American Tobacco. Retailer Relationships. 30 April 2008. 10 February 2009 <http://www.bat.com/group/sites/uk__3mnfen.nsf/vwPagesWebLive/DO6ZXP2Z?opendocument&SKN=1>. British American Tobacco. Where We Are Going. 31 March 2007. February 2009 < http://www.bat.com/group/sites/uk__3mnfen.nsf/vwPagesWebLive/DO52ADBZ?opendocument&SKN=1>. British American Tobacco. Who We Are. 14 July 2008. 1 March 2009 <http://www.bat.com/group/sites/uk__3mnfen.nsf/vwPagesWebLive/DO52ADCY?opendocument&SKN=1>. Bryony, Taylor. HK$10 Rise In Price Of A Packet Of Cigarettes. 27 February 2009. February 2009 <http://tobacco.cleartheair.org.hk/2009/02/27/hk10-rise-in-price-of-a-packet-of-cigarettes/>." Business Week. British American Tobacco PLC (BTI:AMEX). Invest.BusinessWeek.com. February5, 2009 <http://investing.businessweek.com/research/stocks/people/people.asp?symbol=BTI>" Campaign for Tobacco-Free Kids. Tobacco Advertising Gallery. 2004. 10 February 2009 <http://www.tobaccofreekids.org/adgallery/index.php3?Brand=1>. CanWest News Service. Critics raise stink about cigarettes with less tobacco smell. 7 December 2007. January 2009 <http://www.canada.com/topics/news/national/story.html?id=d522153b-fa74-4f2e-a458-bca6df756cb7&k=74191>. Capehart, Tom. Trends in U.S. Tobacco. November 2004. 1 April 2009 <http://www.ers.usda.gov/publications/tbs/nov04/tbs25702/tbs25702.pdf>." CDC. “Morbidity and Mortality Weekly Report.” Center for Disease Control and Prevention. May 23, 2008. <http://cdc.gov/mmwr/preview/mmwrhtml/mm5720a3.htm>" Central Intelligence Agency. European Union. 2 April 2009. 1 April 2009 <https://www.cia.gov/library/publications/the-world-factbook/geos/ee.html>.

164 | P a g e
Central Intelligence Agency. Japan. 2 April 2009. 1 April 2009 < https://www.cia.gov/library/publications/the-world-factbook/geos/ja.html l>. Chemical & Engineering News. ""Newscripts."" Chemical & Engineering News (2008): 56." CNBC. Paul Adams, Cheif Executive. 26 February 2009. February 2009 <http://www.executiveinterviews.com/UK03356-bat-cnbceu/>." Consumer Lifestyles in the United States, GMID Corporate Social Responsibility (and the FMCG Market Response) GMID Crop to Consumer. British American Tobacco. February 2009. <http://www.britishamericantobacco.com/group/sites/UK__3MNFEN.nsf/vwPagesWebLive/DAA7099C52BE7BABC125734B0049A77F?opendocument&SKN=1> Crown7 . Crown7 Announces New HYDRO Electronic Cigarette Product Line . 12 March 2008. January 2009 <http://www.tobacco.org/news/275473.html>. Datamointer. British American Tobacco-company report. January 2008. February 2009 Datamonitor, Global Tobacco: Industry Profile, Reference Code: 0199-0817, Publication date: December 2008" Datamonitor. British American Tobacco PLC - Company Profile. 13 October 2008. Datamonitor. Tobacco Industry – Global. December 2008. DesignBoom. Cigarette Pack Graphics. DesignBoom. January 2009. <http://www.designboom.com/history/cigarettes.html> Diethelm, Pascal and Martin Mckeen. Lifting the Smokescreen. France, February 2006." Dow Jones. British American Tobacco PLC. Factiva, 2009." Eastern Company. Eastern Company S.A.E. 2006. February 2009 <http://www.easternegypt.com/cigaretsexport.html>. Economist Intelligence Unit(EIU). Japan--country report. Country Report. United Kingdom: EIU, 2009." Economist Intelligence Unit. “Country Data Japan.” Economic Data, EIU" Economist Intelligence Unit. “Country Data United States.” Economic Data, EIU <http://www.economist.com/countries/USA/profile.cfm?folder=Profile%2DEconomic%20Data>" Economist Intelligence Unit. Country Report - European Union . March 2009. 9 April 2009 <http://www.eiu.com.proxy.library.carleton.ca/index.asp?layout=displayIssueArticle&issue_id=1814375966&opt=full>.
165 | P a g e
Effect of smokeless tobacco (snus) on smoking and public health in Sweden: J. Foulds, L. Ramstrom, M. Burke, K. Fagerstrom. Review, Tobacco Control, 2003." Employment Situation Summary. US Department of Labour. 3 April 2009. <http://www.bls.gov/news.release/empsit.nr0.htm> Europa. Panorama of the European Union. 2009. January 2009 <http://europa.eu/abc/panorama/index_en.htm>. European Comission. Attitudes of Europeans towards Tobacco. May 2007. European Commission. EuroStat. 2009. January 2009 <http://epp.eurostat.ec.europa.eu/portal/page?_pageid=1996,45323734&_dad=portal&_schema=PORTAL&screen=welcomeref&open=/t_popula/t_pop/t_demo_pop&language=en&product=REF_TB_population&root=REF_TB_population&scrollto=160>." European Union Public Health Information System. Smoking policies. 14 April 2008. January 2009 <http://www.euphix.org/object_document/o4899n27110.html>. Factiva. ""British American Tobacco PLC."" Dow Jones Insider (2009)." Fallon, M. ""Traceability of poultry and poultry products."" Revscitech Offint Epiz (2001): 538-546." Federal Trade Commission. “Prepared Statement of the Federal Trade Commission Before the Committee on Commerce, Science, and Transportation, United States Senate” Federal Trade Commission. November 13, 2007," Food and Agriculture Organization of the United Nation. Overview. 2009. <http://www.fao.org/DOCREP/006/Y4997E/y4997e03.htm#TopOfPage>. Food and Agriculture Organization of United Nation. PROJECTIONS OF PRODUCTION OF TOBACCO LEAF. 1 April 2009 <http://www.fao.org/DOCREP/006/Y4956E/y4956e08.htm>. Framework Convention Alliance. What is the Framework Convention on Tobacco Control? 9 February 2009 <http://www.fctc.org/index.php?option=com_content&view=article&id=14&Itemid=11>. GMID. Global Tobacco: Survival Strategies for a Savage Market. 2008 GMID, “ Cigarette—China” Country Report (2008)" GMID. Why are women smoking more when men are smoking less? February 2009. February 2009 <http://www.portal.euromonitor.com.proxy.library.carleton.ca/passport/Magazine.aspx>. GMID. “Tobacco – World.” 2007. GMID. ""Cigaratte--Japan."" Country Report. 2008."

166 | P a g e
GMID. ""Consumer lifestyles--Japan."" Country Report. 2006." GMID. ""Tobacco-Japan."" Country Report. 2008." GMID. British American Tobacco - PLC. 2008. 12 February 2009 <http://www.portal.euromonitor.com.proxy.library.carleton.ca/passport/ResultsList.aspx>. GMID. British American Tobacco in Tobacco. February 2009. February 2009 <http://www.portal.euromonitor.com.proxy.library.carleton.ca/passport/Magazine.aspx>. GMID. British American Tobacco PLC - World. 2008. 12 February 2009 <http://www.portal.euromonitor.com.proxy.library.carleton.ca/passport/ResultsList.aspx>. GMID. British American Tobacco Plc: Company Factfile . 2008. 4 February 2009 <http://www.portal.euromonitor.com.proxy.library.carleton.ca/passport/DocumentView.aspx>. GMID. Company Report, Philip Morris Cos Inc - Tobacco – World. 2008" GMID. Company Shares (by Global Brand Owner) • Retail Volume • mn sticks. 2007 GMID. Global Tobacco: Survival Strategies for a Savage Market. 5 June 2008. 4 February 2009 <http://www.portal.euromonitor.com.proxy.library.carleton.ca/passport/ResultsList.aspx>. GMID. Global Tobacco: Where Next for the Major Players? February 2009. February 2009 <http://www.portal.euromonitor.com.proxy.library.carleton.ca/passport/Magazine.aspx>. GMID. Imperial Tobacco Group Plc - Tobacco - United Kingdom. 2008 GMID. Japan Tobacco Inc - Tobacco – World: STRATEGIC EVALUATION. 2008 GMID. Philip Morris Cos Inc - Tobacco - World. 11 March 2008. 8 February 2009 <http://www.portal.euromonitor.com.proxy.library.carleton.ca/passport/ResultsList.aspx>. GMID. Tobacco – World Monopolies – The Next Stage in Consolidation. 2008 GMID. Tobacco - World, point of sales. 2008" GMID. Tobacco - World. 5 June 2008. March 2009 <http://www.portal.euromonitor.com.proxy.library.carleton.ca/passport/ResultsList.aspx>. GMID. Tobacco – World: COMPANY STRATEGIES. 2008 GMID. Tobacco – World: Imperial Tobacco. 2008 GMID. Tobacco: World. 5 June 2008. 4 February 2009 <http://www.portal.euromonitor.com.proxy.library.carleton.ca/passport/ResultsList.aspx>.
167 | P a g e
GMID: Tobacco – World Channel Trends GMID: Tobacco – World: BAT Gochman. “Handbook of Health Behavior Research IV” Kluwer Academic Publishers. 2001 Google . Google Finance. 23 January 2009. January 2009 <http://www.google.com/finance>. Google Finance. Barclays PLC(Public, LON:BARC). Google. Accessed on March 4th 2009." Google Finance. “IMT.” Google. January 23, 2009. <http://finance.google.com/finance?q=LON:IMT>" Google Finance. “TYO: 2910.” Google. Janurary 23, 2009. <http://finance.google.com/finance?q=TYO:2914>" Google Finance. Google. Accessed on 5 February 2009. Google Finance. Lloyds Banking Group PLC(Public, LON:LLOY). Google. Accessed on March 4th 2009." Government Printing Office. “Cigarette smoking and health characteristics: United States” . Vital and health statistics. Series 10. No. 34. Center for Disease Control and Prevention. July 1964–June 1965. <http://www.cdc.gov/nchs/data/series/sr_10/sr10_034acc.pdf> Grand Prix Encyclopedia. SPONSORS: BRITISH AMERICAN TOBACCO (LUCKY STRIKE). 2008. February 2009 <http://www.grandprix.com/gpe/spon-028.html>. Hausman, Warren H. ""Supply Chain Performance Metrics."" Emerging Supply Chain Practices. Stanford University, 2000." Health Canada. A Proposal to Regulate the Display and Promotion of Tobacco and Tobacco-Related Products at Retail. 8 January 2008. 10 February 2009 <http://www.hc-sc.gc.ca/hl-vs/tobac-tabac/commun/consultation/_tob-ret/6-eng.php>. Health New Zealand Ltd Information. The Ruyan E-cigarette. New Zealand, 31 March 2008." Heyman KM, Schiller JS, Barnes P. “Early release of selected estimates based on data from the 2007 National Health Interview Survey.” National Center for Health Statistics, June 2008. <http://www.cdc.gov/nchs/about/major/nhis/released200806.htm.>" Hilts, Phillip J. Relative Addictiveness of Drugs . 12 August 1994. January 2009 <http://www.tfy.drugsense.org/tfy/addictvn.htm>." Hu, Hongchun, et al. ""Research on the Application of Radio Frequency Identification in Cigarette-Distribution Systems."" International Conference on Automation and Logistics (2007): 2586-2591." Ikkki Yamakawa. “22% of smokers carry taspo ID card” Asahi Shimbum(2008)
168 | P a g e
Imperial Tobacco . Group Financial Performance. 2009. February 2009 <http://www.imperial-tobacco.com/files/financial/results/ir2008/index.asp?pageid=4>. Imperial Tobacco. Storage and distribution. 2009. February 2009 <http://www.imperial-tobacco.com/files/environment/cr2007/index.asp?pageid=21>. International Monetary Fund. ""Country and Regional Perspectives."" 2008. International Monetary Fund. 31 March 2009 <http://www.imf.org/external/pubs/ft/weo/2008/02/pdf/c2.pdf>." Isidore, Chris. “It's official: Recession since Dec. '07.” CNNMoney.com. December 1, 2008 <http://money.cnn.com/2008/12/01/news/economy/recession/?postversion=2008120115>" J R Hughes, S Shiffman, P Callas and J Zhang. ""A meta-analysis of the efficacy of over-the-counter nicotine replacement."" Tob. Control (2003): 12;21-27." Janus, Andrea. E-cigarettes mimic smoking, but are they safe? 21 February 2009. February 2009 <http://www.ctv.ca/servlet/ArticleNews/story/CTVNews/20090220/ecigarette_safety_090221/20090221?hub=Health>." Japan Tobacco Inc. Facts and Figures. 16 June 2008. 10 February 2009 <http://www.jti.com/about/facts>. Japan Tobacco. Climate for Change. 2007. Japan Tobacco. JT to Release New Camel Product Nationwide. 15 February 2007. January 2009 <http://www.jti.co.jp/JTI_E/Release/2007/02/20070213_01.html>. Japanese Government. Tobacco industrial law. 2007. Jha, Alok. Tobacco Firm Plays Down Reports of Safer Cigarette. 7 November 2006. January 2009 <http://www.guardian.co.uk/society/2005/nov/07/health.smoking>." Jones, Jeffrey. “Latest Gallup Update Shows Cigarette Smoking Near Historical Lows” GALLUP. June 25, 2007. <http://www.gallup.com/poll/28213/Latest-Gallup-Update-Shows-Cigarette-Smoking-Near-Historical-Lows.aspx>" Kazunari Satomura, Suketaka Iwanaga and Megumi Noami. “The Framework Convention on Tobacco Control (FCTC) and Japnese anti-tobacco measures.” Report. 2008." Leake, Jonathan. 'Safe cigarette' claimed to cut cancer by 90%. 6 November 2005. January 2009 <http://www.timesonline.co.uk/tol/news/uk/article587130.ece>." Lugmayr, Luigi. World's First Vitamin E Cigarette. 21 September 2007. January 2009 <http://www.i4u.com/article11644.html>." Market Watch. “Market Watch: How will recession impact the tobacco market in 2009?” MarketWatch. 2009.
169 | P a g e
Market Watch. New Crown7 Device Allows Smokers to Puff Without Smoke. 3 December 2008. February 2009 <http://www.tobacco.org/news/275473.html>. Mergent Online. British American Tobacco Plc (ASE: BTI). Company Details. Mergent Online. British American Tobacco Plc (ASE: BTI): 2009 Mergent Online: Imperial Tobacco Group Plc (NBB: ITYB Y). Property Mergent Online: Imperial Tobacco Group Plc (NBB: ITYB Y). Subsidiaries Morgan Stanley Consumer Retail Conference: New York. British American Tobacco, November 2008." Morgan Stanley Consumer Retail Conference: New York. British American Tobacco. November 2008 <http://www.bat.com/group/sites/uk__3mnfen.nsf/vwPagesWebLive/DO6FKEVZ/$FILE/medMD7LJDQT.pdf?openelement> Moyer, Elizabeth. “Washington's $5 Trillion Tab.” Forbes.com. December 11, 2008. <http://www.forbes.com/2008/11/12/paulson-bernanke-fed-biz-wall-cx_lm_1112bailout.html>" National Association of Attorneys General. ""Master Settlement Agreement."" National Association of Attorneys General. 2008-07-30. < http://www.naag.org/backpages/naag/tobacco/msa/msa pdf/1109185724_1032468605_cigmsa.pdf>" NICLite®. Smoke Free Choice. 2008. 1 April 2009 <http://www.smokefreechoice.com/question-answer.html>. Pamela Jones Harbour. “CONCURRING STATEMENT OF COMMISSIONER PAMELA JONES HARBOUR” Federal Trade Commission. November 26, 2008. < http://www.ftc.gov/os/2008/11/P944509cambridgefiltermethodharbourstmnt.pdf>" Philip Morris International Management SA. “How we Operate.” Philip Morris International. 2008. <http://www.philipmorrisinternational.com/PMINTL/pages/eng/ourbus/How_we_operate.asp> Philip Morris International Management SA. “PMI @ a Glance.” Philip Morris International. 2008. <http://www.philipmorrisinternational.com/PMINTL/pages/eng/ourbus/About_us.asp> Philip Morris International Management SA. “The trade in fake cigarettes” Philip Morris International. Accessed on January 20, 2008. <http://www.philipmorrisinternational.com/PMINTL/pages/eng/busenv/Counterfeiting.asp>" Philip Morris USA Media Relations. “Philip Morris USA Files Additional Lawsuits to Stop Importation of Counterfeit Cigarettes” Philip Morris USA. April 9, 2008. <http://www.philipmorrisusa.com/en/cms/Media/Company_Announcements/2008/Philip_Morris_USA_Files_Additional_Lawsuits_to_Stop_Importation_of_Counterfeit_Cigarettes.aspx?src=search>" Phillip Morris International . Counterfeiting. 2009. 2 April 2009 <http://www.philipmorrisinternational.com/PMINTL/pages/eng/busenv/Counterfeiting.asp>.

170 | P a g e
Qiang, Qiao. ""The Application of RFID ."" Modern Information (2005): 150-151." Reducing our carbon footprint. British American Tobacco. February 2009. <http://www.bat.com/group/sites/UK__3MNFEN.nsf/vwPagesWebLive/DO7JUGKV?opendocument&SKN=4> Responsible leaf production. British American Tobacco. February 2009. <http://www.britishamericantobacco.com/group/sites/UK__3MNFEN.nsf/vwPagesWebLive/97E247DD4B43ED16C1257314004EF5E7?opendocument&SKN=1> SAV. Despite a Ban, E-cigarettes are Available Online. 20 January 2009. 12 February 2009 <http://www.medindia.net/news/Despite-a-Ban-E-cigarettes-are-Available-Online-46537-1.htm> ." Scott, Andrew G. Economic Survey of Western Europe and the European Union. April 2009. April 2009 <http://www.europaworld.com.proxy.library.carleton.ca/entry/we.essay.4>." Shiraki, Toru Fujioka and Maki. ""Japan's Convenience-Store Sales Rise the Most in Eight Years."" Bloomberg News (2009)." Smith, Glenn. ""Sector Insight...Japanese tobacco gaints focus on point-of-sales."" Brand Republic Asia (2008)." StateMaster. “Perception of Cigarette Smoking Risk (most recent) by state” Office of Applied Studies. January 10, 2008. <http://www.statemaster.com/graph/hea_per_of_cig_smo_ris-health-perception-cigarette-smoking-risk>" Study relates marijuana and tobacco use. Yale Daily News. 19 January 2005. <http://www.yaledailynews.com/articles/view/12772?badlink=1> Tabuchi, Hiroko. ""Japan eyes new cigarette tax."" The Wall Street Journal (2008)." The Conference Board Consumer Confidence Index Relatively Unchanged in March. The US Conference Board. 31 March 2009. <http://www.conference-board.org/economics/ConsumerConfidence.cfm> The Japan Times. ""Financial crisis hits home."" 12 November 2008. The Japan Time Online. 22 01 2009 <http://search.japantimes.co.jp/cig-bin/ed20081112a1.html>." Tobacco Solution Online. Nicotine Transdermal Patch. 2009. 1 March 2009 <http://stores.tobaccosolutionsonline.com/Search.bok?category=Nicotine+Transdermal+Patch>. Tobacco Solutions Online Home. Tobacco Solutions Online Product List. 2009. 2009 April 1 <http://stores.tobaccosolutionsonline.com/Categories.bok>. Tonnesen P, Tonstad S, Hjalmarson A, Lebargy F, Van Spiegel P I, Hider A, Sweet R, Townsend J (2003). ""A multicentre, randomized, double-blind, placebo-controlled, 1-year study of bupropion SR for

171 | P a g e
smoking cessation"". J Intern Med 254 (2): 184–192. doi:10.1046/j.1365-2796.2003.01185.x. PMID 12859700. " U.S. Food and Drug Administration. Early Communication About an Ongoing Safety Review. 1 February 2008. 1 April 2009 <http://www.fda.gov/Cder/Drug/early_comm/varenicline.htm>. US Economy Could Recover Much Sooner Than Expected. CNBC. 9 April 2009. <http://www.cnbc.com/id/30111906> WashingtonTimes.com “Obama: Decriminalize pot” The Washington Times. January 31, 2008. < http://www.washingtontimes.com/news/2008/jan/31/obama-decriminalize-pot/>" WHO. The tobacco atlas. 2009. 1 April 2009 <http://www.who.int/tobacco/resources/publications/tobacco_atlas/en/index.html>. Willet, David. “Sierra Club Endorses Obama for President Joins United Steelworkers in Call for Clean Energy Future” Sierra Club. June 19, 2008. <http://www.sierraclub.org/pressroom/releases/pr2008-06-19.asp>" Wilson, Duff. “Democrats Plan an Early Push Against Tobacco.” New York Times. January 6, 2009. < http://www.nytimes.com/2009/01/06/business/06smoke.html>" World Health Organization Regional Office for Europe. Data and Publications. 2009. April 2009 <http://data.euro.who.int/tobacco/?TabID=93302>. World Health Organization. Cigarette Consumption. 2007. 2 April 2009 <http://www.who.int/tobacco/en/atlas8.pdf>. World Health Organization. Query Builder. 2009. February 2009 <http://data.euro.who.int/tobacco/?TabID=93302>. World Tobacco. Vitamin E cigarette by German Tobacco Group . 9 October 2007. January 2009 <http://www.worldtobacco.co.uk/shownews.asp?secid=&pubid=27&nav=1&newstype=0&key=distribution&page=0&newsid=12988>. Yahoo Finance. Cigarette prices rise ahead of looming taxes. 11 February 2009. February 2009 <http://biz.yahoo.com/ap/090211/cigarette_prices.html>. Yamaguchi, Mari. One Fifth of Japanese population age 65 or Older in Rapidly aging Japan. 20 May 2008. 22 01 2009 <http://www.globalaging.org/elderrights/world/2008/japan.htm>." YouTube. 1948 - Lucky Strike Marching Cigarettes Ad. 18 March 2006. 10 February 2009 <http://www.youtube.com/watch?v=BU49DSS1ibc&feature=related>. Zhang Danyu, Liaoli. ""Logistics System Course."" Shandong University Press (2004)."

172 | P a g e
Appendices

173 | P a g e