Embed Size (px)
Citation preview

A Spiking Neuron Model of Head-Direction Cells forRobot Orientation
Thomas Degris�
Loıc Lacheze�
Christian Boucheny���
Angelo Arleo����
AnimatLab - LIP68 rue du Capitaine Scott75015 [email protected]@lip6.fr
���LPPA - College de France - CNRS
11 place M. Berthelot75005 [email protected]@college-de-france.fr
Abstract
This paper proposes a bio-mimetic model of head-direction (HD) cells implemented on a real robot. Themodel is based on spiking neurons to study the tem-poral aspects of state transitions of the HD cell ac-tivity following reorienting visual stimuli. The shorttransient latencies observed experimentally are repro-duced by the model. We focus on the integrationof angular velocity inertial signals provided by ac-celerometers. This integration is realized by a con-tinuous attractor network modeling the interaction be-tween the lateral mammillary nucleus (LMN) and thedorsal tegmental nucleus (DTN), two structures be-longing to the HD cell anatomical circuit. Relevantparameters defining the connections between LMNand DTN are determined by a genetic algorithm.
1. Introduction
Self-orienting agents, that is navigating systems able to esti-mate their own orientation autonomously and on-line, mightrely upon an internal direction representation. Extracellu-lar recordings from freely-moving rats show the presence ofhead-direction (HD) cells, limbic neurons whose firing activ-ity is correlated with the current direction of the head of theanimal (Taube, 1998). A HD cell � has a unique preferred di-rection
���for which it discharges maximally. The directional
coding of the HD cells is independent of the animal location,and provides, therefore, an allocentric directional representa-tion.
The properties of the HD cell system resemble those ofa compass, but the allocentric coding of HD cells does notdepend on geomagnetic fields. Rather, the preferred direc-tions are anchored to visual cues in the environment. For in-stance, rotating a dominant visual cue by an angle � � causesa shift � � of all the preferred directions of the HD cells(Taube, 1998, Zugaro et al., 2001). Besides the control of vi-sual cues upon HD cells, experiments show that inertial self-motion signals (e.g. vestibular) strongly influence the dynam-
ics of the HD cell system. For instance, when the environ-mental light is turned off, the directional coding is maintained(Taube, 1998). In addition, when the head of the animal ro-tates, vestibular signals (coding for the head angular velo-city � ) are integrated to update the HD representation overtime.
HD cells have been observed in several regions cen-tered on the brain limbic system, in particular the post-subiculum (PSC), the anterodorsal thalamic nucleus (ADN),and the lateral mammillary nucleus (LMN) (Taube, 1998).Inertial self-motion signals are likely to converge ontothe HD system via the dorsal tegmental nucleus (DTN)(Bassett and Taube, 2001) which projects inhibitory connec-tions directly to LMN. Visual inputs enter the HD systemvia the PSC which receives afferents from the visual cortex(Taube, 1998). Fig. 1 shows the anatomical interconnectionsbetween PSC, ADN, LMN and DTN.
Maintaining a sense of direction autonomously is crucialfor both biological and artificial systems involved in naviga-tion. For instance, path integration allows a navigating agentto infer its location and its heading relative to a departurepoint (Mittelstaedt and Mittelstaedt, 1980). This implies esti-mating the rotational as well as the translational componentsof motion continuously. In addition, lesions to the HD cellsystem disrupt the allocentric location representation of hip-pocampal place cells (Knierim et al., 1995), neurons whosefiring activity is correlated with the location of the animal.Consequently, the sense of direction is necessary for esta-blishing place cell representations.
This paper presents a neuro-mimetic model of the HD sys-tem and focuses on its robotic implementation. To reflect theproperties of the rat HD cell system, the model must providea stable and persistent HD representation robust to noise andmust permit the integration of an angular velocity signal.
The model is based upon a continuous attractor/integratorneural network modeling the DTN-LMN interaction. An at-tractor model of HD cells is a neural network in which unitsencoding neighboring directions are recursively connected bystrong excitatory synapses, whereas units having distant pre-

PostsubiculumAnterodorsal
thalamic nucleus
Lateral mammillary
nucleus
Dorsal tegmental nucleus
Head angular velocity
Visual information
Figure 1: Anatomical connections between the postsubiculum(PSC), the anterodorsal thalamic nucleus (ADN), the lateral mam-millary nucleus (LMN) and the dorsal tegmental nucleus (DTN).Arrows and circles indicate excitatory and inhibitory connections,respectively.
ferred directions strongly inhibit each other. The interactionbetween the excitation and the inhibition in the neural net-work determines the intrinsic dynamics of the attractor. Thisallows the system to reproduce properties exhibited by rat HDcells. For instance, the system is able to encode a stable HDrepresentation where a subpopulation of HD cells encodingsimilar directions are active while others remain silent. ThisHD representation can be updated by extrinsic input signals(e.g. vestibular angular velocity) utilized to shift the ensem-ble hill of activity of the HD cells over the directional space.
The integration of angular velocity realized by the model isnot perfect in a mathematical sense. Consequently, the modelneeds a calibration method to avoid a cumulative tracking er-ror. We simulate a vision-based calibration by generating anexternal stimulus applied to the HD cell system. Electrophys-iological studies by (Zugaro et al., 2003) have focused on thetemporal aspects of the preferred direction update in ADN.The quantitative results show a short update latency of ap-proximately ���� ����� . Our model uses spiking neuronsand allows us to study the temporal aspects of the attractorstate transitions. Particularly, the model reproduces the fastupdate transient exhibited by the rat HD cells observed by(Zugaro et al., 2003).
Several models of HD cells have been previously pro-posed (Skaggs et al., 1995, Zhang, 1996, Redish et al., 1996,Goodridge and Touretzky, 2000). These models, however,have not been tested by means of robotic implementations.The HD model by (Arleo and Gerstner, 2000) has been val-idated on a real robot but it uses rate coding computationalunits which make it impossible to study the dynamics of thesystem for short time windows. A robotic compass systemhas been proposed by (Gourichon et al., 2003). However, theauthors focus on static visual information only, and do not in-
InformationVisual
InformationVestibular
LMN
DTN
cw ccw
Figure 2: A view of the DTN-LMN interaction. An attractor net-work is formed by the excitatory connections from LMN to DTN(arrows) and the inhibitory connections from DTN to LMN (circles).Also, inhibitory connections within DTN are employed to integrateangular velocity signals.
tegrate angular velocity over time. The model presented hereis similar to our previous work (Degris et al., 2004) that putsforth an attractor neural network of spiking neurons to modelthe DTN-LMN circuit. In contrast to that model, the attractorsystem presented here does not employ recurrent excitatoryprojections within the LMN network, consistent with anatom-ical findings (Allen and Hopkins, 1989). Furthermore, ourprevious model has been validated by means of numericalsimulations only. Here we stress the importance of endowinga mobile robot with a HD system using spiking neurons, andwe cope with implementation constraints such as real timeperformance.
2. Methods
We model HD cells by means of a modular artificial neuralnetwork. Fig. 2 shows a view of the model. The architec-ture consists of an attractor-integrator network composed bya population LMN of ������ �� excitatory directional unitsand two populations DTN ��� and DTN ����� of ��� �"!�� in-hibitory directional units each. The HD units within each net-work have evenly distributed preferred directions.
The dynamics of the HD system is primarily controlled byidiothetic signals (i.e. self-motion inertial inputs) which de-termine the directional selectivity property of the formal HDcells. Allothetic information (e.g. visual input) can be usedto occasionally modify the system’s dynamics and calibratethe HD cell activity.
2.1 Robotic Platform
In order to validate the model experimentally, we have imple-mented it on a mobile Pekee1 robot (Fig. 3). The behavior ofthe robot is monitored by an infrared camera above the arenatracking two LEDs positioned on the robot. The relative po-sitions of the two LEDs are sampled at about #%$'& , which
1The Pekee robot is commercialized by Wany Robotics,http://www.wanyrobotics.com

Figure 3: The mobile Pekee robot with the MT9 device (the blackbox in front of the robot) for sensing inertial self-motion signals.
allows us to measure the actual orientation�)(+*-,
of the robotover time.
The robot’s sensory system consists of an odometer and aXsens MT92 device for sensing inertial self-motion signals.The MT9 device, composed of gyroscopes, accelerometersand magnetometers, provides a real time absolute orientationresulting of the fusion of the inputs of these sensors.
The low-level controller of the robot runs on the on-boardcomputer, whereas the HD model and the high-level con-troller run on a remote PC Pentium IV.
2.2 Attractor network
In order to generate and maintain a HD signal .� , we con-sider a continuous attractor network based on the intercon-nections between LMN and DTN (Blair et al., 1998). Fig. 4shows the connections between formal neurons in LMN andDTN. Note that, because there is no experimental evidencefor lateral connections in LMN (Allen and Hopkins, 1989),there is no recurrent excitation in the LMN of the model(Song and Wang, 2002).
LMN projects excitatory connections to DTN. The weight/10 � of these connections is such that a neuron �32 LMNwith a preferred direction
�4�projects to a cell 5 2 DTN with
a preferred direction� 0 according to a Gaussian weight dis-
tribution/ 0 � �7698;:=<> ?A@=BDCFE1G (H�I� G � 01J�KLJNM > ,POQ4R O> S (1)
where 6 8T:�<> �3#�UWV U is the maximum weight of excitatoryconnections and
R > �X#ZYZV Q�[ is the width of the Gaussianprofile. The values of these parameters have been determinedby means of a genetic algorithm (Sec. 2.6). The term M > is theangular offset of the intermodule connections with M > �\!4 [if 5 2 DTN ��� and M > � G !4 [ if 5 2 DTN ����� .
2The MT9 device is commercialized by Xsens Motion Technologies,http://www.xsens.com
LMN
DTN
Figure 4: The attractor network is based on excitatory connectionsfrom LMN to DTN (arrows) and inhibitory connections from DTNto LMN (circles).
Global inhibition, necessary to implement the center-surround attractor scheme, is provided by the connectionsfrom DTN to LMN. The weight / � 0 of these connectionsis distributed according to/ � 0 �]6 8T:�<^ ?�@=BDCFETG (+� 0 G � � ,-OQ4R O^ S (2)
where 6 8T:�<^ �_!4`aV ! is the maximum weight of inhibitoryconnections, and
R ^ �b AcZYDV U [ is the width of the Gaussianweight distribution (also these two parameters have been setby means of the genetic algorithm described in Sec. 2.6).
Because of the real-time constraint, only the connectionswith a weight /ed aVfY�!hgi6 8T:�< are actually implementedin the network. This avoids the propagation of spikes alongsynapses with small weight and drastically reduces the com-putational complexity of the model. The intrinsic dynam-ics of the DTN-LMN attractor network settles the systemdown to stable (self-sustained) attractor states, in whichsubpopulations of HD cells with similar preferred direc-tions are active while the others remain silent (Zhang, 1996,Blair et al., 1998).
2.3 Integrator
To integrate non-zero angular velocities (i.e. to shift thestable state over the continuous attractor space accordingto the angular velocity � ), an unbalanced cell activity be-tween DTN ��� and DTN ����� is generated. The neuronal re-sponses of the DTN ��� and DTN ����� cells are correlated withboth the head direction
�a(H*-,and the angular velocity � (+*-, .
In particular, the activity of directional cells in DTN ��� andDTN ����� is modulated proportionally to j � (H*-, j during clock-wise and counterclockwise turning, respectively. Neuronsencoding the animal’s head angular velocity have been ob-served in the parietal, somatosensory, and visual cortices(McNaughton et al., 1991, Blair and Sharp, 1995).
Fig. 5 shows the lateral connections between DTN ��� andDTN ����� . These connections are distributed such that a neu-ron k with a preferred direction
� ^ projects to a cell l with a

cwDTN
DTN ccw
LMN
Figure 5: The integrator is based on inhibitory lateral connections(circles) between DTN m�n and DTN mom�n .
preferred direction��p
according to/ p ^ �q698T:�<p ^ ?�@=BDC E G (H� ^ G �Ip JNM p ^ ,POQ�R Op ^ S (3)
where the maximum weight 6 8T:�<p ^ � Q !DV # and the widthR p ^ �rUs!DVt [ have been determined by the genetic algorithm(Sec. 2.6). The term M p ^ is the angular offset of the inter-module connections with M p ^ � G U� [ if k 2 DTN ��� andM p ^ �qU [ if k 2 DTN ����� . Only the connections with a weight/ p ^ d WV `�ugv6 8T:�<p ^ are actually implemented in the network.
During clockwise head turns, for instance, DTN ��� cellsinhibit the left side of the LMN hill of activity encodingthe current direction
�(i.e. introduce an asymmetry within
the recurrent coupling between LMN and DTN). The lateralshifted connections between DTN ��� and DTN ����� reinforcethe asymmetry in DTN. During clockwise head turns, DTN ���cells inhibit the left side of the DTN ����� hill. Thus, the inhi-bition on the right side of the LMN hill is decreased whenthe inhibition by cells in DTN ��� on the left side is increased.This yields a clockwise shift � � of the LMN activity profile.The speed of this shift is proportional to j �ij .2.4 Interpreting the directional output
At each time*, the ensemble activity of a population of neu-
rons provides the estimate .�a(+*-, of the allocentric heading�a(+*-,
of the robot. In order to compute .�)(+*-, , we apply a populationvector scheme (Georgopoulos et al., 1986) to decode the en-semble HD cell activity:�a(H*-, �qw�xzy={zw�|'}T~]�� ��k � (+���D, M (H* G *P�W,~q����=� � (+� � , M (H* G * � ,�� (4)
where M (H* G * ^ , is a Dirac function equal to if the neuron �fires at time
*, otherwise.
2.5 Neuron and synapse model
Both excitatory and inhibitory formal units are leakyintegrate-and-fire neurons. Let � p � G Y��� � , �a���G !4���� , and �)��� G !�!���� denote the resting membrane
0 90 180 270 3600
5
10
15
20
25
30
35
40
Direction (degrees)
Mea
n fir
ing
rate
(spi
ke/s
)
θn
fn ..Fn
Figure 6: Evaluation of a set of parameters at time � . For each neuron� , the desired Gaussian profile ��� (dashed line) is compared to thegenerated Gaussian profile �A� (solid line).
potential, the firing threshold, and the reset potential of a for-mal neuron, respectively. Let � (H*-, be the total synaptic drivereceived by a cell from the afferent units. The dynamics ofthe membrane potential � (H*-, is given by� ?)� � (H*-,� * � G;��? ( � (+*-, G � po, J � (+*-, J �A� (+*-, (5)
where�
and � are, respectively, the membrane capacitanceand leak conductance ( ��� ��� � is the membrane time con-stant) with
� ��WVf!7��� for an excitatory cell and� �WV Q ��� for an inhibitory cell; � 8 � Q ! �v� for an excitatory
cell and � 8 � Q �v� for an inhibitory cell. The refractoryperiod is
Q ��� and �� � for an excitatory neuron and aninhibitory neuron, respectively.� � (H*-, is the background input activity of a neuron and isdefined as �A� (H*-, �¡ � �¢A£ ¤ ?A¥ (H*-, (6)
where � � ¢�£ ¤ is a random number uniformly drawn from¦ W§A A¨ . The factor ¥ (+*-, is constant for excitatory neurons andequal to Q � . For inhibitory neurons¥ (+*-, � ¥ ^ J ¥%©L? � (+*-, (7)
where ¥ ^ �� �� , ¥%© �]WV c�c , and � (+*-, is the angular velocityat time
*. The value of ¥F© has been determined by the genetic
algorithm described in Sec. 2.6.The synaptic input to a neuron � is taken as� (+*-, �qª ? � (+*-, (8)
where ª«�¬aV a is a constant factor and � (+*-, is a gatingvariable whose dynamics is given by
� (H* J � *-, � ( G ª , ? � (H*-, J �0�® ¢ M (+* G * 0 , ? / � 0 J'� ( � , (9)
where � * �¯ ;��� is the time step, ~ � 0�® ¢ M (+* G * 0 , ? / � 0 is aweighted sum over the spikes emitted by the presynaptic neu-rons 5 and / � 0 is the strength of the connection from a presy-naptic unit 5 to the postsynaptic neuron � , with / � 0Ld for
0
0.5
1
1.5
2
2.5
3
3.5
0 10 20 30 40 50 60 70 80 90
Fitn
ess
Generations
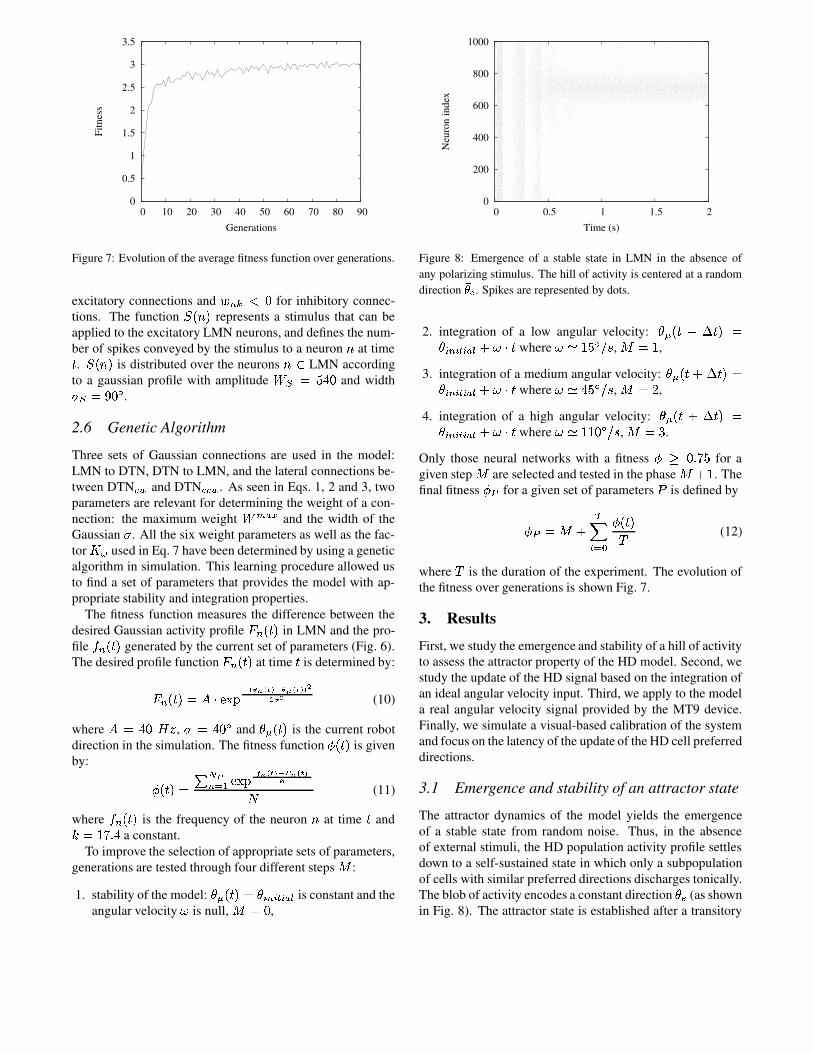
Figure 7: Evolution of the average fitness function over generations.
excitatory connections and / � 0±° for inhibitory connec-tions. The function � ( � , represents a stimulus that can beapplied to the excitatory LMN neurons, and defines the num-ber of spikes conveyed by the stimulus to a neuron � at time*. � ( � , is distributed over the neurons �q2 LMN according
to a gaussian profile with amplitude 6³²9�´!4c and widthR ²µ�¶` [ .2.6 Genetic Algorithm
Three sets of Gaussian connections are used in the model:LMN to DTN, DTN to LMN, and the lateral connections be-tween DTN ��� and DTN ����� . As seen in Eqs. 1, 2 and 3, twoparameters are relevant for determining the weight of a con-nection: the maximum weight 6 8T:�< and the width of theGaussian
R. All the six weight parameters as well as the fac-
tor ¥ © used in Eq. 7 have been determined by using a geneticalgorithm in simulation. This learning procedure allowed usto find a set of parameters that provides the model with ap-propriate stability and integration properties.
The fitness function measures the difference between thedesired Gaussian activity profile � ��(H*-, in LMN and the pro-file · ��(+*-, generated by the current set of parameters (Fig. 6).The desired profile function � � (+*-, at time
*is determined by:
� � (H*-, �]¸ ?A@=BDCT¹sº¼»H½sºf¾À¿À¹»ÂÁºf¾À¿¼¿¼ÃÃoÄ Ã (10)
where ¸Å�rc $'& , R �Æcs [ and��ÇÈ(+*-,
is the current robotdirection in the simulation. The fitness function É (H*-, is givenby: É (H*-, � ~ �ËÊ� ® ¤ @ABDC1Ì Í ½ºÎ¾t¿Ï¹Ð�½sºÎ¾t¿ ÌÑ� (11)
where · � (H*-, is the frequency of the neuron � at time*
and5%�¯ �YZV c a constant.To improve the selection of appropriate sets of parameters,
generations are tested through four different steps Ò :
1. stability of the model:�4ÇÈ(H*-, � � ^ � ^ � ^ : p is constant and the
angular velocity � is null, ÒÓ�] ,
0
200
400
600
800
1000
0 0.5 1 1.5 2
Neu
ron
inde
x
Time (s)
Figure 8: Emergence of a stable state in LMN in the absence ofany polarizing stimulus. The hill of activity is centered at a randomdirection ÔÕ=Ö . Spikes are represented by dots.
2. integration of a low angular velocity:� Ç (+* J � *-, �� ^ � ^ � ^ : p J � ? * where �±×9 �! [ � � , ÒØ�¯ ,
3. integration of a medium angular velocity:� Ç (+* J � *-, �� ^ � ^ � ^ : p J � ? * where �±×¡cs! [ � � , ÒØ� Q ,
4. integration of a high angular velocity:� Ç (H* J � *-, �� ^ � ^ � ^ : p J � ? * where �±×9 � � [ � � , ÒØ�¶U .
Only those neural networks with a fitness É"ÙÚWVÎY4! for agiven step Ò are selected and tested in the phase Ò J . Thefinal fitness ÉÜÛ for a given set of parameters Ý is defined by
ÉÜÛN�]Ò JßÞ � ® ¢ É(+*-,à (12)
whereà
is the duration of the experiment. The evolution ofthe fitness over generations is shown Fig. 7.
3. Results
First, we study the emergence and stability of a hill of activityto assess the attractor property of the HD model. Second, westudy the update of the HD signal based on the integration ofan ideal angular velocity input. Third, we apply to the modela real angular velocity signal provided by the MT9 device.Finally, we simulate a visual-based calibration of the systemand focus on the latency of the update of the HD cell preferreddirections.
3.1 Emergence and stability of an attractor state
The attractor dynamics of the model yields the emergenceof a stable state from random noise. Thus, in the absenceof external stimuli, the HD population activity profile settlesdown to a self-sustained state in which only a subpopulationof cells with similar preferred directions discharges tonically.The blob of activity encodes a constant direction .� > (as shownin Fig. 8). The attractor state is established after a transitory

(a)
0
100
200
300
400
500
600
700
800
900
1000
0 10 20 30 40 50 60
Neu
ron
inde
x
Time (s)
(b)
0
50
100
150
200
250
300
350
0 10 20 30 40 50 60
Dir
ectio
n (d
egre
es)
Time (s)
Figure 9: (a) Rastergram of the activity of the HD cells in LMN overá�âLã. A polarizing external stimulus (applied at
Õ�ä�å9æ âIçduring
the first è â'é%ã ) generates a stable attractor state. After stimulusremoval ( �ëê_è â�é�ã ) the self-sustained state persists over time.(b) Stability of the HD representation over time. The dashed linerepresents the initial direction
Õ äset by the stimulus during the firstè â;é�ã . The continuous line is the direction computed by population
vector coding (Eq. 4).
period (of approximately Y����� ) characterized by an oscil-latory activity pattern. The relative weight between inhibitionand excitation determines the equilibrium reached after thetransient period.
The model can also be initialized to a specific direction�ì
by applying an external stimulus � to LMN. The rastergramin Fig. 9 (a) shows the spike activity of the � � cells in LMNwhen a polarizing input centered at
� ² �í` [ is applied dur-ing the first �³� � . After stimulus removal (
* d �³��� ),the attractor state persists over the time. This corresponds tothe situation in which the head of the animal is immobile (thehead angular velocity � is zero) and oriented in a given direc-tion
� ² . The mean peak spike frequency and the width of thehill of activity, averaged over
à �]#�h� , are about Uî$'& andQ [ , respectively.The center of mass of the ensemble firing pattern, com-
puted according to Eq. 4 and averaging overà �´#�N� , is
0
50
100
0 10 20 30 40 50 60 70 80
Err
or (d
egre
es)
Time (s)
0
50
100
150
200
250
300
350
Dir
ectio
n (d
egre
es)
Figure 10: Integration of ideal angular velocities by the model. Top:a velocity ïñð å è=ò ç=ó ã is applied for è â�ã�ô � ô¶õAâ�ã ; a velocityïvö å¶÷ ò çAó ã is applied for ø â�ã�ô � ô ÷ â�ã ; and a velocity ï�ù åè�è â çAó ã is applied for ò â�ãiô � ôNá�â�ã . The dashed line representsthe ideal integration of these angular velocities. The continuous linerepresents the direction signal of the HD cells of the model. Bottom:the integration error of the HD system over time.
about .� �Ó��# [ . Fig. 9 (b) shows the stability of the di-rectional representation over #�r� . The mean error úû�~ �ýüü .�)(+*-, G � ² üü � à is about ` [ .3.2 Integration
When the head of the rat rotates (i.e. ��þ�e ), the HD cellsystem integrates the angular velocity in order to update theHD representation over time.
We first investigate the integration done by the model inthe case of three ideal angular velocity signals, � ¤ �ÿ �! [ � � ,� O �ûcs! [ � � and ���%�Å � � [ � � . Each angular velocity inputis applied during a ��� period. Fig. 10 shows the response ofthe HD cell system to these three velocity profiles as well asthe integration error over time. The average error of the es-timation of the direction by the model is about Q [ . Qualita-tively, the diagram shows that the larger the angular velocity,the larger the error.
The above simulation does not reflect the noise present inreal experimental conditions. For instance, when sending amotor command to the robot, the motion generated by the ac-tuators is noisy. Fig. 11 compares an ideal angular velocityprofile (motor command) to the real angular velocity of therobot. The robot is asked to turn on the spot at different ran-dom speeds for different random time periods. The angularvelocity of the robot is computed from the absolute directiongiven by the video tracking system. The comparison shows

−200
−150
−100
−50
0
50
100
150
0 20 40 60 80 100
Ang
ular
vel
ocity
(deg
rees
/s)
Time (s)
Figure 11: Example of noisy angular velocity profile. The dashedline represents the command sent to the robot. The continuous lineindicates the angular velocity computed by the tracking system.
that, given a constant angular velocity command, the real an-gular velocity of the robot is unstable.
Since the navigating robot has to be able to estimate itscurrent heading autonomously, it must integrate the angularvelocity signals coming from of one of the on-board sensorysystems. The robot is equipped with odometers measuringlocomotor signals and accelerometers (the MT9 device) pro-viding inertial signals.
Fig. 12 compares the real direction of the robot (providedby the video tracking system) and the directions computedby the MT9 device and by the odometers. The experimen-tal protocol is the same as the one used previously. Letú7� ~ � j ���o(H*-, G �a(+*-, j � à denote the mean error, averagedover
à �Æ ���� , between the estimation���Â(H*-,
and the actualdirection
�a(H*-,of the robot. We average ú over 26 trials and
find an error of ú�� Þ � �ÿ#4c [ for the directional signal fromthe MT9 device and an error of ú����T�7YD [ for the odometers.
Note that, given the experimental protocol (a robot rotatingon the spot), non-systematic errors, like wheel slippage or ir-regularities on rough surface, are unlikely to occur. Despitethe small difference between ú�� Þ � and ú�� �� , the angular ve-locity input provided by the MT9 device is more reliable thanthe signal from the odometers. For instance, if the robot waspulled up and displaced passively by the experimenter, theodometry would be seriously impaired whereas the MT9 de-vice would be able to sense the movement. Therefore, wedecided to use the MT9 device signal as input for our HDmodel.
At time* �e , the HD system is initialized with respect
to an absolute direction�� Þ � . As the robot starts rotating,
the signals from the MT9 device are integrated by the modelwhich starts shifting its internal representation to track theangular displacements of the robot. Fig. 13 shows an exampleof the update of the HD signal .�a(+*-, encoding the current robotheading
�)(+*-,as well as the tracking error over time. The mean
error of the model, overQ # trials of
à �" �F� each, is U�U [relative to the input of the MT9 device and about Y4U [ relative
(a)
0
50
100
150
200
250
300
350
0 20 40 60 80 100
Dir
ectio
n (d
egre
es)
Time (s)
(b)
0
50
100
150
200
250
300
350
0 20 40 60 80 100D
irec
tion
(deg
rees
)Time (s)
Figure 12: Tracking of the robot actual direction (represented bythe dashed line) by the MT9 device (a) and by the integration of theinput from the odometers (b).
to the output of the video tracking system.As shown in Fig. 13, the integration realized by the model
is not perfect in a mathematical sense. Thus, the systemneeds to be calibrated to avoid cumulative errors over time.In this paper, we do not describe any calibration mechanism(Arleo and Gerstner, 2000). Rather, we focus on the temporalaspects of the update of the preferred directions of HD cellsby a reorienting visual stimulus.
3.3 Short update latencies following reorientingstimuli
Electrophysiological findings suggest that HD cells are con-trolled by salient visual cues (Taube, 1998). Recently,(Zugaro et al., 2003) have measured the time necessary to up-date the preferred directions of rat HD cells by a reorientingvisual landmark. The experimental setup consisted of a blackcylinder with a white card attached to the inner wall used asa visual cue. The preferred directions of the HD cells werefirst measured in light conditions. Then, in the dark, the cuecard was rotated by ` [ . When, the light was turned back onthe HD cells updated their preferred directions to reflect the

0
50
100
0 20 40 60 80 100
Err
or (d
egre
es)
Time (s)
0
50
100
150
200
250
300
350
Dir
ectio
n (d
egre
es)
Figure 13: Update of the HD directional coding by the model (con-tinuous line) by integrating the signal provided by the MT9 device(dashed line). The error of integration of the model compared to thedirection given by MT9 is shown in the diagram below.
new visual configuration. A mean latency of �� �N �i��� wasobserved for the establishment of a new blob following the re-orientation event. On the other hand, Acs � ��� � were nec-essary for the extinction of the hill of activity existing priorthe reorientation event.
To reproduce these results, the model is first initializedwith an external stimulus � centered at a specific direction� ² ��`� [ . Second, at time
* ²�� ��!�� , a reorienting stim-ulus � � is applied at
� ²���� Q Y4 [ (simulating the transitionfrom dark to light conditions). Fig. 14 shows the response ofthe system to the reorienting visual stimulus which triggersa �� [ update of all preferred directions. The HD systemis reoriented according to the directional reference frame an-chored to � � . As a consequence, the attractor network settlesto a new stable state abruptly.
The resulting update latency for the establishment of thenew blob of activity is about U³� � , whereas the transientdelay for the extinction of the previous attractor state is about � ��� � . The attractor dynamics is such that inhibition occursafter the increase in the overall activity of the network. Thiscauses a longer update time for the extinction of the previ-ous hill of activity. These results are consistent with thosereported by (Zugaro et al., 2003). Note that in the modelthe transmission delay necessary for the visual signals toreach HD cells is not taken into account. There are no ex-perimental data reporting this transmission delay. However,(Galambos et al., 2000) show that a visual stimulus takes al-ready about U����� to go from the retina to the primary visualcortex.
0
50
100
150
200
250
300
350
3 3.5 4 4.5 5 5.5 6 6.5 7
Dir
ectio
n (d
egre
es)
Time (s)
Figure 14: Raster plot showing the response of the HD system to aè�� â ç reorienting visual stimulus applied at time � ä � å ò ã . A newblob of activity is established at
Õ ä � å õ���â ç whereas the previoushill of activity is extinguished.
4. Discussion
The main goal of this work was to endow a robot with an allo-centric direction representation. We adopted a neuro-mimeticapproach inspired by the properties of head direction (HD)cells, neurons observed in the rat’s limbic system.
In order to obtain a stable and persistent HD signal, themodel relies on an attractor neural network modeling the neu-ral circuit formed by the lateral mammillary nucleus (LMN)and the dorsal tegmental nucleus (DTN). These two anatomi-cal structures are relevant for generating and maintaining theinternal direction representation of rat HD cells. The modelreproduces the anatomical interconnectivity between LMNand DTN. The attractor network has no lateral excitatory con-nections to reflect the absence of experimental evidence forrecurrent excitation in the DTN-LMN circuit. Similar to therat HD cell system, the model can integrate angular velocitysignals to update the direction representation over time. Lat-eral inhibitory connections in the formal DTN are used forthis purpose.
In contrast to earlier HD models, we employ spiking neu-rons to focus on the temporal aspects of the dynamics ofthe attractor network. For instance, electrophysiological datasuggest a very rapid reorientation of the HD representationfollowing changes in the visual scene. The model is able toreproduce these short update latencies.
We stress the importance of validating the model in realexperimental conditions in order to make it useful for au-tonomous navigating systems. We assess the ability of themodel to integrate an angular velocity signal � (+*-, in real-time. We employ an inertial sensor to estimate the angulardisplacements of the robot. The integration of � (+*-, is affectedby a drift of the internal direction representation over time.Therefore, a calibration mechanism, based for instance on vi-sion, will be further developed. Experimental findings showthat visual information is conveyed to the HD system via the

postsubiculum (PSC). The model may be extended by addinga PSC module performing the vision-based calibration.
The HD model presented here provides a subcomponentfor a larger autonomous navigating system. This work is partof Psikharpax, a project that aims at developing a bio-mimeticnavigation and action selection model embedded on a realrobot.
Acknowledgments
This work was supported by the ROBEA program of theCNRS and by the ACI Neuroscience du Ministere de laRecherche. The authors thank S. Gourichon, S. I. Wiener,N. Brunel, O. Sigaud and J. A. Meyer for useful discussions.
References
Allen, G. V. and Hopkins, D. A. (1989). Mamillary bodyin the rat: topography and synaptology of projectionsfrom the subicular complex, prefrontal cortex, and mid-brain tegmentum. Journal of Comparative Neurology,286:311–336.
Arleo, A. and Gerstner, W. (2000). Modeling rodent head-direction cells and place cells for spatial learning in bio-mimetic robotics. In Meyer, J.-A., Berthoz, A., Flore-ano, D., Roitblat, H., and Wilson, S. W., (Eds.), FromAnimals to Animats VI, pages 236–245, Cambridge MA.MIT Press.
Bassett, J. P. and Taube, J. S. (2001). Neural correlates forangular head velocity in the rat dorsal tegmental nucleus.The Journal of Neuroscience, 21(15):5740–5751.
Blair, H. T., Cho, J., and Sharp, P. E. (1998). Role of thelateral mammillary nucleus in the rat head direction cir-cuit: A combined single unit recording and lesion study.Neuron, 21:1387–1397.
Blair, H. T. and Sharp, P. E. (1995). Anticipatory head direc-tion signals in anterior thalamus: Evidence for a thala-mocortical circuit that integrates angular head motion tocompute head direction. The Journal of Neuroscience,15(9):6260–6270.
Degris, T., Brunel, N., Sigaud, O., and Arleo, A. (2004).Rapid response of head direction cells to reorienting vi-sual cues: A computational model. Neurocomputing (inpress).
Galambos, R., Szabo-Salfay, O., s, P. B., Palhalmi, J., Szi-lagyi, N., and Juhasz, G. (2000). Temporal distributionof the ganglion cell volleys in the normal rat optic nerve.Proceedings of the National Academy of Sciences USA,97(24):13454–13459.
Georgopoulos, A. P., Schwartz, A., and Kettner, R. E.(1986). Neuronal population coding of movement di-rection. Science, 233:1416–1419.
Goodridge, J. P. and Touretzky, D. S. (2000). Modeling at-tractor deformation in the rodent head-direction system.Journal of Neurophysiology, 83(6):3402–3410.
Gourichon, S., Meyer, J.-A., Ieng, S., Smadja, L., andBenosman, R. (2003). Estimating ego-motion using apanoramic sensor: Comparison between a bio-inspiredand a camera-calibrated method. In Holstein, H. andLabrosse, F., (Eds.), AISB03 Symposium on BiologicallyInspired Vision, Theory and Application, pages 91–101.
Knierim, J. J., Kudrimoti, H. S., and McNaughton, B. L.(1995). Place cells, head direction cells, and the learn-ing of landmark stability. The Journal of Neuroscience,15:1648–1659.
McNaughton, B. L., Chen, L. L., and Markus, E. J. (1991).Dead reckoning, landmark learning, and the sense ofdirection: A neurophysiological and computational hy-pothesis. Journal of Cognitive Neuroscience, 3:190.
Mittelstaedt, M. L. and Mittelstaedt, H. (1980). Homingby path integration in a mammal. Naturwissenschaften,67:566–567.
Redish, A. D., Elga, A. N., and Touretzky, D. S. (1996).A coupled attractor model of the rodent head directionsystem. Network, 7(4):671–685.
Skaggs, W. E., Knierim, J. J., Kudrimoti, H. S., and Mc-Naughton, B. L. (1995). A model of the neural basis ofthe rat’s sense of direction. In Tesauro, G., Touretzky,D. S., and Leen, T. K., (Eds.), Advances in Neural In-formation Processing Systems 7, pages 173–180, Cam-bridge, MA. MIT Press.
Song, P. and Wang, X.-J. (2002). An attractor networkmodel without recurrent synaptic excitation for head di-rection neurons in rodents. Society for Neuroscience Ab-stracts, page 584.8.
Taube, J. S. (1998). Head direction cells and the neurophys-iological basis for a sense of direction. Progress in Neu-robiology, 55:225–256.
Zhang, K. (1996). Representation of spatial orientation bythe intrinsic dynamics of the head-direction cell ensem-ble: A theory. The Journal of Neuroscience, 16(6):2112–2126.
Zugaro, M. B., Arleo, A., Berthoz, A., and Wiener, S. I.(2003). Rapid spatial reorientation and head directioncells. The Journal of Neuroscience, 23(8):3478–3482.
Zugaro, M. B., Berthoz, A., and Wiener, S. I. (2001). Back-ground, but not foreground, spatial cues are taken as ref-erences for head direction responses by rat anterodor-sal thalamus neurons. The Journal of Neuroscience,21(RC154):1–5.