Embed Size (px)
Citation preview


A Spatial, Temporal, and Geographic Analysis of the Increasing Incidence of Dengue
Fever in Kenya and Africa
A Dissertation submitted in partial fulfillment of the requirements for the degree of
Doctor of Philosophy at George Mason University
By
David Frost Attaway
Master of Geographic Information Science
University of Texas at Dallas, 2009
Honors Bachelor of Arts
University of Texas at Dallas, 2007
Director: Nigel M. Waters, Professor
Department of Geography and Geoinformation Science
Spring Semester 2014
George Mason University
Fairfax, VA

0
This work is licensed under a creative commons
attribution-noderivs 3.0 unported license.

1
DEDICATION
This is dedicated to my loving wife Melinda, my wonderful mom DeLana whose life was
a reflection of diligence and strength, my dad Dick who gave me motivation to continue
with my studies, my brother Dustin, and the Crume and Wilson Family who gave me
support through this endeavor.

2
ACKNOWLEDGEMENTS
I would like to thank Dr. Nigel Waters, Department of Geography and Geoinformation
Science, George Mason University, for his mentoring, coaching, and dedication
throughout this research. You have encouraged me to seek out research that is not only
interesting and challenging, but research that will also have an impact on others. You
have pushed me to be a better student and man. It has been a true pleasure to have
worked with you and I am forever grateful to you.
I would also like to express my gratitude to the members of my committee: Dr. Kathryn
H. Jacobsen, Dr. Allan Falconer, and Dr. Germana Manca. You have provided the
guidance that has inspired me to write as a scholar, dig deeper into the literature and to
explore new methods and tools to improve my research skills. You have helped further
my knowledge of Geospatial Information Science, medical geography, and provided
many hours of assistance with completing this dissertation.
I would like to thank the many friends, relatives, and supporters who have made this
happen. My loving wife, Melinda, provided the role of Editor in Chief. My friends who
motivated me with completing my work. My families consisting of the Attaway, Wilson,
and Crume clan. Finally, thanks go out to my mom who after fighting a battle with brain
cancer provided the inspiration to hope in Heaven for the things of this earth shall pass.

3
TABLE OF CONTENTS
Page
List of Tables ...................................................................................................................... 5
List of Figures ..................................................................................................................... 6
List of Equations ................................................................................................................. 7
List of Abbreviations .......................................................................................................... 8
Abstract ............................................................................................................................... 9
Chapter One: Motivation and Problem statement ............................................................. 11
Motivation ..................................................................................................................... 11
Problem Statement ........................................................................................................ 11
Dengue Fever ................................................................................................................ 13
Dengue Cycle ................................................................................................................ 14
Environments around the globe that are reservoirs for dengue fever ........................... 15
Dissertation Organization .............................................................................................. 17
References ......................................................................................................................... 19
Chapter Two : Dengue Mapping limitations .................................................................... 20
Introduction ................................................................................................................... 22
Methods ......................................................................................................................... 22
Results ........................................................................................................................... 26
Discussion ..................................................................................................................... 35
Conclusion ..................................................................................................................... 37
References ......................................................................................................................... 39
Chapter Three: Similarity Search...................................................................................... 45
Introduction ................................................................................................................... 47
Materials and Methods .................................................................................................. 50
Results ........................................................................................................................... 60
Discussion ..................................................................................................................... 63
References ......................................................................................................................... 67

4
Chapter Four : Susceptibility Analysis ............................................................................. 72
Introduction ................................................................................................................... 73
Data Sources .................................................................................................................. 75
Analysis ......................................................................................................................... 78
Results ........................................................................................................................... 84
Discussion ..................................................................................................................... 90
References ......................................................................................................................... 92
Chapter 5: Discussion ....................................................................................................... 96
References ....................................................................................................................... 101
Chapter 6: Future Analysis ............................................................................................. 102
References ....................................................................................................................... 106
Biography ........................................................................................................................ 107

5
LIST OF TABLES
Table Page
Table 1 - Summary of the 19 eligible dengue mapping articles ....................................... 23 Table 2 - Key for Table 1 .................................................................................................. 24
Table 3 - SWOT analysis for improved dengue mapping. ............................................... 37
Table 4 - Seroprevalence and dengue outbreak reports from Kenya, 1982-2013. ........... 48
Table 5 - Definitions of the 19 bioclimatic variables. ...................................................... 53 Table 6 - Calculated results from the composite for matching all features when
performing Similarity Search (287 cells). ......................................................................... 56 Table 7 - Peer reviewed literature documenting environmental constraints for dengue. . 74
Table 8 - Layers included in the model. ........................................................................... 76 Table 9 - Proportion of the 360 cases captured by various layers in the GIS. .................. 82

6
LIST OF FIGURES
Figure Page
Figure 1 - Cyclical cycle of dengue transmission (WHO 2012). ...................................... 14 Figure 2 - Summary of dengue mapping limitations. ....................................................... 25
Figure 3 - Map of seroprevalence and dengue outbreak reports from Kenya, 1982-2013.
........................................................................................................................................... 49
Figure 4 - Visual results of the composite for matching all features when performing
Similarity Search (287 cells). ............................................................................................ 57 Figure 5 - Sample of processing completed to determine Similarity Search between two
points (PT1 and PT2) compared to the composite for matching all features (MPX). ...... 58
Figure 6 - Graphic view of systematic cycle completed using Similarity Search. ........... 59 Figure 7 - Risk map created using the averages of all 287 reference points comparing
bioclimatic variables, population density, and elevation. ................................................. 61 Figure 8 - Risk map created using individual iterations of all 287 reference points
comparing bioclimatic variables, population density, and elevation. ............................... 62
Figure 9 - Susceptibility models run for various univariate variables. ............................. 80 Figure 10 - Susceptibility models run for various bivariate variables. ............................. 81
Figure 11 - Africa PAT Analysis. ..................................................................................... 87
Figure 12 - Comparison of two PAT models run for dengue susceptibility in Africa. ..... 88

7
LIST OF EQUATIONS
Equation Page
Equation 1 - Z-Transformation Equation (Esri 2013b). .................................................... 54 Equation 2 - Similarity Search .......................................................................................... 55
Equation 3 - Query Expression Editor Equation............................................................... 79
Equation 4 - Query Factor Input Table (QFit) Equation: ................................................. 83

8
LIST OF ABBREVIATIONS
ArcGIS Predictive Analysis Toolset .............................................................................. PAT
Center for Disease Control............................................................................................ CDC
Dengue 1 ................................................................................................................. DENV-1
Dengue 2 ................................................................................................................. DENV-2
Dengue 3 ................................................................................................................. DENV-3
Dengue 4 ................................................................................................................. DENV-4
Dengue fever .................................................................................................................... DF
Dengue hemorrhagic fever .............................................................................................DHF
Dengue shock syndrome ................................................................................................ DSS
Department of Defense .................................................................................................. DoD
Digital Elevation Model ............................................................................................... DEM
Division of Disease Surveillance and Response ......................................................... DDSR
Electronic medical records .......................................................................................... EMRs
Enzyme-linked immunosorbent assay ....................................................................... ELISA
European Space Agency ................................................................................................ ESA
Geographic Information Science/System ....................................................................... GIS
Geographical user interface ........................................................................................... GUI
Global Administrative Areas database ...................................................................... GADM
Global Land Cover .........................................................................................................GLC
Health information systems ............................................................................................ HIS
Immunoglobulin M ......................................................................................................... IgM
Kenya Medical Research Institute ............................................................................ KEMRI
Kenya Ministry of Health ............................................................................................ MOH
Kenyan Field and Laboratory training Program ........................................................ FELTP
Low and middle income countries ............................................................................. LMICs
Medium resolution imaging spectrometer full resolution ................................... MERIS FR
Normalized Difference Vegetation Index ....................................................................NDVI
Normalized Difference Water Index ........................................................................... NDWI
Oak Ridge National Laboratory .................................................................................. ORNL
Quality Control ................................................................................................................ QC
Query Factor Input Table ............................................................................................... QFit
Strengths, Weaknesses, Opportunities, and Threats .................................................. SWOT
United Nations’ Food and Agriculture Organization.....................................................FAO
Université Catholique de Louvain .................................................................................UCL
World Health Organization Library Database ....................................................... WHOLIS
World Health Organization .......................................................................................... WHO

9
ABSTRACT
A SPATIAL, TEMPORAL, AND GEOGRAPHIC ANALYSIS OF THE INCREASING
INCIDENCE OF DENGUE FEVER IN KENYA AND AFRICA
David Frost Attaway, Ph.D.
George Mason University, 2014
Dissertation Director: Dr. Nigel M. Waters
While many studies have focused on the causes of dengue fever and the
occurrence of specific outbreaks, little research has focused on the increasing spatial
range, increasing incidence of infected individuals, and the use of algorithms/models to
increase risk mapping in Kenya and Africa. GIS incorporates methods to evaluate results,
identify geographic locations, and incorporate risk when dengue occurrence data are
limited. This dissertation first outlines the limitations to dengue mapping then examines
the strengths, weaknesses, opportunities, and threats (SWOT) to determine the limitations
for mapping. Next, a similarity search approach was used to map dengue risk in Kenya.
This method estimated the high and low risk areas for dengue by evaluating the similarity
between environmental layers, population density, and elevation with respect to dengue
and mosquito occurrence points. This analysis identified the most cost-effective locations
to target dengue prevention activities such as vector control and public awareness
campaigns. Finally, a PAT approach was used to map dengue susceptibility across the

10
African continent using the Query Expression Editor and QFit tools. High susceptible
risk areas were estimated by comparing peer reviewed literature, determining
susceptibility for risk, and then improving the visualization through mapping. The Query
Expression Editor evaluated dengue susceptibility risk based on environmental high risk
parameters. The QFit tool provided a methodology to estimate high susceptibility risk
between points of occurrence and a set of raster datasets. This dissertation contributes to
improving risk analysis and susceptibility risk for disease through the localized
visualization of risk and situational awareness between health officials, geographers,
epidemiologists, and entomologists.

11
CHAPTER ONE: MOTIVATION AND PROBLEM STATEMENT
Motivation
GIS provides the necessary tools to disseminate information through mapping, by
identifying similarity between geographic risk locations for disease and susceptibility risk
where dengue occurrence data is limited. This dissertation uses two methods to expand
risk and susceptibility risk mapping in Kenya and Africa. Estimating dengue risk is
dependent on utilizing localized data to conduct the study. We used a localized mapping
method to increase the effectiveness and improve dengue disease mapping that has
previously been completed at a higher resolution. Our methods not only improved the
mapping for dengue, but also allowed us to utilize this method for other diseases.
Problem Statement
With dengue being primarily an equatorial disease focused in many parts of the
tropics and subtropics, the focus on Kenya and Africa will allow for diverse weather
conditions to affect models using GIS. GIS provides a platform for visualizing results,
identifying risk locations, and utilizing geospatial data to evaluate locations and
parameters for disease. Kenya and many areas in Africa are affected by the annual cycle
for dengue, which usually occurs during the season when Aedes mosquito populations are
high and when rainfall is optimal for breeding. Modeling risk and susceptibility risk
would provide additional benefits for risk assessment of dengue, when large numbers of

12
people become infected during a short period. Environmental, population density, and
elevation data provide the variables added to a susceptibility risk model or similarity risk
model. Dengue epidemics require a co-incidence of large numbers of vector mosquitoes,
large numbers of people with no immunity to one of the four virus types, and the
opportunity for contact between the vector and host (mosquito and human, respectively).
The risk of dengue both spatially (range) and temporal frequency – time of year – are two
key aspects that can advance the models accuracy and analysis capabilities. Research
suggests that dengue risk is highest in geographic locations between August through
December, with the highest incidence of infection during the months of September and
October (Reiter, 2001). The ability to formulate the spatial range of incidence will allow
for the analysis of isolated events or patterns of multiple outbreaks to determine factors
affecting the range of the disease. With increased urbanization, incidence, and
susceptibility risk a model that incorporates algorithmic procedures for the range of
disease will be essential. In contacting Dr. Rosemary C. Sang (2012), she stated that:
“Your planned study would be interesting and informative as we still
do not have a clear picture about how dengue is moving in East Africa.
Unfortunately, we do not have any focused systematic collation of data on
dengue cases in Kenya. Apart from the outbreaks of the 1979/1980s the
records on dengue incidence are poorly kept”.
The objective of this paper will be to use Similarity Search modeling in conjunction with
the ArcGIS Predictive Analysis Tools (PAT) to analyze the ability to improve risk
modeling of the similarity and susceptibility of individuals in contracting dengue based
on various peer reviewed high risk parameter variables (Esri 2013, Esri 2014).

13
Dengue Fever
Dengue Fever (DF) is a virus that occurs in at least 100 countries in Asia, Africa,
the Pacific, the Americas, and the Caribbean. Areas such as Thailand, Vietnam,
Singapore, Brazil, and Malaysia have all reported an increase in cases over the last few
years (WHO 2012).Dengue is not a virus that is transmitted directly from human to
human, but passes through insects that transmit the disease as vectors. DF infects
mosquitos (Aedes aegypti and Aedes albopictus) with the dengue virus when mosquitos
receive blood meals from humans infected with dengue. Humans can subsequently
become infected by being bitten by a mosquito infected with the dengue virus. It may
only take one blood meal for the virus to be transmitted to other individuals
(Amarasinghe et al. 2011). Symptoms of infection usually begin 4 to 7 days after the
mosquito bite and typically last 3 to 10 days. In order for transmission to occur the
mosquito must feed on an infected person during a 5-day period when large amounts of
virus are in the blood. This period usually begins a little before the person becomes
symptomatic. Some people may never have significant symptoms but can still infect
mosquitoes. After dengue enters the mosquito through a blood meal, the virus will
require an additional 8 to 12 days incubation before it can then be transmitted to another
human. The mosquito remains infected for the remainder of its life, which might be days
or a few weeks. Once a mosquito has the virus, it then will be able to infect other
individuals. As a result, other mosquitoes that receive blood meals from infected
individuals then transmit the disease to others. Therefore, the cyclical spread of dengue is
repeated. The ability to understand the environments of the vector, the analysis of

14
infected individuals, and the susceptibility of the population to infection are justification
for both a geographic and medical analysis for this disease.
Dengue Cycle
Figure 1 - Cyclical cycle of dengue transmission (WHO 2012).
The onset of a likely dengue epidemic is caused by a mosquito who receives a
blood meal from a host individual who is infected with dengue (DENV 1, DENV 2,
DENV 3, or DENV 4) (Figure 1). The initial host could be an individual who has traveled
from an area where dengue is endemic or it could be a person who has suffered dengue in
the past and now serves as a host for transmission. Since there are four separate types of
dengue the potential for spread depends on the regions where the virus is contracted. One
Human (Infected
with dengue)
Mosquito
Human
Mosquito

15
aspect of note it that it may only take one blood meal for the virus to be transmitted to
other individuals (Amarasinghe et al. 2011). Once a mosquito has the virus, it then will
be able to infect other individuals. As a result, other mosquitoes that receive blood meals
from infected individuals then transmit the disease to others causing a cyclical spread of
dengue. The environmental factors such as temperature, precipitation, and Aedes aegypti
abundance will determine the rate at which this will happen. Environmental factors will
be later discussed in the paper.
Environments around the globe that are reservoirs for dengue fever
Dengue environments around the world provide many characteristic and
opportunities for increased range of dengue fever. Areas in tropical and subtropical
locations provide the ideal climate in which the range of dengue can occur based upon
the habitat of Aedes aegypti. These environmental areas serve to show how the range of
dengue is limited by the presence of the mosquito to transmit dengue as well as the
climate able to sustain the mosquitos’ habitat. Individuals in most of these areas are
concentrated in urban environments which allow for the mosquito to flourish based upon
adaptations to the urban habitat by the mosquitos. Urbanization in these regions of the
world poses close relationships between individuals as well as the ideal habitats for
which the Aedes aegypti mosquito can thrive. The presence of individuals who have
contracted the disease provide the sustainment for dengue being a reservoir in the
associated countries. As individuals migrate and travel to new locations the transmission
of dengue continues to progress across the geographic landscape. Africa in particular
poses cultural characteristics that make the range of dengue contingent on individuals

16
migrating to locations from which dengue is present. With increased global warming the
geographic trend for increased dengue incidence is compounded by the ability for the
mosquito to travel further north and south and to higher elevations. Temperature,
humidity, and precipitation continue to prove to be key vectors for the survival of
mosquitos. Another key factor involves the presence of public awareness. The prevalence
of dengue often goes unrecognized in African countries, where the lack of surveillance
systems, or their poor implementation, is the cause of missing information on dengue
virus activity (Franco et al. 2010). However, other regions of the world besides those in
Africa, have experienced an increase in the incidence of dengue even with higher levels
of reporting. Reasons for such increased incidence involve the temperature being ideal
for the mosquitos, the urbanization of many of these countries, and the
increased/decreased presence of precipitation.
There too are areas within these environments that are dengue fever free. Some of
the main reasons involve the cultural and economic patterns in the established locations.
For example, Texas provides a climate in which Aedes aegypti can flourish; however, the
rate of incidence has been greatly reduced through dengue awareness campaigns,
preventative spraying, and combative measures by the government (CDC 1996). Areas
around the world in which dengue occurs have greatly reduced the rate of incidence for
dengue through policies of government intervention. Furthermore, as developing
countries use insecticide netting to cover water containers, remove excess water from
plants and other containers, and spray their houses periodically the ability to limit the

17
environment of dengue is greatly reduced. Even with such measures though, the potential
for dengue is based upon the habitat for the mosquito Aedes aegypti.
Dissertation Organization
Several key areas of Geographic Information Science including mapping
limitations, risk analysis, and utilizing published literature to expand mapping are
addressed with this dissertation. This dissertation assists health officials, geographers,
epidemiologists, and entomologists by increasing situational awareness and improving
visualization of risk. Specifically, this research project presents two models: Similarity
Search and a susceptibility risk model. The following provides a summary of the
remainder of the dissertation. In Chapter 2, I provide an overview of the limitations to
dengue mapping. The different methods, analyses, and models are scrutinized through a
search of the literature to allow us to identify limitations with dengue mapping. This
provides an overview of the methods and models needed to improve mapping and
provides the ability to identify opportunities for improvement. In Chapter 3, I discuss the
development and testing of Similarity Search for determining characteristics analogous to
dengue occurrence locations. This method uses dengue occurrence data and mosquito
habitat to determine similarity to locations within the country of Kenya. This approach
seeks to minimize risk, while maximizing the location where resources and awareness
campaigns will be most beneficial. In Chapter 4, I introduce the ArcGIS Predictive
Analysis Tools (PAT) which estimates dengue susceptibility risk for the continent of
Africa. Two separate susceptibility risk tools within PAT (Query Expression Editor and
QFit) extend the analyses of dengue risk previously published for Africa using both

18
dengue occurrence data and environmental data. In Chapter 5, I provide a summary of the
contributions of this research. Finally, Chapter 6 provides recommendations for future
research.

19
REFERENCES
Amarasinghe A, Kuritsk JN, Letson GW, Margolis HS. (2011). Dengue virus infection in
Africa. Emerg Infect Dis., 17:1349–1354.
Centers for Disease Control and Prevention. (1996). Dengue fever at the U.S.-Mexico
border, 1995-1996. MMWR Morb Mortal Wkly Rep., 45:841-844.
Esri. (2013). ArcGIS Help 10.2 – Similarity Search. Redlands, CA: Environmental
Systems Research Institute. Available at:
http://resources.arcgis.com/en/help/main/10.2/index.html#/Similarity_Search/005
p0000005m000000/ (accessed on 15 April 2014).
Esri. (2014). ArcGIS Predictive Analysis Tools. Redlands, CA: Environmental Systems
Research Institute. Available at:
http://www.arcgis.com/home/item.html?id=90d9d9e8bb9e4228b75ec73ea394f5e
4 (accessed 15 April 2014).
Franco L, Di Caro A, Carletti F, Vapalahti O, Renaudat C, Zeller H, Tenorio A. (2010).
Recent expansion of dengue virus serotype 3 in West Africa. Euro Surveill 15:1-
4.
Reiter P. (2001). Climate change and mosquito borne disease. Environ Health Perspect
109(suppl 1):141-161.
Sang RC. (2012). Dengue fever Research. E-mail correspondence 5 April 2012.
World Health Organization. (2012). Global strategy for dengue prevention and control
2012-2020, WHO Press, V-30 pp.

20
CHAPTER TWO1 : DENGUE MAPPING LIMITATIONS
Abstract
Introduction: Dengue fever, a mosquito-borne viral infection, is a growing threat to
human health in tropical and subtropical areas worldwide. There is a demand from public
officials for maps that capture the current distribution of dengue and maps that analyze
risk factors to predict the future burden of disease.
Methods: To identify relevant articles, we searched Google Scholar, PubMed, BioMed
Central, and WHOLIS (World Health Organization Library Database) for published
articles with a specific set of dengue criteria between January 2002 and July 2013.
Results: After evaluating the currently available dengue models, we identified four key
barriers to the creation of high-quality dengue maps: (1) data limitations related to the
expense of diagnosing and reporting dengue cases in places where health information
systems are underdeveloped; (2) issues related to the use of socioeconomic proxies in
places with limited dengue incidence data; (3) mosquito ranges which may be changing
as a result of climate changes; and (4) the challenges of mapping dengue events at a
variety of scales.
Conclusion: An ideal dengue map will present endemic and epidemic dengue
information from both rural and urban areas. Overcoming the current barriers requires
1 Attaway DF, Jacobsen KH, Falconer A, Manca G, Waters NM. 2014. Assessing the methods needed for
improved dengue mapping: a SWOT analysis. The Pan African Medical Journal. 2014;17:289.

21
expanded collaboration and data sharing by geographers, epidemiologists, and
entomologists. Enhanced mapping techniques would allow for improved visualizations of
dengue rates and risks.
Keywords: dengue; geographic information systems; climate change; developing
countries; medical geography

22
Introduction Dengue fever (DF) is a mosquito-borne viral infection that causes high fevers and
joint pain in the residents of at least 100 countries in Asia, Africa, the Pacific, the
Americas, and the Caribbean. Mosquitoes (Aedes aegypti and Aedes albopictus) can
become infected with any one of the four dengue virus strains when they take blood
meals from humans infected with dengue; susceptible humans are then infected by these
viral-infected mosquitoes. Some people with DF develop dengue hemorrhagic fever
(DHF), which can be fatal.
Although many published studies have examined the behavioral and
environmental risk factors for DF as well as the rates of human infection during
outbreaks, a definitive methodology for mapping the incidence of this disease has yet to
be established. These methodological deficiencies and gaps in the available data have
limited the ability of geographers and other researchers to create effective visualizations
for DF. An improved set of data and more effective mapping tools for the creation of
local and regional dengue maps would facilitate communication about health risks among
public health officials, healthcare providers, policymakers, and the public.
Methods To identify relevant articles, we searched Google Scholar, PubMed, BioMed
Central, and WHOLIS (World Health Organization Library Database) for articles
published between January 2002 and July 2013. The following search terns were used:
[(dengue OR dengue fever) AND (spatial analysis OR geospatial analysis OR GIS OR

23
geographic information systems)]. No language restrictions were imposed. In total, 19
articles were selected for inclusion in the analysis (Table 1).
Table 1 - Summary of the 19 eligible dengue mapping articles
Ref
#
Mo
del
Ty
pe
*
Su
b M
od
el *
Imag
ery
Incid
en
ce
Da
ta
Mo
squ
ito
Da
ta
Preci
p D
ata
Tem
p D
ata
Hu
mid
ity
Da
ta
Po
p D
ata
Ele
va
tio
n
Qu
an
t /
Qu
al
Stu
dy
Sca
le *
Loca
tio
n
Fo
cu
s *
Reso
luti
on
40 1 1 No Yes Yes No No No No No Qual 1
Belem &
Brasilia,
Brazil;
Easter
Island
1 Village or
neighborhood
41 2 2 No Yes Yes No No No Yes No Qual 2 Recife,
Brazil 2
Hypothetical
Sample
42 2 3 Yes No Yes No No No Yes No Quant 5 Port Louis,
Mauritus 1 0.1 x 0.1 km cells
43 2 5 No Yes Yes No No No Yes No Quant 2
Ribeirão
Preto,
Brazil,
1 Pixel (designed by
user)
44 3 6 No Yes No No No No No No Qual 5 Malaysia 1 Country
45 4 No Yes Yes No No No Yes No Quant 3
Jeddah
County,
Saudi
Arabia
1 Point incidence data
46 5 7 Yes Yes No Yes Yes No Yes Yes Qual 6 Global 1 5km cells
47 6 Yes Yes No No No No Yes No Quant
3
/
5
Jeddah
County,
Saudi
Arabia
1
DF Data - district
level imagery - 2.5
m spatial resolution
48 6 8 No Yes Yes No No No Yes No Quant 3 Taiwan 1
"Li”, the lowest
administrative unit
in Taiwan
49 6 9 Yes Yes Yes No No Yes No Quant 4 Johar
State, India 1
Point / District
Level analysis
12 7 10 No Yes No Yes Yes No No Yes Both 6 Global 1 .10° x .10° degrees
(about 11.12 km)
50 8 11 No No No No No No No Yes Quant 6 Global 3 1km cells
29 9 12 Yes Yes No No Yes No Yes Yes Qual 6 Global 1 0.10° grid = 11.1
km cells
51 10 13 No Yes Yes Yes Yes Yes Yes No Both 5 Taiwan 1
14 counties (210
cities
analyzed/aggregate
d to county level)
11 11 14 No No Yes No Yes No Yes No Quant 6 Global 4 Varies
52 12 15 No No No Yes Yes No Yes Yes Quant 4 Hawaii,
USA 2
450 meter
Resolution
21 13 No No No No Yes No Yes No Quant 5 Singapore 3 Country
22 14 No No No Yes Yes Yes Yes No Quant 6 Global 1 .5 x .5 degree cells
(53.56 km)
14 15 No Yes No Yes Yes No Yes No Quant 6 Global 1 5km x 5km pixel

24
Table 2 - Key for Table 1
Model
Type
1: Aggregated
SEIR model
2: Cellular
Automata 3: Cost Model
4: Getis-Ord
Gi*
5: Global Dengue
Risk
6: GWR
7: Non-linear
discriminant
analysis
8: Maxent
9: Non-linear
discriminant
analysis
10: Panel Data
Model &
Contingent
Evaluation Model
(CVM)
11: Reports/
Repository
12: Single static
habitat map
13: Susceptible-
exposed-
infectious-
recovered (SEIR)
model
14. Logistic
regression
15. Boosted
Regression Tree
(BRT) model -
biological and
covariate based
Sub-
model
Type
1: Null
homogeneous
model
2:Spatially Explicit
Transmission
(SET) Model /
stochastic cellular
automata model
3: SEIR
(susceptible-
exposed-infected-
removed) model
4: Spatial
SIRS
epidemic
model
5: stochastic
inter-populations
interactions
6: Delphi
process
7: Boosted
Regression Tree
(BRT) model -
Biological Based
8: OLS / Moran's I
9: Gaussian
model /
Monte Carlo
10: discriminant
analytical
methods / 100
Bootstrap Models
11: Maximum
entropy
12: Akaike
Information
Criterion (AICc)
13: The Breteau
index for mosquito
density / Poisson
Model for
population density
14: Mal-area
calculator
(MAC)
15: Potential
habitat mapping
Scale 1: Local 2: City 3: Municipality
4: State 5: Country 6: Global
Focus 1: Dengue 2: Dengue & Aedes
aegypti 3: Aedes aegypti
4:Various
vectorborne
infections
To be included in the data extraction table, the articles had to (a) be published in
or after 2002, (b) present a spatial analysis of dengue fever or Aedes aegypti mosquitoes,
(c) incorporate qualitative or quantitative analytic techniques or a combination of both,
and (d) use real-life rather than hypothetical data. The eligible articles represent data from
a variety of world regions and model DF distribution using a variety of data sources and
analytical techniques. This diversity of source material provided a solid evidentiary
foundation from which to evaluate the current limitations for dengue visualization.

25
Figure 2 - Summary of dengue mapping limitations.
This paper categorizes the current barriers to the creation of high-quality maps of
dengue risk at the local, national, and global levels (Figure 2). We begin by
characterizing current data and mapping limitations as a first step toward overcoming the
barriers to accurate visualizations of dengue rates and risks. We group these observations
into four themes: (1) human health data limitations, (2) human geography issues, (3)
Mosquito Data
Dengue Mapping
Limitations
• Challenging Differential
Diagnosis
• Limited Access to
Laboratory Testing
• Health Information
Systems
• Socioeconomic
Proxies
• Relationship between
Humans and
Mosquitos
• Endemic versus
Epidemic Mapping
Methods
• Urban versus Rural
Mapping Methods
• Scale issues
• Expanding Mosquito
Habitat
• Environmental Proxies
Physical Geography and
Environment
Human Health Data
Human Geography

26
mosquito data limitations, and (4) physical geography and environmental limitations.
These four fundamental elements encompass critical issues for a successful Geographic
Information System (GIS) for mapping dengue: appropriate mapping methods use valid
and complete disease, vector, and environmental data. We further classify our
observations by identifying sub-themes within each of the four main categories, which
are presented in the Review section below. Finally, we use a SWOT analysis approach to
clarify the strengths, weaknesses, opportunities, and threats to improved dengue mapping
(Table 3) [1-2].
Results Identifying barriers to dengue mapping is a necessary first step in improving the
visualization of dengue. Each of the four key factors must be considered independently
and in relationship with the other issues if the goal is to identify strengths and weaknesses
of current models and opportunities to create better maps in the future.
Human Health Data. The ability to create useful maps of those areas of the
world that are at risk of dengue transmission is dependent on the availability of accurate
epidemiological data from those areas. Although dengue primarily affects low and middle
income countries (LMICs), few LMICs have effective systems in place for dengue
diagnosis and reporting. These human health data limitations exist for a variety of
interrelated reasons.
Challenging Differential Diagnosis. Dengue fever symptoms tend to be clinically
indistinguishable from many other tropical febrile infections. In many lower-income
areas, patients with fevers are presumptively treated with anti-malarial medications, and

27
those who fail to respond to anti-malarial medications or antibiotics are presumed to have
a viral infection [3]. In malaria-endemic countries, over-diagnosis of malaria based on
clinical symptoms rather than laboratory testing may be common [3], and presumptive
diagnoses of malaria may cause the undercounting of cases of other febrile illnesses,
including dengue. Since there are almost no effective treatments available for acute viral
infections, there is often no clinical reason to conduct laboratory tests to determine the
causative agent.
Limited Access to Laboratory Testing. Dengue testing is somewhat more
complicated than testing for many other viral infections [4]. The IgM (immunoglobulin
M) levels in the blood that are markers of acute infection may not be detectable until
several days after the onset of symptoms and then remain elevated for 2 to 3 months after
the initial illness. Thus, a negative ELISA (enzyme-linked immunosorbent assay) IgM
test in a patient with acute symptoms may not be proof that dengue is not the causative
agent, and a positive ELISA in a person who has had a previous febrile illness in the past
several months cannot be considered proof that dengue is the cause of the current fever.
Another challenge to accurate diagnosis is the cross-reactivity of dengue with other
flaviviruses, such as West Nile virus or yellow fever, which may cause false positive
results. Because of these challenges, and because there are four different dengue virus
strains, the results of serological (IgM) tests may need to be confirmed by molecular
methods or isolation of the virus. Consequently, testing for dengue is an expensive
proposition when compared to malaria, which can be diagnosed with just a microscope,
or to viruses like HIV and yellow fever for which accurate rapid diagnostic tests are

28
available. Even if health officials identified increased dengue surveillance as a priority in
their countries, the costs of initial and confirmatory testing is in many instances
prohibitive to patients and to health systems [5].
Health Information Systems. Maps are only as good as the data they are
displaying, and an accurate global map of dengue risk is dependent on having at least
some reasonably valid statistics from every country affected by endemic and/or epidemic
dengue. At present, many countries have no official statistics for the incidence of dengue,
even if they may have a presumed high burden of infection. Many countries where
dengue is endemic or epidemic lack the resources to support robust health information
systems (HIS) and extensive surveillance. A good HIS requires computer infrastructure,
including internet connectivity; the ability to protect confidential electronic patient
records; electronic medical records (EMRs) that are linked across hospitals, clinics,
pharmacies, and other providers; communication between clinicians, laboratory
specialists, public health officers; and a cadre of highly-trained data managers and
analysts. Ideally, a strong HIS will include active surveillance in which public health
authorities reach out to local clinicians to solicit case reports rather than merely relying
on a passive surveillance system in which public health officials wait for healthcare
providers to take the initiative to report a case. Passive surveillance systems may miss the
majority of dengue cases, and even active surveillance systems face under-reporting of
cases [5-6].
The lack of infrastructure and the personnel and technology costs associated with
establishing and operating an effective HIS are significant barriers for LMICs which must

29
generally prioritize urgent patient care needs over the implementation of longer-term
public health activities. Even if subsidies are available to help offset the costs of software
licenses and equipment, the costs of training and supporting epidemiologists and GIS
analysts would be substantial, especially if the goal is to run sophisticated geospatial
analyses [7-10].
The advent of internet-based data collection systems may provide an opportunity
for dengue researchers and others with related interests to share data that may allow for
better mapping of dengue risk. For example, MosquitoMap is an online database within
VectorMap that compiles geospatially-referenced mosquito data [11]. The repository
includes information from the Walter Reed Biosystematics Unit, the School of Integrative
Biology at the University of Queensland, the U.S. Army Medical Research Unit-Kenya
(USAMRU-K) and Kenya Medical Research Institute (KEMRI), and other reporting
agencies [11], and includes, among other resources, maps of the environments that are
suitable for Aedes aegypti [12]. However, while geospatial mosquito data may contribute
to predictive models of dengue risk, mosquito range data alone are not sufficient for
mapping actual dengue incidence and prevalence. The data from MosquitoMap must be
seen as supplemental to accurate data on human dengue fever cases and not as a
substitute for human data.
The collection and dissemination of additional spatially-linked data on human
dengue cases will require careful attention to maintaining the confidentiality of personal
health and other data and protecting the privacy of individuals. Aggregating data to a

30
local scale can protect sensitive medical records while allowing for greater map
sensitivity.
Human Geography. Human geography, which describes the socioeconomic and
cultural factors that influence how various populations interact internally, with other
populations, and with the environment, is an important tool for medical geographers and
other researchers. Dengue researchers must understand how changes in economic
development, international and rural/urban travel, and human patterns of interaction
relate to dengue epidemiology. Several human geography issues contribute to dengue
mapping limitations.
Socioeconomic Proxies. When dengue incidence rates are not available, proxy
variables may be used to identify populations likely to be at risk. Proxies infer the
likelihood of incident dengue occurring based on socioeconomic, demographic, and/or
environmental trends rather than data from confirmed or suspected cases. As a result, the
estimates may significantly underestimate or overestimate the actual dengue risk in
various populations. For example, economic proxies, such as the relative poverty of
neighborhoods within a particular urban area, may be used since lower-income areas tend
to have greater dengue risk [13,14].
Records of human behavior such as travel records [3,5,15] are also sometimes
used as proxies for exposure to dengue. Studies tracking human movement that might
bring susceptible individuals into contact with Aedes-inhabited zones have used GPS
data-loggers, but the data obtained from a small sample of individuals in one town are not
necessarily generalizable to an entire region [16]. Thus, the current social and

31
environmental proxies for dengue have some “scale” limitations: measures like GDP and
GNI are relevant only at the national level while data collected at the neighborhood level,
such as one city or one part of a city within a country, are not able to generalize to a
larger area.
Relationship between Humans and Mosquitoes. A variety of factors may change
the vector density of Aedes mosquitoes in a particular area, including climate change
(global warming) and human activities such as poor water and waste management, which
can create standing pools of water that can serve as breeding sites. Human behaviors also
influence the rate of infection of mosquitoes with dengue virus: increasing human
population density (especially when associated with poor environmental management
from unplanned urbanization), the growth of international trade and tourism (which
facilitates the spread of dengue to new places), and changes in public health policies and
practices (including those related to environmental management and vector control)[17-
20]. Additionally, hyperendemicity with more than one strain of dengue in some places
puts people at risk from multiple strains [21], a situation that is best understood when it
can be visualized. Because both human and mosquito population density and behavior
contribute to dengue incidence and spread, data from both populations must be
incorporated into dengue mapping models.
Mosquito Data. The expected expansion of mosquito habitats due to climate
change means that current maps that show the ranges of mosquito species may soon be
obsolete. Changes in mosquito ranges may limit the ability of existing mosquito habitat

32
data to serve as a proxy for dengue endemicity data, because the mosquito data will no
longer be up-to-date and relevant.
Expanding Mosquito Habitat. Given the relationship between mosquito habitat
and climate, the range of many mosquitoes, including the Aedes species, is expected to
expand with climate change, exposing more people to dengue [22-23]. Prediction models
suggest that global warming may increase the latitudinal range, the altitudinal range, and
the duration of the transmission season for Aedes mosquitoes [24]. Several dengue maps
have attempted to translate Aedes range models to predictions of changes in dengue
distribution, but all admit serious limitations due to the complexity of the analysis and the
limited accuracy and completeness of data for model parameters [26-28].If the range of
mosquitoes changes significantly in coming years, new dengue maps will have to be
created often in order to be of use to health policymakers and practitioners.
Environmental Proxies. If the range of Aedes mosquitoes is demonstrated to be
changing more frequently than in the past, mosquito maps may no longer be sufficient
proxies for dengue infection. Many of the published projections of dengue endemicity
from recent years were created from map layers showing temperature, rainfall, and land
features that are meant to identify areas that are biologically suitable Aedes habitats
[22,24,29]. If these parameters can no longer be measured or estimated with accuracy due
to climate change, estimates of dengue range will have to depend on other forms of proxy
data.
Physical Geography and the Environment. Dengue is often considered to be
primarily an urban infection, in large part because Aedes mosquitoes thrive in urban

33
environments, but dengue also occurs in rural areas [30-32]. The need for endemic and
epidemic maps that provide reasonable estimates for both rural and urban areas requires
addressing several physical (environmental) geography concerns. Additionally, most
current models display only the presence or absence of dengue, and there is a need for a
more nuanced portrayal of levels of risk and levels of the burden of disease from dengue
within affected areas.
Endemic versus Epidemic Mapping Methods. Dengue maps tend to fall into two
categories. Endemic maps show which places experience dengue transmission during at
least some months in a typical year, usually presenting estimates of dengue presence at
the country or regional level [3,5]. Epidemic maps display outbreak information from
places where the infection rates are considerably higher than normal, and tend to show
data specific to neighborhoods, cities, or districts [33-35].
Public health officials need geographic information about both endemic and
epidemic dengue. The maps included in the U.S. Centers for Disease Control and
Prevention’s (CDC) Yellow Book—the travel vaccine guidelines are re-issued every two
years—show which countries are considered endemic for dengue [35]. This book is
widely used by clinicians who provide travel advice. In contrast, the DengueMap project
updates an online map every hour to show the precise locations of cases of dengue that
have been reported by public health officials, newspapers, and internet sources such as
ProMED mail, which is sponsored by the International Society for Infectious Diseases
and allows anyone in the world to submit brief case reports about emerging epidemics.
These approaches provide complementary information for use in decision-making about

34
public health and personal health, but it is difficult to provide one map that captures both
ways of viewing risk.
Urban versus Rural Mapping Methods. Dengue mapping has focused mainly on
studies of urban areas, in part because most dengue infection surveillance is conducted in
high-density population areas. Urban dengue maps factor in considerations of human and
mosquito population density, demographic and environmental factors, and vector control
initiatives. Rural areas have lower population densities, different demographic and
environmental considerations and data availability, and limited vector control efforts. In
particular, urban and rural areas have distinct energy balances, temperatures, humidity
levels, and storm runoff (and standing water) patterns [36]. As a result of these special
environmental considerations, current mapping techniques require different approaches in
urban and rural areas. The lack of human and mosquito data for rural areas often requires
greater dependence on temperature, precipitation, landforms, and other purely
environmental data and estimates, and demands a small scale approach even though more
detailed scales would be beneficial to map users [37]. Dengue maps would be more
useful to policymakers and others if they provided a more complete analysis of dengue
distribution and risk factors across the spectrum of population density.
Scale Issues. Depending on the availability of geographically referenced data,
effective mapping should include both temporal and scale considerations. Dengue maps
highlight the scale differences between global, regional, and local mapping. Mapping of
dengue endemicity on the global scale is usually coarse because global climate datasets
have relatively coarse spatial resolution [29]. Recent models suggest that mapping

35
dengue at the country level underrepresents dengue occurrence [3,5,38,39]. At the same
time, local models with site-specific data are often limited in generalizability to locations
with similar climate, geography, urbanization, and various human geography factors, and
may be so specific to one place that they cannot easily be applied to other regions
[23,24]. Comprehensive dengue mapping projects will need to develop methods for
integrating global climate scenario-based analysis together with local demographic and
environmental factors, including those from both rural and urban areas.
Discussion A SWOT analysis, though traditionally recognized as a tool to evaluate businesses
and projects, provides valuable insight into methods necessary for improved dengue
mapping. SWOT uses evaluations of current performance to develop strategic plans for
improving future operations [25]. The four components of a SWOT analysis examine (1)
the current strengths that should be maintained and built on, (2) the weaknesses that need
to be addressed, (3) the opportunities that are available for moving toward more optimal
function, and (4) the threats that may prevent progress from being made [2,25]. SWOT
provides a framework for evaluating the benefits and limitations of current models that
should be considered as new techniques for advancing mapping and visualization are
developed. Table 2 summarizes the SWOT factors for dengue mapping that were
presented in the Results section. The SWOT analysis points toward actions that would
allow for improved spatial analysis of dengue fever distributions and risks.

36
One major theme that emerges from the SWOT analysis is the critical need for
better data collection and sharing. Improved data collection would require a commitment
to global cooperation and allocation of appropriate resources to this project (which for
cost savings could include many infectious diseases of global interest rather than focusing
exclusively on dengue). Once more data are being collected using comparable
methodologies, the creation of well-maintained and accessible cross-national data
repositories will be incredibly helpful for advancing public health knowledge and for
allowing geographers to develop, test, and compare methods for mapping dengue
endemicity.
As better data sources are developed along with more robust software for
integrating various types of data, there will be an opportunity for new models to
incorporate a more diverse set of data about spatially-specific incidence, human
demography and behavior, mosquito ranges, and other environmental factors, such as
elevation and precipitation. An ideal multi-level model will be viable for local and
regional analysis as well as for examinations of the global burden of dengue.
Additionally, the model will be one that can be updated as often as new data become
available, including live-time data uploaded during outbreaks.

37
Table 3 - SWOT analysis for improved dengue mapping.
Strengths of current dengue maps… Opportunities for future dengue maps…
Identify areas that are historically more
susceptible to dengue
Use advanced spatial analysis techniques
Use multi-level modeling (such as
Combinatorial Complexity Analysis)
Improve the availability of data and
decrease costs of acquiring data
Increase access to new GIS technology by
reducing the cost of software
Incorporate additional dengue variables,
such as information about migration
Inform epidemiologists, geographers, and
citizens to utilize GIS Maps to identify
existing dengue conditions
Capture data systematically through
ongoing data collection and reporting
Provide a wider use of tools like
MosquitoMap and DengueMap (internet
data collection and geospatial data
sharing)
Improve stronger evidentiary base for
targeted dengue prevention and control
activities by increasing public awareness
of risks
Analyze existing models to create a
platform for future multi-level models
Weaknesses of current dengue maps… Threats for future dengue maps…
Are challenged by clinically
indistinguishable dengue fever symptoms
Rely on limited data sources (and
therefore limit the currency and timeliness
of maps)
Involve complex spatial analysis methods
which cannot be conducted without
specialized (and often prohibitively
expensive) software packages
Limits GIS analysis by using a
quantitative approach
Focus on the global scale and are too
coarse for local use or focus on the local
scale and are to fine for global use
Require potentially pricy laboratory
testing to validate possible cases
Lack sufficient resources for
systematically capturing, identifying , and
storing GIS data
Need to ensure the confidentiality of
personal data
Require equally complete or reliable data
for rural and urban areas
Differ in their data compilation methods,
which do not promote data accuracy and
data sharing
Conclusion Understanding current data and mapping limitations is an important first step
toward overcoming the barriers to accurate visualizations of dengue rates and risks. The
development of new maps that inform public health policy and practice will require

38
geographers, epidemiologists, and entomologists to commit to sharing resources and
knowledge and to working together to build robust systems for data collection and
dissemination, data analysis, and distribution of up-to-date maps. New technologies may
then allow for the integration of multiple input variables across global, regional, and local
scales and the creation of better dengue maps for use in public health decision-making.

39
REFERENCES
1. van Wilgenburg R. GIS and epidemiology, a SWOT analysis.
http://www.feweb.vu.nl/gis/spinlab/research/files/gisandsciences/GIS%20and%20ep
idemiology%20-%20an%20introduction.pdf. Accessed 21 August 2013
2. Taleai M, Mansourian A, Sharifi A. Surveying general prospects and challenges of
GIS implementation in developing countries: a SWOT–AHP approach. J Geogr Syst.
2009; 11:291-310
3. Amarasinghe A, Kuritsk JN, Letson GW, Margolis HS. Dengue virus infection in
Africa. Emerg Infect Dis. 2011; 17(8):1349-1354
4. Shu PY, Huang JH. Current advances in dengue diagnosis. Clin Vaccine Immunol.
2004; 11(4):642-650
5. Brady OJ, Gething PW, Bhatt S, Messina JP, Brownstein JS, Hoen AG, Moyes CL,
Farlow AW, Scott TW, Hay SI. Refining the global spatial limits of dengue virus
transmission by evidence-based consensus. PLoS Negl Trop Dis. 2012; 6(8):1760
6. Suaya JA, Shepard DS, Beatty ME. Dengue burden of disease and costs of illness.
2006. Geneva. World Health Organization
7. Goodman DC, Wennberg JE. Maps and health: the challenges of interpretation. J
Public Health Manage Pract. 1999; 5(4):xiii-xvii
8. Melnick AL, Fleming DW. Modern geographic information systems-promise and
pitfalls. J Public Health Manage Pract. 1999; 5(2):viii-x
9. Richards TB, Croner CM, Rushton G, Brown CK, Fowler L. Geographic
information systems and public health: mapping the future. Public Health Rep. 1999;
114(4):359-373

40
10. Richards TB, Croner CM, Novick LF. Atlas of state and local geographic
information systems (GIS) maps to improve community health. J Public Health
Manage Pract. 1999; 5(2):2–8
11. Foley DH, Wilkerson RC, Birney I, Harrison S, Christensen J, Rueda LM.
MosquitoMap and the Mal-area calculator: new web tools to relate mosquito species
distribution with vector borne disease. Int J Health Geogr. 2010; 9:11
12. Rogers DJ. Predicted probability occurrence for dengue: models for vectors and
vector-borne diseases. Adv Parasitol. 2006, 62:1-35
13. Åström C, Rocklöv J, Hales S, Béguin A, Louis V, Sauerborn R. Potential
distribution of dengue fever under scenarios of climate change and economic
development. EcoHealth. 2012; 9(4):448-454
14. Bhatt S, Gething PW, Brady OJ, Messina JP, Farlow AW, Moyes CL, Drake JM,
Brownstein JS, Hoen AG, Sankoh O, Myers MF, George DB, Jaenisch T, Wint
GRW, Simmons CP, Scott TW, Farrar JJ, Hay SI. The global distribution and burden
of dengue. Nature. 2013; 496(7446):504-507
15. Winch PJ, Leontsini E, Rigau-Pérez JG, Ruiz- Pérez M, Clark GG, Gubler DJ.
Community-based dengue prevention programs in Puerto Rico: impact on
knowledge, behavior, and residential mosquito infestation. Am J Trop Med Hyg.
2002; 67(4):363-370
16. Vazquez-Prokopec GM, Stoddard ST, Paz-Soldan V, Morrison AC, Elder JP,
Kochel TJ, Scott TW, Kitro U. Usefulness of commercially available GPS data-
loggers for tracking human movement and exposure to dengue virus. Int J Health
Geogr. 2009; 8:68
17. Gubler DJ. Dengue/dengue haemorrhagic fever: history and current status. Novartis
Found Symp. 2006; 277:3-16
18. Gubler DJ. Dengue and dengue hemorrhagic fever. Clin Microbiol Rev. 1998;
11(3):480-496

41
19. Ooi EE, Gubler DJ. Dengue in Southeast Asia: epidemiological characteristics and
strategic challenges in disease prevention. Cad Saude Publica. 2009; 25(Suppl.
1):S115-S124
20. Torres JR, Castro J. The health and economic impact of dengue in Latin America.
Cad Saude Publica. 2007; 23(Suppl. 1):S23-S31
21. Oki M, Yamamoto T. Climate change, population immunity, and hyperendemicity in
the transmission threshold of dengue. PLoS One. 2012; 7(10):e48258
22. Hales S, de Wet N, Maindonald J, Woodward A. Potential effect of population and
climate changes on global distribution of dengue fever: an empirical model. Lancet.
2002; 360(9336):830-834
23. Patz JA, Martens WJM, Focks DA, Jetten TH. Dengue fever epidemic potential as
projected by general circulation models of global climate change. Environ Health
Perspect. 1998; 106(3):147-153
24. Jetten TH, Focks DA. Potential changes in the distribution of dengue transmission
under climate warming. Am J Trop Med Hyg. 1997; 57(3):285-297
25. Orr SK. The private sector on public land: Policy implications of a SWOT analysis
of Banff National Park. J Nat Res Poli Res. 2011; 3(4):341-354
26. Martens WJM, Jetten TH, Focks DA. Sensitivity of malaria, schistosomiasis and
dengue to global warming. Clim Change. 1997; 35(2):145-156
27. Van Kleef E, Bambrick H, Hales S. The geographic distribution of dengue fever and
the potential influence of global climate change. TropIKAnet. 2010; 2010:1-18
28. Zhang Y, Bi P, Hiller JE. Climate change and the transmission of vector-borne
diseases: a review. Asia Pac J Public Health. 2008; 20(1):64-76
29. Rogers DJ, Wilson AJ, Hay SI, Graham AJ. The global distribution of yellow fever
and dengue. Adv Parasitol. 2006; 62:181-220

42
30. Chang AY, Parrales ME, Jimenez J, Sobieszczyk ME, Hammer SM, Copenhaver DJ,
Kulkarni RP. Combining Google Earth and GIS mapping technologies in a dengue
surveillance system for developing countries. Int J Health Geogr. 2009; 8:49
31. Chareonsook O, Foy HM, Teeraratkul A, Silarug N. Changing epidemiology of
dengue hemorrhagic fever in Thailand. Epidemiol Infect. 1999; 122(1):161-166
32. Schmidt WP, Suzuki M, Dinh Thiem V, White RG, Tsuzuki A, Yoshida LM, Yanai
H, Haque U, Tho LH, Anh DD, Ariyoshi K. Population density, water supply, and
the risk of dengue fever in Vietnam: cohort study and spatial analysis. PLoS Med.
2011; 8(8):e1001082
33. Chan EH, Sahai V, Conrad C, Brownstein JS. Using web search query data to
monitor dengue epidemics: a new model for neglected tropical disease surveillance.
PLoS Negl Trop Dis. 2011; 5(5):e1206
34. Collier N, Doan S. GENI-DB: a database of global events for epidemic intelligence.
Bioinformatics. 2012; 28(8):1186-1188
35. Tomashek KM. Dengue fever & dengue hemorrhagic fever. In: CDC health
information for international travel 2012: The yellow book. Brunette GW, ed. 2012.
New York. Oxford University Press
36. Cooney CM. Downscaling climate models: sharpening the focus on local-level
changes. Environ Health Perspect. 2012; 120(1):a22-a28
37. Johansson MA, Dominici F, Glass GE. Local and global effects of climate on
dengue transmission in Puerto Rico. PLoS Negl Trop Dis. 2009; 3(2):e382
38. Franco L, Di Caro A, Carletti F, Vapalahti O, Renaudat C, Zeller H, Tenorio A.
Recent expansion of dengue virus serotype 3 in West Africa. Euro Surveill. 2010;
15(7):pii=19490
39. Hotez PJ, Savioli L, Fenwick A. Neglected tropical diseases of the Middle East and
North Africa: review of their prevalence, distribution, and opportunities for control.
PLoS Negl Trop Dis. 2012; 6(2):e1475

43
40. Favier C, Schmit D, Müller-Graf CDM, Cazelles B, Degallier N, Mondet B, Dubois
MA. Influence of spatial heterogeneity on an emerging infectious disease: the case
of dengue epidemics. Proc R Soc B. 2005; 272(1568):1171-1177
41. Medeiros LCdC, Castilho CAR, Braga C, de Souza WV, Regis L, Monteiro AMV.
Modeling the dynamic transmission of dengue fever: investigating disease
persistence. PLoS Negl Trop Dis. 2011; 5(1):e942
42. Ramchurn SK, Moheeput K, Goorah SS. An analysis of a short-lived outbreak of
dengue fever in Mauritus. Euro Surveill. 2009; 14(34):pii=19314
43. Gagliardi HF, da Silva FAB, Alves D. Automata network simulator applied to the
epidemiology of urban dengue fever. Lecture Notes in Computer Science - ICCS
2006, Part III. 2006; 3993:297-304
44. Shepard DS, Undurraga EA, Lees RS, Halasa Y, See Lum LC, Ng CW. Use of
multiple data sources to estimate the economic cost of dengue illness in Malaysia.
Am J Trop Med Hyg. 2012; 87(5):796-805
45. Khormi HM, Kuman L, Elzahrany RA. Modeling spatio-temporal risk changes in the
incidence of dengue fever in Saudi Arabia: a geographical information system case
study. Geospatial Health. 2011; 6(1):77-84
46. Simmons CP, Farrar JJ, van Vinh Chau N, Wills B. Dengue. N Engl J Med. 2012;
366:1423-1432
47. Khormi HM, Kumar L. Modeling dengue fever risk based on socioeconomic
parameters, nationality and age groups: GIS and remote sensing based case study.
Sci Total Environ. 2011; 409(22):4713-4719
48. Lin CH, Wen TH. Using geographically weighted regression (GWR) to explore
spatial varying relationships of immature mosquitoes and human densities with the
incidence of dengue. Int J Environ Res Public Health. 2011; 8(7):2798-2815
49. Seng SB, Chong AK, Moore A. Geostatistical modelling, analysis and mapping of
epidemiology of dengue fever in Johor State, Malaysia. In: Proceedings of the17th
Annual Colloquium of the Spatial Information Research Centre November 25, 2005;
Dunedin, New Zealand; 2005, 109-123

44
50. Nyari A, Foley DH. Aedes aegypti_Nyari_1.
http://www.mosquitomap.org/metadata.htm#vec31. Accessed 21 August 2013
51. Tseng WC, Chen CC, Chang CC, Chu YH. Estimating the economic impacts of
climate change on infectious diseases: a case study on dengue fever in Taiwan. Clim
Change. 2009; 92(1-2):123-140
52. Kolivras KN. Mosquito habitat and dengue risk potential in Hawaii: a conceptual
framework and GIS application. Prof Geog. 2006; 58(2):139-154

45
CHAPTER THREE2: SIMILARITY SEARCH
Abstract
Outbreaks, epidemics, and endemic conditions make dengue a disease that has emerged
as a major threat in tropical and sub-tropical countries over the past thirty years. Dengue
fever creates a growing burden for public health systems and has the potential to affect
over 40% of the world population. This paper presents a geospatial analysis called
Similarity Search to identify locations within Kenya with the highest and lowest areas of
dengue risk. Similarity Search develops a risk map by combining environmental
susceptibility analysis and GIS, and then compares areas with dengue prevalence to all
other locations. Kenya has had outbreaks of dengue during the past three years, and we
identify areas with the highest susceptibility to dengue infection using bioclimatic
variables, elevation, and mosquito habitat as input to the model. Comparison of the
modeled risk map with the reported dengue epidemic cases obtained from ProMED, open
source reporting, and government news reports from 1982-2013, confirmed the highest
risk locations. These were used as the Similarity Search presence cells. Developing the
risk model based upon the bioclimatic variables, elevation, and mosquito habitat
increased the efficiency and effectiveness of the dengue fever risk mapping process.
2 Attaway DF, Jacobsen KH, Falconer A, Manca G, Bennett LR, Waters NM. 2014 (in review). Mosquito
habitat and dengue risk potential in Kenya: Alternative methods to traditional risk mapping techniques.
46
Keywords: dengue; geographic information systems; risk mapping; developing
countries; medical geography; Kenya

47
Introduction Dengue fever (DF) is a viral infection transmitted by Aedes mosquitoes. Infection
with any of the four strains (DEN-1 to DEN-4) may cause febrile illness and joint pain
and has the potential for serious complications, including dengue hemorrhagic fever
(DHF) and dengue shock syndrome (DSS). Nearly 40% of the world’s population lives in
areas where dengue fever is endemic (Guzman and Istúriz 2010), and about to 50 to 100
million infections occur globally each year (WHO 2012). Dengue virus infection is not
yet vaccine-preventable, so public health efforts must focus on mosquito control.
Recent research has suggested that the burden of dengue infection in Africa is
lower than that in Asia but is comparable to that reported in the Americas (Bhatt et al.
2013; Franco et al. 2010). The first confirmed outbreak in Kenya, East Africa, occurred
in 1982 (Johnson et al. 1982a). More recent studies from Kenya have reported cases from
both the subtropical coastal regions and the arid northeast part of the country (Sang
2007). Table 4 and Figure 3 highlight the dengue reports from Kenya. Several of the
cross-sectional surveys show that a sizeable proportion of Kenyans have serologic
evidence of past dengue infection, and this suggests that the reported dengue incidence
may be significantly underestimated. Dengue transmission in Kenya is facilitated by the
humid and rainy climate along the coast, where mosquitoes thrive, as well as by
expanding road and rail transportation networks (Gubler 2004).

48
Table 4 - Seroprevalence and dengue outbreak reports from Kenya, 1982-2013. Event
Year Location Study Design
Sample
Size Result Reference
1982 Malindi Case report 1 Tourist visiting Malindi positive for DEN-2
Johnson et al. 1982b
1982 - 1983 Kilifi Serosurvey of
outpatients 96
Seroprevalence:
increased from 7% in 1982 to 57% in 1983
(DEN-2)
Johnson et al. 1982a; 1982b; 1990
1987 Kilifi and Malindi
Serosurvey of outpatients
1059 Seroprevalence: 1.3% (DEN-2)
Johnson et al. 1990
1999 Kilifi Case report 1 Child positive for DEN-2 Sang et al. 2001
2000-2003 Msambweni
District
Serosurvey of
pregnant women 419
Seroprevalence rates:
63% (DEN-1), 67%
(DEN-2), 55% (DEN-3), 44% (DEN-4)
Sutherland et al. 2011
2004 Malindi Population-based cross-sectional
survey
442 Seroprevalence: 34.2%
(DEN-2) Mease et al. 2011
2011 Mandera Case series 5000 5000 cases and 10 dengue deaths reported between
September and October
ProMED-mail 2011
2010 - 2011 Western Kenya Cross-sectional
survey 354
Seroprevalence: 1.1%;
annual incidence: 8.5/1000 persons
Blaylock et al. 2011
2010 - 2011
Busia and
Trans-Nzoia
counties (Western
Kenya)
Serosurvey of
outpatients 422
Seroprevalence: 8.5% by indirect ELISA and 1.2%
by PRNT testing (DEN-
2)
Awando et al. 2013
2013 Mandera Case series 300 300 cases and 3 dengue deaths between January
and February
ProMED-mail 2013c; 2013f
2013 Mombasa
(Kwale and
Kilifi Counties)
Case series 140
KEMRI identified more
than 56% (140 cases) of dengue cases as positive
for dengue virus: DEN-
1(69%), DEN-2(28%), and DEN-3 (3%).One
sample positive for both DEN-1 and DEN-2.
ProMED-mail 2013a; 2013b;
2013d; 2013e

49
Figure 3 - Map of seroprevalence and dengue outbreak reports from Kenya, 1982-2013.

50
The goal of the analysis presented in this paper was to create a more accurate and
robust map of dengue risk in Kenya based on bioclimatic layers, elevation data, high
resolution population data, and information about the range of the Aedes vector, and to
integrate these data into a localized high resolution format (1 km x 1 km). Aedes data are
compiled in Kenya by the Kenya Medical Research Institute (KEMRI) and collaborating
agencies (Sang 2007; Sang et al., 2001); additional sources of climatic and other
geographic information are also available for integration into spatial models. Improved
visualizations of dengue risk will be of use to the Kenya Ministry of Health (MOH)
Division of Disease Surveillance and Response (DDSR), the Kenyan Field and
Laboratory training Program (FELTP), KEMRI, and their partners in infectious disease
prevention and control (Akhwale 2013). The techniques used for the creation of this new
risk map are also applicable to other infectious diseases and their settings.
Materials and Methods Data sources
Spatial data. Administrative boundary data for Kenya were obtained from the
Kenya Central Bureau of Statistics (2005) and verified against the Global Administrative
Areas (GADM), which is a spatial database of the location of the world's administrative
areas (or administrative boundaries) (GADM, 2012). The datasets were set to a custom
projection using a projected coordinate system (World_Equidistant_Cylindrical) centered
within the country of Kenya to limit the distortion of spatial data on the edges of the map.
Potential border issues were addressed by analyzing the data with a 100 mile buffer
around Kenya and retesting the Similarity Search analysis.

51
Population density data. Human population density data were obtained from
the LandScan 2011 Global Population Database, which was developed by Oak Ridge
National Laboratory (ORNL) for the United States Department of Defense (DoD) (Bright
et al. 2011). Data obtained were in a 1 km x 1 km gridded format using the ORNL
methodology to derive population counts (Bright et al. 2011). Incorporating human
population density provides an essential factor in calculating risk (Bhatt et al. 2013,
Hassan et al. 2012, Moffett et al. 2007, Rogers et al. 2006).
Dengue data. Information about areas in which epidemics occurred were
obtained from ProMed (a website where individuals worldwide can submit reports of
infectious disease outbreaks), PubMed (a journal abstract database maintained by the
U.S. National Institutes of Health), and the Weekly Epidemiological Report published by
the World Health Organization.(Kenya’s infectious disease system does not compile and
release reliable dengue incidence data, since diagnosis is expensive and the health
information system is not set up to easily collect case reports from across the country.)
Once the geographic locations of dengue cases were identified, a 1 km buffer was used to
select the cells in which dengue occurred.
Mosquito data. MosquitoMap is a repository of information that identifies
locations where Aedes aegypti mosquitoes can survive. In addition to the data from
MosquitoMap, places within Kenya where cases had been reported in the files included in
Table 4 were noted as areas that were suitable environments for Aedes. A search of the
MosquitoMap database in Kenya from 1982 through 2013 resulted in 365 mosquito
survey collection sites. The 365 collection sites were combined into a single geospatial

52
layer, which resulted in 167 cells (1 km x 1 km) where Aedes were collected within
Kenya. There was no testing of the mosquitos to determine if they were positive for any
DENV strains. Previous research demonstrated the value of museum mosquito collection
records for understanding mosquito biogeography and ecology, and for planning
mosquito surveys (Foley et al. 2008).
Elevation data. The WorldClim Elevation database contained additional high-
resolution information useful for predicting dengue range, which allowed for
environmental analysis at a resolution of 1 km x 1 km (Hijmans et al. 2005). Elevation
data were incorporated to determine whether risk of dengue as reported in Colombia was
limited above 1,500 meters (Hagenlocher et al. 2013).
Bioclimatic layers data. The WorldClim Bioclimatic variables database was
used to derive monthly temperature and rainfall values, which are known to be related to
mosquito distribution and dengue transmission (Bhatt et al. 2013, Brady et al. 2012,
Simmons et al. 2012, Rogers et al. 2006, and Hijmans et al. 2005).From these data,
interpolated global climate surfaces were produced using the ANUSPLIN-SPLINA
software (Hutchinson, 1995). The bioclimatic variables used for this analysis were
selected based on published literature about dengue risk factors (Nyari et al. 2011) and on
previous dengue models (Bhatt et al. 2013, Brady et al. 2012, Simmons et al. 2012,
Rogers 2006, Rogers et al. 2006).

53
Table 5 - Definitions of the 19 bioclimatic variables.
Layer Description
BIO1 Annual mean temperature
BIO2 Mean diurnal range (mean of monthly (max temp - min temp))
BIO3 * Isothermality (BIO2/BIO7) (* 100)
BIO4 Temperature seasonality (standard deviation *100)
BIO5 * Max temperature of warmest month
BIO6 Min temperature of coldest month
BIO7 * Temperature annual range (BIO5-BIO6)
BIO8 * Mean temperature of wettest quarter
BIO9 Mean temperature of driest quarter
BIO10 * Mean temperature of warmest quarter
BIO11 * Mean temperature of coldest quarter
BIO12 Annual precipitation
BIO13 Precipitation of wettest month
BIO14 Precipitation of driest month
BIO15 Precipitation seasonality (coefficient of variation)
BIO16 * Precipitation of wettest quarter
BIO17 * Precipitation of driest quarter
BIO18 * Precipitation of warmest quarter
BIO19 Precipitation of coldest quarter
* Not used in Similarity Search Index
Table 5 summarizes all of the Bioclimatic variables considered for inclusion in
the model. Based on previous analyses by Foley and Nyari, the variables selected for this
analysis were BIO1, BIO2, BIO4, BIO5, BIO6, BIO9, BIO12, BIO13, BIO14, BIO15,
BIO19, and altitude (Foley et al. 2012, Nyari et al. 2011, Foley et al. 2010, Foley et al.
2008). We included the LandScan population data to enhance the model by integrating
population data into the Similarity Search equation (Bright et al. 2012). This produced a
more localized analysis at a higher resolution than previous studies which used a more

54
global scale in their analysis of dengue risk (Bhatt et al. 2013, Brady et al. 2012,
Simmons et al. 2012, Rogers 2006, Rogers et al. 2006).
Analysis
The various types of data listed in the previous section were transformed from 1
km x 1 km grid cells to a point layer so as to bring all the data together into a single
dataset, rather than multiple raster layers, and so that we could use the newly developed
Similarity Search tool in ArcGIS 10.2 software (Esri 2013a). Similarity Search allows
users to find points of interest by resolving a similarity query such as “find the 10 most
similar cities to Los Angeles. Esri’s Similarity Search categorizes the results in an index
from most similar to least similar (Esri 2013a). The different variables used in the
analysis were standardized prior to the analysis. Standardizing the attribute values
utilized a z-transform where each value (X) is subtracted from the mean for all values (δ)
and divided by the standard deviation for all values (∂) (Esri 2013b). The equation is
below:
Equation 1 - Z-Transformation Equation (Esri 2013b).
𝑍‐ 𝑇𝑟𝑎𝑛𝑠𝑓𝑜𝑟𝑚 = 𝑋 − 𝑀𝑒𝑎𝑛 (𝛿) 𝑆𝑡𝑎𝑛𝑑𝑎𝑟𝑑 𝐷𝑒𝑣𝑖𝑎𝑡𝑖𝑜𝑛 (𝜕)⁄
The analysis then sums the differences between each feature for all variables
against the composite for matching all features (MPX) which is explained in further

55
detail below. Then these sums are ranked. Models were run with the 11 Bioclimatic
(BioClim) variables listed above, population density, and elevation (ALT) (Hijmans et al.
2005).
As noted in the methods section, the presence cells are locations where Aedes
mosquitos were collected through surveys or where cases of human dengue were
reported. The 365 mosquito points in the MosquitoMap database were reduced to 167
cells after adjusting for the duplicate points within the same 1 km x 1 km cells.
Additional presence cells were marked in the four regions of the country (Mombasa,
Mandera, Malindi, and Kilifi) where major dengue outbreaks had been reported in
articles indexed in PubMed (documented in Table 4). In total, 287 presence cells (out of
681,442 total cells) were identified as at risk for dengue. The geospatial dengue outbreak
parameters included a 1 km buffer around the urban cities where dengue was reported in
the PubMed sources. From these cells, the spatial parameters were modified to extract
pertinent information to the centroid of the cell so the adjusted data set could be used
within the Similarity Search process. The regions most susceptible to dengue were
identified using the equation below:
Equation 2 - Similarity Search

56
The equation above calculates two vectors of attributes A and B using cosine
similarity mathematics, cos (θ). The cosine similarity index measures the increasing
difference as the index (Similarity) decreases. Using this method, two different analyses
were used to create the maps in Figures 8 and 9. The purpose of the first analysis was to
determine how risk could be visualized with limited dengue data. This analysis created an
average based on the entire set of presence cells for each of the variables and then
compared those average values as the composite target feature (MPX) (Table 6).
Table 6 - Calculated results from the composite for matching all features when performing Similarity Search
(287 cells).
Field Min Max Mean Variable value for which
SimRank based
ALT 0 1621 494.401 318.2056
BIO_1 0 292 68.7527 238.7596
BIO_2 0 169 40.4955 96.2822
BIO_4 0 1500 425.1529 1079.9965
BIO_5 0 401 87.8569 308.5052
BIO_6 0 213 55.0595 176.324
BIO_9 0 285 71.5984 245.0348
BIO_12 0 1949 432.7004 960.1951
BIO_13 0 327 91.8909 215.8118
BIO_14 0 69 16.2808 17.1882
BIO_15 0 125 28.2855 68.0418
BIO_19 0 551 114.9552 196.338
LNDSCN_POP 0 56657 8245.9614 3749.6551
The second analysis visualized more detailed risk by incorporating isolated
presence cells locations and the unique variable values at each location into the final
analysis. This analysis involved running the Similarity Search against each of the

57
presence cells, iteratively, and then creating an average rank based on the rank value of
each cell for each iteration.
For the first analysis, the attributes for each candidate cell (consisting of 13
variables) are compared to the vector of standardized attributes for the composite target
feature based on the 287 presence cells (Figure 4).
Figure 4 - Visual results of the composite for matching all features when performing Similarity Search (287
cells).
Once all of the 681,442 candidate cells have been processed, candidates are
ranked from the smallest cosine similarity index (most similar) to the largest index (least
similar). The tabular graphic displays how two points (PT1 and PT2) are compared to the

58
variable values for which Similarity Search is based (MPX) on all 13 variables values and
not one specific value (Figure 5).
Figure 5 - Sample of processing completed to determine Similarity Search between two points (PT1 and PT2)
compared to the composite for matching all features (MPX).
This method is not based on the magnitude of the variables, but focuses on the
relationships between the attributes once they have been compared to the target feature
attributes (Esri 2013b). The resulting similarity ranges from −1 (which suggests that the

59
candidate cell is perfectly, inversely related to the profile of presence cells) to 1 (which
suggests that the candidate cell is perfectly, directly related to the profile of presence
cells), with 0 usually indicating independence and in-between values indicating
intermediate similarity or dissimilarity. Figure 6 shows the methodological steps used for
developing the dengue risk maps for Kenya.
Figure 6 - Graphic view of systematic cycle completed using Similarity Search.
Mosquito Locations
(365 Survey sites – 167 cells)
Dengue Outbreaks (1982 – 2013)
(4 Locations – 120 Cells)
Similarity Search
Tool
Population Density
Similarity Search based on
averages of 287 points Similarity Search based on 287
individual iterations
Similarity
Search
Averages
Map
Similarity
Search 287
Iterations
Combined Map
Bioclimatic Layers
Elevation Data
Comparison
Discussion
and
Results

60
The second analysis (Figure 8) was run using each individual presence cell (the
287 total presence cells each with 13 variables) against all the other 681,442 cells. We
combined all 287 iterations, each possessing 681,442 cells which were ranked from 1 to
681,442 in each iteration. In total, this constituted over 195,573,854 cells that were
ranked based upon the 2,542,460,102 variables that were compared with Similarity
Search and then combined into one layer using tools within ArcGIS (union). This
analysis allowed the conditions existing at each presence location to be ranked against all
other cells in the country. It also limited the spatial bias incurred from only using
presence points (Hijmans 2012). Performing the analysis using this methodology allowed
for locations such as Mandera (upper northeast region of Kenya) to have a higher input
into the final analysis by incorporating more analysis points and visualizing results to
specific high and low risk areas throughout the country.
Results The average risk map (Figure 7) and the individually combined risk map (Figure
8) created with this Similarity Search method indicate that dengue risk is highest along
the coast and in the central areas of Kenya, which are home to nearly 15 million people.
These areas (indicated in red on the map) are the most cost-effective locations to target
for dengue prevention activities such as vector control.

61
Figure 7 - Risk map created using the averages of all 287 reference points comparing bioclimatic variables,
population density, and elevation.

62
Figure 8 - Risk map created using individual iterations of all 287 reference points comparing bioclimatic
variables, population density, and elevation.

63
In previous research, vector disease models determined human population density
as an essential factor in calculating risk (Moffett et al. 2007). Greater population density
equates to a higher risk of contracting disease. Outbreaks are more likely to be detected in
high population density areas and in those areas that are close to major hospitals as
opposed to rural areas that are far from health services.
The risk maps also show that the risk of dengue outbreaks is minimal in the
mountainous areas in the center and west of Kenya. Previous research has expressed this
concept in explaining a decrease for dengue risk in Colombia above 1,500 meters
(Hagenlocher et al. 2013), but our research found that elevation above 1,800 meters
limited dengue risk in Kenya. Determining the highest risk areas identifies the locations
where more centralized and focused dengue prevention and control activities efforts can
be prioritized in combating dengue.
Discussion This paper demonstrated the utility of the Similarity Search function for ranking
and visualizing locations with similar risk profiles. Using Similarity Search, we created a
risk profile for dengue fever in Kenya based on the environmental characteristics of a
small number of 1 km2 cells that were known to be at high risk of dengue. We then used
Similarity Search to identify other cells that are likely to have high dengue risk. Our
model incorporated data about human demography and health, mosquito distributions,
and a variety of social environmental factors to create a more complex and larger-scale
map of risk at the country level than has previously been possible.

64
The advantages of Similarity Search include the power that comes with defining a
target based on the average characteristics of hundreds of presence cells, the utilization of
a method previously confined to textual searches (Adelfio et al. 2011, Bayardo et al.
2007), the provision of greater flexibility in testing variables, and the ranking of the
attribute values to the target features by most similar to least similar. The main limitation
of Similarity Search is the lengthy computer processing time required for the completion
of the individual cell analysis (used to make the map shown in Figure 8). If a hierarchical
computer process method is not used, the analysis can take days to complete. The use of
an iterative process is often necessary to prevent the computer from running out of
memory but this has the disadvantage of again increasing the processing time.
Nevertheless, the high-resolution local analysis allowed by Similarity Search makes this a
useful tool for identifying the relationships between the attributes and the target feature.
The primary limitations for this model relate to the very incomplete surveillance
and mosquito data available for most cities, towns, and rural areas within Kenya and the
need for more frequent updates of the environmental data. Human health data are
dependent on the accurate diagnosis of dengue through testing, surveillance, and
dissemination of the data. A particular concern is that most case reports come from urban
areas where surveillance and reporting systems are more developed, thus skewing the
maps toward assuming higher risk in urban areas than is appropriate. Given the lack of
nationwide case finding efforts, absence of data about cases from much of the country
cannot be considered evidence of there being no cases in those regions. Mosquito habitats
vary due to climate change, making current data essential for accurate mapping and

65
reporting. The need for updated mosquito data will become especially important if global
climate changes alter the range of Aedes mosquitoes (Hales et al. 2002, Patz et al. 1998).
Global climate change may mean that environmental data quickly become inaccurate and
this will constrain the ability to predict vector borne disease hotspots based on similarity
searches and limited human health data. Ideally, environmental data must be updated
often enough to allow for adjustments to models based on floods, droughts, and
urbanization (or other patterns of human migration) and must exist at a sufficient scale
for use in both rural and urban areas. (For example, one risk factor for dengue is the
presence of standing water which has collected in old tires or small cans (WHO 2012),
and this is not captured by current databases nor by maps with a 1 km2 resolution.)
The effectiveness of these techniques highlights the value that this methodology
could bring to other applications both within and beyond public health. This kind of
Similarity Search could be used to determine areas of a city that are more vulnerable to
certain types of crime based on existing crime locations, for economic development by
benchmarking one city against its most similar counterparts (such as based on education,
taxes, population), to evaluate real estate trends and foreclosure risks, or to justify salaries
by looking at other areas with similar cost of living, amenities, size of household, and
more. Comparison of cities based upon social media preference (Seth et al. 2011), the
geographic locality of cuisine (Zhu et al. 2013), and calculating similarity between user-
generated information about locations (Scheffler et al. 2012) provide real world examples
utilizing cosine similarity mathematics. The prediction maps created with Similarity
Search can provide critical information for government officials, businesses,

66
epidemiologists, and others involved in planning and preparing for future events and
making decisions about resource dissemination and public outreach.
More specifically, the dengue risk maps we created for Kenya provide additional
information for Kenyan health officials and may point to parts of the country where
intensified dengue prevention and control activities may be most beneficial for public
health and, conversely, the regions where resources do not need to be deployed at this
time. The use of tools like Similarity Search to identify areas at high risk for vector borne
disease and other threats to health will increase the effectiveness of public health
interventions by allowing them to be more precisely targeted toward the populations that
will most benefit from them.

67
REFERENCES
Adelfio MD, Nutanong S, Samat H, 2011. Similarity search on a large collection of point
sets. In: GIS ‘11: Proceedings of the 19th ACM SIGSPATIAL International
Conference on Advances in Geographic Information Systems, Chicago, IL,
November 2011, 132-141.
Akhwale W, 2013. Dengue fever outbreak response: Kenya sets up sentinel surveillance
sites. Quarterly Bulletin: The East Africa Public Health Lab Network Newsletter -
June 2013. Available at: http://www.eaphln-ecsahc.org/kenya/?wpfb_dl=39
(accessed January 2014).
Awando JA, Ongus JR, Ouma C, Mwau M, 2013. Seroprevalence of Anti-Dengue Virus
2 Serocomplex Antibodies in out-patients with fever visiting selected hospitals in
rural parts of Western Kenya in 2010-2011: a cross sectional study. Pan Afr Med
J 16, 73.
Bayardo RJ, Ma Y, Srikant R, 2007. Scaling up all pairs similarity search. In Proceedings
of the 16th international conference on World Wide Web (WWW ’07), New
York, NY, 131-140.
Bhatt S, Gething PW, Brady OJ, Messina JP, Farlow AW, Moyes CL, Drake JM,
Brownstein JS, Hoen AG, Sankoh O, Myers MF, George DB, Jaenisch T, Wint
GRW, Simmons CP, Scott TW, Farrar JJ, Hay SI, 2013. The global distribution
and burden of dengue. Nature 496, 504-507.
Blaylock JM, Maranich A, Bauer K, Nyakoe N, Waitumbi J, Martinez LJ, Lynch J, 2011.
The seroprevalence and seroincidence of dengue virus infection in western
Kenya. Travel Med Infect Dis 9, 246-248.
Brady OJ, Gething PW, Bhatt S, Messina JP, Brownstein JS, Hoen AG, Moyes CL,
Farlow AW, Scott TW, Hay SI, 2012. Refining the global spatial limits of dengue
virus transmission by evidence-based consensus. PLoS Negl Trop Dis 6, e1760.
Bright EA, Coleman PR, Rose AN, Urban ML, 2012. LandScan 2011. Oak Ridge
National Laboratory, Oak Ridge, TN. Available at: http://www.ornl.gov/landscan/
(accessed on January 2014).

68
Esri, 2013a. ArcGIS Help 10.2 – Similarity Search. Redlands, CA: Environmental
Systems Research Institute. Available at:
http://resources.arcgis.com/en/help/main/10.2/index.html#/Similarity_Search/005
p0000005m000000/ (accessed on January 2014).
Esri, 2013b. ArcGIS Help 10.2 – How Similarity Search works. Redlands, CA:
Environmental Systems Research Institute. Available at:
http://resources.arcgis.com/en/help/main/10.2/index.html#//005p00000059000000
/ (accessed on January 2014).
Foley DH, Weitzman AL, Miller SE, Faran ME, Rueda LM, Wilkerson RC, 2008. The
value of georeferenced collection records for predicting patterns of mosquito
species richness and endemism in the Neotropics. Ecol Entomol 33, 12-23.
Foley DH, Wilkerson RC, Birney I, Harrison S, Christensen J, Rueda LM, 2010.
MosquitoMap and the Mal-area calculator: new web tools to relate mosquito
species distribution with vector borne disease. Int J Health Geogr 9, 11.
Foley DH, Wilkerson RC, Dornak LL, Pecor DB, Nyari AS, Rueda LM, Long LS,
Richardson JH, 2012. SandflyMap: leveraging spatial data on sand fly vector
distribution for disease risk assessments. Geospat Health 6, S25-30.
Franco L, Di Caro A, Carletti F, Vapalahti O, Renaudat C, Zeller H, Tenorio A, 2010.
Recent expansion of dengue virus serotype 3 in West Africa. Euro Surveill 15, 1-
4.
Global Administrative Areas, 2012. GADM database of Global Administrative Areas,
version 2.0. Available at: www.gadm.org (accessed on January 2014).
Gubler DJ, 2004. The changing epidemiology of yellow fever and dengue, 1900 to 2003:
full circle? Comp Immunol Microb 27, 319-330.
Guzman A, Istúriz RE, 2010. Update on the global spread of dengue. Int J Antimicrob Ag
36, S40-S42.
Hagenlocher M, Delmelle E, Casas I, Keinberger S, 2013. Assessing socioeconomic
vulnerability to dengue fever in Cali, Colombia: statistical vs expert-based
modeling. Int J Health Geogr 12, 36.
Hales S, de Wet N, Maindonald J, Woodward A, 2002. Potential effect of population and
climate changes on global distribution of dengue fever: an empirical model.
Lancet 360, 830-834.

69
Hassan H, Shohaimi S, Hasim NR, 2012. Risk mapping of dengue in Selangor and Kuala
Lumpur, Malaysia. Geospatial Health, 7, 21-25.
Hijmans RJ, Cameron SE, Parra JL, Jones PG, Jarvis A, 2005. Very high resolution
interpolated climate surfaces for global land areas. Int J Climatol 25, 1965-1978.
Hijmans RJ, 2012. Cross-validation of species distribution models: removing spatial
sorting bias and calibration with a null model. Ecology 93, 679-688.
Hutchinson MF, 1995. Interpolating mean rainfall using thin-plate smoothing splines. Int
J Geogr Inf Sci 9, 385-403.
Johnson BK, Ocheng D, Gichogo A, Okiro M, Libondo D, Kinyanjui P, Tukei PM,
1982a. Epidemic dengue fever caused by dengue type 2 in Kenya: preliminary
results of human urological and serological studies. East Afr Med J 59, 781-784.
Johnson BK, Musoke M, Ocheng D, Gighogo A, Rees PH, 1982b. Dengue-2 virus in
Kenya. Lancet 2(8291), 208-209.
Johnson BK, Okath F, Tukei PM, Mugambi M, Woody JN, Morrill JC, Hyams KC, 1990.
Dengue-2 virus in Kenya. Lancet 336, 1071.
Kenya Central Bureau of Statistics, 2005. Geographic dimensions of well-being in
Kenya: who and where are the poor? A constituency level profile – volume 2, The
Regal Press Kenya Ltd, 7-13 pp.
Mease LE, Coldren RL, Musila LA, Prosser T, Ogolla F, Ofula VO, Schoepp RJ, Rossi
CA, Adungo N, 2011. Seroprevalence and distribution of arboviral infections
among rural Kenyan adults: a cross-sectional study. Virol J 8, 371.
Moffett A, Shackelford N, Sarkar S, 2007. Malaria in Africa: vector species’ niche
models and relative risk maps. PLoS One 2, e824.
Nyari A, Foley DH, 2011. Aedes aegypti Nyari. Walter Reed Biosystematics Unit
(WRAIR, Division of Entomology) Suitland, MD. Available at:
http://www.mosquitomap.org/metadata.htm#vec31 (accessed on January 2014).
Patz JA, Martens WJM, Focks DA, Jetten TH, 1998. Dengue fever epidemic potential as
projected by general circulation models of global climate change. Environ Health
Perspect 106, 147–153.
ProMED-mail, 2011. Dengue/DHF update 2011 (39). 20111004.2985. Available at:
http://www.promedmail.org (accessed on January 2014).

70
ProMED-mail, 2013a. Dengue - Kenya (02): (Coastal). 20130325.311131. Available at:
http://www.promedmail.org (accessed on January 2014).
ProMED-mail, 2013b. Dengue - Kenya (03): (Coast). 20130428.1676860. Available at:
http://www.promedmail.org (accessed on January 2014).
ProMED-mail, 2013c. Dengue - Kenya: (North Eastern). 20130221.304287. Available at:
http://www.promedmail.org (accessed on January 2014).
ProMED-mail, 2013d.Dengue/DHF update (24): Asia, Africa. 20130325.1601484.
Available at: http://www.promedmail.org (accessed on January 2014).
ProMED-mail, 2013e. Dengue/DHF update (33): Asia, Africa, Pacific.
20130428.1676860. Available at: http://www.promedmail.org (accessed on
January 2014).
ProMED-mail, 2013f. Dengue/DHF update (16): Asia, Pacific, Africa.
20130225.1558046. Available at: http://www.promedmail.org (accessed on
January 2014).
Rogers DJ, 2006. Predicted probability occurrence for dengue: models for vectors and
vector-borne diseases. Adv Parasitol 62, 1-35.
Rogers DJ, Wilson AJ, Hay SI, Graham AJ, 2006. The global distribution of yellow fever
and dengue. Adv Parasitol 62, 181-220.
Sang RC, 2007. Dengue in Africa. In: Report of the scientific working group meeting on
dengue. Geneva, October 1-5, 2006. WHO Special Programme for Research and
Training in Tropical Diseases; 2007, 50-52.
Sang RC, Dunster LM, 2001. The growing threat of arbovirus transmission and outbreaks
in Kenya: a review. East Afr Med J 78, 655-661.
Scheffler T, Schirru R, Lehmann P, 2012. Matching points of interest from different
social networking sites, KI 2012: Advances in Artificial Intelligence, Springer
Berlin Heidelberg, 245-248 pp.
Seth R, Covell M, Ravichandran D, Sivakumar D, Baluja S, 2011. A tale of two (similar)
cities: inferring city similarity through geo–spatial query log analysis. In:
Proceedings of the International Conference on Knowledge Discovery and
Information Retrieval. Paris, 26-29 October, 2011. KDIR; 2011, 179-189.
Simmons CP, Farrar JJ, Chau N, Wills B, 2012. Dengue. N Engl J Med 366, 1423-1432.

71
Sutherland LJ, Cash AA, Huang YJS, Sang RC, Malhotra I, Moormann AM, King CL,
Weaver SC, King CH, LaBeaud AD, 2011. Serologic evidence of arboviral
infections among humans in Kenya. Am J Trop Med Hyg 85, 158-161.
World Health Organization, 2012. Global strategy for dengue prevention and control
2012-2020, WHO Press, V-30 pp.
Zhu YX, Huang J, Zhang ZK, Zhang QM, Zhou T, Ahn YY, 2013. Geography and
Similarity of Regional Cuisines in China. PLoS ONE 8, e79161.

72
CHAPTER FOUR3 : SUSCEPTIBILITY ANALYSIS
Abstract
The goal of this paper is to create a more accurate, robust, and localized (1 km x 1 km)
dengue risk map for Africa based on bioclimatic layers, elevation data, high-resolution
population data, and other environmental factors that a search of the peer-reviewed
literature showed to be associated with dengue risk. We apply a newly-available add-in
called ArcGIS Predictive Analysis Toolset (PAT) to identify locations within Africa with
environmental characteristics that the literature suggest will be susceptible to dengue
transmission. We compare the results of the PAT analysis to case reports of dengue from
across the African continent. Our new, localized analysis of dengue risk provides
valuable new information for public health officials and others making decisions about
where to increase disease surveillance activities and implement dengue prevention and
control efforts. PAT and other adaptable methodologies for mapping emerging disease
risks will allow these baseline dengue maps to be updated as climate changes occur.
Keywords
dengue; geographic information systems; risk mapping; developing countries; medical
geography; Africa
3 Attaway DF, Jacobsen KH, Falconer A, Manca G, Waters NM. 2014 (in review). Risk analysis for dengue
susceptibility in Africa using the ArcGIS Predictive Analysis Tool (PAT).

73
Introduction
With global average temperatures projected to increase between 1.4 and 5.8 °C by
the end of this century (Intergovernmental Panel on Climate Change 2001), an efficient
method for modeling how these changes will affect human disease susceptibility is
needed (Houghton et al. 2001). In this paper, we examine the climate factors that predict
the presence of dengue fever in Africa. The incidence of dengue is known to be
underestimated in African countries, where viral testing capacity is limited and data
reporting and surveillance systems are sparse (Amarasinghe et al. 2011, Bhatt et al. 2013,
Brady et al. 2012, Franco et al. 2010, Sessions et al. 2013), so there is a need for
improved maps of dengue risk in this region.
Dengue fever is thought to be the most rapidly spreading mosquito-borne viral
disease in the world (WHO, 2012). In the last 50 years, the incidence of dengue has
increased 30-fold (WHO, 2012). In the past decade, the range of the disease has
expanded to new countries and been found across a range of urban and rural settings.
Although outbreaks of dengue in Africa have been reported, data on baseline incidence
and prevalence rates are not readily available for the region (Amarasinghe et al. 2011).
The specific goal of this paper is to create a more accurate, robust, and localized
analysis (1 km x 1 km) of dengue risk mapping in Africa based on bioclimatic layers,
elevation data, high-resolution population data, and other environmental factors that our
search of the peer-reviewed literature showed to be associated with dengue risk (Table 7).

74
Table 7 - Peer reviewed literature documenting environmental constraints for dengue.
Category Evidence Location Source High Risk
Parameters E
lev
ati
on
&
La
nd
cov
er Anything above 1500 meters limits dengue Brazil
Hagenlocher et al.
2013 ALT ≤ 1800
AND
(11 ≤ GLC ≤ 190
OR
WBD ≤ 200km)
Ae. aegypti mosquitoes were abundant at
elevations up to 1300 m, moderately
abundant from 1300 to 1700 m, and still
present but rare from 1700 to 2150 m
Mexico Lozano-Fuentes et
al. 2012
Po
pu
lati
o
n D
ensi
ty Dengue fever is characterized by high human
population densities more or less wherever it
occurs
Global Rogers et al. 2014
POP > 0
Population density in itself is a good measure
of risk. Malaysia Hassan et al. 2012
Pre
cip
ita
tio
n
Greater amounts of precipitation are
associated with higher dengue infection risk Thailand
Wiwanitkit 2006,
Heng et al. 1998
BIO12 ≥ 55mm,
BIO13 > 0,
BIO14 > .2mm,
BIO16> 0, BIO17
> 0, AND BIO19
> 0
High volume of rainfall increases Aedes
survival by providing more breeding sites. Malaysia Hassan et al. 2012
Tem
per
atu
re
Infertile eggs at 10 degrees Celsius Laboratory
Test Turrell and
Lundstrom 1990
MinTemp ≥ 10
°C AND
MaxTemp ≤ 30
°C
Ae. aegypti needs a winter isotherm higher
than 10°C for its survival Global Halstead 2008
Ae. aegypti are capable of transmitting virus
under laboratory conditions after incubation
at temperatures as low as 13°C
Laboratory
Test McLean et al. 1975, Watts et al. 1987
Temperature around an intermediate mean
(26°C) can alter life-history traits, population
dynamics, and the ability of a mosquito to
become infected with and transmit dengue
virus (DENV)
Laboratory
Test McLean et al. 1974,
Watts et al. 1987
Lower temperatures generally extend the
duration of Extrinsic incubation period (EIP)
Laboratory
Test
Rohani et al. 2009,
Watts et al. 1987,
and Turrell et al. 1990
Ae. aegypti vector competence for DENV has
been detected up to a maximum of 35°C Thailand Watts et al. 1987
Adult reproductive function is impaired in
the high 30°s with adult Ae. aegypti survival
declining as temperature continues to rise
Australia,
Laboratory
Test
Tun-Lin et al. 2000,
Carrington et al.
2013
The variables ‘minimum temperature of the
coldest month’ and ‘mean temperature of the
coldest quarter’ were the most important
variables for modeling dengue.
Mexico Machado-Machado et al. 2012.
Extrinsic incubation period (EIP) of the
dengue virus decreases at temperatures
between 30 and 35°C in the mosquito
Laboratory
Test McLean et al. 1974, Watts et al. 1987
Higher temperatures are associated with
higher dengue incidence in humans
Peru,
Singapore,
India
Chowell et al. 2011,
Pinto et al. 2011, Raheel et al. 2011
Occurrence of dengue in Aedes at
temperatures above 18-20°C
Peru,
U.S.A. Chowell et al. 2011,
Mclean et al. 1974
Biological model for suitability of dengue
virus transmission across intraannual
temperature cycles.
Global Gething et al. 2011 and Bhatt et al.
2013

75
The key analytical method used in this paper is the ArcGIS Predictive Analysis Tools
(PAT) function, which incorporates adaptable analysis within the geographic user
interface (GUI) and therefore allows immediate visualizations of how various climate and
other inputs affect the susceptibility model (Esri, 2014). Improved visualizations of the
risk areas for dengue will enable public health officials and policymakers to identify
high-risk areas and allow for the most efficient use of dengue prevention and control
resources. PAT could be applied to a variety of infectious diseases and world regions, but
in this paper we use dengue in Africa as a way to highlight the tool’s utility.
Data Sources
After reviewing the dengue literature (Table 7), we identified a need to acquire a
variety of spatial data, population density data, environmental data (including bioclimatic
layers, land cover data, and water bodies data), and disease data. The sources of the data
used in our model are specified below. Table 8 summarizes the various layers included in
the model.
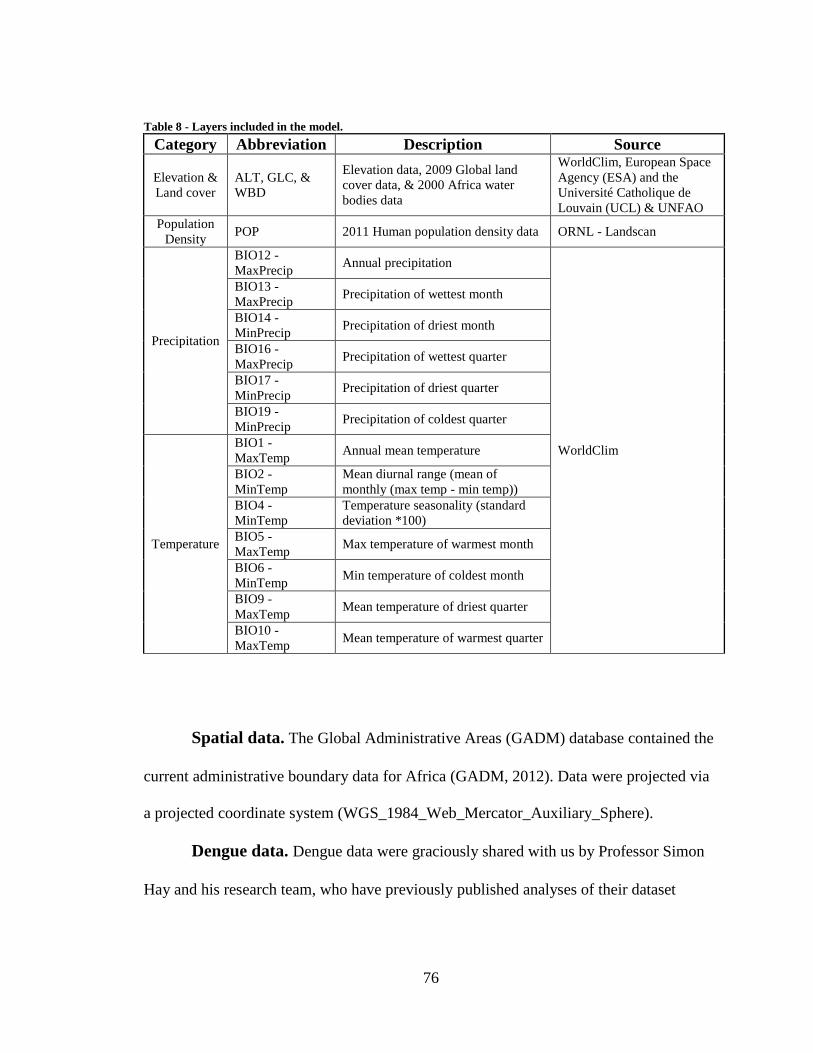
76
Table 8 - Layers included in the model.
Category Abbreviation Description Source
Elevation &
Land cover
ALT, GLC, &
WBD
Elevation data, 2009 Global land
cover data, & 2000 Africa water
bodies data
WorldClim, European Space
Agency (ESA) and the
Université Catholique de
Louvain (UCL) & UNFAO
Population
Density POP 2011 Human population density data ORNL - Landscan
Precipitation
BIO12 -
MaxPrecip Annual precipitation
WorldClim
BIO13 -
MaxPrecip Precipitation of wettest month
BIO14 -
MinPrecip Precipitation of driest month
BIO16 -
MaxPrecip Precipitation of wettest quarter
BIO17 -
MinPrecip Precipitation of driest quarter
BIO19 -
MinPrecip Precipitation of coldest quarter
Temperature
BIO1 -
MaxTemp Annual mean temperature
BIO2 -
MinTemp
Mean diurnal range (mean of
monthly (max temp - min temp))
BIO4 -
MinTemp
Temperature seasonality (standard
deviation *100)
BIO5 -
MaxTemp Max temperature of warmest month
BIO6 -
MinTemp Min temperature of coldest month
BIO9 -
MaxTemp Mean temperature of driest quarter
BIO10 -
MaxTemp Mean temperature of warmest quarter
Spatial data. The Global Administrative Areas (GADM) database contained the
current administrative boundary data for Africa (GADM, 2012). Data were projected via
a projected coordinate system (WGS_1984_Web_Mercator_Auxiliary_Sphere).
Dengue data. Dengue data were graciously shared with us by Professor Simon
Hay and his research team, who have previously published analyses of their dataset
77
(Bhatt et al. 2013a). These 360 cases from Africa were identified through searches of
online databases, including PubMed, ISI Web of Science, and PROMED, and HealthMap
(Bhatt et al. 2013b). Data were current as of 2012 and were vetted through a rigorous
quality control assessment (Bhatt et al. 2013b). In order to make our maps comparable to
the earlier visualizations created by the Hay group, we restricted our case data to only
those points shared by the Hay research team.
Population density data. The accuracy of human infection susceptibility
estimates is dependent on accurate human population density data (Bhatt et al. 2013,
Hassan et al. 2012, Moffett et al. 2007, Rogers et al. 2006). The LandScan 2011 Global
Population Database contains high-resolution (1 km x 1 km) population density data
developed by Oak Ridge National Laboratory (ORNL) for the United States Department
of Defense (DoD) (Bright et al. 2011).
Elevation data. The WorldClim Elevation database contains high-resolution (1
km x 1 km) environmental information (Hijmans et al. 2005). Previous studies have
suggested that dengue transmission is limited above 1700 meters (Lozano-Fuentes et al.
2012).
Land cover data. A raster version of the GlobCover land cover map produced
for the year 2009 was obtained from the European Space Agency (ESA) and the
Université Catholique de Louvain (UCL) (Bontemps et al. 2010). The dataset, a 300 m
global land cover map produced from an automated classification of the medium
resolution imaging spectrometer and full resolution time series (MERIS FR), includes 22
global classes within the raster dataset (Bontemps et al. 2011, Bontemps et al. 2010).

78
Bioclimatic layers data. The WorldClim Bioclimatic variables database
provided the temperature and rainfall parameters for the model. These were selected from
previous scientific studies of mosquito distribution and dengue transmission (Bhatt et al.
2013, Brady et al. 2012, Hijmans et al. 2005, Rogers et al. 2014, Rogers 2006, Rogers et
al. 2006, Simmons et al. 2012).
Water Bodies data. The United Nations’ Food and Agriculture Organization
(FAO) database contained water body vector information at a scale of 1:1000000 and
current as of 2000 (Gassert et al. 2013, Jenness et al. 2007, Hoogeveen 2000). This
dataset was cross-referenced with the GlobCover 2009 dataset for consistency with
classifications.
Analysis
As a first step toward identifying areas susceptible to dengue, we evaluated the
variables known to be associated with dengue risk, and used a search of the literature to
identify parameters for a dengue model (Table 7). For example, temperature parameters
were set to the minimum and maximum thresholds established by published literature, 10
°C and 30 °C (Carrington et al. 2013, Halstead 2008, Tun-Lin et al. 2000, Turrell and
Lundstrom 1990). Similar restrictions were set for elevation, population density, and
precipitation.
The Query Expression Editor within PAT allowed us to find locations where zero
to four of the four key environmental risks for dengue were true for a group of single-
band rasters (Equation 3).

79
Equation 3 - Query Expression Editor Equation
𝑄𝑢𝑒𝑟𝑦 𝐸𝑥𝑝𝑟𝑒𝑠𝑠𝑖𝑜𝑛 𝐸𝑞𝑢𝑎𝑡𝑖𝑜𝑛 = ((𝑌1 (𝐻𝑅𝑃1) + 𝑌2 (𝐻𝑅𝑃2) + 𝑌3 (𝐻𝑅𝑃3) + 𝑌4 (𝐻𝑅𝑃4))
Y = raster datasets for four high risk parameters
HRP = Four High Risk Parameters from Table 7
Highly susceptible = All 4 parameters
Somewhat susceptible = 3 parameters
Limited susceptibility = 2 parameters
Highly unsusceptible = 1 parameter
Not susceptible = 0 parameters
To confirm the relevance of these parameters to dengue risk, we calculated the
proportion of the 360 case data points from Professor Simon Hay and his colleagues that
were captured by each layer of the map (Figure 9) and by combinations of map layers
(Figure 10).

80
Figure 9 - Susceptibility models run for various univariate variables.

81
Figure 10 - Susceptibility models run for various bivariate variables.
The results of these calculations are presented in Table 9. These analyses were
made using tools within ArcGIS PAT. The Query Factor Input Table (QFit) generates a
predictive analysis query using a set of input data points and a set of raster datasets. The
QFit tool allows the user to take a set of observations, such as dengue occurrence points,
and then compare these observations to a group of rasters to determine what values are
characteristic of these points (Equation 4) (Esri, 2014).

82
Table 9 - Proportion of the 360 cases captured by various layers in the GIS.
Factor Parameters Count Total Percentage
Included
UNIVARIATE MODELS Elevation ALT ≤ 1800 (meters) 346 360 96%
Minimum Temperature MinTemp ≥ 100 (10° C) 341 360 95%
Maximum Temperature MaxTemp ≤ 300 (30° C) 297 360 83%
Max Precipitation Average BIO13 > 0, BIO16> 0, AND BIO12 ≥ 550 (55mm) 208 360 58%
Min Precipitation Average BIO14 > 20 (.2mm) AND BIO17 > 0 78 360 22%
Human Population Density* POP > 0 308 337 91%
Land Cover (2009) GLC ≥ 11 (Irrigated Crops) AND GLC ≤ 190
(Artificial areas) 306 360 85%
Distance from Water** WBD ≤ 200km 147 301 49%
BIVARIATE MODELS
Elevation AND Min Temp ALT ≤ 1800 (meters) AND MinTemp ≥ 10° C 341 360 95%
Min Temp AND Population* MinTemp ≥ 10° C AND POP > 0 290 337 86%
Elevation AND Max Temp ALT ≤ 1800 (meters) AND MaxTemp ≤ 30° C 297 360 83%
Land Cover AND
Population*
GLC ≥ 11 (Irrigated Crops) AND GLC ≤ 190
(Artificial areas) AND POP > 0 268 337 80%
Max Temp AND Human
Population Density* MaxTemp ≤ 30° C AND POP > 0 258 337 77%
Land Cover AND Min Temp GLC ≥ 11 (Irrigated Crops) AND GLC ≤ 190
(Artificial areas) AND MinTemp ≥ 10° C 265 360 74%
Elevation AND Population* ALT ≤ 1800 (meters) AND POP > 0 233 337 69%
Land Cover AND Max Temp GLC ≥ 11 (Irrigated Crops) AND GLC ≤ 190
(Artificial areas) AND Max Temp ≤ 300 (30° C) 233 360 65%
Elevation AND Max
Precipitation
ALT ≤ 1800 (meters) AND MaxPrecip Avg
Parameters 213 360 59%
Min Temp AND Max Precip MinTemp ≥ 10° C AND MaxPrecip Avg Parameters 207 360 58%
Elevation AND Precip (Max
OR Min)
ALT ≤ 1800 (meters) AND MaxPrecip Avg
Parameters OR MinPrecip Avg Parameters 206 360 57%
Land Cover AND Max
Precipitation
GLC ≥ 11 (Irrigated Crops) AND GLC ≤ 190
(Artificial areas) AND MaxPrecip Avg Parameters 201 360 56%
Max Temp AND Max Precip MaxTemp ≤ 30° C AND MaxPrecip Avg Parameters 183 360 51%
MinTemp AND MinPrecip MinTemp ≥ 10° C AND MinPrecip Avg Parameters 80 360 22%
Land Cover AND Min
Precipitation
GLC ≥ 11 (Irrigated Crops) AND GLC ≤ 190
(Artificial areas) AND MinPrecip Avg Parameters 80 360 22%
Elevation AND Min
Precipitation
ALT ≤ 1800 (meters) AND MinPrecip Avg
Parameters 70 360 19%
Max Temp AND Min Precip MaxTemp ≤ 30° C AND MinPrecip Avg Parameters 49 360 14%
*Points falling in Jeddah, Saudi Arabia, fell outside the AOI for Population Density Data for Africa (23 points were removed)
**Only water bodies for Africa were calculated with this analysis (59 points falling outside Africa were removed) *** Points within the Bhatt dataset were not completely the same as points collected in the all variables and parameters w/ 3km buffer.
Model was calculated utilizing the Query Factor Input Table (QFit) which generates a predictive analysis query using a set of input
data points and a set of raster datasets. Temperature parameters were set to the min and max thresholds established by published literature (10° C and 30° C)

83
Equation 4 - Query Factor Input Table (QFit) Equation:
𝑄𝐹𝑖𝑡 𝐸𝑞𝑢𝑎𝑡𝑖𝑜𝑛 = 𝑍(𝑋(𝑛 = 360) ∶ 𝑌1 – 𝑌15))
Z = Final results from running model with all 15 variables listed in Table 8
X = Dengue case data (n = 360 dengue data points)
Yn = Layers included in model
Since we already knew the values for the various environmental factors that were
most important in determining the location with high risk of dengue (Table 7), we
manually constructed the query and then applied it to our rasters to see which locations
satisfied those conditions. The use of an adaptable raster format allows for greater
efficiency in computer processing of the models as well as for easy dissemination of
results. Model specifications are saved in xml format, which limits the file size and
enables easier loading of queries and sharing of analytic workflows.
One of the key advantages to using PAT is the greater efficiency in processing
which occurs from only one raster layer being adaptively processed at a time. PAT does
not change the pixels of the original raster datasets; it only modifies a single function
raster dataset, which can be saved as an .afr file (A function raster dataset, when saved to
a file (.afr), defines the processing to be performed on a dataset (Esri, 2014).) This
increases the flexibility of the model when new case data are added as inputs, as might
occur when mapping an outbreak, and when a model is run numerous times with
modified parameters. More importantly, this method limits the amount of memory
required to complete the analysis. Before the PAT tool was created, this analysis required
the researcher to process each and every individual layer for each specification separately

84
and then to use time, computer resources, and data space to combine all layers into one
single analysis layer. The researcher would then have to export each iteration that
occurred using different variables. For example, if the researcher wanted to calculate the
difference between elevation and temperature datasets, the analyst would have to perform
the calculations and then export the results, run statistics on the data, and recalculate the
susceptibility. PAT speeds up this processing, even on older computers, by using QFit
and the Query Expression Editor to quickly and efficiently visualize the effects of various
model inputs.
The dengue susceptibility analysis in this paper uses PAT to demonstrate how
different variables contribute to predictions of dengue risk. This analytic approach limits
the spatial bias that results from only using presence points as the basis for susceptibility,
but also uses previous research data to validate the model outputs. Emerging infections
like dengue highlight the need for more efficient, quicker, and cheaper processing of
health risks. Susceptibility mapping provides entomological, epidemiological, and
geographical researchers with an opportunity to increase their analytic efficiency.
Results
We used the risk factors identified in published literature to assign risk values to
various parameters (Table 7). For example, we assumed that places with low
temperatures below 10°C (BIO6) and places with high temperatures above 30°C (BIO1,
BIO5, BIO9, and BIO10) were considered to have very low risk of dengue. We
confirmed that these environmentally high-risk areas were conducive to dengue

85
transmission by evaluating how many of the 360 case points from the Hay research group
were captured within high risk areas (Table 9).
Figure 11 shows the map that was created by mapping all areas where one or
more of the risk factors from Table 7—elevation, population density, temperature, or
precipitation—were present. Dark red areas mark 1 km x 1 km squares where all four
parameters were present, indicating high susceptibility for dengue outbreaks. Light red
shows places where three of the parameters were present: elevation, population density,
and temperature. Yellow identifies locations where elevation and temperature criteria
were met. Blue areas met the elevation criteria. Dark blue shows locations where none of
the four high risk parameters exist.
Figure 12 shows a map that compares the high risk (dark red) areas from Figure
11, which were identified by PAT using environmental data only, with a layer created
from the dengue case data from Professor Hay (shown in blue in Figure 12). The blue
areas in Figure 12 were mapped by using the QFit Modeler to identify areas with
elevation, population density, temperature, and precipitation data similar to the values
found at the locations of the 360 dengue cases. In short, the QFit Modeler captures not
only the dengue points but also those points that have the same environmental
characteristics as the places where dengue has been observed. The QFit model captured
86% of the dengue case data. (The model did not capture 100% of the points because
locations within Chad, Mali, Saudi Arabia, Sudan, Northern Somalia, and Yemen
represented anomalies where locations did not fulfill the high risk parameters in Table 7.)
The PAT susceptibility risk analysis based on environmental parameters (in red) captured

86
83% of the cases from the original dataset from Professor Hay when using a 3km search
distance and 67% of the cases with no search radius.
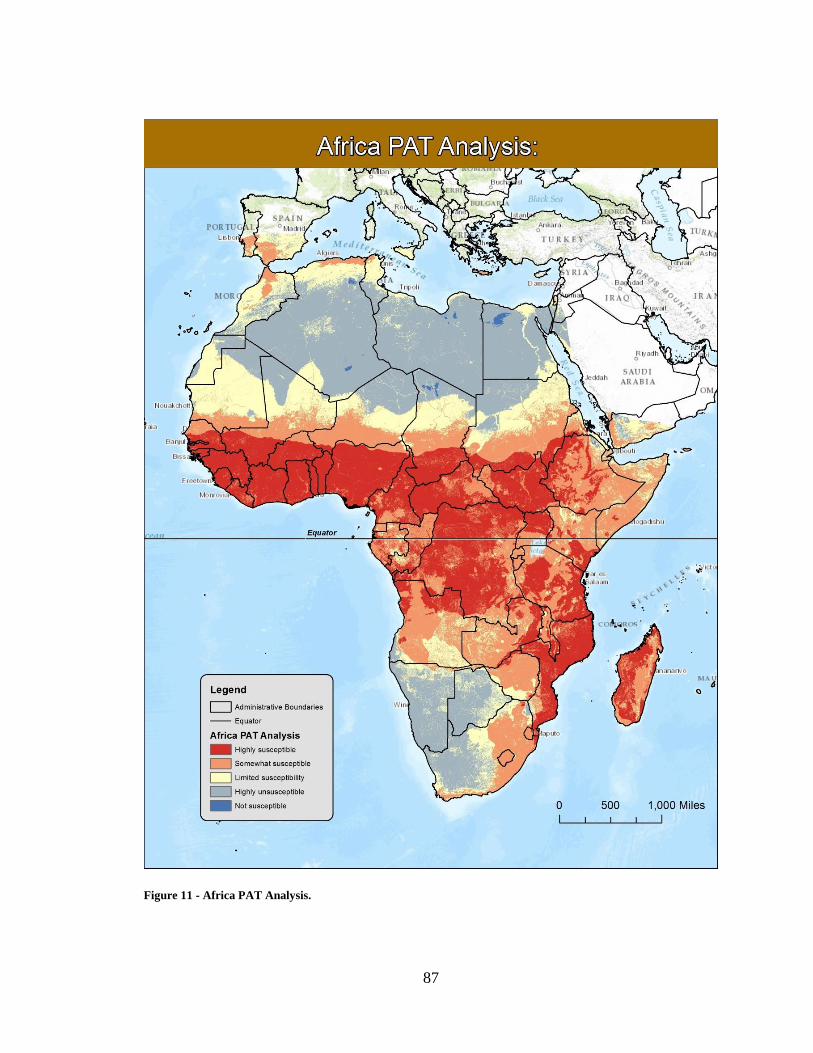
87
Figure 11 - Africa PAT Analysis.

88
Figure 12 - Comparison of two PAT models run for dengue susceptibility in Africa.

89
Human population density at a localized scale is a crucial variable for disease
susceptibility modeling (Bhatt et al. 2013, Hassan et al. 2012, Moffett et al. 2007, Rogers
et al. 2006). We found that, after considering the environmental parameters for the
infection, higher population density is associated with a higher susceptibility to dengue.
Our model incorporated a more localized population density analysis than previous
studies (Bhatt et al. 2013, Brady et al. 2012, Rogers et al. 2014, Simmons et al. 2012).
We found that cases are more likely to be identified in high-density population centers
than those located far from health services. This finding may be due in part to urban cases
of dengue being more likely to be diagnosed and reported than rural cases. However, this
finding is consistent with other studies of dengue around the world, as noted in our
literature search.
Our PAT risk map also found additional locations, such as Luanda, Angola, which are
susceptible environments for dengue outbreaks. Dengue cases from Angola were not
included in the data from Professor Hay that were compiled through the end of 2012, so
no Angolan cases were included in our QFit risk model. However, the PAT risk map
accurately predicted that Luanda was a susceptible dengue habitat: an outbreak in Angola
occurred from April to June 2013 (Sessions et al. 2013). We can therefore confirm that
high susceptibility areas could be located using PAT even without nearby occurrence
points. We also identified other isolated locations that could be high risk areas for
dengue, such as:
Central African Republic near Bangui and near the western border adjacent to Cameroon

90
Democratic Republic of Congo (DRC) along the border between South Sudan and the
south west border neighboring Angola
the northwestern portion of Ethiopia along the border between Sudan and South Sudan
Kenya along one isolated location adjacent to the northern border between Ethiopia and
near the coastal areas of Mombasa, Malindi, and Kilifi.
portions of the countries Liberia and Sierra Leone
South Sudan near Juba and along the border between Uganda and the DRC
Tanzania along the coast near Dar es Salaam and continuing sporadically in isolated
locations along the coast to Mozambique
The identification of potential hotspots allows for proactive disease prevention and
control measures to be implemented before outbreaks occur. As environmental conditions
change, re-running the PAT model with revised inputs will provide critical predictions of
additional locations that have become susceptible environments for dengue fever. (It will
also be important to update the high-risk values in Table 7 to refine the mapping
parameters as new risk factor data become available.)
Discussion
Our new maps extend the analyses of dengue risk previously published for Africa
(Bhatt et al. 2013), and incorporate additional parameters for predicting the locations
where dengue susceptibility is highest. This localized high-resolution analysis for Africa
provides a more detailed map of dengue risk than previous studies that focused on global
scale analyses (Bhatt et al. 2013, Brady et al. 2012, Rogers 2006, Rogers et al. 2006,
Rogers et al. 2014, Simmons et al. 2012). The places shown in red in Figures 12 and 13

91
are the locations currently at highest risk of dengue, and are therefore the sites where
dengue prevention activities such as vector control and public health education will be
most cost-effective. The maps will need to be updated as new climate data become
available and as more dengue case reports are compiled.
The adaptable analysis incorporated within this paper demonstrates how more
localized and useful disease risk maps can be efficiently created with PAT. The dengue
susceptibility maps produced using PAT and presented in this paper used a variety of
spatial data and risk factor information from the peer-reviewed literature to provide a
more detailed assessment of the places in Africa that are likely to have the highest risk for
dengue fever. PAT allowed us to efficiently, quickly, and inexpensively create new maps
of dengue risk that can be used for planning public health interventions. This type of
dengue risk analysis provides the localized predictions necessary for various
governmental entities (both local and national) to make informed decisions about where
to focus their disease prevention and control efforts and where to step up health
surveillance activities. The PAT methodology demonstrated here also provides a baseline
model of dengue range that can be updated with PAT as new environmental, population,
and health data become available. Adaptable methodologies for mapping emerging
disease risks will be vital as global climate changes occur.

92
REFERENCES
Amarasinghe A, Kuritsky, JN, Letson GW, Margolis HS. (2011). Dengue virus infection
in Africa. Emerg Infect Dis, 17(8):1349-1354.
Bhatt S, Gething PW, Brady OJ, Messina JP, Farlow AW, Moyes CL, Drake JM,
Brownstein JS, Hoen AG, Sankoh O, Myers MF, George DB, Jaenisch T, Wint
GRW, Simmons CP, Scott TW, Farrar JJ, Hay SI. (2013a). The global distribution
and burden of dengue. Nature, 496:1-5.
Bhatt S, Gething PW, Brady OJ, Messina JP, Farlow AW, Moyes CL, Drake JM,
Brownstein JS, Hoen AG, Sankoh O, Myers MF, George DB, Jaenisch T, Wint
GRW, Simmons CP, Scott TW, Farrar JJ, Hay SI. (2013b). The global
distribution and burden of dengue – supplementary information. Nature, 496:3-81.
Bontemps S, Defourny P, Bogaert EV, Arino O, Kalogirou V, Perez JR. (2011).
Globcover 2009 - Products description and validation report (February 2011).
UCLouvain & ESA Team. Available at:
http://due.esrin.esa.int/globcover/LandCover2009/GLOBCOVER2009_Validatio
n_Report_2.2.pdf on 20 February 2014 (accessed 6 March 2014).
Bontemps S, Bogaert EV, Defourny P, Kalogirou V, Arino O. (2010). GlobCover 2009 –
Products description manual, version 1.0, December 2010. Available at:
http://ionia1.esrin.esa.int/ (accessed 6 March 2014).
Brady OJ, Gething PW, Bhatt S, Messina JP, Brownstein JS, Hoen AG, Moyes CL,
Farlow AW, Scott TW, Hay SI. (2012) Refining the global spatial limits of
dengue virus transmission by evidence-based consensus. PLoS Negl Trop Dis,
6(8):e1760.
Bright EA, Coleman PR, Rose AN, Urban ML. (2012). LandScan 2011. Oak Ridge
National Laboratory, Oak Ridge, TN. Available at: http://www.ornl.gov/landscan/
(accessed 6 March 2014).
Carrington LB, Armijos MV, Lambrechts L, Barker CM, Scott TW. (2013). Fluctuating
temperatures at critical thermal extremes: how selected life-history trait estimates
change in Aedes aegypti. PLoS ONE, 8:e58824.

93
Chowell G, Cazelles B, Broutin H, Munayco CV. (2011). The influence of geographic
and climate factors on the timing of dengue epidemics in Peru, 1994–2008. BMC
Infect Dis, 11:164.
Esri, 2014. ArcGIS Predictive Analysis Tools. Redlands, CA: Environmental Systems
Research Institute. Available at:
http://www.arcgis.com/home/item.html?id=90d9d9e8bb9e4228b75ec73ea394f5e
4 (accessed 18 March 2014).
Gassert F, Luck M, Landis M, Reig P, Shiao T. (2013). Aqueduct Global Maps 2.0.
working paper. Washington, DC: World Resources Institute. Available at:
http://wri.org/publication/aqueduct-global-maps-20 (accessed on 18 March 2014).
Gething PW, Van Boeckel TP, Smith DL, Guerra CA, Patil AP, Snow RW, Hay SI.
(2011). Modelling the global constraints of temperature on transmission of
Plasmodium falciparum and P. vivax. Parasite Vector, 4:92-102.
Hagenlocher M, Delmelle E, Casas I, Keinberger S. (2013). Assessing socioeconomic
vulnerability to dengue fever in Cali, Colombia: statistical vs expert-based
modeling. Int J Health Geogr, 12:36.
Halstead SB. (2008). Epidemiology. In: Halstead SB, editor. Dengue - tropical medicine
science and practice. London: Imperial College Press, 75-110pp.
Hassan H, Shohaimi S, Hasim NR. (2012). Risk mapping of dengue in Selangor and
Kuala Lumpur, Malaysia. Geospatial Health, 7(1):21-25.
Heng B, Goh K, Neo K. (1998). Environmental temperature, Aedes aegypti house index
and rainfall as predictors of annual epidemics of dengue fever and dengue
haemorrhagic fever in Singapore. In: Dengue in Singapore Technical Monograph
Series No 2 (ed. KT Goh) Institute of Environmental Epidemiology, Ministry of
the Environment, Singapore, 139-149pp.
Hijmans RJ, Cameron SE, Parra JL, Jones PG, Jarvis A. (2005). Very high resolution
interpolated climate surfaces for global land areas. Int J Climatol, 25:1965-1978.
Hoogeveen J. 2000. Inland water bodies in Africa. First Edition. FAO-UN-AGLW. Last
updated 31 May 2002. Available at:
http://www.fao.org/geonetwork/srv/en/metadata.show?id=281&currTab=summar
y (accessed March 2014).
Houghton JT, Ding Y, Griggs DJ, Noguer M, van der Linden PJ, Dai X, Maskell K,
Johnson CA (eds.). (2001). IPCC Climate Change 2001: the scientific basis. New
York: Cambridge University Press, 881pp.

94
Jenness J, Dooley J, Aguilar-Manjarrez J, Riva C. (2007). African Water Resource
Database. GIS-based tools for inland aquatic resource management. 2. Technical
manual and workbook. CIFA Technical Paper, 33(2). Rome, FAO, 308pp.
Lozano-Fuentes S, Hayden MH, Welsh-Rodriguez C, Ochoa-Martinez C, Tapia-Santos
B, Kobylinski KC, Uejio CK, Zielinski-Gutierrez E, Delle Monache L, Monaghan
AJ, Steinhoff DF, Eisen L. (2012). The dengue virus mosquito vector Aedes
aegypti at high elevation in Mexico. Am J Trop Med Hyg, 87:902-909.
Machado-Machado EA. (2012). Empirical mapping of suitability to dengue fever in
Mexico using species distribution modeling. Appl Geogr, 33:82-93.
McLean DM, Miller MA, Grass PN. (1975). Dengue virus transmission by mosquitoes
incubated at low temperatures. Mosq News, 35: 322-327.
McLean DM, Clarke AM, Coleman JC, Montalbetti CA, Skidmore AG, Walters TE,
Wise R. (1974). Vector capability of Aedes aegypti mosquitoes for California
encephalitis and dengue viruses at various temperatures. Can J Microbiol, 20:255-
262.
Moffett A, Shackelford N, Sarkar S. (2007). Malaria in Africa: vector species’ niche
models and relative risk maps. PLoS One, 2:e824.
Pinto E, Coelho M, Oliver L, Massad E. (2011). The influence of climate variables on
dengue in Singapore. Int J Environ Health Res, 21:415-426.
Raheel U, Faheem M, Riaz M, Kanwal N, Javed F, Zaidi N, Qadri I. (2011). Dengue
fever in the Indian subcontinent: an overview. J Infect Dev Countries, 5(04):239-
247.
Rogers DJ, Suk JE, Semenza JC. (2014). Using global maps to predict the risk of dengue
in Europe. Acta Trop, 129:1-14.
Rogers DJ. (2006). Predicted probability occurrence for dengue: models for vectors and
vector-borne diseases. Adv Parasitol, 62:1-35.
Rogers DJ, Wilson AJ, Hay SI, Graham AJ. (2006). The global distribution of yellow
fever and dengue. Adv Parasitol, 62:181-220.
Rohani A, Wong YC, Zamre I, Lee HL, Zurainee MN. (2009). The effect of extrinsic
incubation temperature on development of dengue serotype 2 and 4 viruses in
Aedes aegypti (L.). Southeast Asian J Trop Med, 40:942-950.

95
Sessions OM, Khan K, Hou Y, Meltzer E, Quan M, Schwartz E, Gubler DJ, Wilder-
Smith A. (2013). Exploring the origin and potential for spread of the 2013 dengue
outbreak in Luanda, Angola. Glob Health Action, 6:21822.
Simmons CP, Farrar JJ, van Vinh Chau N, Wills B. (2012). Dengue. N Engl J Med,
366:1423-1432.
Tun-Lin W, Burkot TR, Kay BH. (2000). Effects of temperature and larval diet on
development rates and survival of the dengue vector Aedes aegypti in north
Queensland Australia. Med Vet Entomol, 14:31-37.
Turell MJ, Lundstrom JO. (1990). Effect of environmental temperature on the vector
competence of Aedes aegypti and Ae. taeniorhynchus for Ockelbo virus. Am J
Trop Med Hyg, 43:543-550.
Watts DM, Burke DS, Harrison BA, Whitmire RE, Nisalak A. (1987). Effect of
temperature on the vector efficiency of Aedes aegypti for Dengue 2 virus. Am J
Trop Med Hyg, 36: 143-152.
Wiwanitkit V. (2006). An observation on correlation between rainfall and the prevalence
of clinical cases of dengue in Thailand. J Vector Borne Dis, 43:73.
World Health Organization. (2012). Global strategy for dengue prevention and control
2012-2020, WHO Press, 30pp.

96
CHAPTER 5: DISCUSSION
Our research provided the localized disease mapping in locations throughout
Africa and Kenya, where it is possible that dengue does occur but is not reported due to a
lack of surveillance and reporting. Incidence data alone, though valuable, does not
identify where dengue is probable, what circumstances heighten the risk, and what
actions may reduce dengue range. Though dengue risk is highest immediately following
an outbreak, traditional diagnosis methods can take two weeks or longer to confirm the
medical test results. Interdisciplinary collaboration between the fields of geography,
entomology, epidemiology, and health services research can bring together
complementary methods, practices, and foundational theories that can be applied to solve
problems focused on spatial risk associated with disease.
This research highlights the value of using geospatial methods to evaluate the
geographic range, susceptibility, and risk of populations to dengue and provides evidence
to help decision makers engaged in the process of planning or revising health information
systems. Five contributions in this research include:
1. Providing a summary that addresses the four primary limitations to dengue
mapping based upon a review of the literature.
2. Creating a localized model that highlights the areas of highest dengue risk in
Kenya.

97
3. Developing a model utilizing susceptibility risk analysis for dengue in Africa
(limiting the spatial bias incurred from only using dengue occurrence data). This
model is not limited to dengue and has the potential to be modified for other
diseases as well.
4. Providing the Query Expression Editor and QFit tools that can be easily shared
and modified as better localized data becomes available.
5. Producing a susceptibility risk analysis where the impact of variables are
classified based on a scale ranging from (high, somewhat high, limited risk, low
risk, and not susceptible). This analysis improves the representation of data from
previously limiting binary (yes/no) results.
Our results, using administrative data, environmental data, population density
data, and physical geography data, suggest that the visualization of dengue risk can be
improved through incorporating GIS with multiple disciplines. These findings
incorporated evidence-based risk analysis in the published literature demonstrating the
benefits for calculating risk environments for disease. Our research also increased
awareness that the range associated with dengue may be underestimated, and highlighted
additional locations of risk. Furthermore, we searched the literature and recognize the
four main limitations to dengue mapping. The previous models could benefit from
incorporating localized data analysis as more localized data becomes available. The
application of utilizing a dengue susceptibility analysis based on a weighted schema
reduced the spatial bias from only using dengue occurrence data for analysis and
increased the susceptibility risk model.

98
GIS is a valuable tool for evaluating methods to disseminate results through
mapping, identifying similarity between geographic risk locations for disease, and
identifying susceptibility risk where dengue occurrence data is limited. The accuracy and
quality of the analysis using GIS, as with any other type of method, is dependent on the
data used to conduct the study. In our initial study, we highlighted the four primary
limitations to dengue mapping which compared the differing methods of visualization
seen in published literature then performed an analysis (SWOT) which had previously
been limited to business-related studies. We utilized Similarity Search to statistically
validate a region of Africa (Kenya) and provided the necessary localized analysis for
determining locations where awareness campaigns and dengue surveillance activities
would be most beneficial. PAT provided a tool for testing dengue occurrence data against
the environmental constraints and provided the localized insight into risk associated with
dengue. Our research was able to limit the spatial bias from only using occurrence data
for disease mapping. However, until we received a vetted dataset of dengue occurrence
data we were limited in our analysis capabilities and testing of environmental constraints
for dengue.
The implications of this research are important to consider. The purpose for
defining the limitations to dengue mapping and then areas at risk for dengue is to
determine those areas where localized models focused on reducing dengue risk could be
implemented. Population density, temperature parameters, and limitations to dengue
mapping are sensitive to the modeling assumptions used. Given these sensitivities, it may
be appropriate to define areas with “buffer” boundaries to avoid the use of inflexible

99
parameters where anomalies along country borders will not impact risk modeling. Since
many areas across Africa are deemed to have insufficient reporting of dengue, it is
important to consider alternative methods for visualizing risk with limited data. Recent
studies have suggested the risk and susceptibility to dengue using a consensus study
(Brady et al. 2012) and have suggested methods for improving dengue research (Rogers
et al. 2014, Bhatt et al. 2013, Simmons et al. 2012, and Brady et al. 2012).
The research in this dissertation has revealed that methods used for calculating
disease risk are constantly evolving. With the world climate changing, the need to
disseminate recent research becomes more essential. At the time of the second sub-study,
we used the most current published dengue data for Africa to test susceptibility risk
analysis. This provided a basis to validate and further test how susceptibility risk analysis
affected the population and range of disease in Africa. Although we were able to improve
upon the previous methods by creating a localized risk analysis, we were only able to
validate the modeling assumptions with data from one source (Bhatt et al. 2013). The
lack of dengue reporting in Africa emphasizes the need for standardized dengue data
collection from countries and jurisdictions across Africa.
This research provides vital evidence to guide health policies and improve dengue
surveillance and public awareness campaigns. As this study focuses on better
understanding limitations to dengue mapping, the broader goal was to develop methods
to measure the risk and susceptibility risk of disease at a localized scale. This study
contributes to the fields of medical geography, entomology, and epidemiology by
generating an interdisciplinary method that can be applied to a variety of disease

100
problems in the world. The findings from these three sub-studies lead to an integrated
understanding of the feasibility of using GIS methods, environmental data, administrative
data, population density data, and elevation data for determining areas where localized
combative and awareness campaigns could be implemented within Africa. Integrating the
transfer of information through the dissemination of findings at the academic level with
publications in peer reviewed journals, presentations at geography conferences and
medical conferences, and provided systematic models and information for disease risk at
the localized level allow the knowledge achieved in this study to be replicated and
scalable as more localized data becomes available. The methods presented in this
dissertation are transferable to other diseases and could be applied to studies focused on a
variety of other methodologies ranging from disease mapping, to susceptible
environments for refugee evacuation routes, and site suitability for defense purposes.

101
REFERENCES
Amarasinghe A, Kuritsky, JN, Letson GW, Margolis HS. (2011). Dengue virus infection
in Africa. Emerg Infect Dis, 17(8):1349-1354.
Bhatt S, Gething PW, Brady OJ, Messina JP, Farlow AW, Moyes CL, Drake JM,
Brownstein JS, Hoen AG, Sankoh O, Myers MF, George DB, Jaenisch T, Wint
GRW, Simmons CP, Scott TW, Farrar JJ, Hay SI. (2013). The global distribution
and burden of dengue. Nature, 496:1-5.
Brady OJ, Gething PW, Bhatt S, Messina JP, Brownstein JS, Hoen AG, Moyes CL,
Farlow AW, Scott TW, Hay SI. (2012). Refining the global spatial limits of
dengue virus transmission by evidence-based consensus. PLoS Negl Trop Dis,
6(8):e1760.
Rogers DJ, Suk JE, Semenza JC. (2014). Using global maps to predict the risk of dengue
in Europe. Acta Trop, 129:1-14.
Simmons CP, Farrar JJ, van Vinh Chau N, Wills B. (2012). Dengue. N Engl J Med,
366:1423-1432.

102
CHAPTER 6: FUTURE ANALYSIS
Future research in dengue visualization should include the integration and
development of dynamic data with methods for disseminating dengue data and
information within developing countries. Visualization techniques for presenting dengue
risk should be integrated to use on mobile devices such as smart phones, tablet
computers, and laptop computers where further research can be carried into the field by
researchers. Social media and search queries are relatively recent phenomena (first
reported in 2006) that have enormous potential for increasing awareness of disease
(Bernardo et al. 2013). However, researchers must constantly work to reduce the noise
that surrounds social media and refine their analysis. Africa has recently seen rapid
growth of the internet where overall there has been an average annual growth in users of
40 percent (Warf 2010). Further developments in digital disease surveillance have the
potential to improve sensitivity and specificity towards disease attentiveness: passively
through advances in machine learning and actively through engagement of users. Future
research should collaborate with local, regional, national, and international authorities to
incorporate social media with a structured methodology.
Future research should address methodologies for collecting dengue data at a
large scale within developing countries. Models must limit the spatial bias incurred from
only using presence cell data by including environmental parameters, population density,

103
and elevation specifications which limit disease. Data collection will be vital as potential
climate change impacts the range of disease. Standardizing the collection for dengue data
and mosquito data for Ae. aegypti and Ae. albopictus will increase the modeling and
visualization capabilities for Africa. With the continued conflict and movement of
refugees in Africa, the reporting and collection of dengue will greatly impact the
understanding of potential locations for outbreaks. Incorporating susceptibility risk and
risk analysis for non-monitored areas including locations within Africa will have to be
continually monitored as the potential impact of climate change could drastically
influence the population susceptible to contracting disease.
Novel technology to break dengue transmission cycles should incorporate the
recent trend for the development of a dengue vaccine or use of Wolbachia as a means for
reducing dengue risk. Traditional control measures have focused on reducing populations
of the main transmission vector, the mosquito Ae. aegypti, but these have largely failed to
slow the current dengue cycle. As of now, several vaccines are in various stages of
advanced development, with clinical trials currently underway on five candidate vaccines
(Coller and Clements 2011). The development of a vaccine has been combated by both a
lack of understanding the population’s immune response to a dosing schedule, and the
factors determining disease severity (Coller and Clements 2011). Recently, studies have
looked towards Wolbachia as the solution to reducing dengue risk (Bain et al. 2013).
Wolbachia is a bacterium that lives only within insect cells and is only passed from one
generation to the next through the female insect’s eggs. This bacterium is not infectious
and cannot be transmitted to any warm blooded animals, including humans. Recent

104
studies have found that the Wolbachia bacterium reduces the ability for insects to become
infected with viruses (Bull and Turelli 2013, Bain et al. 2013, Walker et al. 2011,
Hoffman et al. 2011). Successful establishment of Wolbachia in Aedes populations to
suppress dengue transmission could provide a new method to reducing the risk to dengue.
However, not enough data exists to determine the long term effects from introducing
Wolbachia into mosquitoes at this time where the evolution of dengue virulence cannot
be predicted even qualitatively (Bull and Turelli 2013). Future research can utilize the
location and population of Ae. aegypti to determine where Wolbachia infected
mosquitoes could impact the range of dengue as they are released into the environment.
Therefore determining the impact and potential range where releasing Wolbachia infected
mosquitos will be most beneficial. With increased use of GIS and processing we may
provide localized models and methods where analysis provides an important impact on
limiting the risk of disease for public health communities.
The scalability of the susceptibility risk (PAT) and Similarity Search
methodology will allow for more high resolution to be tested as such data becomes
available. Whether data are raster datasets being utilized to test susceptibility risk in PAT
or whether a higher concentration of points being utilized with Similarity Search, the
scalability of the tools will handle the increased processing and incorporation of high
resolution localized data (in both vector and raster formats). The same methodologies
used to disseminate the models run through PAT can be altered to run higher resolution
data as it becomes available. Future studies could re-run the models through
incorporating additional localized variables seen as impacts for disease risk to make their

105
research more susceptible. These tools serve as a basis for creating a risk modeling
approach that can be scalable and increases the ability to disseminate the models and
information quickly and efficiently.
In countries with limited resources, the ability to provide pre-created models with
localized knowledge of disease environments would greatly enhance the dissemination
and awareness of disease mapping. In underdeveloped countries, incorporating a schema
where models and methodologies for disease mapping could prove beneficial to Non-
Government Organizations (NGOs) for estimating resources to respond to endemic and
epidemic conditions of disease. In conclusion, this dissertation moves beyond dengue to
apply methodologies such as Similarity Search, PAT, QFit and GIS to other diseases.
These methods provide the platform to visualize susceptibility at a localized level by
disseminating information, which is a growing concern as potential climate effects will
likely expand the range of disease.

106
REFERENCES
Bernardo TM, Rajic A, Young I, Robiadek K, Pham MT, Funk JA. 2013. Scoping
Review on Search Queries and Social Media for Disease Surveillance: A
Chronology of Innovation. J Med Internet Res, 15(7):e147.
Bull JJ, Turelli M. 2013. Wolbachia versus dengue. Evol Med Public Health,
2013(1):197–207.
Coller BA, Clements DE.2011. Dengue vaccines: progress and challenges. Curr Opin
Immunol, 23(3):391-8.
Hoffmann AA, Montgomery BL, Popovici J, Iturbe-Ormaetxe I, Johnson PH, Muzzi F,
Greenfield M, Durkan M, Leong YS, Dong Y, Cook H, Axford J, Callahan AG,
Kenny N, Omodei C, McGraw EA, Ryan PA, S. A. Ritchie SA, Turelli M,
O’Neill SL. 2011. Successful establishment of Wolbachia in Aedes populations to
suppress dengue transmission. Nature, 476:454–457.
Walker T, Johnson PH, Moreira LA, Iturbe-Ormaetxe I, Frentiu FD, McMeniman CJ,
Leong YS, Dong Y, Axford J, Kriesner P, Lloyd AL, Ritchie SA, O’Neill SL,
Hoffmann AA. 2011. The wMel Wolbachia strain blocks dengue and invades
caged Aedes aegypti populations. Nature, 476:450–453.
Warf B. 2010. Uneven Geographies of the African Internet: Growth, Change, and
Implications. African Geographical Review, 29(2):41-66.

107
BIOGRAPHY
David Frost Attaway graduated from Coppell High School, Coppell, Texas, in 2003. He
received his Bachelor of Arts in Geography from The University of Texas at Dallas
(UTD) in 2007. He then continued his studies at UTD and received his Masters in
Geographic Information Science in 2009. He has over ten years’ experience in GIS work
and has been employed for various government contracting companies. He currently
works for Esri as a Solution Engineer on the Federal Team in Vienna, VA. He also serves
as a member on the Northern Virginia (NOVA) Geospatial Academic Advisory Board.
He plans to continue working for Esri once completion and will look towards a career in
academia.