Embed Size (px)
Citation preview

A spatial study of the relationships between streamwater acidityand geology, soils and relief (Vosges, northeastern France)
A.L. Thomasa,* , E. Dambrineb, D. Kinga, J.P. Partyc, A. Probstc
aUnite Science du Sol-SESCPF (INRA), 45160 ARDON - fax: 02.38.41.78.69 FrancebCentre de Recherches Forestie`res (INRA), Champenoux, 54280 NANCY France
cCentre de Ge´ochimie de la Surface (CNRS), 1 rue Blessig, 67084 STRASBOURG CDX France
Received 5 February 1998; accepted 11 January 1999
Abstract
We have used a geographic information system (GIS) to study the relationships between streamwater pH and alkalinity atbase flow with geology, soils and relief in 100 forested catchments located in the sandstone portion of the Vosges mountains,where atmospheric deposition and forest cover can be considered homogeneous. At base flow, streamwater acidity dependsprimarily on bedrock and soil content of weatherable minerals whose dissolution neutralizes acidity. Catchments are developedon three main stratigraphic levels, consisting of two sandstone layers rich in weatherable minerals, called ‘‘rich’’, at the upperand lower extremity of the stratigraphic sequence, and a quartzitic sandstone, called ‘‘poor’’, in between. Catchments wereclassified into three major groups in relation to the stratigraphic sequence: (1) only ‘‘poor’’ bedrock, (2) ‘‘rich’’ upstream and‘‘poor’’ downstream, (3) ‘‘poor’’ upstream and ‘‘rich’’ downstream. Results showed that streamwater pH differed dependingon the group. Within each group, the pH was related to bedrock, soil and relief characteristics of the catchments. The relativesurface covered by the bedrock located in the lower part of the catchment explained more than 50% of the variability of pH.More than 20% of variability could be explained by soil types in catchments composed of ‘‘poor’’ bedrock only. Soil typeapparently did not influence streamwater pH in the other groups. The catchment area, probably related to the increase of soilvolume and water residence time, explained up to 20% of pH variability, depending on the catchment type.q 1999 ElsevierScience B.V. All rights reserved.
Keywords:Streamwater acidity; Low flow conditions; GIS; Catchment geology
1. Introduction
Since the 1970s, acidification of soil and surfacewaters has been described in European and NorthAmerican forest massifs. Remarkable decreases inpH/alkalinity were demonstrated in sensitive areas(Johnson et al., 1991; Battarbee et al., 1990). Catch-ment sensitivity can be predicted from the relationshipbetween precipitation acidity and streamwater
alkalinity (Almer et al., 1978; Dickson, 1986; Henrik-sen, 1979). Sensitivity depends primarily on the soiland rock content of weatherable minerals whose disso-lution neutralizes acidity and produces alkalinity.Hydrological factors, often linked to the presence ofphysical obstacles restricting the time and/or the areaof contact between minerals and solutions in the soil,can also play an important role (Eilers et al., 1983;Chen et al., 1984), while the retention of sulfur andnitrogen delays the effects of acid deposition.
General relationships between bedrock characteris-tics and stream acidity have been used to map
Journal of Hydrology 217 (1999) 35–45
0022-1694/99/$ - see front matterq 1999 Elsevier Science B.V. All rights reserved.PII: S0022-1694(99)00014-1
* Corresponding author. Fax:1 33-238-417-869.E-mail address:[email protected] (A.L. Thomas)
catchment sensitivity to acidification (Bricker andRice, 1989). Based on either expert knowledge(Hornung et al., 1995; Hall et al., 1995) or on statis-tical analysis (Rochelle et al., 1989; Phillips 1987),several studies have incorporated glacial morphologyand relief characteristics in order to improve catch-ment sensitivity mapping. Integrated studies of envir-onment factors influencing catchment sensitivity,however, remain very rare (Rapp et al., 1987). Inthe Vosges massif (northeastern France), an inventoryof surface water acidity (Probst et al., 1995; Party etal., 1995) has shown that low alkalinity waters werelocated in two geological areas: acid granites andsandstones. Within these areas, however, considerablediversity of pH values was recorded. The aim of thepresent study was to describe the variability of waterpH on sandstone by using lithologic, pedologic and
topographic parameters. For this purpose, the acidityof 100 streams originating from the sandstone areawas measured at low water flow. Information onbedrock, soils and relief were digitized and integratedusing a GIS. The crossing of the spatialized informa-tion enabled to identify environmental factors mosthighly related to water acidity.
2. The study area
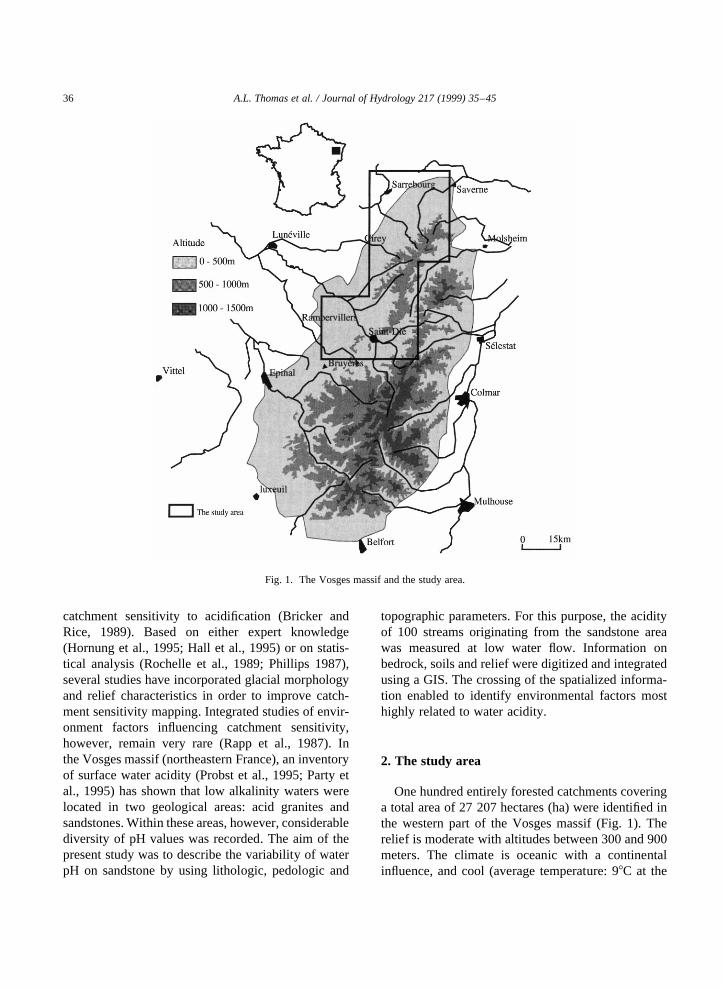
One hundred entirely forested catchments coveringa total area of 27 207 hectares (ha) were identified inthe western part of the Vosges massif (Fig. 1). Therelief is moderate with altitudes between 300 and 900meters. The climate is oceanic with a continentalinfluence, and cool (average temperature: 98C at the
A.L. Thomas et al. / Journal of Hydrology 217 (1999) 35–4536
Fig. 1. The Vosges massif and the study area.

elevation of 400 meters) with an average yearly preci-pitation of 1000 mm varying with altitude between800 and 1200 mm. Fir (Abies alba) forests predomi-nate throughout the region. Annual acid deposition,calculated from three years (1989–1992) bulk preci-pitation and throughfall monitoring at three fir forestsites enclosing the studied area varied between0.4 keqH1.ha21.yr21 at 300 m altitude and 1 keqH1.ha21.yr21 at 900 m altitude. The range of sulfate andnitrate deposition were 10-14 kg.ha21.yr21 and 8-14 kg.ha21.yr21 respectively (Dambrine et al., 1995).
The bedrock is composed of different sandstonesand conglomerates dating from the Permian andTrias inferior (Fig. 2). From the lower and older, tothe upper and younger level, the stratigraphicsequence is composed of Permian sandstone, Senonessandstone, Vosgian sandstone, Conglomerate, Inter-mediate sandstone and Voltzia sandstone. Dependingon their composition (Perriaux, 1961), it is possible toclassify them from the richer to the poorer in weath-erable minerals:
• Permian and Voltzia sandstones, at both ends of thestratigraphic sequence, whose percentages of SiO2
and K2O are 74–79% and 7–5%. Although thepercentages of Ca and Mg do not differ from theother groups, these stratigraphic levels enclose thinlayers of calcite. The Senones sandstone makes thelink with the following group, since its mineralcomposition is similar (81% SiO2, 5% K2O) butit is devoid of calcite.
• Intermediate sandstone whose SiO2 and K2Opercentages are 88% and 3%. In comparison to
the above, this level is also devoid of calcite layersbut poorer in feldspar and mica.
• Vosgian sandstone and conglomerate whose SiO2
and K2O percentages are 93% and 2%, mainlycomposed of sand and siliceous pebbles.
In the Vosges mountains, soil evolution dependsmainly on the composition of bedrock (Bonneau etal., 1978). Soils are sandy, very acid and widelypodzolized on Vosgian sandstone and conglomerate(poorest layers), except locally when wind–bornedeposits (loess) or colluviums originating from richersandstone (intermediate or Voltzia layers) occur. OnVoltzia, Intermediate, Senones and Permian sand-stones, the weathering of feldspars and micas hasled to the formation of cambisols of sandy toloamy–sand texture.
3. Method
Samples of water were taken at the outlet of allcatchments drained by clearwater streams, at lowwater flow, during three consecutive weeks withalmost no rain in the autumn of 1992 (Party et al.,1993). The buffering capacity of soil and rock, inrelation to weathering processes, is maximal duringthat period. The pH of all samples (100) wasmeasured, alkalinity was measured by Gran titrationon 43 of them and complete chemical analysis wasconducted on 18 samples. From these measurements,the following statistical relationship was deduced
A.L. Thomas et al. / Journal of Hydrology 217 (1999) 35–45 37
Fig. 2. Geological section through the study area and localization of each type of catchment.

(Fillion, 1998).
Alk�mmol:l21� � HCO23
� �1 2 CO22
3
h i1 OH2� �
2 H1� �
Alk�mmol:l21� � 1:3 1027:821pH 1 2 × 10218:1512pH� �
1 1000 102141pH 2 102pH� �
This relation, indicating a CO2 partial pressurehigher (1022.9) than atmospheric pressure (1023.5),was applied to calculate alkalinity where measure-ments were lacking.
Data on bedrocks was digitized over the entirestudy area from geologic maps at the scale of1:50,000. The soil map of Saint-Die´ at the scale of1:100 000 (Bonneau et al., 1978) covering 40% of theterritory studied was also digitized. Topographicalinformation was provided by a Digital ElevationModel (DEM) at 50 m, extracted from the altimetricdatabase of the National Geographic Institute (IGN).Morphometric parameters of each catchment werederived from that DEM: minimal, maximal andmedium altitudes, total area, length of the stream,average catchment slope and slope for each bedrock.A hydrologic algorithm applied to the DEM enabled
the catchments to be automatically delineated fromthe outlet points (Jenson and Domingue, 1988).Soils were classified into two groups: podzolic soilsand cambisols. The relative surface covered by eachsoil type and bedrock type was calculated in order todescribe the soil and bedrock composition of eachcatchment.
Catchment typology was established on the basis ofbedrock composition and stratigraphy. Catchmentswere grouped in four main types (Fig. 2):
• type I: ‘‘poor’’. Catchments entirely underlain byVosgian sandstone and conglomerate.
• type II: ‘‘rich over poor’’. Catchments whoseupper part is underlain by Intermediate sandstonewith or without Voltzia sandstone, and whoselower part is based on conglomerate and Vosgiansandstone.
• type III and IV: ‘‘poor over rich’’. Catchmentswhose upper part is composed of conglomerateand Vosgian sandstone (with a possible occurrenceof intermediate sandstone), and whose lower part iscomposed of Senones sandstone (type III) orSenones1 Permian sandstone (type IV).
The information was compiled in a statistical tablein which each line is a catchment and each column alithologic, pedologic or topographic characteristic ofthat catchment. A matrix correlation was used to test
A.L. Thomas et al. / Journal of Hydrology 217 (1999) 35–4538
Fig. 3. Multiple comparison of mean pH for each type of catchment (Tukey test).
the influence of each explanatory variable on stream-water acidity. A regression of the most highly corre-lated variables was then conducted against pH andalkalinity.
4. Results
A multiple comparison of mean pH for each type ofcatchment (analysis of variance) indicated that thetype of bedrock and stratigraphic sequence withinthe catchment determined great differences in stream-water pH. Fig. 3 shows a plot of the mean for eachcatchment type and the 95% confidence intervals forthe means. Bars that did not overlap in types I, II, IIIand IV catchments indicate significant differences
between the four mean pH values. The most acidicwaters (mean pH� 5.4) corresponded to the group ofcatchments whose bedrock was entirely poor (type I).For the other types composed of both rich and poorbedrock, the pH appeared to be related to the nature ofthe substratum located downstream. Acidity waslowest (mean pH� 6.3) when the catchment outletwas located on the poorest bedrock (type II). Meanstreamwater pH values were 7 and 7.4 when the lowerpart of the catchment was composed of rich sand-stones (type III and IV respectively).
Considering each group of catchments separately,the distribution of pH and alkalinity was related to themain environmental factors revealed by the correla-tion matrix.
For catchments entirely located on poor bedrock
A.L. Thomas et al. / Journal of Hydrology 217 (1999) 35–45 39
Table 1Correlation matrix between pH and alkalinity and environmental parameters for catchments of type I. In bold type significant linear correlationcoefficients at the 5% level; critical value equal to 0.53 for 12 degrees of freedom. Alk� alkalinity; TA � total catchment area; CS� relativesurface of cambisols; AS� catchment average slope; AA� catchment average altitude
pH TA CS AS AA Alk TA CS AS AA
pH 1.00 Alk 1.00TA 0.73 1.00 TA 0.69 1.00CS 0.80 20.38 1.00 CS 0.78 20.32 1.00AS 0.42 20.72 20.16 1.00 AS 0.39 20.71 20.12 1.00AA 20.32 0.57 20.08 0.58 1.00 AA 20.36 0.61 20.05 0.59 1.00
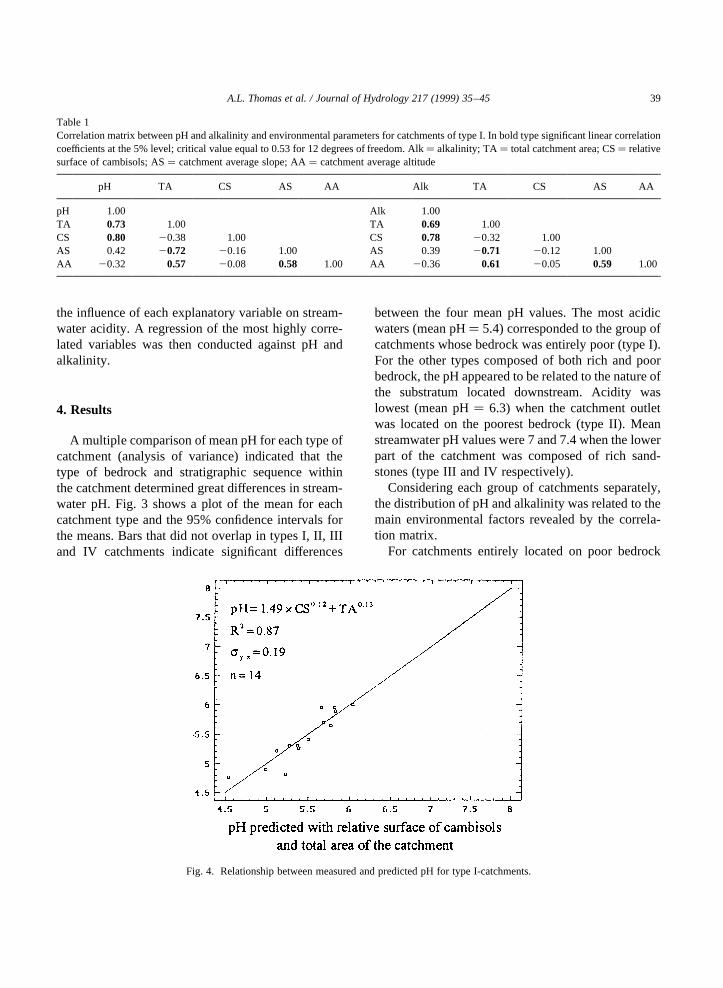
Fig. 4. Relationship between measured and predicted pH for type I-catchments.

A.L. Thomas et al. / Journal of Hydrology 217 (1999) 35–4540
Fig
.5.
Rel
atio
nshi
pbe
twee
npH
(a)
and
alka
linity
(b)
and
rela
tive
surf
ace
of‘‘r
ich’
’bed
rock
for
type
II-ca
tchm
ents
(‘‘ric
hov
erpo
or’’)
.

(type I), the relative surface of cambisols (CS) was thevariable most correlated with streamwater pH,explaining 67% of the variance. The total area (ha)of the catchment (TA) explained 20% of the variance(Table 1). The best fit was obtained with a multipli-cative model (Fig. 4), the equation being:
pH � 1:49× CS0:12 1 TA0:13 R2 � 0:87
pH and alkalinity were linearly correlated in thisrange of pH values.
In type II catchments (‘‘poor over rich’’), stream-water pH varied primarily as a function of the relativesurface of rich substratum (RB) with 72% of variancebeing explained (Fig. 5a). The total catchment areaexplained 5% of the variance (Table 2). The equationproduced by a multiple regression procedure was:
pH � 1:59× RB0:23 1 TA0:08 R2 � 0:77
In type III catchments (‘‘poor over rich’’), stream-water pH was related primarily to the percentage ofrich sandstone (Senones) located at the outlet of thecatchment (61% of the variance explained). Totalcatchment area was no longer involved (Table 3).
The equation was (Fig. 6):
pH � 6:12× RB0:04 R2 � 0:61
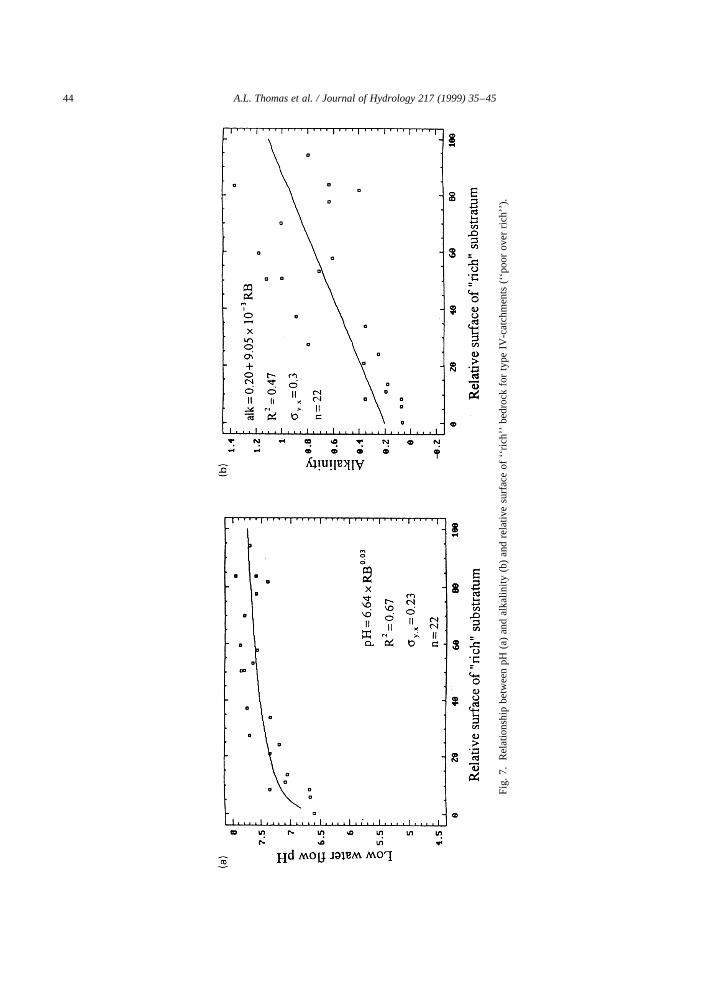
The same was observed for type IV catchments,with 67% of the variance explained by the relativesurface of rich sandstones (Senones1 Permian sand-stones) (Table 4). The equation was (Fig. 7):
pH � 6:64× RB0:03 R2 � 0:67
In all cases, the standard deviation of estimation (sy,x)remained below 0.35 for pH.
5. Discussion
Waters drained at low flow in autumn have under-gone a long contact time with the soil matrix of thedeepest horizons of the soil, especially with theweathered zone located in the lower part of the catch-ment. On Vosgian sandstone, which is composedalmost exclusively of pure quartz sand, variations ofweathering potential were expressed by the relativeproportion of cambisols. Cambisols occur when sand-stone is slightly enriched locally in weatherable fineminerals, or on thick colluviums at the lower part of
A.L. Thomas et al. / Journal of Hydrology 217 (1999) 35–45 41
Table 2Correlation matrix between pH and alkalinity and environmental parameters for catchments of type II. In bold type significant linear correlationcoefficients at the 5% level; critical value equal to 0.38 for 25 degrees of freedom. Alk� alkalinity; TA � total catchment area; RB� relativesurface of rich bedrock (intermediate sandstone); AS� catchment average slope; AA� catchment average altitude
pH TA RB AS AA Alk TA RB AS AA
pH 1.00 Alk 1.00TA 0.43 1.00 TA 20.05 1.00RB 0.83 20.63 1.00 RB 0.55 20.43 1.00AS 20.06 20.63 20.19 1.00 AS 20.24 20.72 20.22 1.00AA 0.13 0.45 20.02 0.69 1.00 AA 0.34 0.55 20.06 0.71 1.00
Table 3Correlation matrix between pH and alkalinity and environmental parameters for catchments of type III. In bold type significant linear correlationcoefficients at the 5% level; critical value equal to 0.32 for 35 degrees of freedom. Alk� alkalinity; TA � total catchment area; RB� relativesurface of rich bedrock (Se´nones sandstone); AS� catchement average slope; AA� catchment average altitude
pH TA RB AS AA Alk TA RB AS AA
pH 1.00 Alk 1.00TA 0.11 1.00 TA 0.14 1.00RB 0.74 20.12 1.00 RB 0.75 20.14 1.00AS 20.24 20.62 0.08 1.00 AS 20.01 20.67 20.08 1.00AA 20.12 0.50 20.19 0.49 1.00 AA 0.09 0.50 20.17 0.48 1.00

A.L. Thomas et al. / Journal of Hydrology 217 (1999) 35–4542
Fig
.6.
Rel
atio
nshi
pbe
twee
npH
(a)
and
alka
linity
(b)
and
rela
tive
surf
ace
of‘‘r
ich’
’bed
rock
for
type
III-c
atch
men
ts(‘‘
poor
over
rich’
’).

the slopes. Neutralization also occurred to greaterextents in large catchments where the general slopebecomes lower and soil thickness increases (Rochelleet al., 1992). The influence of the catchment areacannot be easily explained by other ways: (1) watercoming from small catchments could have retained aCO2 partial pressure higher and closer to that of soils,but then catchment size should not change alkalinity;(2) dissolved organic carbon (DOC) in water drainingsmall catchments could be higher. Such a relationshipdoes not appear in the set of complete water analysesavailable, since DOC was consistently below4 mg.l21. Moreover, this should have induced a distor-tion in the pH/alkalinity relationship at low pH, whichwas not observed.
When the upper part of the catchment wascomposed of rocks and soils richer in weatherableminerals, the proportion of poor bedrock locateddownstream or rich bedrock located upstreamexplained most of the variation in streamwater acid-ity. In this case, soil type did not appear to influencepH, probably because soil types provide redundantinformation highly correlated with bedrock types.Because at low flow stream water mainly originatesfrom the bottom of the catchment, a substrate rich inweatherable minerals at the lower part of thecatchment led to a greater increase in pH (andalkalinity) than that produced by an equivalentproportion of the same material located in the upperpart of the catchment.
The observed linear relationships between alkali-nity and the proportion of richer bedrock in the catch-ment probably reflect the progressive neutralization ofacidity by weathering. This should imply a relationbetween pH and the logarithm of the relative surfaceof rich bedrock. The better fit observed with power
relationships might be partly due to the fact that thesestatistical relationships are strongly dependent on thedata measured at high pH, which are often scattered.
Monitoring of atmospheric deposition in theVosges mountains have shown that depositionincreased with altitude, but also from the South tothe North of the study area. One may suspect thedirect effect of the deposition level on stream pH.This effect is possible but difficult to demonstrate.Within the whole data set, as well as within eachcatchment type, stream pH was not related to themean altitude of the catchment. Moreover, on thebasis of 150 streams analysed in the same area,Boudot (in Dambrine et al., 1998) has shown thatstrong acid concentrations were not different in allcatchment types.
6. Conclusion
Results of this study show that GIS is a powerfultool for describing and analyzing the spatial variabil-ity of streamwater pH when geology, soil and reliefmaps are available. More than 60% of the variabilityof streamwater pH and alkalinity was in fact explainedby the nature of the bedrock in the lower part of thecatchment, soil types and total catchment area.Although the results obtained may appear specificfor the sandstone part of the Vosges, the importanceof catchment location in the stratigraphic sequence forunderstanding the variability of streamwater pHshould be stressed. In general, sensitivity mappingstudies consider the dominant bedrock of eachgeographical unit (Hettelingh et al., 1991). Thisstudy shows that the spatial distribution of bedrocksis very important to consider. This idea should not be
A.L. Thomas et al. / Journal of Hydrology 217 (1999) 35–45 43
Table 4Correlation matrix between pH and alkalinity and environmental parameters for catchments of type IV. In bold type significant linearcorrelation coefficients at the 5% level; critical value equal to 0.42 for 20 degrees of freedom. Alk� alkalinity; TA � total catchment area;RB� relative surface of rich bedrock (Permian and Se´nones sandstones); AS� catchment average slope; AA� catchment average altitude
pH TA RB AS AA Alk TA RB AS AA
pH 1.00 Alk 1.00TA 20.11 1.00 TA 20.35 1.00RB 0.64 0.22 1.00 RB 0.60 0.35 1.00AS 0.26 20.66 0.13 1.00 AS 0.07 20.64 .27 1.00AA 0.13 0.61 20.14 0.68 1.00 AA 0.34 0.65 20.26 0.67 1.00
A.L. Thomas et al. / Journal of Hydrology 217 (1999) 35–4544
Fig
.7.
Rel
atio
nshi
pbe
twee
npH
(a)
and
alka
linity
(b)
and
rela
tive
surf
ace
of‘‘r
ich’
’bed
rock
for
type
IV-c
atch
men
ts(‘‘
poor
over
rich’
’).

restricted to the sedimentary world. The sedimentaryenvironment, poorly influenced by glaciers, hasevidently facilitated our analysis but conclusionsmight also be applied to igneous rocks locally influ-enced by hydrothermalism (Mansuy, 1992) orglaciers.
A similar study at high flow may change the rela-tive importance of the factors involved to a limitedextent because sandstones are porous and thereforewater residence time should be rather long even athigh flow. The combination of such studies at highand low flows (Philips and Stewart, 1991), especiallyin glaciated areas, however, may provide an assess-ment of water pathways in relation to soil structuresinherited from the glacial periods.
References
Almer, B., Dickson, W., Ekstro¨m, C., Hornstro¨m, E., 1978. Sulfurpollution and the aquatics. In: Nriagu, J.O. (Ed.). Sulfur in theEnvironment. Part II: Ecological impact, John Wiley and sons,New York.
Battarbee, R.W., Mason, J., Renberg, I., Talling, J.F., 1990. Paleo-limnology and lake acidification.. Proc. Roy. Soc. London, 219pp.
Bonneau, M., Faivre, P., Gury, M., He´tier, J.M., Le Tacon, F., 1978.Notice explicative de la carte pe´dologique de Saint-Die´ au 1/100 000e`me. INRA, 152 pp.
Bricker, O.P., Rice, K.C., 1989. Acidic deposition to streams. Ageology based method predicts their sensitivity. EnvironmentalScience and Technology 23, 379–385.
Chen, C.W., Gherini, S.A., Peters, N.E., Murdoch, P.S., Newton,R.M., Goldstein, R.A., 1984. Hydrological analyses of Acidicand Alkalines lakes. Water Resources Resarch 20, 1875–1882.
Dambrine, E., Ulrich, E., Ce´nac, N., Durand, P., Gauquelin, T.,Mirabel, P., Nys, C., Probst, A., Ranger, J., Ze´phoris, M.,1995. Atmospheric deposition in France Heidelberg, NewYork. In: Landmann, G., Bonneau, M. (Eds.). Forest declineand atmospheric deposition effects in the French mountains,Springer, Berlin, Heidelberg, New York, pp. 177.
Dambrine, E., Thomas, A.L., Party, J.P., Probst, A., Boudot, J.P.,Duc, M., Dupouey, J.L., Ge´gout, J.C., Gue´rold, F., King, D.,Maitat, O., Nicolaı¨, N., Pollier, B., Thimonier, A., 1998. Acidite´des sols et des eaux dans le massif gre´seux vosgien. Distribu-tion, evolution, role des de´pots atmosphe´riques et conse´quences.Comptes Rendus Acade´mie Agriculture (in press).
Dickson, W., 1986. Some data on critical loads for sulphur onsurface waters. In: Nilsson, I. (Ed.). Critical loads for S andN, Nordic Council of Minister, Stockholm, pp. 143.
Eilers, J.M., Glass, G.E., Webster K, E., Rogalla J, A., 1983.
Hydrologic control of lake susceptibility to acidification. Can.J. Fisheries 40, 1896–1904.
Fillion, N., 1998. Contribution de la matie`re organique dissoute a` lacomposition chimique des eaux de surface. Mesure de l’alcali-nite et de l’acidite organique. Application aux pre´cipitationsatmosphe´riques et aux solutions de sols. The`se Universite´Louis Pasteur, 200 pp.
Hall, J.R., Wright, S.M., Sparks, T.H., Ullyett, J., Allot, T.E.H.,Hornung, M., 1995. Predicting freshwater critical loads fromnational data on geology, soils and land use. Water, Air, Soil,Pollut. 85, 2443–2448.
Henriksen, A., 1979. Nature 278, 542–545.Hettelingh, J.P., Downing, R.J., de Smet, P.A.M., 1991. Mapping
Critical Loads for Europe. CCE Technical Report no.1. RIVM,Bilthoven, The Netherland.
Hornung, M., Bull, K.R., Cresser, M.L., Ullyett, J., Hall, J.R.,Langan, S., Loveland, P.J., Wilson, M.J., 1995. The sensitivityof surface waters of Great Britain to acidification predicted fromcatchment characteristics. 87, 207–214.
Jenson, S.K., Domingue, J.O., 1988. Extracting Topographic Struc-ture from Digital Elevation Data for Geographic InformationSystem Analysis. Photogrammetric Engineering and RemoteSensing. 54 (11), 1593–1600.
Johnson, D.W., Cresser, M.S., Nilsson, S.I., Turner, J., Ulrich, B.,Binkley, D., Cole, D.W., 1991. Proceedings of the RoyalSociety of Edinburg 97B, 81.
Mansuy, D., 1992. Les granites et la couverture pe´dologique dans lebassin du Rouge Rupt. Leurs participations au controˆle de l’aci-dification des eaux. The`se, Universite´ Nancy I, 211 pp.
Party, J.P., Probst, A., and Dambrine, E., 1993. De´termination et carto-graphie des charges critiques en polluants atmosphe´riques dans lesVosges. Rapport scientifique ADEME, Anne´e 1992, 68 pp.
Party, J.P., Probst, A., Dambrine, E., Thomas, A.L., 1995. Water.Air, Soil Pollut. 82, 2407–2412.
Perriaux, J., 1961. Bull. Serv. Carte. Ge´ol. d’Als. et de Lorr., 18, 15-94.
Philips, R.A., 1987. Relationship between glacial geology andstreamwater chemistry in an area receiving acid deposition. J.Hydrol. 101, 263–273.
Philips, R.A., Stewart, K.M., 1991. Longitudinal and seasonal waterchemistry variations in a northern Appalachian stream. WaterResources Bulletin 26, 489–498.
Probst, A., Probst, J.L., Massabuau, J.C., Fritz, B., 1995. Surfacewater acidification in the Vosges mountains: relation to bedrockand vegetation cover. In: Landmann, G., Bonneau, M. (Eds.).Forest decline and atmospheric deposition effects in the Frenchmountains, Springer Verlag, New York, pp. 371.
Rapp, G., Luikkonen, B.W., Allert, J.D., Sorensen, J.A., Glass,G.E., Loucks, O.L., 1987. Geologic and atmospheric inputfactors affecting watershed chemistry in upper Michigan.Enviro. Geol. Water Sci. 9, 155–171.
Rochelle, B.P., Liff, C.I., Cambell, W.G., Cassel, D.L., Charch,M.R., Nusz, R.A., 1989. Regional Relationships betweengeomorphic/hydrologic parameters and surface water chemistryrelative to acidic deposition. J. Hydrol. 112, 103–120.
A.L. Thomas et al. / Journal of Hydrology 217 (1999) 35–45 45