Embed Size (px)
Citation preview

A SOCIOLOGICAL PERSPECTIVE OF WATER CONSUMERS IN SOUTH FLORIDA HOUSEHOLDS
Edited by
George A. Watkins
I PUBLICATION NO. 18 \
\
FLORIDA WATER RESOURCES RESEARCH CENTER
RESEARCH PROJECT TECHNICAL COMPLETION REPORT
OWRR Project Number A-01 O-FLA
Annual Allotment Agreement Number DI-14-01-0001-1077 (1968)
Report Submitted: September 4, 1968
The work upon which this report is based was supported in part by funds provided by the United States Department of the
I nterior, Office of Water Resources Research as _ Authorized under the Water Resources
Research Act of 1964.
ACKNOWLEDGMENTS
The editor expresses his gratitude to Dr. Daniel Kubat, University
of Waterloo, Ontario, and to Mrs. Lilian Tsai, Florida Atlantic University,
Boca Raton, Florida, for their contributions to the original report from
which this monograph was written. Dr. Kubat was the principal investigator
for Project A-OIO-FLA "Prediction Model for Water Use by Population
Structure" and provided invaluable guidance to his staff and researchers.
The Department of Sociology at the University of Florida is
gratefully acknowledged for providing facilities during the project.
Dr. Gerald R. Leslie and Dr. Joseph Vandiver, chairman of the department
during the project, along with other faculty members, provided
substantial assistance and encouragement to the researchers.
Dr. Vandiver's additional assistance in the preparation of this final
report is most sincerely appreciated by the editor.
Dr. Tom Huser, Publicity Director of the Central and Southern Florida
Flood Control District in West Palm Beach and Dr. Olaf Pearson, City
Manager of Homestead are also thanked for their cooperative attitude
during the field work stages.
Finally, the editor wishes to express his sincere thanks to the
Florida Water Resources Research Center in Gainesville, Florida and to
the Department of Sociology at the University of Tulsa, Tulsa, Oklahoma,
for encouragement and support during the editing of this report.
i

TABLE OF CONTENTS
Chapter I. INTRODUCTION
II.
III.
IV.
V.
Review of the Literature
RESEARCH DESIGN
Sampling Procedures Data Collection Techniques Data Processing Data Analysis .
CHARACTERISTICS OF THE POPULATION
Size of Households Number of Children Average Age of Children Education of Head of Household Occupational Classification of Head of Household Income of Head of Household Age of Husband Summary . . . . . . . . . .
WATER CONSUMPTION BY HOUSEHOLD CHARACTERISTICS
Water Consumption by Size of Household Water Consumption by Number of Children Water Consumption by Average Age of Children Water Consumption by Education of Head of Household Water Consumption by Occupation of Head of Household Water Consumption by Income of Head of Household Water Consumption by Number of Water Appliances . . . Determinants of Water Consumption: A Factor Analysis Summary ..........•............
AN ATTITUDINAL PROFILE OF WATER CONSUMERS TOWARDS WATER CONSERVATION . . . . . . . . . . . .
The Rationale for the Variables in the Set Test for Scalability A Test for Validity . Naming the Guttman Scale Potential Uses of the Water Concern Scale
ii
1
2
11
12 13 14 15
16
16 17 18 19 20 21 22 23
25
25 26 29 29 32 32 35 38 45
47
48 50 51 58 60

Chapter VI. AN APPLICATION OF THE SCALE
Statements of Relationships Summary ...
VII. SUMMARY AND CONCLUSIONS
Conclusions
APPENDIX
BIBLIOGRAPHY
BIOGRAPHICAL SKETCH OF AUTHOR
iii
62
62 65
68
69
75
86
93

Table 1.
2.
3.
4.
5.
6.
7.
8.
9.
10.
ll.
LIST OF TABLES
Page Number and Percentage Distribution of Size of Households, Homestead and West Palm Beach, Florida .. ...... 17
Number and Percentage Distribution of Children in Households, Homestead and West Palm Beach, Florida . • . . . . . .. 18
Number and Percentage Distribution of Average Age of Children in Households, Homestead and West Palm Beach, Florida 19
Number and Percentage Distribution of Head of Household's Education, Homestead and West Palm Beach, Florida . . . . 19
Number and Percentage Distribution of Occupational Classification of Head of Households, Homestead and West Palm Beach, Florida ......................•. 21
Number and Percentage Distribution of Head of Household's Income, Homestead and West Palm Beach, Florida . . . . . 22
Number and Percentage Distribution of Ages of Husband in Households, Homestead and West Palm Beach, Florida . . . 23
Number and Percentage Distribution of Size of Household and Water Consumption, Homestead and West Palm Beach, Florida 27
Number and Percentage Distribution of Number of Children in Household and Water Consumption, Homestead and West Palm Beach, Florida .......•... .... 28
Number and Percentage Distribution of Average Age of Children in Household and Water Consumption, Homestead and West Palm Beach, Florida . . . . . . . . . . . . . • . . . . . . . 30
Number and Percentage Distribution of Years of Education Completed by Head of Household, and Water Consumption, Homestead and West Palm Beach, Florida . . . . . • . • . • . . . . . .. 31
12. Number and Percentage Distribution of Occupation of Household Head and Water Consumption, Homestead and West Palm Beach, Florida
13. Number and Percentage Distribution of Income of Household Head and Water Consumption, Homestead and West Palm Beach, Florida
iv
33
34

Table 14. Number and Percentage Distribution of Water Appliances
and Fixtures and Water Consumption, Homestead and West Palm Beach, Florida . . . . . . . . . . . . . . .
15. Rotated Factor Matrix on Selected Socioeconomic Variables
16.
17.
18.
19.
20.
21.
22.
23.
24.
25.
26.
27.
and Water Consumption
Correlation Matrix on Selected Socioeconomic Variables
Correlation Matrix on Selected Socioeconomic Variables and Water Consumption: Homestead and West Palm Beach
Arithmetic Averages (X) and Standard Deviations (S.D.) of Selected Socioeconomic Variables . . . . . . .. .•.•
Item Set with Assigned Subuniverses and Percentage Favorable Responses . . . . . .
Scalogram for Final Five Items
Final Five Statements for Guttman Scale
Factor Matrix of Attitudes toward Water Conservation
Factors Underlying Attitudes towards Water Conservation
Rank-Order of Factors by Mean Loadings of Attitudes towards Water Conservation . . . . . . . . .
Comparison between the Guttman Scale Rankings and Factor Matrix Rankings of Variables Reflecting Attitudes towards Water Conservation . . . •
Water Concern Scalogram
Number and Percentage Distribution of Water-Using Appliances and Fixtures, Homestead and West Palm Beach Households ...
v
Page
36
39
41
43
44
49
52
54
55
56
58
59
61
70

CHAPTER I
INTRODUCTION
Concern over water resources on a national level is a relatively recent
phenomenon. There have been many local squabbles over water rights, there
have been droughts in some areas while others suffered floods, and there has
been considerable national concern over waterway rights for navigation. But
only since the end of World War II has there evolved a nation-wide concern for
water as such. Very recently in American life, rapidly intensifying concern
over environmental resources has taken on the characteristics of a social move
ment. An indispensable part of the concern with environmental resources is the
use and misuse of water resources.
One of the reasons for the increased concern of the federal government
with the water crisis is the population increase in the United States since
1900. United States census figures projections show births, deaths, and in
migration indicating a population rise from 192 million in the early 1960's
to 245 million by 1980, and perhaps 350 million by the year 2000 (Moss, 1967:4).
Our whole society is using more water per person. This nation required only
40 billion gallons daily in 1900, but by the year 1965, it required 360 billion
gallons a day. On a per capita basis this comes out to 526 gallons per person
in 1900, and 1,893 gallons per person in 1965.
At the present time, industry uses the most water. Industry is cur
rently using 160 billion gallons of water a day in its production processes,
and twenty years from now will require close to 400 billion gallons a day.
Irrigation now claims the second largest share of the nation's water supply.
1

2
United States agriculture uses about 141 billion gallons of water a day and it
is estimated that this will increase by 1980 to about 166 billion gallons a day.
Unlike the water used by industry, water used for irrigation can only be used
once before most of it is lost in evaporation to begin nature's hydrological
cycle again. Municipalities, the third largest users of water and the concern
of this particular study, require more than 22 billion gallons a day at present,
and by 1980 this need will increase to 37 billion gallons. This increase will
come about not only because the population will be larger, but because of greater
domestic uses. For example, it takes 3 gallons of water to wash dishes by hand,
but twice this amount by machine; no water at all to put garbage in a can, but
2 gallons each day to flush refuse down a drain (Nikolaieff, 1967:16-17).
There are many programs offered at the local, state, and national level
regarding water resources allocation which may simply be decided administra
tively and on the basis of some engineering efficiency estimate. At the same
time, not all population groups are willing to accept innovations or simple
administrative fiats for a number of reasons including, perhaps, a simple dis
affection with community leadership. Therefore, it is quite important to assess
the feelings of the population before changes in water supply and distribution
practices are initiated. The need for change is always there as demonstrated
by the rapidly expanding pace of population and industry. Sociologists may be
able, through a detailed description of water consumer patterns and through the
assessment of the attitudes of a particular population, to help bridge the gulf
between the administrative solutions needed and the hesitation on the part of
the water consumers to accept them.
Review of the Literature
Within the last ten years there has grown an accumulation of studies con
cerned with the sociological aspects of water resources. Prior to this time,

3
most studies of water resources were technical and administrative in nature.
That is, they were concerned with engineering systems and problems connected
with the allocation of and preservation of water resources. The recent trend
in the social sciences to become concerned with water resources reflects their
growing awareness of the problematic nature of water resources and an emphasis
on an interdisciplinary approach to the solution of such problems.
Necessity of Sociological Inquiry in Water Resources Problems
There have been several articles written which concern themselves with
the need for sociological inquiry, and its resulting contribution, into the
problem of water resources.
Hufschmidt (1967), who noted that the interdisciplinary approach to re-
search and education in water resources is a relatively recent phenomenon,
cited the need for the social sciences to be concerned with water resources.
Although some academic economists and political scientists had been working
on water resources problems for a number of years, their efforts were highly
individualistic, and most of them had made only sporadic contact with engineers
and natural scientists. Hufschmidt felt that the situation has radically changed
and that today social scientists can converse meaningfully with natural scien-
tists about the concern and problems of water resources.
However, he further noted that today's water resources experts have had
little or no formal training in water resources.
They obtained their education in a specific discipline or professional field, perhaps civil or sanitary engineering, economics, law, public administration, geology, chemistry, biology, forestry, city and regional planning, geography, and the like. The interest in water resources probably developed some time after their academic and professional education; to a large extent, they were self-taught in the intricacies of the field. Perhaps because the limitations of this method of training for the water resources field are recognized, we are now concerned with improvements (Hufschmidt, 1967:4).
One of the recognized limitations of training with which Hufschmidt con-
cerned himself was the "highly ·theoretical nature of sociology." Resources
4
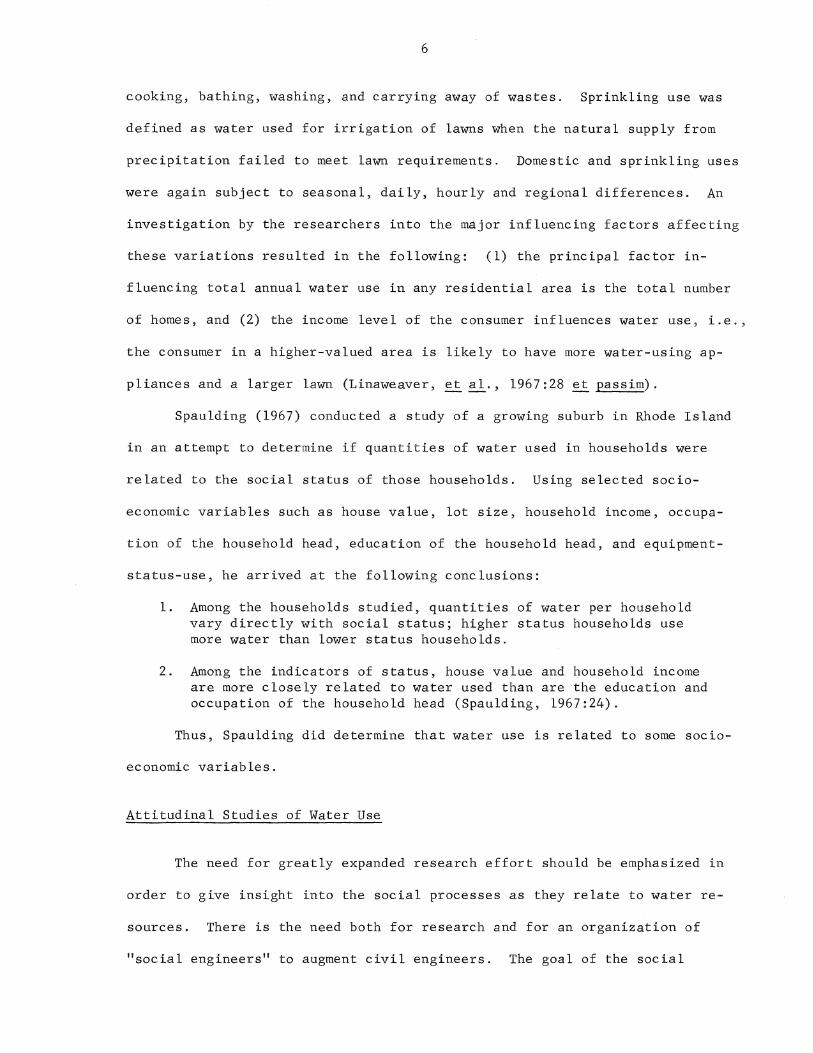
for the Future (RFF) , which has as its mission the application of social
science knowledge to natural science problems, investigated the possible
role that sociology might play in natural science research.
A few leading sociologists ... were consulted about the contribution that their field might make to water resources. Careful investigation revealed, both to the sociologists and to the RFF staff, that the kinds of research in which sociologists were interested were not easily adaptable to the kinds of natural resource problems that RFF was considering at the time (Hufschmidt, 1967:5).
This relatively early neglect of applied research by sociologists may
have been part of the difficulty, but it is one which is gradually being
overcome by such men as Wade H. Andrews of Utah State University.
Andrews has indicated that important contributions for the sociological
study of water resources are being made by several areas of sociology .
. perhaps most notable are rural sociology, as it has dealt with the structure and culture of rural people related to land resource, but also there are the fields of social change, urbanization, diffusion and adoption of technology, social psychology, social action and community development processes. In addition, ... social theory, research methodology, industrial, communication, urban, regional and political sociology as well as population, can contribute to the problems of water resources development (Andrews, 1968:2).
Andrews cited, as did Hufschmidt, the need for an interdisciplinary
approach to the water resources problem. For Andrews, this is not a mere
overlapping of fields in a unidirectional approach, but rather an approach
which demands the most that each field has to offer in a cooperative effort,
i.e., a closure of the social aspects of geography and the applied field of
urban and regional planning.
Regarding the industrial and urban uses of water, Andrews cited the
need for sociology to investigate and direct its attention: (1) to the study
of private industry in relation to the needs, use, and organization of in-
dustry for water, (2) to the way these factors affect other developments,
including the effects on communities, (3) to the analysis of the decision-
making process in both the public and private sectors, including both

5
noneconomic factors which affect those decisions and the effect such decisions
may have on the whole developmental picture, and (4) to study present com-
munities and regions and necessary future changes in them.
Technical knowledge for improved use of the water resources and changing needs for water are constantly in contact with the behavioral systems man has devised of beliefs, organizations or customs to deal with this resource. To implement the adoption of useful information much more technical knowledge about man's behavior is needed (Andrews, 1968:12).
Sociology's Increasing Awareness Reflected by Studies Concerned with Socioeconomic Variables and Water Resources and Use
The numerous sociological studies of the relationship of certain socio-
economic variables to water resources and use, reflect, in part, the concern
of Hufschmidt and Andrews regarding a sociological emphasis and investigation
into water resources problems.
Two studies which reflect a comprehensive investigation into the rela-
tionship between socioeconomic variables and water resources and use are
those of Linaweaver, Geyer, and Wolff (1964, 1967), and Spaulding (1967).
Linaweaver and his colleagues conducted a large scale study of water-
use patterns which occur in residential areas. They further described the
phenomenon of residential water use and analyzed and evaluated the major
factors which influence the use of water in these areas. Linaweaver, et ~.
found that there is a considerable variation in water use in residential
areas influenced by seasonal and hourly factors. Water demands vary over a
wide range throughout the country from season to season and from area to
area, and the nature of water-use patterns and the factors influencing them
were determined by their analysis of residential water-use data.
For purposes of analysis, Linaweaver and his associates separated
residential water use into domestic use and sprinkling use. Domestic use
was defined as water used within the home for purposes including drinking,
6
cooking, bathing, washing, and carrying away of wastes. Sprinkling use was
defined as water used for irrigation of lawns when the natural supply from
precipitation failed to meet lawn requirements. Domestic and sprinkling uses
were again subject to seasonal, daily, hourly and regional differences. An
investigation by the researchers into the major influencing factors affecting
these variations resulted in the following: (1) the principal factor in-
fluencing total annual water use in any residential area is the total number
of homes, and (2) the income level of the consumer influences water use, i.e.,
the consumer in a higher-valued area is likely to have more water-using ap-
pliances and a larger lawn (Linaweaver, ~ al., 1967:28 et passim).
Spaulding (1967) conducted a study of a growing suburb in Rhode Island
in an attempt to determine if quantities of water used in households were
related to the social status of those households. Using selected socio-
economic variables such as house value, lot size, household income, occupa-
tion of the household head, education of the household head, and equipment-
status-use, he arrived at the following conclusions:
1. Among the households studied, quantities of water per household vary directly with social status; higher status households use more water than lower status households.
2. Among the indicators of status, house value and household income are more closely related to water used than are the education and occupation of the household head (Spaulding, 1967:24).
Thus, Spaulding did determine that water use is related to some socio-
economic variables.
Attitudinal Studies of Water Use
The need for greatly expanded research effort should be emphasized in
order to give insight into the social processes as they relate to water re-
sources. There is the need both for research and for an organization of
"social engineers" to augment civil engineers. The goal of the social

7
engineers, or sociologists and other social scientists, would be to eliminate
some of the obstacles to the efficient operation of the programs suggested by
the civil engineers. This is a goal which requires an investigation into the
needs and interests of the affected populations as well as the planned programs
of the engineers in regard to water resources. The efforts of several men
have increased the awareness of the need for further study into the needs and
interests of the populace at state and local levels.
Dasgupta (1968) conducted a study of watershed development and analyzed
his data at three interrelated levels--organizational, individual, and com
munity. It is the second, or individual level which is of present concern.
At the individual level, according to Dasgupta, one is mainly interested in
delineating the characteristics of the landowners which make them positively
or negatively predisposed toward watershed development. Factors such as
occupation, education, social participation, and level of living have been
found to be related to adoption of farming practices and innovations by
Rogers (1962). These findings may have some relevance in delineating factors
related to attitudes toward watershed development at the individual level.
For example, Photiades (1960) reported on the empirical relationship between
attitudes toward watershed development programs and a number of socioeconomic
factors, such as occupation, tenure status, size of farm, age and education.
Dasgupta developed a Guttman scale and selected seven socioeconomic
variables in an attempt to examine their relationship to attitudes towards
watershed development. His seven variables were organizational involvement,
occupational status, education, level of living, age, tenure status, and number
of acres operated. He found only the variables of organizational involvement,
occupational status, education, and level of living to be significantly re
lated to attitude. High organizational involvement, nonfarm occupation, high
education, and high level of living were positively related to attitudes toward

8
watershed development (Dasgupta, 1968:7). He also found that knowledge of
watershed development was highly related to attitudes. Individuals who were
well informed and knowledgeable about watershed development programs were
the same persons who were found to have more favorable attitudes toward
the implementation of such a program in their community.
Spaulding, in his Rhode Island study, also attempted to measure atti
tudes of his respondents in the following areas: (1) water as a necessity,
(2) water as abundant in nature, (3) water as an economic commodity,
(4) concern with water supply problems and shortages, and (5) relationships
among ability to buy water-using equipment, social status, and amount of
water used (Spaulding, 1967:26).
Wilkinson (1966) conducted a survey of rural landowners in two water
shed districts and attempted to measure the attitudes of the residents toward
the watershed project and toward water conservation in general. He found
differences and similarities in the attitudes of the residents of the com
muni,ties as follows: (1) 55 percent of the respondents in Community A and
32 percent in Community B rated the watershed project as "good" or "excellent,"
(2) regarding water conservation in general, a greater proportion of the
respondents in Community A felt that conservation was a real local problem,
that the area's future economy would depend in large part on conservation
of water resources, that the federal government should be involved in water
conservation, that pollution of streams is a major national problem, that the
state gives up power when the federal government finances watershed projects,
that landowners alone should not be required to pay for flood protection,
that most local landowners would lose from watershed programs, that supplying
water for industry should be a major local concern, that widespread local
acceptance of watershed programs would be likely, that spending money for
watershed development is a good investment, and that everyone in the county

9
would benefit from the watershed project, and (3) 72 percent of the respondents
in Community Band 38 percent in Community A agreed with the statement, "Land-
owners have little opportunity to express their opinion in planning watershed
programs" (Wilkinson, 1966:14-15).
Wilkinson found that an examination of demographic and socioeconomic
characteristics of the two groupings did not reveal a pattern of differences
which would account for the differences in attitudes noted above.
For Wilkinson and Cole (1967), attitude
is basically a field-theory concept having to do with the qualitative relationship between an individual's inner life and some object in his psychological environment, i.e., with some object of which he is aware. Two attitude objects appear to be of great significance in the study of water resources problems. One is the attitude of the individual toward water resources as such. The other is his attitude toward programs of water management (Wilkinson, Cole, 1967:9).
The second effort of this study is directed at Wilkinson and Cole's
first attitudinal object--the attitude of the individual toward water re-
sources as such. An attempt will be made to develop an attitudinal scale
to measure the attitudes of a particular population of respondents toward
water resources. Of concern are the attitudes of the respondents regarding:
(1) water resources as an economic commodity, (2) their willingness to do
something about the water resources problems, (3) their awareness of water
resources problems, and (4) their knowledge of certain socioeconomic rela-
tionships and availability of water. Once the scale has been developed, the
scale score of each respondent will be compared with certain socioeconomic
variables.
However, the purpose of this study is first to determine what relation-
ships there are between water consumption in residential areas as compared with
certain socioeconomic variables of the population. It is believed that the
quantities of water used in households are positively related to: (1) the
socioeconomic status of the household, (2) the demographic composition of the

10
household, and (3) the number and kinds of household appliances present which
use water.
In essence, the first part of this study is a replication of research
already done by Spaulding, Linaweaver and others with the intent of verifi
cation. The second part of this study is exploratory in nature. It will be
concerned with the development of a scale to measure attitudes towards water
conservation as developed by Watkins (1968).
CHAPTER II
RESEARCH DESIGN
In July, 1967, the Department of Sociology at the University of Florida
was awarded a grant from the Office of Water Resources Research at the Uni-
versity of Florida under the Water Resources Research Act of 1964, Public
Law 88-379. The purpose of the grant was to determine the possibility of a
prediction model for water use by different population structures.
In an effort to establish a prediction model for water use by population
structures, data collected for this study were obtained from a sample survey
of households in two urban places in South Florida--Homestead and the contig-
1 uous areas of northern West Palm Beach. In order to minimize expense in
sampling, the universe from which the sample was drawn was defined so as to
contain a minimum of business establishments, large-scale apartment complexes
and trailer parks. It was felt by the investigators that the latter complexes
would not offer sufficient data for analysis since the flat rate for dwelling
units eliminated information on the variation of water use by individual
households.
1 To conduct a survey on water consumption in individual households is quite similar to any other survey work. There are some specific traits of such a survey, however. In the first place, when the survey questionnaire contains items regarding attitudes towards water consumption, conservation, and waste, the respondents are not as ready to provide accurate and considered answers inasmuch as such questions still pertain to the realm of the "irrelavant." In the second place, there arise specific problems of identifying households with water meters, households with own wells, and households with both without violating the principle of probability sampling. In the third place, information about the actual water consumption and water-using appliances and plumbing fixtures itemization runs into the problem of incomplete answers.
11

12
Field work, consisting of four stages, was necessary for the collection
of data. After a pretest of the interview schedule (Appendix A) in Gainesville,
Florida in September, 1967, the first stage was started and completed in
February, 1968 in the target areas. The second stage was started and com
pleted in June, 1968.
Sampling Procedures
The first stage of the field-work consisted of sampling residential
units in the two target areas--West Palm Beach and Homestead, Florida. The
technique of area probability sampling was used (Monroe and Finkner, 1959).
First of all, large areas which were presumed to have an equal number of
dwellings were selected from aerial photographs. These selected areas were
then mapped for sampling frames and segmented. Segments were then randomly
selected to represent the sample. By using segments of approximately four
adjacent units and then interviewing the whole segment, it was possible to
keep interviewing costs at a minimum and to spot respondents who were pos
sibly "unique" in their life style and water consumption patterns.
The target area covered forty-five traffic zones in Palm Beach County,
Florida. A systematic sampling procedure was then used on these traffic
zones in an attempt to simplify sampling procedures and to produce a manage
able universe from which a two-stage area probability sample, without re
placement, was drawn. The method of random selection, used to draw a starting
point from the first three zones, consisted of simply "reaching in and drawing
out (N=l) different items." From the zone selected, every third zone on the
list was drawn. As a one-third probability of forty-five traffic zones,
fifteen traffic zones were thus selected, from which the two-stage area
probability sample was drawn.
The first stage of the area probability sample consisted of dividing

13
the fifteen zones into 116 smaller ones. These smaller areas were presumed
to have equal numbers of dwellings in each, based upon the previous study
of aerial photographs and upon on-the-spot inspections. Using a table of
random digits, about one-fifth (N=22) of the smaller areas could be identified
on the aerial photographs and thus were selected.
In the second stage of the area probability sample, the twenty-two
selected areas were mapped and divided into 736 segments. Each segment con
tained approximately four adjacent dwelling units. Using random-sampling
techniques, about 15 percent of these segments (N=lll) were selected. Thus,
for the target area of West Palm Beach, the sample consisted of 425 residen
tial dwelling units.
The third stage of the field-work consisted of an area probability
sample of Homestead, Florida. This was carried out in the same manner as
the first stage in Palm Beach County yielding a sample of 137 residential
dwe lUng units.
The fourth stage of the field-work represented a "purposive sample"
(Selltiz, et al., 1965) in the sense that selected for inclusion in the sample
were only those households for which there were completed interview schedules
from the first field-work stage. The final number of such units was 313, of
which 189 were accounted for after checking on vacant dwellings and those
who had moved to new locations. No effort was made to trace the addresses
as the interviews were anonymous and the investigators had only street ad
dresses with which to work.
Data Collection Techniques
To facilitate interviewing and to limit the number of refusals, the
occupants in the sampled households were notified by letter of the impending
interview. The letter explained the purpose of the interview and asked for

14
the occupant's cooperation. This was done for both stages of interviewing.
In the first stage of data collection, an interview schedule (Appendix
A) was designed to collect the necessary demographic information on the house-
holds. This interview schedule also provided information for the socioeconomic
profile of the respondents in the households, their water consumption patterns
and patterns of water use, and the number of water-using items in the house-
holds. In the second stage of data collection, the aforementioned was again
collected with the addition of responses to a set of questions designed to
elicit the respondents' attitudes toward water resources problems.
In the West Palm Beach area, of the 425 residential units selected,
only 257 (about 55 percent) met the following requirements: (1) the household
was occupied, (2) the household had an individual water meter, and (3) there
was a completed interview schedule for the household.
As stated, of the 425 residential units selected for inclusion in the
sample, only 257 met the requirements. However, there were 56 dwelling units
for which only one criterion was missing. These units were selected for inclu-
sion in the second data-collection stage (N=3l3). However, the final "N" was
189 for the target area in the second data-collection stage. Of the 313 resi-
dential dwelling units originally selected for inclusion in this second sample,
59 units were vacant, 47 householders were different residents, and 18 house
holders refused to be interviewed. 1 This concluded the data-collection stages.
Data Processing
Data-processing techniques involved the coding of some items from each
of the interview schedules. After the schedules for the two data-collection
stages were corrected, edited, and coded, the data were transferred to
lThe refusal rate for the first data-collection stage was 13.4 percent (N=425) and for the second, 5.8 percent (N=3l3).

15
eighty-column IBM cards.
Data Analysis
Absolute frequencies and percentage distributions were computed for
the necessary household information needed for this study. Used in testing
relationships among the variables being examined were: (1) Chi Square
(Mueller and Schuessler, 1961), (2) Factor Analysis (Fruchter, 1954),
(3) Guttman Scalogram Analysis (Edwards, 1957), (4) the Kruskal-Wallis
One-Way Analysis of Variance (Siegel, 1956), and (5) the Spearman Rank
Order Correlation Coefficient (Siegel, 1956).
CHAPTER III
CHARACTERISTICS OF THE POPULATION
This chapter is devoted to the presentation of a profile of the
characteristics of the respondents in the total sample. In attempting to
construct a prediction model for water use by a given population structure,
it is imperative that an accurate and descriptive profile of the sample be
given. Data are presented for each subsample separately on the following
demographic and socioeconomic variables: (1) size of households, (2) number
of children, (3) average age of children, (4) education of head of household,
(5) occupational classification of head of household, (6) income of head of
household, and (7) age of husband. These data should prove very valuable in
the subsequent chapters.
Size of Households
Regarding the size of the households, that is, the number of persons
in each household, the Homestead sample had a greater proportion of single
person households than did the West Palm Beach sample. Contrary to what one
might anticipate, given current sociological data on family size and fertility
differentials, the West Palm Beach sample seems to have proportionately more
larger families. While 84.6 percent of the Homestead households have families
of one to four, only 76.6 percent of the West Palm Beach sample fell into
this same category (Table 1). On the other hand, 23.3 percent of the West
Palm Beach sample had families of five or more while only 15.4 percent of
the Homestead families fell into this same category.
16

Number
17
TABLE 1
NUMBER AND PERCENTAGE DISTRIBUTION OF SIZE OF HOUSEHOLDS, HOMESTEAD AND WEST PALM
BEACH, FLORIDA
of Persons Homestead West in the Household Number Percent Number
1 12 8.6 20
2 46 33.6 78
3 32 23.4 53
4 26 19.0 46
5 17 12.5 34
6 or More 4 2.9 26
Total l37 100.0 257
Number of Children
Palm Beach Percent
7.8
30.4
20.6
17.9
l3.2
10.1
100.0
Consistent with the data presented on the size of the households, the
data on the number of children in the households seem contrary to other studies
on the same data. West Palm Beach seemed to have a larger proportion of its
families with a greater number of children. That is, while 86.2 percent of
the Homestead sample had between no children and two children, only 76.6 per-
cent of the West Palm Beach sample had the same number (Table 2). But, 23.4
percent of the West Palm Beach sample had three or more children while only
1 13.8 percent of the Homestead sample fell into this same category.
lIt should be noted that there is a large United States Air Force installation located in the Homestead area which may account for the apparent "discrepancies" on size of household and number of children data.

18
TABLE 2
NUMBER AND PERCENTAGE DISTRIBUTION OF CHILDREN IN HOUSEHOLDS, HOMESTEAD AND WEST PALM
BEACH, FLORIDA
Number of Children Homestead West in the Household Number Percent Number
0 65 47.4 110
1 29 21.3 51
2 24 17 .5 36
3 13 9.5 36
4 5 3.6 II
5 or More 1 .7 13
Total 137 100.0 257
Average Age of Children
Palm Beach Percent
42.8
19.8
14.0
14.0
4.3
5.1
100.0
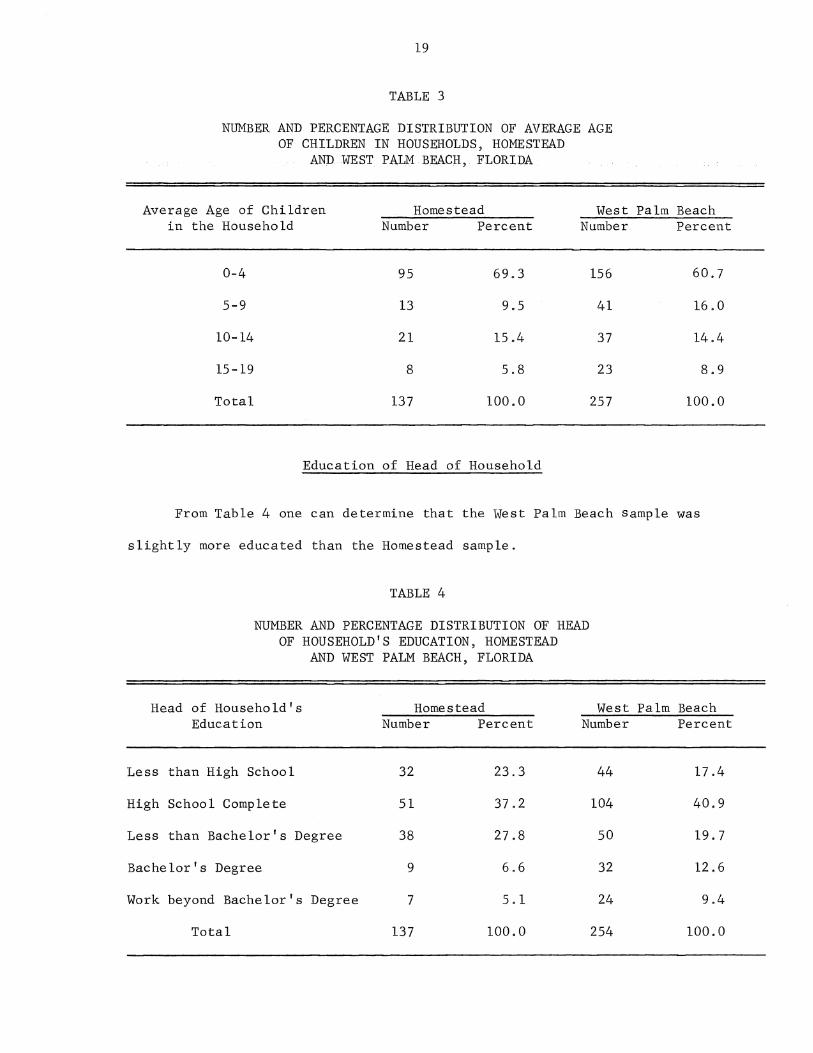
Regarding the average of the children in the households, West Palm
Beach would seem to have slightly older children, that is, proportionately
more West Palm Beach families have older children than do Homestead families.
While 78.8 percent of the Homestead sample have children between the ages
of 0 (the first year) and 9, only 76.7 percent of the West Palm Beach sample
have children of the same ages. Of those families with children 10 to 19
years of age, West Palm Beach had 23.3 percent in this category and Homestead
had 21.2 percent (Table 3).
19
TABLE 3
NUMBER AND PERCENTAGE DISTRIBUTION OF AVERAGE AGE OF CHILDREN IN HOUSEHOLDS, HOMESTEAD
AND WEST PALM BEACH,. FLORIDA
Average Age of Children Homestead West in the Household Number Percent Number
0-4 95 69.3 156
5-9 13 9.5 41
10-14 21 15.4 37
15-19 8 5.8 23
Total 137 100.0 257
Education of Head of Household
Palm Beach Percent
60.7
16.0
14.4
8.9
100.0
From Table 4 one can determine that the West Palm Beach sample was
slightly more educated than the Homestead sample.
Head
TABLE 4
NUMBER AND PERCENTAGE DISTRIBUTION OF HEAD OF HOUSEHOLD'S EDUCATION, HOMESTEAD
AND WEST PALM BEACH, FLORIDA
of Household's Homestead West Education Number Percent Number
Less than High School 32 23.3 44
High School Complete 51 37.2 104
Less than Bachelor's Degree 38 27.8 50
Bachelor's Degree 9 6.6 32
Work beyond Bachelor's Degree 7 5.1 24
Total 137 100.0 254
Palm Beach Percent
17.4
40.9
19.7
12.6
9.4
100.0
20
Twenty-two percent of the West Palm Beach sample had completed at least a
Bachelor's degree, while only about half this number, or 11.7 percent, of
the Homestead sample had done so. This difference holds for any category.
For example, 82.6 percent of the West Palm Beach sample and 76.7 percent of
the Homestead sample had completed at least high school (Table 4).
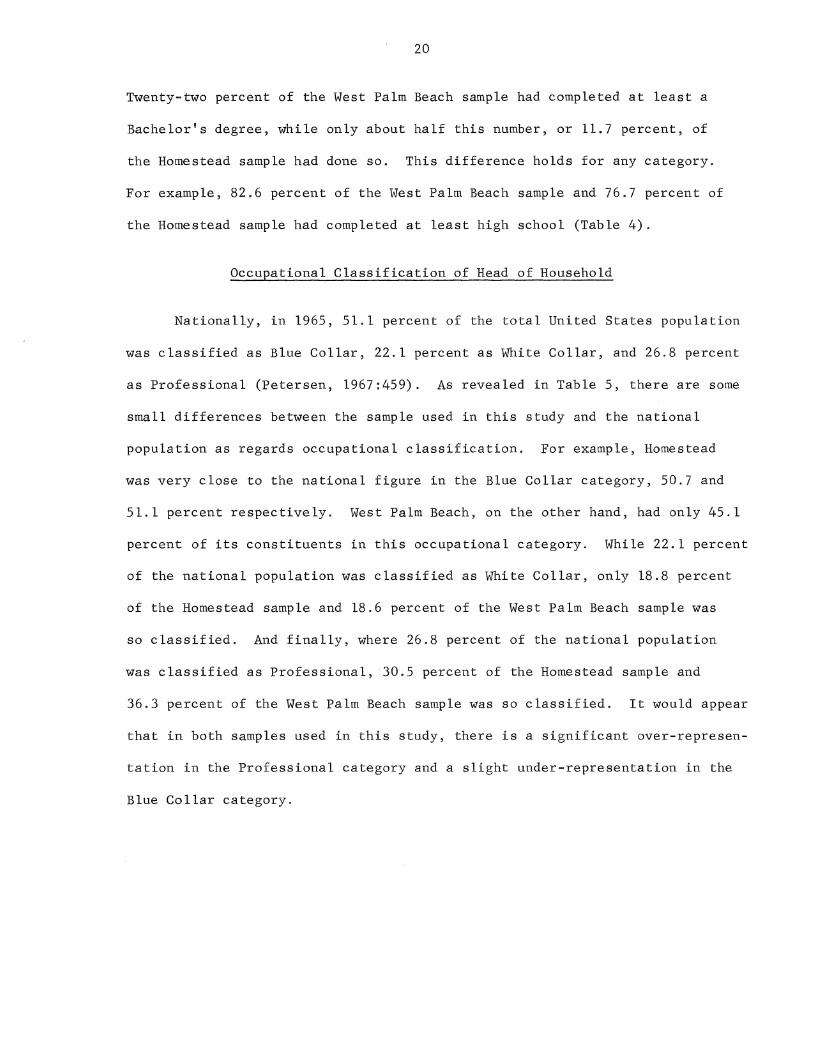
Occupational Classification of Head of Household
Nationally, in 1965, 51.1 percent of the total United States population
was classified as Blue Collar, 22.1 percent as White Collar, and 26.8 percent
as Professional (Petersen, 1967:459). As revealed in Table 5, there are some
small differences between the sample used in this study and the national
population as regards occupational classification. For example, Homestead
was very close to the national figure in the Blue Collar category, 50.7 and
51.1 percent respectively. West Palm Beach, on the other hand, had only 45.1
percent of its constituents in this occupational category. While 22.1 percent
of the national population was classified as White Collar, only 18.8 percent
of the Homestead sample and 18.6 percent of the West Palm Beach sample was
so classified. And finally, where 26.8 percent of the national population
was classified as Professional, 30.5 percent of the Homestead sample and
36.3 percent of the West Palm Beach sample was so classified. It would appear
that in both samples used in this study, there is a significant over-represen
tation in the Professional category and a slight under-representation in the
Blue Collar category.

21
TABLE 5
NUMBER AND PERCENTAGE DISTRIBUTION OF OCCUPATIONAL CLASSIFICATION OF HEAD OF HOUSEHOLDS, HOMESTEAD
AND WEST PALM BEACH, FLORIDA
Occupa tiona 1 United States Homestead West Palm Beach Classificationa PercentD Number Percent Number Percent
Laborers and Service Workers 7.2 3 4.3 22 10.2
Operatives and Kindred Workers 31.5 10 14.5 14 6.5
Craftsmen, Foremen, and Kindred Workers 12.4 22 31.9 61 28.4
Sales Workers 6.5 10 14.5 18 8.4
Clerical and Kindred 15.6 3 4.3 22 10.2
Managers, Officials, and Proprietors 13.9 8 11.6 24 11.2
Professional, Technica 1, and Kindred Workers 12.9 l3 18.9 54 25.1
Total 100.0 69 100.0 215 100.0
a Blue Collar includes laborers and service workers, operatives and kindred workers, and craftsmen, foremen and kindred workers. White Collar includes sales workers and clerical and kindred workers. Professional includes managers, officials and proprietors, professional, technical and kindred workers.
bActual numbers not available so percentages only can be presented.
Income of Head of Household
It would appear from Table 6, that West Palm Beach has a higher average
income per head of household than does the Homestead sample. Sixty-five
percent of the West Palm Beach sample earned between $6,000 and $14,999 per
year while only 42.8 percent of the Homestead sample earned this much. The
mode for the Homestead sample would appear to have been between $4,500 and

22
$5,999, while for the West Palm Beach sample it was between $10,000 and
$14,999. As has been earlier demonstrated (Dasgupta, 1968), and as will
be shown later in this study, income tends to explain a good deal of the
variation found in water consumption.
Income of
TABLE 6
NUMBER AND PERCENTAGE DISTRIBUTION OF HEAD OF HOUSEHOLD'S INCOME, HOMESTEAD AND
WEST PALM BEACH, FLORIDA
Homestead West Head of Household Number Percent Number
$ -0- - $ 2,999 20 15.3 12
3,000 - 4,499 24 18.3 20
4,500 - 5,999 28 21.4 26
6,000 - 7,999 25 19.1 48
8,000 - 9,999 17 13.0 45
10,000 - 14,999 14 10.7 61
15,000 - 19,999 3 2.2 11
20,000 or more 0 0.0 12
Total 131 100.0 235
Age of Husband
Palm Beach Percent
5.1
8.5
11.1
20.4
19.1
26.0
4.7
5.1
100.0
Table 7 reveals that the West Palm Beach population is somewhat older
than the Homestead population. When one divides the population into under
forty and over forty years of age, the Homestead population had 55.4 percent
of its husbands under forty and the West Palm Beach sample had only 43.2 per-
cent of its husbands under forty. In the middle ages of 40 years to 59 years,
the West Palm Beach sample was greater with 41 percent of its husbands in this

23
age category while Homestead had 27.7 percent. It is only in the age category
of 60 years of age or older that Homestead exceeded West Palm Beach, 17.3 per-
cent and 15.8 percent respectively. The modal age group in Homestead was the
20-29 years of age range (N=33.9%), while the modal age range in Palm Beach
County was twenty years older (26% in the 40-49 years of age range), The
analysis of the data on age enables one to see that the income differences
and family size differences previously noted are largely explained by the
differential age distribution in the two areas.
Average Age of Husband
20-29
30-39
40-49
50-59
60-69
70 or more
Total
TABLE 7
NUMBER AND PERCENTAGE DISTRIBUTION OF AGES OF HUSBAND IN HOUSEHOLDS, HOMESTEAD
AND WEST PALM BEACH, FLORIDA
Homestead West Number Percent Number
41 33.9 48
26 21.5 50
15 12.8 59
18 14.9 34
11 9.1 25
10 8.2 11
121 100.0 227
Summary
Palm Beach Percent
21.2
22.0
26.0
15.0
11. 0
4.8
100.0
In general, when one compares the West Palm Beach sample with the Home-
stead sample, the following appears: (1) West Palm Beach has proportionately
more larger families, (2) West Palm Beach had a larger proportion of its
families with a greater number of children, and (3) West Palm Beach had a
24
larger proportion of its families with older children. Additionally, the
head of the household in West Palm Beach, when compared to the head of the
household in Homestead, was: (1) more likely to have completed a high school
education and a college education, (2) more likely to be a professional worker
and less likely to be a blue collar worker, (3) more likely to earn more, and
(4) was slightly older.

CHAPTER IV
WATER CONSUMPTION BY HOUSEHOLD CHARACTERISTICS
In this chapter an attempt will be made to focus on the relationship
between the amount of water consumed in households and the demographic and
socioeconomic characteristics of these households. Contingency tables will
be presented which represent cross-tabulation of the consumption of water
with information on family size, number of children, average age of children,
education of the head of household, occupation of the head of household, in
come of the head of household, number of water appliances and fixtures,
description of water-using appliances and fixtures, and determinants of
water consumption.
For purposes of analysis, four categories of water consumption were
established. The first group of households had a fairly low consumption of
water, under 3,000 gallons per month, or about 100 gallons per day. The
second group, which proved to be a modal for Homestead but not for West Palm
Beach, had a maximum daily use of about 200 gallons per day. The third
group had a maximum use of about 300 gallons per day per household, and the
fourth group had a minimum daily consumption of over 300 gallons.
Water Consumption by Size of Household
In an effort to determine differential water consumption in the sampled
households, analysis was first made on the size of households and water con
sumption. In Homestead, ina small household of four persons or less (85
percent fell into this category), 40 percent of the households used between
25
26
4,000 and 6,000 gallons a month. The remainder of the households is fairly
evenly distributed over the other categories (Table 8). This pattern re
peats itself for the families of five or more with the exception of the 1,000
to 3,000 gallons per month category, where only 14.3 percent used this little
water. Thus, at least in the Homestead sample, the size of the household
did not seem to contribute much to differential consumption since the per
centages in Table 8 were fairly evenly distributed.
In West Palm Beach however, both the small and the large families were
heavy users. The small households constituted about three-fourths of the
West Palm Beach sample and the large households about one-fourth. Among the
large households, two-thirds showed high water consumption as compared with
one-third of the small households. With no large households using less than
4,000 gallons per month in the West Palm Beach area, one could speculate
that there is a positive relationship between the number of persons in the
household and differential water consumption in West Palm Beach.
Water Consumption by Number of Children
To get at the relationship between number of persons in the household
and differential water consumption further, the number of children in the
household was tabulated with water consumption. The number of children was
dichotomized into two or fewer and three or more children in the household.
With no major changes, Table 9 revealed the pattern described above with size
of household. It would seem reasonable, then, to state that the number of
children and, consequently, the size of the household does influence water
consumption, at least for the West Palm Beach area.

TABLE 8
NUMBER AND PERCENTAGE DISTRIBUTION OF SIZE OF HOUSEHOLD AND WATER CONSUMPTION, HOMESTEAD AND
WEST PALM BEACH, FLORIDA
-Monthly Water Consumption
in Thousands of Gallons
Size of 1 - 3 4 - 6 7 - 9 10 or More Household Number Percent Number
Homestead (a)
1 - 4 26 22.4 45
5 or more 3 14.3 9
West Palm Beach (b)
1 - 4 33 16.7 56
5 or more 0 0.0 11
(a) Chi square equals 0.843--p. (.90 (b) Chi square equals 20.787--p.(.001
Percent Number Percent Number Percent
38.8 23 19.8 22 19.0
42.9 4 19.0 5 23.8
Total
28.4 44 22.4 64 32.5
18.3 13 21.7 36 60.0
Total
Total Number Percent
116 100.0 (84.7)
N '-J
21 100.0 (15.3)
137 (100.0)
197 100.0 (76.6)
60 100.0 (23.4)
257 (100.0)

Number of
TABLE 9
NUMBER AND PERCENTAGE DISTRIBUTION OF NUMBER OF CHILDREN IN HOUSEHOLD AND WATER CONSUMPTION, HOMESTEAD
AND WEST PALM BEACH, FLORIDA
Monthly Water Consumption in Thousands of Gallons
Children in 1 - 3 4 - 6 7 - 9 10 or More Household Number Percent Number Percent Number Percent Number Percent
Homestead (a)
2 or less 26 22.0 46 39.0 23 19.5 23 19.5
3 or more 3 15.9 S 42.1 4 21.0 4 21.0
Total West Palm Beach (b)
2 or less 33 16.S 56 2S.4 43 21.S 65 33.0
3 or more 0 0.0 11 lS.3 14 23.3 35 5S.4
Total
(a) Chi square equals 0.3S0--p. (.0.95 (b) Chi square equals 19.466--p. <:;001
Total Number Percent
l1S 100.0 (S6.3)
N 00
19 100.0 ~13.7)
137 (100.0)
197 100.0 (76.6)
60 100.0 (23.4)
257 (100.0)
29
Water Consumption by Average Age of Children
Does age composition affect water consumption in the household? It
may be that having younger children necessitates more water than having
teenagers in the household. To determine this, the data were dichotomized
into families with children nine years and younger and children ten years
and older, the latter representing the threshold of the teens. Table 10
reveals that the data for the Homestead area are inconclusive; about the
same proportion of families with young children consumed as much water as
those families with older children. In the West Palm Beach area, however,
there does appear to be some relationship, only in the opposite direction.
That is, proportionately more families with older children use more water
than those with younger children.
The data would tend to support the notion that the number of people
in the household affects water consumption directly. However, it was earlier
stated that the major factor in water consumption is the socioeconomic status
of the family and not family size. To test for this relationship, data on
education, occupation, and income of the head of the household was cross-
tabulated with water consumption.
Water Consumption by Education of Head of Household
The variable of education of the head of household was trichotomized,
using graduation from high school and from college as the cutting points
(Table 11). In comparing the two areas it can be determined that only about
11 percent of the Homestead sample had a college education as compared with 21
percent of the West Palm Beach sample. Among the big water consumers, the
more educated were slightly over-represented in both samples, with the pattern
being more pronounced in the West Palm Beach area. Since only about one-fifth

TABLE 10
NUMBER AND PERCENTAGE DISTRIBUTION OF AVERAGE AGE OF CHILDREN IN HOUSEHOLD AND WATER CONSUMPTION,
HOMESTEAD AND WEST PALM BEACH, FLORIDA
Monthly Water Consumption in Thousands of Gallons
Average Age 1 - 3 4 - 6 7 - 9 10 or More Total of Children Number Percent Number Percent Number Percen-t Number Percent Number Percent
Homestead (a)
9 or less 26 24.1 42 38.9 19 17.6 21 19.4 108 100.0 (78.8)
w 10 or more 3 10.3 12 41.4 8 27.6 6 20.7 29 100.0 0
(21.1)
Total 137 (l00.0) West Palm Beach (b)
9 or less 33 16.8 57 28.9 36 18.3 71 36.0 197 100,0 (76.6)
10 or more a 0.0 10 16.7 21 35.0 29 48.3 60 100.0 (23,4)
Total 257 (100.0)
(a) Chi square equals 3.20-p. (.50 (b) Chi square equals 20. ll--p. (.001

TABLE 11
NUMBER AND PERCENTAGE DISTRIBUTION OF YEARS OF EDUCATION COMPLETED BY HEAD OF HOUSEHOLD, AND WATER CONSUMPTION,
HOMESTEAD AND WEST PALM BEACH, FLORIDA
Monthly Water Consumption in Thousands of Gallons
Years of Education Completed by Head 1 - 3 4 - 6 7 - 9 10 or More Total
of Household Number Percent Number Percent Number Percent Number Percent Number Percent
Homestead (a)
11 or less 8 25.0 13 40.6 6 18.8 5 15.6 32 100.0 (23.4)
12 - 15 17 19.1 35 39.3 19 21.4 18 20.2 89 100.0 (64.9) \.J..)
I-'
16 or more 4 19.1 6 37.5 2 12 .5 4 25.0 16 100.0 (11. 7)
Total l37 (100.0) West Palm Beach (b)
11 or less 4 9.1 l3 29.5 14 31.0 13 19.6 44 100.0 (17.4)
12 - 15 26 16.9 41 26.6 30 19.5 57 37.0 154 100.0 (61.3)
16 or more 3 5.4 12 21.4 12 21.4 29 51.8 56 100.0 (21.3)
Total 251 (l00.0)
(a) Chi square equals 1. 55--p. <.98 (b) Chi square equals 12.79--p.'.05

32
of the population had less than a high school education, education would
seem not to be a discriminating variable, unless one considers the second
category of twelve to fifteen years of education as the breaking point.
One could, of course, assume that the older population had less education
proportionately and lived in smaller households and thus consumed less water.
The age distribution of the husband attests to this fact when the age is
fifty or older. However, one should keep in mind that the variables dis-
cussed described as head of household need not describe the husband of the
household. In some cases where the families were not complete, the head of
the household was not the husband, so that education, income, and occupation
portray a central tendency.
Water Consumption by Occupation of Head of Household
The second indicator of socioeconomic status is occupation. Using
seven occupational categories, the two samples were dichotomized into two
occupational categories: manual and nonmanual (Table 12). It appeared
from the data that nonmanual occupations are more clearly associated with
high water consumption than are manual occupations. This pattern holds
somewhat more strongly for the West Palm Beach area than for the Homestead
area.
Water Consumption by Income of Head of Household
Income was the third indicator of socioeconomic status. Using income
of the head of the household, an even stronger relationship was revealed
between the consumption of water and income than was revealed with occupation
(Table 13). Again, Homestead had only one-sixth of the low income households
among high water consumers as opposed to two-fifths of the high income

1 - 3
TABLE 12
NUMBER AND PERCENTAGE DISTRIBUTION OF OCCUPATION OF HOUSEHOLD HEAD AND WATER CONSUMPTION,
HOMESTEAD AND WEST PALM BEACH, FLORIDA
4 - 6
Monthly Water Consumption in Thousands of Gallons
7 - 9 10 or More Occupation of Head of Household Number Percent Number Percent Number Percent Number Percent
Homestead (a)
Manual (b) 6 17.1 15 42.9 10 28.6 4 11.4
Nonmanual (c) 5 14.7 14 41.2 6 17.6 9 26.5
Total West Palm Beach (d)
Manual (b) 14 14.4 25 25.8 27 27.8 31 32.0
Nonmanual (c) 12 10.2 27 22.9 23 19.5 56 47.4
Total
(a) Chi square equals 3.00--p. (50
Total Number Percent
35 100.0 (50. 7)
34 100.0 (49.3)
69 (100.0)
97 100.0 (45. 1)
118 100.0 (54.9)
215 (100.0)
(b) Manual includes laborers and service workers, operatives and kindred workers, craftsmen, foremen, and kindred workers.
(c) Nonmanual includes sales workers, clerical and kindred workers, managers, officials proprietors. professional, technical and kindred workers.
(d) Chi square equals 5.7l--p.(.2.0
l;..l l;..l

TABLE 13
NUMBER AND PERCENTAGE DISTRIBUTION OF INCOME OF HOUSEHOLD HEAD AND WATER CONSUMPTION,
HOMESTEAD AND WEST PALM BEACH, FLORIDA
Monthly Water Consumption in Thousands of Gallons
Income of 1 - 3 4 - 6 7 - 9 10 or More Total Household Head Number Percent Number Percent Number Percent Number Percent Number Percent
Homestead (a)
$0 - $4,999 16 36.4 14 31.8 7 15.9 7 15.9 44 100.0 (33.6)
$5,000 - $9,999 8 11.7 33 47.1 17 24.3 12 17.2 70 100.0 (53.5) w
.j>
$10,000 or more 3 17.6 5 29.1 2 1l.8 7 41.2 17 100.0 (12.9)
Total 131 (100.0) West Palm Beach (b)
$0 - $4,999 5 15.6 12 37.5 9 28.1 6 18.8 32 100.0 (13.6)
$5,000 - $9,999 16 13.5 35 29.4 30 25.2 38 31.9 119 100.0 (50.6)
$10,000 or more 8 8.5 13 15.5 15 17.9 45 57.1 84 100.0 (35.8)
Total 235 (100.0)
(a) Chi square equals l6.451--p.(.02 (b) Chi square equals 20.289--p. <.001
35
households. Income also discriminated water consumption in West Palm Beach
as about three times as many high income households and high water consumers
appeared when compared to low income water consumers. Income, as shown in
other studies (i.e., Spaulding, 1967), proved to be the most discriminating
of the socioeconomic variables used in this study.
Water Consumption by Number of Water Appliances
There seems little doubt that socioeconomic status, especially as in-
dicated by income, is important in discriminating how much water a household
consumes. Since the consumption of water is more or less dependent on the
facilities through which the use is possible, the relationship between the
number of water-using appliances and water fixtures and the amount of water
consumed was explored (Table 14). Dichotomizing the appliances into ten or
less and eleven or more, it was revealed that three-fourths of the households
in Homestead were "appliance-poor" when compared to West Palm Beach. It
would seem additionally, that appliances and fixtures prove to be weak pre-
dictors of water consumption in Homestead but relatively good predictors in
West Palm Beach.
The data have shown two things to this point. One, a fairly accurate
profile of the two samples of households has been shown. Second, the cir-
cumstances surrounding high or low water consumption are being revealed.
It should be noted that Homestead charges very low rates for metered
water. The rate is low enough to be considered a flat rate. From other
studies evidence has appeared which indicates that a flat rate tends to
encourage water consumption, not as much in actual household use, but rather
in external use, like the watering of lawns. On the other hand, West Palm
Beach has a graduated water rate which is much more expensive than Homestead
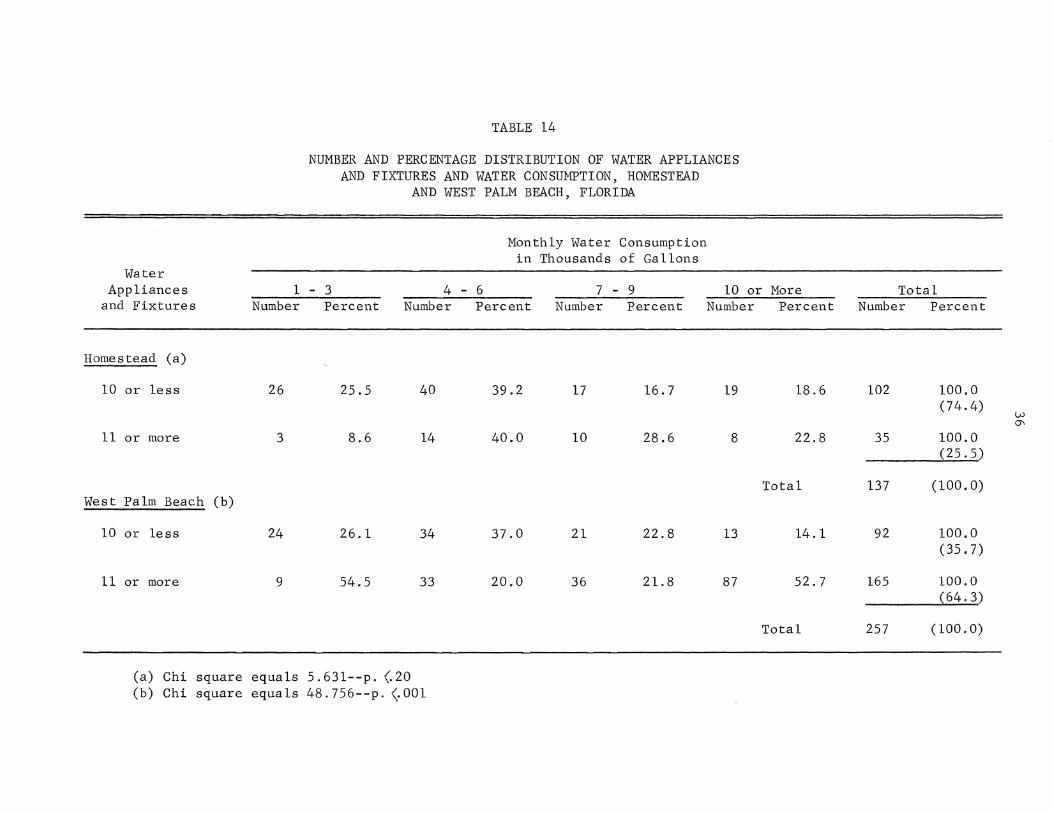
TABLE 14
NUMBER AND PERCENTAGE DISTRIBUTION OF WATER APPLIANCES AND FIXTURES AND WATER CONSUMPTION, HOMESTEAD
AND WEST PALM BEACH, FLORIDA
Monthly Water Consumption in Thousands of Gallons
Water Appliances
and Fixtures 1 - 3 4 - 6 7 - 9 10 or More
Number Percent Number Percent Number Percent Number Percent
Homestead (a)
10 or less 26 25.5 40 39.2 17 16.7 19 18.6
11 or more 3 8.6 14 40.0 10 28.6 8 22.8
Total West Palm Beach (b)
10 or less 24 26.1 34 37.0 21 22.8 13 14.1
11 or more 9 54.5 33 20.0 36 21.8 87 52.7
Total
(a) Chi square equals 5.631--p. (.20 (b) Chi square equals 48.756--p. <.001
Total Number Percent
102 100.0 (74.4)
w C5\
35 100.0 (25.5)
137 (100.0)
92 100.0 (35.7)
165 100.0 (64.3)
257 (100.0)
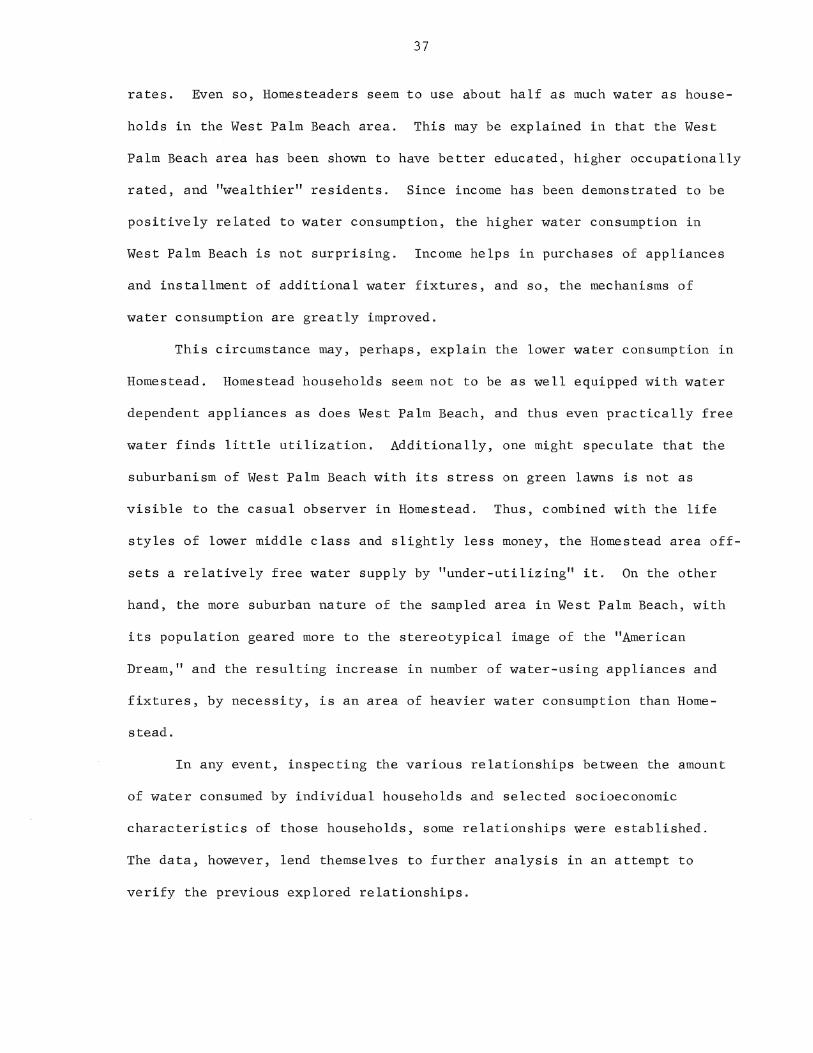
37
rates. Even so, Homesteaders seem to use about half as much water as house
holds in the West Palm Beach area. This may be explained in that the West
Palm Beach area has been shown to have better educated, higher occupationally
rated, and "wealthier" residents. Since income has been demonstrated to be
positively related to water consumption, the higher water consumption in
West Palm Beach is not surprising. Income helps in purchases of appliances
and installment of additional water fixtures, and so, the mechanisms of
water consumption are greatly improved.
This circumstance may, perhaps, explain the lower water consumption in
Homestead. Homestead households seem not to be as well equipped with water
dependent appliances as does West Palm Beach, and thus even practically free
water finds little utilization. Additionally, one might speculate that the
suburbanism of West Palm Beach with its stress on green lawns is not as
visible to the casual observer in Homestead. Thus, combined with the life
styles of lower middle class and slightly less money, the Homestead area off
sets a relatively free water supply by "under-utilizing" it. On the other
hand, the more suburban nature of the sampled area in West Palm Beach, with
its population geared more to the stereotypical image of the "American
Dream," and the resulting increase in number of water-using appliances and
fixtures, by necessity, is an area of heavier water consumption than Home
stead.
In any event, inspecting the various relationships between the amount
of water consumed by individual households and selected socioeconomic
characteristics of those households, some relationships were established.
The data, however, lend themselves to further analysis in an attempt to
verify the previous explored relationships.

38
Determinants of Water Consumption: A Factor Analysis
A useful descriptive measure to identify salient components of any
complex set of variables is factor analysis. 1 This technique was used in
an attempt to confirm the relationship between the selected socioeconomic
variables and water consumption. Twelve variables were selected to be factor
analyzed: family size, number of children, age of children, husband's educa-
tion, wife's education, husband's age, occupation of head of household, in-
come of head of household, income of entire family, number of appliances,
and the metered amount of water consumed in one month by each household.
Using this technique, Table 15 revealed that two factors appeared to
account for eight of the twelve variables used. Factor I will hereafter be
referred to as the "Economic Factor" because of the high factor loadings on
the two income variables (income of head of household and income of entire
family), the two appliance variables (number of appliances and appliances
weighted score), and the water consumption variable. Factor II will here-
after be referred to as the "Family Factor" because of the high loading on
family size, number of children, and age of children.
The important finding of the factor analysis is the clear separation
between the Economic Factor and the Family Factor, especially when most of
the variance in the income variables is accounted for, while the overlap
between the income and the socioeconomic variables obtains, by necessity
again, on the part of the demographic factor. In other words whereas one
can explain water consumption by income and assume that members of the house-
hold are the consumers, the number of people in a given household does not
have much to do with the amount of water consumed. This seemingly curious
1 For a more complete description of the technique of Factor Analysis,
see Fruchter, p. 196.

TABLE 15
ROTATED FACTOR MATRIX ON SELECTED SOCIOECONOMIC VARIABLES AND WATER CONSUMPTION
Factor Loadings
Selected Socioeconomic I II Variables Ec.onomLc. Factor FamLly. Factor
Size of family .271 .655
Monthly water consumption .455 .016
Age of husband .064 - .359
Education of husband .156 - .211
Education of wife .094 - .247
Number of children .239 .671
Age of children .327 .497
Occupation of head of household - .361 .054
Income of head of household .624 .097
Income of fami ly .608 .098
Number of appliances .696 - .014
Appliances weighted score .695 .006
Communalities
.502
.207
.133
.069 w \0
.069
.508
.354
.133
.399
.380
.485
.483

40
fact is easy to explain when one considers that high income households may
be using water for purposes unrelated to the physical needs of the household
members. Additionally, such households are more likely to entertain which
may function as numerically enlarged households without ever showing in the
demographic indicators.
An inspection of the zero order correlation matrix which served as the
basis for the factor analysis program will help one further explain and ex
plore the relationship between consumption and the socioeconomic variables.
The incipient clustering which one observes in the two factors identified
(Table 15) was already noticeable in the correlation matrix (Table 16).
Although a number of the coefficients is significant at the .01 level,l
significance which explains reasonable amount of the variance is not as
frequent. For example, income of the head of the household explained 16
percent of the variance when related to the number of appliances, whereas
water consumption correlated to the number of appliances explained 20 per
cent of the variance. These are the strongest relationships observed, if
one disregards the naturally high correlations between variables like the
size of the family and the number of children. Factored out, the number of
appliances, which had the highest loading on the Economic Factor, represents
close to 50 percent of the total variance and close to unity in explained
variance. In other words, the more water dependent appliances and fixtures
in a household, the more likely are these going to be used and consume water.
To this point, enough real differences between the two samples have
been revealed to deserve even further analysis. The factor analysis dealt
with the two areas combined, rather than separately as was done with the
socioeconomic variables. The justification for doing so was that there should
lBY convention in the social sciences, the .05 level of significance is used.

TABLE 16
CORRELATION MATRIX ON SELECTED SOCIOECONOMIC VARIABLES
Selected Socioeconomic Variables Selected Socioeconomic
Variables 1 2 3 4 5 6 7 8 9 10 11 12
1 Size of Family .16 -.25 -.08 -.08 .90 .56 -.04 .21 .21 .18 .21
2; Water Consumed .07 .06 -.01 .13 .14 - .11 .24 .23 .45 .43
3 Age of Husband -.01 .11 -.31 -.06 -.19 -.12 -.15 .13 .13
4 Education of Husband .52 -.04 -.05 -.06 .11 .11 .06 .04
5 Education of Wife -.08 -.08 -.02 .02 .02 .03 .03 ~ t-'
6 Number of Children .60 -.08 .17 .15 .15 .17
7 Age of Children -.14 .24 .23 .24 .26
8 Occupation of Head of Household -.28 -.24 -.26 -.24
9 Income of Head of Household .93 .39 .40
10 Income of Family .38 .38
11 Number of Appliances .96
12 Weighted Score of Appliances

42
be some underlying factors which influence the various relationships between
household water consumption and the socioeconomic variables considered, such
factors should still be revealed. Whatever the shortcomings of the data may
have been, the variables connected to the fluctuation in water consumption
in the two samples are being more clearly explained.
Income as the Major Determinant of Water Consumption
In order to see what type of household environment acts as a restrictive
or encouraging force on water consumption, another set of variables were
cross-tabulated separately for Homestead and for West Palm Beach. The nine
variables used were: size of family, number of children, age of children,
age of husband, education of head of household, occupation of head of house-
hold, income of head of household, number of appliances, and the amount of
water consumed in one month.
Table 17 revealed that for Homestead, the trinity of education, occupa-
tion and income showed some relationship with water consumption. It showed
additionally that water consumption is significantly related to all of the
other variables used. The possession of appliances is related to income
(r=.36) and occupation of the head of the household (r=.30), but neither
coefficient is very strong given the size of the sample.
Looking at the results for the West Palm Beach sample, a stronger
relationship between income and the number of appliances (r=.49) and between
appliances and water consumption (r=.45) was observed. The link between
education, occupation, and income is stronger in West Palm Beach than in
Homestead.
Table 18 revealed that the mean number of appliances and fixtures in
the Homestead households (X=9.49) is on the lower end of the scale. After
the normal number of bathroom fixtures, kitchen sinks, and a few odd faucets,

1 2 3 4 5 6 7 8 9
1 2 3 4 5 6 7 8 9
43
TABLE 17
CORRELATION MATRIX ON SELECTED SOCIOECONOMIC VARIABLES AND WATER CONSUMPTION: HOMESTEAD
AND WEST PALM BEACH
Selected Socioeconomic Variables
Homestead Selected Socioeconomic
Variables 1 2 3 4 5 6 7
Size of Family . 14 -.27 -.07 -.01 .92 .61 Water Consumed -.08 .11 .13 .10 .09 Age of Husband -.29 .07 -.31 -.09 Education of Head of Household .39 .00 - .04 Occupation of Head of Household .05 .04 Number of Children .66 Age of Children Income of Head of Household Number of App liances
Selected Socioeconomic Variables
West Palm Beach Selected Socioeconomic
Variables 1 2 3 4 5 6 7
Size of Family .16 -.32 .00 - .08 .95 .58 Water Consumed .13 .17 .14 .11 .14 Age of Husband -.26 -.06 -.34 -.07 Education of Head of Household .61 .00 .00 Occupation of Head of Household -.09 -.03 Number of Children .57 Age of Children Income of Head of Household Number of Appliances
8 9
.25 .15
.16 .10
.00 .20
.27 .02
.44 .30
.22 .11
.27 .17 .36
8 9
.06 .15
.35 .45 -.06 .12
.45 .25
.43 .25
.01 .12
.13 .24 .49

TABLE 18
ARITHMEiI'IC AVERAGES eX) AND STANDARD DEVIATIONS (S.D.) OF SELECTED SOCIOECONOMIC VARIABLES
Homesteada Selected Socioeconomic
Variables X S.D.
Size of Family 3.03 1.35
Water Consumed 6.83 5.26
Age of Husband 41.33 17.06
Education of Head of Household 12.18 2.69
Occupation of Head of Householdb 4.10 1. 86
Number of Children 1.04 1. 27
Age of Chi ldren 3.90 5.30
Income of Head of Householdc 3.37 1.64
Number of Appliances 9.49 2.13
West Palm Beacha
X S.D.
3.36 1. 64
11.30 10.46
43.48 14.07
12.93 2.66
4.35 2.03
1. 35 1.64
4.90 5.78
4.62 1.73
12.14 3.61
aThe number of subjects averaged for each variable differs according to available data.
bRated from Low Manual (1) to Professional (7).
CRange from No Income (0) to $20,000 or more (8).
+:--+:--

45
Homestead households did not seem to be equipped with much more. The average
age of husbands in Homestead is 41 years, which would probably be modal for
such a population since only residential one-family units were sampled. It
is felt, however, that the suburban one-family residential dwellings are
the main water consumers among the total population. This is due, probably,
to the equipment of the households and the need for water connected with
maintenance of homes on any side of the lot. The mean age for the whole
population in the sample is about 31 years of age, the population in Home
stead being somewhat younger than the population in West Palm Beach.
Summary
Evaluating the findings so far, there is increasing evidence of a
definite relationship between household water consumption and the income
standing of the household. The income standing, however, is tied more closely
to the earning power of the head of the household than to the earning power
of the family as a whole unit. To interpret this minor difference, it can
be assumed that the social standing of the head of the household is related
more directly to the earning of the head of the household than to the aggre
gate dollars a family can bring together. Probably, the additional income is
not concentrated on the needs of the household as such.
The difference between the West Palm Beach and the Homestead households
is striking, but explainable. To the casual observer, the areas sampled in
West Palm Beach carry more of an image of rapid expanding suburbanization
than the two sampled census tracts in Homestead. The "spirit" of the eastern
coast of Florida, with all of its stress on appearance and on status competi
tion, apparently imposes a style of life which becomes more demanding of
water consumption. Water consumption in West Palm Beach does not appear
to be deterred by pricing which, compared to Homestead, is noticeably more
46
expensive.
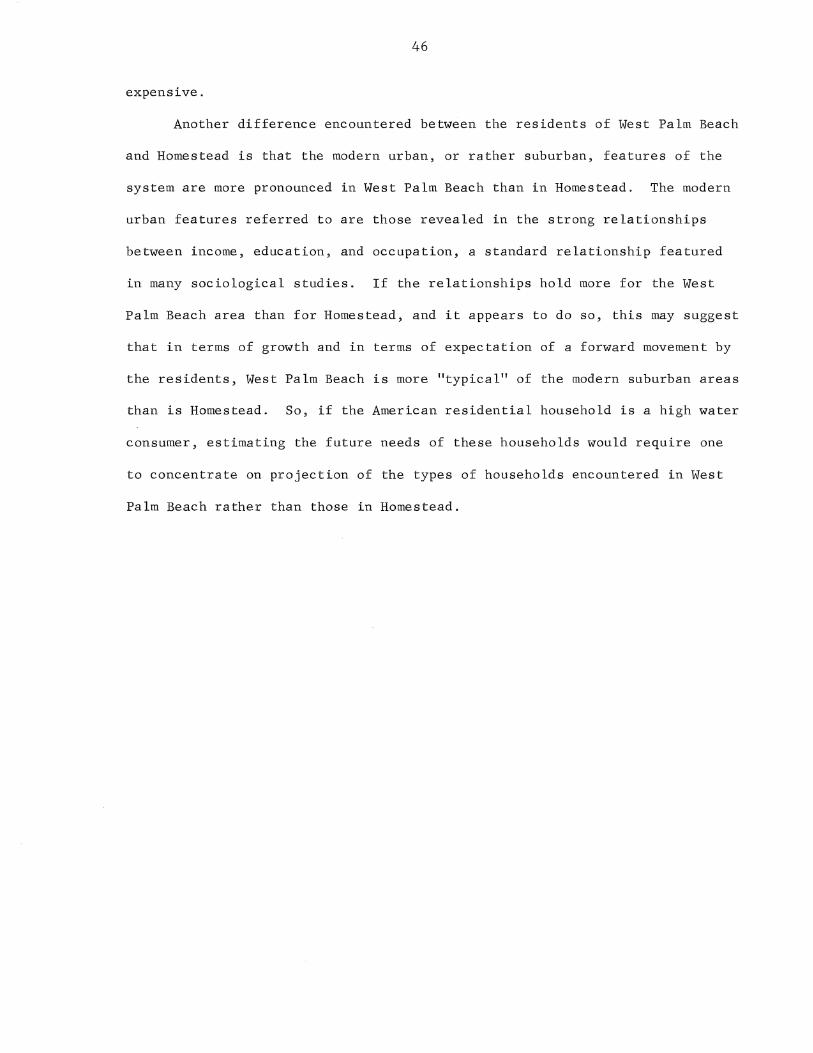
Another difference encountered between the residents of West Palm Beach
and Homestead is that the modern urban, or rather suburban, features of the
system are more pronounced in West Palm Beach than in Homestead. The modern
urban features referred to are those revealed in the strong relationships
between income, education, and occupation, a standard relationship featured
in many sociological studies. If the relationships hold more for the West
Palm Beach area than for Homestead, and it appears to do so, this may suggest
that in terms of growth and in terms of expectation of a forward movement by
the residents, West Palm Beach is more "typical" of the modern suburban areas
than is Homestead. So, if the American residential household is a high water
consumer, estimating the future needs of these households would require one
to concentrate on projection of the types of households encountered in West
Palm Beach rather than those in Homestead.

CHAPTER V
AN ATTITUDINAL PROFILE OF WATER CONSUMERS TOWARDS WATER CONSERVATION
The effort of this chapter was directed at determining the attitude of
the respondent toward water resources as such. An attempt was made to develop
an attitudinal scale to measure the attitudes of a particular population of
respondents toward water resources. Of concern were the attitudes of the
respondents regarding: (1) water resources as an economic commodity,
(2) their willingness to do something about the water resources problems,
(3) their awareness of water resources problems, and (4) their knowledge of
certain socioeconomic relationships and availability of water. Once the
scale had been developed, the scale score of each respondent was compared
with certain socioeconomic variables. The variables considered were family
size, water consumption, age of husband, number of children, income of the
head of household, education of the head of household, and the occupation
of the head of household.
From the interview schedule administered during the second stage of
the field work, nineteen attitudinal statements were administered to the
respondents. They were asked to respond with the five categories of "Strongly
Agree," "Agree," "Undecided," "Disagree," and "Strongly Disagree." The
Guttman scalogram analysis technique was used for analysis. l
lThe Guttman cumulative scaling technique of scalogram analysis was employed. The use of a Guttman scalogram permits one to rank an individual as higher or lower than another according to their responses to a set of statements. An individual with a higher rank than another individual on the same set of statements must also rank as high or higher on every statement in the set as the other individual. " ... this means that a person
47

48
The Rationale for the Variables in the Set
Each variable, or statement, in the set can be placed in one of four
"subuniverses":
1) Statements assigned to subuniverse 1 were intended to discriminate
between those respondents who felt water is an economic commodity which should
be controlled by the government and those respondents who felt otherwise.
2) Statements assigned to subuniverse 2 were intended to discriminate
between those respondents who would be willing to make a sacrifice in time
and/or effort to provide for the proper use and distribution of water and
those who felt the opposite.
3) Statements assigned to subuniverse 3 were intended to discriminate
between those respondents who were aware of a water resources problem and
those who seem to take the existence of water for granted.
4) Statements assigned to subuniverse 4 were intended to discriminate
between those respondents who were knowledgeable and those who were not
knowledgeable about: (a) the relationship between socioeconomic status,
water consumption, and number of water-using appliances, and (b) the presumed
availability of water and water resources in general, as indicated by the
amount of thought which they had given the water resources problem.
The percentage of favorable responses to each variable in the set was
established through a cutting point for each variable. The Cornell technique
(Edwards, 1957:178-184) was then employed, assigning 1 to indicate favorable
must also be just as favorable or more favorable in his response to every statement in the set than the other person" (Edwards, 1957:172). The score is an indication of the rank-order position of individuals with respect to the underlying variable. Unidimensionality is reflected when a single score is derived which is the measure of one factor only. If a single, quantitative score is to represent, without ambiguity, the behavior of an individual on the set of items in the interview schedule, then it must be possible, knowing each respondent's score, to know his behavior on each and every statement in the set. Guttman calls this the principle of reproducibility (Remmers, 1954:99).

49
responses and 0 to indicate unfavorable responses to the dichotomous categories
(Table 19).
TABLE 19
ITEM SET WITH ASSIGNED SUBUNIVERSES AND PERCENTAGE FAVORABLE RESPONSES
Statements
*1. Problems of water supply are only temporary.
2. If there were a shortage of water, we would cut our use of water.
*3. The amount of water people use depends on how much water is available.
*4. Nature has a way to solve water supply problems before they get serious.
5. We would cut our water consumption if necessary.
*6. The government should control the price of water.
7. Water reclaimed from waste is as good as any other water.
8. During water shortages, there should be a restriction of the watering of lawns.
9. The water-using appliances a family has identifies their position in society.
10. We would cut down our use of water if we had to.
*11. Mankind has a right to free and unlimited use of water.
*12. Water is the most abundant natural resource.
13. The amount of water people use depends on the number of water-using appliances they have.
Subuniverse
3
2
4
3
2
1
4
2
4
2
3
3
4
Favorable
.43
.49
.36
.63
.09
.37
.31
.18
.53
.09
.52
.44
.78
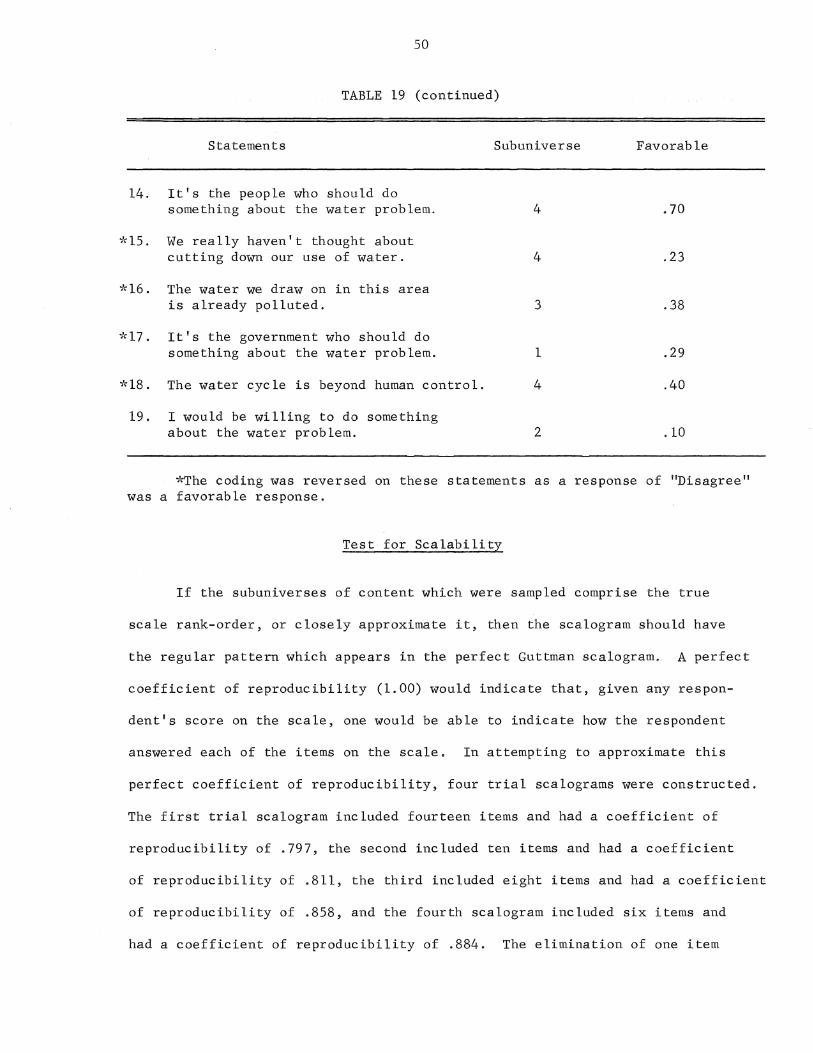
50
TABLE 19 (continued)
Statements Subuniverse Favorable
14. It's the people who should do something about the water problem. 4 .70
*15. We really haven't thought about cutting down our use of water. 4 .23
*16. The water we draw on in this area is already polluted. 3 .38
*17. It's the government who should do something about the water problem. 1 .29
*18. The water cycle is beyond human control. 4 .40
19. I would be willing to do something about the water problem. 2 .10
*The coding was reversed on these statements as a response of "Disagree" was a favorable response.
Test for Scalability
If the subuniverses of content which were sampled comprise the true
scale rank-order, or closely approximate it, then the scalogram should have
the regular pattern which appears in the perfect Guttman scalogram. A perfect
coefficient of reproducibility (1.00) would indicate that, given any respon-
dent's score on the scale, one would be able to indicate how the respondent
answered each of the items on the scale. In attempting to approximate this
perfect coefficient of reproducibility, four trial scalograms were constructed.
The first trial scalogram included fourteen items and had a coefficient of
reproducibility of .797, the second included ten items and had a coefficient
of reproducibility of .811, the third included eight items and had a coefficient
of reproducibility of .858, and the fourth scalogram included six items and
had a coefficient of reproducibility of .884. The elimination of one item
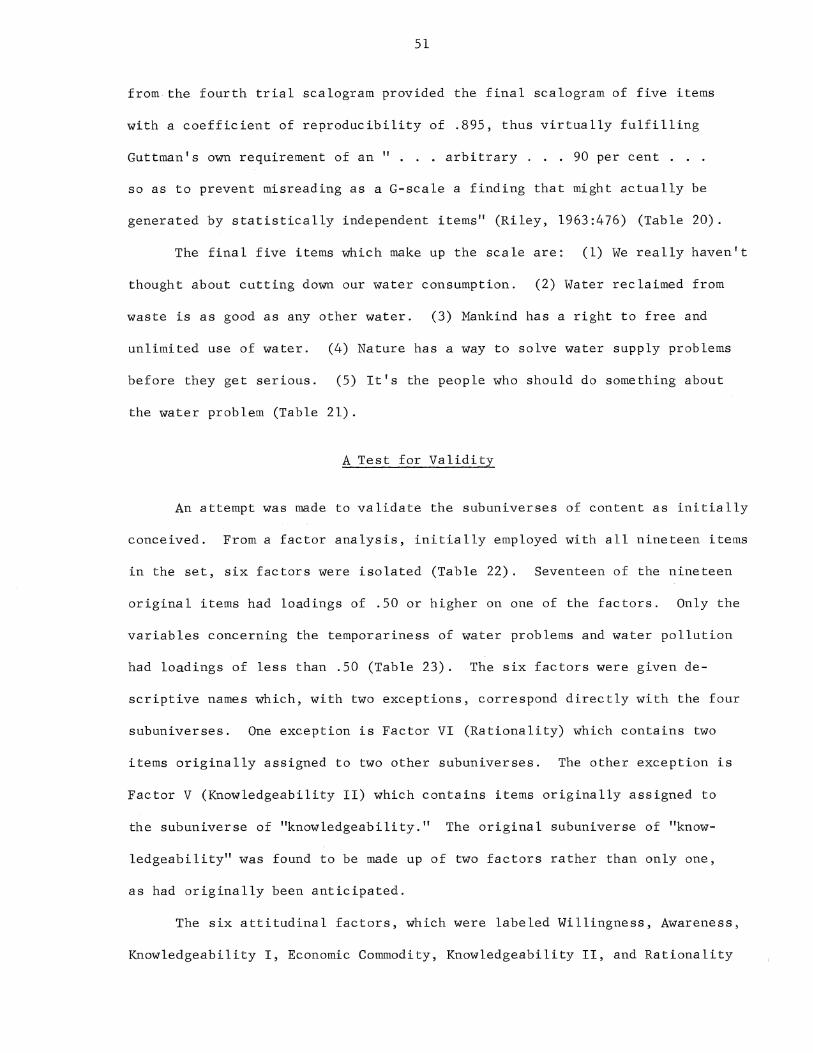
51
from the fourth trial scalogram provided the final scalogram of five items
with a coefficient of reproducibility of .895, thus virtually fulfilling
Guttman's own requirement of an " ... arbitrary. 90 per cent . . .
so as to prevent misreading as a G-scale a finding that might actually be
generated by statistically independent items" (Riley, 1963:476) (Table 20).
The final five items which make up the scale are: (1) We really haven't
thought about cutting down our water consumption. (2) Water reclaimed from
waste is as good as any other water. (3) Mankind has a right to free and
unlimited use of water. (4) Nature has a way to solve water supply problems
before they get serious. (5) It's the people who should do something about
the water problem (Table 21).
A Test for Validity
An attempt was made to validate the subuniverses of content as initially
conceived. From a factor analysis, initially employed with all nineteen items
in the set, six factors were isolated (Table 22). Seventeen of the nineteen
original items had loadings of .50 or higher on one of the factors. Only the
variables concerning the temporariness of water problems and water pollution
had loadings of less than .50 (Table 23). The six factors were given de
scriptive names which, with two exceptions, correspond directly with the four
subuniverses. One exception is Factor VI (Rationality) which contains two
items originally assigned to two other subuniverses. The other exception is
Factor V (Knowledgeability II) which contains items originally assigned to
the subuniverse of "knowledgeability." The original subuniverse of "know
ledgeability" was found to be made up of two factors rather than only one,
as had originally been anticipated.
The six attitudinal factors, which were labeled Willingness, Awareness,
Knowledgeability I, Economic Commodity, Knowledgeability II, and Rationality
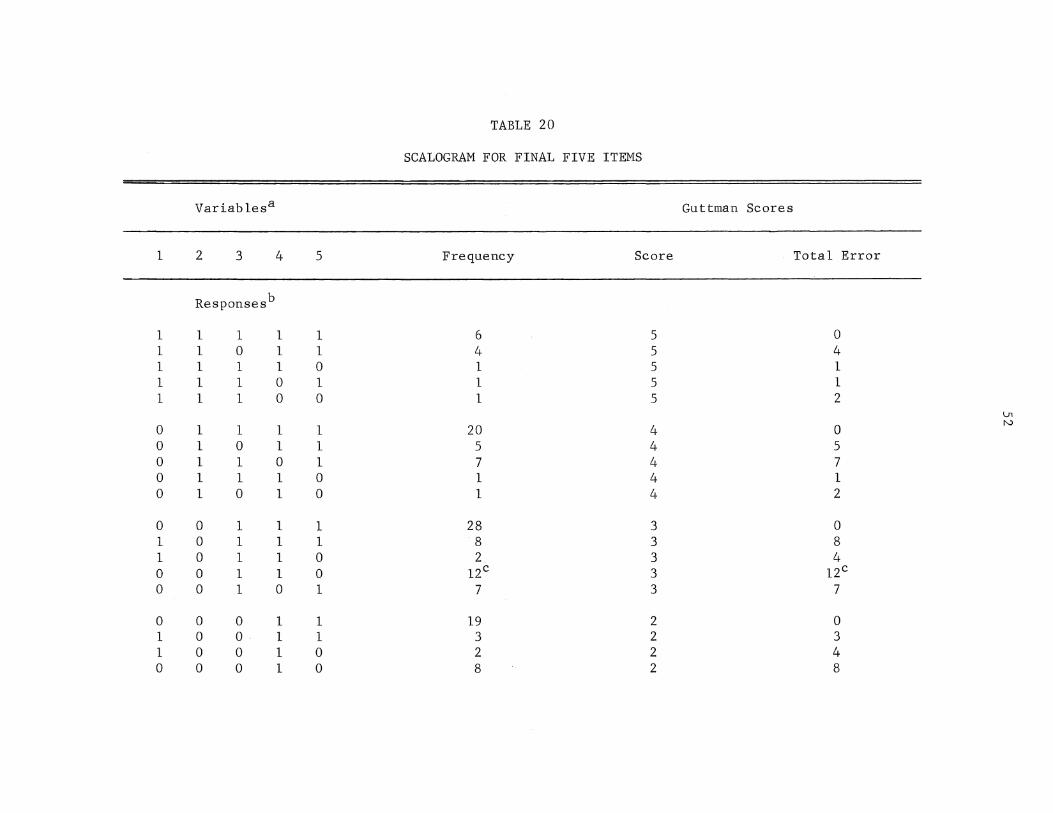
TABLE 20
SCALOGRAM FOR FINAL FIVE ITEMS
Variablesa Guttman Scores
1 2 3 4 5 Frequency Score Total Error
Responses b
1 1 1 1 1 6 5 0 1 1 0 1 1 4 5 4 1 1 1 1 0 1 5 1 1 1 1 0 1 1 5 1 1 1 1 0 0 1 5 2
In
0 1 1 1 1 20 4 0 N
0 1 0 1 1 5 4 5 0 1 1 0 1 7 4 7 0 1 1 1 0 1 4 1 0 1 0 1 0 1 4 2
0 0 1 1 1 28 3 0 1 0 1 1 1 8 3 8 1 0 1 1 0 2 3 4 0 0 1 1 0 l2c 3 12c
0 0 1 0 1 7 3 7
0 0 0 1 1 19 2 0 1 0 o· 1 1 3 2 3 1 0 0 1 0 2 2 4 0 0 0 1 0 8 2 8

Variables
1 2 3
0 0 0 1 1 0 0 1 0 1 0 0
0 0 0 1 0 1 1 1 0 1 0 0 0 1 0 0 0 1
Total Frequency of "1" Response:
4 5
0 1 0 1 0 1 0 1
0 0 0 0 0 0 0 0 0 0 0 0
43 58 98 120 133
TABLE 20 (continued)
Guttman Scores
Frequency Score Total Error
13 1 0 2 1 4 5 1 5 5 1 5
14 0 0 1 0 2 1 0 2 6 0 6 3 0 3 3 0 3
189 99
aThe variables coincide with the items in the interview schedule in the following manner: variable 1 equals item 15, variable 2 equals item 7, variable 3 equals item 11, variable 4 equals item 4, and variable 5 equals item 14.
b Favorable response equals 1, unfavorable response equals O.
cThis scale-type exceeds the .05 percent error for any scale-type. Investigation into the twelve respondents of this scale type revealed that nine have fourteen years or more of education, three have twelve years of education. This was the only variable that was discovered to be "common" among the scale type. For the entire sample, 30 percent were found to have fourteen years or more of education and 42 percent were found to have twelve years of education. The "common denominator" of education for this particular scale-type mayor may not explain the high occurrence of the scale type.
In w

Variable
*1
2
*3
*4
5
54
TABLE 21
FINAL FIVE STATEMENTS FOR GUTTMAN SCALE
Statement
15
7
11
4
14
Statement
We really haven't thought about cutting down our use of water.
Water reclaimed from waste is as good as any other water.
Mankind has a right to free and unlimited use of water.
Nature has a way to solve water supply problems before they get serious.
It's the people who should do something about the water problem.
*Statements have been reverse coded.
Favorable Responses
.23
.31
.52
.63
.70

No.
5 10
2 19
11 12 4
14 9 7
6 17
15 13 18
3 8
TABLE 22
FACTOR MATRIX OF ATTITUDES TOWARD WATER CONSERVATION
VARIABLES
Description
Cut water consumption if necessary Cut water use if had to If shortage, cut use I'd do something about water problem
Man's right to free water Water most abundant resource Nature solves own problems
People do something Appliances identifies position Water reclaimed is good
Government control price Government do something
We haven't thought about cutting use Water use depends on appliances Water cycle beyond control
I
0.77155 0.73554 0.71484 0.60213
Amount water used depends on amount available Restriction of watering lawns
II
0.71548 0.66522 0.54321
FACTORS
III
0.62379 -0.62293
0.51246
IV
0.78317 0.75615
V
0.59271 -0.51862
0.50614
VI
-0.66340 0.56616
\Jl \Jl
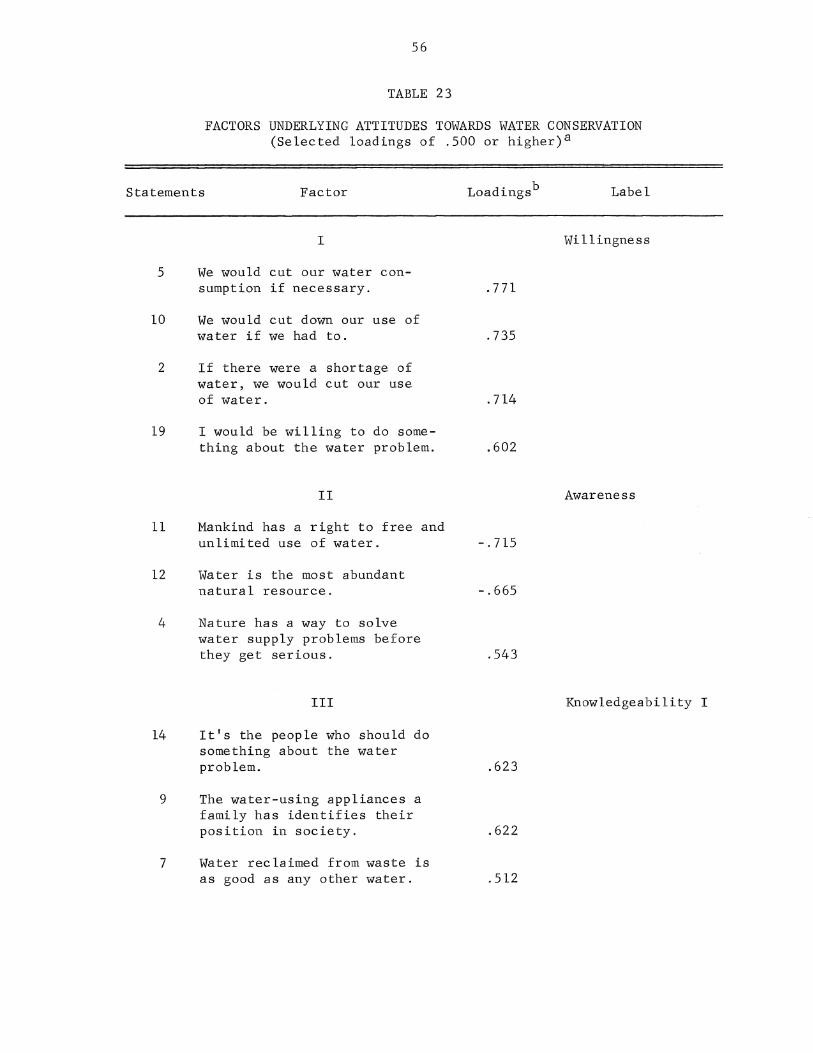
56
TABLE 23
FACTORS UNDERLYING ATTITUDES TOWARDS WATER CONSERVATION (Selected loadings of .500 or higher)a
Statements Factor
5
10
2
19
11
I
We would cut our water consumption if necessary.
We would cut down our use of water if we had to.
If there were a shortage of water, we would cut our use of water.
I would be willing to do something about the water problem.
II
Mankind has a right to free and unlimited use of water.
12 Water is the most abundant natural resource.
4
14
9
7
Nature has a way to solve water supply problems before they get serious.
III
It's the people who should do something about the water problem.
The water-using appliances a family has identifies their position in society.
Water reclaimed from waste is as good as any other water.
Loadingsb Label
Wi llingness
.771
.735
.714
.602
Awareness
-.715
-.665
.543
Knowledgeability I
.623
.622
.512
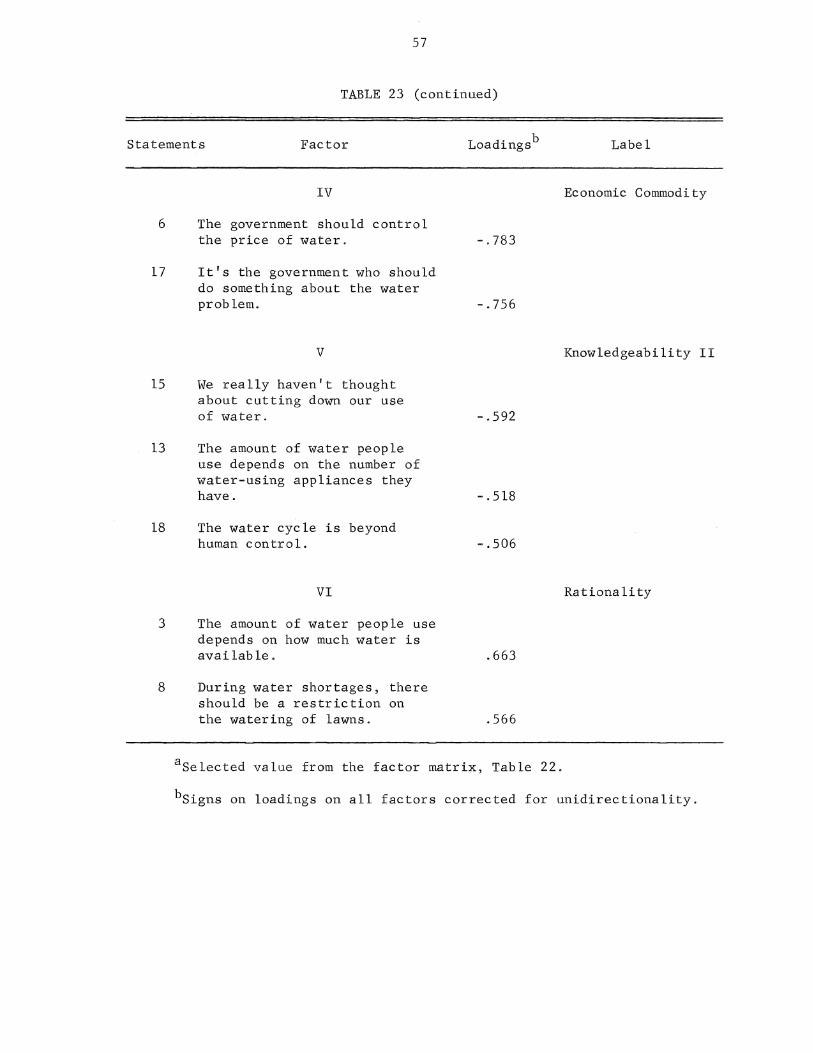
57
TABLE 23 (continued)
Statements Factor Loadingsb
6
17
15
l3
18
3
8
IV
The government should control the price of water.
It's the government who should do something about the water problem.
V
We really haven't thought about cutting down our use of water.
The amount of water people use depends on the number of water-using appliances they have.
The water cycle is beyond human control.
VI
The amount of water people use depends on how much water is available.
During water shortages, there should be a restriction on the watering of lawns.
-.783
-.756
-.592
- .518
-.506
.663
.566
aSelected value from the factor matrix, Table 22.
Label
Economic Commodi ty
Knowledgeability II
Rationality
bSigns on loadings on all factors corrected for unidirectionality.

58
were ranked by the strength of their mean loadings. The ranking developed
as follows: Economic Commodity, Willingness, Awareness, Rationality, Know-
ledgeability I, and Knowledgeability II (Table 24).
TABLE 24
RANK-ORDER OF FACTORS BY MEAN LOADINGS OF ATTITUDES TOWARDS WATER CONSERVATIONa
Factor Name Mean Loadingb
IV Economic Commodity .769
I Willingness .705
II Awareness .641
VI Rationality .614
III Knowledgeability I .586
V Knowledgeability II .539
aDerived from Table 22.
bSigns disregarded.
When the Guttman scale ranks were compared with the corresponding factor
analysis (Table 25), the results fully support the original subuniverses
as initially conceived.
Naming the Guttman Scale
The way in which the final Guttman scale should be read is as follows:
for those respondents who had given considerable thought to the water problem,
it is acceptable to treat water reclaimed from waste as being as good as any
other water, to accept the necessity of control over water exploitation and
misuse, to believe that nature cannot solve supply problems before they
become serious, and finally to acknowledge that the solution of water
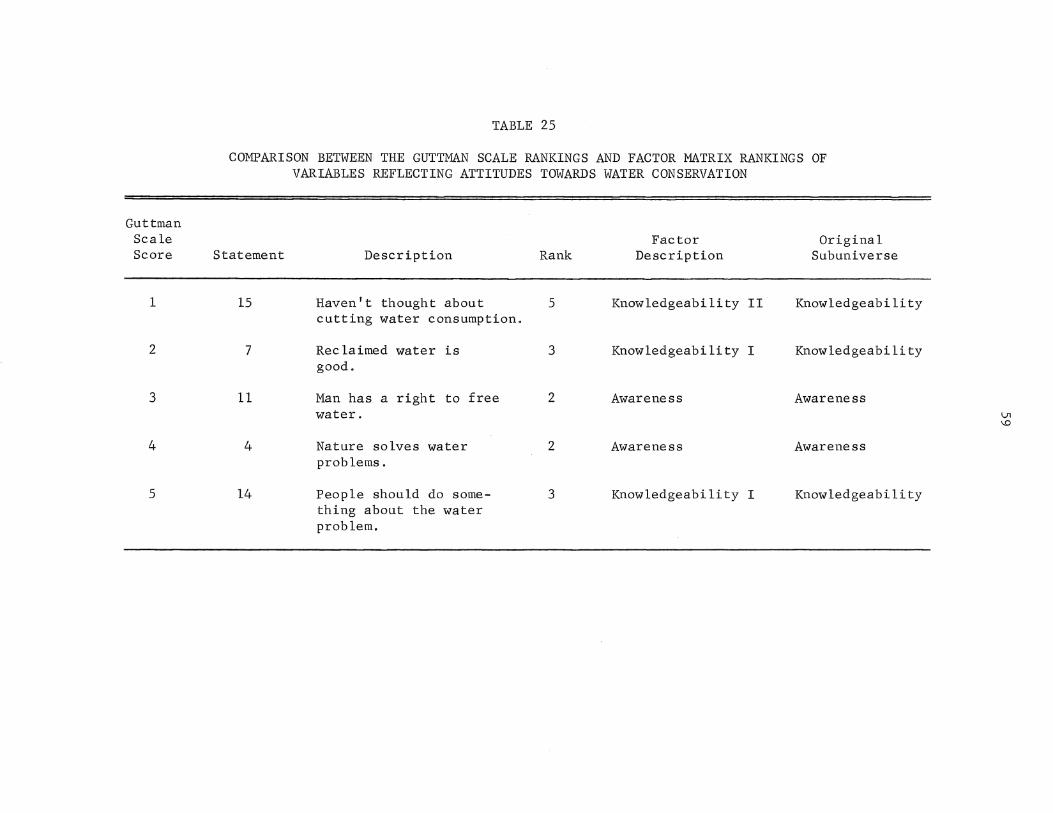
Guttman Scale Score
1
2
3
4
S
TABLE 25
COMPARISON BETWEEN THE GUTTMAN SCALE RANKINGS AND FACTOR MATRIX RANKINGS OF VARIABLES REFLECTING ATTITUDES TOWARDS WATER CONSERVATION
Factor Original Statement Description Rank Description Subuniverse
15 Haven't thought about S Knowledgeability II Knowledgeability cutting water consumption.
7 Reclaimed water is 3 Knowledgeability I Knowledgeability good.
11 Man has a right to free 2 Awareness Awareness water.
4 Nature solves water 2 AWareness Awareness problems.
14 People should do some- 3 Knowledgeability I Knowledgeability thing about the water problem.
V1 \0
60
resources problems is a matter with which they must personally concern them
selves. The underlying dimension which this scale seems to measure is a
concern for and about the water resources problem. The scale was thus
named the "Water Concern Scale" and the resulting scalogram is found in
Table 26.
Potential Uses of the Water Concern Scale
The Water Concern Scale may be a feasible instrument to be used by
civil engineers and community officials in the planning and initiation of
water projects in local areas. The scale could provide the planners with
some measure of the concern and involvement of the residents of the particu
lar community in the water resources and conservation problem, and more
specifically, in the suggested local project. Such a measure would enable
water project planners to decide how much more and what kind of information
needs to be disseminated to the residents in order to gain acceptance for
the suggested project.

TABLE 26
WATER CONCERN SCALOGRAMa
SCALE PATTERN
1 = favorable response and concern o = unfavorable response and concern
Thought about Water Right Nature People water reclaimed to solves should consump- is as free own do some-
SCALE TYPE OF SUBJECT tion good water problems thing
Most Concerned 1 1 1 1 1
0 1 1 1 1
0 0 1 1 1
0 0 0 1 1
0 0 0 0 1
Least Concerned 0 0 0 0 0
Total Subjects
aCompare with Table 3 for further details of the scale.
DISTRIBUTION OF THE RESPONDENTS
Perfect Nonscale Scale Total
7 6 13
14 20 34
29 28 57
13 19 32
12 13 25
14 14 28
89 100 189
(J\ ,.....

CHAPTER VI
AN APPLICATION OF THE SCALE
In an effort to reveal any relationship or association between the
scale types of the sampled population and the respondent's '~ctual" partici-
pation or concern with the water resources problem, the Guttman scores were
compared with certain socioeconomic variables. For the variables of family
size, water consumption, age of husband, number of children, income of the
household head, number of water-using appliances, and education of the house
hold head, the Spearman rank correlation coefficient l was used (Siegel,
1956:202-213).
For the variable of occ.upation of the household head, the Kruskal
Wallis one-way'analysis of variance2 was used (Siegel, 1956:184-194).
Statements of Relationships
The following variables were subjected to a statement of relationship,
using in each instance the form of the null hypothesis, and tested.
FAMILY SIZE: The null hypothesis may be stated: There is no rela-
tionship between the size of the respondent's family and the respondent's
1 Spearman rank correlation coefficient is a "measure of association
which requires that both variables be measured in at least an ordinal scale so that the objects or individuals under study may be ranked in two ordered series" (Siegel, 1956:202). The two sets of scores are ranked in two series. Because of the large proportion of observations tied for certain ranks, a correction factor was incorporated in the computation of rs. The correction factor prevents an inflation of the value of rs.
2The Kruskal-Wallis one-way analysis of variance by ranks assumes that the variable under study has an underlying continuous distribution. "It requires at least ordinal measurement of the variable" (Siegel, 1956:185).
62

63
Guttman score.
For family size, rs 0.066 indicating only a very low correlation
between family size and the Guttman score. This relationship is not signifi-
cant at the .05 level of significance and, therefore, the null hypothesis
cannot be rejected. On the basis of the evidence, then, it does not appear
that one may assume that the size of the family as such operates as a major
determinant of attitudes toward issues related to concern about water problems.
WATER CONSUMPTION: The null hypothesis is: There is ~ relationship
between ~ respondent's household water consumption and his Guttman score.
For water consumption, rs = 0.095 indicating a low correlation between
water consumption and the Guttman score. This relationship is not signifi-
cant at the.OS level of significance and would indicate that a respondent's
household water consumption does not significantly affect his attitude re-
garding concern about water resources problems. The null hypothesis cannot
be rejected.
AGE OF HUSBAND: The null hypothesis may be phrased: There is no re-
lationship between the ~ of the husband in the household and the respondent's
Guttman score.
For age of husband, rs = 0.079 indicating that a low correlation exists
between the age of the husband and the Guttman score. This relationship is
not significant at the .05 level of significance, and, thus, the null hypothesis
cannot be rejected. It would appear that the age of the husband is not a
"cause" of the respondent's attitude concerning water resources problems.
NUMBER OF CHILDREN: The following null hypothesis is offered: There
is E£ relationship between the number of children in the household and the
respondent's Guttman ~.
For the number of children, rs = 0.066 indicating only a very low
correlation between the number of children in the household and the respondent's
64
Guttman score. This relationship is not significant at the .05 level of
significance, and, on this basis, the null hypothesis cannot be rejected.
The number of children apparently does not affect the respondent's attitude
regarding his concern about water resources problems.
INCOME OF THE HOUSEHOLD HEAD: The null hypothesis may be stated:
There is ~ relationship between the income of the household head and the
respondent's Guttman score.
For income of the household head, rs = 0.164 indicating that there is
a correlation between the income of the household head and the Guttman score.
This relationship is significant at the .05 level of significance and, con
sequently, the null hypothesis can be rejected. As found by Dasgupta (1968),
income is found to be a determinant of the respondent's attitudes toward
water resources problems.
NUMBER OF WATER-USING APPLIANCES: The null hypothesis is: There is
no relationship between the number of water-using appliances in the household
and the respondent's Guttman score.
For number of water-using appliances, rs = 0.008 indicating a very low
correlation between the number of water-using appliances in the household and
the Guttman score. This relationship is not significant at the .05 level of
significance, and, therefore, the null hypothesis cannot be rejected. Although
the number of water-using appliances was found to be significantly related to
attitudes by Dasgupta (1968), in this sample the number of water-using appli
ances does not contribute to the respondent's attitudes regarding water re
sources problems.
EDUCATION OF THE HOUSEHOLD HEAD: The null hypothesis may be phrased:
There is ~ relationship between the education of the household head and the
respondent's Guttman score.
For the education of the household head, rs = 0.233. Although a
65
correlation on this level does not suggest a very close relationship between
the series of data, the relationship is significant at the .01 level of
significance. That this null hypothesis can be rejected may offer support,
in some manner, to the occurrence of the twelve-scale-types as discussed
in Table 2. In Table 2 it was determined that education could be the common
denominator for the appearance of twelve respondents with the same response
pattern. The direction of the relationship is such that one may assume the
existence of some tendency for the Guttman score to be higher as the educa
tion of the household increases.
OCCUPATION OF THE HOUSEHOLD HEAD: The null hypothesis is: There is
no relationship between the occupation of the household head and the respond
ent's Guttman score.
For the occupation of the household head, H = 7.066, indicating that
the probability associated with the occurrence under the null hypothesis of
a value this large (df = 6) is not significant at the .05 level of significance.
The null hypothesis cannot be rejected. One may assume, because of this
quite low probability of occurrence, that the occupation of the household
head is not determinant of the respondent's Guttman score.
Summary
An attempt was made to construct an attitudinal scale that might be
useful to social scientists, natural scientists, and civil engineers con
cerned with the water resources problems in the United States. The inter
view schedule contained questions which provided standard socioeconomic
information on the respondents. The interview schedules also contained
nineteen attitudinal questions which were intended to elicit respondents'
attitudes towards water resources problems. The attitudinal questions were
designed to measure the subuniverses of (1) willingness on the part of the

66
respondent to do something about the water resources problem, (2) the con
sideration by the respondent that water is an economic commodity, (3) aware
ness on the part of the respondent, and (4) knowledgeability of the respondent
regarding the water resources problem.
An attempt was then made, using the technique of Guttman scalogram
analysis, to construct the attitude scale. In meeting the requirements of
the Guttman scalogram analysis, that is, that the scale be reproducible,
only five of the original nineteen attitudinal statements were retainable.
The final scale had a coefficient of reproducibility of .895.
The original nineteen items were subjected to a factor analysis to
determine if the original subuniverses were to be validated. Initially,
four subuniverses were proposed: economic commodity, willingness, awareness,
and knowledgeability. The factor analysis revealed that there were six sub
universes measured by the attitudinal items: economic commodity~ willing
ness, awareness, knowledgeability I, knowledgeability II, and rationality.
Only two of the original nineteen items were not sufficiently "loaded" on
the factor analysis. In comparing the original subuniverses with those
revealed by the factor analysis, the final scale was fully supported. That
is, the final five items on the scale had loadings of .50 or higher and were
initially assigned to subuniverses which were validated by the factor analy
sis. The nature of the final five items on the scale was such that it was
named the Water Concern Scale.
The scale scores of the final Water Concern Scale were then compared
with certain socioeconomic variables in order to reveal any relationship
between a respondent's score and his actual concern and participation with
the water resources problem. Using the Spearman rank correlation coefficient
and the Kruskal-Wallis one-way analysis of variance, the following socio
economic variables were compared with the Guttman scores of the respondents:

67
family size, water consumption, age of husband, number of children, income
of the household head, number of water-using appliances, education of the
household head, and occupation of the household head. The relationships
were stated in the form of null hypotheses and the following null hypo
theses could not be rejected at the .05 level of significance: family size,
water consumption, age of husband, number of children, number of water-using
appliances, and occupation of the household head. Only the null hypotheses
concerning the socioeconomic variables of education of the household head
and income of the household head could be rejected. The implication of
this rejection is that income and education of the household head are
determinants of the respondent's attitude score in the population samples
in this research. It was finally noted that another attitudinal study had
revealed these same two socioeconomic variables to be significantly related
to attitudes regarding water resources problems.

CHAPTER VII
SUMMARY AND CONCLUSIONS
An effort has been made in this research to: (1) determine what rela
tionships there are between water consumption in two residential areas com
pared with certain socioeconomic variables of the population, and (2) measure
the attitudes of water consumers toward water conservation. The research
consisted of interviewing residents of two South Florida areas--West Palm
Beach and Homestead.
In an attempt to achieve the two goals of this research, data were
presented and analyzed on the characteristics of the population, water con
sumption by household characteristics, attitudes of the respondents toward
water conservation, and on the relationships of certain socioeconomic vari
ables and the Water Concern Scale. It was determined in this analysis that
the West Palm Beach sample had proportionately more larger families, had
proportionately a larger number of families with a greater number of children,
and had proportionately more families with older children than did the Home
stead sample. The head of the household in West Palm Beach was also found
to have been more likely to have completed a high school education and a
college education, more likely to have been a professional worker and less
likely to have been a blue collar worker, more likely to earn more, and to
be slightly older than his or her Homestead counterpart.
It was also determined, as has been established in other research,
that there is a definite relationship between water consumption and the
income standing of the household. Additionally, differences between West
68

69
Palm Beach and Homestead in water consumption were attributed to their different
"life styles," with West Palm Beach being considered more typically urban.
Finally, with the development of the Water Concern Scale, it was deter
mined that income and education of the household head appear to be the deter
minants of a respondent's attitude score in the two areas sampled. The
attitudinal profile proved to be consistent with other research on attitudes
and water conservation, although this was the first attempt to construct a
Guttman scale as such.
Conclusions
Some basic relationships between the use of water and the several
socioeconomic characteristics of the households of West Palm Beach and
Homestead have been established. By further observation of frequency dis
tributions on some of the items of the interview schedule used, some major
habits of the householders with regard to water use can be established.
In part of the preceding analysis, water dependent appliances and
plumbing fixtures proved to be the key discriminators in water use. Table 27
compares West Palm Beach and Homestead households on the number and types of
appliances and fixtures.
It is demonstrated that the West Palm Beach households are more affluent,
at least judging by the number of appliances which tend to characterize the
higher income households such as dishwashers, garbage disposals, and mUltiple
bathrooms. To what use these appliances and fixtures were put can be esti
mated by the differential water consumption of the respective households.
It has been repeatedly demonstrated that the West Palm Beach households use
substantially more water than the Homestead households. For instance, when
asked about their lawn watering practices, the Homestead respondents were
about twice as likely (71 percent) as the West Palm Beach respondents
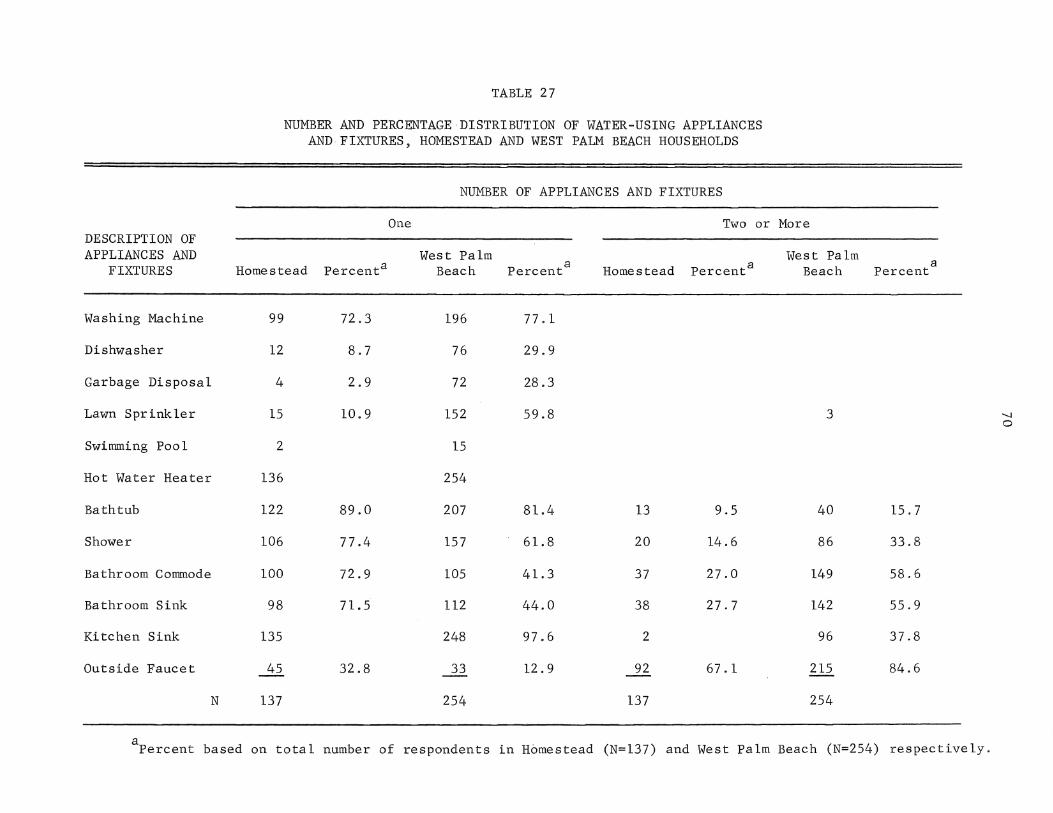
DESCRIPTION OF APPLIANCES AND
FIXTURES
Washing Machine
Dishwasher
Garbage Disposal
Lawn Sprinkler
Swimming Pool
Hot Water Heater
Bathtub
Shower
Bathroom Commode
Bathroom Sink
Kitchen Sink
Outside Faucet
N
TABLE 27
NUMBER AND PERCENTAGE DISTRIBUTION OF WATER-USING APPLIANCES AND FIXTURES, HOMESTEAD AND WEST PALM BEACH HOUSEHOLDS
NUMBER OF APPLIANCES AND FIXTURES
One Two or More
West Palm West Palm Homestead Percenta Beach Percenta Homestead Percenta Beach
99 72.3 196 77 .1
12 8.7 76 29.9
4 2.9 72 28.3
15 10.9 152 59.8 3
2 15
136 254
122 89.0 207 81.4 13 9.5 40
106 77.4 157 61.8 20 14.6 86
100 72.9 105 41.3 37 27.0 149
98 71.5 112 44.0 38 27.7 142
135 248 97.6 2 96
45 32.8 33 12.9 92 67.1 215
137 254 137 254
a Percent
15.7
33.8
58.6
55.9
37.8
84.6
apercent based on total number of respondents in Homestead (N=137) and West Palm Beach (N=254) respectively.
'" 0

71
(32 percent) to report that they water their lawn "seldom or never." A
routine sprinkling of lawns either with a hose or through a sprinkler system
was claimed by West Palm Beach respondents convincingly more often than by
Homestead respondents (watering by garden hose: 25 percent for Homestead,
42 percent for West Palm Beach; watering by sprinkler system: 2 percent
for Homestead and 26 percent for West Palm Beach).
However, the purpose of this research was not to give weight to minor
water consumption habits, but rather to tap the attitudes and opinions of
the respondents as to their understanding of the water supply distribution
question. One of the difficulties in water conservation and consumption
surveys when the focus is on attitudes is that water for a long time has been
considered one of the free things like air, which may not be free either.
In order to pinpoint some of the general and diffuse attitudes and opinions
on water, an attempt was made first of all to ascertain how accurately the
respondents think about their sources of water supply.
One of the questions was designed to find out whether the respondents
could identify accurately the supplier of their water. This proved to be no
problem in Homestead as the City of Homestead is the sole supplier of house
holds who do not have their own wells or are out of the water district. In
the West Palm Beach area, however, the many subdivisions and incorporated
places have a variety of private suppliers, but only 12 of the 254 respondents
identified their water suppliers as such. Apparently, most of them think
the city always supplies water. On the other hand, when asked whether or
not they are satisfied with their present water supply, 16 percent of the
West Palm Beach respondents would prefer a different supplier. This latter
refers, of course, only to the households connected to a metered supply of
water.
The respondents were also asked whether they ever thought before about

72
cutting down their water use, whether they would be willing to do so, and how
they would prefer to implement such cuts. A great majority of them (92 per
cent in Homestead and 82 percent in West Palm Beach) indicated that they have
not given thought to cutting their water consumption and from among those who
had done so, about 15 percent (mostly from West Palm Beach) did so because
of the cost. This seems consistent with other observations made where the
use of water is related to water rates.
When asked how they would implement a cut in water consumption, 36 per
cent of the Homestead respondents and 41 percent of the West Palm Beach
respondents indicated they would cut down on their lawn watering, 30 percent
and 14 percent respectively would check fixtures for leaks, and others men
tioned yet other means. In general, the make-up of the households in the two
areas is reflected in these responses. Since fewer respondents in Homestead
than in West Palm Beach water their lawns in the first place, fewer of the
Homestead respondents would be able to turn off their lawn irrigations. How
ever, since the people in the Homestead sample are apparently more aware of
the cost of living, the lower percentage is proportionately larger regarding
lawn irrigation than the West Palm Beach sample. The economic factor also
enters in checking for leaking faucets where the Homestead respondents would
check their fewer faucets more thoroughly for leaks than would be the case
with the West Palm Beach sample.
Were the respondents faced with a community-wide shortage of water,
they would relegate the responsibility for water consumption to, in the first
place, the water plant itself (20 percent in Homestead and 31 percent in West
Palm Beach), second to the civic responsibility of the citizens themselves
(36 and 34 percent respectively), and lastly, to some legal sanctions (41 and
37 percent respectively). The only apparent real difference between the two
samples is the understanding of the role of the water plant, where only two

73
out of ten respondents in Homestead, but three out of ten in West Palm Beach
would favor such control.
Questions concerning water shortage seem to be of only minor relevance
when three-quarters of the respondents never expect this to happen in their
area. Just about all of them believed that the water supply in their area
was either abundant or quite satisfactory. When the respondents were asked
whether they would go farther, deeper, into the ocean, or into the sewers
were they in need of more water, 13 percent of the Homestead respondents
and only 7 percent of the West Palm Beach respondents indicated such, even
though Homestead draws all of its water supply from the ground and West Palm
Beach off the surface. On the other hand, 34 percent and 44 percent of the
Homestead and West Palm Beach respondents, respectively, indicated they would
prefer to go deeper for the water. Almost 47 percent of the respondents in
Homestead and 42 percent of the respondents in West Palm Beach indicated de
salination as an alternative. Regarding the reclamation of water from the
effluent, only three respondents in each area indicated such as a favorable
alternative.
When, however, the respondents were presented directly with the re
claimed water questions giving reclaimed water as an economical solution to
the water problem, still 51 percent and 60 percent of the respondents in
Homestead and West Palm Beach, respectively, would rather pay more than have
to drink reclaimed water. And, if they had to drink water reclaimed from the
effluent, 62 percent of the Homestead respondents and 66 percent of the West
Palm Beach respondents would be bothered by the knowledge of it. It would
appear that the dislike of water reclaimed from effluent seems to cut across
social class lines.
The overall profile of the two communities may increase our understanding
of the social forces behind the differential water consumption. In Homestead,

74
where the income does not allow as much equipment in the household as in
West Palm Beach, there appears correspondingly lower water consumption,
mainly reflected in the low use of water for lawns and the like. Also, the
overall set of attitudes and opinions toward water conservation seems to be
one of a lack of real concern, some misunderstanding of what it is all about,
and willingness to have somebody else take care of it.

APPENDIX

76
UNIVERSITY OF FLORIDA Department of Sociology
Water Resources Research Center
Prediction Model for Water Use by Population Structure
INTERVIEW SCHEDULE
ADDRESS: (Zone: Segment: )
SCHEDULE SERIAL NUMBER:
INTERVIEWER:
DATE OF CONTACT: lst __________________________ _
2nd __________________________ __
3rd ----------------------------INTERVIEW COMPLETED:
INTERVIEW INCOMPLETE: Dwelling Vacant ____________________ _
Interruption ______________________ __
Refusal "-----------------------------Different Residents ------------------
CARD 6
COLS CODE
1-6
75-77
7,8
9
10
1 2 1
2
3
4
**INTERVIEWER NOTE: ASK THE FOLLOWING QUESTIONS OF EVERY RESIDENT
1. Were you interviewed last Fall by someone from this project? YES NO
If NO, TERMINATE THE INTERVIEW
If YES, ASK THE FOLLOWING QUESTIONS
lao Were you interviewed by a male or female? MALE FEMALE
lb. Did you receive any literature from the interviewer? YES NO
If YES, did you read it? YES NO
11
12
13
14
1 2
1 2
1 2
1 2
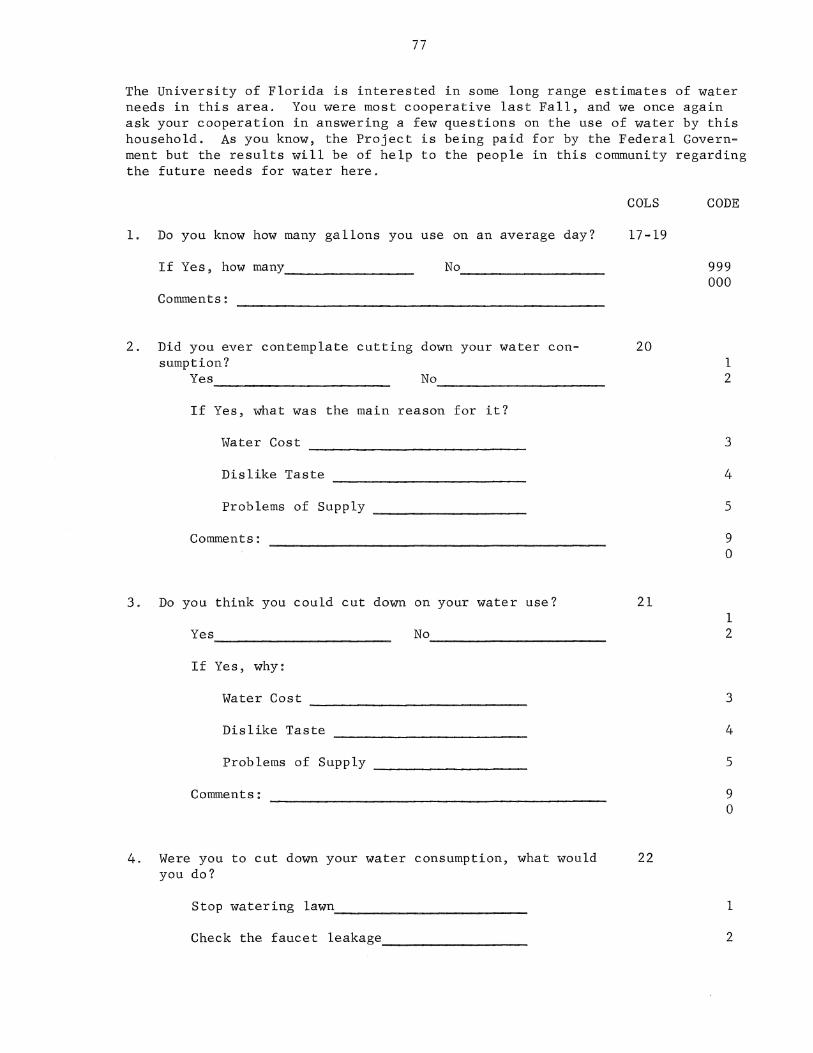
77
The University of Florida is interested in some long range estimates of water needs in this area. You were most cooperative last Fall, and we once again ask your cooperation in answering a few questions on the use of water by this household. As you know, the Project is being paid for by the Federal Government but the results will be of help to the people in this community regarding the future needs for water here.
1. Do you know how many gallons you use on an average day?
If Yes, how many ________________ _ No __________________ _
Comments:
2. Did you ever contemplate cutting down your water consumption?
Yes No ----------------------If Yes, what was the main reason for it?
Water Cost -----------------------------Dislike Taste
Problems of Supply
Comments:
3. Do you think you could cut down on your water use?
Yes No ----------------------- -----------------------If Yes, why:
Water Cost
Dislike Taste
Problems of Supply --------------------Comments:
COLS
17-19
20
21
4. Were you to cut down your water consumption, what would 22 you do?
Stop watering lawn~ ______________________ _
Check the faucet leakage __________________ _
CODE
999 000
1 2
3
4
5
9 o
1 2
3
4
5
9 o
1
2

78
COLS
Other ---------------------------------------Don't know ----------------------------------Comments:
5. Were the community to experience a water shortage and 23 cuts of consumption in each household would have to be made, which of the following ways would appeal to you most?
____ ~Rationing plan by water works, e.g., shutting water supply off a certain time of the day.
____ ~Encouraging the citizens to cut their water consumption in general.
A ban on watering lawns and fines to enforce it. ----~
____ ~Allowing only so many gallons per person in the household.
____ ~Decreasing the pressure.
Comments:
6. Do you think that your community will ever face a problem of an inadequate supply of water?
Yes --- Don't Know ----No ___ _
Comments:
7. Do you think the water supply in this area is:
Abundant ----- Sufficient ---- Inadequate __ _
Comments:
24
25
8. When a community like yours faces a water shortage be- 26 cause there is no adequate recharging of the areas the water comes from, there are several alternatives facing the community. If each of the following alternatives were to cost the same, which one would you prefer?
Go farther to get the water. ----
CODE
3
9 o
1
2
3
4
5
9 o
1
2
9 o
1 2 3
9 o
1
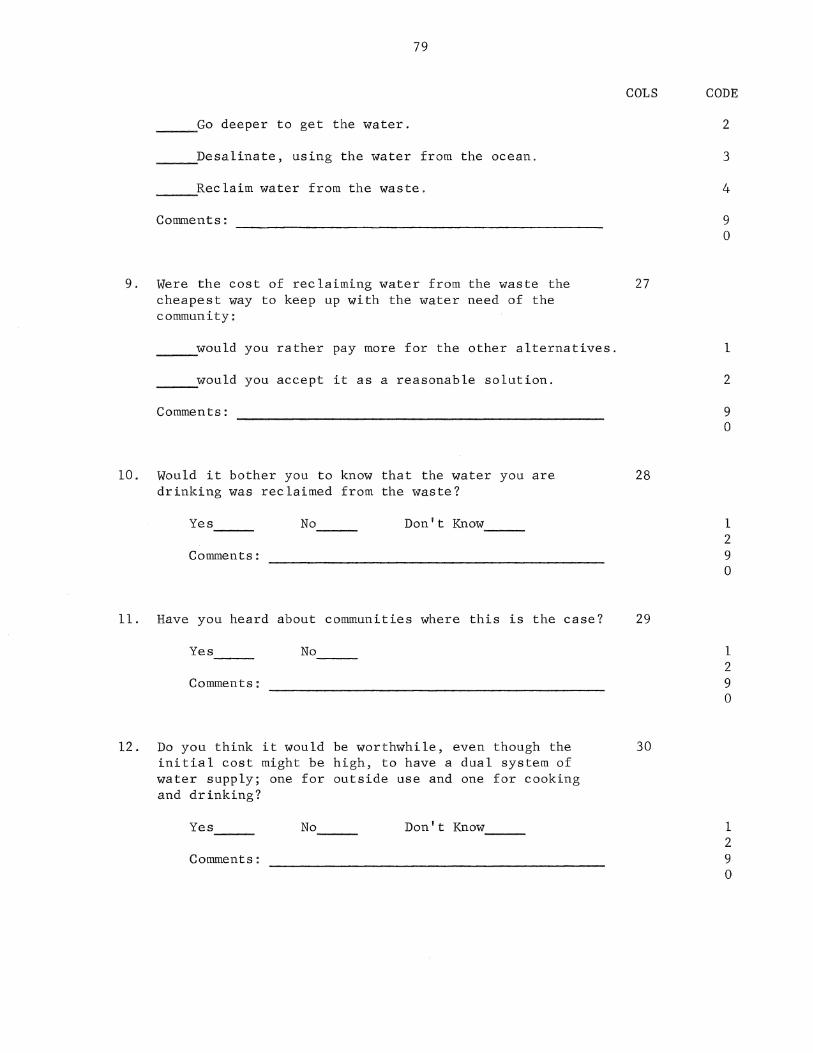
79
Go deeper to get the water. ---___ ~Desalinate, using the water from the ocean.
Reclaim water from the waste. --....;
Conunents:
9. Were the cost of reclaiming water from the waste the cheapest way to keep up with the water need of the community:
would you rather pay more for the other alternatives. ----would you accept it as a reasonable solution. ----
Comments:
10. Would it bother you to know that the water you are drinking was reclaimed from the waste?
Yes --- Don't Know ---No __ _
Comments:
COLS
27
28
11. Have you heard about communities where this is the case? 29
Yes --- No ___ _
Comments:
12. Do you think it would be worthwhile, even though the 30 initial cost might be high, to have a dual system of water supply; one for outside use and one for cooking and drinking?
Yes No Don't Know --- --- ---Comments:
CODE
2
3
4
9 o
1
2
9 o
1 2 9 o
1 2 9 o
1 2 9 o

80
13. Were it necessary to install such a system, how should it be financed?
14.
Increased water rates. ---_____ Governmental subsidy.
Don't know.
Corrrrnents:
There is no question that this area is population and in the need for water. that there should be some governmental assure that the cost of water does not disproportionately?
increasing in Do you think agency to increase
Yes No __ _ Don I t Know ---Corrrrnents:
15. Do you think that water works should be subsidized so that even the poor families may have as much water as they need?
Yes --- No __ _ Don't Know ---
If Yes, how should this subsidy be effected?
____ ~A general water tax.
____ ~Property tax.
Some other tax. ---Comments:
16. Have you ever attended a formal or informal gatherings concerned with water?
Yes No __ _
If Yes, how many:
COLS
31
32
33
34,35
CODE
1
2
9
o
1 2 9 o
1 2 9
3
4
5
o
1 2
99 00

81
COLS
17. With whom have you talked most about the water problem? 36
__ ....;Family
Close personal friends ---Other neighbors ---Other friends at work ---Other (specify) ---
Comments:
18. Have any of the following indicated concern about conserving water?
__ .....;Family
Close personal friends ---_____ Other neighbors
Other friends at work ---Other (specify) ---
Comments:
37
19. Do any of the following exercise exceptional or 38 noticeable practice with respect to water conservation?
__ ....;Family
Close personal friends ---Other neighbors ---Other friends at work ---Other (specify) ---
Comments:
CODE
1
2
3
4
5
9 o
1
2
3
4
5
9 o
1
2
3
4
5
9 o

82
20. Would you be willing to pay more for the water you need?
Yes No --- ---Comments:
21. Would you use desalinated water?
Yes No --- ---
Comments:
22. Do you think your community will face a water shortage soon?
Yes __ _ No __ _
Comments:
23. Do you water your lawn often?
Yes___ No __ _
Comments:
24. Do you think your monthly water bill is fair?
Yes __ _ No __ _
Comments:
**INTERVIEWER NOTE:
COLS CODE
39
1 2 9 0
40
1 2 9 0
41
1 2 9 0
42
1 2 9 0
43
1 2 9 0
That concludes that part of this questionnaire. Now I will read to you a series of statements concerning your attitudes on water. Consider how strongly you personally agree or disagree with the following statements. Tell me if you STRONGLY AGREE with the statement, only AGREE with the statement, if you STRONGLY DISAGREE with the statement, only DISAGREE with the statement, or if you are UNDECIDED about the statement.

83
**INTERVIEWER GIVES THE RESPONDENT THE CARD WITH THE RESPONSES ON IT.
COLS CODE
l. Problems of water supply are only temporary. 45 1 2 3 4 5
SA A U D SD
2. If there were a shortage of water, we would 46 1 2 3 4 5 cut our water use.
SA A U D SD
3. The amount of water people use depends on how 47 1 2 3 4 5 much water is available.
SA A U D SD
4. Nature has a way to solve water supply problems 48 1 2 3 4 5 before they get serious.
SA A U D SD
5. We would cut our water consumption if necessary. 49 1 2 3 4 5
SA A U D SD
6. The government should control the price of water. 50 1 2 3 4 5
SA A U D SD
7. Water reclaimed from waste is as good as any 51 1 2 3 4 5 other water.
SA A U D SD
8. During water shortages, there should be a 52 1 2 3 4 5 restriction on the watering of lawns.
SA A U D SD
9. The water-using appliances a family has identifies 53 1 2 3 4 5 their position in society.
SA A U D SD
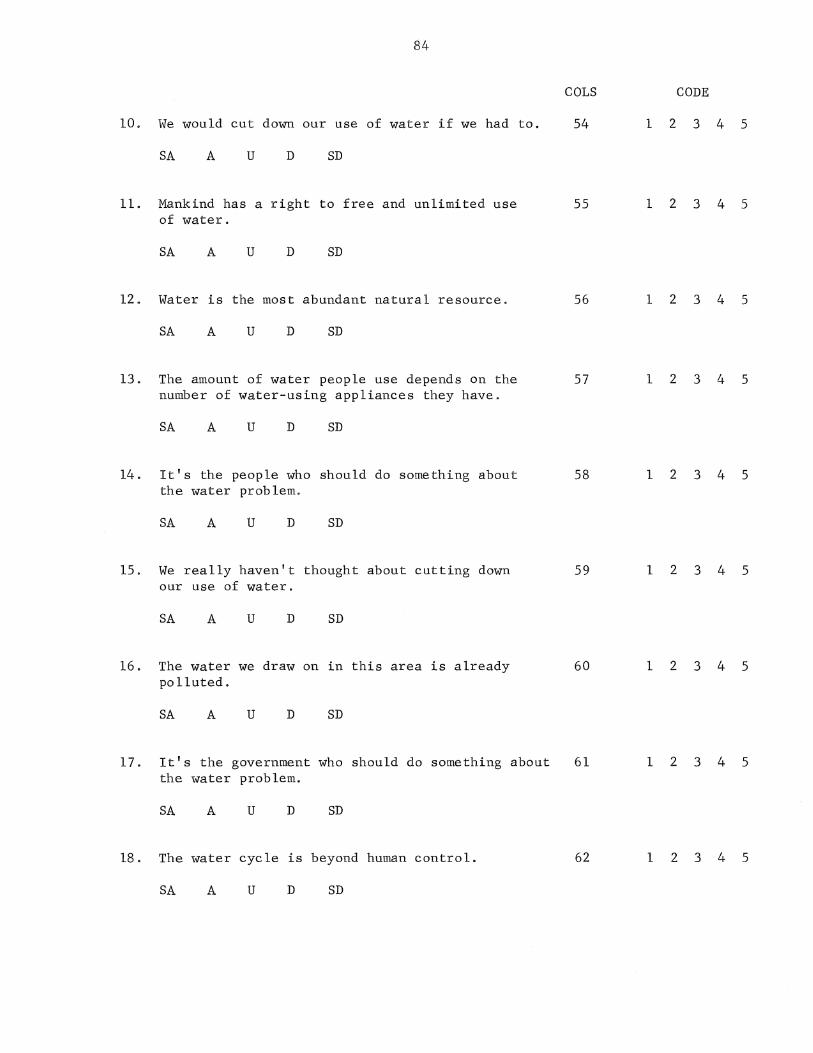
84
COLS CODE
10. We would cut down our use of water if we had to. 54 1 2 3 4 5
SA A U D SD
lL Mankind has a right to free and unlimited use 55 1 2 3 4 5 of water.
SA A U D SD
12. Water is the most abundant natural resource. 56 1 2 3 4 5
SA A U D SD
13. The amount of water people use depends on the 57 1 2 3 4 5 number of water-using appliances they have.
SA A U D SD
14. It's the people who should do something about 58 1 2 3 4 5 the water problem.
SA A tJ D SD
15. We really haven't thought about cutting down 59 1 2 3 4 5 our use of water.
SA A U D SD
16. The water we draw on in this area is already 60 1 2 3 4 5 polluted.
SA A U D SD
17. It's the government who should do something about 61 1 2 3 4 5 the water problem.
SA A U D SD
18. The water cycle is beyond human control. 62 1 2 3 4 5
SA A U D SD
85
19. I would be willing to do something about the water problem.
SA A U D SD
COLS
63
THAT CONCLUDES THE INTERVIEW. I THANK YOU VERY MUCH
CODE
1 2 3 4 5
FOR YOUR COOPERATION. IT WAS MOST SINCERELY APPRECIATED.
**INTERVIEWER NOTE
1. Degree of Interview Cooperation 65
___ Good 1
Fair --~
2
Poor --~
3
Comments:
BIBLIOGRAPHY
"A Directory of Information Resources in the United States - Water," UoS. Library of Congressional Natural Referral Center for Science and Technology (September, 1966).
Ackerman, Edward A" "Questions for Designers of Future Water Policy," Journal of Farm Economics, Vol. 38 (November, 1956), pp. 971-980.
Andrews, Wade H., "Sociological Analysis and Water Resources Problems," Prepared for presentation at a Workshop for Sociological Aspects of Water Resources Research in Logan, Utah State University, April 18, 1968 (Mimeographed).
_____ , and Gillings, James L., "Some Factors Affecting Social Change in Water Resources." Unpublished Paper. San Francisco: Rural Sociological Society Meeting, 1967.
Arrow, Kenneth J., "Criteria for Social Investment," Water Resources Research, Vol. I (First Quarter, 1965), pp. 1-8.
Backstrum, Charles H., and Hursh, Gerald D., Survey Research. Evanston: Northwestern University Press, 1963.
Baur, E. Jackson, "Opinion Change in a Public Controversy," Public Opinion Quarterly, Vol. 26 (Spring, 1962), pp. 210-226.
_____ , "Public Opinion and the Primary Group," American Sociological Review, Vol. 25, (April, 1960), pp. 208-219.
Brock, Dan A., "Multiple Regression Analysis of Maximum-Day Water Consumption at Dallas, Texas," Journal of the American Water Works Association, Vol. 50 (October, 1958), pp. 1391-1394.
Brown, Carl B., and Murphy, Warren T., "Conservation Begins in the Watersheds," Water: The Year Book of Agriculture. Washington, D.C.: U.S. Department of Agriculture (1955), pp. 161-165.
Bryan, E. H., "Water Supply and Pollution Control Aspects of Urbanization," Law and Contemporary Problems, Vol. 30 (Winter, 1965), pp. 176-192.
Bylund, H. Bruce, "The Human Factor and Changes in Water Usage Patterns," Water Resources Research, Vol. 3, No.3 (First Quarter, 1966), pp. 365-369.
"The California State Water Project in 1965," Department of Water Resources, Resources Agency, California, Bulletin No. 132-65 (June, 1965).
86
87
Carhart, Arthur R., Water-Or Your Life. J. B. Lippincott Co., New York, 1951.
Ciriacy-Wantrup, S. V., "Water Policy and Economic Optimizing: Some Conceptual Programs in Water Research," American Economic Review: Papers and Proceedings, Vol. 57 (May, 1967), pp. 179-196.
Clawson, Marion and Dretsch, J. L., "Outdoor Recreation Research: Some Concepts and Suggested Areas of Study," Resources for the Future, Inc., Washington, D.C.: Reprint No. 43 (November, 1963), pp. 23.
Cole, Lucy W., and Wilkinson, Kenneth P., "Sociological Factors in Watershed Development, Preliminary Report No. 20." Social Science Research Center: Mississippi State University, July, 1967.
"30,000 Communities Without Water," Department of Agriculture, U.S. (1965).
Conway, Clarence M., "The Competitive Position of Agriculture for Usable Water," Louisville, Kentucky: Association of Southern Agricultural Workers, 1968.
Craine, Lyle E., "The Muskingum Watershed Conservancy District: A Study of Local Control," Law and Contemporary Social Problems, Vol. 22 (Summer, 1957), pp. 378-404.
Crain, R. L., "Fluoridation: The Diffusion of an Innovation Among Cities," Social Forces, Vol. 44 (June, 1966), pp. 467-476.
" and Rosenthal, D. B., "Structure and Value in Local Political ----Systems: The Case of Fluoridation Decisions," Journal of Politics, Vol. 28 (February, 1966), pp. 169-195.
"Customers React to Increased Rate by Reducing Water Consumption," Water Works Engineering, Vol. 110 (February, 1957), pp. 150, et passim.
Dasgupta, Satadal, "Attitudes of Local Residents Toward ment. Preliminary Report No. 18," State College: State University, Social Science Research Center,
Watershed DevelopMississippi
1967.
_____ , "Sociology of Watershed Development," Jackson, Mississippi: Mississippi Water Resources Conference, April, 1968.
, and Wilkinson, Kenneth P., "Local Participation and Watershed -------Development: A Comparative Study of Two Communities," San Francisco: Third Annual American Water Resources Conference (November, 1967).
Downs, J. F., "Social Consequences of a Dry Well," American Anthropologist, Vol. 67 (December, 1965), pp. 1387-1416.
Dunn, Dorothy F., and Larson, T. E., "Relationship of Domestic Water Use to Assessed Evaluation, with Selected Demographic and Socio-economic Variables," Journal of the American Water Works Association, Vol. 55 (April, 1963), pp. 441-450.

88
Ellis, Harold H., "Legal Aspects of Rural-Urban Water Use Conflicts," Association of Southern Agricultural Workers, Louisville, Kentucky, 1968.
"Federal Assistance in Outdoor Recreation," Journal of Soil and Water Conservation, Vol. 18 (March-April, 1963), pp. 57-60.
Firey, W., "Coalition and Schism in a Regional Conservation Program," Human Organization, Vol. 15 (Winter, 1957), pp. 17-20.
Fox, 1. K., "New Horizons in Water Resources Administration," Public Administration Review, Vol. 25 (May, 1965), pp. 61-69.
Gardner, B. Kilworth, and Schieh, Sett H., "Factors Affecting Consumption of Urban Household Water in Northern Utah," Logan, Utah Agricultural Experiment Station, Utah State University, Bulletin No. 449 (November, 1964), pp. 21.
Hamilton, H. R., "Bibliography of Socio-Economic Aspects of Water Resources," U.S. Office of Water Resources Research, 1966.
Haney, P. D., and Hamann, C. L., "Dual Water Systems," Journal of American Water Works Association, Vol. 57 (September, 1965), pp. 1096-1098.
Haveman, Robert H., "Water Resources Investment and the Public Interest: an Analysis of Federal Expenditures in Ten Southern States," Vanderbilt University Press (1965).
Heath, Milton S., Jr., and Godschalk, David, "How Population and Economic Trends May Affect Water Resources in North Carolina," Popular Government, Vol. 31 (November, 1964), pp. 8-10
Hirshleifer, J., and Milliman, J.W., "Urban Water Supply: A Second Look," American Economic Review, Papers and Proceedings, Vol. 57 (May, 1967), pp. 169-178; 190-196.
Hunter, Homer A., "Texas Water Need Forecast," Journal of the American Water Works Association, Vol. 53 (August, 1961), pp. 968-972.
Kiker, John E., Jr., and Morgan, W. H., "Research Highlights," Water Resources Research Center, Publication No.1, University of Florida, Gainesville. (November, 1966).
Kneese, Allen V., "Socio-Economic Aspects of Water Quality Management," Journal of the Water pollution Control Federation, Vol. 36 (February, 1964), pp. 254-262.
Kraenzel, Carl F., "Social Consequences of River Basin Development," Law and Contemporary Problems, Vol. 22 (Spring, 1957), pp. 221-236.
Kubat, Daniel, and Lei, Lillian, "Awareness of Water Consumption by SocioEconomic Status," Paper prepared for the Rural Sociological Society, Boston, 1968.

89
_____ , and Watkins, George A., "Patterns of Water Use by South Florida Households," A paper presented to the American Water Works Association Conference, Hollywood, Florida, November, 1968.
Lei, Lillian Y. S., "Sociological Determinants of Water Use in Selected Southern Florida Households," Masters Thesis, University of Florida, Gainesville, 1968.
Linaweaver, F. Pierce, Jr., Geyer, John C., and Wolff, Jerome B., "A Study of Residential Water Uses: A Report Prepared for the Technical Studies Program of the Federal Housing Administration," Department of Housing and Urban Development (February, 1967).
_____ , "Progress Report on the Residential Water Use Research Project," Journal of the American Water Works Association, Vol. 56 (July, 1964), pp. 1121-1128.
"Residential Water Use, Research Project Report II, Phase 2, Department of Sanitary Engineering and Water Resources," Baltimore, Maryland, Johns Hopkins University, June, 1965.
Lloyd, T., "Water Resources Policy for Canada," Canada Geographical Journal, Vol. 73 (July, 1966), pp. 2-17.
Lumbard, Emily C., "Theses on Engineering, Economic, Social and Legal Aspects of Water," Water Resources Center Archives, University of California, Berkeley, Report No.2 (October, 1958).
Lyle, C. V., "Economic Problems of Water Pollution Control in the Southeast," Association of Southern Agricultural Workers, Louisville, Kentucky, 1968.
Mendenhall, William, Introduction to Statistics. Belmont, California. Wadsworth Publishing Company, 1964.
Metz, A. S., "Analysis of Some Determinants of Attitude Toward Fluoridation," Social Forces, Vol. 44 (June, 1966), pp. 477-484.
Milliman, J. W., "Economic Consideration for the Design of Water Institutions," Public Administration Review, Vol. 25 (December, 1965), pp. 284-289.
_____ , "Price Policy and Land Value Taxation for Urban Water Supplies," American Journal of Economics, Vol. 25 (October, 1966), pp. 379-404.
Monroe, John, and Finkner, A. L., Hand Book of Area Sampling. Chilton Company Book Division, Philadelphia, 1959.
Morgan, Robert J., "The Small Watershed Program," Law and Contemporary Social Problems, Vol. 22 (September, 1957), pp. 405-432.
Moss, Frank E., The Water Crisis, F. A. Praeger, New York, 1967.
Mueller, J. E., "Politics of Fluoridation in Seven California Cities," Western Political Quarterly, Vol. 19 (March, 1966), pp. 54-67.

90
_________ , Schuessler, Karl F., Statistical Reasoning in Sociology, Houghton Mifflin Company, Boston, 1961.
Murphy, Gardner, and Rensis, Likert, "Public Opinion and the Individual," Harper & Brothers Publishers, New York, 1938.
Nikolaieff, George A. (ed.), The Water Crisis, New York, W. W. Wilson, Co., 1967.
North, Ronald L., "Changes in Land Values Associated with Urbanization and Reservoir Development," Association of Southern Agricultural Workers, Louisville, Kentucky, 1968.
"Obtaining Census Statistics for a Selected Group of Persons," Data Access Descriptions, U.S. Department of Commerce, Bureau of the Census (March, 1967), 4 p.
Photiades, John D., Attitudes Toward the Water Resources Development Program in Central South Dakota, Preliminary Report No. 1 in Rural Sociology, South Dakota State College, Brookings, 1960.
Porges, Ralph, "Factors Influencing Per Capita Water Consumption," Water and Sewage Works, Vol. 104 (May, 1957), pp. 451-455.
Price, R. C., "Some Decisions in the State's Development of California's Water During the 1960's," Public Administration Review, Vol. 25 (December, 1965), pp. 290-296.
Proceedings of the Workshop for Sociological Aspects of Water Resources Research, Held at Utah State University, Logan, Utah, April 18-19, 1968, Report No.1, Social Science Institute Series, Logan, 1968.
Quraishi, G. M., "Domestic Water Use in Sweden," Journal of the American Water Works Association, Vol. 55 (April, 1963), pp. 451-455.
Reid, Paul M., "Problems and Techniques in Population Forecasting," Journal of the American Water Works Association, Vol. 50 (May, 1958), pp. 655-660.
Remmers, Hermann H., Introduction to Opinion and Attitude Measurement, Harper, New York, 1954.
Renne, Roland R., "Social Problems in Water Resources Research," Unpublished paper. San Francisco, Rural Sociological Society Meeting, 1967.
"Report on Seven Cities Water Project, Yadkin River," Pratt and Davis, William C. Olsen and Association, Hazen and Sawyer, Engineers, (1957).
Schmid, A. A., "Nonmarket Values and Efficiency of Public Investments in Water Resources," American Economic Review: Papers and Proceedings, Vol. 57 (May, 1967), pp. 158-168.
Schram, Wilber (ed.), Studies of Innovation and Communication to the Public, Stanford University Institute for Communication Research, Palo Alto, California, 1962.

91
Scott, Guy R., "High Rates of Water Use," Journal of the American Water Works Association, Vol. 50 (March, 1958), pp. 369-374.
Seidel, Harris F., and Cleasky, John L., "A Statistical Analysis of Water Data for 1960," Journal of American Water Works Association, Vol. 58, No. 12 (December, 1966), pp. 1507-1527.
Siegel, Sidney, Nonparametric Statistics for the Behavioral Sciences, McGrawHill, New York, 1956.
Singh, R. N., and Wilkinson, Kenneth P., "Social Science Studies of Water Resources Problems: Review of Literature and Annotated Bibliography," Water Resources Research Institute, Mississippi State University, 1968.
"Six-Year Progress Report," Temporary State Committee on Water Resources Planning, Legislature, New York (1965).
Smith, Stephen C., "Population Demand for Land and Water Resources of the Hinterland," Land and Water Use, American Association for the Advance of Science, pp. 25-43.
Snedocer, George W., Statistical Methods, Ames, Iowa, The Iowa State University Press, 1956.
Spaulding, Irving A., Household Water Use and Social Status, Agriculture Experiment Station, University of Rhode Island, Bulletin 392 (December, 1967), Kingston.
Stern, Carlos, "Recreation in the Missouri River Basin," Water Resources 2545 (May, 1967), (Mimeograph).
"Symposium: Water Resources Research," Natural Resources Journal, Vol. 5 (October, 1965), pp. 218-297.
Taves, M., Hathaway, William, and Bultena, G., Canoe Country Vacationers, Misc. Report No. 39, Minnesota Agricultural Experiment Station, Bulletin 851 (1960).
The Big Water Fight, Brattleboro: The Stephen Greeme Press, The League of Women Voters Education Fund, 1966.
Warriner, Charles K., "Public Opinion and Collective Action: Formation of a Watershed District," Administrative Science Quarterly, Vol. 6 (December, 1961), pp. 333-359.
_____ , "Water Problems and Social Processes: A Study of Social Action in the Delaware Watershed, Kansas," Laurence, Kansas, March, 1957, (Mimeograph).
"Water Consumption," Public Works, Vol. 92 (August, 1961), pp. 83-84.
"Water, Present and Future Estimate of Water Consumption," Public Works, Vol. 87 (December, 1956), pp. 73-77.
92
Watkins, George A., "Scaling of Attitudes Toward Water Conservation," Master's Thesis, University of Florida, Gainesville, 1968.
Wennergren, E. Boyd, "Value of Water for Boating Recreation," Agricultural Experiment Station, Utah State University, Bulletin No. 453 (June, 1965), Logan, Utah, p. 27.
Wilkinson, Kenneth P., Local Action and Acceptance of Watershed Development, Social Science Research Center, Mississippi State University, July, 1966. Bibliography.
, "Watershed Development in the Community Field," Rural Sociological ------Society, Boston, Massachusetts, 1968.
Wolff, Jerome B., "Peak Demands in Residential Areas," Journal of the American Water Works Association, Vol. 53 (October, 1961), pp. 1251-1260.
Wolman, Abel, "Effects of Population Changes on Environmental Health Problems and Programs," Journal of the American Water Works Association, Vol. 57 (June, 1965), pp. 811-818.
-----, "The Metabolism of Cities," Scientific American, Vol. 213, No.3 (September, 1965), pp. 178-190.
Wright, James, The Coming Water Famine, Coward-McCann, Inc., 1966.

BIOGRAPHICAL SKETCH OF AUTHOR
Dr. George A. Watkins is an assistant professor of sociology at the
University of Tulsa, Tulsa, Oklahoma. Before his current status of Graduate
Advisor in the Department of Sociology, Dr. Watkins earned his B.A., M.A.
and Ph.D. degrees from the University of Florida, Gainesville, Florida.
While at the University of Florida, Dr. Watkins served as Assistant to
the Principal Investigator for OWRRProject A-OlO-FLA. He has read papers
on water conservation at the American Water Works Association meeting,
Southern Sociological Society meeting, and at the Southwestern Sociological
Association meeting. He has a paper to be published in the LSU Journal of
Sociology on water conservation. In the Fall of 1972, Dr. Watkins will
become the Academic Coordinator for Environmental Studies at Wright State
University in Dayton, Ohio.
Dr. Watkins is currently a member of the American Association for
the Advancement of Science, American Association of University Professors,
American Sociological Association, Southwestern Sociological Association,
National Council on Family Relations, Population Association of America,
and the Southern Sociological Society. He is also currently the National
Social Sciences Coordinator for Population Phase I, a member of the Phi
Kappa phi honorary, the past president of Alpha Kappa Delta, Beta Chapter,
and past president of Gamma Beta Phi, Beta Chapter.
93