Embed Size (px)
Citation preview

Eldridge Moses, Servaas van der Berg and Kate Rich
A SOCIETY DIVIDED
How unEqual Education quality liMitS Social MoBility in SoutH afRica
Synthesis report for the Programme to Support Pro-Poor Policy Development (PSPPD)

February 2017
Eldridge Moses, Servaas van der Berg and Kate Rich
A SOCIETY DIVIDED
How unEqual Education quality liMitS Social MoBility in SoutH afRica
Synthesis report for the Programme to Support Pro-Poor Policy Development (PSPPD)
S TELLENBOSCHUN IVERS I TE I T
UN IVERS I TY

This report is available online at resep.sun.ac.za
AcknowledgementsThis document has been produced with the financial assistance of the Programme to Support Pro-Poor Policy Development (PSPPD), a partnership programme of the Department of Planning, Monitoring and Evaluation (DPME) and the European Union. The contents of this report can in no way be taken to reflect the views of the Department of Planning, Monitoring and Evaluation and the European Union.
The authors wish to acknowledge valuable inputs into this process by Cobus Burger, Rulof Burger, Chanda Chiseni, Junior Tariro Chiweza, Jeanne Cilliers, Carol Nuga Deliwe, Johan Fourie, Heleen Hofmeyr, Janeli Kotzé, Wawa Nkosi, Nompumelelo Mohohlwane, Marlies Rothkegel, Silke Rothkegel van Velden, Debra Shepherd, Nicholas Spaull, Hendrik van Broekhuizen, Chris van Wyk, Dieter von Fintel, Marisa von Fintel, Gabrielle Wills & Asmus Zoch.
Department of Economics, University of Stellenbosch
S TELLENBOSCHUN IVERS I TE I T
UN IVERS I TY

Table of Contents
EXECUTIVE SUMMARY ��������������������������������������� 1Background and context ������������������������������ 1
Methodology ������������������������������������������������� 2
Main findings ������������������������������������������������ 3
1 INTRODUCTION �������������������������������������������� 5
2 EDUCATION AND SOCIAL MOBILITY IN SOUTH AFRICA ��������������������������������������������� 72�1 Inequality in South Africa: recent
trends ���������������������������������������������������� 7
BOX 1: Migration and social mobility in South Africa ������������������������������������ 10
2�2 Education and Social Mobility �����������11
2�2�1 Public education and social mobility ������������������������������������� 12
2�2�2 The intergenerational transmission of socioeconomic status and education in South Africa ����������������������������������������� 13
2�3 Education quality as a tool for social mobility in South Africa: a conceptual framework ������������������������������������������� 17
BOX 2: Intergenerational mobility during South Africa’s mineral revolution �������������������������������������������� 18
3 UNEQUAL CHANCES: THE EDUCATION SYSTEM ������������������������������������������������������� 203�1 Spectacular growth in educational
attainment over time �������������������������� 22
3�2 Inequality in education quality: recent evidence ���������������������������������� 25
3�3 Inequality from the outset: The case for early intervention ������������������������� 30
3�4 Access to and performance at university ������������������������������������������� 35
BOX 3: The Importance of matric performance for University outcomes �������������������������������������������� 38
3�5 Conclusion ������������������������������������������ 40
4 UNEQUAL CHANCES: LABOUR MARKET INEQUALITY ������������������������������������������������ 414�1 Labour market returns to educational
attainment in South Africa ����������������� 41
BOX 4: Unfulfilled expectations: The gap between objective and subjective social mobility ������������������ 46
4�2 The role of education quality in labour market outcomes �������������������� 48
BOX 5: Convexity or Heterogeneity? Estimates of the shape of the earnings profile ���������������������������������� 48
4�3 Conclusion ������������������������������������������ 50
5 CONCLUSION �������������������������������������������� 51
6 REFERENCES ��������������������������������������������� 53
LIST OF FIGURES AND TABLESFigure E1: South Africa’s dualistic school
system and labour market ������������� 1
Figure 2�1: Poverty headcount by municipality (2011) ������������������������� 7
Figure 2�2: Conditional probability of employment, 2007 ������������������������� 9
Figure 2�3: Poverty gap (depth of poverty) by municipality, 2011 �������������������� 10
Figure 2�4: Net inter-municipal migration rates, 2011 ������������������������������������� 10
Figure 2�5: Earnings functions for provincial migrants and non-migrants, 2011 ��������������������������������11
Figure 2�6: Access to basic services by migration status, 2011 �������������������11
Figure 2�7: Probability of black person being in enrolled in education by age, 2008 to 2014 ���������������������������������� 14
Figure 2�8: Pass rates by race and Grade (2008 to 2014) ������������������������������� 15
Figure 2�9: South Africa’s dualistic school system and labour market ����������� 17

Figure 2�10: Absolute intergenerational mobility: proportion of sons experiencing occupational mobility, by father’s occupational group, over time ��������������������������� 19
Figure 2�11: Relative intergenerational mobility: proportion of sons experiencing occupational mobility, by father’s occupational group, over time� ��� 19
Figure 3�1: Literacy scores for 2007 Grade 3 cohort, 2007 to 2009��������������������� 21
Figure 3�2: Educational attainment growth for black South Africans, by birth cohort �������������������������������������������� 22
Figure 3�3: Number of individuals with matric 1960 to 2011 (by race) ������������������� 23
Figure 3�4: Educational attainment for individuals aged 25 years and older, by race (1993) ��������������������� 23
Figure 3�5: Comprehension and computation test scores (out of 14) for black individuals in 1993, by completed years of education ������������������������ 24
Figure 3�6: PrePIRLS Grade 4 reading scores, by quintile ( 2011) ������������������������� 25
Figure 3�7: South African TIMMS Mathematics and Science scores (1995 to 2015) ������������������������������������������������������� 26
Figure 3�8: South African TIMMS Mathematics scores (2015) ��������������������������������� 27
Figure 3�9: Trends in mathematics marks trends for full-time Grade 12 learners, unadjusted for changes in difficulty levels ������������������������� 28
Figure 3�10: Mathematics marks for 32 stable schools, 2008 to 2015 (by select quantile) ���������������������������������������� 29
Figure 3�11: Mathematics mark trends for full-time Grade 12 learners (adjusted) ������������������������������������������������������� 29
Figure 3�12: Number of students on track by Grade and school quintile (ANA, 2012) ����������������������������������� 32
Figure 3�13: Proportion of entering cohort on track in various Grades ANA 2012 (to Grade 9) and Bachelor passes, by national school quintile ���������� 33
Figure 3�14: South African Learning Trajectories by School Quintiles ���������������������� 34
Figure 3�15: University access and success for the 2008 matric cohort (i�e� the 2004 Grade 8 cohort) ������������������� 35
Figure 3�16: Social spending by spending category, 2006 ������������������������������ 36
Figure 3�17: Racial composition of degree holders, by race (1960 – 2011) ������ 37
Figure 3�18: University access rates by school quintile – all candidates versus Bachelor candidates �������������������� 38
Figure 3�19: Cumulative matric average achievement distribution for the 2008 matric cohort, by race ��������� 39
Figure 4�1: Log of hourly wage rate, by completed years of education (2007) ��������������������������������������������� 43
Figure 4�2: Narrow unemployment rates 2000 to 2015, by educational attainment category ���������������������������������������� 44
Figure 4�3: Returns to education by birth year cohort ������������������������������������������� 45
Figure 3�4: Average education attainment advantage of black individuals, by birth year compared to those born in 1945) ������������������������������������������ 46
Figure 4�5: Educational attainment differences between children and best-educated parent���������������������������� 47
Figure 4�6: Schooling-earnings profile for black males, 15 to 30 (1995 to 2012) ������������������������������������������������������� 49
Figure 4�7: CF estimates of school-earnings profiles, for various individual schooling error terms* ����������������� 50
Table 2�1: Intra-group income / expenditure inequality: Gini coefficients 1970 to 2011 ��������������������������������������������� 8
Table 3�1: Regression: Undergraduate access, completion, conversion and dropout rates – no controls ��������� 39
Table 3�2: Undergraduate access, completion, conversion and dropout rates – controlling for matric performance ������������������������������������������������������� 40
Table 4�1: Effect of change in educational distribution on wage inequality ��� 45

1
ExEcutivE SuMMaRy
Executive summary
Background and context
The central focus of this research project is the investigation of the role of education in promoting
social mobility for the poor in the highly unequal South African economic landscape� The investigation
is of particular relevance in a country where the rapid expansion of educational attainment since
the 1970s has not produced the desired labour market outcomes for many South Africans, for the
most part perpetuating patterns of poverty and inequality along the apartheid dimensions of race and
geography�
Given the deep structural nature of inequality in South Africa, this report employs a conceptual
framework (shown in Figure E1) to illustrate how differences in education quality offered to South
African learners are at the root of income inequality that persists two decades into democracy� The
grim labour market prospects facing South Africa’s young adults are in large part attributable to an
education system that still manages to produce vastly different education outcomes that favour a
small elite in the wealthy part of that system and disadvantage predominantly black and coloured
learners in the less affluent part of the system�
Figure E1: South Africa’s dualistic school system and labour market
•Big demand for good schools, despite fees
•A few schools cross the divide
High productivity jobs & incomes •±10 – 15% of labour force –
mainly professional, managerial & skilled jobs
•Requires degree, good quality matric, or good vocational skills
•Historically mainly whites
•Vocational training
•Affirmative action
High quality schools •±10 – 15 % of schools, mainly former
(though no longer) white
•Produce strong cognitive skills
•Teachers qualified, schools functional, good assessment, parent involvement
Low productivity jobs & incomes •Often manual or low skill jobs
•Limited or low quality education
•Minimum wage can exceed their productivity
Low quality schools •Very weak cognitive skills
•Teachers less qualified, de-motivated, schools dysfunctional, assessment weak, little parental involvement, strong unions
•Mainly former black (DET) schools
Some talented, motivated or lucky students manage
the transition
Source: Van der Berg (2015).

PSPPD: A SOCIETY DIVIDED2
A small minority of learners attend functional, high quality (mostly former white) schools, staffed by
qualified teachers and characterised by good management, assessment and parental involvement�
Learners graduating from these schools have relatively good chances of entering the upper end of
the labour market, often (but not always) first acquiring some form of tertiary education� The high
productivity jobs in this part of the labour market offer high returns� Traditionally this part of the labour
market has been dominated by whites, but the removal of apartheid era restrictions, government
interventions (such as black economic empowerment and affirmative action) and improved access
to better quality education for some black children have allowed a relatively small black minority to
achieve upward social mobility through the labour market�
In contrast, the majority of South Africa’s (mostly black) learners attend formerly black schools�
These schools, that typically also suffer from poor management, little parental participation and poor
assessment, produce poor cognitive outcomes, which are poorly rewarded in the labour market,
resulting in low employment probabilities and low wages from unskilled occupations� While the
transition from low quality schools to low productivity jobs is relatively deterministic, it is possible for
individuals from this part of the education system to access the high productivity part of the labour
market through vocational training, affirmative action or other forms of labour market mobility�
This conceptual framework is used throughout the report to discuss how education, and particularly
education quality, are critical inputs in advancing social mobility for South Africa’s economically
vulnerable citizens�
MethodologyThe work is an amalgamation of existing and ongoing work in the Department of Economics and
the Research on Socio-Economic Policy group at Stellenbosch University, and new work produced
specifically for the PSSPD IIb project� The project is comprised of the following components:
• A literature review which summarises some recent international and local research investigating education attainment and quality, and the impact of both on labour market outcomes and next-generation education opportunities�
• A thorough investigation of educational attainment and quality in South African schools using historical Census data and data from recent international standardised assessments such as the Trends in International Mathematics and Science Study (TIMSS) and Southern and Eastern African Consortium for Monitoring Education Quality (SACMEQ), and local standardised assessments such as the Annual National Assessment (ANA), National School Effectiveness Study (NSES) and learner performance and administrative data from the Department of Education’s Education Management Information System (EMIS) and Higher Education Management Information System (HEMIS)�
• Analysis of the National Income Dynamics Survey (NIDS) and the Post-Apartheid Labour Market Series (PALMS) to determine the roles of educational attainment and quality in labour market employment probabilities and earnings�
• Investigations of other large scale surveys that may yield information on education-social mobility relationships�

3
ExEcutivE SuMMaRy
Main findingsThe most important findings in this report are:
1� Education quality still poor – International and national standardised assessment results show that while educational attainment has converged dramatically over time between races, poor schools still lag far behind their affluent counterparts in learning outcomes� By Grade 9, learners in poor (mostly black) schools, have a backlog of approximately 3�5 years relative to their rich school counterparts�
2� Large & early learning gaps – Substantial learning gaps between learners in different schools are observable as early as the middle primary school years, making a strong case for decisive intervention as early as possible in a child’s schooling career� As early as Grade 4, fewer than 30% of learners in the poorest 40 percent of schools are performing above international low learning benchmarks�
3� Importance of post-matric education – Educational attainment is an important predictor of labour market outcomes, with years of education completed beyond Grade 12 offering extraordinarily high returns to educational investment, both in terms of employment probabilities and wages earned� In 2007 the wage per hour of someone who had achieved a degree was three times as large as for someone who had achieved only a matriculation�
4� Centrality of school quality – New empirical evidence suggests that school education quality, usually omitted from earnings functions because of lack of data, is also strongly positively associated with future earnings� Therefore, learners who attend poor quality schools generally earn substantially less than those who attend good quality schools, even when they have the same education levels�
5� Unmet expectations – The consequences of unequal education opportunities are particularly dire for many of South Africa’s black youth, who despite having more education than previous generations and no longer facing discriminatory labour market legislation, have no better employment probabilities than older labour market participants� Thus, despite having achieved objective social mobility in terms of education, subjectively young black South Africans have not achieved as much as they would have liked relative to older generations who were less educated and subject to discriminatory labour market legislation�
By Grade 9, learners in poor (mostly black) schools, have a
backlog of approximately 3.5 years relative to their rich school counterparts.

PSPPD: A SOCIETY DIVIDED4
The findings are indicative of a dualistic education system that limits
social mobility for the poor and perpetuates apartheid-era patterns
of labour market inequality� The majority of South African learners
essentially follow a learning trajectory that ultimately leads to poor
access to tertiary education and poor labour market outcomes,
which in turn perpetuate a cycle of desperation for generations
to come that is almost impossible to escape from through the
education system in its current state� The persistence of deep
inequality two decades after apartheid is a powerful indictment
of the South African education system’s failure to overcome past
injustices, despite considerable shifts in government spending to
poor schools� It is therefore of utmost importance that South Africa
addresses inequalities in educational opportunity inequalities as
early as possible to promote social mobility for the poor�
In previous research for PSPPD, ReSEP has investigated the
education system in more depth, with a focus inter alia on the
binding constraints to educational improvement� A central finding
in this regard, which is enhanced by the analysis in this report, is
that early interventions are crucial, and that there is a clear need for
a focus on getting reading right in the first years of primary school�
Readers are referred to two of these studies for further analysis
of policy recommendations: The report on Binding Constraints in Education (Van der Berg et al�, 2016) and Laying Firm Foundations
(Spaull et al�, 2016)�
This report has demonstrated how social mobility, and thus also
poverty and income distribution, is closely linked to the quality of
education that South Africa society provides for its children� The
imperative to improve on this cannot be clearer, and requires wider
debate, more experimentation and improved implementation of
policies in education to create a better future for the millions of
children currently caught in a cycle of poverty�
As early as Grade 4,
less than one third of learners in poor schools are performing above international low learning benchmarks.

5
intRoduction
1 Introduction
“An equitable society would not allow circumstances over which the
individual has no control to influence her or his basic opportunities
after birth� Whether a person is born a boy or a girl, black or white,
in a township or leafy suburb, to an educated and well-off parent
or otherwise should not be relevant to reaching his or her full
potential: ideally, only the person’s effort, innate talent, choices in
life, and, to an extent, sheer luck, would be the influencing forces�
This is at the core of the equality of opportunity principle, which
provides a powerful platform for the formulation of social and
economic policy—one of the rare policy goals on which a political
consensus is easier to achieve�” (World Bank, 2012)�
The role of educational attainment in the promotion of social
mobility has long been one of the central issues in political,
economic and sociological debate� A considerable body of
international and South African research points to education’s
increasing importance in determining labour market outcomes
and economic growth and upon first sight, would suggest that
countries need only to improve access to education at all levels
to improve labour market and growth prospects (Mankiw, Romer,
Weil, 1992; Barro, 2001), and by extension reduce inequality�
Yet despite the rapid expansion of educational attainment amongst
South Africa’s non-white population since the 1970s and large
scale resource shifts in social spending targeted towards the poor,
the predicted role of education as an uplifting intermediary link
between initial socioeconomic background and later socioeconomic
class has been less robust than was previously believed� A number
of possible reasons have been put forward to explain the limited
impact of educational attainment on social mobility� Many of these
relate to the labour market, where slow job creation, work-place
discrimination, institutionally determined wages and demand-
supply mismatches are some of the factors often cited as reasons
why convergence in educational attainment between races has
produced unspectacular social mobility trends in South Africa�
The most compelling argument for the weak link between education
and social mobility is that educational attainment in years does
not uniformly reflect learning outcomes (see Louw et al, 2006; Van
der Berg, 2007; Spaull, 2013)� As will become clear in the rest of
this report, each additional year of education in weakly performing
schools is unlikely to produce the same learning outcomes as
an additional year in a well-functioning school� The disparities
Each additional year of education in
weakly performing schools is unlikely to produce the
same learning outcomes as an additional year in a well-functioning school.

PSPPD: A SOCIETY DIVIDED6
in learning outcomes between races today has its roots in an
education system previously divided along racial lines, with
government spending disproportionately favouring whites� While
the political transition in 1994 ushered in a government whose
ideologies were significantly more pro-poor, many of the country’s
institutions continued to operate de facto along racial lines, much
as they did under apartheid� This inertia is particularly apparent
in South Africa’s education system that continues to provide
education quality of a standard similar to that found in developed
countries to a small elite, while the majority of learners (mostly
black) attend schools that for the most part are as dysfunctional as
they were under apartheid�
While the human and physical resource deprivation under
apartheid in the former black part of the school system undoubtedly
contributed to the dysfunctionality of many of these schools,
weak functioning in schools is further exacerbated by intangible
elements such as weak management, low levels of cognitive
demand and poor teacher and learner discipline� This school-
level dysfunctionality combined with the lower socioeconomic
background of learners combine to make social mobility through
the education system particularly difficult for children in the poorer
part of the education system�
This report argues that addressing the causes of inequality in the
education system is necessary for sustainable social mobility�
The failure to offer children of all backgrounds the opportunity
to realise their true potential through more and especially better
quality education perpetuates the cycle of inequality along the
lines of race, location and socio-economic status� In Chapter 1
an overview of South African inequality trends, social mobility
theory, international literature and the framework for analysing
social mobility in South Africa is presented� Chapter 2 describes
how the labour market in South Africa is both a cause and result
of educational inequality� This is followed by Chapter 3 which
describes how the South African education system in many ways
still functions as two separate entities�
The failure to offer
children of all backgrounds quality education perpetuates the cycle of inequality along the lines of race, location and socio-economic status.

7
Education and Social MoBility in SoutH afRica
2 EDUCATION AND SOCIAL MOBILITY IN SOUTH AFRICA
2.1 Inequality in South Africa: recent trends
Despite South Africa’s classification as an upper middle-income country based on its economic
structure, it fares poorly on a number of quality of life indicators such as life expectancy, infant
mortality and access to basic services� Statistics South Africa’s (2016) mid-year estimates find that life
expectancy was 62�4 years and infant mortality was 33�7 deaths per 1000 live births, both on par with
lower-middle and lower income countries� Both indicators are symptoms of an extremely inequitable
distribution of human capital (health and education) and other resources� A relatively small group
of South Africans enjoy a standard of living similar to that of developed country citizens, while the
poorest 20% of the population has spending power on par with the poorest developing countries (Van
der Berg, 2014: 198)�
Poverty in South Africa still has a strong rural dimension, with much of the country’s poverty
concentrated in the former homelands, the areas set aside for blacks during the apartheid period,
shown by the yellow borders in Figure 2�1� The Eastern Cape, Kwazulu-Natal, Limpopo and North West
Province (where most of the former homelands were concentrated) account for 61% of South Africa’s
poverty burden (Moses, 2017)�
Figure 2�1: Poverty headcount by municipality (2011)
Source: Moses (2017).

PSPPD: A SOCIETY DIVIDED8
The concentration of poverty in the former homelands has its roots in the systematic exclusion of
black South Africans from full economic and political participation during the apartheid era� That
exclusion, along with sustained inequality in government spending in all spheres (such as basic
services, education, health, housing and social grants) is a large contributing factor to the persistent
poverty plaguing the former homelands and inequality between races� That inequality has remained
persistently high over time, with a particularly large increase in inequality between 1995 and 2001, as
shown by the Gini coefficients in Table 2�1 below (confirmed by a number of authors such as Yu, 2009;
Ardington et al�, 2005)� Since 2001, overall inequality has remained relatively stable and high over
time, although there have been small decreases in inequality between race groups over the same
period�
The confounding combination of a rise in overall inequality and a decrease in inequality between races
can be reconciled by considering the intra-racial inequality trends over time (in the first four columns of
Table 2�1)� Between the mid-1990s and 2011 inequality within race groups has increased substantially�
The increased inequality within race groups can be explained in large part by a substantial upward
movement of other race groups into a middle class that was previously dominated by whites (Van der
Berg et al�, 2008)�
Table 2�1: Intra-group income / expenditure inequality: Gini coefficients 1970 to 2011
Blacks Coloureds Indians White Total
Census 1970 – 0�53 0�42 0�43 –
Census 1975 0�49 – – – –
IES 1995 0�57 0�52 0�49 0�47 0�66
IES 1995 (expenditure) 0�58 0�52 0�49 0�47 –
Census 1996 0�68 0�57 0�53 0�52 –
Census 1996 (SRMI) 0�62 0�53 0�48 0�46 0�69
IES 2000 0�59 0�55 0�51 0�49 –
Census 2001 (post-SRMI) 0�65 0�6 0�58 0�57 0�76
Community Survey 2007 (post SRMI) 0�66 0�62 0�61 0�56 0�74
Census 2011 (post SRMI) 0�72 0�66 0�64 0�57 0�75
Source: 1970 to 2007 figures: Van der Berg & Louw (2004); Yu (2009: 41, Table 2). 2011 figures: Own calculations based on Census 2011 data.
The removal of apartheid-era labour market discrimination therefore benefited a number of
blacks, coloureds and Indians, but as the rising intra-racial Gini coefficients show, many previously
disadvantaged citizens remained relatively disadvantaged in the post-apartheid era� Education has
increasingly become the dividing line between affluence and poverty within groups, with highly
educated black individuals being able to take advantage of increased opportunities for mobility due
to the overhaul of labour market legislation and being able to benefit from new opportunities in the
labour market� Unfortunately, slow yet technology-intensive economic growth did not benefit the
less educated, resulting in increasingly precarious employment opportunities for individuals with
less than a Grade 12 qualification� The difference in employment probability between the educated

9
Education and Social MoBility in SoutH afRica
and less educated is shown below in Figure 2�2, which shows
the conditional probability of employment in 2007 (Van der Berg,
2014: 212)� From the figure below it is evident that that up to
Grade 11 there is very little increase in employment probability
for every additional year of education� However, from Grade 12
onwards, the probability of employment increases dramatically,
with tertiary graduates on average enjoying an employment
probability of close to 90 percent�
Figure 2�2: Conditional probability of employment, 2007
00.10.20.30.40.50.60.70.80.9
1
Employment probability (conditional)
0 1 2 3 4 5 6 7 8 9 10 11 12 13 14 15Education (years)
Source: Van der Berg (2014).
The relationship between educational attainment and wages is
similarly convex, with relatively little reward for every additional
year of education before Grade 12 (matric), and very high returns
for every additional year of education completed from Grade
12 onwards� The powerful link between education and labour
market outcomes from Grade 12 is therefore partly attributable
to the signalling effect of passing the externally assessed matric
examination1 (evidenced by employment probabilities), but also
because of actual higher productivity (evidenced by higher wages
for higher levels of education once employed)�
At the root of South Africa’s persistent poverty and income
distribution problem are widespread unemployment and severely
unequal wage distributions for the employed� Educational
attainment, and education quality (as will be demonstrated later
on in Chapter 3 of this report), are inextricably bound to labour
market outcomes� This relationship therefore supports the case
for increased educational attainment for social mobility, both
intergenerationally and for individuals�
1 In South Africa, as in a number of developing countries, learners are sometimes routinely promoted despite learning very little. Learning deficiencies therefore only become apparent in the externally assessed National Senior Certificate Examination.
Up to Grade 11 there is very
little increase in employment probability for every additional year of education.
Tertiary graduates on average enjoy an employment probability of close to 90 percent.

PSPPD: A SOCIETY DIVIDED10
BOX 1: Migration and social mobility in South AfricaPoverty in South Africa is strongly associated with geography� As Figure 2�1 showed earlier, poverty headcount rates are highest in South Africa’s former homelands� The poverty gap ratio (or depth of poverty), which measures the extent to which people are below the poverty line relative to what incomes would have been if everyone was exactly on the poverty line, is shown below in Figure 2�3� Poverty is deepest in the former homelands (shown by yellow borders)�
Internal migration offers individuals a more immediate (and often less costly) means of changing personal and household living standards than investing in more education� Unsurprisingly, as Figure 2�4 shows, municipalities within former homeland borders also have the lowest net internal migration rates (darker areas have more out-migration than in-migration)�
Conventional migration theory holds that individuals are most likely to migrate when the expected wage (considering also the probability of employment) in the destination region is higher than the wage in the sending region� Therefore, migration will occur until average expected wages are equalised between regions� Figure 2�5 shows an earnings function for migrants and non-migrants between the ages of 15 and 49 years based on data from Census 2011� The reference groups, shown by the dashed vertical line, are black males, individuals between the ages of 15 and 19 years, with no schooling, who live in rural areas and do not migrate� On average, whites earn more than Indians, who in turn earn more than coloureds, who themselves earn more than blacks (the reference group)� Women earn less than men, while being older (having more labour market experience) is associated with higher wages�
The powerful role of location as a determinant of income is shown by the urban premium in wages� Changing location is also beneficial to migrants� In every case, interprovincial migrants earn more than their non-migrant counterparts (after controlling for a number of other factors)�
Figure 2�3: Poverty gap (depth of poverty) by municipality, 2011
Figure 2�4: Net inter-municipal migration rates, 2011

11
Education and Social MoBility in SoutH afRica
Figure 2�5: Earnings functions for provincial migrants and non-migrants, 2011
ColouredIndian or Asian
White
Female
20 to 2425 to 2930 to 3435 to 3940 to 4445 to 49
Some primaryCompleted primary
Some secondaryGrade 12/Std10
HigherUrban
EC migrantNC migrantFS migrant
KZN migrantNW migrant
GAU migrantMPU migrantLIM migrant
Black
Male
15 to 19 yrs
No schooling
Census 2011Earnings function interprovincial migrants and non-migrants
–.5 0 .5 1 1.5 2
Figure 2�5 shows the factors associated with the log income of employed individuals between the ages of 15 and 49 years� The vertical dashed reference line shows the reference group (listed in bold text) for a a particular explanatory variable� Within each category (such as age or race), the distance from the reference line shows how much more or less (in log rands) that group earns relative to the reference group� For example, for race “black” is the reference group� So, relative to the black reference group, coloureds earn more, Indians earn more both than coloureds and blacks, while whites earn the most�
Source: Own calculations based on Census 2011 data.
Figure 2�6: Access to basic services by migration status, 2011
Access to basic services by migration status 2011
Non-migrant EC
Flush toilet
Migrant EC to WC
Non-migrant EC
Migrant EC to WC
0
20
40
60
80
100
Piped water
Employed Unemployed Discouraged
In addition to labour market benefits, access to social services in migrant destinations are often better than in sending regions� Figure 2�6 shows access to basic services for adult Eastern Cape non-migrants and migrants from the Eastern Cape to the Western Cape, by employment status� Regardless of employment status, migrants from the Eastern Cape enjoy far better access to sanitation and piped water than their non-migrant counterparts�
Source: Own calculations based on Census 2011 data.
Migration therefore offers individuals an opportunity to achieve social mobility through the labour market and through improved access to basic services, which through their impacts on health can improve labour market and education outcomes�
2.2 Education and Social Mobility Upon assuming power, South Africa’s post-1994 government was faced with tremendous inequalities in the provision of education, health and basic services� The enduring legacy of apartheid still makes itself felt today by vast disparities in the distribution of income, access to services, and unemployment and poverty burdens� Two decades after the de jure dismantling of apartheid, South Africa’s socioeconomic landscape is still visibly divided along racial, geographic and gender lines, with the average white South African being considerably more affluent than black South Africans�
Nevertheless, South Africa has witnessed unprecedented upward social mobility from the lower class into the middle class, with much of that mobility being concentrated amongst the black population�

PSPPD: A SOCIETY DIVIDED12
Between 1993 and 2008 South Africa’s middle class absorbed an additional 3 million black people, increasing their share of the middle class from just under 30 percent to more than 50 percent within 15 years (Visagie, 2015)� Considered in isolation, the magnitude of the upward movement for blacks is suggestive of an economy that is increasingly becoming more dynamic and inclusive, conditions generally associated with improved economic and political stability (Easterly, 2001)�
However, recent increases in the frequency and violence of service delivery protests suggest serious dissatisfaction with social and economic conditions amongst large parts of the population� It appears to point to a serious imbalance between a minority of highly educated who could take full advantage of the changing political and economic landscape, and those whose prospects of social mobility are limited by deteriorating labour
market prospects� In a more meritocratic but unequal environment the public education system is universally regarded as a crucial link between initial poverty in childhood years and eventual mobility into a higher socioeconomic class� In this section the role of the public education system in promoting social mobility will be described, followed by a discussion of how socioeconomic status is transmitted inter-generationally through education in South Africa�
2�2�1 Public education and social mobilityThe strong relationship between socioeconomic background and educational outcomes, coupled with high returns to education, means that education systems often fail to contribute much towards social mobility from one generation to the next� Yet there is some evidence that countries that spend more on education have higher social mobility, which offers some hope that it is possible for education to act as an equalising force� However, it must be noted that none of the studies outlined below give evidence of a causal relationship� It could be that the observed relationship between mobility and education expenditures simply reflects some other characteristic of countries that is related to both� Furthermore, higher public education spending on its own is unlikely to improve outcomes, unless these resources are used effectively (Hanushek, 2003)�
According to the model of Solon (2004) that is later discussed in more detail, intergenerational mobility should increase the more progressive education spending is� Several empirical studies have examined the relationship between public education expenditure and intergenerational mobility� Chevalier et al� (2009) show that public education spending is positively related to intergenerational mobility across European countries and the USA, but that the expansion of access to tertiary education for successive generations does not appear to have increased educational mobility substantially�
Ichino et al� (2011) model differences in intergenerational persistence across countries in terms of differences in political institutions and their effect on public education� They find a negative association between public education expenditures and intergenerational persistence – in other words, higher expenditures on public education are associated with a greater level of mobility� Primary education expenditures in particular are strongly correlated with mobility�
Blanden (2009) also finds that education spending as a percentage of GDP is positively correlated with social mobility across countries (or negatively correlated with intergenerational persistence)� However, he finds no clear pattern indicating that primary schooling expenditure is more important for mobility than expenditures on the secondary phase�
Two decades after the de jure dismantling of apartheid, South Africa’s socioeconomic landscape is still visibly divided along racial, geographic and gender lines

13
Education and Social MoBility in SoutH afRica
Mayer and Lopoo (2008) analyse the relationship between mobility and various forms of government spending across US states� They find that states that spend more have higher intergenerational mobility, especially for low-income children� The category of state spending that has the largest association with the future incomes of low-income children is primary and secondary education�
Behrman et al� (1998) find no significant effect of public education spending as a proportion of GDP on intergenerational schooling mobility in Latin America� However, government spending on primary education per child of primary school age is positively and significantly related to intergenerational schooling mobility (though for only one of their two schooling mobility indices)� Furthermore, average school quality, as measured by the average education of teachers, is positively and significantly associated with intergenerational schooling mobility for both indices� The authors suggest that the lack of any significant relationship between overall education spending and mobility could be because once spending on primary education and school quality is taken into account, total education spending may reflect education spending that disproportionately benefits the rich�
This brief review of the literature suggests that more spending on education is likely to be positively related to social mobility� That will only be the case, however, if more education spending does lead to improved learning� However, as Berhman (1998) finds, both education quality (a supply side factor) and home background (demand side) are important predictors of social mobility� As the next section shows, socioeconomic status is for the most part inter-generationally persistent� Children from affluent homes are likely to attend well-functioning, well-resourced schools, while their poorer counterparts, already disadvantaged by poverty, languish in schools that are less able to promote cognitive skill development and that are often more poorly resourced�
2�2�2 The intergenerational transmission of socioeconomic status and education in South Africa
Two important theoretical papers have related intergenerational persistence to differing investment in human capital by rich and by poor parents� In these models, the persistence of income or earnings across generations (i�e� limited intergenerational mobility) occurs because children of better-off parents tend to inherit better endowments, transmitted both genetically and through “nurture”, as well as because better-off parents are able to invest more in children’s human capital� Becker and Tomes (1986) developed a model of intergenerational mobility that modeled children’s income as a function of parents’ investment in their children’s human capital, as well as of endowments inherited from parents, including genetically inherited traits such as ability, aspects of culture and family connections� In their model, parents’ utility depends on both their own consumption and the consumption of their children, which is determined by the human capital invested in their children� Parents allocate expenditure between their own consumption and investments in the human capital of their children� Credit constraints may limit optimal investment in children’s human capital by poor parents, as they cannot provide the collateral for loans to invest in their children’s education, even if such education may bring large financial rewards�
Solon (2004) expanded this model� In his model, intergenerational mobility is related to the inheritability of characteristics that are rewarded in the labour market, the effectiveness of investment in human capital, the returns to human capital in the labour market, and how progressive public human capital investment is� The more productive private investment in human capital is, the lower intergenerational mobility is likely to be, as children from rich backgrounds tend to experience more of this advantage� On the other hand, as public human capital investment becomes more progressive, intergenerational mobility increases�

PSPPD: A SOCIETY DIVIDED14
Behrman et al� (1998) explain how a number of factors (market imperfections) may result in different
households facing different benefits and costs and thus result in them making different investments in
their children’s human capital� High income households may be able to access better quality schools,
raising the benefit of schooling to them and thus giving them an incentive to invest in higher levels of
education� Second, the costs of investments that are complementary to schooling, such as time spent
helping children with homework or investing in children’s health, are often lower for more affluent,
better educated parent� Finally, highly educated parents may have access to social networks that
enable their children to obtain highly paid jobs, which again raises the marginal private benefit of
investment in their children’s education�
There are wide gaps in the educational achievement of children from different socioeconomic status
backgrounds in South Africa� Children face unequal opportunities across the life course – children
from middle-class households are much more likely than those from poor households to complete
primary school on time, reach matric, receive some tertiary education or find employment (Zoch,
2013)� Parents’ education, in particular that of mothers, is strongly related to their children’s education
outcomes (Lam, 1999; Timaeus, Simelane and Letsoalo, 2013; Zoch, 2013)� The relationship between
socioeconomic status and educational outcomes is particularly strong in South Africa – even more
so than in the USA, where socioeconomic status and educational outcomes are also strongly related
(Taylor and Yu, 2009)�
The average socioeconomic status of learners in a school has a stronger association with learners’
performance than their own socioeconomic background, but learners’ own socioeconomic status has
a strong influence on what school they attend (Taylor and Yu, 2009) and their respective enrolment
rates� Burger and Zoch (2016) use data from the National Income Dynamics Survey to track individuals’
school and labour market progression from 2008 to 2014� Figure 2�7 shows the probability of being
enrolled for black non-poor and poor blacks� While there is almost universal enrolment for all races
until age 12, there is substantial divergence between black and white from that point on, and also
between non-poor and poor blacks�
Figure 2�7: Probability of a black person being in enrolled in education by age, 2008 to 2014
Age Non-Poor Poor
100%
90%
80%
70%
60%
50%
40%
30%
20%
10%
0%6 9 12 15 18 21 24 27 30
Source: Burger and Zoch (2016).

15
Education and Social MoBility in SoutH afRica
Figure 2�8 compares the matric pass rate of three race groups
across all 12 school grades� The probability of passing differs not
only between race groups but also between grades� Figure 2�8
shows that the average probability of passing grade 2 to grade 7 is
roughly 93% for blacks, 95% for coloureds and 97% for whites� The
probability of passing decreases from grade 7 onwards for all race
groups� Black learners from poor homes are demonstrably less
likely to pass a grade than black non-poor learners, with visible
differences between the two groups settling in as early as Grade 2�
Figure 2�8: Pass rates by race and Grade (2008 to 2014)
100%
90%
80%
70%
GradePass rate poor black Pass rate non-poor black Pass rate Coloured Pass rate White
1 2 3 4 5 6 7 8 9 10 11 12
Source: Burger and Zoch (2016).
Socioeconomic status has a much stronger influence on educational
achievement in rich rather than poor schools� In most poor schools,
not even relatively well-off students perform well� In rich schools
where learners’ socioeconomic status is more strongly related
to their performance, even poor children nevertheless perform
relatively well� Poor schools are less able to mitigate the effects of
a learner’s disadvantaged background (Van der Berg, 2008)� Rather
than promoting social mobility by weakening the link between
children’s home backgrounds and their school performance, the
South African school system entrenches existing inequalities, thus
limiting social mobility�
Black children who attend historically white schools perform
significantly better than their peers who remain in historically black
schools� Coetzee (2014) shows that attending a former white school
increases black children’s mathematics and English test scores by
0�5 and 0�7 standard deviations respectively, even after considering
those characteristics that make children more likely to attend a
former white school� This is equivalent to more than a year’s worth
of learning� This suggests that accessing higher quality, well-
Black learners from poor homes are demonstrably
less likely to pass a grade than black non-poor learners, with visible differences between the two groups settling in as early as Grade 2.
Attending a former white school increases black children’s
mathematics and English test scores by 0.5 and 0.7 standard deviations respectively equivalent to more than a year’s worth of learning

PSPPD: A SOCIETY DIVIDED16
functioning schools can help to improve children’s life chances,
disrupting the intergenerational transmission of socioeconomic
status and thus promoting social mobility� More recent research
based on tracking children across schools finds similarly large
effects of attending a better performing school (Coetzee and
Van der Berg 2017)� However, to the extent that socioeconomic
background determines what school a child ends up in, the school
system merely serves to perpetuate existing patterns of inequality�
One of the ways of escaping poverty that is mentioned in the
framework described later in this chapter is that poor schools may
perform well enough to allow some of their learners to reach and
perform well in matric and to continue on to university� Kotzé (2017)
draws on two uniquely constructed datasets using Annual National
Assessments and the School Monitoring Survey to investigate the
prevalence of such poor schools which manage to perform above
the demographic expectation� She finds that only 5% of all quintile
1 – 3 schools, serving only 3% of the total learner population,
perform on average at a level that is broadly consistent with a
low international benchmark and that could lead on to obtaining
a Bachelor’s pass in matric� She estimates that poor learners who
attend such schools gain up to a year of additional learning relative
to their peers in weakly performing schools� Characteristics
associated with such good performance of poor schools are strong
school management and governance and supportive bureaucratic
accountability� Her estimates of the number of poor children being
able to follow this route out of poverty, i�e� through performing
well in matric, is similar to those shown in the figure from Van
Broekhuizen et al� (2016) presented in Chapter 3, that only 3 to 4%
of the children starting secondary school in quintiles 1 – 3 achieve
Bachelor’s level passes, i�e� a level of performance that can lead on
to university studies�
Using data from the National Income Dynamics Study (NIDS),
Hofmeyr (2017) investigates the role of household structure on
educational outcomes� Given the fragility of households in South
Africa, much of it generated by a century of migrant labour, this is an
important issue� Her analysis paper suggests a strong correlation
between home background and the educational outcomes of a
sample of South African youths� She finds that, broadly speaking,
the co-residence of biological parents in the household is positively
associated with educational outcomes of children�
The foregoing literature suggests that government has a large
role to play in providing opportunities for poor children to access
and complete good quality education in order to escape from
Only 5% of all quintile 1 – 3 schools, serving only 3% of the total learner population, perform on average at a level that could lead on to obtaining
a Bachelor’s pass in matric

17
Education and Social MoBility in SoutH afRica
poverty� In the next section a conceptual framework for analysing social mobility through education is
presented� This framework will be used throughout the rest of this report to describe how the dualistic
nature of the education system perpetuates labour market inequalities in South Africa, long after the
demise of apartheid�
2.3 Education quality as a tool for social mobility in South Africa: a conceptual framework
The grim labour market prospects facing poor young adults are in large part attributable to an
education system that still produces vastly different education outcomes that favour a small elite
in the wealthy part of that system and disadvantages most black and coloured learners in the less
affluent part of the system� The strong link between education quality and labour market outcomes
in South Africa is shown below in Van der Berg’s depiction of the dualistic natures of both the school
system and the labour market (Figure 2�9)� A small minority of learners attend functional, high quality
(mostly former white) schools, staffed by qualified teachers and characterised by good management,
assessment and parental involvement� Learners graduating from these schools have relatively good
chances of entering the upper end of the labour market, usually often after also acquiring some form
of tertiary education� The high productivity jobs in this part of the labour market offer high rewards�
Traditionally this part of the labour market has been dominated by whites, but the removal of apartheid
era restrictions, government interventions (such as black economic empowerment and affirmative
action) and improved access to better quality education for blacks have allowed a relatively small
black minority to achieve upward social mobility through the labour market�
Figure 2�9: South Africa’s dualistic school system and labour market
•Big demand for good schools, despite fees
•A few schools cross the divide
High productivity jobs & incomes •±10 – 15% of labour force –
mainly professional, managerial & skilled jobs
•Requires degree, good quality matric, or good vocational skills
•Historically mainly whites
•Vocational training
•Affirmative action
High quality schools •±10 – 15 % of schools, mainly former
(though no longer) white
•Produce strong cognitive skills
•Teachers qualified, schools functional, good assessment, parent involvement
Low productivity jobs & incomes •Often manual or low skill jobs
•Limited or low quality education
•Minimum wage can exceed their productivity
Low quality schools •Very weak cognitive skills
•Teachers less qualified, de-motivated, schools dysfunctional, assessment weak, little parental involvement, strong unions
•Mainly former black (DET) schools
Some talented, motivated or lucky students manage
the transition
Source: Van der Berg (2015).

PSPPD: A SOCIETY DIVIDED18
In contrast, the majority of South Africa’s learners attend formerly black schools� In such schools,
teachers generally have less formal education than their former white school counterparts, while these
schools typically also suffer from poor management, little parental participation and poor assessment�
As a consequence, these schools produce poor cognitive outcomes, which are poorly rewarded in the
labour market, resulting in low employment probabilities and low wages for those who do find jobs
in unskilled occupations�
Social mobility in such a world of double dualism between the school system and the labour market
can occur in four possible ways� Children from a poor homes can gain entry to the upper end of the
labour market (i) through attending more affluent schools, (ii) through some schools serving the poor
performing well, (iii) through entering the lower end of the labour market and then somehow being
upwardly mobile within the labour market, or (iv) through some children in weaker performing schools
nevertheless performing well enough to complete matric and then gaining access to universities or
colleges�
Throughout this report this framework will be used to discuss how improvements in access to
education, and particularly education quality, are critical inputs in advancing social mobility for
South Africa’s economically vulnerable citizens� The next chapter considers to what extent the South
African education system provides opportunities for poor children to achieve social mobility through
education�
BOX 2: Intergenerational mobility during South Africa’s mineral revolution
Cilliers and Fourie (2017) use a genealogical data set to investigate who benefited from the late 19th century mining boom in South Africa’s northern interior� Whites, who held political power since the 17th centuryand through much of the 20th century, clearly benefited the most from South Africa’s mineral revolution but up to this point, it is unclear who within this group benefited the most�
Cilliers and Fourie (2017) create father-son pairs from the South African Families database, which contains complete registers of all settler families and their descendants until 1910� They use these father-son pairs to investigate whether there has been any intergenerational occupational mobility� The absolute intergenerational mobility is shown below in Figure 2�10� There is increasing intergenerational mobility in absolute terms – by the final period (1887 to 1909) 35% of sons of famers left farming compared to 21% initially� Over time, the decline in the mobility of white collar workers and the increased mobility of unskilled and skilled and semi-skilled workers are remarkable� The patterns in Figure 2�10 are suggestive of a changing labour market in response to the changing drivers of economic activity� However, if one controls for the changing structure of the labour market, a more nuanced story emerges (shown in Figure 2�11)�

19
Education and Social MoBility in SoutH afRica
Figure 2�10: Absolute intergenerational mobility: proportion of sons experiencing occupational mobility, by father’s occupational group, over time
100
90
80
70
60
50
40
30
20
10
01806–1834
‘Slavery’1835–1867
‘Stagnation’1868–1886‘Diamonds’
1887–1909‘Gold’
Farmers White Collar Skilled/Semi-skilled Unskilled
Source: Cilliers and Fourie (2017).
Figure 2�11 shows the relative intergenerational mobility of sons, after controlling for changes in labour market structure� The sons of farmers and unskilled workers experienced very little mobility over time, while the sons of semi-skilled and skilled workers benefited from occupational improvements relative to their fathers, as there were fewer barriers to entry into the upper class�
Figure 2�11: Relative intergenerational mobility: proportion of sons experiencing occupational mobility, by father’s occupational group, over time.
100
90
80
70
60
50
40
30
20
10
01806–1834
‘Slavery’1835–1867
‘Stagnation’1868–1886‘Diamonds’
1887–1909‘Gold’
Farmers White Collar Skilled/Semi-skilled Unskilled
Source: Cilliers and Fourie (2017).

PSPPD: A SOCIETY DIVIDED20
Cilliers and Fourie (2017) offer two possible explanations for intergenerational mobility for the period: geography and migrant status� Those residing closest to mines exhibited the most intergenerational mobility, while those further away showed lower probabilities of mobility� Sons of locally-born fathers were less likely to be intergenerationally mobile than sons of immigrants� Immigrants may have had wider social networks and more access to capital and may have been better educated, allowing them to take advantage of the growing demand for skilled occupations�
The main result from the study is that the benefits of rapid structural transformation of an economy are not evenly distributed� Those at the bottom do not necessarily benefit most, as seen by the relative occupational stagnation of sons of unskilled fathers� Quite often, it is those with the requisite skills and education who are able to benefit most from rapidly changing economic structures� Though circumstances differ, these lessons from history offer interesting glimpses into factors that may influence mobility in various contexts�
3 UNEQUAL CHANCES: THE EDUCATION SYSTEMAs Chapter 3 will attest, much of South Africa’s inequality is rooted in the labour market, where young and poorly educated workers face extraordinarily poor employment and earnings prospects� Inequality in education opportunities leads to inequalities in labour market outcomes, which in themselves limit opportunities for future generations to obtain good education and labour market success� A convincing body of South African evidence (Van der Berg, 2007; Spaull, 2013; Burger, 2016) concludes that the severe inequalities that exist are visibly entrenched as early as the primary school years�
Much of the research on South African educational performance confirms the continued de facto existence of two very different public school systems: a smaller, better-performing system attended by the wealthiest South African learners, and a much larger, less efficient system accommodating the vast majority of learners (Fleisch 2008)� While the dismantling of apartheid provided some blacks with hitherto unprecedented access to education and labour market opportunities, inequality in educational outcomes still manifests itself along much of the same dimensions as before 1994� Race, geographical location and socio-economic status, still almost inexorably linked two decades into democracy, to a large degree determine how a child will perform in school� Learners in the former black part of the school system perform at considerably lower levels than learners in historically white schools� Figure 3�1 shows the distribution of literacy test scores for the 2007 Grade 3 cohort from the National School Effectiveness Study between 2007 and 2009 (Taylor, 2011)�2 The solid line curves show Grades 3, 4 and 5 in former black schools, while the dashed curves represent learners in the same grades in former white schools� The vast performance differences between learners in different parts of the school system are immediately apparent�
2 Kernel density curves such as these are best read as if they show continuous histograms, i.e. the distribution of performers across different levels of test scores. The highest point on each curve is then the modal value, i.e. the test score that most frequently occurs.
Race,
geographical location and socio-economic status still predict how a child will
perform in school.

21
unEqual cHancES: tHE Education SyStEM
In Grade 3, learners in historically black schools perform substantially worse than learners in historically white schools� As learners progress to Grade 5, the already limited overlap in performance between the two race groups becomes even smaller� That overlap occurs at the top end of the black distribution and the bottom end of the white distribution� In other words, the worst performers in historically white schools and the best performers in historically black schools perform at roughly similar levels�
Figure 3�1: Literacy scores for 2007 Grade 3 cohort, 2007 to 2009
00
Kern
el D
ensit
y
0.005
0.01
0.015
0.02
0.025
0.03
0.035
0.04
0.045
9 20 31 42
Literacy score (Percentage)
Historically black grade 3
Historically black grade 4
Historically black grade 5
Historically white grade 3
Historically white grade 4
Historically white grade 5
53 64 75 86
Source: Taylor (2011).
The small degree of overlap in performance between historically
black and white schools is an indictment of an education system
that mostly still operates as two sub-systems, with one producing
substantially different learning outcomes to the other� The magnitude
of the performance gap is apparent from how much to the left the
Grade 5 distribution of black children lies compared to the Grade 3
distribution of white learners, despite that latter group being two
years younger�
In this chapter a brief overview of the growth in South African
educational attainment over time is given before delving into the
education system’s performance in recent years� A case will be
made that the staggering inequalities in educational opportunity and
outcome that manifest themselves as labour market inequalities later
on, are cultivated as early as the first few primary school years, and
follow learners throughout their school and higher education careers�
Thereafter South Africa’s higher education sector, where access is still
limited because of a combination of financial constraints and failures
in the basic education system, will be discussed�
On average black individuals
born in 1990 have 8 more years of education than those
born in 1945

PSPPD: A SOCIETY DIVIDED22
3.1 Spectacular growth in educational attainment over time
Historically, South Africa has spent more on education than most developing countries, spending
R189�5 billion on basic education in 2014/15� The sustained spending shifts in favour of former black
schools has been evident since at least the 1970s (Van der Berg, 2008), resulting in growth in average
educational attainment that is nothing short of spectacular� Figure 3�2 shows the average educational
attainment of black South Africans, relative to the 1945 birth year cohort: for example, on average those
black individuals born in 1990 have 8 more years of education than those born in 1945� Educational
mobility has occurred in both absolute terms and relative to the white population, whose educational
attainment remained relatively stable over time�
Figure 3�2: Educational attainment growth for black South Africans, by birth cohort
–2
–1
0
1
2
3
4
5
6
7
8
9
Birthyear
Year
s of e
duca
tion
Average years of own education (relative to 1945 birth year cohort)
Source: Von Fintel and Von Fintel (2017), based on NIDS data.
Educational convergence between races is also evident in Figure 3�3, which shows the absolute numbers
of individuals who had attained at least a Grade 12 school-leaving certificate (matric) between 1960
and 2011� In the 1960 census just 17 980 members of the black population had matriculated; by the 2011
census that figure had increased to 8 462 047� The racial differentials in educational attainment in the
two decades coinciding with the post-apartheid era (from 1991 to 2011) are particularly noteworthy –
while the number of white individuals with at least Grade 12 grew by only 16% over the period, the
number of black matriculated individuals grew by 454% (and by 269% and 168% for coloureds and
Indians/Asians, respectively)�

23
unEqual cHancES: tHE Education SyStEM
Figure 3�3: Number of individuals with matric 1960 to 2011 (by race)
Blacks
2011200119911980197019600
2 000 000
4 000 000
6 000 000
8 000 000
10 000 000
12 000 000
14 000 000
Coloureds
Indians
Whites
Source: Own calculations from Census data.
Despite the spectacular gains made before democracy in terms
of producing matriculants, there were still substantial inequalities
between races in terms of educational attainment at the time of
the transition (Van der Berg et al�, 2002)� Figure 3�4 below shows a
boxplot of educational attainment for individuals aged 25 years and
older by race in 1993, with the width of the boxes being indicative
of race group size relative to the total population size� The median
educational level in 1993 (represented by the line within the boxes)
for blacks was approximately 6 years while the white median was
approximately 12 years of education�
Figure 3�4: Educational attainment for individuals aged 25 years and older, by race (1993)
Black Coloured
Race
Educ
atio
n yea
rs
Indian White
0
5
10
15
Source: Van der Berg et al. (2002: 292) based on analysis of data from the 1993 Project for Statistics on Living Standards and Development.
The median educational level
in 1993 for blacks was approximately 6 years while the
white median was approximately
12 years of education

PSPPD: A SOCIETY DIVIDED24
While the pre-democracy educational attainment differences were substantial, a perhaps more serious
consequence of segregated and unequally resourced education was the differentials in education
quality between schools serving the different races� The comprehension and computational ability
tests in the 1993 Project for Statistics on Living Standards (results shown in Figure 3�4) revealed the
shocking degree of dysfunctionality in the black education system�
Figure 3�5: Comprehension and computation test scores (out of 14) for black individuals in 1993, by completed years of education
0.50 1 2 3 4 5 6 7 8 9
Years of schooling
Comprehension Computation
10 11 12 13 14 15 16
1.0
1.5
2.5
2.0
3.5
3.0
4.5
4.0
Com
preh
ensio
n and
com
puta
tion s
core
s
Source: Moll (1998: 274).
The tests, scored out of 14, were designed to be comparable in
difficulty to Grade 7 examinations, though later evaluations of the
literacy test found that its complexity was actually more fitting for
evaluating Grade 3 or 4 learning (Moll, 1998: 272)� While the average
Asian and white scores at all levels of education were 7 or more out
of 14, even the average black test-taker with 12 years of education
failed the test with a score of 5�7� Regression analysis by Case and
Deaton (1999) imply that the racial deficit in cognitive development
measured by the test implied that black learners in 1993 would have
required about 10 more years of schooling than whites to perform on
par with their white counterparts�
While educational expansion had translated into increased
educational attainment for black South Africans, that educational
attainment did not always reflect actual learning� By 1993, the end of
the apartheid era, vast inequalities in educational quality remained,
effectively curtailing labour market success for many black South
Africans� While race is no longer the de jure divider of education
quality and labour market outcomes, its continued close relationship
with socioeconomic status means that the education system today is
still largely split in two by race� This is further analysed in Section 2�2�
Black learners in 1993 would have required about
10 more years of schooling than whites to perform on par with their white counterparts

25
unEqual cHancES: tHE Education SyStEM
3.2 Inequality in education quality: recent evidence
South Africa’s education system was overhauled substantially since
1994� Spending on education has become relatively well targeted
towards the poor, with spending inequalities largely eliminated
(Gustafsson & Patel, 2006; Van der Berg and Moses, 2012)� Yet, in spite
of considerable shifts of resources towards the poor, standardised
local and international tests still reveal stark disparities in learning
outcomes along similar dimensions as under apartheid�
Examination of educational performance shows the continued
existence of a dualistic system that on the one hand provides
education of a quality comparable to that of developed countries
to children in one part of the system, and on the other hand, fails
to prepare most learners adequately for the demands of the labour
market or further studies� Figure 3�6 below shows South African
Grade 4 learners’ reading scores in the Progress in International
Reading Literacy Study 2011, by school quintile3� This so-called
prePIRLS assessment was specifically geared to test learners in
the language that their schools used from Grades 1 to 3 (in most
cases this would be the student’s home language)�
The dualistic nature of South Africa’s education system is apparent
in the large performance gap between quintile 5 schools (shown
by the bold black curve) and the rest of the education system�
Figure 3�6: PrePIRLS Grade 4 reading scores, by quintile ( 2011)
00 200
prePIRLS Gr5 reading score
400 600 800
0.002
0.004
0.006
School SES Q4
School SES Q2
School SES Q1
School SES Q3
School SES Q5
Source: Shepherd (2016).
3 These “quintiles” are calculated from data on possessions in the home. Schools are then classified based on the average asset score into quintiles, with schools serving the poorest 20 percent of learners in quintile 1 and those serving the wealthiest 20 percent of learners).
of the Grade 4 learners could not read for meaning in any language while
29%were reading illiterate. Learners who cannot read for meaning are at risk of becoming part of the “silently excluded”.
58%

PSPPD: A SOCIETY DIVIDED26
Altogether 58% of the Grade 4 learners tested in the nationally representative sample of 341 schools could not read for meaning in any language while 29% were reading illiterate (Spaull, 2016)� Learners who cannot read for meaning are at risk of becoming part of the “silently excluded”, whose early reading backlogs accumulate over time, preventing them from participating fully in academic environments�
The early reading backlogs that many learners have in the poorer parts of the South African school system spill over into other subjects in later grades as well� South Africa’s performance in TIMSS between 1995 and 2015 is shown below in Figure 3�7� The y-axis is delineated in 40-point increments, which is accepted to be roughly equivalent to one year’s learning� While there are no remarkable changes in scores between 1995 and 2002, 2015 South African Grade 9 pupils scored 108 and 82 points higher than their 2002 counterparts in Mathematics and Science, respectively (Spaull, 2013: 17)� In effect, this means that the average South African pupils’ performance in both Mathematics and Science improved more than 2 grade levels between 2002 and 2015�
In isolation, the performance increases are heartening, but relative to other middle-income countries, South Africa’s average is 2�0 grade levels below the middle-income country average in Mathematics and 2�3 grade levels below in Science� The learning gap between pupils from South African and other middle-income countries is all the more apparent in light of the fact that South African Grade 9 pupils were tested while all other countries’ Grade 8 pupils were tested�
Figure 3�7: South African TIMMS Mathematics and Science scores (1995 to 2015)
0
276 275 264 285 352 372 441 260 243 244 268 332 358 450
1995 1999
Grade 8 Grade 9TIMSS
middle-incomecountry
Gr8mean
TIMSSmiddle-incomecountry
Gr8meanTIMSS Mathematics TIMSS Science
Grade 8 Grade 9
2002 1995 1999 20022002 2011 2015 2015 2002 2011 2015 2015
50
100
150
200
250
300
350
400
450
500
TIM
SS sc
ore
Source: Spaull (2017), with figures from Howie & Hughes (1998), Reddy (2006) and Mullis et al (2012, 2016)
South African pupils’ performance in both
Mathematics and Science improved more than 2 grade levels between
2002 and 2015 but South Africa’s average is 2–3 grade levels below the middle-income country average in Mathematics and Science.

27
unEqual cHancES: tHE Education SyStEM
The improvement in the TIMSS averages shown above, while encouraging, masks another salient
feature of the South African education system: the fact that education outputs are not evenly
distributed� Once South Africa’s TIMSS performance is categorised by quintile4 the vast educational
quality differentials still present in the South African school system become apparent (Spaull, 2013: 18)�
Figure 3�8 below shows South Africa’s 2015 average mathematics score by school type, relative to
other middle-income countries� While the average South African learner in the top two asset quintiles
(shown on the graph as “fee charging”) score close to the middle-income mean score of 441 points,
learners in the bottom three quintiles (“no-fee schools”) score 2 grade levels below their counterparts
from wealthier schools�
Figure 3�8: South African TIMMS Mathematics scores (2015)
200
Russ
ia
Kaza
khsta
n
Lithu
ania
Mala
ysia
Turk
ey
Geor
gia
Leba
non
Iran
Thail
and
Chile
Egyp
t
Jord
an
Mor
occo
Publ
ic (N
o-fe
e)
Publ
ic (F
ee ch
argi
ng)
South AfricaMiddle-income countriesIn
depe
nden
t
Saud
i Ara
bia
Sout
h Af
rica (
Gr9)
Botsw
ana (
Gr9)
240
280
320
360
400
440
480
520
560 538 528511
465 458 453442 436 431 427
392 391 386 384 372 368 341423
477
600
Source: Spaull (2013); 2015 data from Reddy et al. (2016).
South Africa’s performance improvements in TIMSS over time have led some researchers to question
why the same improvements cannot be seen in the local externally assessed National Senior Certificate
examinations� The Grade 12 Mathematics marks for learners who pass have declined on average since
2008� Figure 3�9 shows the performance trends for full-time Grade 12 learners in mathematics at
the 50, 60 and 70% levels (Gustafsson, 2016)� At face value, the downward trends appears worrying,
particularly so when one considers the 70% performance level (a B symbol or higher) which declined
at an annualised rate of 3�8% for the 2008 to 2015 period� This stark decline in the number of high-
level achievers performing at the 70% level may suggest that mathematics marks are not strictly
comparable across years, particularly because learners achieving at these high levels are quite often
located in schools with relative performance stability over time�
4 South African public schools are classified by wealth into five quintiles, with quintile 1 representing the poorest 20 per cent and each successive quintile representing the next poorest 20 per cent (up to quintile 5 representing the wealthiest 20 per cent of learners).

PSPPD: A SOCIETY DIVIDED28
Figure 3�9: Trends in mathematics marks trends for full-time Grade 12 learners, unadjusted for changes in difficulty levels
02007 2008 2009 2010 2011 2012 2013 2014 2015 2016
10 000
20 000
30 000
40 000
50 000
60 000
70 000
Lear
ners
atta
inin
g thi
s lev
el
Mark 70Mark 60Mark 50
Source: Gustafsson (2016: 4).
To adjust for possible inconsistency in the testing standard across years in mathematics and science,
Gustafsson (2016: 7) selected 32 well-performing schools that satisfy a number of stability criteria to
serve as performance benchmarks for the years 2008 to 2015� Learners were then divided into 200
performance quantiles to determine their positions relative to other students who wrote mathematics
in the same year� Assuming that school performance and school performance distributions are
relatively stable over time, it is possible to determine with some confidence what marks learners
could have achieved had they written the mathematics examination in different years�
The results, presented in Figure 3�10, confirm the suspicion that the difficulty of the mathematics
examination fluctuated between 2008 and 2015� The general downward trends for learners performing
at the 98th, 123rd and 147th quantile (corresponding to the 50, 60 and 70% average between 2008 and
2014, respectively) suggest that the difficulty of Grade 12 mathematics examinations had increased
over time� For example, learners in the 98th quantile (roughly equivalent to a 50% average across
years) would have achieved 58% in 2008 and 48% in 2015� Similarly, learners in the 147th quantile
(roughly equivalent to a 70% average across years) would have achieved 77% in 2008 but only 69%
in 2015�

29
unEqual cHancES: tHE Education SyStEM
Figure 3�10: Mathematics marks for 32 stable schools, 2008 to 2015 (by select quantile)
452007 2008 2009 2010 2011 2012 2013 2014 2015 2016
50
55
60
65
70
75
80
Mat
hem
atics
mar
k
98th quantile 123rd quantile 147th quantile
Source: Gustafsson (2015: 8).
The apparent performance inconsistency across years therefore provides justification for an
‘adjustment’ of mathematics marks to reduce the impact of measurement error in a bid to get more
comparable estimates of mathematics performance across years� Applying such an ‘adjustment’ to
the raw mathematics marks in Figure 3�9 produces entirely different trends in the numbers of learners
performing at the 50, 60 and 70% levels (shown in Figure 3�11 below)�
Figure 3�11: Mathematics mark trends for full-time Grade 12 learners (adjusted)
02007 2008 2009 2010 2011 2012 2013 2014 2015 2016
10 000
20 000
30 000
40 000
50 000
60 000
70 000
Lear
ners
atta
inin
g thi
s lev
el
Mark 50 Mark 60 Mark 70
Source: Gustafsson (2016: 25).

PSPPD: A SOCIETY DIVIDED30
The results in Figure 3�11 convincingly demonstrate that the
numbers of learners achieving at performance levels of 50,
60 and 70% have generally increased between 2008 and 2015�
The average annual growth in learners achieving these marks
between 2008 and 2015 were 4�3%, 4�5% and 3�4% respectively�
This finding thus contrasts with the conventional view that there
was a contraction of high-performing learners in mathematics for
the period� Encouragingly, after “adjusting” the marks for possible
differences in difficulty, Gustafsson (2016) notes a large increase
in the numbers of black and coloured learners achieving higher
mathematics marks� This provides further support for the findings
from TIMSS that some improvement in performance has been
taking place�
The recent evidence on education quality in South Africa shows
an education system that generally only produces good education
outcomes for a small minority of learners in affluent schools� Pre-
PIRLS shows that the learning gaps observed in secondary school
are already present and growing as early as Grade 4, suggesting
that interventions should be targeted as early as possible�
Section 2�3 presents more evidence of these early learning gaps
and makes a case for intervention as early as possible to mitigate
the cumulative damage done to poor learners throughout their
school careers�
3.3 Inequality from the outset: The case for early intervention
The international literature shows that cognitive gaps between
children of different socio-economic backgrounds are established
well before they enter school, and widen as they progress through
the school system, despite the school system being seen by many
as the primary mechanism for reducing inequality� These early
school and home environment inequalities persist into the labour
market, where poor employment and wage prospects for the poor
deterministically could assign future generations to the same fate
as their predecessors�
Almond and Currie (2010) show that child and family characteristics
at the age of seven can explain as much of the variation in adult
outcomes, such as earnings and probability of employment, as
years of schooling� This means that socioeconomic status begins to
influence children’s abilities and potential from the very beginning
of life, thus transmitting socioeconomic status from one generation
The numbers of learners achieving at
performance levels of 50, 60 and 70% have generally
increased between 2008 and 2015.

31
unEqual cHancES: tHE Education SyStEM
to the next and hindering social mobility� This suggests that the
earlier education (or other) interventions happen, the greater the
chance that they will be successful�
Cunha and Heckman (2007) provide a more formal argument for
early investment in children� In their model, investments at different
stages of childhood build upon one another� Skills (both cognitive
and non-cognitive) acquired during one stage of childhood foster
the development of other skills (“self-productivity”) and increase
the productivity of subsequent investments in children (“dynamic
complementarity”)� In other words, skills learnt early in life enable
children to get more out of school as they get older� However, early
investments need to be followed up by later investments to be
fully effective� This makes it critical to invest in education as early
in a child’s life as possible to reduce the impact of socioeconomic
disadvantage and intergenerational transmission of socioeconomic
status� But early investments also need to be followed up by high-
quality education throughout a child’s school career�
The enduring impact of childhood circumstance, and its power in
predicting future cognitive performance, is particularly evident in
the South African context� Using South Africa’s Annual National
Assessments5, Van der Berg (2015) finds that educational attainment
gaps between the poor and the more affluent are cemented as early
as the middle of primary school already� Figure 3�12 shows South
African learners, proportional to the Grade 1 entering cohort size,
who are not over-aged and who are performing better than one
standard deviation below the white and Indian average6, by grade
and school quintile� The results show a relatively steep downward
trajectory in the number of learners on track in the primary
school years� By Grade 4, fewer than half of the learners who had
started Grade 1 three years earlier would be appropriately aged
and performing at or above the low international benchmark� The
decreases in the proportions of on-track learners are most marked
in school quintiles 1 and 2 (representing the poorest 40% of
schools), where only one-third of learners starting Grade 1 would
be on track by Grade 4�
5 The ANAs were standardised national assessments for learners in the foundation, intermediate and senior phases
6 White and Indian learners in South Africa who are not overaged attain close to the average Mathematics score in TIMSS. In TIMSS the low international benchmark is set at one standard deviation below the average, which suggests that learners performing at one standard deviation below the white and Indian ANA average would also be attaining close to the TIMSS low international benchmark.
By Grade 4, fewer than half of the learners who had
started Grade 1 three years earlier would be appropriately aged and performing
at or above the low international benchmark.
In school
quintiles 1 and 2 only one-third of learners starting Grade 1
would be on track by Grade 4.

PSPPD: A SOCIETY DIVIDED32
Figure 3�12: Number of students on track by Grade and school quintile (ANA, 2012)
Grade 1
Quintile 1
Quintile 2
Quintile 3
Quintile 4
Quintile 5
Grade 2 Grade 3 Grade 4 Grade 5 Grade 6 Grade 9
200 000
300 000
400 000
500 000
600 000
700 000
100 000
0
Source: Van der Berg (2015: 10).
Figure 3�13 presents the same results, but in addition also shows
the percentage of the entry cohort attaining a Bachelor’s pass in
Grade 12 (which makes learners eligible for entry to university)� The
shape of the distribution of Bachelor passes across quintiles is very
similar to that for on-track students in Grade 4, demonstrating that
the educational attainment (and quality) gaps between learners of
different socio-economic backgrounds observed in the Grade 12
national assessments set in as early as primary school�
These results provide a strong argument for early learning
interventions� While drop-out (through poor performance and
repetition) is another notable problem between Grade 6 and
Grade 9, the glaring learning deficits already visible at Grade 4
suggest an urgent need for remedial action as early as possible�
The glaring
learning deficits already visible at
Grade 4 suggest an urgent need for
remedial action as early as possible
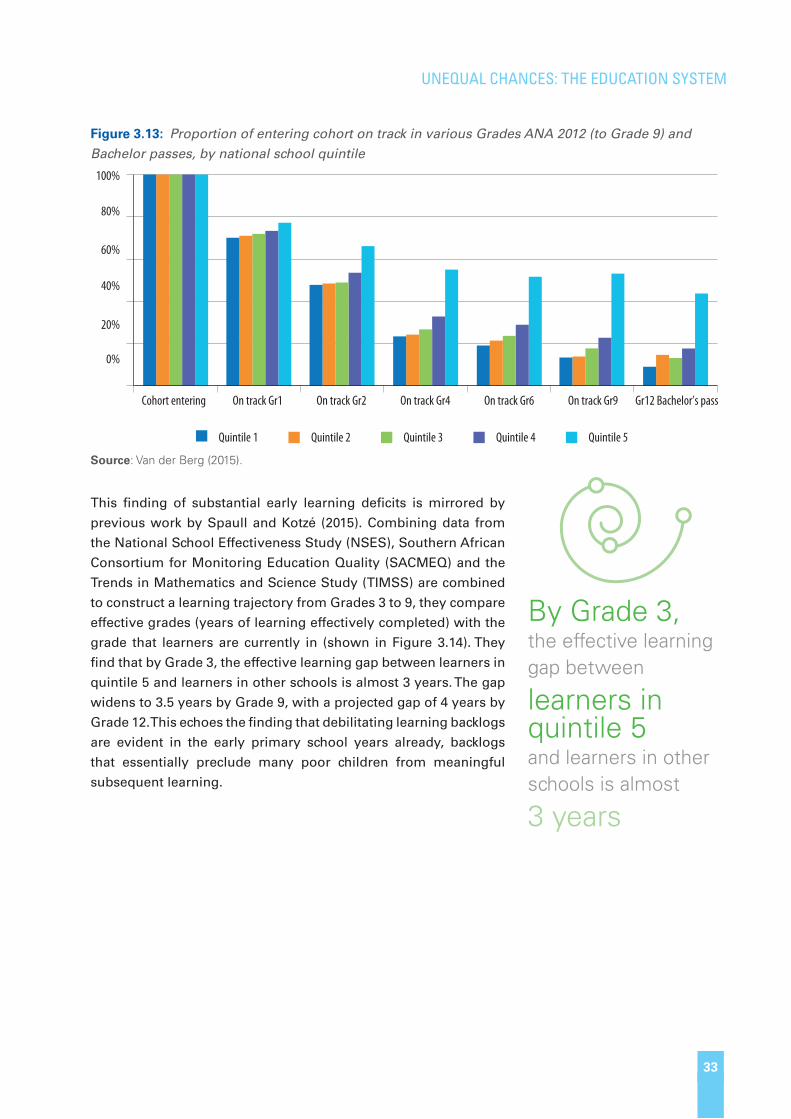
33
unEqual cHancES: tHE Education SyStEM
Figure 3�13: Proportion of entering cohort on track in various Grades ANA 2012 (to Grade 9) and Bachelor passes, by national school quintile
Cohort entering On track Gr1 On track Gr2 On track Gr4 On track Gr6 On track Gr9 Gr12 Bachelor’s pass
0%
20%
40%
60%
80%
100%
Quintile 4Quintile 2Quintile 1 Quintile 3 Quintile 5
Source: Van der Berg (2015).
This finding of substantial early learning deficits is mirrored by
previous work by Spaull and Kotzé (2015)� Combining data from
the National School Effectiveness Study (NSES), Southern African
Consortium for Monitoring Education Quality (SACMEQ) and the
Trends in Mathematics and Science Study (TIMSS) are combined
to construct a learning trajectory from Grades 3 to 9, they compare
effective grades (years of learning effectively completed) with the
grade that learners are currently in (shown in Figure 3�14)� They
find that by Grade 3, the effective learning gap between learners in
quintile 5 and learners in other schools is almost 3 years� The gap
widens to 3�5 years by Grade 9, with a projected gap of 4 years by
Grade 12� This echoes the finding that debilitating learning backlogs
are evident in the early primary school years already, backlogs
that essentially preclude many poor children from meaningful
subsequent learning�
By Grade 3, the effective learning gap between
learners in quintile 5 and learners in other schools is almost
3 years
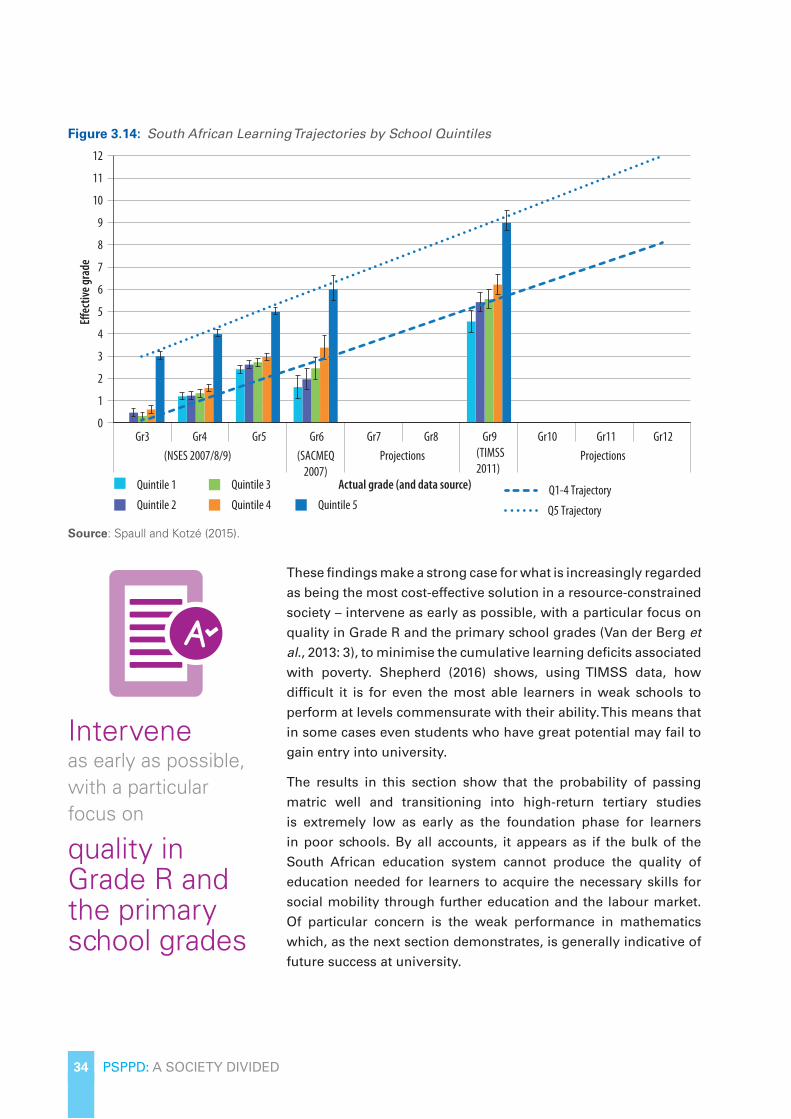
PSPPD: A SOCIETY DIVIDED34
Figure 3�14: South African Learning Trajectories by School Quintiles
Gr3 Gr4 Gr5 Gr6 Gr7 Gr8 Gr9 Gr10 Gr11 Gr12
ProjectionsProjections
Actual grade (and data source)
(TIMSS2011)
(SACMEQ2007)
(NSES 2007/8/9)
12
11
10
9
8
7
6
5
4
3
2
1
0
E�ec
tive g
rade
Quintile 4Quintile 2
Quintile 1 Quintile 3
Quintile 5Q1-4 Trajectory
Q5 Trajectory
Source: Spaull and Kotzé (2015).
These findings make a strong case for what is increasingly regarded
as being the most cost-effective solution in a resource-constrained
society – intervene as early as possible, with a particular focus on
quality in Grade R and the primary school grades (Van der Berg et al�, 2013: 3), to minimise the cumulative learning deficits associated
with poverty� Shepherd (2016) shows, using TIMSS data, how
difficult it is for even the most able learners in weak schools to
perform at levels commensurate with their ability� This means that
in some cases even students who have great potential may fail to
gain entry into university�
The results in this section show that the probability of passing
matric well and transitioning into high-return tertiary studies
is extremely low as early as the foundation phase for learners
in poor schools� By all accounts, it appears as if the bulk of the
South African education system cannot produce the quality of
education needed for learners to acquire the necessary skills for
social mobility through further education and the labour market�
Of particular concern is the weak performance in mathematics
which, as the next section demonstrates, is generally indicative of
future success at university�
Intervene as early as possible, with a particular focus on
quality in Grade R and the primary school grades

35
unEqual cHancES: tHE Education SyStEM
3.4 Access to and performance at university
South Africa’s youth unemployment rate in 2016, at approximately
50%, is amongst the highest in the world and is likely to remain as
high in the foreseeable future (ILO, 2016)� The fact that half of South
African youth entering the labour market are not able to find a job
is deeply troubling�
One suggested response to the high levels of unemployment
of young adults is expanding access to tertiary education so that
more South Africans can take advantage of the relatively high
returns to higher education� However, access to higher education,
either through school performance or financial constraints, remains
highly unequal� Figure 3�15 shows how socioeconomic inequalities
during childhood education persist into early adulthood, with school
socioeconomic quintile being strongly predictive of university access
and success� While most South African children start secondary
school (grade 8), the graph shows how these numbers drop off
between Grade 8 and matric, and then how the numbers that pass
matric are even smaller, and that those achieving a Bachelor’s pass
are an even smaller group� What is also noticeable is how starkly
the patterns differ between those learners in quintile 5 and those
in the bottom three quintiles� While Bachelor’s passes in matric are
achieved by almost 42% of the quintile 5 entrants into high school,
the proportion in quintile 1 is only 3�9%, and there is little difference
in the patterns in the bottom three quintiles�
Figure 3�15: University access and success for the 2008 matric cohort (i.e. the 2004 Grade 8 cohort)
0
1 000
788732
389 419
120
391136
162239
537
521
Grade 8 Matric Candidates Passed Matric Bachelor Pass Obtain Degree
100
200
300
400
500
600
700
800
900
1 000
Stud
ents
Quintile 4
Quintile 2Quintile 1
Quintile 3
Quintile 5
Source: Own calculations based on Van Broekhuizen et al. (2016).
While 42% of the quintile 5 entrants into high school will earn a Bachelor’s pass, only
4% of quintile 1 learners will do so

PSPPD: A SOCIETY DIVIDED36
While 16�2% of learners in quintile 5 schools go on to earn degrees within six years after matric, just
more than 1% of learners from quintile 1 – 3 schools achieve the same feat� The restricted access to
university for learners from poor schools ensures that public spending on tertiary education remains
pro-rich (Van der Berg and Moses, 2012)� Benefit incidence or concentration curves for government
spending on various departments are shown below�7 Figure 3�16 reveals that tertiary education
spending is decidedly pro-rich, with the poorest 40% of South Africa’s population only receiving 5%
of government spending on tertiary education� The unequal spending is largely attributable to access
issues related to academic performance at school, and financial constraints�
Figure 3�16: Social spending by spending category, 2006
100%
90%
80%
70%
60%
50%
40%
30%
20%
10%
0%0% 10%
Total income/expenditure Social Grants Health School Education Tertiary Education
20% 30% 40% 50%
Cumulative % of population
60% 70% 80% 90% 100%
Cum
ulat
ive %
of be
ne�t
s
Source: Van der Berg & Moses (2012).
While government spending on tertiary education mirrors the prevailing income/expenditure inequality
quite closely (in other words, it does little to reduce existing income equality), Figure 3�17 shows that
the racial composition of degree holders has changed substantially between 1960 and 2011� Whites,
who represented more than 90% of all degree holders in the population between 1960 and 1980, made
up only 43% of all degree holders by 2011�
7 Like Lorenz curves, benefit incidence or concentration curves are a graphical representation of inequality. The population is arranged from poorest to richest and placed. The X-axis represents the cumulative percentage of the population. The diagonal 45-degree line indicates equally distributed spending (e.g. the poorest 40% receive 40% of the benefits of social spending, and so forth). Any curves above the line, such as the one for school education, indicate pro-poor spending, i.e. the poorest 40% receives more than 40% of social spending on education (in this case 47%).

37
unEqual cHancES: tHE Education SyStEM
Figure 3�17: Racial composition of degree holders, by race (1960 – 2011)
Blacks Coloureds Indians Whites
100%
90%
80%
70%
60%
50%
40%
30%
20%
10%
0%1960 1970 1980 1991 2001 2011
Source: Own calculations based on Census data 1960 to 2011.
As encouraging as the growth in black tertiary graduates is, university access and success while
at university are still highly unequal� The dualistic school system reduces the majority’s chances of
accessing higher education� Of the student cohort who entered Grade 1 in 1997 (the 2008 matric
cohort), only 60% wrote the matric examinations in 2008, with only 37%8 of the original group passing
matric (Van Broekhuizen, 2016)� Only 26% of the 1997 Grade 1 cohort achieved a pass that qualified
them for university entrance� 12% of the cohort accessed university, and only
half of that group completed an undergraduate qualification within 6 years
after matric�
Figure 3�18 shows that school quintiles (roughly indicative of average learner
socioeconomic status) are strongly predictive of access to university� While
less than 14% of learners in matric from quintile 1 schools enrolled for any
undergraduate programme within 6 years,
the comparable figure for matric learners
from quintile 5 schools is 80%� The very
sharp rise in the slope of the SES-access
relationship between quintile 4 and quintile
5 suggests that learners in the most affluent
schools gain much more from education
relative to most others�
8 The pass rate of 37% refers to the proportion of Grade 1 learners starting school in 1997 who eventually pass matric. The pass rate for learners who made it to Grade 12 and wrote the matric examinations in 2008 was 62%.
Less than 14% of learners in
matric from quintile 1 schools enrol for any undergraduate programme within 6 years

PSPPD: A SOCIETY DIVIDED38
Figure 3�18: University access rates by school quintile – all candidates versus Bachelor candidates
0
0.1
0.2
0.3
0.4
0.5
0.6
0.7
0.8
0
0.1
0.2
0.3
0.4
0.5
0.6
0.7
0.8
Q1
9% 11%15%
4% 5% 7% 14%
23%
35%
63% 66%
68%
50% 53%
68%70%
62%45% 48%
45%
Q2 Q3 Q4 Q5 Q1 Q2 Q3 Q4 Q5
All pass types
Any undergraduate programme Undergraduate degree programme
Bachelor passes
6–ye
ar ac
cess
rate
(%)
Source: Van Broekhuizen et al., 2016.
Because socioeconomic status is still almost synonymous with race, a casual observer may be
tempted to believe that differentials in access rates by race are due to discrimination� As Box 3 shows,
once school performance is accounted for, there are not large differences between blacks and whites
in terms of access to university� This finding emphasises the importance for future social mobility of
improving education quality in those parts of the education system that fail the majority�
BOX 3: The Importance of matric performance for University outcomesBeyond the value of matric as a determinant of access to university, the student’s average mark is also expected to be a good indicator of how well prepared he/she is for the intellectual and emotional demands associated with university enrolment (Van Broekhuizen et al�, 2015)� Figure 3�19 shows the cumulative matric average achievement for learners who wrote the matric examinations in 2008� Cumulative distribution functions (CDFs), such as the one below, show the percentage of learners that achieve at and below a certain performance level� The CDFs below show glaring performance inequalities by race – while 40 percent of white learners achieved less than 60 percent in their matric examination in 2008, the comparable figure for black learners was 95 percent� By implication, 60 percent of white learners writing the matric examination achieved 60 percent or more, while only 5 percent of their black counterparts did�

39
unEqual cHancES: tHE Education SyStEM
Figure 3�19: Cumulative matric average achievement distribution for the 2008 matric cohort, by race
Black Coloured Indian White
00
0.1
0.1 0.2 0.3 0.4 0.5
Matric Average Achievement
0.6 0.7 0.8 0.9 1
0.2
0.3
0.4
0.5
0.6
0.7
0.8
0.9
1
Cum
ulat
ive Pe
rcent
age
Source: Van Broekhuizen et al. (2015).
As matric performance is positively related to university access and performance, the stark performance differentials in the secondary education part of the education system spill over into the higher education sector� The linear probability regressions in Tables 3�1 and 3�2 overleaf confirm the racial differentials in university access, conversion, completion and dropout� Table 3�1 shows the relationship between race and university outcomes for the 2008 national matric cohort, before controlling for matric performance and the type of pass achieved� Since the reference group is black learners, the 1-year access results shown in the first column reveal that both white and Asian matriculants are about 26 percentage points more likely than black matriculants to gain access to a university (coloured learners are 4 percentage points more likely)�
The significant racial differences in university access are evident even when accounting for delayed access to university in the second column showing 6-year access to university� The pattern is much the same for throughput and retention, with whites 18 percentage points more likely than blacks to complete an undergraduate qualification within 6 years after enrolment and 14 percentage points less likely to drop out within five years�
Table 3�1: Regression: Undergraduate access, completion, conversion and dropout rates – no controls
1-year access
6-year access
6-year conversion
6-year completion
5-year dropout
Coloured 0�040*** 0�032*** 0�018*** 0�003 0�015***
Asian 0�263*** 0�267*** 0�168*** 0�086*** – 0�092***
White 0�256*** 0�308*** 0�227*** 0�181*** – 0�140***
N 560 921 560 921 560 921 72 537 72 537
Adjusted R 2 0�056 0�052 0�048 0�023 0�018
Source: Van Broekhuizen et al. (2015).

PSPPD: A SOCIETY DIVIDED40
Table 3�2 below controls for the type of pass achieved and the learner’s averagemark in the matric examination� The results underscore the importance of matric achievement in university access and oucomes at university once enrolled� In contrast to the previous table where whites are considerably more likely to access university in the year following matriculation, Table 3�2 reveals that once the type of pass and matric average is controlled for, white matriculants are actually 12�6 percentage points less likely than black learners to access university� Even 6 years after matric, whites are significantly less likely than blacks to access university, once matric performance is accounted for�
The fourth column in Table 3�2 shows racial differentials in completion within 6 years after matric, relative to the black population, the reference grouo in these regrssions� The results show that once the type of pass and average matric mark are taken into account, there are no significant differences in completion between black and white university students�
Table 3�2: Undergraduate access, completion, conversion and dropout rates – controlling for matric performance
1-year access
6-year access
6-year conversion
6-year completion
5-year dropout
Coloured – 0�032*** – 0�076*** – 0�036*** – 0�038*** 0�063***
Asian 0�001 – 0�074*** – 0�038*** – 0�066*** 0�059***
White – 0�126*** –0�182*** – 0�076*** – 0�005*** 0�043***
Bachelor pass 0�244*** 0�312*** 0�155*** 0�007*** – 0�068***
Matric average 0�0126*** 0�012*** 0�012*** 0�014*** – 0�012***
N 560 926 560 926 560 926 72 526 72 526
Adjusted R 2 0�379 0�443 0�294 0�095 0�109
Source: Van Broekhuizen et al. (2016).
From the results in Tables 3�1 and 3�2 it appears that racial differentials in favour of whites in terms of access to and success while at university are driven in large part by differences in performance in the matriculation examination� The findings here suggest strongly that interventions should focus on basic education to reduce racial differentials in university access and success�
3.5 Conclusion
Rising demand for education along with significant pro-poor shifts in education spending away
from previously white schools to previously black schools have produced a significant growth in
educational attainment, with substantial reductions in the attainment gap between black and white
people� However, despite almost universal access to education, the education system essentially still
generally produces only a relatively small group of learners equipped to pursue university education,
and a large group of mostly black, mostly poor learners with significant learning backlogs in the weaker
and poorer part of the school system� As chapter 3 will show, inequalities in education quality and the
resultant inability of many learners to access and complete university education, prevent many South
Africans from participating meaningfully in the labour market� Given the strong relationship between
White learners are
25.6 %points more likely to access university than black matriculants in the year after Matric.
However, once Matric examination performance is controlled for, white learners are
12.6 %points less likely to access university than black learners in the year after Matric.

41
unEqual cHancES: laBouR MaRKEt inEquality
present generation labour market success and next-generation access to good quality education, it
is likely that the South African economy will remain highly unequal for some time to come, unless
serious steps are taken to address learning gaps as early as possible in the formal education system�
4 UNEQUAL CHANCES: LABOUR MARKET INEQUALITY
Education is widely considered to be a key policy objective to promote social mobility� Development
economists have long held that the primary benefits of attaining more education are improved labour
market prospects in the forms of improved employment probabilities and higher earnings, through
education’s role in improving productivity� More education is also believed to bestow upon its beholder
non-pecuniary benefits such as health and enhanced ability to integrate into and function successfully
in mainstream society, both of which in turn are likely to improve both education and labour market
outcomes�
Educational attainment has historically enjoyed a strong, positive relationship with economic growth�
Barro (2001) and other researchers showed convincingly that increases in educational attainment
were significant contributors to economic growth between the 1960s and the 1990s� Findings that
education would increase labour productivity and growth provide justification for the rapid expansion
of education in many developing countries, including South Africa�
Yet, unemployment nevertheless remains largely intractable and returns to education are relatively
low for individuals with no tertiary qualification� The labour market is characterised by a growing
skills mismatch created by the combination of an increasing labour market demand for highly skilled
individuals, and an education system that is unable to meet that demand satisfactorily�
This chapter will demonstrate that beyond educational attainment, quality of education is an important
predictor of labour market outcomes� This then becomes a vital consideration in formulating policy
to promote social mobility� The chapter first considers the returns to educational attainment in the
form of wages and employment probabilities, followed by a discussion of whether social mobility for
black South Africans can be observed over time� Next a brief analysis is presented of how mobility
in terms of educational attainment has not produced the desired outcomes for many younger black
labour market participants� Finally, the importance of education quality in labour market outcomes is
discussed�
4.1 Labour market returns to educational attainment in South Africa
Human capital theory, in its simplest forms, holds that investments in human capital eventually
reward individuals with earnings higher than would be the case in the absence of such investments�
The early empirical work dedicated to these returns to investment in education typically followed
Mincer’s (1974) earnings function framework, with much of the research implicitly assuming that each
additional year of education increases earnings at a uniform rate for all individuals and all levels of

PSPPD: A SOCIETY DIVIDED42
schooling� That assumption was relaxed in later years as it became
clear that the education-earnings relationship was not a strictly
linear one� This realisation resulted in more flexibility in modelling,
with early work in this direction finding that lower levels of
education yielded higher returns to education than higher levels
of education (Psacharopolous, 1973, 1985; Psacharopolous and
Patrinos, 1994)� However, later research found evidence in favour
of a convex education-earnings relationship (where returns to
education are higher at higher levels of education)� This has been
particularly conclusive in middle-income developing countries,
where abundant supplies of unskilled and semi-skilled labour and
relative shortages of highly skilled labour exist (see for example
Siphambe, 2000; Keswell and Poswell, 2004)�
The South African labour market exhibits the expected strongly
convex relationship between education and earnings, offering
very high returns to persons with high levels of education, and
on the other hand, rewarding those individuals with low levels of
education with very low returns, with such returns only rising more
rapidly once a person reaches a level of matric or higher� Figure 4�1
shows the relationship between the hourly wage rate and years of
education for a representative South African in 2007� The graph has
a convex shape, i�e� it rises sharply at higher levels of education�
In 2007 the average wage per hour of someone who had achieved
a degree was R36, while it was only R12 for someone who had
achieved only a matriculation, if they were otherwise similar
individuals� Thus a degree was associated with a threefold increase
in income, a very high return indeed on investment in university
education� In contrast to that, someone with grade 9 earned only
R6 per hour, about half the earnings of the average matriculant�
From this it is apparent how greatly education contributes to the
gap between the wealthy and the less wealthy� This wage premium
for the highly educated in South Africa can be ascribed to the large
demand for highly qualified people, who are in short supply, while
the demand for relatively unskilled workers is limited, and there is
a surplus of such workers�
In 2007 the average wage per hour of someone who had achieved a degree was
R36, compared with R12 for someone with a matric and R6 for someone with
grade 9.

43
unEqual cHancES: laBouR MaRKEt inEquality
Figure 4�1: Log of hourly wage rate, by completed years of education (2007)
0.0
0.5
1.0
1.5
2.0
2.5
3.0
3.5
4.0
0 1 2 3 4 5 6 7 8 9 10 11 12 13 14 15
Education (years)
R6
R12
R36
Log o
f wag
e per
hour
(con
ditio
nal)
Source: Own calculations from the Labour Force Survey.
It can be expected that as the economy grows, there would be a further increase in the demand for
skilled labour, with the consequence that the wage premium may even increase – unless education
and schooling can keep up with the rapidly growing demand for highly skilled workers�
Just like for the monetary returns to education, there is a similar convexity when considering the
relationship between education and the probability of being employed� This probability hardly
increases for education levels between 0 and 10 years, but for those with a matric and particularly
those with more than a matric certificate, the probability of employment is much higher� Amongst
graduates, the probability of employment is in fact exceedingly high in an international perspective
(Van Broekhuizen and Van der Berg, 2015)�
Unequal educational attainment opportunities manifest in the labour market as a large unemployment
burden disproportionately borne by young people� School-leavers with poor skills and work-relevant
competencies enter a labour market that already fails to accommodate more than a quarter of the
existing labour force, and that is particularly unforgiving of jobseekers who have not completed
some form of post-secondary education� This is evidenced by Figure 4�2 which shows the narrow
unemployment rates between 2000 and 2015, by educational attainment category (Van Broekhuizen,
2016)�

PSPPD: A SOCIETY DIVIDED44
Figure 4�2: Narrow unemployment rates 2000 to 2015, by educational attainment category
0%
5%
10%
15%
20%
25%
30%
35%
0%
5%
10%
15%
20%
25%
30%
35%
2000
2001
2002
2003
2004
2005
2006
2007
2008
2009
2010
2011
2012
2013
2014
2015
Year
Narro
w Un
empl
oym
ent R
ate (
%)
Graduates Diplomates All working age
Source: Van Broekhuizen, 2016.
Another reason extended for poor labour market outcomes for non-graduates is the so-called ‘paradox
of progress’, a term used by Bourguignon and his co-authors (2005) to refer to a phenomenon often
encountered in developing countries, namely that as educational attainment levels increase, income
inequality may worsen� As more people reach higher levels of education, the gap between the educated
and the less educated may simply become more apparent, whereas that may not have been the case
when there was only a small sliver of the population with high levels of education�
Standard labour economics distinguishes a composition (endowment) effect (changes in the highest
grade attained) and a pay structure effect (changes in the returns to education) on earnings as time
passes� It is possible to decompose trends in wage inequality into these effects, which then also allows
an estimation of the strength of the paradox of progress�
Table 4�1 is based on the PALMS data series for the labour market� It shows that the Gini coefficient9
for wages rose from 54�4 to 59�7, i�e� by 5�2, in the period 1994-2000� Almost a third (1�5) of this increase
was simply the result of the rise in levels of education� This was calculated by determining what
change would have occurred if wage levels at each level of education had remained constant whilst
only the education expansion of that period had occurred� For the period 2001 to 2011, the Gini rose
by 2�3� If only educational attainment had risen, the Gini would nevertheless have risen by 0�9 only�
9 Although the Gini coefficient is usually expressed as a proportion, it has now become quite common to multiply that value by 100, so that a Gini coefficient of 0.60 would be referred to as a Gini coefficient of 60. As that is easier to interpret in tabular form, this convention is also followed here.

45
unEqual cHancES: laBouR MaRKEt inEquality
Table 4�1: Effect of change in educational distribution on wage inequality
Period Gini at beginning of period
Gini at end of period
Change in Gini
Change in Gini that would have occurred had education improved, but returns remained constant
1994 – 2000 54�4 59�7 5�2 1�50 (0�0005)***
2001 – 2011 58�6 60�9 2�3 0�90 (0�006)***
Standard error in brackets� Significance levels obtained using 200 bootstrap estimations�
Source: Shepherd & Van der Berg 2016., based on Palms 1994 – 2012.
These results indicate that the paradox of progress may be one of the factors behind increasing wage
inequality in South Africa, so that, given the structure of the labour market and education system, more
education currently still tends to worsen inequality� More importantly, though, the data indicates that
the returns to higher levels of education are still rising, and that contributes even more to worsening
inequality� This is in contrast to available international evidence (e�g� from Latin America) that suggests
that a fall in returns to education is a common factor in declining earnings inequality�
One of the primary causes of this paradox in the South African situation is that even though educational
attainment, i�e� levels of education achieved by the population, grew quite substantially even during
apartheid, the quality of such education was extremely weak, something which remains a problem
today� Figure 4�3 shows clearly how the returns to education profile is relatively flat between 1 and
7 years of completed education, followed by a slightly steeper gradient between 7 and 11 years, and
how it then rises sharply from 12 year of education onwards for the 1985 birth year cohort�
Figure 4�3: Returns to education by birth year cohort
0.00
0.50
1.00
1.50
2.00
2.50
Years of education
Retu
rns t
o edu
catio
n
0 1 2 3 4 5 6 7 8 9 10 11 12 13 14 15 16
1945 1950 1960 1970 1975 1985
Returns normalised to 0 for persons with no schooling. Wage regression estimated on pooled dataset (1994 – 2011) with log(wage) as dependent variable; time, age (quadratic) and birth cohort effects included as controls.
Source: Shepherd & Van der Berg 2016., based on Palms 1994 – 2012.

PSPPD: A SOCIETY DIVIDED46
Whilst other factors operated to reduce Latin American inequality substantially in the past two decades,
it is likely that high relative returns for the highly educated, in terms of employment probabilities
and wages once employed, will remain for some time to come in the South African economy that
produces jobs slowly in a fragile macroeconomic environment� Mismatches between skills demand
and supply create conditions for unfulfilled expectations (see also Box 4), which could contribute to
political instability�
BOX 4: Unfulfilled expectations: The gap between objective and subjective social mobilitySouth Africa has undergone massive educational expansion in the last half of the 20th century� Figure 4�4 shows that black individuals born in the 1990s have almost 8 years more education that those born in 1945, the reference year for the graph� Thus, objectively there has been social mobility in terms of educational attainment�
Figure 4�4: Average education attainment advantage of black individuals, by birth year compared to those born in 1945
–2
–1
0
1
2
3
4
5
6
7
8
9
Birthyear
1940 1960 1980 2000
Year
s of e
duca
tion
Average years of own education (relative to 1945 birth year cohort)
Source: Von Fintel & Von Fintel (2017).
The figure shows the average educational advantage in educational attainment of each birth cohort compared to those born in 1945� For example, on average black individuals born in 1960 attained about 2 years more of education that those born in 1945�
By all expectations, this growth in human capital should have stimulated social mobility and have bridged socioeconomic gaps across race groups� Yet despite the massive differences in their educational attainment and the removal of state-sanctioned job discrimination, younger generations of black South Africans do not perceive themselves as having moved up the socioeconomic ladder during their lifetimes any quicker than older generations have�

47
unEqual cHancES: laBouR MaRKEt inEquality
Two possible explanations for these trends:
1� Mobility and expectations are subjectively measured� Perceived mobility is therefore not necessarily linked to absolute increases in welfare across generations, but relative to another group against which progress is judged� It is therefore notable that while education expanded in absolute terms for younger generations, it did not always do so in relative terms� Figure 3�5 shows educational attainment differences between black individuals and their best educated parents�
Figure 4�5: Educational attainment differences between children and best-educated parent
0
1
2
–1,5
–2
–1
–0,5
0,5
1,5
2,5
3
1940Birth year
1960 1980
Year
s of E
duca
tion
Years of education more than parents
Source: Von Fintel & Von Fintel (2017).
Compared to their own parents, the generation born between 1960 and 1980 progressively received more education than their parents; while the post-1980 generation still attained more education than their parents, the extent of the “progress gap” declined, with children no longer out-pacing their parents by as much as earlier generations did�
Hence, relative mobility declined and individuals perceive to have achieved no more social mobility than previous generations�
2� Despite large-scale educational expansion among blacks, the probability of employment has remained static across generations� This finding is even more noteworthy when compared to whites, where one additional year of education relative to their parents increases the probability of them being employed by 1�7%, while for blacks an additional year of education relative to their parents increases their employment probability by 1%� This suggests that obstacles other than a lack of human capital prevent access to the labour market, such as a racially discriminatory labour market (Burger, Jafta & Von Fintel, 2016), employers that are increasingly concerned about education quality, and poor employment prospects for those labour market participants who do not have any form of tertiary education (Festus et al�, 2016)�

PSPPD: A SOCIETY DIVIDED48
4.2 The role of education quality in labour market outcomes
Although educational attainment among blacks has risen strongly
and rapidly narrowed the racial gap in educational attainment,
the equalising effect of this has been offset by rising returns to
matric and post-school education, so that inequality has remained
fairly constant (Branson et al�, 2012)� Most sectors of the South
African economy have become more skill-intensive, increasing the
demand for skilled labour�
The low quality of education in much of the school system is partly
to blame for the fact that the return to schooling below matric
remains low and that the rise in educational attainment has not
done much to decrease inequality or improve income mobility�
Burger and Jafta (2006) show that differing returns to education by
race, rather than racial discrimination, are increasingly responsible
for the racial earnings and employment gap, suggesting that
education quality has become a more prominent influence on
labour market outcomes�
A large part of the wage gap between blacks and whites can be
explained by differences in the quality of education they receive
(Burger and Van der Berg, 2011), which remains highly unequal�
While non-personnel spending is decidedly pro-poor, substantial
differences in teacher qualifications and experience favour rich
schools (Branson and Leibbrandt, 2013)�
If poor children receive a low quality education, they are more
likely to remain poor and socially immobile� However, because
of the high labour market returns to quality education and to
higher levels of education, for those poor children who manage
to access better quality schools, education can indeed promote
social mobility, acting as a route out of poverty� If the quality of
schools could be improved for poor children, this would be likely
to promote greater social mobility� Recent work by Burger and
Teal (2016), discussed in Box 5 shows that once education quality
is controlled for, the convex schooling-earnings profile becomes
significantly more linear, suggesting that education quality is an
important predictor of labour market earnings�
A large part of the
wage gap between blacks & whites can be explained by
differences in the quality of
education they receive

49
unEqual cHancES: laBouR MaRKEt inEquality
BOX 5: Convexity or Heterogeneity? Estimates of the shape of the earnings profileThe convex schooling-earnings profile observed in many African countries is generally interpreted as being reflective of labour markets where there is a low demand for workers with less than tertiary education and a high demand for tertiary graduates� The policy implications of a convex schooling-earnings function seem to be clear – in order to combat unemployment and wage inequality (and by extension, inequality in general), access to tertiary education must improve�
However, the conventional schoolings-earnings model does not account for heterogeneity in the costs and marginal benefits of schooling for different individuals� In a model first introduced by Becker (1964), individuals maximise their utility by choosing the amount of schooling that equalises the marginal costs and benefits of education� Individuals differ both in their opportunities to acquire education and their ability to transform educational attainment into earnings, resulting in heterogeneity in schooling and labour market outcomes�
Keeping in mind this possible heterogeneity in both the ability to attain education and the ability to transform that education attainment into productivity, Burger and Teal (2016) employ a control function (CF) approach to estimating the schooling-earnings function for black individuals aged 15 to 30� In Figure 4�6 the CF schooling-earning profile is compared to the results from the conventional OLS regression function� The CF profile suggests that the real South African schooling-earnings function is almost linear and slightly concave once ability differences are considered, suggesting that the convexity implied by conventional OLS approaches may be overestimated�
Figure 4�6: Schooling-earnings profile for black males, 15 to 30 (1995 to 2012)
0
0,5
1
1.5
2
2,5
3
3,5
Years of completed education
Log o
f hou
rly w
age r
ate
0 2 4 6 8 10 12 14 16
OLS CF
Source: Burger and Teal (2016).

PSPPD: A SOCIETY DIVIDED50
Figure 4�7 decomposes the CF schooling-earnings function into separate earnings profiles which proxy the returns to schooling in below average, average and above average schools� The results reveal the expected relationship between education quality and earnings� Individuals attending school in the low quality part of the education system have flatter earnings profiles than those attending average or higher quality schools� In other words, individuals who attend high quality schools are more likely to stay in school longer to take advantage of the increasing returns associated with attaining more education� However, those individuals attending low quality schools face an almost flat profile, suggesting that learners in this part of the education system who remain at school longer are likely to be disappointed with labour market outcomes relative to those who drop out earlier�
This heterogeneity in the schooling-earnings profile between low quality and high quality schools suggests a policy response that goes far beyond improving access to higher levels of education� A more appropriate response would be to address the causes of the heterogeneity in returns to education, particularly education quality�
Figure 4�7: CF estimates of school-earnings profiles, for various individual schooling error terms*
0
1
2
3
4
3 5 7 9 11 13 15
Below average Average Above average Expected outcomes
* Schooling error terms: 2 standard deviations below the mean (below average returns profile), mean (average returns profile), 2 standard deviations above the mean (high returns profile)
Source: Burger and Teal (2016).
4.3 ConclusionThis chapter has shown that educational attainment is an important predictor of employment probabilities and earnings in South Africa� However, the returns to educational attainment are low for labour market participants with Grade 11 or less for a number of reasons, that include the low signalling power of educational attainment that has not been externally assessed and a rapidly changing structure of the labour market that rewards highly educated individuals and limits the earnings capacity of less educated individuals�

51
ExEcutivE SuMMaRy
The earnings gap between races, often thought to be solely attributable to racial discrimination, can in
part be explained by differences in education quality� The education quality disadvantage so pervasive
in former black schools negatively affects labour market prospects not only for the current generation
but also make it much more likely that future generations will suffer the same fate because of school
choice being constrained by financial means�
Subjective perceptions that there has been little social mobility relative to previous generations
because of poor labour market prospects are likely to persist unless there is decisive action to address
the underlying causes of poor quality education in many schools� The consequences are likely to be
more political instability in a labour market environment that is increasingly critical of low education
levels and poor education quality�
5 Conclusion
This report has provided an empirical overview of the pivotal role that education plays in social
mobility, with particular emphasis on the labour market� Chapter 1 introduced the notion of a dualistic
education system that continues to serve an affluent minority well, despite massive public spending
shifts in favour of learners in poor schools� The persistent education quality differential is a defining
feature of the education system and compromises the prospect of sustainable, meaningful social
mobility for the majority of South Africans�
The evidence presented in Chapters 2 and 3 suggests that while educational attainment for the black
population has increased over time, education quality in most former black schools still lags far behind
that produced by former white schools� Thus, the majority of learners essentially follow a learning
trajectory that ultimately constrains opportunities of access to tertiary education and engenders poor
labour market outcomes, which in turn perpetuate a cycle of poverty and desperation�
The most important findings in this report are:
1� Education quality still poor – International and national standardised tests show that while educational attainment has converged dramatically over time between races, poor schools still lag far behind their affluent counterparts in learning outcomes�
2� Poor education quality for the poor – Initial socioeconomic status is strongly associated with learning outcomes� Children from affluent homes are more likely to reside in homes that are conducive to learning through parents who are able to support learning, and to attend well-performing schools� In contrast, learners from poor homes are less likely to have access to good learning opportunities, either formally through the education system or at home�
3� Large & early learning gaps – Substantial learning gaps between learners in different schools are observable as early as the middle primary school years or even before, making a strong case for decisive interventions as early as possible in children’s school careers�
4� Importance of post-matric education – Educational attainment is an important predictor of labour market outcomes, with years of education completed beyond Grade 12 offering extraordinarily high returns to educational investment, both in terms of employment probabilities and wages earned�

PSPPD: A SOCIETY DIVIDED52
5� Centrality of school quality – New empirical evidence suggests that education quality, often omitted from earnings functions, is also positively associated with future earnings� Therefore, learners who attend poor quality schools generally earn substantially less than those who attend good quality schools, even when they have the same education levels� The underlying causes of heterogeneity in education-earnings profiles therefore need urgent attention�
6� Unmet expectations – The consequences of unequal education opportunities are particularly dire for South Africa’s black youth, who despite having more education than previous generations and no longer facing discriminatory labour market legislation, have no better employment probabilities than older labour market participants� Thus, despite having achieved objective social mobility in terms of education, subjectively young black South Africans have not achieved as much as they would have liked to relative to older generations�
The continued dualism in the education system that produces distinctly different learning outcomes
has far-reaching consequences for social mobility� Poor quality education for the majority of learners
leads to poor labour market outcomes, which in turn beget poor quality education for the next
generation� The persistence of deep inequality two decades after apartheid is a powerful indictment of
the South African education system’s failure to overcome past injustices, despite considerable shifts
in government spending to poor schools�
In previous research for PSPPD, Resep has investigated the education system in more depth, with a
focus inter alia on the binding constraints to educational improvement� A central finding in this regard,
which is enhanced by the analysis in this report, is that early interventions are crucial, and that there
is a clear need for a focus on getting reading right in the first years of primary school� Readers are
referred to two of these studies for further analysis of policy recommendations: The reports on Binding Constraints in Education (Van der Berg et al�, 2016) and Laying Firm Foundations (Spaull et al�, 2016)�
This report has shown social mobility, and thus also poverty and income distribution, is closely
linked to the quality of education that South Africa society provides for its children� The imperative to
improve on this cannot be clearer, and requires wider debate, more experimentation and improved
implementation of policies in education to create a better future for the millions of children currently
caught in a cycle of poverty�

53
REfEREncES
6 References Almond, D� & Currie, J� 2010� Human capital
development before age five� In Handbook of Labor Economics, Vol� 4b� O� Ashenfelter & D� Card, eds� Amsterdam: Elsevier� 1315 – 1486�
Ardington, C� D� Lam, M� Leibbrandt & M� Welch� 2005� The sensitivity of estimates of post-apartheid changes in South African poverty and inequality to key data imputations� CSSR Working Paper No� 106� Cape Town: Southern Africa Labour and Development Research Unit, Centre for Social Science Research�
Barro, R� 2001� Human Capital and Growth� American Economic Review, 91 (2): 12 – 17�
Becker� G� 1964� Human Capital� New York: Columbia University Press�
Becker, G� S� & Tomes, N� 1986� Human capital and the rise and fall of families� Journal of Labor Economics, 4(3): S1–S39�
Behrman, J� R�, Birdsall, N� and Szekely, M� 1998� Intergenerational schooling mobility and macro conditions and schooling policies in Latin America� IADB Working Paper No� 386� Washington, D�C�: Inter-American Development Bank�
Blanden, J� 2009� How much can we learn from international comparisons of intergenerational mobility? Centre for the Economics of Education DP 111� London: London School of Economics�
Branson, N�, Garlick, J�, Lam, D�, Leibbrandt, M� (2012)� Education and Inequality: The South African Case. A Southern Africa Labour and Development Research Unit Working Paper Number 75� Cape Town: SALDRU, University of Cape Town�
Branson, N� and Leibbrandt, M� 2013� Education and Labour Market Outcomes in South Africa. OECD Economics Department Working Papers, No� 1021� Paris: Organisation for Economic Co-operation and Development Publishing�
Burger, J� and Van der Berg, S� 2011� Modelling cognitive skills, ability and school quality to explain labour market earnings� Stellenbosch Economics Department Working Paper 08/2011� Stellenbosch: Stellenbosch University�
Burger, J� & Zoch, A� 2016� Modeling School Progression and Labour Market Outcomes. Unpublished paper presented at ReSEP workshop, 21 November 2016�
Burger, R� & von Fintel, D�, 2014� Rising unemployment in a growing economy: a business cycle, generational and life cycle perspective of post-transition South Africa’s labour market� Studies in Economics and Econometrics, 38(1)�
Burger, R� and Teal, F� 2016� Convexity or Heterogeneity? Estimates of the Shape of the Earnings Profile� Unpublished paper presented at ReSEP workshop, 21 November 2016
Burger, R�, Jafta, R� and von Fintel, D� 2016� Affirmative action policies and the evolution of post-apartheid South Africa’s racial wage gap� UNU-WIDER Working Paper wp2016-066� Helsinki: World Institute for Development Economic Research (UNU-WIDER)�
Case, A and Yogo, M� 1999� Does School Quality Matter? Returns to Education and the characteristics of schools in South Africa� Working Paper 7399� Massachusetts: National Bureau of Economic Research�
Chevalier, A�, Denny, K� & McMahon, D� 2009� Intergenerational mobility and education equality� In Education and Inequality across Europe. P� Dolton, R� Asplund & E� Barth, eds� Edward Elgar� 1–22�
Coetzee, M� 2014� School quality and the performance of disadvantaged learners in South Africa. Stellenbosch University Economics Department Working Paper 22/14� Stellenbosch: Stellenbosch University�

PSPPD: A SOCIETY DIVIDED54
Cunha, F� & Heckman, J� 2007� The technology of skill formation� AEA Papers and Proceedings, 97(2): 31 – 47�
DataFirst� 2016� South Africa – Post Apartheid Labour Market Series 1993-2015� (PALMS series�) ID zaf-datafirst-palms-1993-2015-v3�1� DataFirst: University of Cape Town�
Easterly, W� 2001� The Lost Decades: Explaining Developing Countries’ Stagnation in Spite of Policy Reform 1980-1998, Journal of Economic Growth, 6 (2): 135 – 157�
Festus, L� Kasongo, A�, Moses, M� & Yu, D� 2016� The South African labour market, 1995–2015� Development Southern Africa, 33 (5): 579 – 599�
Fleisch, B� 2008: Primary Education in Crisis: Why South African schoolchildren underachieve in reading and mathematics� Juta: Cape Town�
Cilliers, Jeanne & Fourie, Johan� 2017� Social mobility during South Africa’s industrial take-off� Stellenbosch Economics Department Working Paper� Stellenbosch: Stellenbosch University�
Gustafsson, M� 2016� Understanding trends in high-level achievement in Grade 12 mathematics and physical science. Pretoria: Department of Education�
Gustafsson, M� & F�Patel� 2006� Undoing the apartheid legacy: Pro-poor spending shifts in the South African public school system� Perspectives in Education 24(2): 65 – 77
Hanushek, E� 2003� The failure of input-based schooling policies� The FwpEconomic Journal 113(485): F64 – F98�
Hofmeyr, H� 2017� Home background and educational outcomes: An analysis using NIDS. Stellenbosch Economics Department Working Paper� Stellenbosch: Stellenbosch University�
Howie, S�, Hughes, C�, 1998� Mathematics and science literacy of final-year school students in South Africa: a report of South African students in the Third International Mathematics and Science Study (TIMSS)� Human Sciences Research Council, Pretoria�
Ichino, A�, Karabarbounis, L� & Moretti, E� 2011� The political economy of intergenerational income mobility� Economic Inquiry, 49(1): 47 – 69�
International Labour Office� 2016� World Employment and Social Outlook Trends 2016. International Labour Office� Geneva: International Labour Office�
Keswell, M�, & Poswell, L� 2004� Returns to education in South Africa: A retrospective sensitivity analysis of the available evidence� The South African Journal of Economics, 72(4): 834 – 860�
Kotzé, J� 2017� Analysing schools performing above expectations using three constructed datasets. Stellenbosch Economics Department Working Paper� Stellenbosch: Stellenbosch University�
Lam, D� 1999� Generating extreme inequality: Schooling, earnings, and intergenerational transmission of human capital in South Africa and Brazil� Report No� 99-439� Ann Arbor, MI: Population Studies Center, University of Michigan�
Louw, M�, Van der Berg, S� & Yu, D� 2007� Convergence of a kind: Educational attainment and intergenerational social mobility in South Africa� South African Journal of Economics, 75(3): 548–571�
Mankiw, G�, Romer, D� & Weil, D� 1992� A contribution to the empirics of economic growth� Quarterly Journal of Economics, 107 (2): 407 – 437�
Mayer, S� E� & Lopoo, L� M� 2008� Government spending and intergenerational mobility� Journal of Public Economics, 92: 139 – 158�
Mincer, J� 1974� Schooling, Experience and Earnings. New York: National Bureau of Economic Research�
Moll, P� G� 1998� Primary schooling, cognitive skills and wages in South Africa� Economica, 65(258): 263 – 284�
Moses, E� 2017� Determinants of Internal Migration in South Africa: Evidence from Census 2011. Stellenbosch Economics Department Working Paper� Stellenbosch: Stellenbosch University�

55
REfEREncES
Mullis, I�, Martin, M�O�, Foy, P�, Arora, A�, 2012� TIMSS 2011 International Results in Mathematics� TIMSS & PIRLS International Study Center and IEA, Chestnut Hill, USA�
Mullis, I�, Martin, M�O�, Foy, P�, Hooper, M�, 2016� TIMSS 2015 International Results in Mathematics� TIMSS & PIRLS International Study Center and IEA, Chestnut Hill, USA�
Psacharopoulos, G� 1973� Returns to Education: An International Comparison� Amsterdam: Elsevier�
Psacharopoulos, G� 1985� Returns to Education: A Further International Update and Implications� Journal of Human Resources, 20(4): 583 – 604�
Psacharopoulos, G� 1994� Returns to investment in education: A global update� World Development, 22(9), 1325 – 1343�
Reddy, V�, 2006� Mathematics and Science Achievement in South African Schools in TIMSS 2003� Human Sciences Research Council, Cape Town�
Reddy, V�, Visser, M�, Winnaar, L�, Arends, F�, Juan, A and Prinsloo, C�H� (2016)� TIMSS 2015: Highlights of Mathematics and Science Achievement of Grade 9 South African Learners. Human Sciences Research Council�
Shepherd, D� 2016� What is the limit? Performance ceilings at secondary school and their relation to socioeconomic status. Unpublished paper presented at ReSEP workshop, 21 November 2016� Stellenbosch�
Shepherd, D� & S� van der Berg� 2016� Education and wage inequality: Prospects for income redistribution. Unpublished paper submitted to REDI project on Inclusive Growth� University of Stellenbosch�
Siphambe, H� K� 2000� Rates of return to education in Botswana� Economics of Education Review, 19(3): 291 – 300�
Solon, G� 2004� A model of intergenerational mobility variation over time and place� In Generational income mobility in North America and Europe� M� Corak, ed� Cambridge University Press: Cambridge� 38 – 47�
Spaull, N� 2013� South Africa’s Education Crisis: The quality of education in South Africa 1994 –
2011. Report commissioned for the Centre for Development and Enterprise� Johannesburg: Centre for Development and Enterprise�
Spaull, N� & Kotzé, J� 2015� Starting behind and staying behind in South Africa: The case of insurmountable learning deficits in mathematics� International Journal of Educational Development, 41:13 – 24�
Spaull, N�, S� van der Berg, G� Wills, M� Gustafsson & J� Kotzé� 2016� Laying firm foundations: Getting reading right. A study financed by the Zenex Foundation� Stellenbosch�
Statistics South Africa� 2016� Mid-year population estimates. Pretoria: Statistics South Africa�
Taylor, S� 2011� Uncovering indicators of effective school management in South Africa using the National School Effectiveness Study� Stellenbosch Economics Department Working Paper 10/11� Stellenbosch: Stellenbosch University�
Taylor, S� & Yu, D� 2009� The importance of socio-economic status in determining educational achievement in South Africa� Stellenbosch Economic Working Paper 01/09� Stellenbosch: Stellenbosch University�
Timaeus, I�, Simelane, S� & Letsoalo, T� 2013� Poverty, race, and children’s progress at school in South Africa� The Journal of Development Studies, 49(2):270 – 284�
Van Broekhuizen, H� 2016� Graduate unemployment and Higher Education Institutions in South Africa� Stellenbosch University Economics Department Working Paper 08/16� Stellenbosch: Stellenbosch University�
Van Broekhuizen, H� and Van der Berg, S� 2012� Graduate unemployment in South Africa: A much exaggerated problem. Stellenbosch Economics Department Working Paper 22/2012� Stellenbosch: Stellenbosch University�
Van Broekhuizen, H�, Van der Berg, S� & Hofmeyr, H� 2016� Higher education access and outcomes for the 2008 national matric cohort. Stellenbosch University Economics Department Working Papers: 16/16� Stellenbosch: Stellenbosch University�

PSPPD: A SOCIETY DIVIDED56
Van der Berg, S� 2007� Apartheid’s enduring legacy: Inequalities in education� Journal of African Economies, 16(5):849 – 880�
Van der Berg, S� 2008� How effective are poor schools? Poverty and educational outcomes in South Africa� Studies in Educational Evaluation, 34:145 – 154�
Van der Berg, S� 2010� Current poverty and Income distribution in the context of South African history. Stellenbosch Economics Department Working Paper 22/10� Stellenbosch: Stellenbosch University�
Van der Berg, S� & Moses, E� 2012� How better targeting of social spending affects social delivery in South Africa� Development Southern Africa, 28 (1): 127 – 139�
Van der Berg, Servaas, Megan Louw & Derek Yu� 2008� Post-transition poverty trends based on an alternative data source� South African Journal of Economics, 76: 58 – 76�
Van der Berg, S� 2015� What the Annual National Assessments can tell us about learning deficits over the education system and the school career� South African Journal of Childhood Education, 5(2): 28 – 43�
Van der Berg, S� Girdwood, E�, Shepherd, D� Van Wyk, C�, Kruger, J�, Viljoen, J�, Ezeobi, O� and Ntaka, P� 2013� The Impact of the Introduction of Grade R on Learning Outcomes. Unpublished report� Accessed on the 15th January 2017 at http://resep�sun�ac�za/wp-content/uploads/2014/06/Grade-R-Evaluation-1-3-25-Final-Unpublished-Report-13-06-17�pdf�
Van der Berg, S�, N� Spaull, G� Wills, M� Gustafsson & J�Kotzé� 2016� IdentIfyIng binding constraints in education. A study financed by PSPPD (Project to Support Pro-Poor Policy Development)� Stellenbosch�
Visagie, J� 2015� Growth of the middle class: Two perspectives that matter for policy� Development Southern Africa, 32 (1): 3 – 24�
Von Fintel, D� and Von Fintel, M� 2017� Educational expansion, unfulfilled expectations and perceived lifetime social mobility in South Africa� Stellenbosch Economics Department Working Paper� Stellenbosch: Stellenbosch University�
World Bank, 2012� South Africa Economic Update: Focus on Inequality of Opportunity� Washington DC: World Bank�
Yu, Derek� 2009� The comparability of Census 1996, Census 2001 and Community Survey 2007� Working Papers 21/09� Stellenbosch University, Department of Economics
Zoch� A� 2013� Life chances and class: Estimating inequality of opportunity in South Africa for various life stages� Stellenbosch Economics Department Working Paper 08/13� Stellenbosch: Stellenbosch University�

EnquiriesResearch on Socio-Economic Policy (ReSEP)Department of EconomicsMatieland, 7602See more at: http://resep.sun.ac.za/