Embed Size (px)
Citation preview
A Sky Dome Visualisation for Identification of Astronomical Orientations
Georg Zotti∗ Meister Eduard Groller†
Institute of Computer Graphics and Algorithms, Vienna University of Technology
Figure 1: Virtual reconstruction of a look through one of the doors in the neolithic Kreisgrabenanlage of Steinabrunn in Lower Austria. Thesingular post appears to be aligned to the rising point of the Pleiades star cluster, which with their rising in the morning possibly announced thebeginning of the agricultural year. Astronomical alignments like this have been identified using the method described in this paper. Screenshotfrom StarryNight Pro 4.5, foreground from virtual reconstruction courtesy of Imagination Computer Services, Vienna.
ABSTRACT
It has long been known that ancient temples were frequently ori-ented along the cardinal directions or to certain points along thehorizon where Sun or Moon rise or set on special days of the year.In the last decades, archaeologists have found evidence of evenolder building structures buried in the soil, with doorways that alsoappear to have distinct orientations.
This paper presents a novel diagram combining archaeologicalmaps with a folded-apart, flattened view of the whole sky, showingthe local horizon and the daily paths of sun, moon and brighterstars. By use of this diagram, interesting groupings of astronomicalorientation directions, e.g. to certain sunrise and sunset points couldbe identified, which were evidently used to mark certain days of theyear. Orientations to a few significant stars very likely indicated thebeginning of the agricultural year in the middle neolithic period.
CR Categories: I.3.8 [Computer Graphics]: Applications; J.2[Physical Sciences and Engineering]: Archaeology; J.2 [PhysicalSciences and Engineering]: Astronomy
Keywords: Archaeology, Astronomy, data mining
∗e-mail: [email protected]†e-mail: [email protected]
1 INTRODUCTION
A large body of evidence shows the connection of ancient culturesto annually repeating celestial events. In many old cultures, templeaxes are typically aligned either along cardinal directions (with thepyramides in Egypt as most popular kand best studied example) ortowards solstice risings and settings of the sun, e.g. Persepolis [9].Another frequently cited example is Stonehenge and many othermegalithic sites, which were presumably overinterpreted by vari-ous authors, most notably Thom [10], but are largely accepted assun- and moon-oriented temples [5]. Also medieval churches werefrequently oriented towards the rising point of the Sun on the dayof the church’s patron [4].
Apparently the orientation of buildings has a much older tradi-tion. Since the 1960s, aerial photography, later combined with geo-magnetic prospection with highly sensitive caesium magnetometersand, where possible, successive excavations, discovered a certainclass of neolithic circular enclosures: Kreisgrabenanlagen (KGA).They typically consisted of 1–3 nearly circular wooden palisadewalls, surrounded by 1–3 ditches, which were V-shaped and up to6m deep and 12m wide. The circular ditches were broken by “earthbridges”, which allowed people to enter the enclosure through gaps(“doors”) in the palisades. The overall diameter of these Kreis-grabenanlagen is approximately 40–180m. The best archaeologicalsurvey results, short of the slow and very costly direct excavation,come from measuring the minute deviations of the Earth’s naturalmagnetic field caused by the different qualities of soil which today

Figure 2: Archaeological map of the Kreisgrabenanlage (KGA)Steinabrunn in Lower Austria [3]. The wide brown rings indicatethe circular ditches which are connected by narrower radial ditchesalong 4 access bridges. In the central area, traces of 3 concentricpalisade walls are marked in a lighter shade of brown. Small browndots indicate singular postholes, the green area marks a central pit. Amultitude of similar KGA traces has been found in the last decades,among the many theories about their use exists the idea of astro-nomically oriented doorways.
fill the ditches. According to 14C dating of excavated bone mate-rial, all KGAs have been erected in the very short time span between4800 and 4500 B.C. These structures have been found over a largepart of central Europe, from Hungary to northern Germany, with aconcentration of over 40 such structures known in Lower Austria(e.g., Figure 2).
Since the 1980s, with increasing numbers of known KGAs, the-ories about their use have been discussed and rejected, spanningfrom cattle paddocks to fortifications. The current interpretation istheir use as a place for special gatherings, cultic worship, or initia-tions. But, in parallel to the much younger megalithic constructionsof Great Britain and Brittany [11], also some astronomical align-ments have been proposed, most notably by Becker [1], who foundthat Kreisgrabenanlagen of Bavaria had doors and bridges alignedto rising points of the Sun at solstices.
During the preparation of the first large public exhibition onKreisgrabenanlagen, also the theory of astronomical connectionshas been investigated. This paper describes what has to be takeninto account for these orientation studies. Not only possible Sun-related directions have been studied, but also Moon- and star-related directions. A key element on the way to an interesting dis-covery has been a diagram combining the archaeological map witha celestial map, which allows to immediately see possible align-ments.
The rest of the paper is as follows: first, important terms fromastronomical phenomenology are defined, and necessary astronom-ical computations are pointed out. Then, a methodology is devel-oped which shows how to apply various diagrams to questions re-lated to astronomical orientations. Kreisgrabenanlagen are usedas example, but the same idea can be applied to any building orgeological structure for which an oriented map exists. Then a com-bined result from a multitude of KGAs is shown, which allow thepostulation of an archeoastronomical theory.
2 CELESTIAL POSITIONS
To compute the position of a celestial object, we need
• the geographical position (λ ,ϕ) of the observer, where thegeographical longitude λ is positive for longitudes east ofGreenwich and latitude ϕ is positive on the northern hemi-sphere,
• the object’s celestial coordinates (α ,δ ) on the imaginaryinfinite celestial sphere, with the longitudinal coordinate αnamed right ascension and counted in hours instead of de-grees, eastward from the First Point of Aries à. This pointmarks the one intersection of the celestial equator with theSun’s annual path, the ecliptic, where the Sun crosses the ce-lestial equator northward, this event defining the beginning ofastronomical spring in the northern hemisphere. δ is calleddeclination and is positive for objects north of the celestialequator.
• the time of observation. Here we have to take care not to usejust zone time (maybe even further denaturalized by daylightsaving rules), but local mean solar time.
From these data, we can compute an object’s azimuth A, i.e., its hor-izontal direction, counted from north (0◦) eastward (or, following adifferent, equally valid convention, from south westward), and al-titude a. Details of the computation of positions can be found ingeneral astronomical literature, e.g. [6].
On any day of the year, stars rise and set approximately 4 minutesearlier than on the day before. Stars surrounding the celestial poleof the observer’s hemisphere are visible in every clear night andcalled circumpolar. Others are only visible in parts of the year, theSun being too close to them to be observable at other times. The lasttime such a star is visible at dusk is called its heliacal setting. Aftera few weeks of invisibility due to close distance to the Sun, theyemerge in the morning on the day of their heliacal rising: in themorning twilight, they appear shortly over the horizon haze, onlyto become too washed out a few moments later by the increasingbrightness of the emerging daylight. On each successive day, theywill be visible about four minutes longer. It has long been knownthat heliacal risings have been used by various peoples all over theworld to mark specific days in the year [5], the best known examplebeing the Egypian use of the heliacal rising of Sirius as “herald” ofthe Nile flood.
The rising and setting azimuths on a location’s horizon dependon its geographical latitude ϕ , the star’s declination δ and the localhorizon’s altitude. On the northern hemisphere, any elevation onthe horizon will shift both rising and setting points southward.
In addition, for investigation of rising and setting alignmentsalong the horizon, two phenomena caused by Earth’s atmospherehave to be taken into consideration:
• refraction, causing a slight increase of altitude for objectsclose to the horizon. Refraction causes the Sun and Moonto appear vertically compressed when they are on the horizon,and raise both these objects by about 1/2 degree on the hori-zon, thus causing also a slight northward shift in both risingand setting points.
This shift also applies to stars, but only the very brightest starsare visible in so low altitudes, because of the
• extinction, which reduces the objects’ brightnesses, frequentlymaking dimmer stars invisible. A star’s brightness is givenon a logarithmic magnitude scale, the brightest stars hav-ing slightly negative numbers. The dimmest stars observablewithout optical aid under best conditions are about mag6.5,but only close to the zenith. In low altitudes, esp. close to the

Name Constellation mag aE
Arcturus Bootes -0.1 0◦
Vega Lyra 0.0 0◦
Capella Auriga 0.1 0◦
Procyon Canis Minor 0.4 0.3◦
Altair Aquila 0.8 0.7◦
Antares Scorpius 0.9 0.9◦
Pollux Gemini 1.2 1.2◦
Deneb Cygnus 1.3 1.3◦
Table 1: Extinction angles aE for a few stars[7, p.130].
horizon, the atmosphere absorbs much of the starlight. Onlythe brightest stars are visible on the horizon, most stars willnot be visible below a certain altitude, their respective extinc-tion angle aE . Table 1 shows extinction angles for best condi-tions. Depending on humidity and dust, aE can be larger.
For Sun and Moon, one more aspect must be guessed: whether thealignment intended to mean the point of first resp. last visibility(i.e., upper limb), disk center or full visibility (lower limb).
2.1 Sun
Mirroring Earth’s motion around it, the Sun annually describes agreat circle on the celestial sphere, which due to Earth’s tilted axisintersects the celestial equator on the First Points of Aries à andLibra æ. The moments the sun is at these points define the be-ginnings of astronomical spring and autumn, respectively, in thenorthern hemisphere. The Sun can reach northern and southern de-clinations equal to the Earth’s axis tilt from orbit normal, which iscurrently about ε = 23.5◦, but slowly and slightly varies over mill-ennia. Reflecting this, the annual points of sunrise and sunset spana wide arc along eastern and western horizons. Near the solstices(“standstills”), the sun rises or sets on almost the same positions forseveral days.
It is known from older cultures [5] that some peoples defined theseasons not beginning with solstices and equinoxes, but centeringthe seasons around these dates, leading to terms like “midsummer”for summer solstice. Traces of this tradition survive in today’s AllSaints’ Day/Halloween and Candlemas as begin and end of Winter,and May Day as begin of Summer.
2.2 Moon
Similar to the Sun, the Moon can reach a wide area of declinations.Due to its orbit being tilted about i = 5◦ from Earth’s orbit, its ex-treme north and south declinations vary even wider, with outer ex-tremes (“major standstills”, δ = ε + i) and inner extremes (“minorstandstills”, δ = ε − i) [11]. Due to orbital motions, these extremestandstills occur in intervals of about 18.6 years [6].
2.3 Stars
Although called fixed stars, over the course of centuries and mill-ennia, stars do change their position on the celestial sphere mostlydue to
• their proper motion in space, which due to their enormousdistance from the Solar system is hardly noticeable even afterseveral thousand years, with only a handful bright exceptions,and
• precession, a motion of Earth’s axis counteracting the tug ofMoon and Sun on Earth’s equatorial bulge, which both at-tempt to erect Earth’s rotational axis. Acting like a spinning
Figure 3: Typical all-sky map. When looking up from the Earth,cardinal directions appear mirrored compared to a geographical map.The red arc is part of the annual solar path, the ecliptic. The circle atupper right aligns mean solar time and calendar date to show whenthis map is applicable each day. The setting is for a situation inthe year 4701 B.C. (astronomical -4700), described later in the text(Section 4).
top, Earth evades this erection by moving its axis sideways.This results in a motion where the Earth’s axis over about25800 years traces a double cone with the tip in the Earth’scenter. Reflecting this motion, the stars seem to move parallelto the ecliptic (the red line in figure 3), slowly changing theircoordinates on the celestial sphere. For this reason, the starwe now know as Pole Star will be far from the pole in just afew centuries, rendering it unusable for navigational purposes.The neolithic sky was shifted by about 90◦ from today’s sky.
Meeus [6] describes algorithms to correct stellar catalog positionsgiven for one epoch to another.
If a structure’s date cannot be determined to at least few hundredyears, searching for alignments with stars is useless, because almostevery azimuth will be covered by some bright star at some point intime. Here, only solar and lunar alignments can be investigated.
Fortunately, the epoch where Kreisgrabenanlagen were in use isknown and is even short enough to use a single mean date for allsites without too great errors. The effect of precession on declina-tion δ (and thus, combined with latitude ϕ , on rising and settingpoints) will be strongest where the ecliptic crosses the equator. Inthe latitude of ϕ = 48.5◦, during the 300 year period, the azimuthshift amounts to about 1.7◦. Lines inside the KGAs cannot be givento sub-degree accuracy, because the exact positions of, e.g., posttops above the surface is lost and can only be estimated from posthole positions.
3 MAPPING THE SKY DOME
For archeo-astronomical research, a method has to be found to com-bine archeological data, e.g., an excavation map, with astronomicaldata, i.e., positional data of celestial objects. Research typically
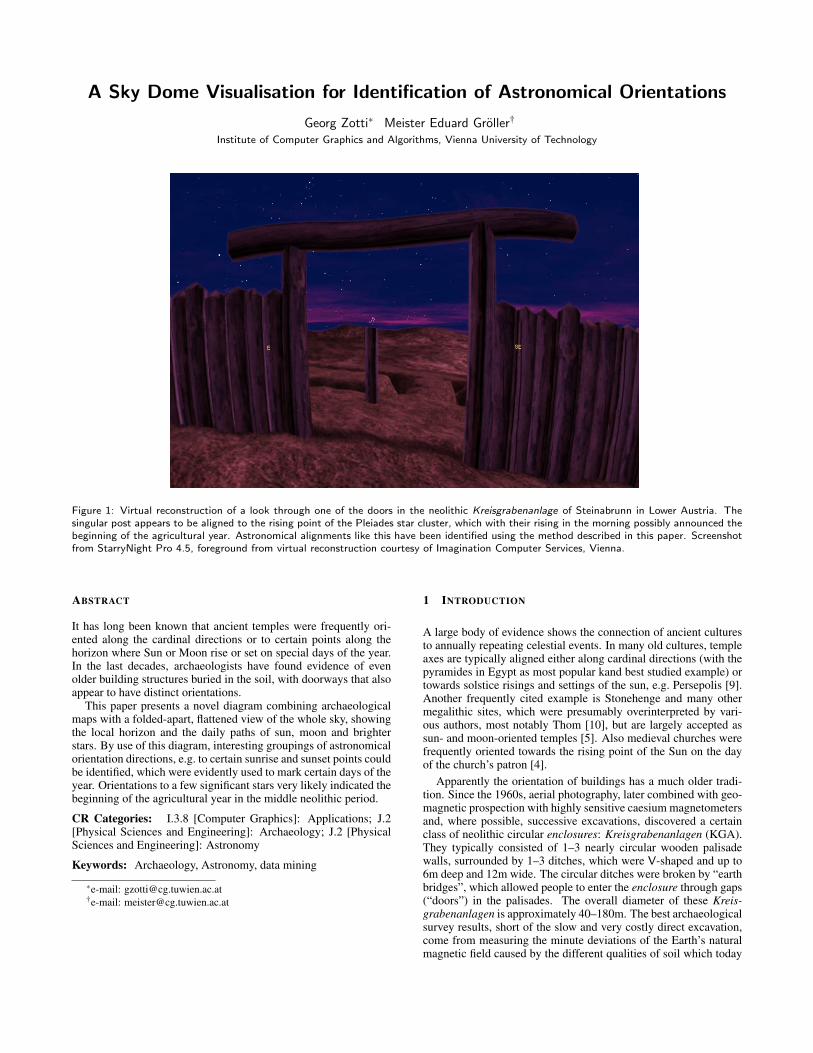
Figure 4: Map showing daily paths of brighter stars over the sky, to-gether with the Sun’s path on 8 specific dates of the year (red) andextreme paths of the Moon (green). The viewer is looking downwardfrom the outside of the apparent sky dome, so the cardinal directionsare aligned like on an ordinary geographical map. The paths changeover centuries due to precession and (much less) stellar proper mo-tion. Rising and setting directions can be read off at the horizonline (blue). Like in figure 3, the map is centered around the zenith(orange dot).
concentrates on alignments of artificial structures towards risingand setting points of Sun, Moon and selected bright stars.
Earlier studies frequently just pointed out orientations towardsthese directions on a map, assuming a flat horizon, because sur-veyed horizon data was rarely available and data for zero altitudeare easy to compute. However, horizon profiles nowadays can beacquired from a Geographical Information System (GIS), so a dia-gram combining the archeological structure, sky dome and horizonhad to be created.
3.1 All-Sky Map
A common way to show an all-sky star map, sometimes found innewspaper columns, consists of a fisheye-like round star map eitherin stereographic projection or with linearly mapped zenith distance(Figure 3). In the linear mapping, a point with azimuth A and el-evation h > 0 on the hemisphere is mapped to a point with radiusr = 90◦− h and angle θ = A, counted counterclockwise from top.The zenith in the center shows stars immediately overhead at a cer-tain time, whereas the stars close to the outer border are low on thehorizon.
This mapping nicely shows an instantaneous view of the sky, butis almost totally useless for investigations of points on the horizonwhere the Sun or stars rise or set.
3.2 Star Path Map
Our interest while investigating astronomical alignments does atfirst not involve an instantaneous view, but a representation of allpossible positions a star can reach for a certain geographical lo-cation. This leads to a map showing the daily paths of the stars
Figure 5: A mapping similar to Fig. 4 showing only the Sun’s annualsky coverage used in a 3D scene, viewed from south-west. Mappedon an infinite sphere, a virtual walkthrough of an archaeological sitewill show possible alignments.
(Figure 4). In this figure, we exchanged east and west to providea mapping which represents a view from “outside” the local skydome, so east and west are oriented like on an ordinary geograph-ical map, and θ = A, but counted clockwise from top. This mapallows to read the rising and setting points of celestial objects onthe outer border, and also the altitudes and combined azimuths anobject can reach.
3.2.1 Application for a 3D Scene
The map of figure 4 is perfectly usable as texture on a large (in-finite, if possible) hemisphere for a virtual reconstruction inside a3D modeling or VR application (Figure 5). During a virtual walk-through, astronomical alignments can be identified. However, 3Dreconstructions of archaeological sites including their surroundinglandscapes require lots of effort, so a simpler way had to be found.
3.3 Flipped Star Path Map
Our aim was to find a mapping in which the orientation lines(ditches, palisade gaps) can be combined with points on the hori-zon which in nature lie outward of the structure. To achieve this,we must leave the traditional mapping of the hemisphere to the cir-cle with the zenith in the center. Instead, we flip the mapping byripping the sky dome open at the zenith and “folding” the sky out-ward. This creates a map with an opening in the center, where weleave room for other data, and the whole sky flattened outward,with the point of the zenith mapped to the outermost circle. So,θ = A, counted clockwise from north like on a geographical map,but r = r0 + h, where r0 is the radius of the inner area. The starpaths appear largely unnatural at first but are still readable. Risingand setting points can be read again on the horizon, which is nowthe inner circle (Figure 6).
The red arcs in Figures 4 and 6 represent the Sun’s paths atthe dates of solstices (northern-/southernmost), equinoxes (east towest) and dates lying between these dates. Dashed green lines rep-resent the standstill lines of the Moon. Star paths are marked inblack arcs with various dot patterns according to the brightness ofthe respective star. The maps show star paths of the year 4701 B.C.(the astronomical year −4700).
This mapping now provides an inner area, which we used for twodistinct purposes: Investigations of singular KGAs and an interpre-tation of a histogram of all identified directions.
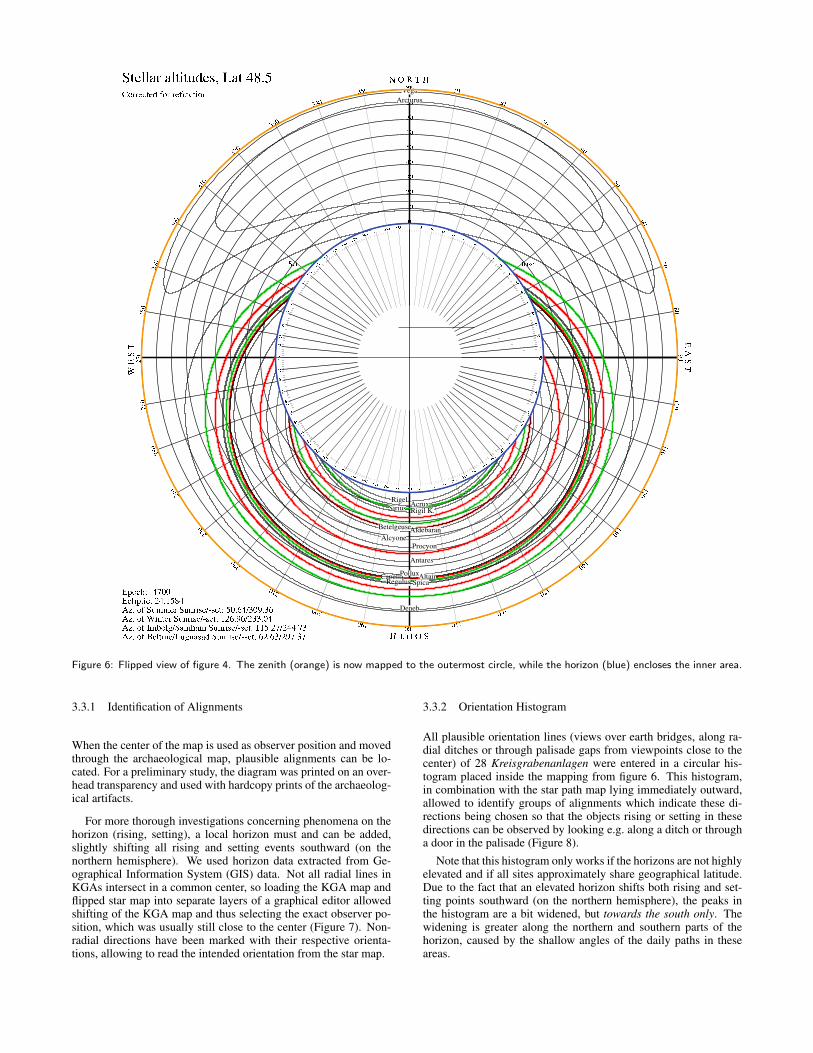
Figure 6: Flipped view of figure 4. The zenith (orange) is now mapped to the outermost circle, while the horizon (blue) encloses the inner area.
3.3.1 Identification of Alignments
When the center of the map is used as observer position and movedthrough the archaeological map, plausible alignments can be lo-cated. For a preliminary study, the diagram was printed on an over-head transparency and used with hardcopy prints of the archaeolog-ical artifacts.
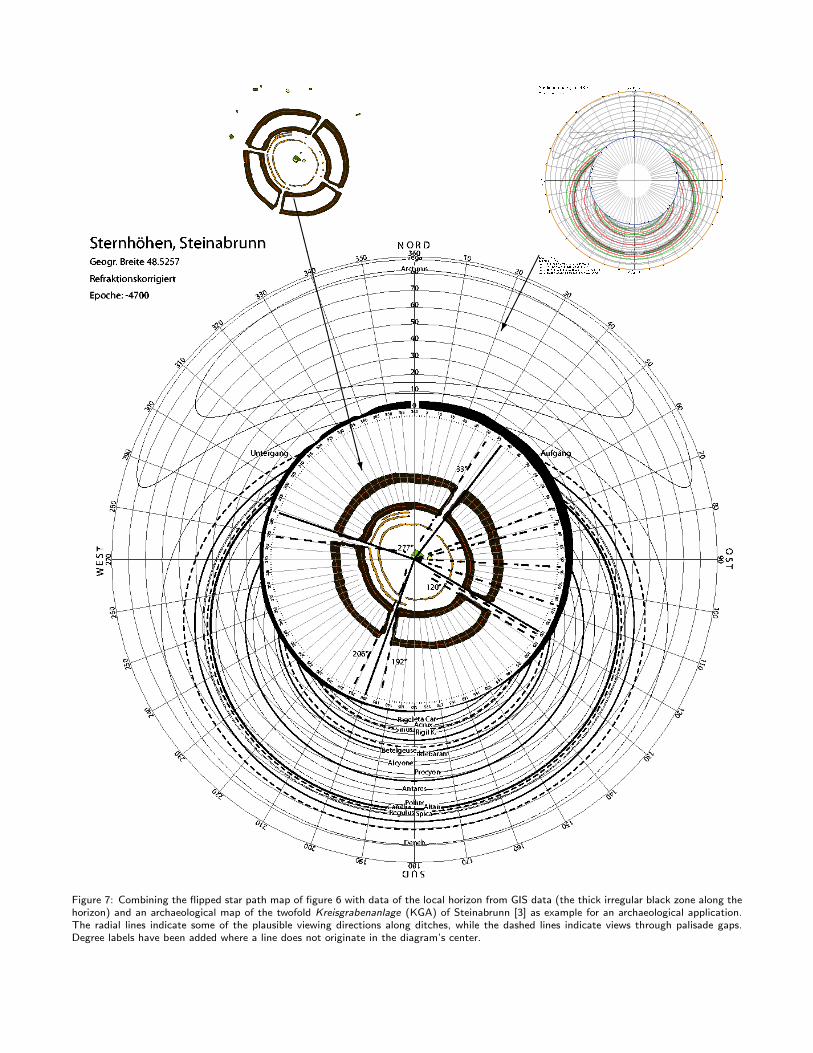
For more thorough investigations concerning phenomena on thehorizon (rising, setting), a local horizon must and can be added,slightly shifting all rising and setting events southward (on thenorthern hemisphere). We used horizon data extracted from Ge-ographical Information System (GIS) data. Not all radial lines inKGAs intersect in a common center, so loading the KGA map andflipped star map into separate layers of a graphical editor allowedshifting of the KGA map and thus selecting the exact observer po-sition, which was usually still close to the center (Figure 7). Non-radial directions have been marked with their respective orienta-tions, allowing to read the intended orientation from the star map.
3.3.2 Orientation Histogram
All plausible orientation lines (views over earth bridges, along ra-dial ditches or through palisade gaps from viewpoints close to thecenter) of 28 Kreisgrabenanlagen were entered in a circular his-togram placed inside the mapping from figure 6. This histogram,in combination with the star path map lying immediately outward,allowed to identify groups of alignments which indicate these di-rections being chosen so that the objects rising or setting in thesedirections can be observed by looking e.g. along a ditch or througha door in the palisade (Figure 8).
Note that this histogram only works if the horizons are not highlyelevated and if all sites approximately share geographical latitude.Due to the fact that an elevated horizon shifts both rising and set-ting points southward (on the northern hemisphere), the peaks inthe histogram are a bit widened, but towards the south only. Thewidening is greater along the northern and southern parts of thehorizon, caused by the shallow angles of the daily paths in theseareas.
CCCCCCCCCCCCCCCCCCCCCW
��
��
���
Figure 7: Combining the flipped star path map of figure 6 with data of the local horizon from GIS data (the thick irregular black zone along thehorizon) and an archaeological map of the twofold Kreisgrabenanlage (KGA) of Steinabrunn [3] as example for an archaeological application.The radial lines indicate some of the plausible viewing directions along ditches, while the dashed lines indicate views through palisade gaps.Degree labels have been added where a line does not originate in the diagram’s center.
��
��
��
��
��
��
��
��
��
@@
@@
@@R
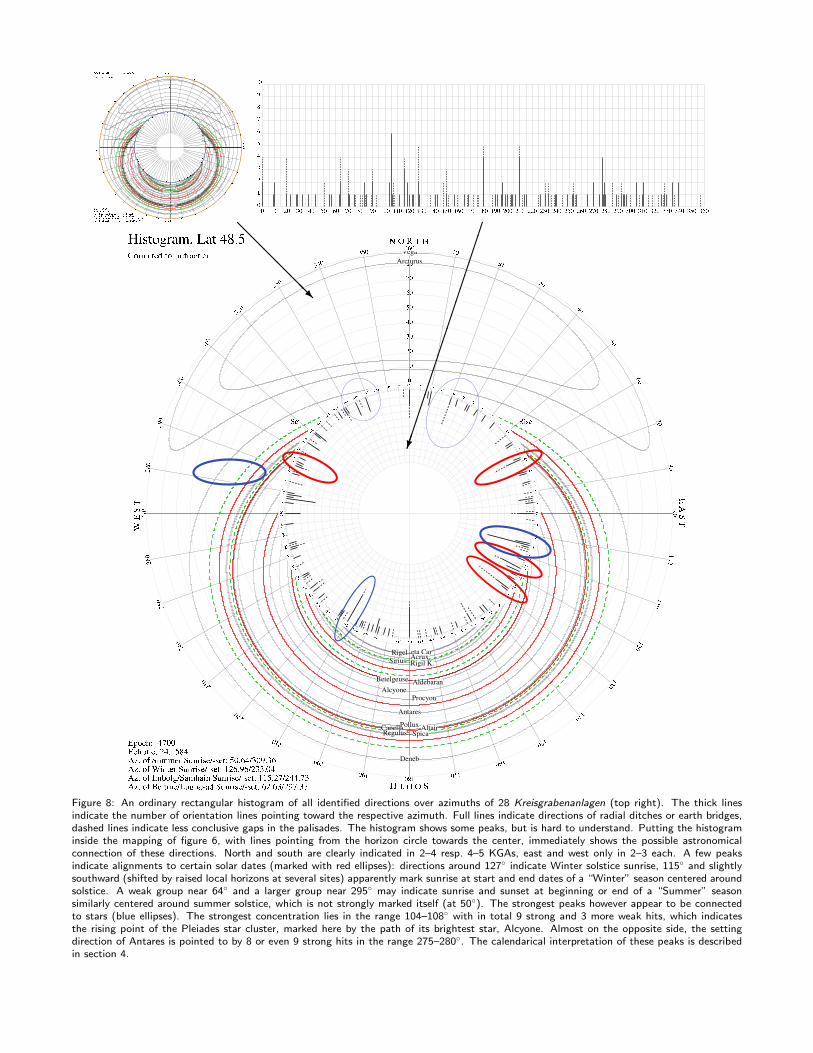
Figure 8: An ordinary rectangular histogram of all identified directions over azimuths of 28 Kreisgrabenanlagen (top right). The thick linesindicate the number of orientation lines pointing toward the respective azimuth. Full lines indicate directions of radial ditches or earth bridges,dashed lines indicate less conclusive gaps in the palisades. The histogram shows some peaks, but is hard to understand. Putting the histograminside the mapping of figure 6, with lines pointing from the horizon circle towards the center, immediately shows the possible astronomicalconnection of these directions. North and south are clearly indicated in 2–4 resp. 4–5 KGAs, east and west only in 2–3 each. A few peaksindicate alignments to certain solar dates (marked with red ellipses): directions around 127◦ indicate Winter solstice sunrise, 115◦ and slightlysouthward (shifted by raised local horizons at several sites) apparently mark sunrise at start and end dates of a “Winter” season centered aroundsolstice. A weak group near 64◦ and a larger group near 295◦ may indicate sunrise and sunset at beginning or end of a “Summer” seasonsimilarly centered around summer solstice, which is not strongly marked itself (at 50◦). The strongest peaks however appear to be connectedto stars (blue ellipses). The strongest concentration lies in the range 104–108◦ with in total 9 strong and 3 more weak hits, which indicatesthe rising point of the Pleiades star cluster, marked here by the path of its brightest star, Alcyone. Almost on the opposite side, the settingdirection of Antares is pointed to by 8 or even 9 strong hits in the range 275–280◦. The calendarical interpretation of these peaks is describedin section 4.
4 DISCOVERIES
Combined with either interactive desktop planetarium software or aself-made planisphere for the neolithic period, a skilled astronomercan interpret a few of the detected accumulations of azimuth direc-tions. In addition to the factual alignment visible from the diagram,we wanted to solve the question why certain stars could have beenso important that our far ancestors oriented their largest buildingsafter them.
For the Sun, the most obvious direction accumulations are nearazimuth 127◦ (Winter solstice) and south of 115◦ (Candlemas/All-Saints-Day), thus marking start, middle and end of a “Winter” sea-son centered around Winter solstice. On the other side, Summerappears to be marked mostly with begin/end dates.
Still, it seems evident that not only solar directions have playeda role in the orientations of Kreisgrabenanlagen. While the datacurrently do not offer a clear connection to lunar extremal risingsor settings (dashed green lines in figures 4 and 8), there are twostriking peaks towards directions 104–108◦ and 275–280◦. Indeed,around 4700 B.C., there have been two very conspicuous objectsrising resp. setting at these directions: the Pleiades star cluster (ris-ing) and the bright star Antares in Scorpius (setting). Moreover,the events of rising Pleiades and setting Antares took place almostsimultaneously. Further investigation led to the conclusion that thePleiades’ heliacal rising (see section 2) took place just after springequinox. It appears very likely that the neolithic farmers used thiscelestial event to start their agricultural year. Note that the Pleiadeshave been observed by many cultures worldwide in connection withthe seasons [5], although a star cluster like the Pleiades, which con-sists of dim stars, cannot be observed below an extinction angle ofabout aE = 4◦, which is, however, a typical horizon elevation inLower Austria.
Deneb, the Swan’s tail star, joins the couple: just when Antaresis setting and the Pleiades are rising, Deneb is highest in the sky,shining almost in the zenith. It is the northernmost bright star thatsets below the northern horizon, and a wide group of doors andother sight lines appear to point towards it. Unfortunately, the in-tersections on the northern and southern horizon are very sensitiveto elevated horizon lines, so the entries in the histogram, whichcannot contain a horizon line, appear less concentrated. Figure 3shows the scene where simultaneously Antares is setting near 275◦,the Pleiades rise at 106◦ and Deneb culminates in the south in about80◦ altitude (near center).
Also a frequently used southern gate direction (210◦) required tolook for a star setting there. Unfortunately, there are several starssharing almost the same declination, but Rigel appears to be thebrightest candidate. Further investigations in the field, taking mea-sured horizon profiles, should clarify and narrow the error marginsfor this and all other directions.
5 CONCLUSION AND FUTURE WORK
In this paper we have shown a simple, yet effective way to inves-tigate buildings with known date of origin for astronomical orien-tations towards special rising and setting points of Sun, Moon andstars. The core item is a novel diagram combining a terrestrial map,e.g., of a building or other archaeological structure, and a folded-apart representation of the sky dome showing daily paths of celes-tial objects and the local horizon. We have shown how this diagramhas been applied to a certain class of neolithic circular enclosures(Kreisgrabenanlagen), and have pointed out interesting discover-ies made with a variant of the diagram which includes a histogramof alignments of a larger number of KGAs. These discoveries al-lowed us to produce renderings for selected points of view insidevirtual reconstructions. These were used as foreground panoramasfor commercial desktop planetarium software to create astronomi-
cal vistas and animations (e.g., Figure 1 [12]). Clearly, an optimalsolution would be an interactive, navigable VR/AR environmentwith an astronomically correct and visually convincing high qual-ity sky simulation, which would allow immediate investigation ofvirtual reconstructions of archaeological sites. Unfortunately, onlypartial solutions of such systems seem to exist (e.g., [8]).
The concept of analyzing collected azimuth directions in a circu-lar histogram could be extended to allow interactive work. Interac-tive brushing through a larger database of KGAs in a GeographicalInformation System (GIS) which includes their possible orienta-tions and selecting, e.g., only archaeological sites in a specific re-gion, could for example probably identify local traditions, althoughthe total number of known KGAs in Europe (about 120 [2, p.4])may be too small to deliver reliable results. If data from a longtemporal series (several centuries) are investigated, the star pathswill be seen shifting due to precession, still, for example an inter-active investigation of the orientation of burial sites could probablyfind long-lasting traditions. In any case, dating the archaeologicalfindings is necessary for any stellar position related investigation.
ACKNOWLEDGEMENTS
Data of Kreisgrabenanlagen and local horizons have been pro-vided by Wolfgang Neubauer. The first author would like to thankMichael Gervautz and Heimo Kramer for the interesting discussionduring development of the flipped star map, and Ralf Habel for Fig-ure 5. Thanks also go to the anonymous reviewers.
This work was supported by the Austrian Science Fund (FWF)under contract number P17558.
REFERENCES
[1] Helmut Becker. Kultplatze, Sonnentempel und Kalenderbauten aus
dem 5. Jahrtausend vor Chr. – Die mittelneolithischen Kreisanla-
gen in Niederbayern. Arbeitshefte des Bayerischen Landesamtes fur
Denkmalpflege, (59), 1996.
[2] Falko Daim and Wolfgang Neubauer, editors. Geheimnisvolle
Kreisgraben — Niederosterreichische Landesausstellung 2005, Horn,
Wien, 2005. Verlag Berger.
[3] Alois Eder-Hinterleitner, Wolfgang Neubauer, and Peter Melichar.
Magnetic modelling for the 3D reconstruction of the neolithic circular
ditch system of Steinabrunn/Austria. In J. Faßbinder and W. Irlinger,
editors, Archaeological Prospection, number 108 in Arbeitshefte des
Bayerischen Landesamtes fur Denkmalpflege, pages 32–33. 1999.
[4] Maria G. Firneis. Untersuchung zur astronomischen Orientie-
rung des Domes zu St. Stephan/Wien. Mitt. d. Mathematisch-
Naturwissenschaftlichen Klasse, Osterreichische Akademie der Wis-
senschaften, 193(8–10), 1984.
[5] E. C. Krupp. Echoes of the Ancient Skies – The Astronomy of Lost
Civilizations. Oxford University Press, New York, Oxford, 1994.
[6] Jean Meeus. Astronomical Algorithms. Willmann-Bell, Richmond,
Virginia, second edition edition, 1998.
[7] Rolf Muller. Der Himmel uber dem Menschen der Steinzeit, vol-
ume 106 of Verstandliche Wissenschaft. Springer-Verlag, Berlin–
Heidelberg–New York, 1970.
[8] UCLA Visualization Portal. vrNav2. http://www.ats.ucla.
edu/portal/research_activities/vrNav/default.htm, ac-
cess 07/2005.
[9] Wolfhard Schlosser and Jan Cierny. Sterne und Steine – Eine prak-
tische Astronomie der Vorzeit. Wissenschaftliche Buchgemeinschaft,
Darmstadt, 1996.
[10] Alexander Thom. Megalithic Sites in Britain. Clarendon Press, Ox-
ford, 1967.
[11] Alexander Thom and Alexander S. Thom. Megalithic Remains in
Britain and Brittany. Clarendon Press, Oxford, 1978.
[12] Georg Zotti. Kalenderbauten?—Zur astronomischen Ausrichtung der
Kreisgrabenanlagen in Niederosterreich. In Daim and Neubauer [2],
pages 75–79.