Embed Size (px)
Citation preview
A Six-unit Network Is All You Need To Discover Happiness
Matthew N. Dailey, Garrison W. CottrellGary's Unbelievable Research Unit (GURU)Computer Science and Engineering DepartmentInstitute for Neural ComputationUCSD
Ralph AdolphsDepartment of NeurologyUniversity of Iowa

Questions About Face Processing
� What kinds of representations are involved in face perception?� How do specific tasks recruit those representations?
• Identity, expression, similarity, discrimination.� Does categorization interact with perception? Conflicting data:
• Sometimes facial expression perception looks continuous.• Sometimes facial expression data indicate categorical perception:
– Sharp boundaries between categories.– Improved discrimination of pairs of stimuli near category boundaries.
� Our computational model of facial expression recognition begins to answer some of these questions.

Outline
� An overview of our facial expression recognition system.
� Classification of prototypical facial expressions.
� Perception/classification of expression morph sequences.
� Conclusions: the model provides a simple explanation for a variety of
human behavioral phenomena.

Facial Expression Database
� Ekman and Friesen quantified muscle movements (facial actions) involved in prototypical portrayals of happiness, sadness, fear, anger, surprise, and disgust.• Result: the pictures of facial affect (1976).• >70% agreement on emotional content by naive human subjects (average 92%).
� 110 images, 14 actors, 7 expressions.
"JJ" portraying 6 “basic” emotions and Neutral.JJ’s faces are the easiest for humans and our model to classify.
HappinessDisgust Neutral SurpriseAnger Fear Sadness

The Facial Expression Classifier
PCA
.
.
.
.
.
.
GaborFiltering
HappySadAfraidAngrySurprisedDisgusted
1-layer NNet
Pixel(Retina)
Level
Object(IT)
Level
Perceptual(V1)
Level
CategoryLevel

The Gabor Lattice Representation� Basic feature: the 2-D Gabor wavelet filter (Daugman, 85):
� Combine two filters to get phase insensitivity, modeling complex cell responses in primary visual cortex.
Convolution
*
Magnitudes
� Subsample in a 29x36 grid:

Principal Components Analysis
� Principal Components Analysis (PCA) for unsupervised dimensionality reduction:
� The resulting 50 inputs are fed to the category layer: a 6-unit softmax network (no hidden layer).
...
50 element reduced representation suitable for supervised neural network training.
Input/Output: 40,600-element Gabor Lattice
(PCA can be learned by a Hebbian network)
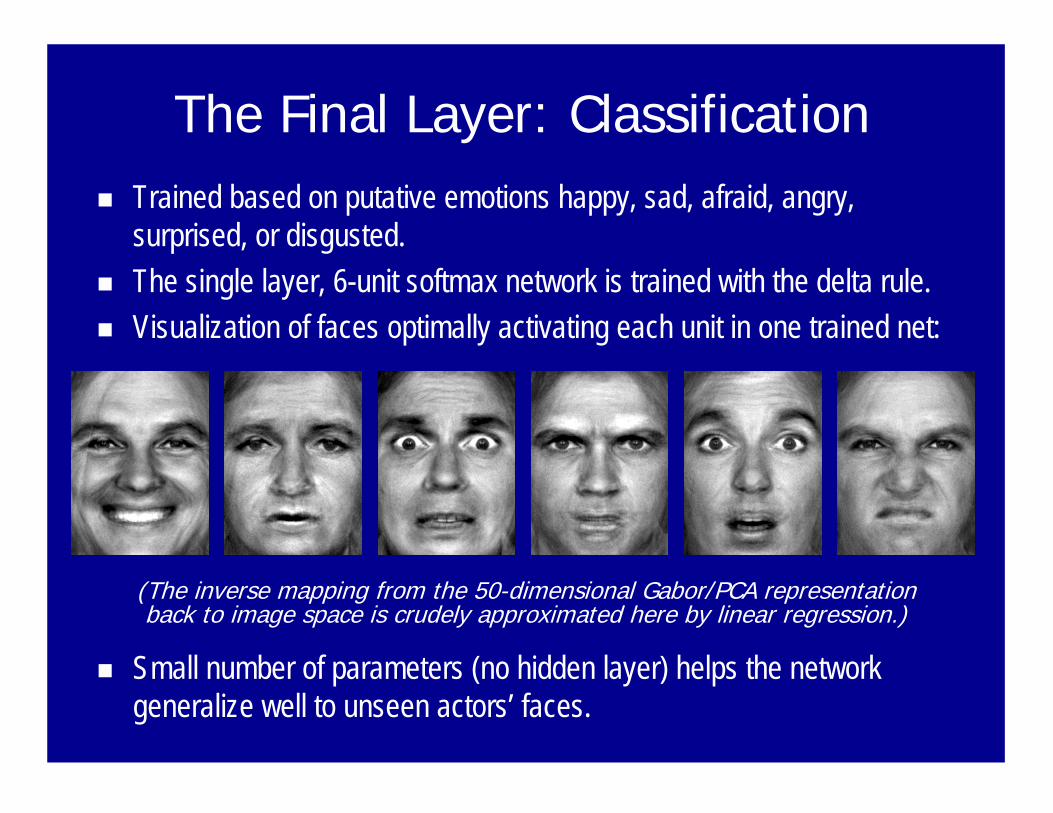
The Final Layer: Classification� Trained based on putative emotions happy, sad, afraid, angry,
surprised, or disgusted.� The single layer, 6-unit softmax network is trained with the delta rule.� Visualization of faces optimally activating each unit in one trained net:
(The inverse mapping from the 50-dimensional Gabor/PCA representation back to image space is crudely approximated here by linear regression.)
� Small number of parameters (no hidden layer) helps the network generalize well to unseen actors’ faces.
Outline
� An overview of our facial expression recognition system.
� Classification of prototypical facial expressions:
• Generalization performance is at the level of naïve human subjects.
• The human emotional similarity structure and the human confusion patterns are
emergent properties of the model.
� Perception/classification of expression morph sequences:
� Conclusions: the model provides a simple explanation for a variety of
human behavioral phenomena.

Prototype Generalization Results
� Average network/human performance is equivalent (t=0.587, p=0.279).� Kendall’s tau (rank order correlation): 0.667, p=0.0441.� The correlation is an emergent property of the model.� This implies that humans have difficulty classifying fear because the
expression is intrinsically difficult.
91.6%90.0%Average87.7%67.2%Fear89.2%83.3%Sadness88.9%89.1%Anger92.3%100.0%Disgust92.4%100.0%Surprise98.7%100.0%Happiness
Human AgreementNetwork % CorrectExpression

Comparing Similarity Structures� Multidimensional scaling (MDS) helps visualize similarity ratings. The
technique makes facial expression space look continuous.
� Distances are derived from correlation of human 6-way forced choice responses.
� Configuration: H-S-F-M-A-D
Human MDS Configuration HappinessSurpriseFearSadnessAngerDisgust

Network Similarity Structure� MDS configuration derived from training set similarity at the network’s
output layer has the same order around the configuration:
� Same arrangement of emotions (H-S-F-M-A-D) about the origin.
Network MDS Configuration, RotatedHappinessSurpriseFearSadnessAngerDisgust

Correlation of Net/Human Errors� MDS informally indicates that the network induces some of the similarity
structure present in the data.� Correlation of network and human responses can quantify this more
formally.� Networks and humans have a 6x6 confusion matrix for the stimulus set.
The off-diagonal terms are the errors.� Correlation of off-diagonal terms: training set: r = 0.4818 (p = 0.007);
test set: r = 0.6614 (p<0.001).� This correlation is another emergent property of the model: it is never
told which expressions it should confuse.
Outline
� An overview of our facial expression recognition system.
� Classification of prototypical expressions:
� Perception/classification of expression morph sequences:• Decision based on network output layer accounts for human 6-way forced choice
identification data.
• Output layer uncertainty explains human response times.
• Input (Object) layer similarity accounts for human discrimination data.
• Model detects secondary expression in a morph as well as humans do.
� Conclusions: the model provides a simple explanation for a variety of human behavioral phenomena.

Morph Transition Perception� Morphs help psychologists study categorization behavior in humans.� Example: JJ fear--sadness morph:
� We use data from Young et al.’s (1997) “megamix” study for comparison. They presented images from morphs between all 6 emotions (15 sequences) to subjects in random order, with a 6-way forced choice task.
0% 10% 30% 50% 70% 90% 100%
Fear Sadness
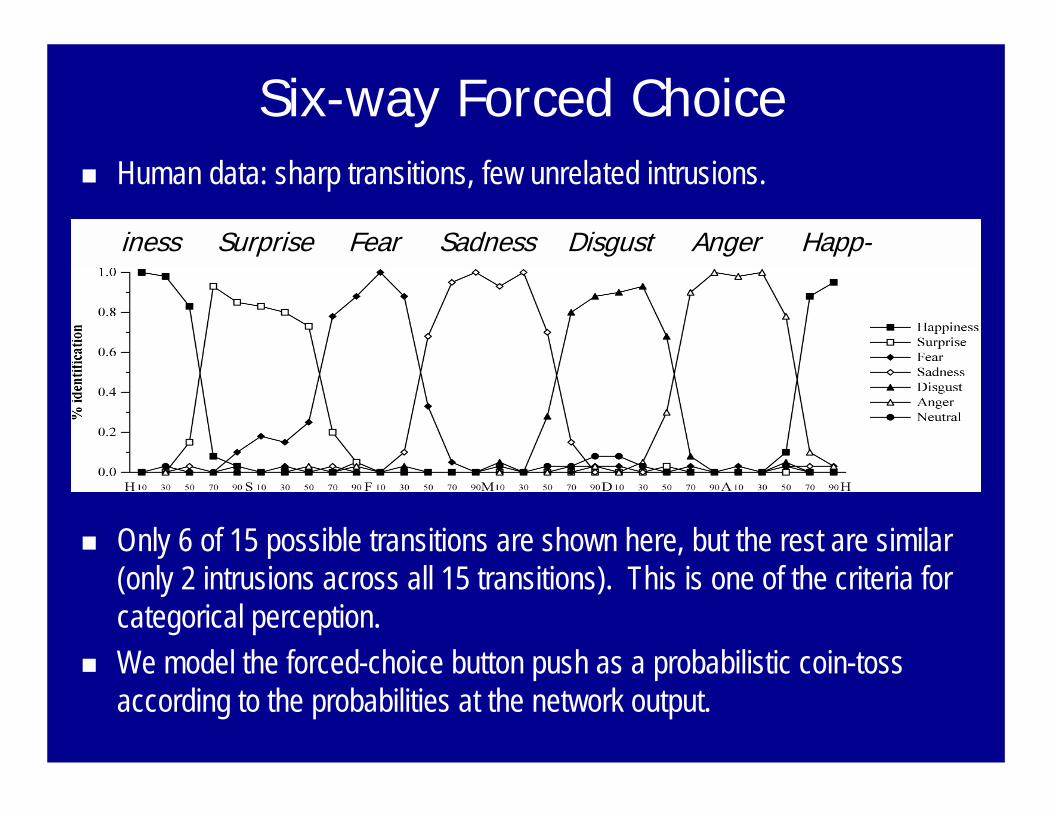
Six-way Forced Choice� Human data: sharp transitions, few unrelated intrusions.
iness Fear Sadness Disgust Anger Happ-Surprise
� Only 6 of 15 possible transitions are shown here, but the rest are similar (only 2 intrusions across all 15 transitions). This is one of the criteria for categorical perception.
� We model the forced-choice button push as a probabilistic coin-toss according to the probabilities at the network output.

Modeling the Six-way Button Push
� Correlation of r=0.9416 over all 15 transitions,� Even though the model is never trained on JJ or morph images!
iness Fear Sadness Disgust Anger Happ-Surprise
Human
Model

Modeling Human Reaction Times
� Human RT patterns are inconsistent with predictions of “perfect” CP.� Model nevertheless accounts for data: r=0.6771 (p<0.001).
iness Fear Sadness Disgust Anger Happ-Surprise
HUMAN SUBJECTS REACTION TIME
MODEL REACTION TIME (1-MAX_OUTPUT)
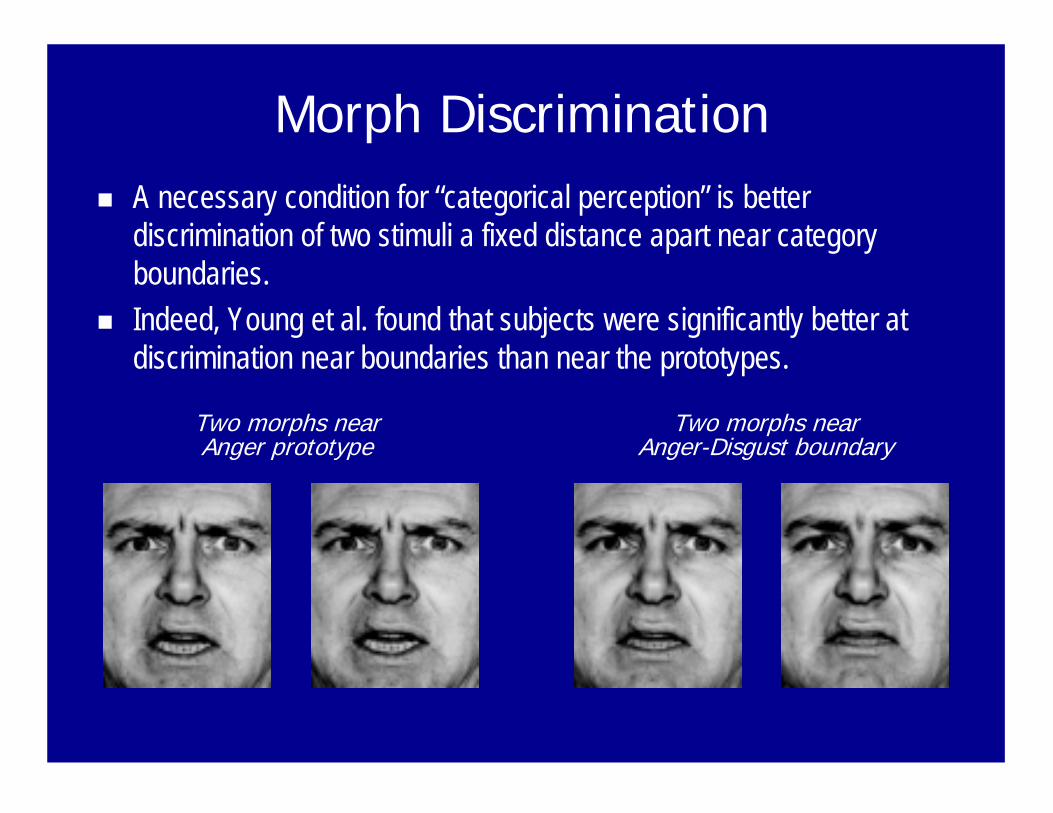
Morph Discrimination� A necessary condition for “categorical perception” is better
discrimination of two stimuli a fixed distance apart near category boundaries.
� Indeed, Young et al. found that subjects were significantly better at discrimination near boundaries than near the prototypes.
Two morphs near Anger prototype
Two morphs near Anger-Disgust boundary

Morph Discrimination� Young et al. found that subjects were significantly better at
discrimination near boundaries than near the prototypes.
iness Fear Sadness Disgust Anger Happ-Surprise
iness Fear Sadness Disgust Anger Happ-Surprise

Modeling Discrimination� Is the improved discrimination near the boundaries due to the influence
of category boundaries?� Discrimination is naturally modeled as the flip side of similarity:
• We model discrimination as 1-r (correlation) between pairs.� Prediction of CP: best fit should occur at category level of the model.
PCA
.
.
.
.
.
.
GaborFiltering
HappySadAfraidAngrySurprisedDisgusted
1-layer NNet
Pixel(Retina)
Level
Object(IT)
Level
Perceptual(V1)Level
CategoryLevel
Modeling Discrimination
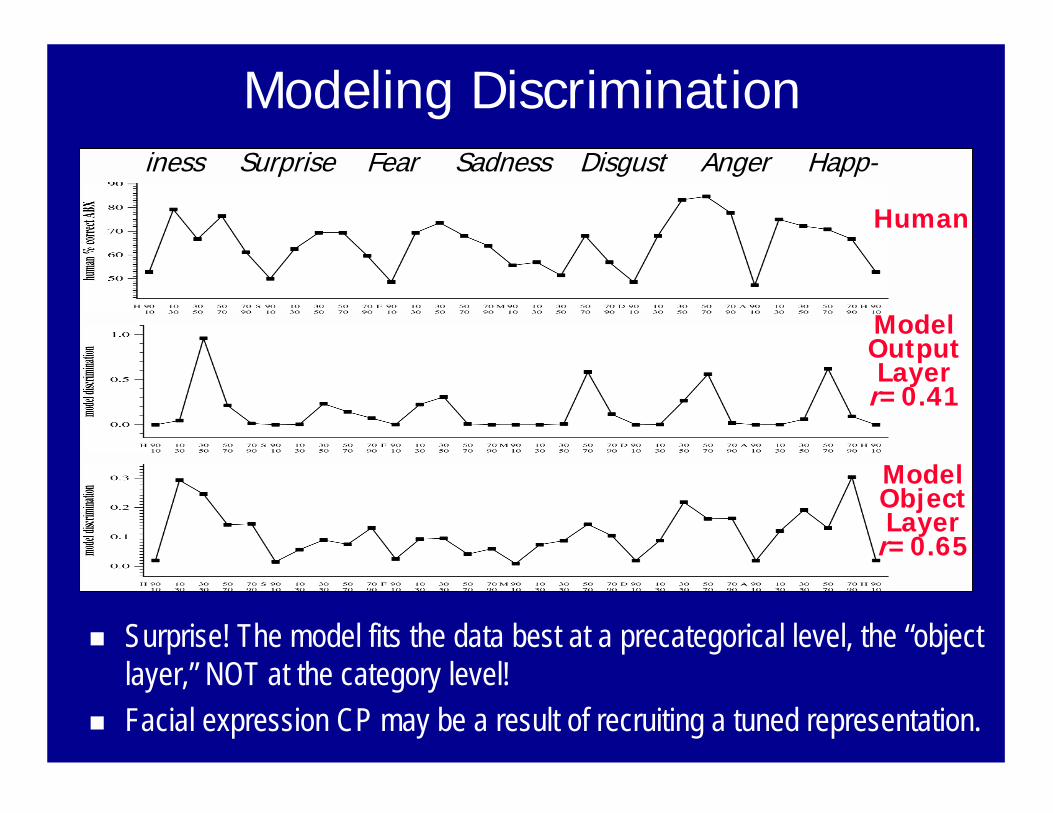
� Surprise! The model fits the data best at a precategorical level, the “object layer,” NOT at the category level!
� Facial expression CP may be a result of recruiting a tuned representation.
iness Fear Sadness Disgust Anger Happ-Surprise
Human
ModelOutputLayer
r=0.41
ModelObjectLayer
r=0.65

Detecting 2nd Expression in a Morph� When subjects are asked to rate 1st, 2nd, 3rd most apparent expressions,
subjects reliably detect the mixed-in expression at the 30% morph level.
� These data seem more consistent with continuousperception.
� But they arise naturally in the network when its 1st, 2nd, and 3rd-largest responses are scored the same way.
Mixed-In Expression Detection
-0.5
-0.3
-0.1
0.1
0.3
0.5
0.7
0.9
1.1
1.3
1.5
10 30 50
Percent Mixing
Ave
rage
Ran
k Sc
ore Mixed-in expression
(humans)Unrelated expressions(humans)Mixed-in expression(networks)Unrelated expressions(networks)
Discussion� Some data on facial expression perception seems continuous:
• MDS facial expression circumplex.• Categorization RT cost when moving away from prototypical faces.• Ability to detect the 2nd expression mixed in to a morph image.
� Other data show CP:• Sharp category boundaries.• Better discrimination near category boundaries.
� The model naturally accounts for all these results.• Some expressions are inherently more difficult than others.• Some expressions are inherently more confusable than others.• Any good classifier will give you sharp category boundaries.• Better discrimination near the boundaries is pre-categorical with our representation.

Conclusions� Our model simultaneously fits data supporting both categorical and
continuous theories of expression perception.� We believe the fits are due to:
• The way expression categories slice up perceptual face space,• The inherent similarity of facial expressions in that space,• And tuning the representation to facial identity/expression via PCA.
� The model shows that discrete categories and innate CP are unnecessary to explain the data.
� We have demonstrated in detail how experiments can tap either a continuous perceptual representation or a discrete decision process.
� We believe these results will generalize to other domains where CP appears.


![INTERNATIONAL NATURAL FIBRES WEEK SALVADOR BAHIA [The Land of Happiness] BRAZIL NOVEMBER 13 TH TO 18 TH, 2011 DISCOVER NATURAL FIBRES – DISCOVER SISAL](https://img.dokumen.tips/doc/110x75/5697c02d1a28abf838cd9ebe/international-natural-fibres-week-salvador-bahia-the-land-of-happiness-brazil.jpg)