Embed Size (px)
Citation preview
Journal of Petroleum Science and Technology
*Corresponding author
Armin Taheri Nakhost
Email: [email protected]
Tel: +98 263 250 6040
Fax: +98 263 250 4793
Article history
Received: February 16, 2013
Received in revised form: June 30, 2013
Accepted: July 1, 2013
Available online: October 25, 2013
Journal of Petroleum Science and Technology 2013, 3(2), 45-56 http://jpst.ripi.ir
© 2013 Research Institute of Petroleum Industry (RIPI)
45
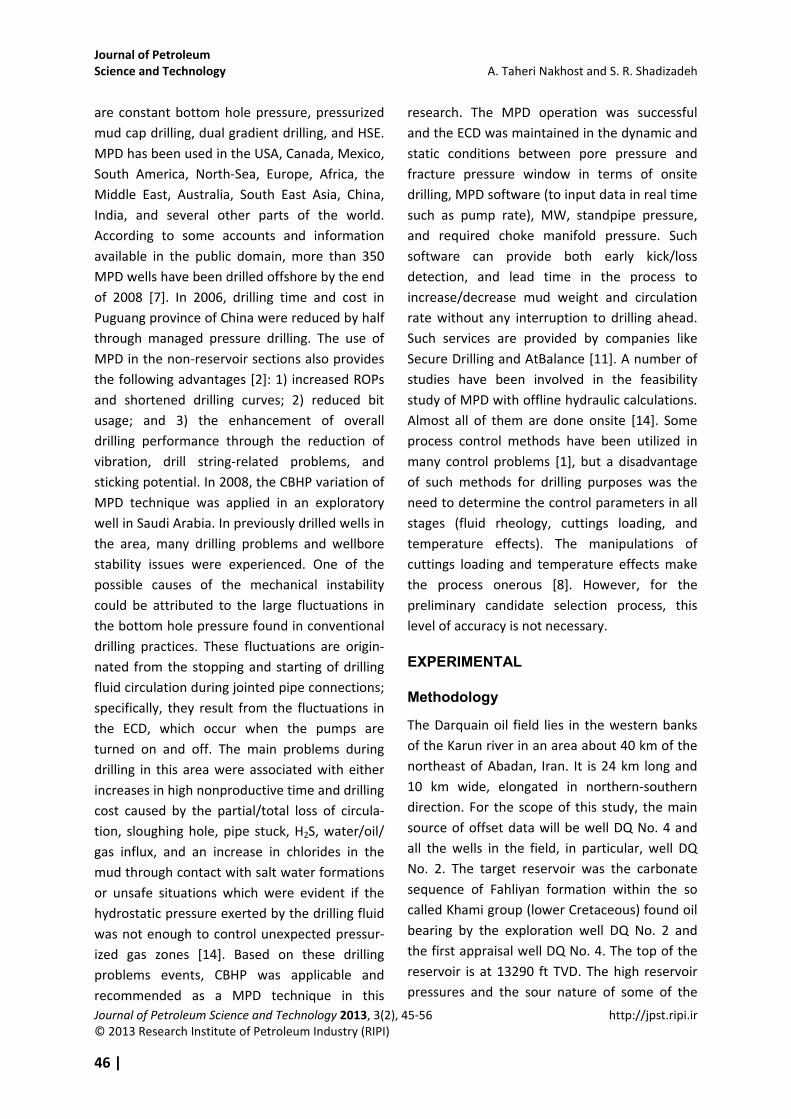
A SIMULATION OF MANAGED PRESSURE DRILLING IN IRANIAN
DARQUAIN OIL FIELD
Armin Taheri Nakhost1* and Seyed Reza Shadizadeh
2
1 Department of Petroleum Engineering, Sciences & Researches Branch of Islamic Azad University, Tehran, Iran
2 Department of Petroleum Engineering, Abadan Faculty of Petroleum Engineering, Petroleum University of
Technology, Abadan, Iran
ABSTRACT
The narrow operating window between pore pressure and fracture pressure makes drilling difficult
in some operations. A feasibility study of managed pressure drilling (MPD) is carried out on Iran
Darquain oil field. The previous wells drilled in this field showed that mud returns were lost during
drilling Gadvan formation. The present work addresses this problem by means of surface back
pressure application in Darquain oil field. The methodology employed in this study is based on
hydraulic analysis calculations and comparative drilling operation pressures. The DZxION MPD
software performs hydraulic analysis using the API RP 13D rheological model and calculates the
annular pressure drop to compare the pressures and the required back pressure, if needed. Using a
mud weight of 14.31 ppg and exerting 100 psi static back pressure, the wellbore pressure profile
got slightly overbalanced. When the mud pumps are in service, no back pressure is required. The
problem is resolved and no kick or loss is observed using a MW of 14.31 ppg and a static back
pressure of 100 psi. As a result, the managed pressure drilling technology is useful in Iran Darquian
oil field through using a lower mud weight in order to overcome the circulation loss in Sarvak
formation. This study is based on hydraulic analysis calculations and comparing the drilling
operation pressures in Darquain oil field. For analyzing the pressure regimes throughout the well,
DZxION managed pressure drilling software performs hydraulic analysis. This software calculates
annular pressure drop and equivalent circulating density to compare the pressures and required
back pressure, if needed. By using this method to drill the well, some advantages were gained: the
mud weights used to drill the well, the number of casing strings, and the number of changing mud
weights were reduced.
Keywords: Equivalent Circulating Density, Back Pressure, Annular Frictional Pressure, Constant
Bottom Hole Pressure, Darquain Oil Field
INTRODUCTION
Several MPD wells have been drilled onshore
and offshore worldwide so far and the range of
application of MPD has enormously increased
since the past few years. MPD technology has
four major variations and some of them have
many different methods to attain MPD, while
some have just one method. These variations
Journal of Petroleum
Science and Technology A. Taheri Nakhost and S. R. Shadizadeh
Journal of Petroleum Science and Technology 2013, 3(2), 45-56 http://jpst.ripi.ir
© 2013 Research Institute of Petroleum Industry (RIPI)
46 |
are constant bottom hole pressure, pressurized
mud cap drilling, dual gradient drilling, and HSE.
MPD has been used in the USA, Canada, Mexico,
South America, North-Sea, Europe, Africa, the
Middle East, Australia, South East Asia, China,
India, and several other parts of the world.
According to some accounts and information
available in the public domain, more than 350
MPD wells have been drilled offshore by the end
of 2008 [7]. In 2006, drilling time and cost in
Puguang province of China were reduced by half
through managed pressure drilling. The use of
MPD in the non-reservoir sections also provides
the following advantages [2]: 1) increased ROPs
and shortened drilling curves; 2) reduced bit
usage; and 3) the enhancement of overall
drilling performance through the reduction of
vibration, drill string-related problems, and
sticking potential. In 2008, the CBHP variation of
MPD technique was applied in an exploratory
well in Saudi Arabia. In previously drilled wells in
the area, many drilling problems and wellbore
stability issues were experienced. One of the
possible causes of the mechanical instability
could be attributed to the large fluctuations in
the bottom hole pressure found in conventional
drilling practices. These fluctuations are origin-
nated from the stopping and starting of drilling
fluid circulation during jointed pipe connections;
specifically, they result from the fluctuations in
the ECD, which occur when the pumps are
turned on and off. The main problems during
drilling in this area were associated with either
increases in high nonproductive time and drilling
cost caused by the partial/total loss of circula-
tion, sloughing hole, pipe stuck, H2S, water/oil/
gas influx, and an increase in chlorides in the
mud through contact with salt water formations
or unsafe situations which were evident if the
hydrostatic pressure exerted by the drilling fluid
was not enough to control unexpected pressur-
ized gas zones [14]. Based on these drilling
problems events, CBHP was applicable and
recommended as a MPD technique in this
research. The MPD operation was successful
and the ECD was maintained in the dynamic and
static conditions between pore pressure and
fracture pressure window in terms of onsite
drilling, MPD software (to input data in real time
such as pump rate), MW, standpipe pressure,
and required choke manifold pressure. Such
software can provide both early kick/loss
detection, and lead time in the process to
increase/decrease mud weight and circulation
rate without any interruption to drilling ahead.
Such services are provided by companies like
Secure Drilling and AtBalance [11]. A number of
studies have been involved in the feasibility
study of MPD with offline hydraulic calculations.
Almost all of them are done onsite [14]. Some
process control methods have been utilized in
many control problems [1], but a disadvantage
of such methods for drilling purposes was the
need to determine the control parameters in all
stages (fluid rheology, cuttings loading, and
temperature effects). The manipulations of
cuttings loading and temperature effects make
the process onerous [8]. However, for the
preliminary candidate selection process, this
level of accuracy is not necessary.
EXPERIMENTAL
Methodology
The Darquain oil field lies in the western banks
of the Karun river in an area about 40 km of the
northeast of Abadan, Iran. It is 24 km long and
10 km wide, elongated in northern-southern
direction. For the scope of this study, the main
source of offset data will be well DQ No. 4 and
all the wells in the field, in particular, well DQ
No. 2. The target reservoir was the carbonate
sequence of Fahliyan formation within the so
called Khami group (lower Cretaceous) found oil
bearing by the exploration well DQ No. 2 and
the first appraisal well DQ No. 4. The top of the
reservoir is at 13290 ft TVD. The high reservoir
pressures and the sour nature of some of the

Journal of Petroleum A Simulation of Managed Pressure Drilling… Science and Technology
Journal of Petroleum Science and Technology 2013, 3(2), 45-56 http://jpst.ripi.ir
© 2013 Research Institute of Petroleum Industry (RIPI)
| 47
fluids dictate special care and attention during
drilling through the cap rock and reservoir
sequences to avoid potential drilling hazards [4].
It is decided to use the constant bottom hole
pressure variation of managed pressure drilling
technique to stay close to an agreeable pressure
profile using surface backpressure. This variation
is closely related to the enhanced kick and loss
detection category of MPD. DZxION MPD CSM
was used in order to perform offline hydraulic
analysis and calculations [11]. The software can
act as a preliminary screen to determine the
utility of MPD for the potential MPD candidate
wells. For calculating the annular and pipe
pressure drop, it follows API RP 13D rheological
model. Essential input parameters for this
software are as follows:
1. Pp and PF data;
2. Drill string and BHA-OD’s lengths;
3. Set of rheology data;
4. Mud weight, circulation rate;
5. Wellbore profile (if the well is direc-
tional);
6. Casing and open hole details (IDs and
ODs).
The hydraulic calculations cannot be performed
without the required input parameters men-
tioned above. Following the basic hydraulic
analysis and calculations, it would help the user
to make a better engineering decision in
deciding whether to use MPD or not for a given
prospect. In the method selected to perform the
feasibility study of the DQ No. 5 well of Darquain
field, the hydraulic calculations using API RP 13D
model are performed. This can determine the
ECD of each mud weight. By determining ECD
and having pore pressure and fracture pressure
in hand, it is possible to choose which tech-
nology is suitable for drilling the well, namely
conventional drilling or managed pressure
drilling.
So the first input data is the casing and drill pipe
data set. The drill pipe length depends on which
section of the well is to be simulated. The next
step is to enter the formation pressure regime.
By using overburden pressure gradient, pore
pressure gradient, and Poisson’s ratio in Eaton’s
equations, the fracture pressure gradient is
obtained. The obtained fracture pressure
gradient and pore pressure gradient are input to
the software in pound per gallon unit. The
calculated equivalent circulating density by the
software is compared with the pore pressure/
fracture pressure window. Drilling fluid proper-
ties, mud rheology data, and the BHA details are
next.
This is how the software determines whether
this window is acceptable or not. If both the
hydrostatic and dynamic pressures in the well
are between the pore pressure and fracture
pressures, the well does not need the MPD. If
these pressures (hydrostatic of mud and dynam-
ic pressure when pumps are on) fall below the
pore pressure or exceed the fracture pressure,
the software calculates the required mud weight
and amount of back pressure. Afterwards, the
software decides whether the MPD is applicable
or not. The next section refers to the pressure
gradients using the actual drilling data from well
DQ No. 4 and all the important and valuable
information from the offset wells. Well DQ No. 4
still remains as the reference well, though.
Fracture Pressure and Pore Pressure
The overburden gradient was calculated using
the sonic log data of well DQ No. 4. The bulk
density has been calculated using AGIP default
formulas. The default values in the formula such
as matrix bulk density, pore fluid density, and
average matrix transit time were modified
according to the local conditions, although there
was no sufficient data. The bulk density was
then integrated to calculate the overburden
gradient. The fracture gradient is calculated as a
function in the estimated pore and overburden
gradient of the area. Depending on lithological
type encountered, the K constant (a function in
Journal of Petroleum
Science and Technology A. Taheri Nakhost and S. R. Shadizadeh
Journal of Petroleum Science and Technology 2013, 3(2), 45-56 http://jpst.ripi.ir
© 2013 Research Institute of Petroleum Industry (RIPI)
48 |
Poisson’s ratio) has been defined maintaining
ENI AGIP strict policy operating in an unknown
new area. In well DQ No. 4, all the tests were
conducted as formation integrity test (FIT).
Therefore, the fracture gradient curve illustrated
in the gradient forecast graph was constructed
using the theoretical formula using the basic
rules as stated in ENI AGIP policies and manuals.
The fracture pressure prediction strategy was
also developed by Ben Eaton in 1975. The data
required are formation overburden stress, pore
pressure, and Poisson’s ratio of the formation.
The fracture gradient prediction equation is
given by:
������ = �
1 − � �� �� − �� ��� �+ �� ��� (1)
The resulting overburden pressure gradient is
integrated from the bulk density of the well DQ
No. 5 and is represented in pound per gallon
unit of depth. The main source of the actual
pore pressure data above the reservoir section
is the well DQ No. 4. In the reservoir section, the
actual bottom hole formation pressure from the
DST tests has been used to update the pressure
gradient data from the offset wells.
Drilling Operation Window
As it can be seen in Figure 1, from surface to
Pabdeh formation at about 7382 ft TVD and in
the whole Fahliyan formation, there is no
serious drilling problem (through the 24”, 17 ½”,
and 8 ½" hole section) due to the wide pressure
margin. Figure 1 illustrates the drilling operation
window of Darquain field. A significant loss has
been observed during drilling lower 12 ¼” hole
that has marginal pressure. Thus, the focus of
this study is only on this section.
Steps of the Study
The steps involved either candidate selection or
a feasibility study that can be divided into the
following main categories: defining the purpose,
procuring information, performing hydraulic
analysis, and selecting the method [10]. First of
all, establishing the purpose of the study has a
higher precedence compared to the remaining
steps. Heavy losses occur during drilling the
lower 12 ¼" hole section; thus suggesting a way
solving this drilling problem seems satisfactory.
Therefore, curing the loss of circulation through
that way provides advantages, including cost
effectiveness (due to less mud loss) and
eliminating excess casing string and saving time
(because of fewer drilling problems and less rig
cost).
All available data from the well being drilled
(such as pressure regimes, drill string and BHA
details, mud weight and rheology, and well bore
geometry) are used in this study. Tables 1 to 7
are the input data of the software.
By using API RP 13D rheological model, the
annular frictional pressure, ECD changes, and
the required mud weight are calculated. The
feasibility of the option, hydraulic analysis,
constraints of the rig, and availability of the
equipment assist choosing the best method
along the different MPD variation.
RESULTS AND DISCUSSION
All the data mentioned above were input to the
software. After running casing 13 3/8” to 7382
ft TVD and cementing, drilling continued with a
12 ¼" bit without major kick or loss problems
according to the planned mud weight (ENI AGIP,
2005) [4]. When the bit reaches 13181 ft TVD
(lower 12 ¼" hole section), the operator changes
the MW from 13.34 ppg to 14.68 ppg because of
high pore pressure expected in Gadvan. This is
continued to the planned 9 5⁄8 " casing setting
depth (13304 ft TVD). Figure 2 illustrates this
procedure. According to the Figure 2, the pore
pressure at 13304 ft TVD is about 9983 psi, and
the column pressure of 14.68 ppg of mud is
10156 psi. When circulating the mud at 767
gpm, the BHP increases to 10259 psi. Although
the well does not flow, as it generates positive

Journal of Petroleum A Simulation of Managed Pressure Drilling… Science and Technology
Journal of Petroleum Science and Technology 2013, 3(2), 45-56 http://jpst.ripi.ir
© 2013 Research Institute of Petroleum Industry (RIPI)
| 49
differential pressures of 173 psi and 276 psi in
static and dynamic conditions respectively, mud
returns are lost throughout the Sarvak forma-
tion during drilling and making connection. It is
critical to reduce the mud weight so as to
possibly cure the problem. The minimum mud
weigh that can be used to drill this interval
(about last 123 ft of Gadvan formation) is an
EMW of 14.43 ppg. For safety reasons, a mud
weight of 14.45 ppg was used to drill this
section. Hence a little overbalanced was
expected at the bottom of the hole; however,
when the pump turned on at 767 gpm, the mud
returns could be found in Sarvak formation.
Figure 1: Pore pressure and fracture pressure profile of Well DQ No. 5
Table 1: Input data, drill string and BHA details, used in Fahliyan formation
Drill String Description
(From Bit to Top) ID (in) OD (in) Length (ft) Distance from Bit (ft)
DC 2.81 8.00 30.80 30.80
St. Stab 2.81 12.25 4.82 35.62
DC 2.81 8.00 62.73 98.35
St. Stab 2.81 12.25 5.41 103.76
DC 2.81 8.00 180.90 284.66
Jar 2.81 8.00 16.53 301.19
DC 2.81 8.00 30.80 331.99
HWDP 3.00 5.00 460.78 792.77
DP 4.27 5.00 12511.00 13304.50
Table 2: Input data, casing design data
Description (Go From
Bottom to Top)
Hole Dia.
(in)
Casing OD
(in) Casing ID (in) Depth From (ft) Depth To (ft)
Open Hole 12.25 9.625 8.535 7382.25 13304.45
Surface Casing 17.50 13.375 12.415 0.00 7382.25
Conductor 24.00 18.625 17.755 0.00 820.25
Journal of Petroleum
Science and Technology A. Taheri Nakhost and S. R. Shadizadeh
Journal of Petroleum Science and Technology 2013, 3(2), 45-56 http://jpst.ripi.ir
© 2013 Research Institute of Petroleum Industry (RIPI)
50 |
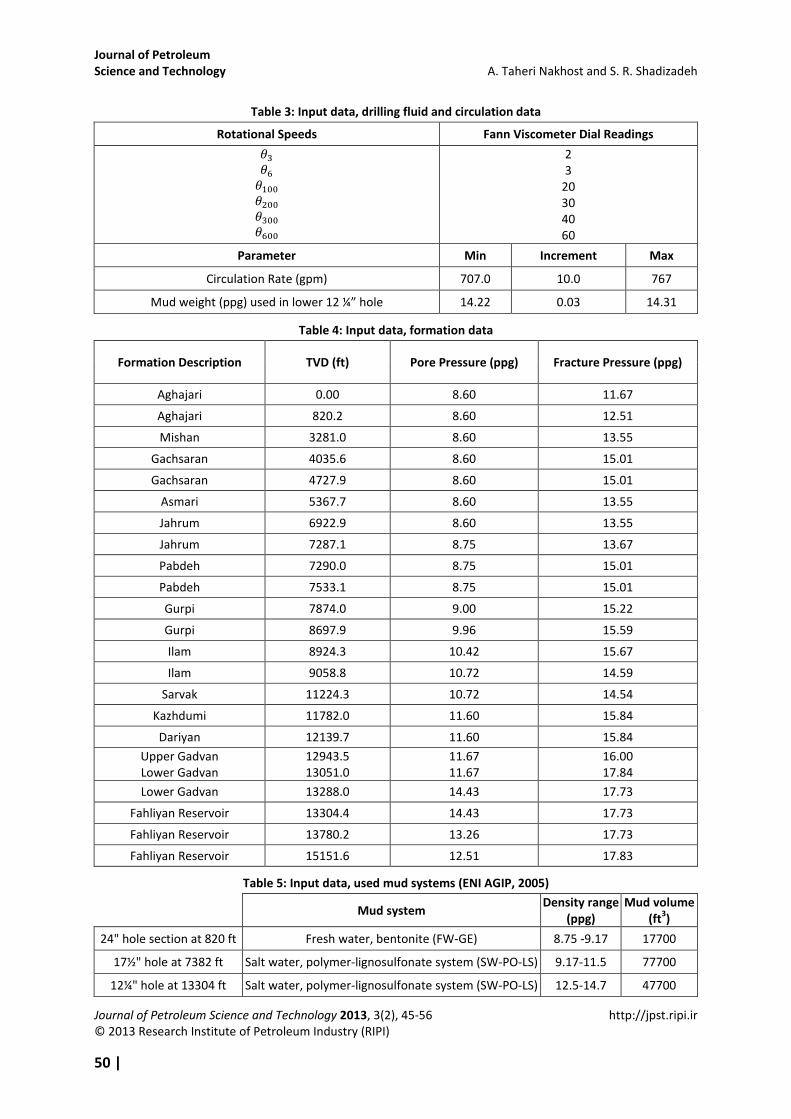
Table 3: Input data, drilling fluid and circulation data
Rotational Speeds Fann Viscometer Dial Readings
��
��
����
����
����
����
2
3
20
30
40
60
Parameter Min Increment Max
Circulation Rate (gpm) 707.0 10.0 767
Mud weight (ppg) used in lower 12 ¼” hole 14.22 0.03 14.31
Table 4: Input data, formation data
Formation Description TVD (ft) Pore Pressure (ppg) Fracture Pressure (ppg)
Aghajari 0.00 8.60 11.67
Aghajari 820.2 8.60 12.51
Mishan 3281.0 8.60 13.55
Gachsaran 4035.6 8.60 15.01
Gachsaran 4727.9 8.60 15.01
Asmari 5367.7 8.60 13.55
Jahrum 6922.9 8.60 13.55
Jahrum 7287.1 8.75 13.67
Pabdeh 7290.0 8.75 15.01
Pabdeh 7533.1 8.75 15.01
Gurpi 7874.0 9.00 15.22
Gurpi 8697.9 9.96 15.59
Ilam 8924.3 10.42 15.67
Ilam 9058.8 10.72 14.59
Sarvak 11224.3 10.72 14.54
Kazhdumi 11782.0 11.60 15.84
Dariyan 12139.7 11.60 15.84
Upper Gadvan
Lower Gadvan
12943.5
13051.0
11.67
11.67
16.00
17.84
Lower Gadvan 13288.0 14.43 17.73
Fahliyan Reservoir 13304.4 14.43 17.73
Fahliyan Reservoir 13780.2 13.26 17.73
Fahliyan Reservoir 15151.6 12.51 17.83
Table 5: Input data, used mud systems (ENI AGIP, 2005)
Mud system
Density range
(ppg)
Mud volume
(ft3)
24" hole section at 820 ft Fresh water, bentonite (FW-GE) 8.75 -9.17 17700
17½" hole at 7382 ft Salt water, polymer-lignosulfonate system (SW-PO-LS) 9.17-11.5 77700
12¼" hole at 13304 ft Salt water, polymer-lignosulfonate system (SW-PO-LS) 12.5-14.7 47700

Journal of Petroleum A Simulation of Managed Pressure Drilling… Science and Technology
Journal of Petroleum Science and Technology 2013, 3(2), 45-56 http://jpst.ripi.ir
© 2013 Research Institute of Petroleum Industry (RIPI)
| 51
Table 6: Input data, mud characteristics (ENI AGIP, 2005)
Hole Phases
24” 17 ½” 12 ¼”
Mud Type Units FW-GE SW-PO-LS SW-PO-LS
From ft 0 820 7382
To ft 820 7382 13304
Mud Density ppg 8.75 -9.17 9.17-11.5 12.5-14.7
Viscosity sec-1
70 50-60 50-60
PV cps 15-20 15-20 15-20
YP lb/100 ft2 61 18-22 19-25
Gel 10” lb/100 ft2 NA 2-4 2-4
Gel 10’ lb/100 ft2 NA 4-6 4-6
PH - 9.5-10 9-10 9-10
Filtrate API cc/30’ NA < 8 4-6
Pm cm3 0.02N H2SO4 NA 1 1
Pf cm3 0.02N H2SO4 NA 0.7 0.7
Table 7: Hydraulic program, 17 ½” section from 820 to 7382 ft RKB
Pump data Bit Data
Depth
(ft)
Mud
Weight
(ppg)
Flow
Rate
(gpm)
Pressure
(psi)
Force
(HHP)
Annular
Velocity
(ft/sec)
Nozzles
(1/32 in.)
TFA
(in2)
Pressure
at bit (psi)
%
pressure
at bit
Jet velocity
(ft/sec)
Pressure
(HHP/in2)
Impact
Force (kg)
1640 9.2 898 1251 662 1.306 3*18+1*16 0.941 793 61.0 305 1.7 594
3821 10.1 898 1507 792 1.306 3*18+1*16 0.941 867 55.0 305 1.8 648
4921 10.2 898 1678 886 1.306 3*18+1*16 0.941 867 49.6 305 1.8 648
7218 10.2 898 2361 1241 1.306 3*18 0.745 1381 56.0 387 2.9 820
7382 10.2 898 2446 1288 1.306 3*18 0.745 1381 54.0 387 2.9 820
Conventional Drilling
When a MW of 14.68 ppg is used, there is no
other way to reduce loss amount and stop it,
even if the pump is turned off. Thus this mud
weight is rejected. By using a MW of 14.45 ppg,
the circulation is lost under dynamic conditions
using a pump rate of 767 gpm (see Figure 3).
The only way to eliminate the problem in this
situation is to reduce the pump rate to about
545 gpm; nevertheless, this rate might increase
the risk of undesirable hole cleaning. It
generates excessive frictional pressure of the
cuttings, compensates for the pump rate
reducing action, and might increase the ECD
greater than that of the 767 gpm condition.
Therefore, this mud weight could not treat loss
of returns. These results make the use of a lower
mud weight and the application of surface back
pressure by choke manifold or back pressure
pump inevitable in order to compensate for the
bottom hole pressure due to a lower mud
weight.
Constant Bottom Hole Pressure Solution
In the simulator, a MW of 14.31 ppg is used to
drill this section. It is obvious that this mud is
about 0.12 ppg lower than the pore pressure of
the Gadvan formation at 13304 ft TVD. The
static BHP of this mud is 9900 psi, while the pore
pressure is about 9983 psi (see Figure 4). The
well will certainly flow during drilling and
connection, and thus the minimum 83 psi back
pressure should be exerted at surface through
choke manifold to compensate for the BHP.
When the bit is reaming the formation at a

Journal of Petroleum
Science and Technology A. Taheri Nakhost and S. R. Shadizadeh
Journal of Petroleum Science and Technology 2013, 3(2), 45-56 http://jpst.ripi.ir
© 2013 Research Institute of Petroleum Industry (RIPI)
52 |
pump rate of 767 gpm, the pressure throughout
the wellbore is in a margin of safety and kick or
loss scenario does not happen. The main issue is
when a connection is to be made and the mud
pumps are to be turned off. This is called the
transition from dynamic to static condition.
Figure 2: Operation window, static and dynamic BHP using a MW of 14.68 ppg at a pump rate of 767 gpm
Figure 3: Static and dynamic BHP using a MW of 14.45 ppg at a pump rate of 767 gpm

Journal of Petroleum A Simulation of Managed Pressure Drilling… Science and Technology
Journal of Petroleum Science and Technology 2013, 3(2), 45-56 http://jpst.ripi.ir
© 2013 Research Institute of Petroleum Industry (RIPI)
| 53
Figure 4: Static and dynamic BHP using a MW of 14.31 ppg at a pump rate of 767 gpm
Choke Opening Design
To shut down the pump for any reasons or if the
pump is shut down suddenly, the BHP falls down
the formation pressure and the well flows. Then,
transition from dynamic to static conditions
should follow a scheduled process to overcome
the problem. Imagine that the pump rate is
reduced; thus the BHP decreases stepwise until
the pump is shut down. To avoid flow while the
pump rate is reduced, the back pressure should
slowly be exerted to the surface simultaneously
to compensate for BHP. The choke opening is
reduced until the annular pressure reaches the
desired pressure at the next pump rate on the
schedule; then, the pump rate is reduced to the
one matching that annular pressure. Table 8 and
Figure 5 show the design of the reducing pump
rate while increasing choke back pressure to
maintain the bottom hole pressure constant. It
can be deduced from the bottom part of Figure
6 that the well flows if the pump is suddenly
shut down from 767 gpm to a static condition.
However, if the back pressure schedule is
followed, the colored lines between “static-no
BP” (green dotted line) and “static-100 psi BP”
(red dotted line) are obtained. The result is that
all of the stages from dynamic to static condi-
tions are accompanied with a reduction in choke
opening (means BP applied) and simultaneously
pump rate is reduced; as a consequence, the
bottom hole pressure is always constant.
Tripping in and Tripping out
Due to the marginal pressure window while
drilling the last 123 ft of Gadvan formation, the
surge and swab pressures should be taken into
consideration. The lowest and highest criteria of
allowable pressures while tripping are pore
pressure in Gadvan and fracture pressure in
Sarvak respectively. Since the BHP under both
static and dynamic conditions are nearly equal
to Gadvan pore pressure (about 17 psi over-
balanced), the maximum pipe velocity while
tripping out the hole should be simulated. The
fracture pressure at bottom Sarvak is 8487 psi
and should not exceed a maximum of 35 psi
during tripping in. The mud clinging constant for
annulus between 5" drill pipe and 12 ¼" open
hole is equal to 0.36. The maximum allowable
downward pipe velocity to have no returns loss
to Sarvak is simulated to be about 1.75 ft/s.
Also, the maximum allowable upward pipe
velocity to avoid well flow is simulated to be
about 0.58 ft/s. It is recommended that a good
condition bit be selected for drilling this interval
to avoid any bit problem in pulling out of hole.

Journal of Petroleum
Science and Technology A. Taheri Nakhost and S. R. Shadizadeh
Journal of Petroleum Science and Technology 2013, 3(2), 45-56 http://jpst.ripi.ir
© 2013 Research Institute of Petroleum Industry (RIPI)
54 |
Thus when a MW of 14.68 ppg is used and there
is return loss in Sarvak formation, two ways are
available to continue the operation:
1-Casing the bottom Sarvak and then using a
higher MW will be possible;
2-Using the lowest possible MW to drill the
Gadvan formation safely by choking the outlet
of the wellbore to generate a pressure drop
over a surface choke.
Each of these ways has a series of disadvantages
and benefits. The first way requires a higher
budget for casing and cementing excessive
casing string, and as a consequence reduces
borehole size. Therefore, it places some con-
straints on completion and production opera-
tions. The risk of stuck pipe due to high
differential pressure is also high. The NPT
increases and the total project cost per foot
rises. In the second way, with an initial fixed cost
of implementing MPD process, the need for
excessive casing string is eliminated. Casing
setting depth is extended and the wellbore
reaches the reservoir with a higher hole size;
this is suitable for performing completion and
production operations. The risks of kick, loss,
and differential stuck pipe are reduced due to a
lower MW and controlled back pressure. The
number of mud weight changes throughout the
process is also reduced. All of these advantages
can reduce NPT with no drilling problems, and
eventually lower cost per foot is needed. The
biggest disadvantage of this method is surge/
swab problem. By using a velocity of 1.75 ft/s
and 0.58 ft/s in tripping in and tripping out
respectively, it take a longer time to complete
the operation. About 2 hours to trip in and 6 and
half hours to trip out, which is too much high
and can increase the total cost per foot of
project.
Table 8: Schedule of reducing choke opening in shutting down the mud pump process with a mud weight of
14.31 ppg
Pump rate (gpm) 767 677 587 497 407 317 137 0
Applied Back pressure (psi) 0 17 37 52 67 78 94 100
Figure 5: Pump rate and back pressure schedule to maintain constant BHP

Journal of Petroleum A Simulation of Managed Pressure Drilling… Science and Technology
Journal of Petroleum Science and Technology 2013, 3(2), 45-56 http://jpst.ripi.ir
© 2013 Research Institute of Petroleum Industry (RIPI)
| 55
Figure 6: Pressure profile by following scheduled choke opening to maintain constant BHP
CONCLUSIONS
The feasibility study of implementing CBHP
variation in Darquain oil field was done;
It was more challenging when the hole was
simultaneously exposed to Gadvan formation
with a pore pressure very close to the fracture
pressure of the other exposed formation
(Sarvak). A MW of 14.68 ppg induced circulation
loss in Sarvak;
A MW of 14.45 ppg lowered the differential
pressure and possibly brought formation fluid
into the wellbore when the mud pumps were
on;
By using the MPD software, a MW of 14.31 ppg
was selected to drill the bottom 12 ¼” hole
section;
Under static conditions, applying a surface back
pressure of 100 psi by following the scheduled
pump rate-choke opening eliminated the
problem.
ACKNOWLEDGMENTS
The authors wish to express their gratitude to
ENI AGIP Co. for geological and drilling reports
and creating the opportunity to conduct this
research.
NOMENCLATURE
AFP : Annular frictional pressure
BHP : Bottom hole pressure
BP : Back pressure
CBHP : Constant bottom hole pressure
ECD : Equivalent circulating density
EMW : Equivalent mud weight
Fp : Fracture pressure
gpm : Gallon per minute
MW : Mud weight
NPT : Nonproductive time
Pp : Pore pressure
ppg : Pound per gallon
TVD : True vertical depth
Journal of Petroleum
Science and Technology A. Taheri Nakhost and S. R. Shadizadeh
Journal of Petroleum Science and Technology 2013, 3(2), 45-56 http://jpst.ripi.ir
© 2013 Research Institute of Petroleum Industry (RIPI)
56 |
REFERENCES
[1] Balchen, J. G., Mumme, K. I., Process Control:
Structures and applications, New York,
VanNostrand Reinhold Company Inc, 1988,
539.
[2] Chen, S., Xinming, N., Steve N., Holt, C.,
“Managed Pressure Drilling Reduces China
Hard-Rock Drilling by Half,” 105490,
SPE/IADC Drilling Conference, Amsterdam,
Netherlands, February, 20-22, 2007.
[3] Chustz, M. J., Smith, L. D., Dell, D., “Managed
Pressure Drilling Success Continues on
Auger TLP,” 112662, IADC/SPE Conference,
Orlando, Florida, USA, March 4-6, 2008.
[4] ENI AGIP Co. 2005, “Darquain Oil Field
Development: Well DQ No. 5 Geological
and Drilling Reports,” NIOC PEDEK, 2009.
[5] Hannegan, D. M. and Fisher, K., “Managed
Pressure Drilling in Marine Environments,”
10173, International Petroleum Technology
Conference, Doha, Qatar, November 21-23,
2005.
[6] Hannegan, D. M. and Wanzer, G., “Well
Control Considerations-Offshore
Applications of Underbalanced Drilling
Technology,” 79854, SPE/IADC Drilling
Conference, Amsterdam, February 19-21,
2005.
[7] Hannegan, D. M., “Case Studies-Offshore
Managed Pressure Drilling,” 101855, SPE
Annual Technical Conference and
Exhibition, San Antonio, Texas, September
24-27, 2006.
[8] Iversen, F., Gravdal, J. E., Dvergsnes, E. W.,
Nygaard, G., Gjeraldstveit, H., Carlsen, L. A.,
Intl. Research Inst. Of Stavanger, And Low,
E., Munro, C., Torvund, S., “Statoil
Feasibility Study of Managed-pressure
Drilling with Automatic Choke Control in
Depleted HP/HT Field,” 102842, SPE Annual
Technical Conference and Exhibition, San
Antonio, Texas, September 24-27, 2006.
[9] Miller, A., Boyce, G., Moheno, L., Arellano, J.,
and Murillo, J., “Innovative MPD
Techniques Improve Drilling Success in
Mexico,” 104030, First International Oil
Conference and Exhibition in Mexico,
Cancun, Mexico, September 1-2, 2006.
[10] Rehm, B., Schubert, J., Haghshenas, A.,
Paknejad, A.S., Hughes, J. “Managed
Pressure Drilling,” Texas, Houston Gulf
Publishing, 2009.
[11] Sagar Nauduri, A. S., “Managed Pressure
Drilling Candidate Selection”, Ph.D.
Dissertation, Texas A&M University, 2009.
[12] Sagar Nauduri, A. S., Medley, G. H.,
Schubert, J., “MPD Candidate Identification:
To MPD or Not To MPD,” 130330, SPE/AIDC
Managed Pressure Drilling and
Underbalanced Operations Conference and
Exhibition, Kuala Lumpur, Malaysia,
February ,24-25, 2010.
[13] Sagar Nauduri, A. S., Medley, G. H.,
Schubert, J., “MPD: Beyond Narrow
Pressure Windows,” 122276, AIDC/SPE
Managed Pressure Drilling and
Underbalanced Operations Conference and
Exhibition, San Antonio, Texas, February,
12-13, 2009.
[14] Vieira, P., Arnone, M., Russel, B., Cook, I.,
Moyse, K., Torres, F., Qutob, H.,
Weatherford International, and Yuesheng,
C., Qing, C., “Sino Saudi Gas Constant
Bottom hole Pressure: Managed-Pressure
Drilling Technique Applied in an Exploratory
Well in Saudi Arabia,” 113679, SPE
Managed Pressure Drilling and
Underbalanced Operations Conference and
Exhibition, Abu Dhabi, UAE, January 28-29,
2008.