Embed Size (px)
Citation preview

A Simplified Load Rating Method for Masonry and Reinforced Concrete Arch Bridges
John S. Kim, PhD, PE – PB Americas, Inc. Rick Garro, PE - CSXT Dan Doty, PE – STV/RWA
ABSTRACT As arch structure has been a scientific and engineering subject for more than 300 years,
numerous methods such as graphical methods have been introduced to analyze this type of
structure. While the AREMA Manual for Railway Engineering does not provide a guideline for
the analysis of masonry arches, British and Canadian specifications have provided provisions for
the load rating of masonry arch bridges. However, their methods incorporate complex collapse-
load analysis, which requires an understanding of limit state analysis of masonry structures.
In recent years, the analyses of arch bridges have arrived at a new stage with the assistance of
computer analysis software. Many researchers have analyzed a number of existing masonry arch
bridges using computer programs and found the analysis results are compatible to field
measurements. However the computer analysis still requires costly 3D analysis software
specifically intended to handle soil-structure interaction.
This paper will introduce a simplified analysis method for the load rating of stone masonry arch
bridges as well as reinforced concrete arch bridges. This simplified frame model of the structure
will utilize commonly available structural analysis software such as LARSA. A detailed analysis
of the CSX Thomas Viaduct arch bridge will be presented as an example of rating a stone
masonry arch bridge. The load rating method for reinforced concrete arch bridges will be also
discussed in this paper.
1. INTRODUCTION
A significant number of masonry arch bridges were built during the mid-to-late 19th century on
the railroad systems of the Northeastern United States. The oldest in the United States is the
Carrollton Viaduct crossing Gwynn’s Fall, near Baltimore, MD, which was completed in 1829.
© AREMA 2009 ®

Some of these bridges are still carrying a substantial railroad load without any major distress, but
some arch bridges are required to be rated for a posting limit.
Many researchers including Boothby (2001) and Fanning (2002) have analyzed a number of
existing masonry arch bridges using computer programs and have compared the results to field
measurements. Since their computer analyses results are very compatible to the field-testing, the
elastic frame analysis method is validated. Therefore, it is now possible to predict the behavior
of arch structures with greater confidence using a simplified frame model of the structure with a
commercially available structural analysis program such as LARSA or STAAD. However, their
methods have presented a few unsolved inconsistencies such as the eccentricity that escapes the
arch ring thickness yet the bridges in measurement showed no significant signs of overstress.
Boothby suggested using a moment (M) and axial thrust (P) envelope to rate the arch bridges. It
is also difficult to apply this envelope to the load rating without going through repeated computer
runs.
In an effort to develop a more user-friendly analysis method, the authors have enhanced the
existing elastic frame analysis by adding a number of new features such as soil springs for
passive resistance of the fill and weightless structural members for fill material. A simplified yet
effective formula was developed to estimate the soil spring values and is presented in this paper.
This new formula was based on various researches on soil-structures interactions. To some
researchers, this may look overly-simplified, but for the majority of engineers it may provide a
simple yet practical way to estimate the spring values.
One of the features of this paper is to convert the fill material to structural members emulating
the load path under live load. Again, the authors developed a simplified way to estimate the
equivalent elasticity modulus for the substituting structural members matching the same amount
of deflection that the fill material may experience under a point load.
The authors also suggested a new direct method to rate the arch bridges without having to build
the envelope or repeat computer runs with constant change of partial factor for live load until the
most critical point of M and P reaches to the envelope.
© AREMA 2009 ®

With the application of this soil spring that is intended to represent the passive resistance of the
fill, the eccentricity that escapes the arch ring thickness in Boothby’s research seemed to be
contained within the arch ring thickness and consequently the analysis results turned out to be
more consistent with the field measurements.
Analysis procedures for spandrel walls are also discussed in this paper. Reinforced concrete arch
bridges share many of the same procedures as the masonry arch bridges, particularly in load
effect parts. However, it is in a totally different class when it comes to the procedure to estimate
the capacity. A brief discussion on this type of arch structure is presented here.
2. REVIEW OF EXISTING ANALYSIS METHODS
Many researchers have made efforts to find out the effective and accurate analysis for masonry
arch bridges during the last 50 years. Among the methods developed and widely used in Europe
are semi-empirical methods such as the MEXE (Military Engineering Experimental
Establishment) method. The MEXE method was originally developed by Pippard (1936) to
quickly access the capacity of arch bridges for military vehicles. Since the MEXE procedure
yields too conservative results, the mechanism method was developed in the early 80’s. This
collapse mechanism method yields better results than the MEXE method, but still poses some
issues. This method assumes four hinges to be formed at both supports and each quarter point of
the arch span while it may not be true under different live load positions.
With the advent of personal computer, numerous computer programs have been developed for
arch bridge analyses but are difficult to adapt and apply to the load rating analysis for railroad
bridges. Some of these programs are still based on the four hinge collapse mechanism.
When a more accurate analysis is demanded, 3-D or 2-D non-linear finite element methods have
been used. These methods incorporate the interaction of soil with the arch structure. Due to the
© AREMA 2009 ®

high cost of running this type of software, a number of researchers have suggested elastic frame
analysis, which can be performed with commonly available general purpose analysis software.
The elastic frame analysis has been suggested primarily by Boothby and Panning (2001, 2004).
Their methods were compared with field measurements claiming that most of the analysis results
were compatible with the field measurement. However, the elastic frame analysis suggested by
Boothby has presented a number of items to be answered:
1. It allows the axial thrust to escape the arch ring thickness in a certain location where the
arch ring deflects into the fill. This means the applied compressive stress in the arch ring
become infinitely large. The arch ring is supposed to collapse due to this enormous stress
but the bridges in his research were observed to be in good condition. He explained it may
be due to the passive resistance of the fill. This fill effect was not directly incorporated into
his analysis models.
2. It allows tension capacity of masonry to be included. However, when the stress in the arch
ring approaches to the ultimate level, tension cracks will be created along the arch ring.
There is no area to provide tension capacity in cracked sections. Therefore, it is rational to
ignore the tension capacity in ultimate strength method.
3. It utilizes axial thrust (P) and moment (M) envelope to rate arch bridges. It is difficult to
apply this method to the current AREMA Manual without repeated runs.
3. FEATURES OF THIS METHOD
To reinforce the existing elastic frame analysis method, the authors have developed a simplified
yet effective method to analyze arch bridges. The features of this method are as follows:
1. Soil springs at each side of arch ring to represent passive earth resistance of the fill.
2. The fill material is substituted with structural members to emulate the live load path from
the surface to the arch ring.
© AREMA 2009 ®
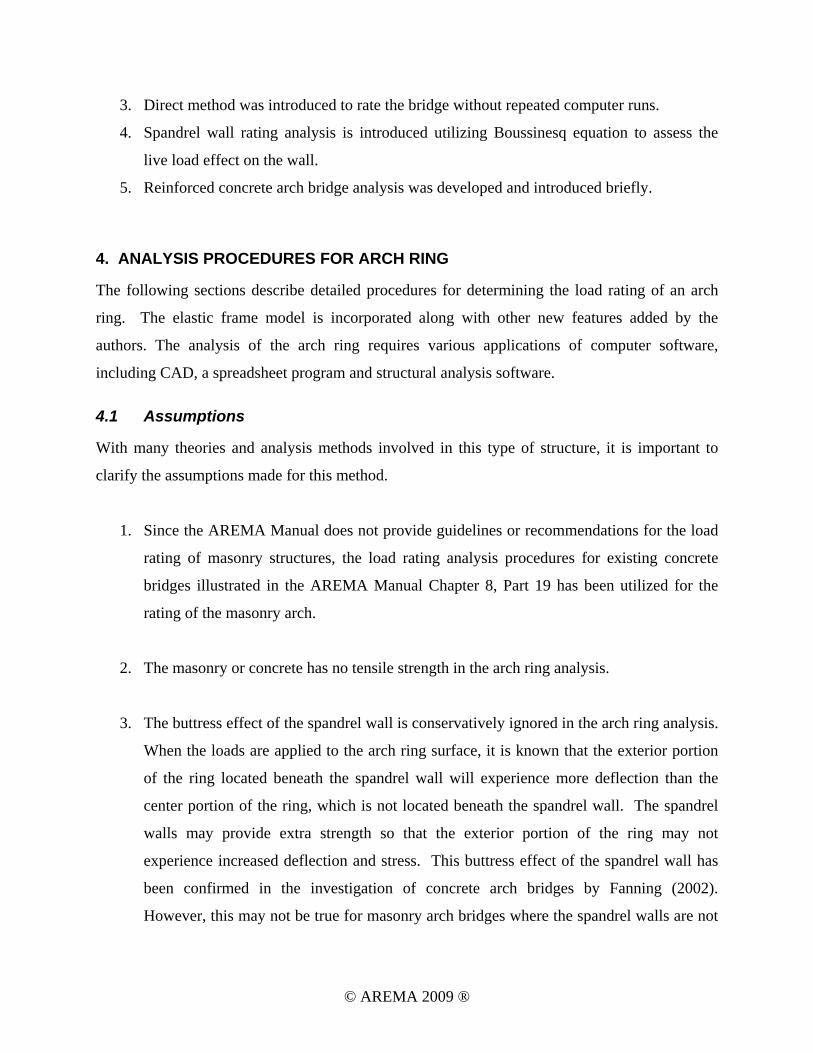
3. Direct method was introduced to rate the bridge without repeated computer runs.
4. Spandrel wall rating analysis is introduced utilizing Boussinesq equation to assess the
live load effect on the wall.
5. Reinforced concrete arch bridge analysis was developed and introduced briefly.
4. ANALYSIS PROCEDURES FOR ARCH RING
The following sections describe detailed procedures for determining the load rating of an arch
ring. The elastic frame model is incorporated along with other new features added by the
authors. The analysis of the arch ring requires various applications of computer software,
including CAD, a spreadsheet program and structural analysis software.
4.1 Assumptions
With many theories and analysis methods involved in this type of structure, it is important to
clarify the assumptions made for this method.
1. Since the AREMA Manual does not provide guidelines or recommendations for the load
rating of masonry structures, the load rating analysis procedures for existing concrete
bridges illustrated in the AREMA Manual Chapter 8, Part 19 has been utilized for the
rating of the masonry arch.
2. The masonry or concrete has no tensile strength in the arch ring analysis.
3. The buttress effect of the spandrel wall is conservatively ignored in the arch ring analysis.
When the loads are applied to the arch ring surface, it is known that the exterior portion
of the ring located beneath the spandrel wall will experience more deflection than the
center portion of the ring, which is not located beneath the spandrel wall. The spandrel
walls may provide extra strength so that the exterior portion of the ring may not
experience increased deflection and stress. This buttress effect of the spandrel wall has
been confirmed in the investigation of concrete arch bridges by Fanning (2002).
However, this may not be true for masonry arch bridges where the spandrel walls are not
© AREMA 2009 ®
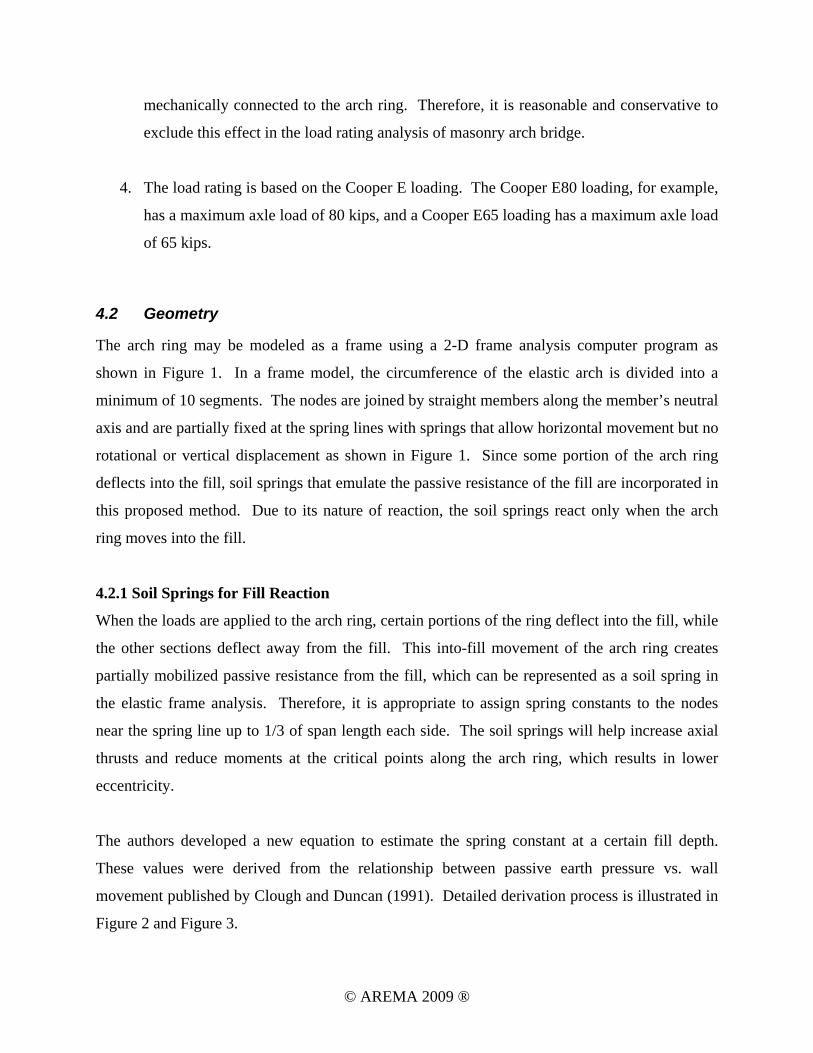
mechanically connected to the arch ring. Therefore, it is reasonable and conservative to
exclude this effect in the load rating analysis of masonry arch bridge.
4. The load rating is based on the Cooper E loading. The Cooper E80 loading, for example,
has a maximum axle load of 80 kips, and a Cooper E65 loading has a maximum axle load
of 65 kips.
4.2 Geometry
The arch ring may be modeled as a frame using a 2-D frame analysis computer program as
shown in Figure 1. In a frame model, the circumference of the elastic arch is divided into a
minimum of 10 segments. The nodes are joined by straight members along the member’s neutral
axis and are partially fixed at the spring lines with springs that allow horizontal movement but no
rotational or vertical displacement as shown in Figure 1. Since some portion of the arch ring
deflects into the fill, soil springs that emulate the passive resistance of the fill are incorporated in
this proposed method. Due to its nature of reaction, the soil springs react only when the arch
ring moves into the fill.
4.2.1 Soil Springs for Fill Reaction
When the loads are applied to the arch ring, certain portions of the ring deflect into the fill, while
the other sections deflect away from the fill. This into-fill movement of the arch ring creates
partially mobilized passive resistance from the fill, which can be represented as a soil spring in
the elastic frame analysis. Therefore, it is appropriate to assign spring constants to the nodes
near the spring line up to 1/3 of span length each side. The soil springs will help increase axial
thrusts and reduce moments at the critical points along the arch ring, which results in lower
eccentricity.
The authors developed a new equation to estimate the spring constant at a certain fill depth.
These values were derived from the relationship between passive earth pressure vs. wall
movement published by Clough and Duncan (1991). Detailed derivation process is illustrated in
Figure 2 and Figure 3.
© AREMA 2009 ®

The new simplified equation was developed to efficiently estimate the value of the spring
constant (Ksp) as follows:
Ksp = β * Hi (kips / in. / ft) (1)
Where β = 200 for Dense Sand ( φ = 45 deg)
= 60 for Medium Dense Sand (φ = 37 deg)
Hi = Depth from top to a nodal point, i (in.)
When the arch ring deflects into the fill, the nodal points move horizontally and vertically as well.
However, the vertical component of the springs is ignored for simplicity and it was revealed
during parametric studies that there was no significant difference. Therefore, use Eq. (1) to
estimate the spring values at each nodal point up to 1/3 of span length on each side.
4.2.2 Soil Springs at Supports
The spring constants representing the supports at the abutments and piers may be obtained by
comparing field data to analytical results as demonstrated in the study by Boothby (2001). The
spring stiffness at abutments is generally greater than the stiffness at piers owing to passive earth
resistance of the backfill. If field data is not available, the typical values shown in Table 1 may
be used as suggested by Boothby. The table constants are based on the force to cause one-inch
of movement for one-foot of arch ring width. Therefore, if the arch ring model has two feet
width, the table values should be doubled.
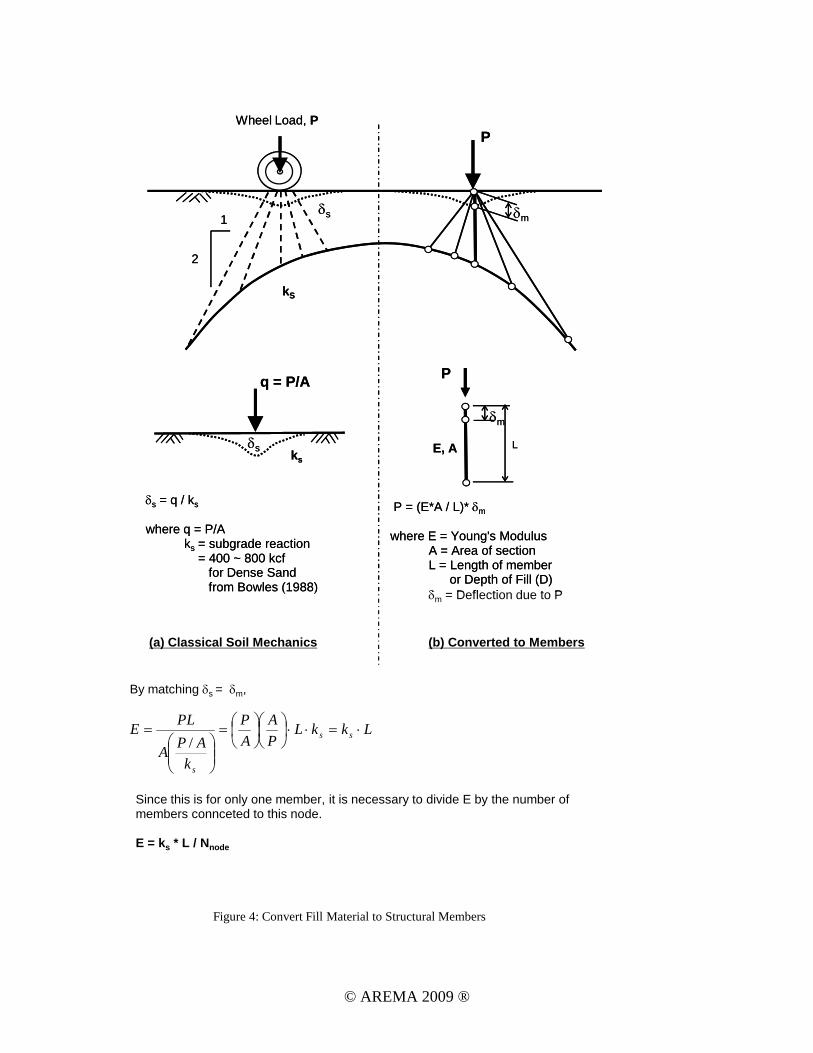
4.2.3 Converted Fill Material to Structural Members
The loads above the arch ring are transferred through the fill at a 2:1 slope. Since the fill
material is not elastic, it usually requires high-cost software that can handle soil-structure
interactions to accurately obtain the load effect on the arch ring. However, when the actual
amount of movements in arch ring and the adjacent soil are very small, it is not irrational to
convert the fill material to structural members.
© AREMA 2009 ®

As shown in Figure 4, each node at the surface is suggested to be connected by five members:
one vertical and four with slopes. The number of connected members can be determined by
examining the fill depth and distance between two nodes to create a 2:1 slope with two outer
members. Only the vertical member has weight to represent the fill weight and the rest of
members are weightless structural members. The same sectional properties are assigned to all
five members so that the area and moment of inertia are the same through all five members.
During the conversion process, the structural characteristic such as Young’s Modulus (E) are
carefully selected with a calibration to the soil characteristics under a point load using classical
soil mechanics principles. After vigorous investigation on the modulus of subgrade reaction (ks)
and Young’s modulus (E), the following simplified relationship was extracted. The detailed
procedures are explained in Figure 4.
E = ks * D / Nnode (2)
Where ks = Modulus of subgrade reaction (400 to 800 kcf for Dense Sand),
D = Average depth of the fill
Nnode = Total members connected to the node (usually five)
Since the depth of fill varies along the arch ring, E values will constantly change. In this
simplified method, the average fill depth is used to find the E value for all nodes.
4.3 Properties
Material properties of the arch masonry, if not specified in the design drawings, may be obtained
from field samples taken from the structure or from published literature on stone masonry. If
material properties are not available, the typical values shown in Table 2 may be used with
caution. It is suggested to start with the lower bound values and increase the material property to
reasonable values based on field observations combined with sound engineering judgment. A
more accurate analysis may be obtained by a core sample test to better define the material
properties.
© AREMA 2009 ®

The elasticity modulus and nominal compressive stress given in Table 2 are considerably lower
than the values of masonry units alone due to the general use of soft mortars in the joints. These
material properties should be used for modeling of the arch ring in the analysis program.
Sectional properties for the arch ring are based on a 12-inch strip. When the arch ring consists of
uneven thicknesses, which happens often at the crown area, use an average or minimum
thickness of the ring and apply it to entire length of the ring. When severe deterioration is
observed in a certain area along the arch ring, reduce the ring thickness and model accordingly.
For a severely damaged arch, it is vital to exercise engineering judgment in reducing the size of
the ring thickness because the ring thickness is linearly proportional to the capacity of the bridge.
4.4 Loads and Load Combinations
The loads to be considered in the rating of an arch bridge, as given in the AREMA Manual
Chapter 8, Part 19, include Dead Load, Live Load, Impact Load, Earth Pressure, Buoyancy,
Stream Flow, Centrifugal Force and Longitudinal Force.
The self-weight of the arch ring and superimposed dead loads such as the weight of the fill and
track should be applied to the extrados of the arch ring. The weight of the spandrel walls is
assumed to be equally distributed over the width of the arch ring.
The live load resulting from an axle load is dispersed through the fill at a slope of 2 vertical to 1
horizontal. The AREMA Manual allows the axle loads to be treated as uniformly distributed
loads over an area that is 3 feet in the longitudinal direction and 8.5 feet in the transverse
direction per track, as shown in Figure 5. The magnitude of pressure applied to the nodal points
varies as the depth of the fill above each node changes. In multi-track arch bridges, the middle
strip of the arch ring is subject to higher live load pressure as shown in Figure 5(b).
The application of live load impact on the arch ring is likely to depend on the fill depth. Though
AREMA Manual does not directly specify for arch structures, Chapter 8, Part 16 Design and
Construction of Reinforced Concrete Box Culvert can be utilized to estimate the live load impact.
© AREMA 2009 ®

Since the fill depth at the arch crown is the shallowest, it may be conservative to use this depth to
determine for the inclusion of the live load impact and apply the decision to the entire arch ring.
4.5 Live Load Position for Maximum Stress
According to Gilbert (2006), the span length of the majority of arch bridges in England ranges
from 10 ft to 15 ft. In this short span arch bridge, the position of one or two heavy axles will
determine the critical cases. Many researchers suggested that an axle load positioned at a quarter
point of the span will yield the most critical condition. However, the long span cases will be
hard to predict as more than one axle will be applied simultaneously within the span.
Fortunately most modern structural analysis software comes with a moving load generator. This
feature can provide the exact position of the live load for maximum stress.
4.6 Critical Case in Arch Ring
Instead of building an interaction diagram for all nodal points of the arch ring, it is convenient to
deal with the critical section only where the maximum compressive stress occurs. The procedure
to find the maximum combined compressive stress (fm) in the masonry arch ring is as follows:
Step 1: From the frame analysis, find the maximum applied moment, M, and corresponding axial
thrust, P. The relationship of M and P is illustrated in Figure 6 (b).
Step 2: Find the eccentricity, e, of the axial thrust.
e = M / P (3)
Step 3: Calculate applied compressive stress, fm.
fm = P / (a * B) (4)
where a = h – 2e from Figure 6 (c)
h = Arch ring thickness
B = Arch ring width.
© AREMA 2009 ®

4.7 Load Rating for Arch Ring
The AREMA Manual presents two different rating methods: Service Load Rating (SLR) and
Load Factor Rating (LFR). Since the methodology developed for the compressive stress (fm) is
based on the limit state theory, LFR is the more appropriate method than SLR. LFR has two
ratings: Load Factor Normal Rating (LFN) and Load Factor Maximum Rating (LFM).
The normal rating factor (LFN) is defined by the lesser rating value of two equations:
])(3/5[ 3.1)(1.1
CFILSFBEDSLFN N
+++++−
=φ (5)
)(3.1)5.0(1.1
LFCFILFWLWSFBEDSLFN N
+++++++++−
=φ (6)
The maximum rating factor (LFM) is defined by the lesser rating value of two equations:
)( 3.1)(1.1
CFILSFBEDSLFM N
+++++−
=φ (7)
)(1.1)5.0(1.1
LFCFILFWLWSFBEDSLFM N
+++++++++−
=φ (8)
where, φ = Strength reduction factor = 0.7
SN = Nominal strength.
Since the strength reduction factor (φ) for stone masonry is not available in the current AREMA
Manual, the reduction factor for concrete, φ = 0.7 for bearing, is used. The nominal strength of
the stone masonry (Fm) can be obtained by sampling or values suggested in Table 2 in the
absence of such testing.
© AREMA 2009 ®

All applied loads in Equations (5) through (8) should be expressed in the same format as the
nominal strength (SN); stress vs. stress or force vs. force. Equations (5) through (8) can be
expressed as:
φ SN = LFN x 1.3 [5/3 (L+I)+CF] + 1.1(D+E+B+SF) (9)
φ SN = LFN x 1.3 (L+I+CF+LF) + 1.1(D+E+B+SF+0.5WL+WL+F) (10)
φ SN = LFM x 1.3 (L+I+CF) + 1.1(D+E+B+SF) (11)
φ SN = LFM x 1.1 (L+I+CF+LF) + 1.1(D+E+B+SF+0.5WL+WL+F) (12)
The left side term calculates the capacity of the stone masonry (φ SN) and the right side term
computes the total applied stress (fm). LFN and LFM may be calculated by running a computer
program several times until the total applied stress matches with the strength. Instead of running
repeatedly, rating factors can be obtained by utilizing the principle of superposition. When the
initial analysis is performed based on E80 loading, identify all compressive stresses due to
individual load. Adjust the values of LFN and LFM factors until fm matches φ SN. A spreadsheet
program can be easily written to perform this task once the frame analysis identifies P and M
produced by each load case.
When the LFN and LFM are obtained based on Cooper E80 loading, the rating expressed in
terms of Cooper E Series can be computed by the following expressions:
Normal Rating = LFN x 80 (13)
Maximum Rating = LFM x 80 (14)
5. ANALYSIS PROCEDURES FOR SPANDREL WALL
It has been observed in a number of masonry arch bridges that the spandrel walls experience a
horizontal shift and rotation from their original location due to lateral earth pressures exerted on
© AREMA 2009 ®
the wall. According to Boothby (2001), more problems were observed in spandrel walls than the
arch rings. Therefore it is essential to estimate the capacity of the spandrel wall using a simple
and practical method. Since the current AREMA Manual does not provide a rating method for
masonry arch bridges, it is suggested to use the same rating formats developed for concrete
structures with the conventional wall stability criteria such as overturning moment and sliding.
5.1 Stability Criteria
The spandrel wall is analyzed for stability, which includes overturning and sliding. The lateral
earth pressure generated by the backfill and live load create both an overturning moment and a
horizontal sliding force. The magnitude and direction of the earth pressure is determined by
applying the principles of soil mechanics. The overturning moment and sliding force are resisted
by the self-weight of the spandrel wall, the weight of the spandrel fill material, and the vertical
component of the live load surcharge. The overturning safety factor, i.e., the ratio of the
resisting moment over the overturning moment should be at least 2.0, while the minimum safety
factor for sliding should be 1.5.
The resisting sliding capacity is determined by multiplying the calculated vertical force by a
frictional coefficient. The sources of vertical forces are spandrel wall self-weight, fill materials
and live load surcharge. The typical frictional coefficient values suggested by NAVFAC (Naval
Facilities Engineering Command) are presented in Table 3. Since each layer of stone masonry is
bonded with mortar, the spandrel wall may experience sliding or overturning failure in any layer
of the masonry.
5.2 Earth Pressure Coefficient
The masonry spandrel wall is assumed to move slightly under the heavy live load so that it may
create an active earth pressure condition. The best known equation for estimating active earth
pressure coefficient (Ka) was developed by Rankine, which is a theoretical relationship between
Ka and the internal friction angle φ, or Ka = (1 - sin φ) / (1 + sin φ). Typical values for the angle
of internal friction are given in Table 4.
© AREMA 2009 ®

5.3 Earth Pressures due to Live Load Surcharge
When vertical loads, such as the railroad live load, are applied near the top of a retaining wall, a
lateral earth pressure is generated against the wall as shown in Figure 7. The applied railroad
live load typically consists of a continuous strip surcharge load (qs) with an equivalent load equal
to the maximum axle load of 80 kips from the Cooper E80 load train divided by an area
consisting of a typical tie width of 8.5 feet and an axle spacing of 5 feet.
The current AREMA Manual presents the Boussinesq equation for a strip load, based on the
theory of elasticity, as shown in Figure 7(a). The Boussinesq equation for a strip load yields an
unreasonably high pressure due to its inherent singularity problem when the track is located too
close to the wall.
Since the backfill materials are not perfectly elastic, the Boussinesq equation yields much higher
pressures than the field-measured pressures when the surcharge loads are very close to the wall.
A number of researchers including Terzaghi (1954), and Kim and Barker (2003), have suggested
using the upper limit value for the lateral earth pressure due to surcharge loads. Terzaghi
suggested that the lateral pressure should not be greater than the lateral pressure measured at a
distance/wall height ratio of 0.4.
Kim and Barker (2003) suggested that the lateral pressure should not be higher than the pressure
produced by the half-space case as shown in Figure 7(b), where the same uniformly distributed
load (qs) is applied over an infinitely large surface area. The logic behind this suggestion is that
the strip load should produce no greater earth pressure than the half-space load. Since the
applied area is infinite, the induced horizontal pressure is considered to be constant throughout
the wall height. Therefore, when the edge of track ties are too close to the spandrel wall, say 1 ft
or closer, the earth pressure obtained from the Boussinesq equation should always be compared
with the pressure from the half-space equation.
Due to energy dissipation effects in the arch fill material, it is assumed that the live load impact
is not included in the load rating of the spandrel wall. The dead load of rail, tie and ballast
© AREMA 2009 ®

produces vertical pressure as well as horizontal pressure and therefore should be included in the
load rating analysis.
5.4 Procedure for Spandrel Wall Load Rating
The AREMA Manual Part 8.19 specifies two rating methods to be used: Service Load Rating
and Load Factor Rating. Since the spandrel wall rating utilizes the conventional stability criteria
that incorporate safety factors, the Service Load Rating method is more appropriate to be used.
The Service Load Rating has two rating factors: Service Load Normal (SLN) and Service Load
Maximum (SLM). According to the AREMA Manual, the Normal Rating refers to the
maximum load level that may be carried by an existing wall for an indefinite period of time. The
Maximum Rating represents the maximum load level the spandrel wall may support at infrequent
intervals.
The normal rating factor (SLN) is defined by the lesser rating value of two equations:
[ ] [ ]][
2.1/CFIL
SFBEDSSLN f
+++++−
= (15)
[ ][ ]LFCFIL
FWLWSFBEDSSLN f
+++++++++−
=5.0
(16)
The maximum rating factor (SLM) is defined by the lesser rating value of two equations:
[ ]][ CFIL
SFBEDSSLM f
++
+++−= (17)
[ ][ ]LFCFIL
FWLWSFBEDSSLM f
+++
++++++−=
5.02.1 (18)
© AREMA 2009 ®

where Sf = Permissible stress.
In the similar manner as the arch ring analysis, Equations (15) through (18) can be expressed in
terms of Sf. The permissible stress in spandrel wall analysis is a bit different from the arch ring,
though. It can be expressed as a factor of safety, which is ROTM / LOTM in overturning where R
represent resistance and L represents loads. Sf can be expressed in RSliding / LSliding in sliding.
Using a spreadsheet program, adjust SLN and SLM until the applied factors of safety match the
target safety factors.
When Cooper E80 loading is used in Equations (15) through (18), the rating, expressed in terms
of a Cooper E Series live load, is computed by the following expressions:
Normal Rating = SLN x 80 (19)
Maximum Rating = SLM x 80 (20)
Since the height of the wall varies along the arch, it is suggested to analyze the wall at pier or
abutment where the fill depth is the deepest and at the crown where the fill depth is shallowest.
6. REINFORCED CONCRETE ARCH BRIDGE
Rating analysis in reinforced concrete arches has very similar procedures to the masonry arch
bridge in finding the axial thrust and moment. The fill material is substituted by structural
members and the soil springs represent the partially mobilized passive resistance of the fill.
However, the evaluation of a section capacity is quite different due to the presence of reinforcing
steel as shown in Figure 8.
With the critical combination of P and M identified by the frame analysis, the reinforced
concrete section can be evaluated for load rating. The basic idea of analysis on this type of
bridge is based on the analysis of a reinforced concrete column using the following equations:
© AREMA 2009 ®
Nominal Axial Load Capacity, Pn
f A- f' A'a b 0.85f'P sssscn +⋅⋅= (21)
Nominal Bending Moment Capacity, Mn
( ) ( )yd f Ad'y f' A'2ay a b 0.85f'M sssscn −+−+⎟
⎠⎞
⎜⎝⎛ −⋅⋅= (22)
6.1 Load Rating Procedures Even though the rating procedure is much more complex than the masonry arch, the rating
procedures can be summarized as follows:
1. Using reinforced concrete column analysis, create P-M Interaction Diagram.
2. Plot the critical P and M in the diagram.
3. Change the live load factor until the applied P and M reach to the envelope boundary.
4. Calculate the load rating factor, which is the ratio of the adjusted live load factor to the
nominal live load factor.
If the applied loads, P and M, are within the envelope, the structure is considered adequate to
carry the applied live load. If they are outside the envelope, then reduce the live load factor to
bring it inside the envelope. The rating factor in this case will be smaller than 1.0. This rating
factor can be LFN or LFM depending on what nominal live load was used.
7. ANALYSIS EXAMPLE: The Thomas Viaduct
7.1 Description
CSXT Bridge No. 10A is located at Mile Post BAA9.1, Baltimore Division, Capital Subdivision,
near Relay, Baltimore County, Maryland, better known as The Thomas Viaduct. The Thomas
Viaduct is an eight-span, stone masonry arch bridge traversing the Patapsco River Valley located
between the towns of Relay and Elkridge, Maryland. The viaduct has an overall length of 704’-
10” including the approaches. There are a total of 8 arches with each span measuring 67’- 6” in
lengths center-to-center of piers. The width of the arch is 26’- 4”. The structure was built on a
© AREMA 2009 ®
4º-30´ horizontal curve and supports two tracks spaced 12’- 4” center-to-center. The depth of
structure at the arch crown is 3’- 6” and the depth of structure at the spring line is 32’-0”. The
viaduct face consists of roughly cut dense granite with a ring thickness of 2’-6”. The photo in
Figure 9 shows an elevation view of one of the arches in the bridge.
7.2 Geometry
Since the original bridge drawings were not available, the bridge dimensions are based on a 1937
bridge repair plan sheet. The shape of all eight arches is the same and therefore an arch span is
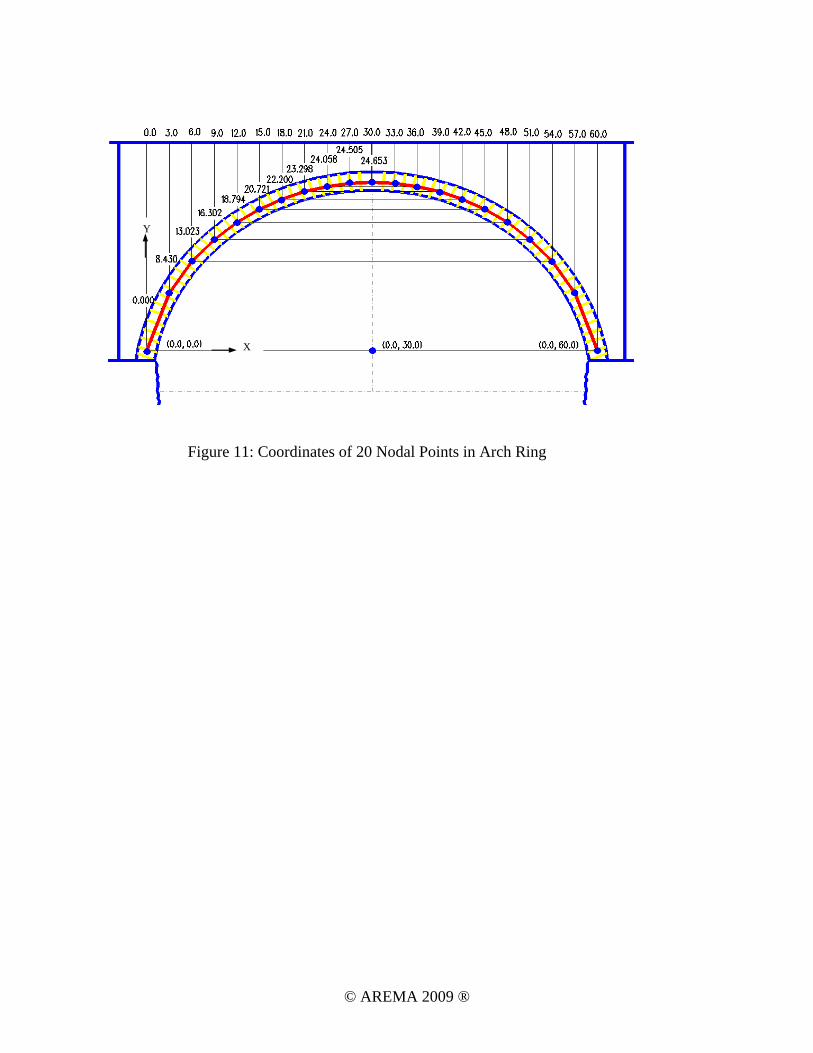
selected for the load rating analysis. The arch ring is first divided into 20 segments with each
node referenced in a Cartesian coordinate system. Figure 10 shows the wall height at the crown
to be approximately 4’-6” and an arch width of 26’-4”.
A horizontal elastic spring is assigned to represent a more realistic elastic behavior at each
support. As recommended in Table 1, a spring constant of 8,700 kip/in./ft was chosen and
applied at each supports, which are nodal points 1 and 21 as shown in Figure 11. To account for
the passive resistance of the fill as the outer third of arch ring deflects into the fill, soil springs
are assigned to nodal points 2, 3, 4, 18, 19 and 20 as described in Section 4.2.1. The direction of
spring should be normal to the arch ring; however, this procedure requires very complex
calculations and there is insignificant difference between the results when comparing the case
with the springs normal to the arch ring to the case with horizontal springs. Therefore it is
recommended to apply horizontal springs only.
7.3 Material and Section Properties
The semi-circle arch ring is modeled as an elastic frame using an analysis computer program
such as LARSA. Each voussoir of the arch ring consists of a dense granite stone that is 2 ft long,
2 ft 6 in. high and 3 ft wide in the transverse direction. Since 2-D frame analysis typically uses a
unit width of 1 ft, the cross section of the arch ring used in the analysis is 12 in. wide and 30 in.
deep, yielding a cross sectional area of 360 in2 and a moment of inertia of 27,000 in4. The
nominal compressive strength of the stone (Fm) is taken as 1,500 psi and the modulus elasticity
(E) used in this analysis is 1,600 ksi.
© AREMA 2009 ®

7.4 Loadings and Load Combinations
Referencing the AREMA Manual, Chapter 8, Part 19, the loadings considered in the load rating
of a concrete structure should include dead load (D), live load (L), impact (I), buoyancy (B),
stream flow (SF), centrifugal force (CF), longitudinal force (LF), Friction (F) and earth pressure
(E). Since this project was completed before a new version of AREMA Manual was issued in
2005, longitudinal force and friction were not included. Buoyancy and stream flow were ignored
in this example due to unlikelihood of occurring.
7.5 Arch Ring Analysis
The following sections provide a load rating analysis for the arch ring using a spreadsheet
program and a general structural analysis program called LARSA.
7.5.1 Material and Section Properties
The arch ring for this bridge consists of solid granite stone and the material properties are input
in LARSA. As recommended in Table 2, the modulus of elasticity (E) of the granite stone is
taken to be 1,600 ksi and the nominal compressive strength (Fm) is 1.5 ksi. The arch ring is
modeled as a 2-D frame that is 12 in. width, the cross-sectional dimensions are 2 ft 6 in. tall and
12 in. wide.
7.5.2 Loads and Load Combinations
Applied load for rating consists of Dead Load, Live load, Earth Pressure, and Centrifugal Force
for this example. Since the limit state concept was incorporated in the arch ring analysis, load
factor rating analysis was used. The AREMA Manual Part 8.19 specifies load factors for the
load rating analysis.
7.5.3 Summary of Arch Ring Analysis
Based on the frame analysis model with soil springs at the outer third, the critical moment and
axial thrust at the crown fell within a reasonable range. The rating for the arch ring is
summarized in Table 5. The capacity for normal rating is Cooper E75 and the maximum rating
is Cooper E124.
© AREMA 2009 ®
7.6 Spandrel Wall Analysis
The load carrying capacity of the spandrel walls is investigated at the crown as well as at the
pier. Stability criteria of overturning moment and sliding are used for load rating analysis. Load
rating analysis of the spandrel walls at the pier and at the crown is summarized in Table 6.
Based on the traditional wall stability criteria for overturning moment and sliding forces, the
resisting capacities are calculated. Service load rating factors, SLN and SLM, were obtained
using these resisting capacities.
At the pier, the overturning moment criterion governs the load rating, as the normal service load
rating factor (SLN) is 0.85, which is equivalent to Cooper E68 live loading. The maximum
service load rating factor (SLM) is 1.06, which yields the maximum live load rating of Cooper
E85.
At the crown, the sliding criterion controls the rating. The SLN rating is 0.99, which results in
the normal live load rating of Cooper E79, and the SLM is 1.22, which results in the maximum
live load rating of Cooper E98. Either at the crown or at the pier, the maximum allowable
Cooper loading exceeds E80, whereas normal rating is about Cooper E80 for both sliding and
overturning.
As shown in the summary table, the wall at the pier has less rating capacity than at the crown.
Since the wall height rapidly changes from the pier to the crown and the stones are interlocked
with mortar, it is not too irrational to average the rating value at the pier and the one at the
crown. Therefore, the average Normal rating for overturning is Cooper E88 and the average
Normal rating for sliding is E77. The average Maximum ratings for overturning and sliding are
Cooper E109 and E96, respectively. Since the lesser value of sliding and overturning is the
controlling rating factor, this spandrel wall has a rating value of E77 for Normal and E96 for
Maximum.
© AREMA 2009 ®

8. CONCLUSIONS
Elastic frame analysis modeling for a unit width of the arch ring of a masonry arch bridge
provides a sufficiently quick, simple and reasonably precise means of rating the load carrying
capacity of masonry and reinforced concrete arch bridges. The use of average material strength
and stiffness constants based on the analysis of previous field test data by Boothby (2001, 2004)
makes it possible to predict the behavior of a masonry arch bridge to within sufficient accuracy
of load rating analysis. The field test results compared with the procedures developed by
Boothby, et al. (2002) legitimize the use of elastic frame analysis for the load rating of masonry
arches. However, a few mysteries were still yet to be answered. The new features in this paper
hopefully offer some answers to those mysteries and provide a simplified yet practical analysis
method for masonry and reinforced concrete arch bridges.
9. ACKNOWLEDGMENTS
The research described herein has been carried out through many load rating projects sponsored
by CSX’s Thomas Viaduct Load Rating and the development of CSX’s Masonry Arch Bridge
Load Rating Manual, Load rating analysis for Deep River by NS, Load rating analysis for three
masonry arch bridges by Vermont Railway, and 25 arch bridge load rating analysis by Virginia
DOT. Mark Yanik of Parsons Brinckerhoff has offered a great deal of his effort in this research.
10. REFERENCES AREMA Manual (2009) Vol. II, Chapter 8, Part 19 Rating of Existing Concrete Bridges Boothby T. E. (2001). “Load Rating of Masonry Arch Bridges”, Journal of Bridge Engineering, ASCE, Vol. 6, No. 2, 79-86. Boothby T. E. and Erdogmus, E. (2001). “Load Rating of Masonry and Concrete Arch Bridges”, Proceedings of AREMA Annual Conference 2001, 30 p. Boothby T. E. and Fanning, P.J. (2001). “Assessment Methods for Masonry Arch Bridges”, Proceedings of Structural Faults and Repair Conference, 6 p. Boothby T. E. and Fanning, P.J. (2004). “Load-Rating of Masonry Arch Bridges: Refinements”, Journal of Bridge Engineering, ASCE, Vol. 9, No. 3, 304-307.
© AREMA 2009 ®
Brencich A. and Francesco U.D. (2004). “Assessment of Multispan Masonry Arch Bridges. I: Simplified Approach”, Journal of Bridge Engineering, ASCE, Vol. 9, No. 6, 582-590. Brencich A. and Francesco U.D. (2004). “Assessment of Multispan Masonry Arch Bridges. II: Examples and Applications”, Journal of Bridge Engineering, ASCE, Vol. 9, No. 6, 591-598. Clough, G. W. and Duncan, J. M. (1991). “Earth Pressures”, Foundation Engineering Handbook”, 2nd Ed., edited by Fang, H.Y., Van Nostrand Reinhold, New York, NY, 223-235. Fanning, P.J. and Boothby T. E. (2002). “Three-Dimensional Modeling and Full-Scale Testing of Stone Arch Bridges”, Computers & Structures No. 79, Elsevier Science Ltd., 2645-2662. Gilbert M., Melbourne C and Smith C. (2006). Discussion of “Assessment of Multispan Masonry Arch Bridges. I: Simplified Approach” by Brencich and Francesco, Journal of Bridge Engineering, ASCE, Vol. 11, No. 2, 257-261 Harvey, W. J. (2001). “The Complex Relationship Between Analysis, Testing and Assessment of Arch Bridges”, Proceedings of Structural Faults and Repair Conference, 12 p. Kim, J. S. and Barker, R. M. (2002). “Live Load Surcharge Effect on Abutment and Retaining Wall”, Journal of Geotechnical Engineering, ASCE, Vol. No. 10, ASCE Kim, J. S. and Dan, D. A. (2003). “Masonry Arch Bridge Load Rating Manual”, CSXT NAVFAC DM7.2 (1982). “Foundations and Earth Structures”, Dept. of the Navy, Naval Facilities Engineering Command, Washington, D.C. Taly, N. (1998). Design of Modern Highway Bridges, The McGraw-Hill Company, Inc., New York. Terzaghi, (1954). “Anchored Bulkheads.” Transactions of the ASCE, Vol. 119, 1243-1324. Veksler, R and Thorat, A. (1999). “The Arch Bridge Mystery”, Journal of Civil Engineering, September, 48-51. Woodham, D. B. (2000). “Strengthening a Stone Arch Bridge”, Journal of Structural Engineer, May, 3 p.
© AREMA 2009 ®

10. FIGURES AND TABLES
LISTS OF FIGURES AND TABLES Figure 1: Deflection Shape of Arch Ring Figure 2: Approximate Passive Earth Pressure vs. Movement Figure 3: Soil Springs for Fill Reaction Figure 4: Convert Fill Material to Structural Members Figure 5: Live Load Distribution Figure 6: Procedure of Finding Compressive Stress (fm) Figure 7: Earth Pressure due to a Strip Load and Half-Space Load Figure 8: Section Capacity with Compression and Tension Steel Figure 9: The Thomas Viaduct (CSXT Bridge No. 10A) Figure 10: Typical Section View Looking West Figure 11: Coordinates of 20 Nodal Points in Arch Ring Table 1: Suggested Horizontal Support Spring Constants (Boothby, 2001) Table 2: Suggested Material Properties of Masonry (Boothby, 2002) Table 3: Typical Frictional Coefficient Values (from NAVFAC, 1982) Table 4: Typical Internal Friction Angle (after Clough and Duncan, 1991) Table 5: Summarized Results of Arch Ring Rating Table 6: Summarized Results of Spandrel Wall Rating
© AREMA 2009 ®

Figure 1: Deflection Shape of Arch Ring
Spring Line Spring Line
Deflection Shape
© AREMA 2009 ®

K'p = 1600 (Δ/h) for Dense Sand
4.0 [K'p at linearly proportional]
K
Δh
Approx. Linearity for Dense Sand, φ = 45 deg.
Relationship K and Δ from Clough and Duncan (1991)
0.0025
0.29 [Ko = 1-sin φ]Movement Movement
away from Fill
Simplified Linear Line
5.8 [Kp = (1+sin φ)/(1-sin φ)]
From Simplified Linear Line, read D/h = 0.0025 for K'p = 4.0.
Similarly,
K'p = 500 (Δ/h) for Medium Dense Sand
4.0 [K'p at linearly proportional]
K
Δh
Approx. Linearity for Dense Sand, φ = 45 deg.
Relationship K and Δ from Clough and Duncan (1991)
0.0025
0.29 [Ko = 1-sin φ]Movement Movement
away from Fill
Simplified Linear Line
5.8 [Kp = (1+sin φ)/(1-sin φ)]
Figure 2: Approximate Passive Earth Pressure vs. Movement
From Simplified Linear Line, read D/h = 0.0025 for K'p = 4.0.
Similarly,
© AREMA 2009 ®

FE = (K'p*γ*Ho)*h FSp = Ksp*Δ
Let FE = FSp and solve for KSp
(K'p*γ*Ho)*h = Ksp*Δ
Ksp = (K'p*γ*Ho)*(h/Δ)
1
4
3
2
Ho
FE
Soil Propertiesφ, γ
h
56
7
FSp2
Spring Reaction ForceEarth Pressure Force
Δ
h
Since K'p = 1600 (Δ/h) for Dense Sand from Figure 2,
Ksp = 1600 (Δ/h)*γ*Ho*(h/Δ) = 1600 γ*Ho
For γ = 0.120 kcf, Ksp = 192 Ho
Say,Ksp = 200 Ho for Dense Sand
Similarly, K'p = 500 (Δ/h) for Medium Dense Sand,
Ksp = 60 Ho for Medium Dense Sand
1
4
3
2
Ho
FE
Soil Propertiesφ, γ
h
56
7
FSp2
Spring Reaction ForceEarth Pressure Force
Δ
h
Figure 3: Soil Springs for Fill Reaction
© AREMA 2009 ®
Wheel Load, PP
2
1δs δm
E, A
kS
q = P/A
δs ks
δs = q / ks
where q = P/Aks = subgrade reaction
= 400 ~ 800 kcf for Dense Sandfrom Bowles (1988)
δm
L
P
P = (E*A / L)* δm
where E = Young's ModulusA = Area of sectionL = Length of member
or Depth of Fill (D)δ Deflection due to P
(b) Converted to Members
Figure 4: Convert Fill Material to Structural Members
Wheel Load, PP
2
1δs δm
E, A
kS
q = P/A
δs ks
(a) Classical Soil Mechanics
δs = q / ks
where q = P/Aks = subgrade reaction
= 400 ~ 800 kcf for Dense Sandfrom Bowles (1988)
δm
L
P
P = (E*A / L)* δm
where E = Young's ModulusA = Area of sectionL = Length of member
or Depth of Fill (D)δm = Deflection due to P
By matching δs = δm,
Since this is for only one member, it is necessary to divide E by the number of members connceted to this node.
E = ks * L / Nnode
LkkLPA
AP
kAPA
PLE ss
s
⋅=⋅⋅⎟⎠⎞
⎜⎝⎛⎟⎠⎞
⎜⎝⎛=
⎟⎟⎠
⎞⎜⎜⎝
⎛=
/
© AREMA 2009 ®

Figure 5: Live Load Distribution
(b) Transverse Direction
1
2
1
2
3’
8.5’
(a) Longitudinal Direction
© AREMA 2009 ®

Figure 6: Procedure of Finding Compressive Stress (fm)
Detail A
(a) Arch Ring
P P h
h/2
C L
(b) Member Forces in Detail A
h/2 M M
(c) Combined Axial Thrust
P Pa
e
a/2
CL
fm
M = P * e
© AREMA 2009 ®

Figure 7: Earth Pressure due to a Strip Load and Half-Space Load
(a) Boussinesq Pressure for a Strip Load
qs
Ps
(b) Pressure due to Half-Space Load
qs
Ps
© AREMA 2009 ®

MnMn
Pn
Mn
Pn
b
Mn
Pn
b
hd
yh/2
A'sd'
Plastic Centroid
Mn
Pn
b
hd
yh/2
As
A'sd'
Plastic Centroid
Mn
Pn
b
hd
yh/2
As
A'sd'
Plastic Centroid
Figure 8: Section Capacity with Compression and Tension Steel
© AREMA 2009 ®

Figure 9: The Thomas Viaduct (CSXT Bridge No. 10A)
© AREMA 2009 ®
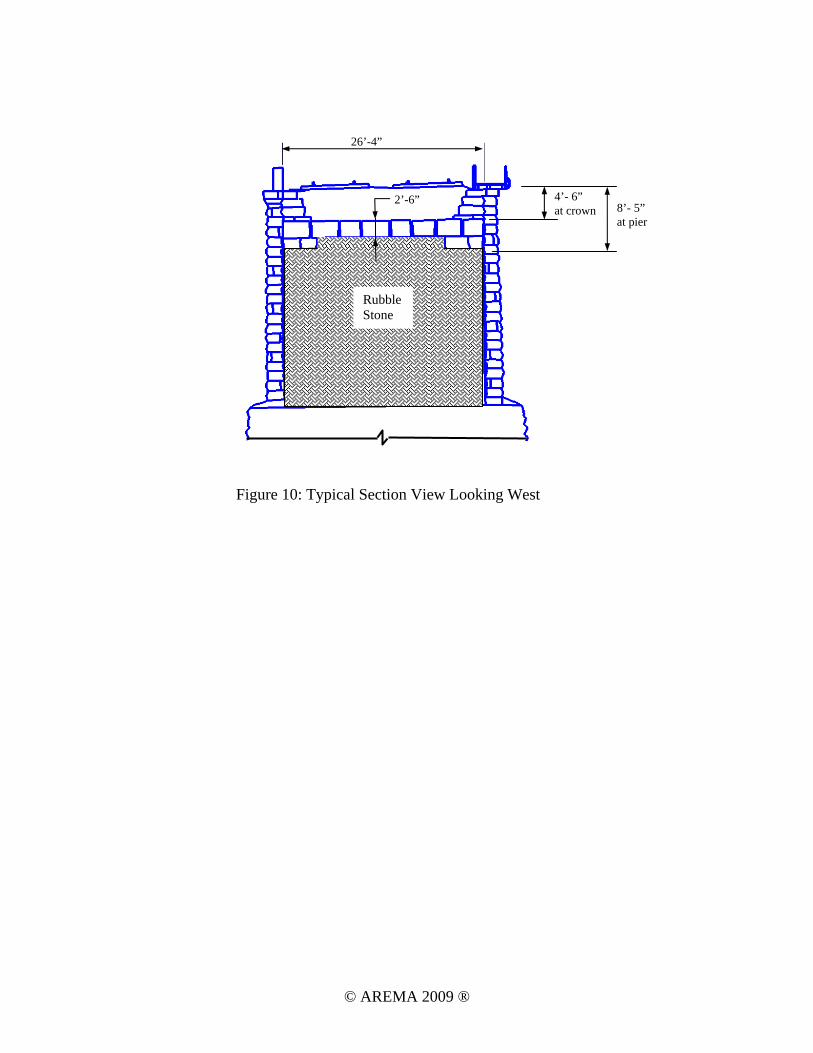
Rubble Stone
2’-6”
26’-4”
4’- 6” at crown 8’- 5”
at pier
Figure 10: Typical Section View Looking West
© AREMA 2009 ®
Y
X
Figure 11: Coordinates of 20 Nodal Points in Arch Ring
© AREMA 2009 ®
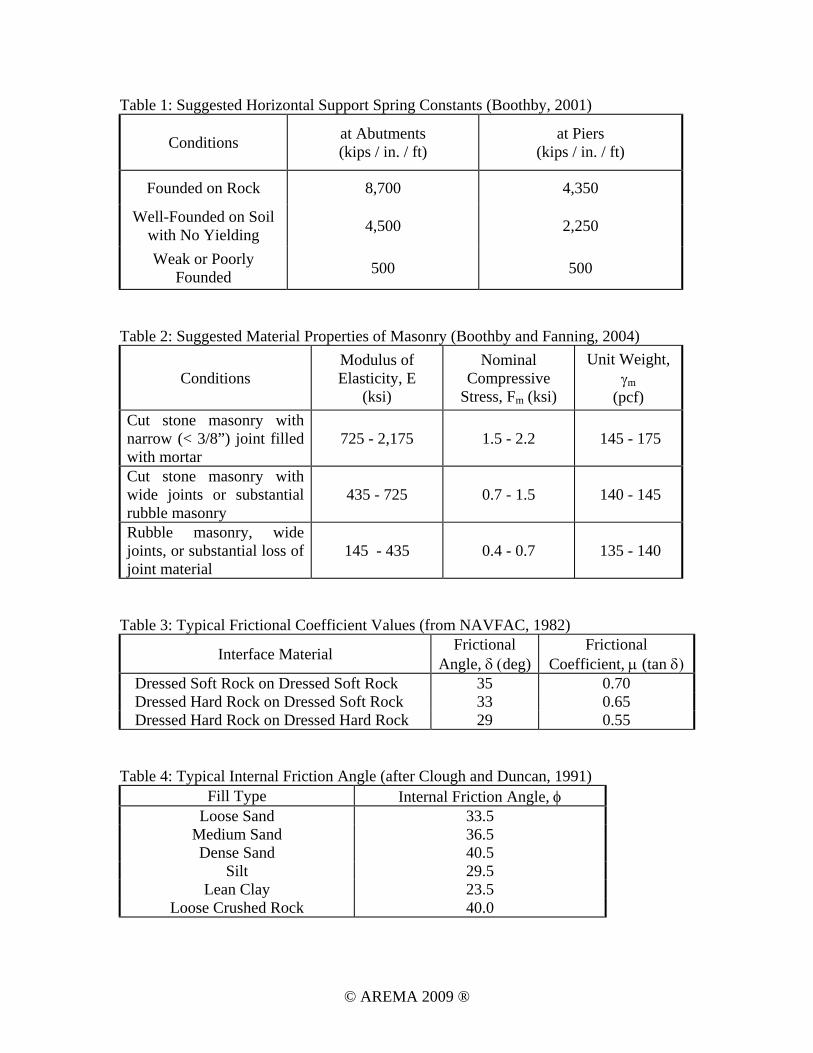
Table 1: Suggested Horizontal Support Spring Constants (Boothby, 2001)
Conditions
at Abutments (kips / in. / ft)
at Piers (kips / in. / ft)
Founded on Rock 8,700 4,350
Well-Founded on Soil with No Yielding 4,500 2,250
Weak or Poorly Founded 500 500
Table 2: Suggested Material Properties of Masonry (Boothby and Fanning, 2004)
Conditions Modulus of Elasticity, E
(ksi)
Nominal Compressive
Stress, Fm (ksi)
Unit Weight, γm
(pcf) Cut stone masonry with narrow (< 3/8”) joint filled with mortar
725 - 2,175 1.5 - 2.2 145 - 175
Cut stone masonry with wide joints or substantial rubble masonry
435 - 725 0.7 - 1.5 140 - 145
Rubble masonry, wide joints, or substantial loss of joint material
145 - 435 0.4 - 0.7 135 - 140
Table 3: Typical Frictional Coefficient Values (from NAVFAC, 1982)
Interface Material Frictional Angle, δ (deg)
Frictional Coefficient, μ (tan δ)
Dressed Soft Rock on Dressed Soft Rock 35 0.70 Dressed Hard Rock on Dressed Soft Rock 33 0.65 Dressed Hard Rock on Dressed Hard Rock 29 0.55
Table 4: Typical Internal Friction Angle (after Clough and Duncan, 1991)
Fill Type Internal Friction Angle, φ Loose Sand 33.5
Medium Sand 36.5 Dense Sand 40.5
Silt 29.5 Lean Clay 23.5
Loose Crushed Rock 40.0
© AREMA 2009 ®

Table 5: Summarized Results of Arch Ring Rating (1) Normal Rating
Φ Fm (ksi)
LFN
Cooper
E
Load LFN x 2.17 x (L+I)
Factors LFN x 1.3 x CF
P
(kips)
M
(k-ft)
e
(in.)
h
(in.)
a
(in.)
B
(in.)
fm
(ksi)
1.05 1.00 80 2.17 1.30 80.57 81.53 12.143 30.0 5.714 12.0 1.18
1.05 0.96 77 2.08 1.25 78.61 78.39 11.966 30.0 6.067 12.0 1.08
1.05 0.95 76 2.06 1.24 78.17 77.70 11.928 30.0 6.144 12.0 1.06
1.05 0.94 75 2.04 1.22 77.70 76.99 11.890 30.0 6.219 12.0 1.04
1.05 0.93 74 2.02 1.21 77.30 76.29 11.843 30.0 6.314 12.0 1.02
(2) Maximum Rating
Φ Fm (ksi)
LFM
Cooper
E
Load LFM x 1.3 x (L+I)
Factors LFM x 1.3 x CF
P
(kips)
M
(k-ft)
e
(in.)
h
(in.)
a
(in.)
B
(in.)
fm
(ksi)
1.05 1.40 112 1.82 1.82 73.45 70.15 11.461 30.0 7.078 12.0 0.86
1.05 1.50 120 1.95 1.95 76.33 74.75 11.752 30.0 6.497 12.0 0.98
1.05 1.55 124 2.02 2.02 77.88 77.23 11.900 30.0 6.200 12.0 1.05
1.05 1.60 128 2.08 2.08 79.21 79.35 12.021 30.0 5.958 12.0 1.11
© AREMA 2009 ®

Table 6: Summarized Results of Spandrel Wall Rating
At Crown At Pier
Wall Height 4’-6” 8’-5”
Vertical Force Dead Load 3.27 kips 7.66 kips
Live Load 3.20 kips 5.67 kips
Centrifugal Force 0.27 kips 0.48 kips
Horizontal Force Earth Pressure 0.30 kips 1.06 kips
Live Load Surcharge 2.11 kips 3.95 kips
Dead Load Surcharge 0.06 kips 0.10 kips
Centrifugal Force 0.18 kips 0.33 kips
Resisting Moment Dead Load 6.60 k-ft 20.32 k-ft
Live Load 10.73 k-ft 22.70 k-ft
Centrifugal Force 0.90 k-ft 1.91 k-ft
Overturning Moment Earth Pressure 0.46 k-ft 2.98 k-ft
Live Load Surcharge 4.75 k-ft 16.62 k-ft
Dead Load Surcharge 0.08 k-ft 0.36 k-ft
Centrifugal Force 0.40 k-ft 1.40 k-ft
AREMA Rating-Overturn. SLN - Nominal 1.37 (E110) 0.85 (E68)
SLM - Maximum 1.67 (E134) 1.06 (E85)
AREMA Rating-Sliding SLN - Nominal 0.99 (E79) 0.99 (E79)
SLM - Maximum 1.22 (E98) 1.24 (E99)
© AREMA 2009 ®