Embed Size (px)
Citation preview

Solar Enerey. Vol. 18. pp. 129-134. Pergamon Press 1976. Printed in Great Britain
A SIMPLE MODEL FOR ESTIMATING THE TRANSMITTANCE OF DIRECT SOLAR RADIATION
THROUGH CLEAR ATMOSPHERESt HOYT C. HOTTEL
Department of Chemical Engineering, Massachusetts Institute of Technology, Cambridge, MA 02139, U.S.A.
(Received 12 August 1975)
Abstract--The clear-day all-wavelength transmittance 7. of solar radiation directly through the 1962 standard atmosphere to a surface at altitude A is found to fit a simple mixed-gray-gas model (1 black, 1 gray, 1 clear) with a maximum error of 0.4 per cent. The relation is
7" : a o + a t e k/c,,~ z
where z is the zenith angle of the sun. The constant ao, a, and k are functions only of altitude and of haze model (visibility range). Allowance is made for the effect of four climate types (tropical, midlatitude summer and winter, and subarctic summer) by modifying the 3 constants by ratios which depend on climate type only (not on altitude or haze model) and which lie betweeo, 0.92 and 1.04. This simple model should be capable of being combined with sunshine or cloud records, plus generalizations covering diffuse radiation, to yield predictions of insolation for use in design optimizations.
INTRODUCTION
The assessment of merit of solar devices depends of course on the availability of good data on insolation. Although the most reliable predictions of performance will be based on pyranometer data taken over a period of years at the exact locale of interest, other more general approaches have merit. Several are available[l], none entirely satisfactory. One alternative approach is to estimate the transmission through clear atmosphere, modify it by allowance for cloudiness or percentage sunshine, and add an estimated diffuse component. Projections of expected insolation based on climate type, atmosheric transmittance, and earth geometry have the merit that they can be associated with known geographi- cal areas, and that they constitute simpler inputs in feasibility studies of various proposals for economic use of the sun and--a corrollary of simplicity--that they permit better generalizations to be reached concerning design optimization. It is therefore of interest to be able to determine direct transmittance through clear atmospheres as accurately and simply as possible. The objective here is to present a model which retains the accuracy achievable by rigorous spectral integration while being much simpler to use.
The Air Force-Cambridge Research Laboratories[2] have assembled data on absorption and scatter coeffi- cients of the components of the atmosphere over the wavenumber range 40,000-350cm -~ (the wavelength range 0.25-28.5/z), averaged over 20cm -~ intervals but tabulated at 5 c m ' intervals, For the 1962 Standard Atmosphere and 5 other climate types the equivalent
tPresented at the 1975 ISES International Solar Energy Congress and Exposition, Los Angeles, California (28 July-I Aug. 1975).
sea-level amount of each scattering or absorbing compo- nent has been determined for a path through the atmosphere extending from a specified altitude horizon- tally a specified distance or vertically to the top of the atmosphere; the latter is of present interest. It is to be remembered that, because of pressure broadening, a unit mass of absorber attenuates a beam more strongly when the absorber is located at sea level than at high altitude. Consequently, allowance has been made for the vertical distribution of water vapor and ozone as affected by climate type. As an example, the tropical-climate atmos- phere contains 4.2cm of precipitable moisture in a vertical path from sea level, but this is equivalent only to 3.35 cm if located at sea level. And although the first km above sea level contains but 11 per cent of the air mass, it contains 38 per cent of the effective or equivalent sea-level water vapor.
Other absorbers and scatterers are assumed to be in constant ratio independent of temperature, pressure, or climate type, but their equivalent sea level quantities must be calculated. From such data plots have been prepared by McClatchey et al.[2] which permit calculation, by a graphical method due to Altschuler [3], of monochromatic transmittance at any solar wavelength from any altitude A horizontally a specified distance, or slanting upward to the top of the atmosphere. A program, LOWTRAN 2, has been written to carry out similar calculations [4]. Figure 1, based on 581 wavelength intervals, is an example of application of the program to determine the wavelength variation of transmittance of the 1962 Standard Atmos- phere over a path length from outside the earth's atmosphere to sea level when the air mass is 2 (600 zenith angle of the sun) and the visibility is 23 km.
It is to be noted that the wavelength scale of Fig. 1 is non-linear. Figure 2, based on Thekaekara's tabulated spectral distribution of extra-terrestrial solar energy [5], is
129

130 H.C. HOTTEL
0.1 1.0 I
0 9
0.8
07
0.6
0 5
0 . 4
0 . 3
0 . 2
0 .~
b 0 0 . 3 0.4 05 0 6 0.7
Fraction of solar constant below wavelength,
0 . 2 0 . 3 0 . 4 0 .5 0 6 0 . 7 I r I i I ; I
I J t E I I I I I L 08 0.9 I0 1.2
Wavelength X , ,u.m
X
0.8 09 I0 I I I
Fig. 1. Transmittance of solar energy vs wavelength. (Receiver at sea level, zenith angle of sun 600 (Air mass 2), (Visibility 23 km).) Wavelength scale from Fig. 2. 1962 Standard Atmosphere.
1.0
.• 0.8
0 . 6
o
0 4
0 . 2
._~
Wavelength ~, #m
5
Fig. 2. Spectral distribution of extraterrestrial solar energy (from tabulation of Thekaekara [4]).
a plot, vs A, of the fraction f~ of the sun's energy lying at wavelengths less than A.t The abscissa scale of Fig. 1 is linear in fA, in consequence of which the total area under the curve--to 1 ~'~ dfx--is the direct transmittance r of the atmosphere for total solar energy, 0.476 for the present example. If ~'~ were truly a monochromatic value, changing the zenith angle of the sun to make the path length change from LI to L2 without changing A would change the effective amounts of all absorbers or scatterers by the same ratio L2/L~. Then rx.L2 = (r~.L,) L2tL', and a plot of In ~'~ vs L would be a straight line through (0,0). But the total transmittance ~- would not obey such a relation unless the atmosphere were gray.
tit is interesting to compare the Stefan-Boltzmann temperature of the sun, 5762°K (the black-body temperature of a disk subtending 0.009305 rad at the earth and yielding a solar constant of 1.353 kw/m 2) with the temperature 5612 K which a black body must have in order that half its energy is on either side of wavelength 0.7318/~m as read from Fig. 2.
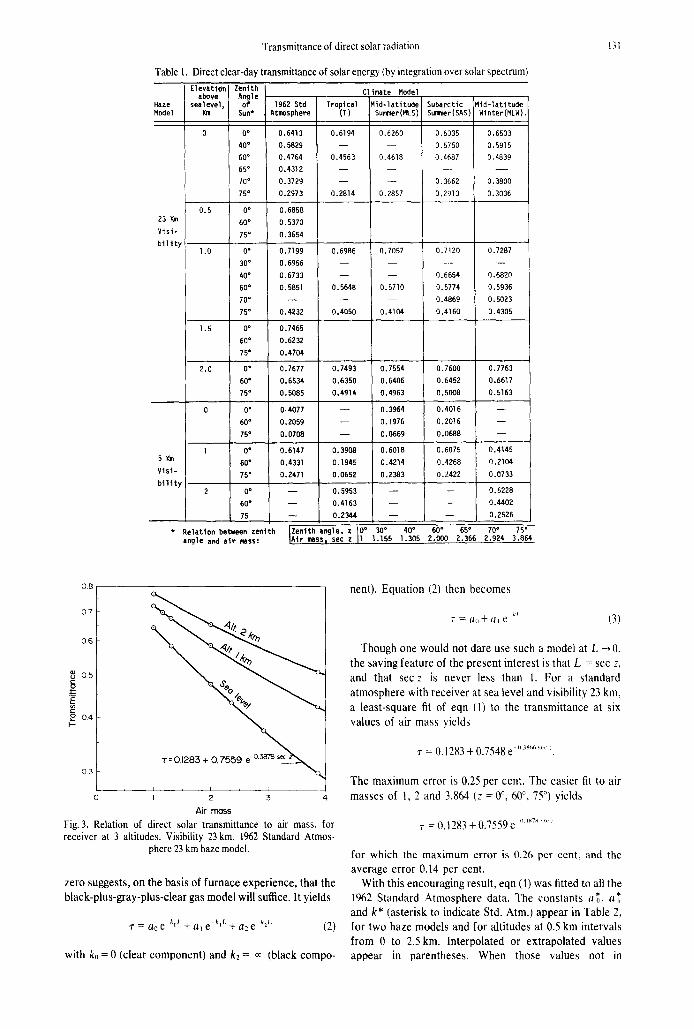
The LOWTRAN 2 program has been used here to obtain r for each of several air masses (sec z) and each of several altitudes A : each value of r required 581 z / s to permit integration. The results appear in Table 1, and Fig. 3 shows some of them plotted, ~" on a log scale vs air mass, arithmetic. The lines, as expected, are not straight. They could be represented with any desired accuracy by a power series, but a model which has had good success in representing highly non-gray combustion gases in indus- trial furnaces and in some problems in stellar radiation will require fewer constants to fit the data. That is the e-function series or mixed-gray-gas model[6], with transmittance ~" given by
) r = ~ a,e -k~L a, = 1 (1) i=O
The facts that the curvature of the lines of Fig. 3 is not great and that there is no present interest in ~- at L near
Transmittance of direct solar radiation
Table 1. Direct clear-day transmittance of solar energy (by integration over solar spectrum)
Elevation Zeni th above Angle I'
Haze sealevel~ of 1962 Std Tropical Model Km Sun* Atmosphere (T)
0 O* 0.6413 0.6194
40* 0.5829 - -
60 ° 0.4764 0.4563
65* 0.4312 - -
70* 0.3729 - -
75* 0.2973 0.2814
0.5 0* 0.6858
23 K,n 60 ° 0.5370
V l s i - 75 ° 0.3654
b i l l t y l .O 0 ° 0.7199 0.6986
30* 0.6956 - -
40* 0 . 6 7 3 3 - -
60* 0.5851 0.5648
70 ° - - - -
75* 0.4232 0.4050
1.5 0 a 0.7465
60* 0.6232
75 ° 0.4704
2.'0 0* 0.7677 0.7493
60* 0.6534 0.6350
75 ° 0.5085 0.4914
0 0* 0.4077 - -
60* 0.2059 - -
75* 0.0708 - -
1 0* 0.6147 0.3908 5 Km 60* 0.4331 0.1945
V i s i - 75" 0.2471 0.0652 b l l l t y
2 0 ° - - 0.5953
60* - - 0.4163
75 ~ 0.2344
* Relation between zenith angle and aie mass:
Climate Model
M i d - l a t i t u d e Subarct ic M i d - l a t i t u d e Summer(MLS) Summer(SAS) Winter(MLW).
0,6260 0.6335 0.6503
- - 0.5750 0.5915
0,4618 0.4687 0,4839
- - 0.3662 0.3800
0.2857 0.2913 0,3036
0.7057 0,7120 0.7287
- - 0.6654 0.6820
0.5710 0.5774 0.5936
- - 0.4869 0.5023
0.4104 0.4160 0.4305
0.7554 0.7600 0.7763
0.6406 0.6452 0.6617
0.4963 0.5008 0.5163
0.3964 0.4016 - -
0.1976 0.2016 - -
0.0669 0.0688 - -
0.6018 '0.6075 0.4145
0.4214 0.4268 0.2104
0.2383 0,2422 0.0733
- - - - 0.6228
- - - - 0.4402
- - - - 0.2526
[Zenith angle, z 10" 30* 40* 60* 65* 70* 75* 1.155 1.305 2.000 2.366 2.924 3.864
131
0 . 8
0 7
0 6
0 . 5
0 4 t--
"r- 01283 ÷ 0,7559 e - ° ' ~ a ~ _ ~ , , , ~ 0 3
I I '
0 I 2 3 4
Air m o s s
Fig. 3. Relation of direct solar transmittance to air mass, for receiver at 3 altitudes. Visibility 23 kin. 1962 Standard Atmos-
phere 23 km haze model.
zero suggests, on the basis of furnace experience, that the black-plus-gray-plus-clear gas model will sut~ce. It yields
f = ao e k,,L + a~ e -k]L + a2 e -k2L (2)
with ko = 0 (clear component) and k2 = ~ (black compo-
nent). Equation (2) then becomes
7 = a i l + ~/i e kl t3)
Though one would not dare use such a model at L ~ 0, the saving feature of the present interest is that L = sec z, and that s e c z is never less than 1. For a standard atmosphere with receiver at sea level and visibility 23 kin, a least-square fit of eqn (I) to the transmittance at six values of air mass yields
r = 0.1283 + 0.7548 e ~'~ ....... .
The maximum error is 0.25 per cent. The easier fit to air
masses of l, 2 and 3.864 (z = 0 °, 60 °, 75 °) yields
T =/I. 1283 + 0.7559 e ~ 3~7 . . . . .
for which the maximum error is 0.26 per cent, and the average error 0.14 per cent.
With this encouraging result, eqn (1) was fitted to all the 1962 Standard Atmosphere data. The constants a*, a* and k* (asterisk to indicate Std. Arm.) appear in Table 2, for two haze models and for altitudes at 0.5 km intervals from 0 to 2.5 kin. Interpolated or extrapolated values appear in parentheses. When those values not in
132 H. C. HOTTEL
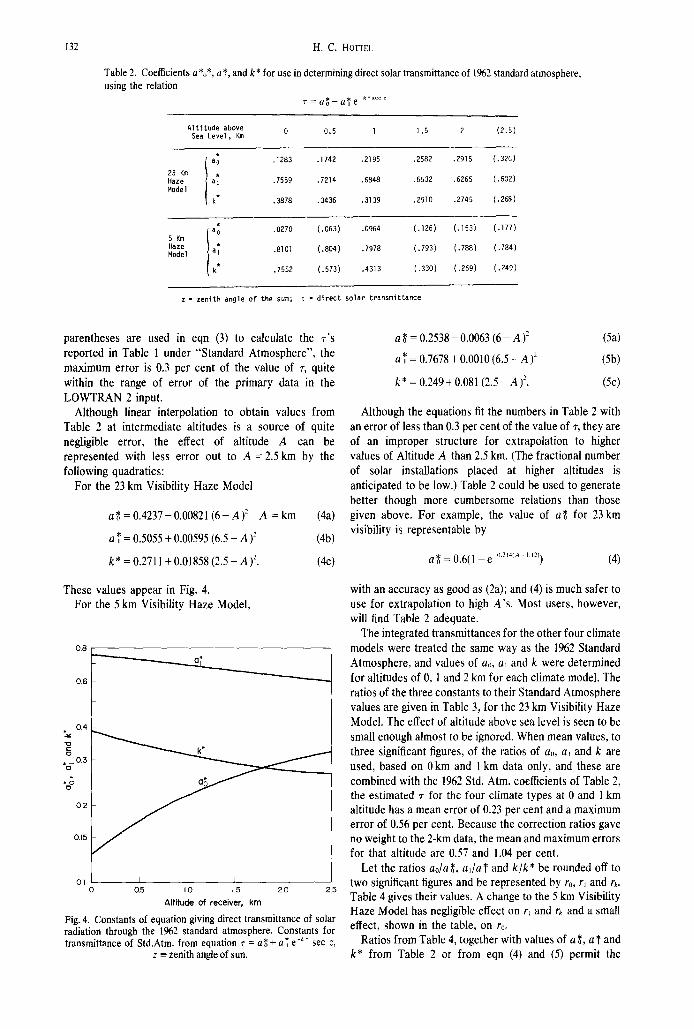
Table 2. Coefficients a %*, a *, and k* for use in determining direct solar transmittance of 1962 standard atmosphere, using the relation
~ '=a~+a*e ~ . . . . .
Altitude above 0 0.5 l 1.5 2 (2.5) Sea Level, Km
23 Km Haze Model
l a o .1283 .1742 .2195 .2582 .2915 (.326)
a I .7559 .7214 .6848 .6532 .6265 (.602)
k* .3878 .3436 .3139 .2910 .2745 (.268)
5Km Haze M o d e l
a o .0270 (.063) .0964 (.126) ( .153) (.177)
a I .8101 (.804) .7978 (.793) ( .788) (.784)
k* .7552 (.573) .4313 (.330) ( .269) (.249)
z = zenith angle of the sun; T = direct solar transmittance
parentheses are used in eqn (3) to calculate the r ' s reported in Table 1 under "Standard Atmosphere", the maximum error is 0.3 per cent of the value of r, quite within the range of error of the primary data in the LOWTRAN 2 input.
Although linear interpolation to obtain values from Table 2 at intermediate altitudes is a source of quite negligible error, the effect of altitude A can be represented with less error out to A = 2.5 km by the following quadratics:
For the 23 km Visibility Haze Model
a~=0.4237-0.00821 ( 6 - A ) 2 A =kin (4a)
a ,* = 0.5055 + 0.00595 (6.5 - A )2 (4b)
k* = 0.2711 + 0.01858 (2.5 - A )2. (4c)
These values appear in Fig. 4. For the 5 km Visibility Haze Model,
0.8
0.6
0 .4
0.1 0
*a- 03
~o
0 2
0.15
I I J I 05 1.0 1.5 2.0 2.5
Altitude of receiver, km
Fig. 4. Constants of equation giving direct transmittance of solar radiation through the 1962 standard atmosphere. Constants for transmittance of Std.Atm. from equation r = a* + a* e -k" sec z,
z ~- zenith angle of sun.
a ~ = 0.2538 - 0.0063 (6 - A )2
a * = 0.7678 + 0.0010 (6.5 - A )2
k* = 0.249+ 0.081 (2.5 - A) 2.
(5a)
(5b)
(5c)
Although the equations fit the numbers in Table 2 with an error of less than 0.3 per cent of the value of ~', they are of an improper structure for extrapolation to higher values of Altitude A than 2.5 kin. (The fractional number of solar installations placed at higher altitudes is anticipated to be low.) Table 2 could be used to generate better though more cumbersome relations than those given above. For example, the value of a~ for 23 km visibility is representable by
a ~ = 0.6(1 - e 0.214(A+,.,2)) (4)
with an accuracy as good as (2a); and (4) is much safer to use for extrapolation to high A's. Most users, however, will find Table 2 adequate.
The integrated transmittances for the other four climate models were treated the same way as the 1962 Standard Atmosphere, and values of ao, a~ and k were determined for altitudes of 0, 1 and 2 km for each climate model. The ratios of the three constants to their Standard Atmosphere values are given in Table 3, for the 23 km Visibility Haze Model. The effect of altitude above sea level is seen to be small enough almost to be ignored. When mean values, to three significant figures, of the ratios of ao, a, and k are used, based on 0 km and 1 km data only, and these are combined with the 1962 Std. Atm. coefficients of Table 2, the estimated r for the four climate types at 0 and 1 km altitude has a mean error of 0.23 per cent and a maximum error of 0.56 per cent. Because the correction ratios gave no weight to the 2-km data, the mean and maximum errors for that altitude are 0.57 and 1.04 per cent.
Let the ratios ao/aL a~/a~ and k/k* be rounded off to two significant figures and be represented by ro, r~ and rk. Table 4 gives their values. A change to the 5 km Visibility Haze Model has negligible effect on r~ and rk and a small effect, shown in the table, on ro.
Ratios from Table 4, together with values of a ~, a ~' and k* from Table 2 or from eqn (4) and (5) permit the
Transmittance of direct solar radiation 133
Table 3. Effect of climate type on the ratios of ao, a,. and k to their Standard Atmosphere values
Atmosphere El evati on, a o a 1 Type km a~ o g k*
O 0.1950 0.979 i.024 Tropical 1 0.945 0.986 1.013
2 0.970 0,986 1.024
0 0.974 0,986 1.024
M i d l a t i t u d e 1 0.969 0.990 1.017
Summer 2 0.982 0.991 1.023
0 1.049 1.007 1.005 M i d l a t i t u d e I 1.011 1.009 0.988
Winter 2 1.022 1.004 0.998
0 9.997 0.992 1.017 Subarctic 1 0.975 0.996 1.004 Summer
2 0.996 0.992 1.021
Table 4. Recommended correction factors to allow for climate type
Climate type r I Pk
Tropical
Mid-latitude Summer
Subarctic Summer
Mid-latitude Winter
rQ Z3 km 5 km
l i s ib l l i t y Visibi l i ty
0.95 0.92
0.97 0.96
0.99 0.98 1.03 1.04
ro z aola~ ; r l ~ a11a~ ; r k z k/k*
0.98
0.99
0.99
1.01
1.02
1.02
1.01
1.00
determination, through use of eqn (3), of the transmit- tance of the atmosphere for each of five climate types and two haze models, with the sun at any zenith angle from 0 to 80 o and the receiver at any altitude from sea level to 2.5 kin. The difference between values so obtained and those coming from a rigorous and time-consuming integration throughout the solar spectrum is well within the accuracy of primary data, as indicated by the
following: the use of eqn (3) to calculate f at 0 = 400 with constants from Tables 2 and 4 produces results which have average and maximum differences from the spectral integration of 0.21 per cent and 0.42 per cent at sea level, for all four climate types; 0.23 per cent and -0.43 per cent at I km altitude; 0.58 per cent and -1.14 per cent at 2 km altitude (0.4 per cent at sea level and air-mass 1.5 is equivalent to an altitude error of only 19 m). Since the
0 2 6
I ~ 0 22 o /.
0 .20
~ 0 1 8 t/ ~ t ~ 0 1 6
P 0 ~ 4
W-~ 0 [2
O tO
~oo8 c~ 006
OO4 O O2
~ 017 018 0 I I i i ~ i I I
0 0 q 0.2 0 3 0 4 0 5 0 6 0 9 I 0
(Daily direct)/(Extraterrestriul), ( H - D or tY -D) /H o
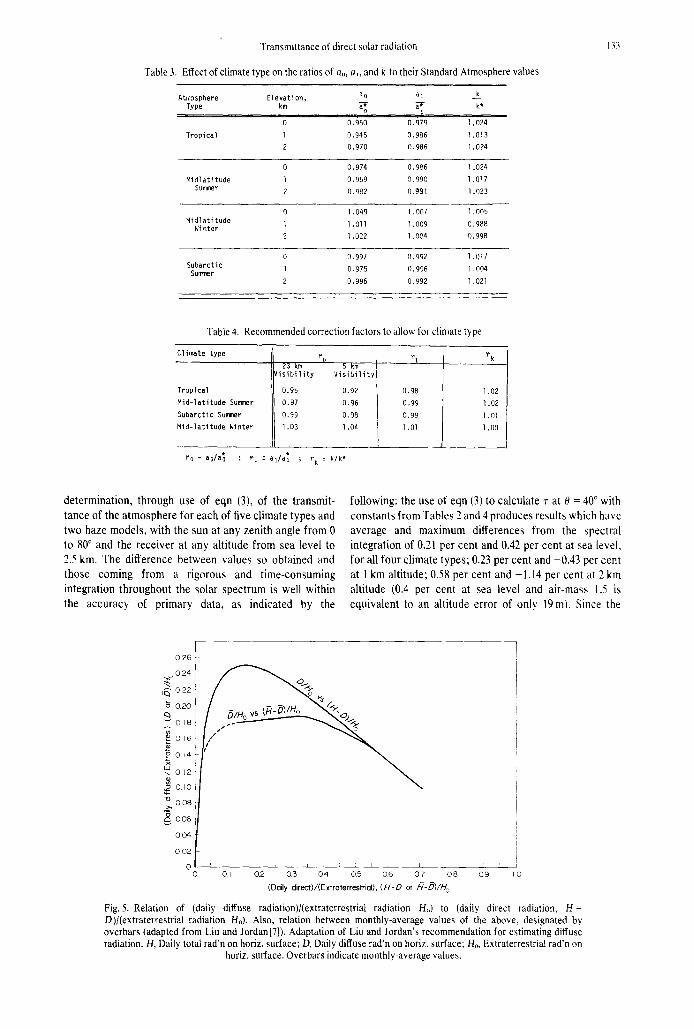
Fig. 5. Relation of (daily diffuse radiation)/(extraterrestrial radiation H,) to (daily direct radiation, H- D)/(extraterrestrial radiation Ho). Also, relation between monthly-average values of the above, designated by overbars (adapted from Liu and Jordan[7]). Adaptation of Liu and Jordan's recommendation for estimating diffuse radiation. H, Daily total rad'n on horiz, surface; D, Daily diffuse rad'n on horiz, surface: H,, Extraterrestrial rad'n on
horiz, surface. Overbars indicate monthly-average values.

134 H.C. HOTTEL
solar constant itself is not claimed to be known with an error of less than 1.5 per cent, and pyrheliometric measurements are reliable to about one per cent, it is clear that the black-plus-gray-plus-clear-gas model is an ade- quate representat ion of clear-sky transmit tance.
Although it is not the object of this paper to indicate how best to use est imates of clear-sky t ransmit tance, some comments are in order on diffuse radiation. Liu and Jordan [7] have shown the existence of a relation between the daily diffuse radiation D and the daily total radiation H on a horizontal surface, both expressed as fract ions of the daily extraterrestr ial radiation H. By generalizing the distribution of daily total around its mean value for a month, they also established a relation be tween the monthly-average D, ca l led /9 and expressed as a fract ion of Ho, and the monthly-average H, called /4 and expressed as a fract ion of/4,,. From these relations D/Ho can be expressed as a funct ion of (daily direct, H-D)/(daily extraterrestrial , Ho), analogous to the t ransmit tance ~" of this paper; D/Ho, the monthly-average fractional diffuse radiation, can similarly be expressed as a funct ion of (/4 - D)/Ho, the monthly-average fractional direct t ransmit tance. These curves appear in Fig. 4. Other useful relations are those for determining the distribution, throughout the hours of the day, of the daily total of total radiation[8] and of diffuse radiation[7] on a horizontal surface.
Time has not permit ted examinat ion of the relation between cloudiness or per cent sunshine and the direct t ransmit tance values calculated by the method developed
in the present paper. If such a relation were established, Fig. 5 and Tables 2 and 4 of the present paper would permit generat ion of a model of solar incidence as a funct ion of climate type, cloudiness or per cent sunshine, and altitude, for any latitude and season. There would be merit in expressing the per formance of solar-conversion devices in terms of such a model of solar input.
Acknowledgements--Thanks are due Mr. D. J. Conklin for ~be computations of Table 1, and to Dr. A. F. Sarofim for alway~ stimulating discussions.
R E F E R E N C E S
1. J. A. Duffle and W. A. Beckman, Solar Energy Thermal Processes, pp. 29-53. Wiley, New York (1974).
2. R. A. McClatchey, R. W. Fenn, J. E. A. Selby, F. E. Volz and J. S. Garing, Optical properties of the atmosphere (Third Edition). Air Force Cambridge Research Laboratories, AFCRL-72-0497, Environmental Research Paper No. 411 (1972).
3. T. L. Altschuler, Infrared transmission and background radiation by clear atmospheres. G. E. Report 61SD 199, AD401923 (1961).
4. J. E. Selby and R. M. McClatchey, Atmospheric transmittance from 0.25 to 28.5 ,o.m: computer code LOWTRAN-2. Air Force Cambridge Research Laboratories, AFCRL-72-0745, Environmental Research paper No. 427 (29 Dec. 1972).
5. M. P. Thekaekara, Solar energy outside the earth's atmosphere. Solar Energy 14 (2), 109 (1973).
6. H. C. Hottel and A. F. Sarofim, Radiative Transfer, pp. 247-252. McGraw-Hill, New York (1967).
7. B. V. H. Liu and R. C. Jordan, Solar Energy 4, 1 (1960). 8. H. C. Hottel and A. Whillier, Trans. Conf. on Use of Solar
Energy: The Scientific Basis, II, Pt. I, Sec. A, pp. 74--104 (1955).
Resumen--La transmitancia r de todas las longitudes de onda en dias claros de radiaci6n solar a trav6s de la atm6sfera standard de 1962 hacia la superficie a la altitud a estfi basada en un modelo simple de mezcla gris-gas (I negro, 1 gris, 1 claro) con un error m~iximo de 0,4%. Esta relaci6n es:
z = ao+a~ e -k/c°s z
donde z es el ~ingulo zenital del sol. Las constantes ao, a, y k son funciones solo de la altitud y de la turbiedad del modelo (rango de visibilidad). Modificando las 3 constantes seg~n fndices que dependen solamente del tipo de clima (tropical, verano e invierno en latitudes medias, y verano sub-artico) y que varfan entre 0,92 y 1,04 sin depender de la altitud ni de la turbiedad, se tiene en cuenta el efecto de cuatro tipos distintos de clima. Este modelo simple podr/a ser capaz, combinS.ndolo con registros de heliofanfa o nubosidad y generalizaciones que cubran la radiaci6n difusa, de predecir la insolaci6n para su uso en optimizaci6n de disefios.
R6sum6--La ransmittance d'une atmosphere standard 1962, pour le rayonnement solaire de toutes longueurs d'onde parvenant par jour clair sur une surface ~ ?altitude A, est trouvd correspondre ~, un module simple de m61ange de gaz gris (1 noir, I gris, 1 clair) avec une erreur maximum de 0,4%. La relation est:
,r = a o + a l e k/cosz
ofl zest l'angle z6nithal du soleil. Les constantes ao, a~ et k, sont seulement fonction de l'altitude et du mod/~le de brume (domaine de visibilitd) On tient compte de l'effet de quatre climats types (tropical, 6t~ et hiver en latitude moyenne, dtd subartique) en modifiant les trois constantes par des rapports qui d6pendent seulement du type de climat (et non de l'altitude et du mod61e de brume) et qui se situent entre 0,92 et 1,04. Ce mod61e simple devrait 6tre susceptible d'6tre combing avec les enregistrements d'ensoleillement et de ndbulosit6, ainsi qu'avec des gdn6ralisations comportant le rayonnement diffus, pour permettre des pr6dictions d'ensoleillement utilisables dans l'optimisation des concepts.