Embed Size (px)
Citation preview
You et al. BMC Bioinformatics 2010, 11:343http://www.biomedcentral.com/1471-2105/11/343
Open AccessR E S E A R C H A R T I C L E
Research articleA semi-supervised learning approach to predict synthetic genetic interactions by combining functional and topological properties of functional gene networkZhu-Hong You1,2,3, Zheng Yin3, Kyungsook Han4, De-Shuang Huang*1 and Xiaobo Zhou*3
AbstractBackground: Genetic interaction profiles are highly informative and helpful for understanding the functional linkages between genes, and therefore have been extensively exploited for annotating gene functions and dissecting specific pathway structures. However, our understanding is rather limited to the relationship between double concurrent perturbation and various higher level phenotypic changes, e.g. those in cells, tissues or organs. Modifier screens, such as synthetic genetic arrays (SGA) can help us to understand the phenotype caused by combined gene mutations. Unfortunately, exhaustive tests on all possible combined mutations in any genome are vulnerable to combinatorial explosion and are infeasible either technically or financially. Therefore, an accurate computational approach to predict genetic interaction is highly desirable, and such methods have the potential of alleviating the bottleneck on experiment design.
Results: In this work, we introduce a computational systems biology approach for the accurate prediction of pairwise synthetic genetic interactions (SGI). First, a high-coverage and high-precision functional gene network (FGN) is constructed by integrating protein-protein interaction (PPI), protein complex and gene expression data; then, a graph-based semi-supervised learning (SSL) classifier is utilized to identify SGI, where the topological properties of protein pairs in weighted FGN is used as input features of the classifier. We compare the proposed SSL method with the state-of-the-art supervised classifier, the support vector machines (SVM), on a benchmark dataset in S. cerevisiae to validate our method's ability to distinguish synthetic genetic interactions from non-interaction gene pairs. Experimental results show that the proposed method can accurately predict genetic interactions in S. cerevisiae (with a sensitivity of 92% and specificity of 91%). Noticeably, the SSL method is more efficient than SVM, especially for very small training sets and large test sets.
Conclusions: We developed a graph-based SSL classifier for predicting the SGI. The classifier employs topological properties of weighted FGN as input features and simultaneously employs information induced from labelled and unlabelled data. Our analysis indicates that the topological properties of weighted FGN can be employed to accurately predict SGI. Also, the graph-based SSL method outperforms the traditional standard supervised approach, especially when used with small training sets. The proposed method can alleviate experimental burden of exhaustive test and provide a useful guide for the biologist in narrowing down the candidate gene pairs with SGI. The data and source code implementing the method are available from the website: http://home.ustc.edu.cn/~yzh33108/GeneticInterPred.htm
* Correspondence: [email protected], [email protected] Intelligent Computing Lab, Institute of Intelligent Machine, Chinese Academy of Science, P.O. Box 1130, Hefei, Anhui 230031, China3 The Methodist Hospital Research Institute, Weil Medical College, Cornell University, Houston, TX 77030, USAFull list of author information is available at the end of the article
© 2010 You et al; licensee BioMed Central Ltd. This is an Open Access article distributed under the terms of the Creative Commons At-tribution License (http://creativecommons.org/licenses/by/2.0), which permits unrestricted use, distribution, and reproduction in anymedium, provided the original work is properly cited.
You et al. BMC Bioinformatics 2010, 11:343http://www.biomedcentral.com/1471-2105/11/343
Page 2 of 13
BackgroundGenetic interaction analysis, in which two mutationshave a combined effect not exhibited by either mutationalone, can reveal functional relationship between genesand pathways, and thus have been used extensively toshed light on pathway organization in model organisms[1,2]. For example, proteins in the same pathway tend toshare similar synthetic lethal partners [3]. Given a pair ofgenes, the number of common genetic interaction part-ners of these two genes can be used to calculate the prob-ability that they have physical interaction or share abiological function. Therefore, identifying gene pairswhich participate in synthetic genetic interaction (SGI) isvery important for understanding cellular interaction anddetermining functional relationships between genes.Usually, SGI includes synthetic lethal (SL, where simulta-neous mutation, usually deletion, on both genes causeslethality while mutation on either gene alone does not)and synthetic sick (SS, where simultaneous mutation oftwo genes causes growth retardation) interactions. How-ever, so far little is known about how genes interact toproduce more complicated phenotypes like the morpho-logical variations.
Recently, modifier screening such as synthetic geneticarrays (SGA) has been applied to experimentally test thephenotype of all double concurrent perturbation to iden-tify whether gene pairs have SGI [3]. Although high-throughput SGA technology has enabled systematic con-struction of double concurrent perturbation in manyorganisms, it remains difficult and expensive to experi-mentally map out pairwise genetic interactions forgenome-wide analysis in any single organism. For exam-ple, the genome of S. cerevisiae includes about 6,275genes. About 18 million double mutants need to be testedif the analysis is carried out based on their combinatorialnature. This number will expand to about 200 million forthe simple metazoan C. elegans (with ~20,000 genes),posing insurmountable technical and financial obstacles.
Therefore, many computational methods for predictingSGI have been proposed in previous works in order toalleviate the experimental bottleneck [4,5]. A promisingsolution is to predict the SGI by integrating various typesof available proteomics and genomics data. Candidategene pairs with SGI are computationally predicted andvalidated experimentally. In [4], SS or SL gene pairs inS.cerevisiae are successfully predicted, with 80% of theinteractions being discovered by testing 20% of all possi-ble combinations of gene pairs. Various supervised algo-rithms, such as artificial neural network, SVM anddecision tree, have been developed to tackle the syntheticgenetic interaction prediction problem [4,6]. In spite ofbeing able to handle large input spaces and deal withnoisy samples in an efficient and robust way, a main diffi-culty facing all supervised methods is that they predict
the SGI only from labelled samples and the learning pro-cess heavily relies on the quality of the training dataset[7]. For example, in [4] about 519,647 experimentallytested gene pairs of S. cerevisiae are adopted as trainingdataset, which is impossible in most cases.
Usually, obtaining labelled samples is much more diffi-cult than getting unlabelled samples. When the size ofavailable training set is small, traditional approachesbased on supervised learning may fail. Worse still, experi-ment-supported genetic interactions gene pairs are farmore less in metazoans than in S. cerevisiae, thus it ismore difficult in metazoans to generate genome-widepredictions by using supervised algorithms. Therefore, itis desirable to develop a predictive learning algorithmusing both labelled and unlabelled samples. In this con-text, it becomes natural that semi-supervised classifiersare employed. SSL classifier uses available label informa-tion as well as the wealth of unlabelled data as the inputvector. We propose a graph-based SSL method, previ-ously presented in [8], in the context of SGI prediction.One advantage of SSL is the compatibility to small train-ing sets, thus it could have great potentials in organisms,especially metazoans with less experiment-supportedgenetic interaction gene pairs. We concentrate on graph-based method due to their solid mathematical back-ground, as well as the close relationship with kernelmethods and model visualization.
In recent years, it has been a growing and hot topic tocombine information from diverse genomic or proteomicevidence in order to arrive at accurate and holistic net-work [9-13]. The heterogeneous data sources, in one wayor the other, carry interaction information reflecting dif-ferent aspects of gene associations and their functionrelationships. Therefore, one of the major challenges is tointegrate these data sources and obtain a system levelview on functional relationships between genes [14]. Thesuccessful applications have proved that an integration ofheterogeneous types of high-throughput biological datacan improve the accuracy of the groupings comparedwith any single dataset alone [10,15-19]. However, despitethe success of integrated networks in other area [10],most previous works on synthetic genetic interactionprediction mainly consider PPI or gene expression dataalone [20-22].
In this study, we integrate PPI, protein complex andgene expression data simultaneously to utilize moreinformation for more accuracy of genetic interaction pre-diction taking the following observations into consider-ation. PPI data is believed to contain valuable insight forthe inner working of cells. Therefore, it may provide use-ful clues for the function of individual protein or signal-ling pathways [23,24]. Although it is unclear whichproteins are in physical contact, protein complexesinclude groups of proteins perform a certain cellular task
You et al. BMC Bioinformatics 2010, 11:343http://www.biomedcentral.com/1471-2105/11/343
Page 3 of 13
together and contain rich information about functionalrelationships among the involved proteins. The high-throughput gene expression profiles are becoming essen-tial resources for systems-level understanding of geneticinteraction [25-28]. Gene expression profiles measure theexpression levels of certain genes in genome scale. Rela-tive to randomly paired genes, functionally interactinggenes are more likely to have similar expression patternsand phenotypes [5,29,30]. It is assumed that genes withsimilar expression profiles are involved in the control ofthe same transcriptional factors and thus they are func-tionally associated [25,31].
Network analysis is a quantitative method originatingfrom the social science; it studies the nodes' topologyproperties related to its connectivity and position in thenetwork. It has become increasingly popular in diverseareas, especially in molecular biology and computationalbiology [9,32]. Network analysis is a powerful tool forstudying the relationships between two nodes in a net-work. It has been proved in recent work that geneticinteractions are more likely to be found among proteinsthat are highly connected and highly central in proteininteraction network [33]. This finding demonstrates thecorrelations between topological properties of PPI net-work and SGI between proteins. In this study, we studythe extent to which pairwise SGI can be predicted fromthe topological properties of the corresponding proteinsin a FGN.
In previous works, they only consider the topologicalproperties of the binary protein interaction networkwhile ignore the underlying functional relationshipswhich can be reflected by the gene expression profile[4,20]. A major limitation of these methods stems fromthe fact that the weight of ties is not taken into account.For FGN, the weights often reflect the function similarityperformed by the ties. Exploring the information thatweights hold allows us to further our understanding ofnetworks [34,35]. In this paper, we also present a straight-forward generalization of a number of weighed networkproperties which originally defined on the unweightednetworks. Concretely, the weighted network propertiesare defined by combining weighted and topologicalobservables that enable us to characterize the complexstatistical properties and heterogeneity of the actualweight of edges and nodes. This information allows us toinvestigate the correlations among weighted quantitiesand the underlying topological structure of the network.The topological properties of the FGN are examined withthe aim of discovering the relationship between the net-work properties of gene pairs and the existence of a SGIrelationship.
ResultsGeneral approachThe aim of the proposed approach is to predict geneticinteractions in Saccharomyces cerevisiae using topologi-cal properties of two proteins in a weighted functionalgene network. The first input feature vector for the algo-rithm is a set of network properties corresponding topairwise genes. The second input is a set of syntheticgenetic interaction and non-interaction pairs found fromprevious large scale mutant screens. The output of thisapproach is scores corresponding to the propensity of aparticular gene pair to be synthetic genetic interaction.The overall workflow is illustrated in Figure 1.
We can see from Fig. 1 that PPI data, protein complexdata, and gene expression profiles are integrated to builda high coverage and high precision weighted FGN. Morespecifically, PPI and protein complex data are used todetermine the topology of the network. Then a clusteringanalysis method is utilized to identify functionally relatedgroups from the gene expression profile and the weightsof the interaction are calculated based on the geneexpression profile and clustering centroids, i.e. the weightof a PPI network derives from a metric considering thedistance of expression of individual gene and the cen-troids of its cluster, as well as the distance between thetwo cluster centroids themselves. The weights areassigned as the confidence scores which represents theirfunctional coupling. Considering weights of interactionsinstead of binary linkage information allows more accu-rate modelling and will have better classification perfor-mance [15,17].
And then, a set of topological properties are extractedfrom the FGN. These network properties and the experi-mentally obtained gene pairs which have been confirmedto have or do not have the synthetic genetic interactionare considered as an input vector of a SSL classifier topredict other unknown interacting gene pairs. Con-cretely, we use a SSL classifier to model correlationsbetween network properties and the existence of a SGI.The output labels of the SSL classifier are soft labels yi [0, 1], which measure if the two corresponding genes par-ticipate in a SGI. The details of above procedure aredescribed in the method section.
Cross validationPerformance comparisons are based on the followingCross Validation (CV) procedures. CV is a way of choos-ing proper benchmarking samples to assess the accuracyand validity of a statistical model. Specifically, we ran-domly select 1,500 known SGI pairs and 1,500 non-SGIpairs from the dataset provided by Tong et al [3]. Thus,the sampled dataset contain an equal number of SGI and
You et al. BMC Bioinformatics 2010, 11:343http://www.biomedcentral.com/1471-2105/11/343
Page 4 of 13
non-SGI gene pairs. In n - fold CV, we randomly dividethe known SGI pairs into n subsets of approximatelyequal size. Equal number of non-SGI pairs correspondingto above n divided subsets are randomly selected andassigned to the n subsets. Then n - 1 such subsets arecombined for training the classifier, which is subse-quently tested on all other SGI and non-SGI pairs fromthe withheld subset. This procedure is repeated n timeswith each subset playing the role of the test subset once.
We use the standard Receiver Operating Curve (ROC)to assess performance overall. We compute the sensitivity(or true-positive rate, defined here as the fraction of SGIgene pairs correctly predicted) and false-positive (definedhere as the fraction of non-SGI gene pairs incorrectly pre-dicted to be SGI) by decreasing stringency levels of theclassifier (outputs soft labels). By using alternative scorethresholds, this approach can be tuned to predict a subsetof SGI with higher confidence at a small cost of sensitiv-ity.
Experiment resultsSVM has emerged as one of the most popular supervisedapproaches with a wide range of applications. In particu-lar, the previous studies have demonstrated that SVM hasbetter learning performance and accuracy than othersupervised algorithms, such as Artificial Neural Networkand Decision Trees [36]. Therefore, in this study weimplemented our graph-based SSL algorithm and com-pared it with the SVM in distinguishing SGI versus non-SGI gene pairs on the same benchmark dataset. We testthe capability of our method using different levels of spar-sity of training set. In the experiment, 80% (5-fold CV),50% (2-fold CV), and 20% of the known SGI and non-SGIgene pairs are randomly chosen for training the classifierrespectively, which was subsequently tested on all otherSGI and non-SGI gene pairs from the withheld group(This is repeated several times with each group playingthe role of the test group at least one time). Since the genepairs to be classified for cross-validation are randomlychosen, we repeated each experiment five times and com-puted the average of all the results.
Figure 2 shows a comparison result between SSL algo-rithm and SVM method when 20% of gene pairs areassumed to be unlabelled. Figures 3, 4 demonstrate theperformance of the two tested algorithms when 50% and80% of gene pairs are assumed to be unlabelled respec-tively. The proposed SSL algorithm outperforms SVM inalmost all the range of threshold. In particular, we can seefrom Figure 2 that when 20% of nodes are unlabelled,SVM has a slightly better performance in the first part ofthe ROC curve while SSL achieves better results in otherpart. Conversely, when 80% of nodes are unlabelled, SSL
shows much higher accuracy than SVM (see Figure 4). Insummary, the accuracy of SSL appears higher than that ofSVM classifier. Further, when labelled nodes in trainingdataset are very small, the performance of SSL is signifi-cantly better than that of SVM. SSL method can reach atrue positive rate of 92% against a false positive rate of 9%accuracy at a maximum in our experiment. However,Wong et al [4] reported that they predicted SSL genepairs in S. cerevisiae with a success rate such that 80% ofthe interactions are discovered by testing <20% of thepairs. Our algorithm has higher accuracy than theirmethod. Moreover, our approach only depends on pro-tein interaction data and gene expression data, and doesnot require other data source like genomic sequence data.Our results clearly demonstrate that the FGN integratingof proteome and genomic data can be used to predict theSGI. We exhibit that the topological properties of FGNfor pairwise genes serve as compelling and relativelyrobust determinants for the existence of synthetic geneticinteraction between genes.
As a supplementary result we also compare the perfor-mance of proposed method on the same training datasetbetween the weighted network and binary network. Thebinary network is constructed by combining PPI and pro-tein complex data. From Figure 5, we can see that theweighted network has higher performance than that ofbinary network in almost all the range of threshold. Webelieve this is because for binary network the weights ofinteractions are not taken into account and the informa-tion that weights hold is not employed.
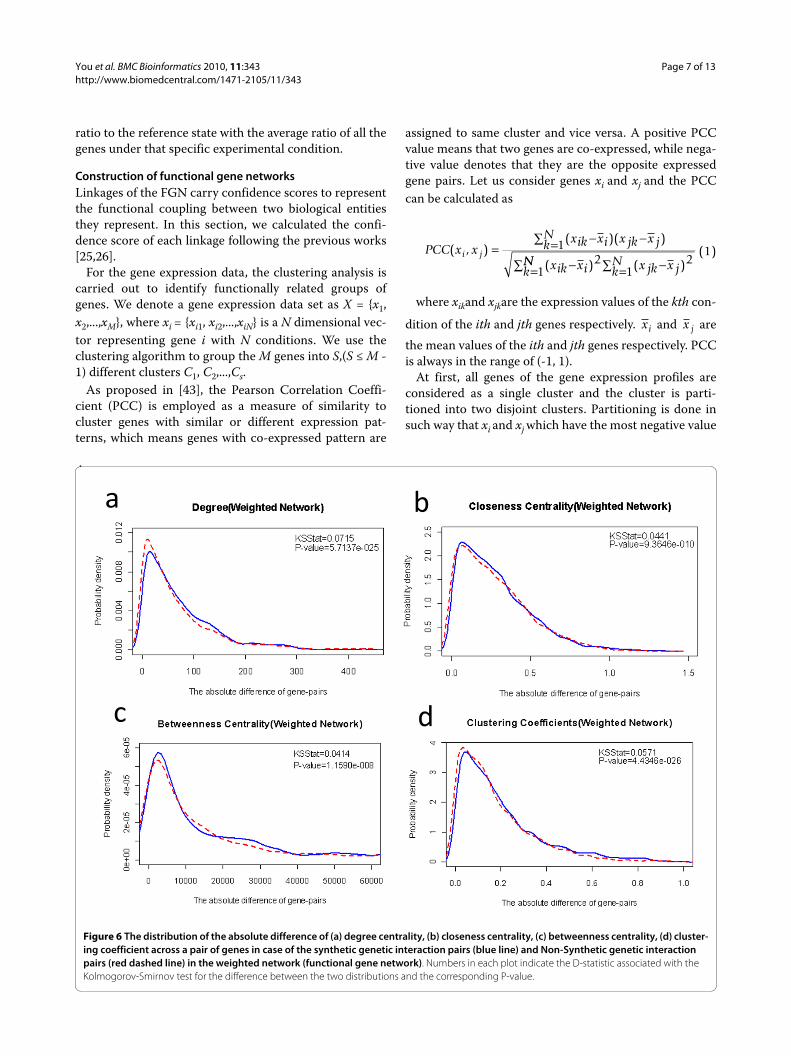
DiscussionIn order to assess the suitability of using certain networkproperties to classify SGI gene pairs and non-SGI pairs,we draw the distributions of probability density for theseproperties across SGI pairs and non-SGI pairs, respec-tively. To make it simple, we just give detailed descriptionof four network properties, such as centrality degree,betweenness centrality, closeness centrality and cluster-ing coefficient. For each property, we plot the distributionof the average value over pairwise genes and the absolutedifference across the two genes. For most properties here,the difference in distribution of probability density acrossSGI and non-SGI pairs is statistically significant (seeAdditional file 1 Figure S1-S16). The distributions of theaverage and difference value of each property across twoproteins in case of SGI pairs (blue lines) and non-SGIpairs (red lines) are displayed in figure 6.
We used the Kolmogorov-Smirnov (K-S) test to com-pare the two distributions. The null hypothesis is that thetwo distributions are from the same continuous distribu-tion. The alternative hypothesis is that they are from dif-

You et al. BMC Bioinformatics 2010, 11:343http://www.biomedcentral.com/1471-2105/11/343
Page 5 of 13
ferent continuous distributions. The major contributionof K-S test is that no distribution assumption is neededfor the data. As shown in Table 1 that all the P-values ofthe KS-test are less than 0.05. From Additional file 1 Fig-ure S17-S32, we can see that the empirical distributionsof cumulative function across SGI and non-SGI pairs arealso different. According to the result, the differencebetween SGI and non-SGI samples is significant enough.Also when viewed as part of a FGN, comparing with non-SGI pairs, SGI pairs tends to have higher average degree,higher average closeness centrality. We also compared theKS-test performance in weighted FGN and binary net-work. We can see from Table 1 that the P-values of allnetwork properties in weighted network are much lessthan those in binary network.
ConclusionsIn conclusion, a SSL prediction approach was proposedin this paper to predict SGI by combining functional andtopological properties of FGN. Using a clustering-baseddata integration method, large-scale protein interactiondata, protein complex data and multiple time-course geneexpression datasets were combined in order to build FGNin yeast. Greater coverage and higher accuracy wereachieved in comparison with previous high-throughputstudies of PPI networks in yeast. Then, we show thattopological properties of protein pairs in a FGN can beserved as compelling and relatively robust determinantsfor the existence of synthetic genetic interaction betweenthem. Finally, a graph-based SSL is utilized as a classifierto model correlations between FGN properties and theexistence of a synthetic genetic interaction.
Our results clearly demonstrate that the proposed algo-rithm can achieve better performance comparing withprevious methods. Our framework of feature representa-tion is a general form, and it is straightforward to addother topological properties that are relevant to thisproblem. It is also possible to add other types of biologi-cal evidences. For example, information about the func-tion of proteins can be encoded in our framework as well.We hope to extend this work and improve feature repre-sentation in future so that we can detect other types ofinteraction groups.
Figure 2 Comparison of the ROC curves for Semi-supervised learning and SVM algorithm (unknown genetic interaction and non-interaction gene pairs: 20%). The horizontal axis is 1-Specificity and vertical axis is the corresponding Sensitivity. The diagonal line de-notes random prediction.
Figure 1 Schematic diagram for predicting the synthetic genetic interaction. The simplest case of a synthetic genetic interaction and non-inter-action involving two genes is shown (See low left corner of Fig. 1). The green and purple nodes denote two different genes. The node with cross inside means it is knocked out and vice versa. Here, two single deletions would not result in cell mortality but would result in a "synthetic" lethality pheno-type. Hit gene pair means mutations in both of these two genes would result in a "synthetic" lethality phenotype.
PPI data(BioGrid)
Semi-supervised learning
Known double knock out data provide hit and non-hit gene pair
The degree
………………
Clustering Coefficient
Stress Centrality
Shortest distance
Mutual neighbor #
Step depth length Microarray
data
ProteinComplex
Weighted Network f1
f2
f3
f4
f5
f6
fN
Samples:[S1,S2,.,SM]
Each sample:[f1
g1, f1g2,.. fN
g2]
Features of each gene or gene pair
Network Graphical Properties
Non-hit
Hit
Each gene pair g1, g2 as a sample
g1 g2

You et al. BMC Bioinformatics 2010, 11:343http://www.biomedcentral.com/1471-2105/11/343
Page 6 of 13
MethodsBiological datasetsThere are four different types of data sets used in thestudy. 1) Golden standard dataset of known genetic inter-actions (True positives, TPs) and non-interacting proteinpairs (True negatives, TNs). 2) Experimental protein-pro-tein interaction data. 3) Experimental protein complexdata. 4) Time-lapse gene expression profiles.Golden standard genetic interaction datasetUsing the Synthetic Genetic Array (SGA) technology,Tong et al. screened 132 query strains (carrying muta-tions in genes with diverse functions in cell polarity, cellwall biosynthesis, chromosome segregation and DNA
synthesis and repair) against the complete library of~4700 viable haploid deletion strains, and ~650,000 genepairs were experimentally tested and identified a total of~4,000 synthetic lethal synthetic sick interactions, at0.65% frequency [3]. We used this dataset as golden stan-dard dataset to investigate synthetic genetic interaction inS. cerevisiae.Protein-protein interaction datasetTo computer network properties associated with protein-protein interaction in S. Cerevisiae, we download proteininteraction data from the BioGrid database [37]. This net-work contains 12,990 unique interactions among 4,478proteins.Protein complexes datasetFor protein complex, we assigned binary interactionsbetween any two proteins participating in a complex.Thus in general, if there are n proteins in a protein com-plex, we add n(n - 1)/2 binary interactions. We get theprotein complex data from [38,39]. Altogether about49,000 interactions are added to the protein interactionnetwork.Microarray gene expression dataFour sets of time course data from the DNA microarrayof S. cerevisiae are used in this study. These datasets havealso been used to study the genetic interactions in previ-ous work [40]. The first set contains 17 time points dur-ing the mitotic cell cycle [41]. The second set contains 6time points during heat shock and the third set contains 9time points during sporulation [31], and the fourth setcontains 32 time points during cell cycle [42]. Altogether64 experimental conditions for all the genes in S. cerevi-siae related to cell cycle are used. For the missing valuesin each experiment, we substituted its gene expression
Figure 3 Comparison of the ROC curves for Semi-supervised learning and SVM algorithm (unknown genetic interaction and non-interaction gene pairs: 50%). The horizontal axis is 1-Specificity and vertical axis is the corresponding Sensitivity. The diagonal line de-notes random prediction.
Figure 4 Comparison of the ROC curves for Semi-supervised learning and SVM algorithm (unknown genetic interaction and non-interaction gene pairs: 80%). The horizontal axis is 1-Specificity and vertical axis is the corresponding Sensitivity. The diagonal line de-notes random prediction.
Figure 5 Semi-supervised Learning performance comparison be-tween the weighted functional gene network and the binary net-work (unknown genetic interaction and non-interaction gene pairs: 50%). The horizontal axis is 1-Specificity and vertical axis is the corresponding Sensitivity. The diagonal line denotes random predic-tion.
You et al. BMC Bioinformatics 2010, 11:343http://www.biomedcentral.com/1471-2105/11/343
Page 7 of 13
ratio to the reference state with the average ratio of all thegenes under that specific experimental condition.
Construction of functional gene networksLinkages of the FGN carry confidence scores to representthe functional coupling between two biological entitiesthey represent. In this section, we calculated the confi-dence score of each linkage following the previous works[25,26].
For the gene expression data, the clustering analysis iscarried out to identify functionally related groups ofgenes. We denote a gene expression data set as X = {x1,x2,...,xM}, where xi = {xi1, xi2,...,xiN} is a N dimensional vec-tor representing gene i with N conditions. We use theclustering algorithm to group the M genes into S,(S ≤ M -1) different clusters C1, C2,...,Cs.
As proposed in [43], the Pearson Correlation Coeffi-cient (PCC) is employed as a measure of similarity tocluster genes with similar or different expression pat-terns, which means genes with co-expressed pattern are
assigned to same cluster and vice versa. A positive PCCvalue means that two genes are co-expressed, while nega-tive value denotes that they are the opposite expressedgene pairs. Let us consider genes xi and xj and the PCCcan be calculated as
where xikand xjkare the expression values of the kth con-
dition of the ith and jth genes respectively. and arethe mean values of the ith and jth genes respectively. PCCis always in the range of (-1, 1).
At first, all genes of the gene expression profiles areconsidered as a single cluster and the cluster is parti-tioned into two disjoint clusters. Partitioning is done insuch way that xi and xj which have the most negative value
PCC x xxik xi x jk x jk
N
xik xi x jk x jkN
k
i j( , )( )( )
( ) ( )=
− −=∑
− −=∑=
12 2
11NN∑
(1)
xi x j
Figure 6 The distribution of the absolute difference of (a) degree centrality, (b) closeness centrality, (c) betweenness centrality, (d) cluster-ing coefficient across a pair of genes in case of the synthetic genetic interaction pairs (blue line) and Non-Synthetic genetic interaction pairs (red dashed line) in the weighted network (functional gene network). Numbers in each plot indicate the D-statistic associated with the Kolmogorov-Smirnov test for the difference between the two distributions and the corresponding P-value.
a b
c d

You et al. BMC Bioinformatics 2010, 11:343http://www.biomedcentral.com/1471-2105/11/343
Page 8 of 13
of PCC will be assigned into two different clusters. Geneshaving larger PCC value with xi compared with xj areassigned in the cluster that contains xi. Otherwise, theyare placed in the cluster that contains xj. In the next itera-tion, a cluster having a gene pair (xi, xj) with the mostnegative PCC value will be selected and the above parti-tioning procession is repeated until there is no negativePCC value present between any pair of genes inside anycluster. This kind of cluster method ensures that all pairsof genes in any cluster are only positively correlated. Ithas been proven that this method is able to obtain clus-ters with higher biological significance than that obtainedby some other algorithms such as Fuzzy K-means, GKand PAM clustering methods [43].
Based on the above obtained gene expression profilewhich has been partitioned into a couple of clusters, wecalculate the weighted confidence scores of the interac-tions between two proteins as below:
where xi and xj represent genes i and j with N conditions
respectively. and denote the centroids of the
clusters in which genes xi and xj located respectively. ||·||2
denotes the Euclidean distance. In equation (2), the con-stant L1 is a tradeoff parameter used to tune the ratio ofthe first and second term in the weight function. Accord-ing to [44], we choose L1 = 0.3 because we assume that thedistance between centroids of two cluster more signifi-cant comparing with the distance of each gene from itscentroid. The outcome of the integration method is aweighted undirected graph, i.e. functional gene network.
The properties of functional gene network for predicting SGIFor using as input feature vector of the SSL classifier, wecompute the following topological properties of FGN foreach protein or protein pair. Here we report a total of 18features representing 10 network properties. These net-work properties reflect the local connectivity and globalposition of the nodes in the network and are assumed tobe correlated to its functional properties. Table 2 lists the10 types of topological properties used in this paper. Thedetails can be seen as below.(1) Centrality degreeA network can be expressed by its adjacency matrix aij,whose elements take the value 1 if an edge connects thenode vi to the node vj and 0 otherwise. In an unweightedgraph, the degree of node vx is equivalent to the numberof neighbors of node vx , which can be denoted as
W x x L x C x C
L C C
i j i x j x
x x
i j
i j
, - -
( - ) -
( ) = × +⎛⎝⎜
⎞⎠⎟
+ ×
12 2
1
21
(2)
CxiCx j
Table 1: The statistics of network properties for SGI vs. non-SGI gene pairs
Gene pair characteristic KSStat P-value
BinaryNetwork
WeightedNetwork
BinaryNetwork
WeightedNetwork
Average Degree 0.0364 0.0261 0.9 0.0011
Closeness 0.0212 0.0385 0.0108 1.48E-07
Betweenness 0.0319 0.0529 1.55E-05 7.05E-14
Clustering Coefficient 0.0679 0.0691 1.41E-23 2.365E-24
AbsoluteDifference
Degree 0.0587 0.0715 1.00E-17 5.71E-25
Closeness 0.0587 0.0441 1.00E-17 9.365E-10
Betweenness 0.0313 0.0414 2.35E-05 1.56E-08
Clustering Coefficient 0.0615 0.0571 1.97E-19 4.435E-26

You et al. BMC Bioinformatics 2010, 11:343http://www.biomedcentral.com/1471-2105/11/343
Page 9 of 13
However, the weighted degree of node vi is the sum ofthe weights of the edges between vi and its neighbors [45].
where ω is the weight between two nodes, in which ωijis greater than 0 if node vi is tied to node vj , and the valueis the weight of the tie, which represents the strength ofthe relation between the two nodes.(2) Clustering coefficientThe clustering coefficient of a node in a network quanti-fies how close the node and its neighbors are to being aclique. Let Ccl(i) denote the clustering coefficient of nodevi , and it is given by the proportion of links between thenodes within its neighbourhoods divided by the numberof links that could possibly exist between them. For anunweighted graph, the clustering coefficient can bedefined as:
where ei is the number of the links between the neigh-bourhoods of node i and ki is the number of the neigh-bourhoods of node vi . For a weighted graph, thedefinition of the clustering coefficient is defined as [45]
(3) Weighted Shortest PathBoth the closeness centrality and betweenness centralityrely on the calculation of shortest path in a network.Therefore, a first step towards extending these measuresto weighted networks is to generalize how shortest path isdefined in weighted networks.
In weighted networks, the shortest path is a pathbetween two nodes with the minimal sum of the weightsof its constituent edges. Since all edges have the sameweight in unweighted networks, the shortest pathbetween two nodes is through the smallest number ofintermediary nodes. However, a complication ariseswhen the ties in a network do not have the same weightattached to them. There have been several attempts to
calculate shortest distances in weighted networks in pre-vious work [46,47]. In our work, we applied Dijkstra'salgorithm to the weighted biological network by invertingthe positive weights in the network [47]. Thus, high val-ues represent weak ties, whereas low values representstrong ties.(4) Betweenness centralityBetweenness is a centrality measure of a node within anetworks. Nodes that occur on many shortest pathsbetween other nodes have higher betweenness than thosethat do not. For an unweighted network, to calculate the
betweenness of node vi, we firstly count the num-ber of shortest paths between two nodes passing the nodevi . Let bi be the ratio of this number to the total numberof shortest paths existing between these two nodes. Thenthe betweenness of node vi is the sum of bi over all pairs ofnodes in the network. We normalize it to lie between 0and 1 by dividing above value by the total number of pairsin the network. The betweenness for node vi is as follow
where gjk is the number of shortest geodesic paths fromnode vj to vk. gjk(i) is the number of shortest geodesicpaths from vj to vk which pass through the node vi.
In the case of weighted network, we assume that theflow in the network occurs over the paths that Dijkstra'salgorithm identifies and use this algorithm to find thenodes that funnel the flow in the network. Then theweighted betweenness centrality is extended by countingthe number of paths found by Dijkstra's algorithm on aweighted network instead of the number found on abinary network [48].(5) Closeness centralityCloseness is a centrality measure of a node within a net-work. Nodes which tend to have short geodesic distancesto all other nodes within the network have higher close-ness. In unweighted network, closeness centrality isdefined as the inverse of the average distance from onenode to all other nodes. For a weighted network, this def-inition changes slightly. Within the adjacency matrix, forany two nodes, vi and vj , if dij is the shortest distance fromvi to vj, then the closeness centrality of node vj is definedas [49]
C i aDu
ijj
N( ) =
=∑ 1(3)
C i aD ij ijj
Nw w( ) ==∑ 1
(4)
C iei
ki kiC icl
uclu( )
( ), ( ( ) )=
−< <2
10 1 (5)
C iCD i CD
u i
ij iha a a
cl
j h
N
ij ih jh
ww
w w
( )( ) ( ( ) )
( )
,
=× −
×+
× × ×=∑
2
1
21
(6)
C iBu( )
C in n
g jk i
g jki j kB
u
k
n
j
k
( )( )( )
( ), ( )=
− −× ≠ ≠
==
−
∑∑21 2
11
1
(7)
C jn
d j d j dnjCw( )
...= −
+ + +1
1 2(8)

You et al. BMC Bioinformatics 2010, 11:343http://www.biomedcentral.com/1471-2105/11/343
Page 10 of 13
where n is the total number of nodes in the network.(6) Eigenvector centralityEigenvector centrality is a measure of the importance of anode in a network. It assigns relative scores to all nodes inthe network based on the principle that connections tohigh-scoring nodes contribute more to the score of thenode in question than equal connections to low-scoringnodes.
Let xi denotes the score of the ith node. Let Aij be theadjacency matrix of the network. In weighted network,the entries of A are real numbers representing connectionstrengths. For the ith node, let the eigenvector centralityscore be proportional to the sum of the scores of all nodeswhich are connected to it. It can be formulated as [49]:
where λ is a constant. Defining the vector of centralitiesx ={x1,x2,...,xn}, we can rewrite this equation in matrixform as
Hence we see that x is an eigenvector of the adjacencymatrix with eigenvalue λ. In our work, we used the freesoftware package named igraph to calculate the eigenvec-tor centrality of weighted network [50].
In addition to above six weighted network properties,we also calculated several other binary network proper-ties, such as stress centrality [51], information centrality[52], flow betweenness centrality [53], the number ofmutual neighbors between proteins vi and vj. All of theabove ten network properties can reflect the local net-work structure around the node or the global networktopology.
Graph-based semi-supervised classifierThe SSL is halfway between supervised and unsupervisedlearning, which is very active and has recently attracted aconsiderable amount of research [7,54]. In essence, thereare three different kinds of SSL algorithms being applied,i.e., Generative models, Low density separation algo-rithms, and Graph-based methods. In our study, we usegraph-based SSL method because of its solid mathemati-cal background, their relationship with kernel methods,visualization, and good results in many areas, such ascomputational biology [32], web page classification [54],or hyperspectral image classification [7]. We here presentthe whole formulation of the graph-based SSL algorithm.
Consider the whole dataset being represented by χ = (χl,χn) of labelled inputs χl = {x1, x2,...,xl} and unlabelledinputs χn = {xl+1, xl+2,...,xn} along with a small portion ofcorresponding labels {y1, y2,...,yl}. Consider a connectedweighted graph G = (V, E) with vertex V corresponding toabove n data points, with nodes L = {1, 2,...,l} correspond-
x A xi ijj
n
j==∑11l
. (9)
lx A x= . (10)
Table 2: Features for representing synthetic interaction
Gene pair characteristic Reference Graph Type
1 Centrality degree Barrat et al. (2004) Weight
2 Clustering coefficient Barrat et al. (2004). Weight
3 Betweenness centrality Brandes. (2001) Weight
4 Closeness centrality Newman. (2001) Weight
5 Eigenvector centrality Csardi G. (1965) Weight
6 Stress centrality Freeman LC. (1977) Binary
7 Information centrality Stephenson K. (1989) Binary
8 Shortest path length Newman. (2001) Weight
9 Flow between centrality Newman. (2001) Binary
10 Mutual neighbor Newman. (2001) Binary

You et al. BMC Bioinformatics 2010, 11:343http://www.biomedcentral.com/1471-2105/11/343
Page 11 of 13
ing to the labelled points with labels y1, y2,...,yl and U = {l+ 1, l +2,...,n} corresponding to unlabelled points. ForSSL, the objective is to infer the labels {yl+1, yl+2,...,yn} ofthe unlabelled data {xl+1, xl+2,...,xn}, typically l << n.
Firstly, the n × n symmetric weight matrix W on theedges of the graph can be
where xi and xj denote the different points in the graphG. The constant σ is a length scale hyperparameter.Therefore nearby points in Euclidean spaces are assignedlarge edge weight, and vice versa.
Then let F denotes a series of n × l matrices with non-
negative elements. A matrix corresponds to one certain classification on χ = (χl, χn) byassigning each point xi a label yi = argmax xj≤l.Fij. Wedefine an n × l matrix Y F with Yij = 1 if xi is labelled as yi= j and Yij = 0 otherwise.
Secondly, we build the matrix S = D-1 2WD-1 2 where Dis a diagonal matrix with the (i, i) -elements equal to thesum of the ith row of W. Then take the iteration F(t + 1) =αSF(t) + (1 - α)Y until the similarity matrix F converges,where α is a predefined constant which ranges from0 to 1.
Thirdly, let F* represent the limit of the sequence {F(t)}.Label each point xi as a label yi = argmax xj≤C.F*ij. Because0 <α < 1 and the eigenvalues of S ranges from -1 to 1.
Then the classification matrix can be calculated as: F* =(1 - αS)-1Y. As in [8], F* can be obtained without iteration.After the above steps, the labels of unlabelled data {xl+1,xl+2,...,xn} will be assigned.
Support vector machines classifierSVM algorithm has been proposed by Vapnik as an effec-tive and increasingly popular learning approach for solv-ing two-class pattern recognition problems [55]. SVM asa typical supervised machine learning method is attrac-tive because it is not only well founded theoretically, but
also superior in practical applications. Intuitively, SVMclassifier is based on the structure risk minimizationprinciple for which error bound analysis has been theo-retically motivated. The method is defined over a vectorspace where the problem is to find a decision surface that"best" separates the data points in two classes by finding amaximal margin. SVM has been widely applied to a num-ber of pattern recognition areas like text categorization[56], object recognition [57], etc. In most of these cases,the performance of SVM is significantly better than thatof other supervised machine learning methods, includingNeural Network and Decision Tree classifier [17]. TheSVM has a number of advanced properties, including theability to handle large feature space, effective avoidance ofoverfitting, and information condensing for the givendata set, etc. A brief introduction about SVM is given inthe Additional file 1.
Here, we describe the use of the LibSVM provided byChih-Chung Chang. LibSVM is an integrated softwarefor support vector classification [58]. It is much easy toconstruct a SVM classifier. We only need to choose a ker-nel function and regularization parameter to train theSVM. In this study, we adopt the radial basis function(RBF) as the kernel function whose parameters were opti-mized by taking a n-fold cross-validation on the trainingset [55]. Specifically, the grid search was used to find opti-mal kernel parameters such as C, Gamma, which triesvalues of each parameter across the specified searchrange using geometric steps. Although grid searchmethod is computationally expensive, it is computation-ally feasible in our cases.
Additional material
Authors' contributionsZHY & XBZ & DSH conceived the original idea, wrote the main body of themanuscript and implemented the experiments. ZY & KH attended the discus-sion of the work and revised the manuscript. All authors have read andapproved the final version of this manuscript.
AcknowledgementsDr. Zhou is partially supported by NIH R01LM010185-01 and NIHR01CA121225-01A2. This work was supported by National Science Foundation of China (NSFC) under Grant No. 30900321, 30700161 and 60973153, and the China Postdoctoral Science Foundation (Grant No. 20090450825), and the Knowl-edge Innovation Program of the Chinese Academy of Science (Grant No. 0823A16121). We thank the anonymous reviewers for their helpful comments and suggestions.
W
xi x jif i j
if i j
ij =−
−⎛
⎝
⎜⎜⎜
⎞
⎠
⎟⎟⎟
≠
=
⎧
⎨
⎪⎪⎪
⎩
⎪⎪⎪
exp
2
2 2
0
s (11)
F F F F FT TnT T= ∈[ , ,..., ]1 2
F F t
S Y S Y
n
n
t
n i
t i
∗→∞
→∞−
→∞ =
−
=
= + − ∑lim ( )
lim( ) ( ) lim ( )a a a1
0
11
(12)
Additional file 1 This file consists of three parts of supplementary materials. The first part contains a more detailed description of SVM and the parameters settings used in this study. The second part contains figures which show the probability density distribution of different network prop-erties across synthetic genetic interactions and non-interaction pairs. The third part contains figures that show the empirical cumulative distributions of different network properties across synthetic genetic interactions and non-interaction pairs.

You et al. BMC Bioinformatics 2010, 11:343http://www.biomedcentral.com/1471-2105/11/343
Page 12 of 13
Author Details1Intelligent Computing Lab, Institute of Intelligent Machine, Chinese Academy of Science, P.O. Box 1130, Hefei, Anhui 230031, China, 2Department of Automation, University of Science and Technology of China, Hefei, Anhui 230027, China, 3The Methodist Hospital Research Institute, Weil Medical College, Cornell University, Houston, TX 77030, USA and 4School of Computer Science and Engineering, Inha University, Incheon, South Korea
References1. Hartman JLt, Garvik B, Hartwell L: Principles for the buffering of genetic
variation. Science 2001, 291(5506):1001-1004.2. Kelley R, Ideker T: Systematic interpretation of genetic interactions
using protein networks. Nature Biotechnology 2005, 23(5):561-566.3. Tong AH, Lesage G, Bader GD, Ding H, Xu H, Xin X, Young J, Berriz GF, Brost
RL, Chang M, et al.: Global mapping of the yeast genetic interaction network. Science 2004, 303(5659):808-813.
4. Wong SL, Zhang LV, Tong AH, Li Z, Goldberg DS, King OD, Lesage G, Vidal M, Andrews B, Bussey H, et al.: Combining biological networks to predict genetic interactions. Proc Natl Acad Sci USA 2004, 101(44):15682-15687.
5. Zhong W, Sternberg PW: Genome-wide prediction of C. elegans genetic interactions. Science 2006, 311(5766):1481-1484.
6. Onami S, Kitano H: Genome-wide prediction of genetic interactions in a metazoan. Bioessays 2006, 28(11):1087-1090.
7. Camps-Valls G, Marsheva TVB, Zhou DY: Semi-supervised graph-based hyperspectral image classification. Ieee Transactions on Geoscience and Remote Sensing 2007, 45(10):3044-3054.
8. Zhou D, Bousquet O, Lal TN, Weston J, Olkopf BS: Learning with local and global consistency. Advances in Neural Information Processing Systems 16 2004:321-328.
9. Lee I, Date SV, Adai AT, Marcotte EM: A probabilistic functional network of yeast genes. Science 2004, 306(5701):1555-1558.
10. You ZH, Zhang SW, Li LP: Integration of Genomic and Proteomic Data to Predict Synthetic Genetic Interactions Using Semi-supervised Learning. Emerging Intelligent Computing Technology and Applications: With Aspects of Artificial Intelligence 2009, 5755:635-644.
11. Jansen R, Yu HY, Greenbaum D, Kluger Y, Krogan NJ, Chung SB, Emili A, Snyder M, Greenblatt JF, Gerstein M: A Bayesian networks approach for predicting protein-protein interactions from genomic data. Science 2003, 302(5644):449-453.
12. Yamanishi Y, Vert JP, Kanehisa M: Protein network inference from multiple genomic data: a supervised approach. Bioinformatics 2004, 20(Suppl 1):i363-370.
13. To CC, Vohradsky J: Supervised inference of gene-regulatory networks. Bmc Bioinformatics 2008, 9:.
14. Zhao XM, Wang Y, Chen LN, Aihara K: Protein domain annotation with integration of heterogeneous information sources. Proteins-Structure Function and Bioinformatics 2008, 72(1):461-473.
15. Zheng H, Wang H, Glass DH: Integration of genomic data for inferring protein complexes from global protein-protein interaction networks. IEEE Trans Syst Man Cybern B Cybern 2008, 38(1):5-16.
16. Troyanskaya OG, Dolinski K, Owen AB, Altman RB, Botstein D: A Bayesian framework for combining heterogeneous data sources for gene function prediction (in Saccharomyces cerevisiae). Proc Natl Acad Sci USA 2003, 100(14):8348-8353.
17. Linghu B, Snitkin ES, Holloway DT, Gustafson AM, Xia Y, DeLisi C: High-precision high-coverage functional inference from integrated data sources. Bmc Bioinformatics 2008, 9:.
18. Lee I, Li Z, Marcotte EM: An improved, bias-reduced probabilistic functional gene network of baker's yeast, Saccharomyces cerevisiae. PLoS ONE 2007, 2(10):e988.
19. Zhao XM, Wang Y, Chen L, Aihara K: Protein domain annotation with integration of heterogeneous information sources. Proteins 2008, 72(1):461-473.
20. Paladugu SR, Zhao S, Ray A, Raval A: Mining protein networks for synthetic genetic interactions. Bmc Bioinformatics 2008, 9:.
21. Lezon TR, Banavar JR, Cieplak M, Maritan A, Fedoroff NV: Using the principle of entropy maximization to infer genetic interaction networks from gene expression patterns. Proc Natl Acad Sci USA 2006, 103(50):19033-19038.
22. Scott BT, Bovill EG, Callas PW, Hasstedt SJ, Leppert MF, Valliere JE, Varvil TS, Long GL: Genetic screening of candidate genes for a prothrombotic interaction with type I protein C deficiency in a large kindred. Thromb Haemost 2001, 85(1):82-87.
23. Damjanovic A, Garcia-Moreno B, Lattman EE, Garcia AE: Molecular dynamics study of hydration of the protein interior. Computer Physics Communications 2005, 169(1-3):126-129.
24. Whitten ST, Garcia-Moreno B, Hilser VJ: Local conformational fluctuations can modulate the coupling between proton binding and global structural transitions in proteins. Proceedings of the National Academy of Sciences of the United States of America 2005, 102(12):4282-4287.
25. Tu K, Yu H, Li YX: Combining gene expression profiles and protein-protein interaction data to infer gene functions. J Biotechnol 2006, 124(3):475-485.
26. Segal E, Wang H, Koller D: Discovering molecular pathways from protein interaction and gene expression data. Bioinformatics 2003, 19(Suppl 1):i264-271.
27. Tornow S, Mewes HW: Functional modules by relating protein interaction networks and gene expression. Nucleic Acids Res 2003, 31(21):6283-6289.
28. Xiao G, Pan W: Gene function prediction by a combined analysis of gene expression data and protein-protein interaction data. J Bioinform Comput Biol 2005, 3(6):1371-1389.
29. Jansen R, Greenbaum D, Gerstein M: Relating whole-genome expression data with protein-protein interactions. Genome Res 2002, 12(1):37-46.
30. Greenbaum D, Jansen R, Gerstein M: Analysis of mRNA expression and protein abundance data: an approach for the comparison of the enrichment of features in the cellular population of proteins and transcripts. Bioinformatics 2002, 18(4):585-596.
31. Eisen MB, Spellman PT, Brown PO, Botstein D: Cluster analysis and display of genome-wide expression patterns. Proc Natl Acad Sci USA 1998, 95(25):14863-14868.
32. Aittokallio T, Schwikowski B: Graph-based methods for analysing networks in cell biology. Brief Bioinform 2006, 7(3):243-255.
33. Kafri R, Dahan O, Levy J, Pilpel Y: Preferential protection of protein interaction network hubs in yeast: Evolved functionality of genetic redundancy. Proceedings of the National Academy of Sciences of the United States of America 2008, 105(4):1243-1248.
34. Lubovac Z, Gamalielsson J, Olsson B: Combining functional and topological properties to identify core modules in Protein Interaction Networks. Proteins-Structure Function and Bioinformatics 2006, 64(4):948-959.
35. Schormann N, Senkovich O, Walker K, Wright DL, Anderson AC, Rosowsky A, Ananthan S, Shinkre B, Velu S, Chattopadhyay D: Structure-based approach to pharmacophore identification, in silico screening, and three-dimensional quantitative structure-activity relationship studies for inhibitors of Trypanosoma cruzi dihydrofolate reductase function. Proteins-Structure Function and Bioinformatics 2008, 73(4):889-901.
36. Caruana R, Niculescu-Mizil A: An Empirical Comparison of Supervised Learning Algorithms. Proceedings of the 23rd international conference on Machine learning 2006, 148:161-168.
37. Stark C, Breitkreutz BJ, Reguly T, Boucher L, Breitkreutz A, Tyers M: BioGRID: a general repository for interaction datasets. Nucleic Acids Res 2006:D535-539.
38. Ho Y, Gruhler A, Heilbut A, Bader GD, Moore L, Adams SL, Millar A, Taylor P, Bennett K, Boutilier K, et al.: Systematic identification of protein complexes in Saccharomyces cerevisiae by mass spectrometry. Nature 2002, 415(6868):180-183.
39. Gavin AC, Bosche M, Krause R, Grandi P, Marzioch M, Bauer A, Schultz J, Rick JM, Michon AM, Cruciat CM, et al.: Functional organization of the yeast proteome by systematic analysis of protein complexes. Nature 2002, 415(6868):141-147.
40. Hakamada K, Hanai T, Honda H, Kobayashi T: Preprocessing method for inferring genetic interaction from gene expression data using Boolean algorithm. J Biosci Bioeng 2004, 98(6):457-463.
41. Cho RJ, Campbell MJ, Winzeler EA, Steinmetz L, Conway A, Wodicka L, Wolfsberg TG, Gabrielian AE, Landsman D, Lockhart DJ, et al.: A genome-wide transcriptional analysis of the mitotic cell cycle. Molecular Cell 1998, 2(1):65-73.
42. Spellman PT, Sherlock G, Zhang MQ, Iyer VR, Anders K, Eisen MB, Brown PO, Botstein D, Futcher B: Comprehensive identification of cell cycle-
Received: 24 December 2009 Accepted: 24 June 2010 Published: 24 June 2010This article is available from: http://www.biomedcentral.com/1471-2105/11/343© 2010 You et al; licensee BioMed Central Ltd. This is an Open Access article distributed under the terms of the Creative Commons Attribution License (http://creativecommons.org/licenses/by/2.0), which permits unrestricted use, distribution, and reproduction in any medium, provided the original work is properly cited.BMC Bioinformatics 2010, 11:343

You et al. BMC Bioinformatics 2010, 11:343http://www.biomedcentral.com/1471-2105/11/343
Page 13 of 13
regulated genes of the yeast Saccharomyces cerevisiae by microarray hybridization. Molecular Biology of the Cell 1998, 9(12):3273-3297.
43. Bhattacharya A, De RK: Divisive Correlation Clustering Algorithm (DCCA) for grouping of genes: detecting varying patterns in expression profiles. Bioinformatics 2008, 24(11):1359-1366.
44. Maraziotis IA, Dimitrakopoulou K, Bezerianos A: Growing functional modules from a seed protein via integration of protein interaction and gene expression data. Bmc Bioinformatics 2007, 8:.
45. Barrat A, Barthelemy M, Pastor-Satorras R, Vespignani A: The architecture of complex weighted networks. Proceedings of the National Academy of Sciences of the United States of America 2004, 101(11):3747-3752.
46. Katz L: A New Status Index Derived from Sociometric Analysis. Psychometrika 1953, 18(1):39-43.
47. Dijkstra EW: A note on two problems in connexion with graphs. Numerische Mathematik 1959, 1:269-271.
48. Opsahl T, Panzarasa P: Clustering in weighted networks. Social Networks 2009, 31(2):155-163.
49. Newman MEJ: Scientific collaboration networks. II. Shortest paths, weighted networks, and centrality. Physical Review E 2001, 6401(1):.
50. Csardi G, Nepusz T: The igraph software package for complex network research. InterJournal 2006. Complex Systems:1695
51. Freeman LC: Set of Measures of Centrality Based on Betweenness. Sociometry 1977, 40(1):35-41.
52. Stephenson K, Zelen M: Rethinking Centrality: Methods and Applications. Social Networks 1989, 11:1-37.
53. Brandes U, Fleischer D: Centrality measures based on current flow. Stacs 2005, Proceedings 2005, 3404:533-544.
54. Liu R, Zhou JZ, Liu M: A graph-based semi-supervised learning algorithm for web page classification. ISDA 2006: Sixth International Conference on Intelligent Systems Design and Applications 2006, 2:856-860.
55. Cortes C, Vapnik V: Support-Vector Networks. Mach Learn 1995, 20(3):273-297.
56. Drucker H, Wu DH, Vapnik VN: Support vector machines for spam categorization. Ieee T Neural Networ 1999, 10(5):1048-1054.
57. Pontil M, Verri A: Support Vector Machines for 3 D object recognition. Ieee T Pattern Anal 1998, 20(6):637-646.
58. Chang C-C, Lin C-J: LIBSVM: a library for support vector machines. 2001 [http://www.csie.ntu.edu.tw/~cjlin/libsvm/].
doi: 10.1186/1471-2105-11-343Cite this article as: You et al., A semi-supervised learning approach to pre-dict synthetic genetic interactions by combining functional and topological properties of functional gene network BMC Bioinformatics 2010, 11:343


![Adversarial Robustness: From Self-Supervised Pre-Training to … · 2020. 6. 28. · Jigsaw [25, 3]: By dividing an image into different patches, Jigsaw trains a classifier to predict](https://img.dokumen.tips/doc/110x75/60a0f45614ee601a6c4ebf00/adversarial-robustness-from-self-supervised-pre-training-to-2020-6-28-jigsaw.jpg)


![Lifelong Learning - Stanford University · General [supervised] online learning problem: What is the lifelong learning problem statement? for t = 1, …, n observe 𝑡 predict ̂](https://img.dokumen.tips/doc/110x75/60bbda1b3076bd2fae764c1f/lifelong-learning-stanford-university-general-supervised-online-learning-problem.jpg)

