Embed Size (px)
Citation preview

A SELF-OPTIMISING PORTABLE FES SYSTEM USING AN ELECTRODE ARRAY AND MOVEMENT SENSORS
Thesis submitted for the degree of
Doctor of Philosophy
at the University of Leicester
by
Ahmed Elsaify B.Eng (Hons)
Department of Engineering
University of Leicester
UK
May 2005

A SELF-OPTIMISING PORTABLE FES SYSTEM USING AN ELECTRODE ARRAY AND MOVEMENT SENSORS
By
Ahmed Elsaify
Declaration of originality
This thesis is submitted in fulfilment of the requirements of Doctor of Philosophy in
the Department of Engineering, University of Leicester, United Kingdom. All work
recorded in this thesis is original unless otherwise is acknowledged in the text
reference. No part of this thesis has been submitted for any other degree either to the
University of Leicester or to any other University.
Signed
Ahmed Elsaify

Acknowledgment
The work on this thesis has been an inspiring, mostly challenging, but always an interesting experience. It has been made possible by some special people to whom I owe many thanks. I would like to express my sincere thanks to Dr William Peasgood the original grant holder for this research project, who has given me an invaluable experience, advice and scientific input. I would like also to express my deep gratitude to my supervisor Professor John Fothergill for his constant support, encouragement and many fruitful discussions. I would sincerely thank Dr Rosie Jones and Mrs Angela Davies-Smith of Bristol General Hospital for their co-operation, help and support during my clinical trials visits to Bristol. Always, I wish to thank my parents, for their understanding and love that I received from them during the past years. I wish to sincerely thank my brother, my sisters and my friends for their spiritual support. Many thanks for all the people who have contributed and helped in some way to my research. I wish to thank EPSRC for their financial support to this research project. Ahmed Elsaify

A Self-Optimising Portable FES System Using an Electrode Array and Movement Sensors
By
Ahmed Elsaify
Abstract
A portable functional electrical stimulation system has been designed using embedded systems technology. The system, which was applied to patients suffering from foot drop, uses sensors to monitor foot movement and orientation in a unique way, uses sophisticated algorithms for feedback, and drives an array of surface electrodes for stimulation. This system meets British Standards and safety requirements for medical equipment. A new technique was invented based on using the twitch response of muscles to optimise the configuration of the electrode array. This reduces the setup time in the clinic. Using feedback from the sensors, the optimum configuration of electrodes is chosen to produce correct stimulation and movement in real time. The instrument presents the patient with a ranked list of electrode combinations that are likely to be optimum; the patient can then choose a combination that is both effective and comfortable. The system is also able to vary the chosen pattern of electrodes and the stimulation signal parameters during the stimulation process. This may enable some problems associated with fatigue and skin irritation to be reduced. Trials were carried on 30 controls and 12 patients to test the instrument and study and develop the system optimisation and control algorithms. These preliminary clinical trials showed that control of the stimulation during walking, based on the optimisation algorithms developed in this work, gives high quality correction of foot drop. This was shown by gait assessment analysis by the physiotherapists involved in the project and blind assessment using independent researchers. These trials prove that the concept of using the electrode array for stimulation has advantages over using a conventional 2-electrode system.

I
CONTENT CHAPTER 1: INTRODUCTION ------------------------------------------------------------------------------ 1 1.1 General background -------------------------------------------------------------------------------------------- 1 1.2 Clinical benefit and the motivation of this project --------------------------------------------------------- 3 1.3 Aims and objectives -------------------------------------------------------------------------------------------- 4 1.4 Physiology background ---------------------------------------------------------------------------------------- 5
1.4.1 Neurons ---------------------------------------------------------------------------------------------------- 5 1.4.2 Lower Motor Neurones ---------------------------------------------------------------------------------- 7 1.4.3 Motor Units------------------------------------------------------------------------------------------------ 7 1.4.4 Skeletal muscle-------------------------------------------------------------------------------------------- 8 1.4.5 Muscle Control -------------------------------------------------------------------------------------------- 8 1.4.6 Action Potential ------------------------------------------------------------------------------------------- 9
1.5 Lost muscle movement ---------------------------------------------------------------------------------------12 1.5.1 Multiple Sclerosis----------------------------------------------------------------------------------------12 1.5.2 Stroke------------------------------------------------------------------------------------------------------13 1.5.3 Spasticity--------------------------------------------------------------------------------------------------13 1.5.4 Fatigue-----------------------------------------------------------------------------------------------------13
1.6 Electrical stimulation------------------------------------------------------------------------------------------14 1.6.1 Electrical stimulation techniques using electrodes --------------------------------------------------14 1.6.2 Transcutaneous functional electrical stimulation ----------------------------------------------------15
1.6.2.1 Electrode tissue interface--------------------------------------------------------------------------15 1.6.2.2 Skin impedance-------------------------------------------------------------------------------------17 1.6.2.3 Electrode sensation --------------------------------------------------------------------------------18 1.6.2.4 Electrode placement -------------------------------------------------------------------------------18 1.6.2.5 Electrode size ---------------------------------------------------------------------------------------19
1.6.3 Stimulation signal parameters --------------------------------------------------------------------------19 1.6.3.1 Stimulation pulse amplitude ----------------------------------------------------------------------21 1.6.3.2 Stimulation strength and pulse duration---------------------------------------------------------22 1.6.3.3 Stimulation frequency -----------------------------------------------------------------------------24 1.6.3.4 Minimising muscle Fatigue -----------------------------------------------------------------------27 1.6.3.5 Stimulation pulse waveform ----------------------------------------------------------------------29
1.7 Summary--------------------------------------------------------------------------------------------------------32 CHAPTER 2: FES AND FOOT DROP ----------------------------------------------------------------------34 2.1 Foot drop--------------------------------------------------------------------------------------------------------34
2.1.1 The effect of Foot Drop on mobility ------------------------------------------------------------------35 2.1.2 Electrode placement for Foot Drop correction -------------------------------------------------------38
2.2 Prior foot drop FES research overview ---------------------------------------------------------------------41 2.2.1 Transcutaneous foot drop stimulators -----------------------------------------------------------------41 2.2.2 Foot gait detection ---------------------------------------------------------------------------------------45
2.2.2.1 Foot switch------------------------------------------------------------------------------------------45 2.2.2.2 Natural sensors -------------------------------------------------------------------------------------46 2.2.2.3 Inertial sensors--------------------------------------------------------------------------------------47
2.2.3 Foot drop control-----------------------------------------------------------------------------------------49 2.5 Summary--------------------------------------------------------------------------------------------------------50

II
CHAPTER 3: SYSTEM DESIGN-----------------------------------------------------------------------------52 3.1 Introduction-----------------------------------------------------------------------------------------------------52 3.2 Stimulation system [ST32 FES system] --------------------------------------------------------------------54
3.2.1 Specifications---------------------------------------------------------------------------------------------54 3.2.2 System configuration: -----------------------------------------------------------------------------------55 3.2.3 Microcontroller and embedded firmware -------------------------------------------------------------56 3.2.4 User interface and control ------------------------------------------------------------------------------56 3.2.5 Stimulating signal generator----------------------------------------------------------------------------57 3.2.6 Output stage ----------------------------------------------------------------------------------------------59
3.2.6.1 Constant current ------------------------------------------------------------------------------------59 3.2.6.2 Constant voltage------------------------------------------------------------------------------------59 3.2.6.3 Output stage design --------------------------------------------------------------------------------60
3.2.7 Electrode Array Switcher -------------------------------------------------------------------------------62 3.2.8 Power supply ---------------------------------------------------------------------------------------------64
3.3 Real time feedback Sensors ----------------------------------------------------------------------------------66 3.3.1 Force Sensitive Resistor (FSR) ------------------------------------------------------------------------66 3.3.2 Accelerometer --------------------------------------------------------------------------------------------67 3.3.3 Gyroscope-------------------------------------------------------------------------------------------------69
3.4 Electrode array -------------------------------------------------------------------------------------------------69 3.5 Summary--------------------------------------------------------------------------------------------------------70 CHAPTER 4: ELECTRODE ARRAY OPTIMISATION------------------------------------------------72 4.1 Optimisation techniques and problems ---------------------------------------------------------------------72 4.2 Monitoring the foot movement ------------------------------------------------------------------------------73 4.3 The twitch response -------------------------------------------------------------------------------------------75
4.3.1 Twitch response vs. continuous stimulation response-----------------------------------------------77 4.4 Twitch response Laboratory testing -------------------------------------------------------------------------82 4.5 Twitch signal problems and solutions-----------------------------------------------------------------------84 4.6 Laboratory trials -----------------------------------------------------------------------------------------------88
4.6.1 Continuous and twitch stimulation movement recording -------------------------------------------89 4.6.2 Electrode array mapping --------------------------------------------------------------------------------90
4.7 Electrode array optimisation algorithm ---------------------------------------------------------------------93 4.7.1 First step:--------------------------------------------------------------------------------------------------93 4.7.2 Second step: ----------------------------------------------------------------------------------------------94 4.7.3 Third step: ------------------------------------------------------------------------------------------------95 4.7.4 Fourth step: -----------------------------------------------------------------------------------------------95 4.7.5 Fifth step: -------------------------------------------------------------------------------------------------96 4.7.6 Sixth step:-------------------------------------------------------------------------------------------------97 4.7.7 Seventh step:-------------------------------------------------------------------------------------------- 102 4.7.8 Final step: ----------------------------------------------------------------------------------------------- 103
4.8 Summary------------------------------------------------------------------------------------------------------ 105 CHAPTER 5: FOOT-DROP CORRECTION DURING WALKING ------------------------------- 107 5.1 Foot-Drop monitoring--------------------------------------------------------------------------------------- 107
5.1.1 FSR sensor---------------------------------------------------------------------------------------------- 108 5.1.2 Gyroscope----------------------------------------------------------------------------------------------- 108 5.1.3 Accelerometer ------------------------------------------------------------------------------------------ 109

III
5.1.4 Filter design -------------------------------------------------------------------------------------------- 110 5.3 Foot-Drop correction algorithm---------------------------------------------------------------------------- 112
5.3.1 Detailed algorithm description ----------------------------------------------------------------------- 115 5.4 Summary------------------------------------------------------------------------------------------------------ 124 CHAPTER 6: PRELIMINARY CLINICAL STUDY --------------------------------------------------- 126 6.1 Introduction--------------------------------------------------------------------------------------------------- 126
6.1.1 The study objectives----------------------------------------------------------------------------------- 126 6.1.2 Study technical requirements------------------------------------------------------------------------- 127 6.1.3 Study participants recruitment ----------------------------------------------------------------------- 127
6.2 Study methodology------------------------------------------------------------------------------------------ 128 6.2.1 Subject assessment phase ----------------------------------------------------------------------------- 128 6.2.2 Seated phase tests -------------------------------------------------------------------------------------- 130 6.2.3 Walking phase tests------------------------------------------------------------------------------------ 133
6.3 Study Results and Analysis--------------------------------------------------------------------------------- 136 6.3.1 Control subjects ---------------------------------------------------------------------------------------- 136
6.3.1.1 Seated phase results and analysis for control subject---------------------------------------- 137 6.3.1.2 Electrode mapping analysis--------------------------------------------------------------------- 146 6.3.1.3 Walking phase results and analysis for control subjects: ----------------------------------- 148
6.3.2 MS and Stroke patient subjects ---------------------------------------------------------------------- 151 6.3.2.1 Assessment of Subjects-------------------------------------------------------------------------- 151 6.3.2.2 Seated phase test results and analysis for patient subjects ---------------------------------- 153 6.3.2.3 Electrode mapping analysis--------------------------------------------------------------------- 161 6.3.2.4 Walking phase results and analysis for patient subjects:------------------------------------ 164
6.4 Summary------------------------------------------------------------------------------------------------------ 170 CHAPTER 7: CONCLUSION AND FUTURE WORK ------------------------------------------------ 172
7.1 The main objectives of the project were -------------------------------------------------------------- 172 7.2 Future Work ---------------------------------------------------------------------------------------------- 175
REFERENCES----------------------------------------------------------------------------------------------------- 1 APPENDIX – A: PUBLICATIONS -----------------------------------------------------------------------------A APPENDIX – B ----------------------------------------------------------------------------------------------------B
B-1) Stimulation System Version 1 & 2----------------------------------------------------------------------B B-2) Feedback Sensors------------------------------------------------------------------------------------------B B-3) Digital filter coefficients----------------------------------------------------------------------------------B B-4) Stimulation System Manual------------------------------------------------------------------------------B B-5) Microcontroller Embedded Firmware ------------------------------------------------------------------B B-6) MEMO Safety Test Results ------------------------------------------------------------------------------B
APPENDIX – C ----------------------------------------------------------------------------------------------------C C-1) Clinical Assessment---------------------------------------------------------------------------------------C C-2) Clinical Study Forms -------------------------------------------------------------------------------------C

Chapter 1 Introduction
0
Chapter 1
INTRODUCTION

Chapter 1 Introduction
1
CHAPTER 1: INTRODUCTION
1.1 General background Functional electrical stimulation (FES) is the term given to a form of electrotherapy
which can be used to stimulate muscle in order to achieve a certain functional
contraction which can then be used to perform a clinically useful activity. The
development of assistive rehabilitation devices like functional electrical stimulation
has become the field of activity for many researchers around the world. The FES
system of interest in this work is the transcutaneous surface electrode functional
electrical stimulation. The application of interest in this research is foot drop due to
stroke or multiple sclerosis (MS). Both electrical stimulation and foot drop will be
discussed in more details in this chapter and Chapter2.
Over the last 40 year the number of FES devices manufactured to restore foot drop in
stroke patients alone is about (14,000), (Lyons, 2002). According to Creasey and
Donaldson the numbers of stroke victims in Europe population are 12,000/million,
(Creasey, 2000), and according to Burridge et al. and Leane et al. 10 – 20 % of stroke
victims have experience the foot drop problem, (Burridge, 1997), (Leane, 1998).
Comparing the number of manufactured stimulator devices to the number of stroke
patients suffers from foot drop reflects the problems associated with these devices
technology and perception. Many authors reported that this low volume of foot drop
stimulators could be due to the fact that the commercial foot drop stimulation devices
available are single channel open loop devices. Out of the foot drop patients who are
clinically referred for FES, only 50–70% adopts surface stimulation for correction of
their disability (Taylor, 1999). However, limited number of subjects from these given
foot drop stimulation devices will continue to use it in the long-term; this is due to
difficulty placing the electrode at the correct location on a daily basis, difficulty
tolerating the sensation of stimulation, difficulty operating the equipment on a daily
basis, (Taylor, 1999).

Chapter 1 Introduction
2
An alternative solution to some of these problems specialty the problem of finding the
optimum stimulation site using surface transcutaneous electrode stimulation is to use
an electrode array. One of the first attempts to use the transcutaneous electrode array
was reported by Regehr et al, they used a manual switchboard to select 8 out of 61
channels for stimulation (Regehr, 1989). In 1990 Robert Patterson made use of
garment electrode array, (Patterson, 1990). Patterson used two channels of a four-
channel stimulator to stimulate the quadriceps muscles using the garment electrode.
The other two channels are used to stimulate the peroneal nerve to achieve foot
dorseflexion, (Patterson, 1990). Also Jimbo and Kawana describe a complete system
with 18 stimulation channels, (Jimbo, 1992). The flexible PCB transcutaneous
electrode array was introduced by FESTIVAL (EU Project Tide 1250, 1997) as a
means of combining individual electrodes onto a single substrate. This did prove
effective but individual circles of hygrogel were required to isolate each electrode
which made them time consuming to reproduce, (Whitlock, 1997). Pancrazio et al,
describe a 16-channel stimulation system for cardiac myocytes implemented in VLSI,
(Pancrazio, 1998). Zeck and Fromherz use FET technology to construct a similar
system for invertebrate neurons, (Zeck, 2001). Another system that combines
recording and stimulation capabilities for 64 electrodes was recently described
(Jimbo, 2003).
Bijelic et al, introduced manual 24 button transcutaneous electrode array control box,
the electrode array was made of conductive micro-fibre silver coated textile. The
conductive fields are circular and they are evenly spread over the flexible substrate
which is 5 cm x 8 cm, and the conducting field hade diameter of 1 cm. The switcher
box can be controlled manually using push button switches or using a PC interface to
turn on and off the conduction for each electrode within the array individually. This
electrode system was mainly used for fingers flexion and hand grasping investigation
and clinical assessment (Popović-Bijelić, 2004), (Bijelic, 2004). In 2001 Livshitz
showed that for a 2x2 array it is possible to influence the charge distribution within
tissue with respect to the motor point alignment (Livshitz, 2001). Lawrence et al,
designed virtual electrodes stimulation system formed from two dimensional array of
small electrode elements, each one can be switched on and off. The electrodes was
made of square (10 mm x 10 mm) textiles silver coated fibres and arranged in array of
4x4 with 2mm inter spacing, (Lawrence, 2004),

Chapter 1 Introduction
3
Heller et al, introduced the use of an 8 x 8 array of mini transcutaneous electrodes (4.5
mm diameter) with an overall size that cover the stimulation site, the optimisation
method was based on finding the optimum electrode or group of electrodes that
stimulates the nerve that is responsible for producing the desired movement, (Heller,
2003). Sha and Heller produced a 3D finite element model to optimise the design of
self adhesive electrode array in FES applications, this 3D model was used to calculate
the current density distribution in tissue in the vicinity of the electrodes, (Sha, 2004).
The 3D model can help in determining the spatial selectivity of the electrode array.
The model also demonstrated that for a 1mm thick hydro-gel interface a minimum
resistivity of 500Ω is required to maintain selectivity, (Sha, 2004).
1.2 Clinical benefit and the motivation of this project
The best way to measure the clinical benefit of FES is to study the patient perception
and rejection of using FES. Salisbury District Hospital in the UK has one of the most
successful FES clinical centres world wide, especially in supplying and using foot
drop devices. Salisbury group reported results from questionnaire sent to 291 patients
provided with ODFS device for foot drop correction, (Taylor, 1998). The result show
that 168 patients were still using the device, 64% of whom replied and 123 patients
had been discharged, 43% of these replied. The condition for these users was as
follow; 72% stroke, 14% MS, and the rest were other conditions. From the patient still
using the device 44% reported less effort during walking when they use the device as
a reason to continuo using it. About 23% continue using the device because they are
less likely to trip when they use it. 14% reported that they can walk further and 9%
reported more confidence. Only 4 % reported that they can walk faster as reason to
use the device. This questionnaire results show that 55% uses the system every day,
40% all day. Regarding the distance they can walk with system 42 reported 10-100
yards and 30% 100-500 yards. About 50% of the users who stopped using the device
experienced a problem finding the optimal electrode position, and they reported that
as the main reason for discontinuing using the device. 20 % of all users reported skin
irritation and 10% of all users stopped using the device because of that. Unreliability
was reported by 40 % of patients stopped using the device. The rest reported other
reasons for stopping using the device such as spasticity and difficulty to use, (Taylor,

Chapter 1 Introduction
4
1998). In 2000 Salisbury District Hospital group published results another
questionnaire called IMPULSE (Taylor, 2000). This questionnaire surveyed long-term
users of the ODFS single channel foot drop stimulation device. Of the 140 users
surveyed, 70% (98) replied. Only 13% report that they had experienced no problems
with the equipment. The most commonly experienced problem was with finding the
correct electrode positions (72%); with 17% of respondents reporting this to be severe
problem and 37% a moderate problem. 36% reported the sensation from electrical
stimulation to be a problem. Again, they estimate, based on clinical experience, that
approximately 25–30% of foot drop stimulation users ultimately reject the device
(Taylor, 2000). The above questionnaire results indicate some of the clinical benefit
of using FES for foot drop and also some of the problems they experienced with the
ODFS device, despite the fact that this device is one of the most successful devices
that benefited the foot drop suffers specially in the UK. The above results was the
main motivation of this project, which was mainly to try to close the gap between the
user need and the clinically available systems.
1.3 Aims and objectives
The original aims of this research as setup by EPSRC grant proposal GR/N13029
were to develop a new FES portable system with sensory input under closed loop
control that will alleviate the problem of foot drop during walking.
The objectives were; to design an "intelligent" stimulator, which can have variable
pulse shapes (for comfort), pulse trains of variable frequency and pulse width for
more dynamic stimulation and control. The feedback was to be designed such that it
would measure function using appropriate sensors.
The second aim was to use an electrode array to alleviate electrode placement
problems associated with obtaining the desired movement. In order to achieve this,
the third aim was third aim was to design a new system that uses a novel electrode
array optimisation technique and algorithm to find the best stimulation sites
automatically and in a short period of time. This new optimisation technique should
produce the desired, comfortable and accurate stimulation movement.

Chapter 1 Introduction
5
Finally, the stimulation system was to be tested for electrode array optimisation
(setting up) and walking tests to alleviate foot drop in preclinical trials in a hospital
research clinic (Bristol General Hospital).
In general the research question was “Can we use a new automatic optimisation
technique based on using an electrode array to solve the problem of finding the best
electrode position using transcutaneous stimulation?”
1.4 Physiology background
The excitability of nerve and muscle fibres gives the background for therapeutic
applications of FES. The following headings cover a short review of the basic
neurophysiology of nerve and muscle excitation to clarify the principles of functional
electrical stimulation for the purpose of this thesis.
The nervous system comprises sets of neurons connected with varying degrees of
complexity. The nervous system in the human body consists broadly of two
components; the central nervous system CNS, composed of the brain and spinal cord,
and the peripheral nervous system, consisting of the nerves extending from the brain
and spinal cord. These two can be further divided as illustrated in Figure (1.0),
(Davies, 2001), (Arthur J, 1994), (Winter, 1990), (Campbell, 1984). This division is
not absolute in that there is some measure of functional overlap between the two
systems. In this research it is the voluntary lower motor system that is of interest. The
voluntary nervous motor system, which is directly responsible for skeletal muscle
movement, can be divided into upper and lower motor neurons. The upper ones are
those that extend from the brain into the spinal cord. The lower motor neurons
(somatic nerves) are those that go from the spinal cord to the muscle motor end plates.
1.4.1 Neurons Neurons are irregularly shaped cells. They consist of three parts, the dendrites, the cell
body, the axon and the axon terminals, Figure (1.1). The dendrites and axons are
projections from the cell body. The dendrites carry information to the cell body and

Chapter 1 Introduction
6
the axon transfer information away from the cell body, (Winter, 1990). Typical
neurons have many short-branched dendrites and a single long axon. Neurones are
interconnected; the junctions are called synapses. This is a chemical junction in that a
neurone -chemical transmitter passes information across the synaptic junction. The
nerve fibres have an outer myelin sheath, which is composed of fatty material that
electrically insulates the intracellular fluids from the extra-cellular ones. It has gaps at
approximately 1mm intervals. These gaps are known as nodes of Ranvier and allow
rapid transfer of information along the nerve, (Davies, 2001), (Levitan, 2001).
Figure (1.0) - General overview of the human nervous system
Nervous System
Central Nervous System (Brain and Spinal Cord)
Peripheral Nervous System
Afferent (sensory) Division (From receptor in periphery to the CNS, muscle feed back control)
Automatic or Involuntary Nervous System (muscles)
Voluntary nervous system (Somatic and Skeletal muscle)
Upper Motor Neurons
(From brain to spinal cord)
Lower Motor Neurons
(From spinal cord to muscles)
Efferent Division

Chapter 1 Introduction
7
Figure (1.1) - Structure of a neurone and the direction of nerve message transmission
(modified from (Winter, 1990)).
1.4.2 Lower Motor Neurones
Two different types of lower motor neurones exist, alpha motor neurones and gamma
motor neurones. Alpha motor neurones are the final pathway from the nervous
system. The alpha motor neurones with large cells and thick axons supply the main
skeletal muscle fibres, and are responsible for the initiation of skeletal muscle
contraction and for tension development in contracting muscles. The Gamma motor
neurones are the final efferent from the central nervous system through which the
muscle spindle activity is regulated to control muscle tone, (Hamill, 1995).
1.4.3 Motor Units
The motor unit is considered as the functional structural unit and final common path
for both reflex and voluntary movement. It comprises a nerve cell whose cell body is
located within the anterior horn of the spinal cord. This is the alpha motor neurone.
Emerging from it is the axon, which leaves the spinal cord via the ventral nerve root.
Once this axon reaches the muscle supplied, it branches and innervates a group of
skeletal muscle fibres, which together with the innervating nerve cell constitute the
motor unit.
Node of Ranvier
Myelin

Chapter 1 Introduction
8
1.4.4 Skeletal muscle
Skeletal muscle is composed of bundles of striated muscle fibres. Morphologically,
each single striated muscle fibre consists of many myofibrils, which are organized in a
parallel formation within the fibre, each being shown alternate light and dark bands,
as a result of special arrangement of thick myosin filaments and thin actin filaments.
Activation of the muscle causes the actin and myosin components to move towards
each other, shortening the muscle.
1.4.5 Muscle Control Spinal mechanisms play an important role in the control of movement. They alter the
balance of activity between muscles and affect the sophisticated integration of
peripheral and central inputs needed for rapid motor adaptation. Muscle spindles are
the sensory organs in muscles that are responsible for the stretch reflexes and provide
information on muscle length and the rate of change of muscle length. Figure (1.2) is
a schematic drawing showing a muscle spindle and its role in controlling muscle.
Figure (1.2) - The motor neurones used to control muscle tone in skeletal muscle,
(modified from (Hamill, 1995)).
Muscle spindle
Muscle fibres
Sensory neurone ending
Same skeletal muscle
Spinal cord
Sensory neuron
Alpha motor neuron

Chapter 1 Introduction
9
The output from the muscle spindle synapses with the associated muscle lower alpha
motor neurone, the synaptic connection between the sensory neurone and the alpha
motor neurone is facilitated by triggering this connection. Facilitation of a synaptic
connection means that, the connection is allowed or not under the ON/OFF control of
the upper motor system over the lower motor neurones. If a synaptic connection is
allowed, facilitation occurs and if it is not allowed, inhibition occurs. This regulation
called motor reflex integration. Figure (1.3) shows an example of this process. If a
person is standing the body sways forward, the calf muscles are stretched, this fires
the muscle spindles of the calf muscles. The reflex contraction helps to restore
balance and the body is pushed back into the upright position. This neural circuit
called the reflex arc and the associated reflex is referred to as the myotatic reflex.
Figure (1.3) - Reflex activities in the calf muscles to maintain posture
( Tyldesley, 1989).
1.4.6 Action Potential The action potential or impulse is the mechanism by which nerve cells transmit
signals and information. The event that generates the action potential can be of
different kinds including chemical, electrical and mechanical stimuli (e.g. stretch).
The electrical excitability of nerve tissue depends principally on the voltage
sensitivity of the nerve membrane permeability and on the frequency of impulses
transmitted by a nerve fibre, the number of fibres involved, and the synaptic
connections made. When a neurone is not sending a signal, it is said to be "at rest." In
its resting state a nerve membrane is more permeable to potassium than to sodium or

Chapter 1 Introduction
10
other cellular ions, the unequal ionic distribution maintains a resting membrane
potential of 70-90 mV, with the inside electrical negative with respect to the outside,
as shown in Figure (1.4) This principle applies to muscle fibres, (Baker, 2000),
(Arthur, 1994).
NERVE FIBRE
Figure (1.4) - Nerve Fibre: A membrane potential of approximately -90 mV is
established in the normal resting nerve fibre. The passive diffusion of sodium and
potassium (broken arrows) is countered by the active transport system (solid arrows),
allowing a steady state condition to prevail (Baker, 2000)
An action potential, or very rapid reversal of membrane potential, is triggered by a
stimulus, which reduces the membrane potential. This stimulus may be natural, such
as touch activation of a sensory receptor, or may be induced by an externally applied
electrical field or current, as is the case in electrical stimulation. The trigger stimulus,
regardless of its source, results in an opening of sodium selective membrane channels
and the beginning of an inward flow of sodium ions driven by a large concentration
and electrostatic pressure gradient. The membrane potential is briefly reversed to a
positive potential, this is the first stage of the generation of the action potential. This
process is called depolarization. Immediately afterwards, a similar amount of
potassium ions also cross the membrane, exiting from the nerve fibre interior. As the
equilibrium chemical potential for sodium is approached, the driving force of sodium
decreases and finally stops as the membrane channels for sodium close. This process
is called repolarization. The restoration of selective potassium permeability to the
membrane restores the original ionic concentration and electrostatic pressure
gradients and results in a re-establishment of the potassium dominated resting
potential. This transient process is completed in about one millisecond for nerve tissue
and within a few milliseconds for muscle tissue. A graph of the membrane potential,
as it varies with time, during the generation of an action potential is shown in Figure
(1.5) (Baker, 2000).

Chapter 1 Introduction
11
Figure (1.5) - A nerve action potential and the response of the membrane potential to
several sub-threshold stimuli, numbers 1 to 3, (Carlson, 1994).
Each action potential is fundamentally identical within the same nerve (“all or none
law”) although slight variations occur between different nerves. An action potential,
once generated, is normally self-sustaining throughout its travel along the nerve
process and is propagated from the periphery to the CNS by afferent axons and
between the CNS to the periphery by efferent axons (Baker, 2000), (Carlson, 1994).
In order to induce an action potential, external electrical stimuli must be of adequate
intensity and of sufficient duration to equal or exceed the threshold of excitability of
the cell membrane. Nerves have a lower threshold than muscle and thus electrical
activation of peripheral nerves could induce muscular contraction by the normal
physiological mechanism.

Chapter 1 Introduction
12
1.5 Lost muscle movement
It is important to state that FES is effective only when the peripheral nervous system
is intact. Damage to the peripheral nerve causes muscle degeneration hence no nerve
to stimulate and muscle properties change so that they become harder to stimulate.
Therefore FES is more likely to be effective on stroke, multiple sclerosis (MS),
moderate (partial) spinal cord injuries (SCI), cerebral palsy (CP) and traumatic brain
injury (TBI). Persons with lower motor neurone damage due to peripheral nerve
lesions or damage to the anterior horn cells of the spinal cord (grey matter containing
alpha motor neurons), will not respond to standard FES. Of these conditions, stroke
and head-injuries are by far the more prevalent problems with reported prevalence of
12 000/million for stroke and 20 000/million for head injuries as opposed to
800/million for SCI, 2000/million for MS, and 3000/million for CP, (Creasey, 2000).
The primary concerns in this research are disabilities related to stroke and multiple
sclerosis (MS). The following discussion will present the ways in which MS and
stroke can affect the ability of movement.
1.5.1 Multiple Sclerosis MS is a disease of the central nervous system (CNS). The pathological process starts
with inflammation around groups of nerve fibres in the CNS, followed by
development of patchy areas of demyelination (plaques). MS cause the myelin sheaths
disappearing in patches in any area throughout the CNS and a scar is formed
(sclerosis), (Matthews, 2002). In most individuals attacks of MS occur intermittently
especially during the early years after diagnosis (relapse/remitting MS). Functional
impairment and the recovery from impairment during remission have been stated to
be dependent on interference with and restoration of conduction in the region of the
plaques. MS can cause much sensory, motor and autonomic impairment that give
different symptoms which vary in intensity in different subjects, presumably
according to the site and extent of the lesions, some of these symptoms impair daily
living activity including movements, (McDonald, 1996).

Chapter 1 Introduction
13
1.5.2 Stroke
A stroke occurs when blood vessels carrying oxygen and other nutrients to a specific
part of the brain suddenly burst or become blocked. When blood fails to get through
to the affected parts of the brain, the oxygen supply is cut off, a stroke occurs and
brain cells begin to die. Strokes fall into two major categories, based on whether the
disrupted blood supply is caused by a blocked blood vessel, known as an ischemic
stroke, or a burst blood vessel called a haemorrhagic stroke. Stroke due to Cerebral
Vascular Accident (CVA) is one of the most common causes of adult physical
disability and death in the western world, (Royal College, 1989).
1.5.3 Spasticity Spasticity is one of the common consequences of MS and stroke. It indicates that the
upper motor neuron controlling the inhibition of myotatic reflexes has become
isolated from its descending inhibitory system, so that Alpha and Gamma motor
neurones are abnormally excitable, and as a result these reflexes are facilitated in
circumstances when they would normally be inhibited. Thus if an attempt is made to
execute a movement which involves stretching a muscle whose reflex arc is affected,
the muscle contract through the myotatic reflex and may prevent the desired
movement being executed. This condition is referred to as spasticity, (Apkarian,
1991).
1.5.4 Fatigue
Muscle fatigue is a feature of normal muscle and is “the transient decrease in
performance capacity of muscle when they have been active for a certain time, usually
evidenced by a failure to maintain or develop a certain expected force or power”,
(Asmussen, 1979). Another definition of fatigue is that “fatigue is a gradual loss in
muscle tension”, (Sandercock, 1985). The fatigue mechanism is likely to be involved
for two reasons. First, the maximal contraction associated with voluntary effort,
rapidly declines. Secondly, during voluntarily contraction, motor-neurones show a
wide range in thresholds. This suggests that the excitability of the highest threshold
units could be difficult to maintain (Garland, 1988).

Chapter 1 Introduction
14
1.6 Electrical stimulation
One of the attempts to use muscle electrical stimulation to improve function was a
single channel stimulator designed by Liberson 1961 (Librson, 1961), to dorsiflex the
ankle of dropped foot patients during the swing phase of walking gait. Shortly after
that researchers started to apply muscle electrical stimulation to restore body function
during long term management of these movements “such as walking, standing, hand
functions and heart muscle functions”, at this time the specialised term Functional
Electrical Stimulation (FES) is applied.
1.6.1 Electrical stimulation techniques using electrodes
Electrical muscle stimulation can be achieved using two contacts or electrodes; this
type of electrode system includes the electrode plus any mechanism or technique used
to maintain contact between the patient and the stimulator. This electrode system
plays a major role in determining the effectiveness of electrical stimulation and the
ease with which it can be given. There are three options using different stimulation
electrode system techniques, (Frank, 1990), (Baker, 2000).
I. Subcutaneous stimulation, i.e., under the skin, by having surgery to place
implemental electrodes. The electrodes are either sutured to the muscle surface or are
placed around the appropriate nerve bundle using a cuff arrangement. The stimulation
can be powered and controlled external to the body via wires or an RF link. The
stimulation has to be with the use of current in some manner and that can be only
achieved by wires routed from the stimulator, which can be embedded to the
electrode.
II. Percutaneous stimulation, i.e., through the skin, using fine wire and hypodermic
needle electrodes, which are passed through the skin and pushed into the belly of the
muscle. The optimum location for the electrodes can be determined by stimulating the
muscle during the insertion surgery process. When successfully located the needle is
withdrawn. The wires from the electrode are left emerging from the skin and
terminated in a small junction box secured to the skin surface.

Chapter 1 Introduction
15
III. Transcutaneous stimulation, i.e., across the skin using surface electrodes that can
be stuck or strapped to the surface of the skin. The optimum location for the
electrodes can be determined by moving the electrodes during the stimulation process.
The main differences between these techniques are the amount of stimulus intensity
required, and the ability to select which muscle to be stimulated and to what extent. In
all cases the muscle is stimulated by placing one of the electrodes (active) as close as
possible to the major motor point/ nerve bundle, with the other electrode (return )
placed near the muscle tendon. The electrodes are attached in this manner so as to
reduce the amount of stimulation required to produce a given contractile force.
The main disadvantages of the first two methods are both need the candidates to
commit themselves to surgery, that is expensive and electrode placement needs to be
very precise and this is difficult to evaluate during the surgery. Also when using wire
connections much care is required to keep the entry site for the wire free from
infection and to avoid electrode wire breakage during the relative movement between
the muscle and the skin. Moreover these impermeable electrodes can cause permanent
damage to the nerve tissue, (Frank, 1990), (Webber, 1990).
1.6.2 Transcutaneous functional electrical stimulation
1.6.2.1 Electrode tissue interface
At the electrode-tissue interface in transcutaneous electrical stimulation, an electrical
stimulation pulse applied by an electric field or current between the stimulation
electrodes causes a current of ions to flow and penetrate through the skin and flow
through the tissues underneath the skin that includes muscles (motor points) and
nerves. The polarity of the electrode depends on the type of stimulation signal pulse
polarity. When using Monophasic stimulation signal one of the electrodes will be
negative in polarity (active electrode) and the other will be positive in polarity
(indifferent electrode). When using Alternating or Bi-phasic signals it is not possible
to decide about the polarity of the electrode, as polarity at each electrode alternate
from positive to negative or vise-versa.

Chapter 1 Introduction
16
Figure (1.6) show simplified diagram of the transcutaneous stimulation mechanism.
At the positive electrodes the positive ions at the electrolyte interface are attracting
the negative ions. At the negative electrode the negative ions attract the migrating
positive ions. This causes electrical charged particles to flow. It is the movement of
potassium and sodium ions across the axon membrane that causes the action potential
and as a result a nerve impulse is produced. This nerve impulse causes the muscle that
this nerve supplies to contract.
Figure (1.6) - Muscle stimulation by applying electric field between two electrodes,
stimulation applied near to the motor point of the nerve. The depolarisation or the excitation of the nerve axon occurs principally at the
cathode, hyperpolarisation occurring at the anode, near the cathode the potential is
lowered. If a nerve axon is in the neighbourhood, the potential difference across the
membrane may be lowered sufficiently to cause an action potential. Critical to
whether a given stimulus causes an action potential or not is the impedance between
the electrodes and the skin, the orientation and size of the electrodes and the
stimulation signal type. Also placements of the electrodes are very important to
stimulate the selected muscles that are responsible for specific movement. The best
place to stimulate is over the selected muscle motor point, (Baker, 2000).
Anode Cathode
Nerve Muscle Motor point
+

Chapter 1 Introduction
17
1.6.2.2 Skin impedance
Examinations of skin by light microscopy show that in the top of the skin tissue there
is a heavily ridged surface of flaking, dead cells (corneum) perforated by sweat gland
ducts and hair follicles, which form the skin impedance. During stimulation the
current will flow in the direction of least impedance. Therefore the current flows more
easily through tissue with low impedance than through tissue with high impedance.
Increasing the pressure on the electrode increases the contact area, as does the use of
good conducting fluid or gel at the interface.
Consequently a higher voltage from the stimulator must be used to pass an equivalent
amount of electric field density to reach and stimulate the nerve through a high
impedance tissue than is necessary to pass the same current through tissue with low
impedance (high conductivity). Ohm’s Law defines this relationship: V = I.R or
I = V/R. In this familiar formulation, V is the voltage output of a stimulator, the
electric field generated supposed to be driving a current (I) of ions through the tissue
resistance (R). Physiologic systems (body tissues), however, are not made up of pure
resistance, but also contain significant capacitance. The most appropriate term to use
in referring to both resistive and capacitive elements is impedance (Z), which more
accurately defines the physiologic state. In Figure 1.7 the skin impedance Z is
considered to be resistance parallel with capacitance and Rs is the contact resistance
between the electrode and the skin surface (Webber, 1990).
Figure (1.7) - Electrode tissue impedance interface
Research by Stephens (Stephens W.G.S, 1963) found skin impedance to surface
stimulation electrodes could be modelled by a 4kΩ resistance shunted by a 0.28μF
constant capacitance. Mizrahi found the resistive value to be 500Ω. Other authors
have utilised a 1kΩ resistance in parallel with a 0.1μF capacitance as an
Skin = Rp // C Rp
C

Chapter 1 Introduction
18
approximation to the load presented by the human body. It must be noted that the
above values are considered to be typical values only and that variations will occur
between individuals and different body sites (Webber, 1990).
1.6.2.3 Electrode sensation Discomfort during Electrical Stimulation has limited the use of FES systems in
various applications, (Lyons, 2002). Transcutaneous stimulation activate the sensory
receptors on the skin surface, this acute sensory execution can cause irritation or
discomfort, if the stimulation intensity increased above certain limit, pain nerve fibres
will be recruited (Gracanin, 1975), (Bowman, 1984), (Lyons, 2004). The sensation of
stimulation and the level stimulation that can trigger the pain nerve fibres vary from
person to another. Some patients can not tolerate the pain or the discomfort of
stimulation and they completely reject the use of FES devices. The solution for this
problem is to enhance the method of applying the stimulation. Many factors affect the
stimulation efficiency and comfort, these factor include the stimulation signal
parameters, Electrode size and Electrode placement, (Lyons, 2004). In the following
few sections some of these factors are discussed in more details.
1.6.2.4 Electrode placement
The optimum electrode stimulation site or position that produces the desired muscle
contraction is very critical. Usually the best stimulation site is the nearest to the
muscle motor point, which provides the greatest amount of motor excitation with the
minimal stimulating intensity, (Baker, 2000). In most muscles motor endplates are
located near then mid point of each fibre such that in a muscle with parallel fibres (e.g
tibialis anterior) the motor point forms a band across the belly of the muscles and can
be located where the nerve begins to branch into the muscle and make contact with
individual muscle fibres. Depending upon the anatomy of the nerve-muscle interface,
the motor point may be that area of the muscle where the nerve is most superficial.
Locating motor points and placing the electrodes may depend upon both the patient
and treatment goals because each individual is different and may present with slightly
altered 'best' electrode placement. A 5 mm electrode movement may produce clear

Chapter 1 Introduction
19
change in the stimulation functional response, (Carrioni-Burnett, 2002). If the
stimulation electrodes are not optimally placed the stimulation intensity required will
be higher than necessary, and this will affect the stimulation comfort and
effectiveness, (Robinson, 1994), (Baker, 2000).
1.6.2.5 Electrode size
The sizes of the stimulation electrodes have direct effect on the current density which
should be higher than the recruited muscle stimulation threshold, (Rattay, 1988).
When electrode size increase the current density decreases and vice versa, (Lyons,
2004). The optimum size of electrode will depend on the muscle stimulated and
location of stimulation, (Lyons, 2004). McNeal and Baker found no difference in
stimulation effectiveness between using small electrodes (20 cm²) and larger electrode
(36 cm²), but they reported that the large electrode is more comfortable for some
subjects, (McNeal, 1988). Other researchers Also reported that stimulating using large
size electrode is more comfortable than small size electrode but more likely the
stimulation intensity need to be increased when large electrode is used, (Patterson,
1991), (Alon, 1985). Alon et al, reported that using two large electrodes (20.25 cm²)
or (40.3 cm²) give the same result and are more comfortable and effective more than
using two smaller electrodes, (2.25 cm²) or (9 cm²), (Alon, 1994), (Lyons, 2004).
Larger electrodes that cover more area of the stimulated muscle guarantee stimulating
the motor point as it is difficult to hunt for the motor point using smaller electrodes. If
an optimal stimulation site can be found smaller electrode with less stimulation
intensity will be more effective and comfortable, (Baker, 2000).
1.6.3 Stimulation signal parameters Electrical stimulation of nerve or muscle tissue using transcutaneous electrode,
although evoking a response similar to that produced by normal physiological neural
excitation, is not the same and some undesirable effects are inevitable. The
stimulation parameters required to produce an effective motor response therefore need
to be considered. Variations in these affect the stimulus applied to the tissues, which,
in turn, determines the physiological response.

Chapter 1 Introduction
20
The stimulation signal waveform can be formed of charge balanced pulses or single
monophasic pulses, the parameters that can be controlled are shown in Figure (1.8).
These parameters may be illustrated as:
• Pulse shape (rectangular, sinusoidal, etc…)
• Pulse waveform (monophasic, biphasic, alternating, charge balanced)
• Stimulation signal (train of pulses) envelope (Te)
• Pulse maximum amplitude, voltage or current, (Amax)
• Pulse width, (Tw)
• Pulse repetition rate (frequency) (Tp)
• Stimulation signal envelope rise time (Tr)
• Stimulation signal envelope fall time (Tf)
Voltage and impedance will determine the current that flows. Peak current and
voltage (pulse amplitude), pulse width, frequency of pulses and pulse shape or
waveform all influence charge transfer and therefore energy dissipation. It is desirable
to apply stimulation that minimises charge transfer and energy dissipation while
eliciting an effective muscle contraction.
Figure (1.8) - Stimulation signal parameter (for a monophasic rectangular waveform)
Undesirable physiological responses to be considered are possible tissue damage due
to a rise in temperature of the surrounding tissues and the electro-chemical formation
Tp
Amax
Tf Tr
≈ Tr
ain
of s
imila
r pu
lses
Tw
Te

Chapter 1 Introduction
21
of toxic electrode compounds. Charge balanced stimulation pulses should always be
used to avoid tissue electrolysis effects which occur when there is a net d.c. charge in
the tissues. Fatigue and discomfort are also important and must be minimised for
stimulation to be practical.
1.6.3.1 Stimulation pulse amplitude
The amplitude of the stimulus pulse and its duration must be adequate to meet or
exceed the threshold of excitability of the stimulated tissue. Figure (1.9) shows the
quality of the motor response, measured as torque production, resulting from an
adjustment of stimulus amplitude (current), with pulse duration held constant. As
current amplitude is increased from zero, no muscle response is observed until the
threshold of the most excitable motor units is reached. As the current amplitude is
increased beyond this threshold level, the torque output increases as a result of
recruiting additional motor units. Increasing the amplitude beyond this up to maximal
levels, results in no additional muscle force (Baker, 2000).
Malezic et al, successfully utilised pulse magnitudes in the range 20V to 80V,
(Malezic, 1987). Hertzler and Kaminski found an upper magnitude limit of 67.5V to
be adequate for surface stimulation (Hertzler E.C, 1968). Bogataj et al, suggest the
use of a slightly larger magnitude range up to 120V and also suggest the use of 80mA
- 120mA current pulse magnitudes, equivalent to the previous range when 1kΩ body
impedance is considered, (Bogataj, 1989). Takebe et al, produced a stimulator with a
maximum pulse magnitude of 100V, (Takebe, 1975). The adjustment of ramp-up time
can be very important in subjects with muscle spasticity, and it allows better gradual
control over the stimulation recruitment process of motor nerve fibres and gradual
increase in muscle fibre contraction, which produces a more comfortable smooth
movement (Vodovnik, 1965), (Robinson, 1994). Also, ramp-down time allows a
gradual decrease in stimulation intensity, which produces a more controlled
movement.

Chapter 1 Introduction
22
Figure (1.9) - Effect of Amplitude on force contraction, (data from the quadriceps
femoris, surface electrodes, pulse duration of 300 μs and frequency of 35 Hz (Baker,
2000)
1.6.3.2 Stimulation strength and pulse duration
The event that triggers the generation of an AP is called an adequate stimulus. An
adequate stimulus must be of sufficient intensity, which can be increased to equal or
exceed the threshold of excitation for the tissue by increasing the duration of the pulse
(usually measured in ms or μs) or the amplitude of the pulse (usually measured in mA
or Volts).
To determine the basic relationship between a particular tissue response and the
intensity of an adequate electrical stimulus it is necessary to limit some of the
variables while adjusting others.
Consider, therefore:
i) A threshold level of stimulation - at which only the largest, most excitable,
motor fibres are stimulated.
ii) A near maximal contraction - at which even the least excitable motor
fibres are stimulated.

Chapter 1 Introduction
23
This relationship is traditionally represented as the "strength-duration" or intensity-
duration curve. This curve compares the length of time and the stimulus current of a
particular intensity must be applied to a tissue to excite it. Figure (1.10.a) shows a
schematic representation of the variation between the excitability of nerve and
muscle. Stimulation of shorter pulse duration require increasing the intensity to
execute the tissue, the stimulation of very short duration will not cause depolarisation
except with very high intensity, (Baker, 2000), (Stephens, 1963).
The Pulse Duration / Voltage curve shown in Figure (1.10.b) shows the voltage just
sufficient to cause excitation of a particular tissue, with very long pulse durations (at
least 300-1,000 ms) this is called rheobase. The pulse duration required for threshold
activation, at a current intensity twice the rheobase is called the chronaxie. The
chronaxie for nerve (approximately 25μs) is significantly lower than that for muscle
(approximately 7 ms), (Baker, 2000), (Stephens, 1973).
As the pulse duration is decreased below 0.3ms an increasingly higher voltage is
needed to evoke a muscle twitch. Pulse durations of greater than 0.3ms require only
slightly less current amplitude. As charge transfer per pulse decreases with decreasing
pulse width (reaching a minimum at 0.05ms) it is minimised at pulse duration of
0.3ms. (Baker, 2000), (Frank, 1990), (Stephens, 1973).
Pulse duration in the midrange between 200-400µs was reported by many researchers,
Higher pulse duration reported to be uncomfortable and pulse duration of 300 or 350
µs reported to be adequate, (Bowman, 1985), (Alon, 1994), (Baker, 2000).

Chapter 1 Introduction
24
Figure (1.10 (a, b)) - The Strength / Pulse Duration curve for muscle and nerve
(Baker, 2000)
1.6.3.3 Stimulation frequency
Pulse frequency or repetition rate is the rate at which pulses are emitted, and
determines the sum of charge transfer in a given time. Lower frequencies therefore
reduce unwanted side effects. It is important to remember that during normal neural
activity, neurones are firing at different times and rates. As a result, a smooth muscle
contraction is achieved with frequencies of firing of between 5 and 25 Hz. To achieve
a smooth muscle contraction with electrical stimulation, a single stimulation pulse
generates an action potential that propagates along the nerve and results in muscle
twitch. As shown in Figure (1.11) a single muscle twitch lasts only about 100 - 200
a)
b)

Chapter 1 Introduction
25
ms, (Baker, 2000). By applying trains of pulses (3-10 Hz) the stimulated muscles
experience tremor. Increasing the stimulation frequency puts the single muscle
twitches closer together; they start overlapping and cannot be individually
distinguished. Ultimately muscle is no longer able to relax or return to it resting
status. This process of continuous muscle contraction is called “summation of
contraction” or “tetanization”. For stimulation frequencies of 25 - 40 Hz the tremor
becomes very small and with the final fusion of fibre contraction, tetanic contraction
is obtained. Increasing the stimulation frequency smoothens the tetanic contraction
further, but has the disadvantage of increasing muscle fatigue, (Boonstra, 1987).
Figure (1.11) - summations of contraction and tetanization, (Baker, 2000).
During physiological contractions, the muscle fibers are activated randomly through
thousands of nerve fibers. The action potentials are fired asynchronously with a firing
rate between 0.3 - 5 Hz depending on the desired force and the fatigue level of the
muscle. This asynchronous firing above a threshold frequency results in tetanic
contraction although the stimulation frequency for a single motor unit may be low,
whereas in artificially stimulated nerves the action potentials are generated all at the
same time. The distribution of action potentials as produced during natural
contractions cannot be generated artificially with FES. For tetanic contractions the
muscle has to be stimulated with a rather high stimulation frequency around 20 Hz or
higher. Physiologically firing rates of between 10 and 80 Hz are recorded depending
on muscle type and its function. The high stimulation frequency reduces the rest time
Tetanus force
Twitch force Mus
cle
Tens
ion
ms

Chapter 1 Introduction
26
of the muscle fibres and produces a faster rapid fatiguing of the muscles, (Herbison,
1971), (Symons, 1986), (Baker, 2000).
A lot of research underpins the above conclusion. Liberson et al, used pulse lengths in
the range 20μs - 250μs and pulse frequencies of 30Hz –100Hz, (Librson, 1961).
Eberstein A. et al, concluded that the optimum stimulation for fast muscle is
intermittent bursts of impulses at high frequency (e.g. 100Hz), and for slow muscle is
continuous low frequency pulses (e.g.10Hz), (Eberstein, 1996). Some researchers
have advocated a stimulation pattern derived from the normal EMG signal of the
particular muscle, (Petterson, 1994). Malezic et al, found the usable ranges for the
pulse length to be 50 - 500μs, with the pulse repetition frequencies in the range 5 -
120 Hz, (Malezic, 1992), although they stated that the mean frequency required by
patients was 30Hz. In a separate report, Malezic et al., found that 200μs widths of
20Hz produced satisfactory results for some muscles and some functions, (Malezic,
1994). A pulse frequency of 20Hz is also suggested by Carroll et al. along with pulse
widths of around 150μs, (Carroll, 1989). Ranges approximating to those mentioned
above have been found to be adequate for surface stimulation purposes by various
authors, (Gracanin, 1975), (KJjajic, 1992), (Durfee, 1989), (Borges, 1989), (Agnew,
1989), suggest that 200μs pulse lengths and 33Hz frequency are ideal values, whereas
Handa et al, suggest that 200 μs pulses and 20Hz frequency were found to produce the
best results (Handa, 1992). Pulse lengths of 200μs and a frequency of 30Hz was
successfully employed by Herbert and Bobechko (Herbert,1989) and Akazawa et al,
(Akazawa, 1989), re-enforcing the likely required nominal parameters of a general
purpose muscle stimulator. Research into the isometric recruitment relationships of
muscle by Durfee and Maclean, found that l00 μs pulses at a frequency of 40Hz
produced a useful torque / fatigue trade off, (Durfee, 1989). The digitally synthesised
pulse trains of Hoshimiya et al., employed a 200 μs pulse width and 50Hz pulse
repetition frequency for optimum results, (Hoshimiya, 1989). Carroll et al, state that
peak torque was achieved by application of 150 μs pulses with the pulse repetition
frequency in the range 66Hz to 83Hz (Carroll, 1989). This repetition frequency
caused the mean torque to have dropped to 5% of the starting torque after thirty
seconds stimulation, whilst a 50ms inter-pulse interval produced a drop to only 82%
of initial torque after a similar length of time. It was also found by Carroll et al, that
pulse repetition frequencies of greater than 83Hz produced rapid high frequency

Chapter 1 Introduction
27
fatigue, (Carroll, 1989). Therefore, it may be concluded that the pulse repetition
frequency should not be greater than 66Hz, although it may be less than this value for
lower torque and greater fatigue resistance.
The above results and discussion places the nominal pulse parameters at 200μs pulse
width and 30ms inter-pulse interval, which produce a frequency of 33Hz. Koller et al.
found that this frequency did not cause any significant neural damage, (Koller, 1992).
Agnew et al, found that constant stimulation at frequency of 50Hz and above caused
irreversible demyelination and axon degeneration in cats, (Agnew,1989). Wilson et al,
suggests that the ideal rise and fall time is in the range 5 μs to 10 μs, (Wilson, 1968).
This value for rise-time and fall-time parameters, equivalent to 1% of the nominal
pulse length value, presents a fast rise-time and fall time in comparison to the pulse
length.
1.6.3.4 Minimising muscle Fatigue
Depending on the muscle and the type of the system used, fatigue manifests itself as the
decreasing ability of the muscle to produce a maintained tetanic contraction of adequate
power. In normally innervated muscles, recruitment of the motor units is hierarchical.
For low output requirements recruitment begins with the smaller fibres that are also
resistant to fatigue whereas larger fibres are activated progressively as the force output
demand is increased. Furthermore in an able bodied person, motor units are cyclically
and asynchronously activated in order to produce overall smooth contractions, with force
distributed uniformly throughout the muscle, whereas at the same time allowing the
individual fibres to rest (Robinson, 1994), (Baker, 2000).
The three factors contributing to affect the physiological muscle recruitment
mechanism and increase fatigue characteristics in electrically stimulated muscle
compared to the natural case are:
1. Synchronous/Asynchronous recruitment of motor units:
Natural Stimulation is asynchronous
Electrical Stimulation is synchronous

Chapter 1 Introduction
28
2. Stimulation frequency:
Natural Stimulation mean frequency is lower due to asynchronous stimulation
Electrical Stimulation frequency is higher due to synchronous stimulation
3. Motor Units used:
In Natural Stimulation different motor units are switched in and out of use
In Electrical Stimulation a fixed block of motor units are continuously recruited.
These combined factors make fatigue in electrically stimulated muscle a
significant problem. Figure (1.12) shows the higher the frequency the more
rapidly the muscle fatigues. The test in this example was during a sustained
contraction of the Tibialis Anterior muscle stimulated via the Common Peroneal
nerve (Baker, 2000).
Figure (1.12) - Effects of frequency of stimulation pulses on muscle fatigue, (data
obtained from tibialis-anterior transcutaneous stimulation at 300µs, (Baker, 2000).
It is difficult to address the fatigue issue when using surface electrical stimulation,
since the induced electrical field activates the nerve fibres as it reaches them i.e. first
the outer larger axons that are also the least fatigue resistant. This indiscriminate
excitation recruits all of the accessed axons simultaneously and leaves no time for the
muscle fibres to recover. Ever-increasing stimulation strength is therefore used to
25 50 75 100 125 150
Stimulation time (s)
S% In
itial
torq
ue

Chapter 1 Introduction
29
sustain the required contraction by recruiting more and more motor units and this
eventually leads to irrecoverable fatiguing of the muscle, (Kralj, 1989), (Mourselas,
1998), (Robinson, 1994), (Baker, 2000).
The problem of fatigue caused by electrical stimulation can be addressed in a few
ways:
1. By the selection of frequencies between 20 and 40Hz to allow a smooth
contraction, and minimise fatigue - slower than 20 Hz is less comfortable as it
produces a jerky contraction, partial tetanus (Robinson, 1994).
2. By stimulating different sites of the same muscle using more than one
electrode.
3. By using cyclic stimulation with rest periods between pulse trains, on/off time
the off time is to allow ionic gradient and neurotransmitters to recover in nerve
and muscles (Baker, 1988), (Reed, 1997). The dropped foot stimulator used in
this research is designed to cause activation only during the swing phase of the
gait cycle, allowing the muscles to rest during the stance phase.
1.6.3.5 Stimulation pulse waveform
As discussed earlier in this thesis, the first electrical stimulation was using direct
current (d.c.) known as galvanic current Figure (1.13.a), although this was not suitable
for inducing a tetanic muscle contraction but it was used for treating neuralgia.
Alternating current (a.c.) Figure (1.13.b) sinusoidal waveform of any frequency also
was used for electrical simulation. Faradic current waveform is shown in Figure
(1.13.c). These waveforms have been used for neuromuscular stimulation by
physiotherapists for many years. Another type of waveform familiar to
physiotherapists is known as Faradism after Michael Faraday. This is a series of short
asymmetrical, bi-directional pulses which provide effective nerve stimulation, but
which are too short to stimulate muscle fibres directly.
Two types of waveform are most commonly used in stimulation, rectangular and
exponential. Each of these can be monophasic or biphasic. Monophasic waveform
Figure (1.13.d) requires the generation of unipolar pulses only and this is by far the

Chapter 1 Introduction
30
simplest method of stimulation pulse train production. The currents associated with
monophasic stimulation are unidirectional hence the charge is always injected into the
tissue at a single electrode and not recovered by a following pulse of opposite
polarity. That is why this waveform is not favoured for stimulation because it creates
charge imbalance and causes skin and tissue damage, Monophasic alternating
rectangular pulses Figure (1.13.e) are used to overcome the problem of charge
imbalance, (Campbell, 1984), (Donaldson, 1986).
Bi-phasic charge balanced Figure (1.14.f); consisting of stimulation pulses followed
by opposite polarity pulses and are produced when the current is capacitively coupled.
This waveform has been suggested by a number of authors as a safer method of
stimulation because of the charge-balanced property of the waveform, these authors
also reported that using symmetrical or asymmetrical bi-phasic waveform minimise
irritation and stimulation discomfort, (Rohlicek, 1964), (Campbell, 1984),
(Donaldson, 1986), (McNeal, 1988), (McCreery, 1992). The advantage of a
capacitively coupled waveform is that, although it is charge balanced, because of the
asymmetric shape of the pulse, depolarisation is more intense than repolarisation,
allowing the threshold for generating action potential to be reached. However
Rohlicek states that capacitive coupling of the pulse train to the body to remove any
d.c. component is not a suitable method of charge recovery and suggests that the use
of alternating pulse polarities within the pulse train produces the best compensation
for the ion transport of unipolar pulses, (McCreery, 1992).

Chapter 1 Introduction
31
Figure (1.13) - A selection of waveforms that could be used for stimulation.
a) Galvanic
b) Alternating
c) Faradic
d) Monophasic
e) Monophasic alternating
f) Bi-phasic charged balanced

Chapter 1 Introduction
32
Nilsson et al, suggest that the immediate following opposite polarity pulse may follow
the initial pulse at any time within the refractory period of the nerve under stimulation
and in fact they achieved good results with a 200 μs delay between the positive and
negative pulses (Nilsson, 1988). McCreery et al, also suggest that a further
improvement on this system of alternating pulses is to replace the single pulses of the
unipolar system with a positive pulse immediately followed by a negative pulse
injecting an equal amount of charge with negligible inter-pulse delay, (McCreery,
1992).
1.7 Summary
Several fundamental issues were identified in this chapter to help in setting up the
theme for this research thesis. At the beginning of this chapter some basic
neuromuscular physiology background was introduced. This background is needed to
help in understanding nerve and muscle electrical stimulation. The chapter also details
some of the lost muscle movement and disabilities aspects that can be restored using
the FES systems such as multiple sclerosis and stroke. The main electrical stimulation
techniques were introduced including transcutaneous stimulation. Factors affecting
transcutaneous stimulation were discussed. These factors included, skin impedance,
electrode size, electrode placement and all stimulation signal parameters such as
stimulation pulse amplitude, pulse width, stimulation frequency and pulse waveform.
Details reported by other researchers using electrode arrays in transcutaneous
electrical stimulation, has also been discussed. The next chapter will introduce foot
drop as the movement disability selected for this research. The chapter will present
detailed information about FES applications for foot drop and a general over view of
what other researchers have reported.

Chapter 2 FES and Foot Drop
33
Chapter 2
FES AND FOOT DROP

Chapter 2 FES and Foot Drop
34
CHAPTER 2: FES AND FOOT DROP
2.1 Foot drop Foot drop is the inability to dorsiflex the foot sufficiently to clear the ground. There is
a large population of potential users of foot drop prostheses; a fact that enables
researchers to select the most appropriate individuals to test newly developed
rehabilitation techniques, also these people with a low degree of injury, such as foot
drop, it is inherently safer to apply the rehabilitation assistive functional restoration
outside the laboratory as compared with those of more severe neurological damage. A
persistent, long-term disability in approximately 10 to 20% of stroke survivors is
upper motor neurone foot drop, (Burridge, 1997), (Leane, 1998). This typically
involves an inability to dorsiflex the foot during the swing phase of gait (drop foot),
loss of normal knee flexion, inability to “push-off,” and spasticity of the calf muscle
group. For the above reasons foot drop due to stroke and MS is the disability problem
that is the symptom of interest in this research.
Foot drop manifests itself during the swing phase of walking when the muscles in the
lower leg are unable to adequately lift the toes, so that the foot does not clear the
ground and is a hindrance to mobility. This is because of loss of function or over-
activity in one four primary movements of the foot, shown in Figure (2.1).
• Dorsiflexion - An upward movement of the foot
• Plantarflexion - A downward movement of the foot
• Inversion - An inward rotation of the foot with the sole facing towards the
centre line of the body
• Eversion - An outward rotation of the foot with the sole facing away from the
centre-line of the body
Foot Drop is usually caused by a combination of muscle weakness and spasticity
sometimes called spastic paralysis, which results in poor active control of the Tibialis
Anterior muscle and spasticity in the extensor muscles of the ankle, particularly the
triceps surae group. The effect of these two conditions is that the subject's

Chapter 2 FES and Foot Drop
35
dorsiflexion is significantly reduced, if not eliminated and also that there may be
excessive inversion, (Burridge, 1997). Foot drop can also be caused by partial
weakness or denervation of the dorsiflexor muscles.
Figure (2.1) – Dorsiflexion-Plantarflexion and eversion-inversion movements
2.1.1 The effect of Foot Drop on mobility The human gait cycle is, as is shown in Figure (2.2), composed of two phases; the
stance phase and the swing phase. During the stance phase, the leg in question is
supporting the body and making contact with the ground. During the swing phase, the
leg actually swings through the air to propel the body. The beginning of the swing
phase (which corresponds to the end of the stance phase) is identified by a gait event
called "Toe Off, where the toe is lifted from the ground to initiate swing. The end of
the swing phase (which corresponds to the beginning of the stance phase) is identified
by a gait event called "Heel Contact", where the heel of the foot makes contact with
the ground at the end of the swing phase, (Hamill, 1995), (Whittle, 1991).
Dorsiflexion Plantarflexion
Eversion Inversion

Chapter 2 FES and Foot Drop
36
Figure (2.2) - The human gait cycle, (Whittle, 1991).
These events are given different names by different researchers, for instance heel
contact is also referred to as "Initial Contact", (Vaughan, 1992). If a heel switch only
is used to detect the beginning and end of swing, then the toe-off event indicating the
beginning of swing will not be detected. In this case the gait event heel-off is detected
by the heel-switch and is used in FES applications in conjunction with a suitable delay
to indicate the beginning of the swing phase of gait. For foot drop FES applications,
the terms, heel-off, toe-off and heel-contact are most commonly used.
For the leg to be effectively swung through the air during the swing phase of gait, it is
necessary for the foot to be lifted and dorsiflexed to provide ground clearance. This
action can be seen in Figure (2.3), where the joint angular excursions and muscle
contraction patterns of a typical healthy subject during the gait cycle are illustrated. It
can be seen that, soon after the toe-off event, the ankle joint moves from a
plantarflexed position (approximately 40°) to the neutral position (0°) in a time period
corresponding to approximately 20 % of the gait cycle. The gait cycle is typically
quoted as having a period of 1 second, thus the ankle joint at toe-off undergoes a
dorsiflexion action of 40° in 0.2s, (Basmajian, 1985). Thus if a person is unable to
foot lift due to foot drop they will have great difficulty in obtaining ground clearance
during the swing phase and as a result, the execution of walking will be severely
affected. Lehmann et al, have presented data, which showed that a group of seven
hemiplegic subjects had an average walking speed of 0.463 m/s and that an age-match
group of seven able-bodied subjects had an average walking speed of 0.998 m/s,
(Lehmann, 1987). This suggests that there is a 53 % reduction in walking speed

Chapter 2 FES and Foot Drop
37
resulting from foot drop. The foot drop subject usually develops a characteristic
compensatory gait such as hip hitching or circumduction. Hip hitching refers to the
ipsilateral hip joint (affected hip joint) being lifted in the air, to effectively give the
plantar-flexed foot ground clearance. Circumduction refers to the leg being rotated
around the hip joint to form a cone shape, again providing ground clearance.
The foot drop person's energy consumption during walking is also increased, due to
the reduction in the efficiency of walking. To correct hemiplegic foot drop, the
damaged functionality must be assisted using an orthosis. Using Physiological Cost
Index to measure energy consumption, (Burridge, 1997) found a 20% increase in
Physiological Cost Index for a hemiplegic Foot Drop sufferer from walking without
an orthosis to walking with an orthosis.
There are two orthotic approaches to the correction of hemiplegic Foot Drop:
• Mechanical Orthosis
• Electrical muscle stimulation
Orthotic-assisted hemiplegic foot drop correction in the presence of spasticity in a
subject presents significant problems. Whether the orthotic approach adopted is
mechanical or electrical, its objective must be to provide dorsiflexion during the
swing phase of gait. When the foot is dorsiflexed during swing, the corresponding
stretching of the calf muscles may trigger a spastic response of the calf, due to
sensitivity of its muscle spindles to stretch and velocity of stretching with reflex
inhibition removed. The calf muscles group is significantly more powerful than the
tibialis anterior muscle, which is the prime mover of dorsiflexion, and as a result its
contraction will overcome or significantly weaken the attempts to dorsiflex the foot.
Thus, whatever orthotic approach is adopted, attention must be paid to the level of
spasticity in the subject's calf muscles on the affected side and to both the amount and
rate of stretching of the calf muscles produced by the orthotic mechanism.

Chapter 2 FES and Foot Drop
38
Figure (2.3) - Joint Angles and Muscle Activity during the Gait Cycle
(Basmajian, 1985)
2.1.2 Electrode placement for Foot Drop correction
As described, the placement of the stimulation electrodes is a very important part of
the process, as misplacement will render the system either inoperable or else
performing below full capability. For the correction of Foot Drop, using the
traditional two electrodes the electrodes may be placed to stimulate the common
peroneal nerve and/or dorsiflexor/evertor muscle group, the active electrode (cathode,
when using Monophasic stimulation signal), is placed over tibialis anterior or the

Chapter 2 FES and Foot Drop
39
common peroneal nerve, one finger breadth below the head of the fibula and the
indifferent electrode (anode, when using Monophasic stimulation signal) is located 5
cm below and slightly medially of the active electrode or behind the knee. To test the
electrode position, stimulation can be applied with a very low stimulation intensity
setting and the intensity can be increased until dorsiflexion produced. If dorsiflexion
is not achieved, then the active electrode position is adjusted until dorsiflexion is
produced, (Baker, 2000).
The active electrode position is also adjusted until desired dorsiflexion is produced,
i.e. slightly eversion achieved. Bringing the active electrode slightly forward may
reduce eversion and bringing the active electrode slightly back reduces inversion. This
placement procedure can be explained by referring to Figure (2.4), Figure (2.5), and
Table (2.1). As the active electrode position is adjusted around the branch of the
common peroneal nerve, there are three possible outcomes:
1. Stimulation of the Common Peroneal, resulting in strong dorsiflexion, some
plantarflexion, some eversion and some inversion.
2. Stimulation of the Deep Peroneal nerve, resulting in dorsiflexion and some
inversion
3. Stimulation of the Superficial Peroneal nerve, resulting in some plantarflexion and
some eversion.
Thus the placement of the active electrode attempts to balance the eversion and
inversion actions, reduce plantarflexion and obtain strong dorsiflexion. The
positioning of the common peroneal branch will vary from subject to subject, due to
variation in the anatomy and muscle physiology of a subject and thus adjustment of
the positioning of the electrodes will be required, when a foot drop stimulation system
is fitted to a subject.

Chapter 2 FES and Foot Drop
40
Figure (2.4) - Posterior view of the nerve supply to the lower leg, (Davies, 2001)
Figure (2.5) - Anterior and lateral views of the leg muscles, (Hamill, 1995)

Chapter 2 FES and Foot Drop
41
Muscle name Action Innervation Tibialis Anterior Prime mover of dorsiflexion; Inverts
foot Deep peroneal nerve
Extensor Digitorum Dorsiflexes foot; Prime mover of toe extension
Deep Peroneal nerve
Peroneus Tertius Dorsiflexes foot and extends great toe
Deep Peroneal nerve
Extensor Hallucis Longus
Dorsiflexes foot and extends great toe
Deep Peroneal nerve
Peroneus Longus Plantar flexes and everts foot Superficial Peroneal nerve
Peroneus Brevis Plantarflexes and everts foot Superficial Peroneal nerve
Table (2.1) - derived from, (Hamill, 1995)
2.2 Prior foot drop FES research overview
2.2.1 Transcutaneous foot drop stimulators The correction of the foot drop condition was one of the first successful applications
of FES and has since been the most widely used both in its basic form as well as in a
number of variations resulting from technological advances in the field. There are
three main reasons for the relative success of the method and the persistence of the
researchers to continuously improve on it. Firstly there is a large population of
potential users of drop-foot FES prosthesis; a fact that enables researchers to select
the most appropriate individuals to test newly developed techniques (Burridge, 1997).
From these individuals a significant proportion eventually uses this method on a
permanent everyday life basis. Equally important is the fact that in people with a low
degree of injury, such as foot drop, it is inherently safer to apply FES for functional
restoration outside the laboratory as compared with those of more severe neurological
damage. Most people with foot drop retain good overall motor function and preserved
sensation. Finally the relative donning-doffing of the FES system involved requires
less effort and little user dexterity, it is more reliable and durable than more complex
systems and hence it can be more easily given to patients to apply and use for
themselves on a daily basis.

Chapter 2 FES and Foot Drop
42
The first proposed FES application to restore foot drop was a single channel
stimulator designed by Liberson in 1961 to dorsiflex the ankle of dropped foot
patients during the swing phase of walking gait, Liberson’s system incorporated foot
triggering foot-switch, (Liberson, 1961). Following Liberson, several researchers
produced similar systems. Moe and Post, (Moe, 1962), described the use of a
commercial drop foot stimulator whose housing had a curved design to facilitate its
use as a belt-worn device and, as discussed, proposed the use of the term FES to
describe the technique. Due to the potential in using FES systems in various
applications a considerable amount of research into FES for foot drop has been
undertaken over the years, utilising single and multi-channel stimulators. Vodovnik,
Dimitrijevic, Prevec, and Logar, (Vodovnik, 1965), from the University of Ljubljana
introduced the functional peroneal splint (FPS). The FPS also incorporated foot
triggering using the conventional foot-switch. Dimitrijevic et al, also described similar
foot drop stimulator trigged with a heel switch, (Dimitrijevic, 1968). The work of
Vodovnik and his co-workers at Ljubljana led to development of a series of
commercial hard-wired single channel drop foot stimulator devices at Ljubljana,
namely, the PO-8 (Bowman, 1985), and the FEPA and the MICROFES (Acimovic,
1987). The PO-8 device featured an elastic knee support with built-in electrodes. The
Functional Electronic Peroneal Apparatus (FEPA)-10, featured a large intensity
control knob.
In 1982 The FESE-L2 system was introduced by Griethuysen et al, it consists of a
stimulator unit attached to an elastic knee band. The stimulating electrodes are fixed
in the elastic band and held over selected positions on the leg that dorsiflex the foot. A
heel switch placed in the shoe of the affected leg controls activation of the stimulator.
Stimulation begins with the lifting of the heel and ends on heel contact or after 3
seconds, which ever occurs first. Additional delays to the on and off times can also be
introduced to suit the requirements of the gait of the individual subject, (Griethuysen,
1982). In 1975, Takebe et al, used a commercial drop foot stimulator manufactured by
Philips. The Philips functional electronic peroneal stimulator system consists of the
stimulator box, the stimulating electrodes and a rubber insole that fits into the shoe of
the unaffected leg. Electrode positioning is the same as for the previous case, whereas
activation of the stimulator is controlled through the increased pressure of the toe
section of the insole, transferred to the stimulator via a rubber tube, (Takebe, 1975).

Chapter 2 FES and Foot Drop
43
The main difference from Liberson’s design was the use of an air-filled insole foot-
switch. The insole was connected to the stimulator using a rubber tube, which
conducted the increases in air-pressure, occurring at heel-strike, to the stimulator.
The ODFS (Odstock Drop Foot Stimulator) peroneal stimulator is another typical
single channel device that was used and described by , Burridge, Taylor, Hagan, and
Swain, (Burridge, 1997). In 1996, Granat, Maxwell, Ferguson, Lees, and Barbenel
(Granat, 1996) used a single channel surface stimulator with the added feature of
recording the length of time stimulation is delivered. This feature is useful in
assessing the amount of use a subject makes of the stimulator outside the clinic.
The first to introduce the use of multi-channel FES was Kralj and his co-workers from
the University of Ljubljana in Slovenia (Kralj, 1971). They described the use of three
channels of stimulation in their portable stimulator. The three stimulation channels
enabled different muscle groups to be controlled independently, such as ankle
dorsiflexors and knee flexors and extensors. A drawback of the system was that the
clinician was required to make multiple adjustments to optimize the delay settings for
each of the three stimulation channels following detection of the heel-off event. Kralj
et al, were of the opinion that multi-channel stimulation would not become routine
until the size and weight of the portable unit could be reduced. In order words, multi-
channel stimulation was not practical with the integrated circuit technology available
at the time (Kralj, 1971). A follow-up study by the Ljubljana group six years later in
1977, (Strojnik, 1979) evaluated six-channel stimulation. This system was designed to
evaluate, in a clinical setting, the appropriate sequence of muscle stimulation required
for a particular subject’s pathology and thus was not a home-use system. The Strojnik
six-channel stimulator system used a heel switch built into a shoe insole to control
application of the six channels of stimulation. Based on Takebe’s earlier finding
(Takebe,1975), subjects having difficulty with system size, weight and daily
placement of electrodes, a six-channel surface stimulation system is evidently not
suitable as a take-home system. It would be an impossible task for a hemiplegic
subject, or their carer, to correctly place six pairs of electrodes at different muscle
locations on a daily basis. The implementation of multi-channel systems using hard-
wired technology resulted in systems which were difficult to configure, and
highlighted the need for microprocessor technology to enable a more user-friendly
Chapter 2 FES and Foot Drop
44
programmable implementation of multi-channel stimulation. Bogataj et al, are the first
to have reported the first use of microcontroller and microprocessor technology in a
drop foot stimulator (Bogataj, 1984). Bogataj’s system was a six-channel stimulator
of six arrays of switches permit the selection of stimulation amplitude for each
stimulation channel, and also gives a graphical indication of the selection. The system
included a simple stride analyzer. The parameters measured were: number of steps,
mean stride time, and mean heel-on times.
The experimental multi-channel stimulators, such as the six channels programmable
stimulator described by Brandell, are only manually programmable via switches on
the unit and do not self-adjust. This mode of operation leads to the use of a fixed open
loop control strategy of the lower leg muscles, (Brandell, 1986). This system was not
suitable for take-home use, as previously discussed multi-channel stimulation is only
suitable for use in the clinic, thus a system like this is primarily for clinical use. In the
1990s, a portable two-channel drop foot stimulator O2CHS was developed using
hard-wired technology by the group at Salisbury District Hospital, UK. Setting up
different stimulation options on the O2CHS is achieved using a complex combination
of DIP (dual in-line package) switches and potentiometer settings (10 potentiometer
and 10 DIP switches. Some other multi-channel stimulators have been utilised,
(Graupe, 1997), (Bogataj, 1989), (Davis, 1987), (Handa, 1992), (Akazawa, 1989),
(Kralj, 1986), (Meadows, 1989).
The application of microprocessor technology in surface Drop foot stimulator led to a
dual-channel foot drop stimulator design by the Ljubljana group in 1992 (Malezic,
1992). The stimulator programmer unit also allowed the clinician to load fixed
stimulation sequence settings and the only stimulus parameter adjustable by user was
stimulus amplitude. Popovic, Keller, Pappas, and Müller, described a programmable
stimulator, which could potentially be applied in drop foot correction (Popovic, 2001).
The stimulator is a four-channel stimulator with two sensor inputs. The unit also has a
port, which can be used to cascade additional stimulators together, to communicate
serially with a PC or to trigger stimulation using a push-button. The unit is
programmed using a PC-based graphical user interface (GUI). Generally due to the
size and complexity of the multi-channel stimulators, they remained at the
experimental stage.

Chapter 2 FES and Foot Drop
45
Significantly, the stimulation systems discussed earlier utilise fixed pulse parameters
during the stride and merely activate or deactivate the pulse train sequences, while
neither design incorporated the ability to perform self-adjustment of any parameters
using closed loop control, they are generally adjustable to suit individual patients but
fixed whilst in use. Also within all these systems, locating the electrode placement
position when using all these FES systems can prove a challenging task for the user.
Placement of the indifferent electrode over the tibialis communis is relative
straightforward, whereas accurately identifying the peroneal nerve’s surfacing can be
a time consuming task. Non-optimal electrode placement may cause poor eversion
and dorsiflexion or even plantarflexion of the foot (Granat, 1996). Furthermore many
of these patients may have limited hand function that further restricts their ability to
properly position the stimulating electrodes as well as perform the rest of the donning
and doffing process. This research was focused on using transcutaneous electrode
stimulation not implanted electrodes, but it important to mention that a lot of
researchers are using implanted electrodes such as (Hutten, 2002), (Kottink, 2004).
Hutten et al presented a study using to evaluate the stimulation responses on each
channel of an implantable two-channel stimulator that stimulates the peroneal nerve
branches innervating the muscles for dorsiflexion and eversion movements. both
dorsiflexion and eversion direction can be set individually and with great accuracy
(Kottink, 2004).
2.2.2 Foot gait detection
2.2.2.1 Foot switch
Since Liberson’s development of the first drop foot stimulator to the early 1990s,
most of these FES systems in use for foot drop correction typically employ foot
switches (Waters, 1975), (Brandell, 1986), (Crago, 1986), (Malezic, 1984), (Bogataj,
1989), (Rushton, 1997), (Ott, 1998), such as mechanical switch, force sensitive
resistors, an air pressure switch under the heel or ball of the foot to indicate the start
of the gait movement and lift the toes of the affected limb, (Takebe, 1975). The
problems encountered with this type of switch are mainly reliability and gait events

Chapter 2 FES and Foot Drop
46
detection accuracy, (Vodovnik, 1965), (Waters, 1975), (Willemsen, 1990), (Haugland,
1995), (Ott, 1998), For these reasons several researchers have evaluated alternative
gait sensors using either another type of gait sensor, which would be suitable for
implantation, or using the body’s “natural” sensors.
2.2.2.2 Natural sensors
A proposed solution to the problems of gait sensors in FES-based foot drop correction
systems is to use Electromyography (EMG) measurements sensors of the pectoralis
muscles’ activity to detect gait events and control the stimulation; although very
effective the proposed system did not provide information about gait phases, (Graupe,
1983). Another interesting method for detecting transitions between the stance and
swing phases to control the timing of the stimulation sequences generated by FES
systems for walking, was based on measurements of afferent nerve activity with
implanted nerve-cuff electrodes. Recording nerve signals is referred to as
Electroneurography “ENG”. Haugland and Sinkjar described the use of recordings
from a cuff electrode, on the sural nerve, to control the application of stimulus to the
common peroneal nerve of a hemiplegic subject (Haugland, 1995). A few problems
were identified with the system; first the need to eliminate the wires going through the
skin or implanting a neural amplifier; some false detection of the heel-strike occurred.
In 1999 Strange and Hoffer presented some gait detection results recorded from cats
and suggested that there detection system could be used as a reliable source of
feedback for closed loop control of functional electrical stimulation, (Strange, 1999).
Upshaw and Sinkjaer compared the performance of natural cuff electrode sensor
versus artificial standard heel contact switch sensors when used in a closed-loop foot
drop electrical stimulation system, the results show a great advantage and accuracy
achieved from using the natural cuff electrode sensor over the standard foot switch,
(Upshaw, 1999). Systems measuring afferent nerve activity are invasive, sensitive to
electromagnetic interference, and so far provide information about only one gait
event.

Chapter 2 FES and Foot Drop
47
2.2.2.3 Inertial sensors
One of the first groups to propose an alternative artificial sensor to the foot-switch as
a gait sensor in foot drop stimulation systems was Symons et al. This involved the
preliminary evaluation of an in-house accelerometer to detect heel strike, (Symons,
1986). Kirkwood et al, presented combined measurements from goniometers and
instrumented shoe insoles to derive four distinct gait phases using inductive learning
techniques. The experiments performed in their laboratory showed that the detection
accuracy of the proposed system was between 70% and 90%. However they reported
that this was insufficient for practical applications, (Kirkwood, 1989).
The evaluation of using alternative artificial sensors carried out by Symons was not
very extensive. Willemsen et al, proposed the use of an integrated accelerometer as a
replacement for the foot-switch in foot drop correction system, they calculated the
equivalent acceleration of the ankle joint by using accelerometers between the ankle
and the knee joint to distinguish stance and swing phases during the gait cycles,
(Willemsen, 1990). In 1996 Dai et al, investigated the use of inertial tilt sensor to
control of Functional Electrical Stimulation to improve the gait of persons who had a
foot drop due to stroke or incomplete spinal cord injury, the system demonstrated gait
improvement for some subjects with several advantages over traditional stimulators
controlled by foot switches, (Dai, 1996).
Gait detection using gyroscope has proved to be another alternative technique for gait
analysis, Tong and Grant showed that with the use of two gyroscopes, one placed on
the thigh and the other one on the shank, one can measure the knee angle during
walking, (Tong, 1999). Luinge et al, investigated the estimation of joint segment
orientation, using a combination of solid-state gyroscopes and integrated
accelerometers; however no clear correspondence has been established between gait
events and the pattern of the gyroscope angular velocity measurements. Therefore
these gyroscope inertial sensors systems were considered suitable only for
applications where the subject is almost stationary or at slow movement, (Luinge,
1999).

Chapter 2 FES and Foot Drop
48
Veltink et al, tried to distinguish between several static and dynamic activities
(standing, sitting, lying, walking, ascending stairs, descending stairs, cycling) using a
set of two uniaxial accelerometers. The standard deviation of the accelerometer signal
and the cycle time were primarily related to the speed of the dynamic activities, and
did not contribute to the discrimination of the activities. Therefore, discrimination of
dynamic activities on the basis of the combined evaluation of the mean signal value
and signal morphology is proposed, (Veltink, 1996).
In 2000 rule based detectors were used with a single cluster of accelerometers by
Williamson et al, (Williamson, 2000). The accelerometer was attached to the shank
for the real time detection of the main phases of normal gait during walking. The gait
phase detectors were synthesized from two rule induction algorithms, Rough Sets and
Adaptive Logic Networks. A three dimensional inertial sensing system for measuring
foot movements during gait was proposed by Veltink et al, the investigation carried
out using implanted two-channel foot drop stimulator. This study indicates that foot
movements can be reconstructed from 3D inertial sensor signals such as to distinguish
the change of foot movements during swing when the stimulation parameters of the
two channels are adapted. This sensitivity is a pre-requisite for an automated
balancing system for both stimulation channels of the foot drop stimulator, but the
feasibility of such an automated system was not demonstrated, (Veltink, 2003).
Mathie et al, reported the use of a single, waist-mounted triaxial accelerometer system
to monitor a range of different parameters of human movement in an unsupervised
setting. The movements were first divided into activity and rest. The activities were
classified as falls, walking, transition between postural orientations, or other
movement. The postural orientations during rest were classified as sitting, standing or
lying, (Mathie, 2004).Tanaka et al, have developed prototype device for monitoring
human posture and walking velocity in ambulatory subjects using 3 accelerometers
and one gyroscope, The preliminary study using the prototype show that the initial
value of the thigh angle just before starting walk could be determined and thus, the
problem of the error accumulation by integration of the gyroscope signal could be
eliminated, but further tests are required, (Tanaka, 2004).

Chapter 2 FES and Foot Drop
49
2.2.3 Foot drop control
In order to control movement of the human limbs in a manner similar to that of
the central nervous system, FES systems require some means of controlling the
stimulation sequence. Many control architectures have been tried during the years of
FES development in a continuous attempt to make these systems more successful in
achieving the functionality and reliability standards required for practical use outside
the laboratory. Foot drop FES systems have been the most widely used application
of electrical stimulation. Also, it offers itself for experimentation with a wide range of
control schemes, several open and a few closed loop systems featuring ambitious
control algorithms have been tested in the laboratory and trial groups.
Stanic, Trnkoczy, Acimovic, and Gros described the use of gradually modulated
electrical stimulation, where the system store the required stimulation sequence
(Stanic, 1977). Prochazka and Wiles evaluated closed loop control of dorsiflexion
angle using a length sensor attached across the ankle joint, (Prochazka, 1983). The
recent developments in computer technologies and software engineering have led to
the flourishing of radical control strategies like the neural network adaptive control
and machine learning techniques, Granat and Heller (Granat, 1993), Graupe and
Kordylcwski (Graupe, 1997), Abbas and Chizeck (Abbas, 1995), (Kostov, 1995,
1999), (Yamaguchi, 1990), (Khang, 1989), (Willemsen, 1990), (Haugland, 1995),
(Sepulveda, 1995), (Crago, 1996). Mourselas and Granat described one of the latest
prototype foot drop stimulation, which applied closed loop control of dorsiflexion
angle using fuzzy techniques (Mourselas, 2000). The fuzzy controller was
implemented on a microcontroller and ankle flexion was monitored using a flexible
resistive goniometer. Heel contact was also monitored using a FSR foot switch. The
closed-loop system consistently performed better than the open-loop system by
providing improved dorsiflexion.

Chapter 2 FES and Foot Drop
50
Most of the foot drop control methods proposed to date have been adapted from
industrial control applications where the control problems are usually better defined
and of a considerably lower degree of complexity. On the other hand classification of
the control strategies as applied to the human body can be performed with the same
criteria as for totally man made systems.
2.5 Summary This chapter introduced the problem of foot drop. Careful attention was paid to the
difference of the walking gait between normal and affected foot drop subjects. A
background of the muscle and nerves responsible for the foot movements was
presented. This chapter also discussed the hypothesis of how electrical stimulation can
be used to correct foot movement. A literature review of developed foot drop systems
by different researchers over the last 40 years has been discussed. This has included a
review of foot gait detection using feedback, particularly inertial sensors used to
control the stimulation. Toward the end of the chapter the problem associated with
current commercially available foot drop systems was discussed. In the next chapter
the new stimulation system designed during this research will be presented. This
design is mainly based on the transcutaneous stimulation understanding demonstrated
in the previous chapters and on the research investigation requirements, such as
electrode array and combination of inertial feedback sensors.

Chapter 3 System Design
51
Chapter 3
SYSTEM DESIGN

Chapter 3 System Design
52
CHAPTER 3: SYSTEM DESIGN
3.1 Introduction
One of the primary aims and challenges in this research was to design and develop a
stimulation system that can be used to fulfil the research investigation requirements.
Current commercially available stimulation systems and devices are very simple in
operation as discussed earlier; therefore they are not suitable to be used in this
research. These available systems produce a fixed stimulation signal and they have
very limited feedback channels. The set up process for these stimulators always takes
a long time particularly to find the best electrode position. This set up process has to
be done by specialists as the patients are unlikely to do it by themselves. Almost all of
these available systems can not be pre-programmed with control algorithms or
patterns. The available portable compact stimulation systems have a very limited
number of stimulation channels. The research requirements at this level of decision
making ability suggest the use of microprocessor or microcontroller based system,
such a system permits the creation of software to implement the decision making
procedure. The proposed system design architecture at the beginning of the design
process is shown in Figure (3.1).
The key elements (functional blocks) for this stimulation systems design are:
• The user interface to give full control and monitoring over the stimulator
output and feedback if required
• A stimulation pulse generator that generate the pulse, vary its shape, width and
repetition rate also vary the pulse amplitude and stimulation envelope rise-fall
time, the ranges of these parameters were based on the stimulation parameters
discussion in chapter 1.
• An output stage amplifier that can amplify the produced stimulation signal to
the required stimulation level, also this amplifier should fulfil the safety
requirement for the system

Chapter 3 System Design
53
Figure (3.1) - Proposed system architecture
• An electrode array switcher to steer the amplified stimulation signal to an
array of electrodes
• A battery power supply that can provide the system with the required power
for as long as possible to perform its functions, also to facilitate designing a
safe portable system
• Feedback sensors to give full information about the performed stimulation and
movement responses in real time
The design and development process consumed a lot of time and effort and
toward the end of this research three systems were designed and implemented. Each
system version overcame the problems associated with the previous one and gained
some more features to match the new research requirements and specification. The
first two versions are discussed in appendix (B-1) and the latest version is discussed in
this chapter.
Power Supply
Trigger signal
User Interface and Control
Electrode
Array
Stimulation subject
Switcher
Array
Output stage
Pulse Generator

Chapter 3 System Design
54
3.2 Stimulation system [ST32 FES system]
This system was developed on the basis of the experience gained during designing
and testing version 1 and 2 presented in appendix (B-1). The main aim was to
overcome all these problems associated with the old versions and build a new system
using the latest embedded system technology to produce a portable and safe
stimulation system capable of providing all the research needs. The new (ST32 FES)
system design specifications are listed below.
3.2.1 Specifications
- Easy user interface and control over the stimulator
- Produce 12 or more different stimulation waveforms shapes
- Digital control over the stimulation amplitude, range (0% to 100%) of the
maximum output stage peak-peak voltage (400V peak to peak no load)
- Digital control for stimulation waveform pulse width, ranges (50μs Min to
500μs Max).
- Digital control over stimulation frequency range of 10Hz to 200Hz, which
give a pulse repetition rate range of 100ms to 5ms.
- Producing single twitch signal pulse, manually and automatically
- Digital control over stimulation signal envelope rise time, extension time and
fall time
- Digital control over 32 electrode array high voltage switching circuit.
- Modify pulse parameters on pulse-by-pulse or envelope by envelope basis
- Analogue and/or digital Interface to FSR, gyroscope and accelerometer
sensors
- Process analogue and digital data from real time feedback sensors
- Ability to be programmed with various advanced control algorithms to control
the system using real time feedback data
- Produce comfortable stimulation
- Portable system
- A safety stop switch to stop stimulation in an emergency (user control)
- Longer life battery powered system

Chapter 3 System Design
55
- Patient isolation and safety
- Meet the British standard and safety requirements for medical equipments
[BSEN 60601-1]
3.2.2 System configuration:
The system was developed to match the specifications listed above; a functional block
diagram for the system is shown in Figure (3.2). This was the final stimulation system
design during this research and it is the design approved by the Medical Equipment
Management Organization (MEMO) of UBHT NHS Trust in Bristol and was used for
patient clinical trials. This system functional blocks is discussed in detail in the
following few sections.
Figure (3.2) – (ST32 FES) system architecture
Keypad
4x4
LCD Interface
20 X 4
Battery Power Supply
Accelerometer
Gyroscope 1
32 Electrode
array
F
Accelerometer
Pulse Generator
Microcontroller
Output Stage
High voltage Switcher
Sensors signal conditioning
Gyroscope 2
FSR

Chapter 3 System Design
56
3.2.3 Microcontroller and embedded firmware
This latest system version used one of the latest released Microchip microcontrollers,
the PIC18F8. It is a low-power high-speed flash CMOS device running at 40 MHz.
This microcontroller is running at 40 MHz with 100ns instruction cycle execution
speed. It has 64Kbytes program memory and 1Kbytes of EEPROM data. The
PIC18F8 has 68 digital Input/Output ports, 16-channel of 10-bit ADC. It features five
16bit Capture/Compare/PWM modules with 10- bit resolution and five 8/16 bit timer
modules. It has the capability of in-circuit serial programming and debugging as well
as self programming. Combination of custom made assembly language (MPASM™
macro assembler) and C language using microchip PIC18C compiler, were used for
programming this microcontroller. This microcontroller carry out all real time
feedback signals processing and control of the overall the stimulation system as will
be explained in the next few sections. The embedded microcontroller firmware code
design for this system is included in the Appendix (B-4).
3.2.4 User interface and control
The user interface in this system was based on using (4x4) membrane keyboard and
(4x20) line LCD as shown in Figure (3.4). The microcontroller communicated to the
LCD using three control lines and eight parallel data bus and communicated to the
key board using 6 lines as shown in Figure (3.4). This arrangement allowed easier
user interface by allocating simple functions to each key, and displaying more
information on the LCD about the stimulation processes on a step be step basis.
Figure (3.4) - ST32 system interface

Chapter 3 System Design
57
3.2.5 Stimulating signal generator
This stimulation signal generator was based on the digital synthesis technique. It was
programmed to allow 12 different stimulation waveform shapes to be stored. Five of
these stimulation waveforms are shown in Figure (3.5) and were used in the trials.
The signal generator had digital control over all the stimulation signal and envelope
parameters described earlier in the specification. All these parameters could be varied
using the keypad and the display even when stimulation was applied to the patient. An
emergency hand held button stop switch was also used. This allowed the patient to
stop the stimulation (through software control only) as a precaution should anything
go wrong while using the system. The stimulation signal generator schematic circuit
is shown in Figure (3.6). As shown in the schematic the microcontroller is the heart of
this circuit. As stated earlier the microcontroller was flash programmable and had a
large memory that could be programmed internally with preset waveform shapes
including. Each waveform was formed from 200 samples and stored in the memory as
digital data. These digital waveforms were converted to analogue using a parallel
interfaced 8-bit MDAC that provided very high speed performance. The analogue
signal amplitude was controlled by an additional Digital to Analogue Converter
(DAC) connected to the reference input of the MDAC to give waveform amplitudes
ranging from 10 m V to 1 V peak-to-peak by 10 mV step. This signal was not suitable
to be amplified using the output stage amplifier and required additional amplification
and buffering. This was achieved using a high-speed operational amplifier with a gain
of 10 to boost this signal to 10V Peak-to-Peak.
waveform 1 Square wave waveform 2 Balanced Square wave
waveform 3 sine wave 1 cycle waveform 4 sine wave 2 cycle
waveform 5 sine wave 3 cycle
Figure (3.5) - Stimulation waveform shapes

Chapter 3 System Design
58
Figure (3.6) - ST32 main circuit schematic
<Doc
><R
evC
ode>
FES
PIC
18
B
45
Mon
day
, Nov
embe
r 29,
200
4
Title
Size
Doc
umen
t N
umbe
rR
ev
Dat
e:S
heet
of
VDD
5V
LO
0
VDD
5V
VDD
VCC
VD
D
HI
+ 5V
+ 5V
+ 5V
+ 5V
+15V
-15V
VCC
GN
D
DAC
1
Driv
LE
DAC
1
Row
4
Row
4
MAX
O
Col
1
Driv
CLK
MAX
_CLK
Driv
DI
Res
et
MAX
_CLK
DAC
3
DAC
7
E
Row
1R
ow 2
Col
2
MAX
_DI
Res
et
DAC
0
MAX
_CS
MAX
O
PB1
DAC
6
DAC
4
RW
DAC
3
MAX
_CS
Col
4
Buz
zer
Row
1
DAC
6D
AC5
Row
3
Col
2
D4
Col
1
D5
Buz
zer
Col
3
PB3
DAC
5
DAC
7
PB2
DAC
4
MAX
_DI
D7
DAC
2D
6
DAC
0
DAC
2
CLK
Col
3
CLK
stop
swi
tch
Driv
DI
Driv
CLK
Driv
LE
D6
D5
D7
E D4
RW
Col
4
stop
swi
tch
PIN
47
PIN
52
O/P
LE
D
LF35
3 O
utpu
t Sig
nal t
o L2
72 in
put
sign
al
Driv
DI
Driv
CLK
Driv
LE
+15V
-15V
VC
C
Res
etV
DD
VSS
PIN
47P
IN52
RS
RS
Y-a
xis
X-ax
is
VSS
VSS
Gyr
o-X
Gyr
o-X
VSS
VSS
VSS
VSS
VSS
Gyr
o-Y
X-ax
is
VSS
VSS
VSS
Gyr
o-Y
Y-a
xis
VSS
VSS
VSS
VSS
VSS
Row
3
Row
2
VDD
VD
D
VDD
VDD
VD
D
VDD
VD
D
VDD
VD
D
VD
D
VD
D
VD
D
VD
DVD
D
VD
D
VDD
VDD
VD
DV
DDVD
D
VD
D
-15V+15V
O/P
LE
D
FSR
3
FSR
3
FSR
1
FSR
1
NC
21
NC
10
NC
13
NC
22
NC
3
NC
16
NC
20
NC
4
NC
13
NC
25
NC
10
NC
20
NC
19
NC
14
NC
12
NC
8
NC
5
NC
15
NC
8N
C9
NC
2
NC
4
NC
6
NC
11
NC
5
NC
24
NC
7
NC
25N
C24
NC
3
NC
11
NC
21
NC
2
NC
17
NC
6
NC
18
NC
14
NC
23
NC
12
NC
16
NC
1
NC
9
NC
1
NC
22
NC
7
NC
19
NC
15
NC
17
NC
23
FSR
2
FSR
2
R21 2.2 K
R29
8k
200R
R20
10k
R14
470
C18 33
uF
Tan
talu
m
C52
0.1u
F
R40
R
D9
LED
U7
PIC
18F8
621
1 2 3 4 5 6 7 8 9 10 11 12 13 14 15 16 17 18 19 20 21 22 23 24 25 26 27 28 29 30 31 32 33 34 35 36 37 38 39 4041424344454647484950515253545556575859606162636465666768697071727374757677787980
RH
2/A1
8R
H3/
A19
RE
1/AD
9R
E0/
AD8
RG
0/C
CP
3R
G1/
TX2/
CK
2R
G2/
RX2
/DT2
RG
3/C
CP
4/P3
DM
CLR
/VPP
/RG
5R
G4/
CC
P5/
P1D
VSS
VDD
RF
7/SS
RF
6/AN
11R
F5/
AN10
/CVR
EF
RF
4/AN
9R
F3/
AN8
RF
2/AN
7/C
1OU
TR
H7/
AN15
/P1B
RH
6/AN
14/P
1CR
H5/
AN13
/P3B
RH
4/AN
12/P
3CR
F1/
AN6/
C2O
UT
RF
0/AN
5AV
DD
AVSS
RA
3/AN
3/VR
EF+
RA
2/AN
2/VR
EFR
A1/
AN1
RA
0/AN
0VS
SVD
DR
A5/
AN4/
LVD
INR
A4/
T0C
KI
RC
1/T1
OS
IR
C0/
T1O
SO
/T13
CK
IR
C6/
TX1/
CK
1R
C7/
RX1
/DT1
RJ4
/BA
0R
J5/C
ER
J6/L
BR
J7/U
BR
C2/
CC
P1/
P1A
RC
3/S
CK/
SCL
RC
4/SD
I/SD
AR
C6/
TX1/
CK1
RC
5/S
DO
RB7
/KBI
3/P
GD
VDD
OS
C1/
CLK
IO
SC2/
CLK
O/R
A6
VSS
RB6
/KBI
2/P
GC
RB5
/KBI
1/P
GM
RB4
/KBI
0R
B3/I
NT3
RB2
/IN
T2R
B1/I
NT1
RB0
/IN
T0R
J3/W
RH
RJ2
/WR
LR
J1/O
ER
J0/A
LER
D7/
AD
7/P
SP7
RD
6/A
D6/
PSP
6R
D5/
AD
5/P
SP5
RD
4/A
D4/
PSP
4R
D3/
AD
3/P
SP3
RD
2/A
D2/
PSP
2R
D1/
AD
1/P
SP1
VSS
VDD
RD
0/A
D0/
PSP
0R
E7/A
D15
RE6
/AD
14R
E5/A
D13
RE4
/AD
12R
E3/A
D11
RE2
/AD
10R
H0/
A16
RH
1/A1
7
R32
1K
sensors connectors
Accelerometer
Gyr
osco
pe
J6
Acc
eler
omet
er
1 2 3 4 5 6 7 8 9 10 11 12 13 14
R19
220
C22
1uF
Tant
alum
U5
7 6 5 12348
Row
2 C
Row
3 B
Row
4 A
Col
1C
ol 2
Col
3C
ol 4
Row
1 D
C47
1uF
Tan
talu
mC
500.
1uF
R17 2.2 K
U10
14131211108 97651 2 3 4 1615D
B7D
B6D
B5D
B4D
B3
DB1
DB2
DB0E
R/R
W
VSS
VDD V0 RS KA
C55
0.01
uF
C19
0.1u
FR
228k
C56
1uF
Tan
talu
m
R18
8k
200R
J5 DAT
A
1 2 3 4
R38
5k
C41
0.1u
F
+ -
U9A
LF35
3N
3 21
8 4
C21 0.
1uF
R30
1K
C15
0.1u
FC
14 1uF
Tan
talu
m
R28
13
2
R39
1k
Buz
2 1
- +
JP10
JUM
PER
12
C17
0.1u
F
U8
DAC
08
12 11 10 9 8 7 6 5 14 15
4 2 16 113 3
B8
B7
B6
B5
B4
B3
B2
B1
VR
+
VR
-
IOU
T
IOU
T
CO
MP
VLCV+ V
-
MAX533
U11
1 2 3 4 5 6 7 891016 1315 12 1114
OU
TBO
UTA
RE
FU
PO
PDE
LDAC
CLR
DO
UT
CS
SC
LK
OU
TC
VDD
OU
TD
DG
ND
DIN
AGN
D
C46
0.1u
F
200R
R16 2.2 K
R15 2.2 K
C53
0.1u
F
R24
10K
13
2
C16
0.1u
F
12
200R
C49
0.1u
F
C20
33uF
Tan
talu
m
Y2
CR
YS
TAL4
12 3
4
12
C43
0.1u
F
C57
1uF
non
Par
alys
ed
J10
Ser
ial P
rogr
amin
g
1 2 3 4 5 6
R26 5K
JP14
FSR112
R27 5K
JP12
FSR312
R25 5K
All th
e un
used
pin
s in
the
PIC
18J7
CO
N25
1 2 3 4 5 6 7 8 9 10 11 12 13 14 15 16 17 18 19 20 21 22 23 24 25
R1
FSR
1
12
14 7
FSR
2
R1
U5C 5
6
147
JP13
FSR212
R31
1K
LF35
3 O
utpu
t Sig
nal t
o L2
72 in
put s
igna
l
-15V
rese
t
LCD MODULE, GDM2002
+15V
4x4 matrix keypad
Driv
DI
A627
6 pi
n2Driv CLK A6276 pin3
Driv
LE
A627
6 pi
n4
STOP
out
put
sign
al
40 M
HZ

Chapter 3 System Design
59
3.2.6 Output stage
The stimulation system output stage should amplify or boost the stimulation output
signal to an effective stimulation level. There are several stimulation techniques as
discussed earlier in chapter 1; each stimulation technique required a specific output
stage design. The output stages that were investigated in this research were the
constant current and constant voltage. In both cases the execution of an action
potential in the muscle depends very much on the impedance of the underlying tissue.
In the following section the advantages and disadvantages of constant current and
constant voltage will be discussed.
3.2.6.1 Constant current
Constant current stimulation is the most widely used technique. Most FES
applications are performed with constant current stimulators. Almost all the
physiological measurements in FES are also performed with constant current.
This because of the following advantages:
- Less variability and more stable stimulation due to changes in body impedance,
e.g. skin
- Can control or current limit the pulse for safety e.g. cardiac pacemaker
- Circuits can be built using a low component count
The main disadvantages of the constant current stimulation are:
- Known to be painful sometimes
- Poor electrode contact cause very high current density which may give rise to skin
irritation or burning of skin
- Only rectangular current pulses are mostly available
3.2.6.2 Constant voltage
The constant voltage is less popular than the constant current, sometimes it is used
because of the following advantages:
- Safer than constant current in case fall of electrode contact during use

Chapter 3 System Design
60
- Based on the constants voltage output stage design it can be used for stimulating
and recording the voluntary Electromyogram (EMG) from the same muscle at the
same time (constant current stimulation can produce pulses with long tails)
- Can produce a wide range of waveform pulse shape
- By selection of an appropriate waveform, it can reduce stimulation pain and
sensation problem
The Main disadvantages of using constant voltage are:
- Stimulation varies with body load impedance variation
- Reduction in the current delivered through the electrode in case of poor electrode
contact hence results less stimulation and reduction in physiological effect
- Requires more components in the circuitry
As discussed before the aim was to design an output stage that can amplify the
stimulation signal produced to the required stimulation level. In this first stimulation
system design a constant voltage output stage was chosen to be used. This was due to
the need to stimulate using different waveforms for comfort and the need for sharing
stimulation pulses over a set of electrodes in the array.
3.2.6.3 Output stage design
After investigating and designing several output stages amplifiers, including the
output stage used in version 1 and 2 discussed in the appendix, a hybrid constant
current and constant voltage output stage was designed. The output stage circuit
schematic is shown in Figure (3.7). An L272 power operational amplifier was used, it
is powered with ±15V supply voltage, consuming about 60mA when continuously
stimulating an artificial body load of 1KΩ in parallel with 0.1µF. This amplifier drove
“Eagle” miniature transformer. The transformer had 1.2 kΩ input impedance and
3.2Ω output impedance. The squared turns ratio is equal to the ratio of output to input
impedances for a transformer, which gives a squared turns ratio n2 =1200/3.2,
therefore n = 20 approx. Used in reverse, this transformer could be used to boost the
waveform amplitude to levels for use in the transcutaneous stimulation. The amplifier
output was connected in series to a 1000µF non polarised electrolytic capacitor. This

Chapter 3 System Design
61
capacitor was used to block any d.c. current flowing from the op amp output to the
transformer primary. This reduced transformer saturation and subsequent waveform
distortion.
The L272 was a dual op amp so it was decided to further increase the ability to drive a
body load at full output by using an additional transformer wired in parallel. The
outputs of both transformers were connected in series to algebraically combine the
stimulation signals. This gave a far better quality of waveform at full output,
suggesting that saturation effects had been reduced by sharing the pulse current in the
body load between the two transformers and increasing the overall peak to peak pulse
amplitude voltage output. This circuit amplified the ±5V stimulation pulse from the
DAC to approximately 500V peak-peak (with no load) and approximately 400 V
peak-peak when using the body load.
The transformers were capacitively coupled on both output leads using two high
voltage polystyrene capacitors. This capacitive isolation had >15000MΩ insulation
resistance at up to 200 V DC voltage. This prevented any dc component in the
stimulation waveform to flow to the switcher circuit and into the patient, ie: these
capacitors made the stimulation waveforms charge balanced. Additionally the
capacitors also protected the patient during a system fault condition as they prevented
any dc from getting onto the output leads. This insulation resistance also helps to
protect the patient against d.c. leakage current. The charge balanced pulses made the
stimulation very comfortable when applied to the skin but it was also necessary to
filter out any digital high frequency signals from the power supplies, as this was not
deemed comfortable during the development stage.

Chapter 3 System Design
62
+15V -15V
0
VDD 5VVDDVCC
VCC
GND
Driv _DI PIC pin62
Driv _CLK PIC pin61
Driv _LE PIC pin60
H_V_+Ve_stimulation Signal
H_V_ -Ve stimulation signal
H_V_+Ve_stimulation Signal
H_V_ -Ve stimulation signal
Inpu
t Si
gnal
from
LF
353
pin1
Inpu
t Si
gnal
from
LF
353
pin1
Inpu
t Si
gnal
from
LF
353
pin1
+15V-15VVCCGND
VCC
GND
Driv _DI PIC pin62
Driv _CLK PIC pin61
Driv _LE PIC pin60
H_V_+Ve_stimulation Signal
H_V_ -Ve stimulation signal
Driv _DI PIC pin62Driv _CLK PIC pin61Driv _LE PIC pin60
Input Signal f rom LF353 pin1
C6
0.1uFC433uf /25V
C2
1uf /400V
R11K
JP5
JUMPER1 2
R2
0.5K
C8
1uf /400VR6
0.5K
JP1
JUMPER1 2
C533uf /25V
C3
0.1uF
T2
LT700
1 5
4 8
+
-
+
-
+IN2
-IN2
-IN1
+IN1
V-
OUT2
OUT1
V+
U1
L272M
6
5
2
8
7
3
4
1
C1
1000uf /35V
JP4
JUMPER1 2
T1
LT700
1 5
4 8
JP2
JUMPER1 2
JP3
JUMPER
1 2
R4100K
R51K
C7
1000uf /35V
J1
DATA
1234
J2
POWER
1234
R3100K
Figure (3.7) – ST32 output stage
3.2.7 Electrode Array Switcher
A switching circuit was built based on using miniature high voltage photovoltaic
relays interfaced to the microcontroller using a serial controlled Light Emitting Diode
(LED) array driver. The photovoltaic relay used in this circuit was the PVT412. It was
a single pole normally open solid-state relay. This relay device utilised a MOSFET as
an output switch controlled by an LED, which is isolated from the photovoltaic
generator as shown in Figure (3.8). The switch has 4000Vrms input/output isolation
and could switch up to ±400V ac/dc, 140mA. The switching speed was 500µs rise
time and 200µs fall time. Each switch could be turned on and off using a simple 5V
logic signal and required no additional power supply to bias the output stage.

Chapter 3 System Design
63
Figure (3.8) - photovoltaic relay
The LED driver used was the A6276 16-bit serial input latched, shown in Figure
(3.9). The device included a 16-bit CMOS shift register, accompanying data latches,
and 16 npn constant-current sink drivers. The CMOS shift register and latches
allowed direct serial interfacing with the microcontroller using 3 low voltage control
signals and typical serial data-input rates up to 20 MHz.
Figure (3.9) - A6276 led driver
A 32 channel switching circuit was built using two 16 channel LED drivers and 32
photovoltaic relays as shown on the switcher circuit schematic Figure (3.10). This
circuit was much safer than version 2 presented in the appendix and it did not require
complex safety arrangement.

Chapter 3 System Design
64
<Doc> <Rev Code>
<Title>
A2
2 5Saturday , September 04, 2004
Title
Size Document Number Rev
Date: Sheet of
VCC
VCC
VCC
VCC
VCC
VCC
VCC
VCC
VCC
VCC
VCC
VCC 5V
VCC
VCC
VCC
VCCVCC
VCC
VCCVCC
VCC
VCC
VCC
VCC
VCC
VCC
VCC
VCC
VCC
VCC
VCC
VCC
VCC
VCC
0
VDD 5VVDDVCC
VCC
GND
Driv_DI PIC pin62
Driv _CLK PIC pin61
Driv_LE PIC pin60
H_V_+Ve_stimulation Signal
H_V_ -Ve stimulation signal
Driv _DI PIC pin62
Driv _CLK PIC pin61
Driv _LE PIC pin60
Driv _CLK PIC pin61
Driv _LE PIC pin60
SD_OUT
H_V_+Ve_stimulation Signal
H_V_+Ve_stimulation SignalH_V_ -Ve stimulation signal
H_V_+Ve_stimulation Signal
Out0
Out1
Out2
Out3
Out1
Out2
Out3
Out4
Out5
Out6
Out7
Out0
Out7
Out6
Out5
Out4
Electrode1
Out_0
Out_1
Out_2
Out_3
Out_6
Out_4
Out_5
Out_7
Out8
Out11
Out9
Out10
Out12
Out13
Out15
Out14
Out_15
Out_14
Out_12
Out_13
Out_9
Out_10
Out_8
Out_11
Out_14
Out_10
Out_15
Out_13
Out_9
Out_8
Out_12
Out_11Out_4
Out_6
Out_1
Out_0
Out_7
Out_5
Out_3
Out_2
Out8
Out14
Out15
Out12
Out11
Out10
Out13
Out9
Electrode17Electrode18Electrode19Electrode20Electrode21Electrode22Electrode23Electrode24Electrode25
Electrode27Electrode26
Electrode28Electrode29Electrode30Electrode31Electrode32
Electrode3
Electrode16
Electrode4Electrode5Electrode6Electrode7Electrode8Electrode9
Electrode11Electrode10
Electrode12Electrode13Electrode14
Electrode1
Electrode15
Electrode2
Electrode2
Electrode3
Electrode4
Electrode17
Electrode18
Electrode19
Electrode20
Electrode8
Electrode7
Electrode6
Electrode5
Electrode9
Electrode10
Electrode11
Electrode12Electrode13
Electrode16
Electrode15
Electrode14
Electrode21
Electrode22
Electrode23
Electrode24 Electrode25
Electrode28
Electrode27
Electrode26
Electrode32
Electrode31
Electrode30
Electrode29
VCC
GND
Driv _DI PIC pin62
Driv _CLK PIC pin61
Driv _LE PIC pin60
H_V_+Ve_stimulation Signal
H_V_ -Ve stimulation signal
LS1 PVU4141
2
6
5
43
LS7 PVU4141
2
6
5
43
LS5 PVU4141
2
6
5
43
LS14 PVU4141
2
6
5
43
LS11 PVU4141
2
6
5
43
LS3 PVU4141
2
6
5
43
JP6 JUMPER
1 2
LS9 PVU4141
2
6
5
43
LS13 PVU4141
2
6
5
43
J3
CON16 Electrode
12345678910111213141516
LS15 PVU4141
2
6
5
43
LS10 PVU4141
2
6
5
43
LS12 PVU4141
2
6
5
43
LS4 PVU4141
2
6
5
43
LS23 PVU4141
2
6
5
43
LS30 PVU4141
2
6
5
43
U3
A6276EA
1
2
3
4
5
6
7
8
9
10
11
12
24
23
22
21
20
19
18
17
16
15
14
13
GND
SD_IN
CLK
L_EN
Out 0
Out 1
Out 2
Out 3
Out 4
Out 5
Out 6
Out 7
VDD
REXT
SD_OUT
OE
Out 15
Out 14
Out 13
Out 12
Out 11
Out 10
Out 9
Out 8
J4
CON16 Electrode
12345678910111213141516
LS16 PVU4141
2
6
5
43
LS21 PVU4141
2
6
5
43
LS27 PVU4141
2
6
5
43
LS18 PVU4141
2
6
5
43
LS22 PVU4141
2
6
5
43
LS19 PVU4141
2
6
5
43
LS24 PVU4141
2
6
5
43
LS26 PVU4141
2
6
5
43
LS17 PVU4141
2
6
5
43
LS29 PVU4141
2
6
5
43
LS32 PVU4141
2
6
5
43
LS25 PVU4141
2
6
5
43
LS28 PVU4141
2
6
5
43
R85.2KR
LS20 PVU4141
2
6
5
43
LS31 PVU4141
2
6
5
43
C9 0.1uf
C10 0.1uf
JP7JUMPER
1 2
JP9 JUMPER1 2
JP8 JUMPER
1 2
R75.2KR
LS6 PVU4141
2
6
5
43
LS8 PVU4141
2
6
5
43
LS2 PVU4141
2
6
5
43
U2
A6276EA
1
2
3
4
5
6
7
8
9
10
11
12
24
23
22
21
20
19
18
17
16
15
14
13
GND
SD_IN
CLK
L_EN
Out 0
Out 1
Out 2
Out 3
Out 4
Out 5
Out 6
Out 7
VDD
REXT
SD_OUT
OE
Out 15
Out 14
Out 13
Out 12
Out 11
Out 10
Out 9
Out 8
H_V_+VE_stimulation_signal in to group 1
H_V_-VE_stimulation_signal in to group 4
H_V_+VE_stimulation_signal in to group 2
H_V_+VE_stimulation_signal in to group 3
out0
out1
out2
out3
out4
out5
out6
out7
out7
out6
out5
out2
out4
out1
out0
out3
H_V_+VE_stimulation_signal in to group 1
H_V_+VE_stimulation_signal in to group 3 H_V_-VE_stimulation_signal in to group 4
H_V_+VE_stimulation_signal in to group 2
Figure (3.10) – ST32 Switcher circuit schematic
3.2.8 Power supply
The system power supply circuit was designed using MAXIM step-up switch mode
d.c - d.c. converters to produce positive voltages (MAX608) and negative voltages
(MAX776) from a battery. Figure (3.11) shows the circuit schematic that was used in
the system. For the positive supplies, an input voltage of 1.8V to 16.5V could be used
and the device could boost or cut this input voltage to regulated output voltages of
either +5V, +15V through selection of a feedback resistor. This device used an
external N-channel MOSFET transistor allowing an output power load of up to 10W
with about 80% switching efficiency over a range of output current up to 1A. For the
negative supplies, an input voltage of 3V to 16.5V could be used and the device could
boost or cut this input voltage to a regulated output voltage of -15V. This device used
the same technology as the +5V and +15V circuits but with an external P-channel
MOSFET switch allowing to power a load of up to 5W with about 85% switching
efficiency over a range of output current up to 1A. The different input voltage
requirements of each device meant that a battery voltage of 4.8V was used as input.
The battery pack used was made up from 4 serially connected AA 1.2V NiMH

Chapter 3 System Design
65
rechargeable batteries, each capable of 2.4Ah of charge. If the -15V converter was
designed for 1.85V input voltage then only 2 of these batteries would be required
which would make the whole stimulator smaller and lighter and it was disappointing
that this was not the case.
-15V
IN f rom Battary
IN f rom Battary
IN f rom Battary
+15V
0
VDD 5VVDDVCC
VCC
+15V
-15V
VCC
GND
+15V-15VVCC
+15V
-15V
VCC
IN f rom Battary
GNDGND
C29150uf
R33450kR
C340.1uf
D1
1N5817
C32
0.1uf
C33150uf
L3 22 uh
Q3
MOSFET P1
2
3
D2
1N5817
D3
1N5822
R34 50kR
L1
22 uh
JP19
JUMPER1 2
C35
0.1uf
C36120uf /20V
Q2
MOSFET N1
2
3
C260.1uf
J9
BATTARY
12
C280.1uf
MAX Controller
78
4
26
1
3
5
EXTGND
REF
FBISENSE
OU
T
SHDN
V+
JP20
JUMPER1 2
MAX Controller
1
23
5
6 7
8
4EXT
OUTFB
REF
AG
ND
GN
D
ISENSE
SHDN
R23R R23
R
D8
LED
R3650mR
R3550mR
R23R
D8 LED
C58
33uF
R37
0.07R
C38
0.1uF
C250.1uf
JP17
JUMPER1 2
JP16
JUMPER1 2
J8
POWER
1234
F1
FUSE
C27200uf
C370.1uf
C31150uf
D4
DIODE
D8
LED
C24200uf
JP18
JUMPER1 2
L2
22 uh
Q1
MOSFET N1
2
3
C230.1uf
MAX Controller
1
2
3
5
6 7
8
4
EXT
OU
T
FB
REF
AG
ND
GN
D
ISENSE
SH
DN
JP15
JUMPER1 2
C30
0.1uf
R Sence
R Sence
R Sence
Figure (3.11) – ST32 power supply circuit schematic
These MAXIM circuits required the use of a high current inductor for each power
supply to switch currents and pulse charge into a load capacitor from which the output
voltage was taken. The load voltage was controlled by using a combination of pulse
frequency modulation (PFM) and pulse width modulation (PWM) that provided high
efficiency at heavy loads while using less than 100µA quiescent current when
operating with no load. The circuits used a sense resistor to control the peak switching
current through each inductor and each device had a high switching frequency of up
to 300KHz which added to the overall efficiency. The switching noise generated in
the output voltage required careful selection of filtering capacitors so that the peak to
peak noise voltage did not exceed 150mV at a full load of 1A. This was sufficiently
low to prevent digital noise getting into the output waveform.

Chapter 3 System Design
66
This power supply approximately drew approximately 150mA at full stimulation
signal output when continuously stimulating a body load comprising a 1kΩ resistor in
parallel with a 0.1µF capacitor. A fully charged battery pack could therefore keep the
stimulator powered for up to 16 hours of continuous stimulation (2400mAh/150mAh
= 16 hrs). To prevent reverse battery voltages from being applied to the system during
development which would have meant self destruction of all semiconductor devices
on the PCBs, a low forward voltage Schottky silicon diode was placed in series with
the output from the battery compartment. A short circuit of the batteries during
development or fine tuning with the lid off the stimulator or component failure could
cause a fire hazard as the energy density of these AA batteries was unusually high,
(2400mAh). To prevent potential problems a 1A quick blow fuse was placed
immediately after the power switch which could be accessed from the outside of the
stimulator using a draw type fuse holder. This particular fuse holder was selected so
that no special tools were required for fuse replacement and the fuse compartment
was completely isolated from the power supply when open.
3.3 Real time feedback Sensors
3.3.1 Force Sensitive Resistor (FSR)
The FSR is a tactile force sensing sensor which acts as a non-linear potentiometer that
responds to applied physical pressure or force by exhibiting a decreasing resistance.
For more details about this FSR sensor see appendix (B-2). This FSR sensor was
integrated into this system using two techniques. The first one was as a switch, this
was achieved by incorporating it into the circuit shown in Figure (3.12, A). The
voltage potential divider works as force to voltage circuit and the Schmitt trigger
produces a clean logic level to interface to logic inputs of the microcontroller.
Depending on the on/off voltage a threshold, an adjustment to the potential divider
resistor R1 was made to increase or decrease the sensitivity of the force sensor. The
second technique was to use one of the microcontroller ADC channels to process the
feedback voltage signal from the FSR sensor potential divider circuit. By setting some
voltage thresholds in software, the system was able to distinguish between the
different events during the walking gait.

Chapter 3 System Design
67
Figure (3.12) – A: Typical sensor response based on circuits shown, B: FSR heel
sensor mechanical packaging
The FSR mechanical packaging was improved by mounting the sensor on a slab of
rubber. This enabled the sensor to be more reliable during walking. A heel sensor is
shown in Figure (3.12, B). The sensor was offset so that the wired connection was
not placed under the heel which made it more comfortable when placed in the shoe.
3.3.2 Accelerometer A miniature two axis (biaxial) ADXL202 Micro-Electrical-Mechanical-Systems
(MEMS) accelerometer from “Analog Devices” was used to detect foot acceleration.
The ADXL202 accelerometer theory of operation and circuit schematic is explained
in more details in appendix (B-2). This particular accelerometer was chosen because it
had a more sensitive response to acceleration than piezo electric accelerometers. It
had a ±2g maximal response but incorporated an amplifier that could increase the
sensitivity to approximately ±5mg. The ADXL202 produced two different types of
output, an analogue continuous output (voltage proportional to acceleration) and
digital pulse width modulated (PWM) (ratio of pulse width to period proportional to
acceleration) output. This accelerometer measured dynamic and static acceleration.
The ADXL accelerometer was in a compact size, robust design. In addition to that it
used a 5 V supply voltage with relatively very little power (<0.6 mA). The ADXL202
+ 5V
+ 5V
output
R1
FSR
1 2
147
Digital FSRinterface
A B

Chapter 3 System Design
68
PWM output has 12.5%/g sensitivity. The analogue output sensitivity is 312mV/g at
5V supply. The typical noise floor is ( )Hzgμ500 .
The sensor calibration was done using the microcontroller firmware provisionally
using stored value or instantly in respect to the start and the end of the acceleration
measurement. The digital pulse width modulated PWM output was used for tilt
measurements, but some problems and difficulties was experienced using the PWM
output in measuring accurately the dynamic acceleration. For this reason the analogue
output signal from the same accelerometers was used, with the capability of using the
digital output when needed. The accelerometer analogue output was amplified using
an operational amplifier for two reasons, to be buffered before the microcontroller and
to set the output voltage to be compatible with the microcontroller ADC.
Figure (3.13) -Gyroscope and accelerometer
The accelerometer was used as a tool to investigate the measurement of static and
dynamic acceleration foot movement in the direction of dorsiflexion/plantarflexion
and eversion/inversion; as discussed in chapter 5. It was also used to detect the twitch
movement acceleration as will be discussed later in chapter 4. It was also utilized for
stride length distance calculations and as a step counter. During these investigations
different acceleration bandwidths and PWM time periods were used.
Accelerometer PCB
Gyroscope PCB

Chapter 3 System Design
69
3.3.3 Gyroscope
Miniature MEMS ADXRS gyroscopes from “Analog Devices” are used in this
application. This gyroscope design is based on the principle of a resonator gyro. This
ADXRS150 gyroscope can measure movement angular velocity < ±150°/s. It
produces an analogue output voltage proportional to the angular rate. This gyroscope
is a z axis sensitive device that generates positive voltage output for clockwise
rotation and negative output for anti clockwise as explained in the appendix. This
device typical sensitivity is 12.5mV/º/s when 5 volt supply is used. This gyroscope
sensor was used to measure the foot and ankle angular rotation in the planes of
dorsiflexion/plantarflexion and eversion/inversion. Some measurement accuracy
problems were faced while using this gyroscope for this research application as will
be discussed in detail in chapter 5. Both gyroscope and accelerometer PCBs are
shown in Figure (3.13).
3.4 Electrode array
Due to a limitation in time and funding there was little chance of designing an
electrode array prototype similar to the one designed during the Festival project as
discussed earlier in chapter 2. Technologies using flexible PCB or conductive tracks
printed onto plastic would have been suitable but were not thought of as a critical path
to testing the concept of the optimisation algorithm and are left for future work. Some
of these technologies have been used successfully in the past by Peasgood et al
(Festival Project Report, 1994-1997). Some time was spent investigating
commercially available surface electrodes and trying carefully to reshape them and
form a 4x4 electrode array. These electrodes are carbon rubber rectangular
(20mmX10mm) cut down from 20mm circular electrodes. They were placed on the
skin with an inter electrode spacing of approximately 3mm. This 4x4 array of active
electrodes was placed to cover roughly the tibialis anterior muscle. Two return 45mm
square carbon rubber electrodes were used. The system can drive more electrodes but
this setup was enough to cover the areas of muscle and nerves of interests, typically

Chapter 3 System Design
70
the anterior and lateral lower leg compartments, as discussed in chapter 2 A typical
example of electrode array is shown on Figure (3.14).
Figure (3.14) - Electrode array example
3.5 Summary
This chapter discussed the design and implementation for the FES “ST32” system
developed during this research. The system was built to the specification and
requirement stated earlier. It was also designed to meet the British standard and safety
requirements for medical equipment (BS EN 60601-1:1990) and (BS EN 60601-2-
10:2001) "particular requirements for the safety of nerve and muscle stimulators" and
it was approved by the Medical Equipment Management Organization (MEMO) of
the united Bristol health care trust (UBHT) to be used for patient clinical trials. The
system performed very well during the pre-clinical trials with very little problems as
will be discussed in chapter 6. The next chapter will present and describe the
electrode array optimisation technique and algorithms.
Active electrodes
Return electrode

Chapter 4 Electrode Array optimisation
71
Chapter 4
ELECTRODE ARRAY OPTIMISATION

Chapter 4 Electrode Array optimisation
72
CHAPTER 4: ELECTRODE ARRAY OPTIMISATION
4.1 Optimisation techniques and problems Surface electrode stimulation based on using an electrode array was proposed in this
research to try to overcome problems associated with using “transcutaneous” surface
electrode stimulation such as finding the best stimulation site, irritation, and fatigue as
discussed earlier in chapter 1.
When using an electrode array a group of active and return electrodes, there are many
electrodes to test to find the best electrode combination that gives the optimum
movement. For example, the first electrode array used in this research during the lab
trials had 16 active electrodes and two return electrodes and the possible combinations
of this array are (16 X 2) which gives 32 different combinations of simple pairs of
active and return electrodes. More combinations need to be tested when trying more
than combinations of pairs such as triples or quads.
This 16 active and 2 return electrode array was tested on normal control subjects in
the early laboratory trials, Figure (4.1). This array placed on top of the groups of
muscles of interest to produce the desired dorsiflexion eversion movements. The
stimulation system was using the manual switcher box presented in chapter 3 system
version-1 to steer the stimulation signal between the electrodes within the array. The
evaluation of each of these combinations of electrodes using continuous stimulation
and monitoring the movement takes a long time. This is due to ramping up and down
of the stimulation signal. In addition, it is known that sometimes it is painful to apply
stimulation over certain electrode sites and they are liable to fatigue the muscles. For
these reasons, new techniques were needed to reduce or overcome these problems
associated with the electrode array optimisation.

Chapter 4 Electrode Array optimisation
73
Figure (4.1) – electrode array and sensors
4.2 Monitoring the foot movement
To monitor the foot movement and twitch response several sensors were investigated.
The gyroscope and accelerometers presented in chapter 3 were chosen to be the
movement monitoring sensors because of their sensitivity, compact design and size
and compatibility with microcontroller based embedded systems.
The gyroscope measures the angular velocity or rotation rate of the angle, which can
be used to calculate the actual angle. One gyroscope was placed on the foot as shown
in Figure (4.2 ) is used to monitor the ankle dorsiflexion/plantarflexion angle, another
gyroscope placed on the foot as shown on the same Figure is to monitor the ankle
inversion/eversion angle.
Return electrodes
Sensors
Active electrode array

Chapter 4 Electrode Array optimisation
74
Figure (4.2) – Gyroscope orientation
The accelerometer was dual axis type and it measured both acceleration and tilt angle
reference to gravity. Only one accelerometer placed on the foot as shown in Figure
(4.3). The X-axis was used to monitor the ankle dorsiflexion/plantarflexion tilt angle
reference to gravity and the movement acceleration response and the Y-axis was used
to monitor the ankle inversion/eversion tilt angle and the movement acceleration
response.
Gyroscopic
Dorsiflexion Plantarflexion
Eversion Inversion
+ Dº
- Pº
+ Eº - Iº
Rotation around X axis
Rotation around Y axis
Y
X
X
Y

Chapter 4 Electrode Array optimisation
75
Figure (4.3) – accelerometer orientation
4.3 The twitch response
The single stimulation pulse generates an action potential in the muscle and results in
a muscle twitch. When applying a train of pulses tremors start to occur. By increasing
the stimulation frequency, the tremor becomes smaller and a tetanic contraction
obtained. This is called continuous muscle contraction or “summation of contraction”,
this was discussed in more details in chapter 1
During the early laboratory investigations, the stimulator output signal was tested
using different pulse frequencies (pulse repetition rate) starting from a single “twitch”
pulse and then from 5ms to 200ms (5ms step) continuous stimulation. When
observing this twitch response from each electrode applying the same pulse
parameters it was discovered that a different twitch movement direction responses
was obtained for each electrode positions. The response of the twitch stimulation was
therefore very interesting and encouraging, as the response of the twitch stimulation
could now be used to help in optimising and mapping the electrode array.
Accelerometer Dorsiflexion Plantarflexion
Eversion Inversion
+ Dº
- Pº
+ Eº - Iº R
ef a
ngle
pos
ition
Ref angle position

Chapter 4 Electrode Array optimisation
76
A sample of analogue signals from the twitch movement using both an accelerometer
and a gyroscope are shown in Figure (4.4). X represents the twitch movement in the
dorsiflexion/plantarflexion direction and Y represents the twitch movement in the
eversion/inversion direction.
Figure (4.4) –Twitch movement response analogue sensor signals
The gyroscope signals represent the twitch movement angular velocity and the
direction for this movement, this was found to be different from electrode to
electrode, especially the movement direction. For example, when continuous
stimulation was applied to the same electrodes, it produce the response shown in the
Figure (4.4), dorsiflexion and eversion were obtained. When testing different
electrodes that give plantarflexion or inversion the twitch signal recorded by the
accelerometer and gyroscope was the inverse of the one in the Figure (4.4).
The accelerometer signals represent the twitch movement acceleration for both the
dorsiflexion/plantarflexion and eversion/inversion movement. The accelerometer
sensitivity in detecting the twitch response was better than the gyroscope, and it
Gyroscope signals
Xg
Yg
Xa
Ya Accelerometer signals
Dor
sifle
xion
/ Ev
ersi
on
Peaks of interest
Peaks recording

Chapter 4 Electrode Array optimisation
77
captured more detail than the gyroscope signal. When applying the twitch stimulation
signal to different electrodes in the array, it produces different acceleration signal
responses that contain information about the movement direction due to the polarity
and how strong the measured signal peak. That is why the early twitch study focused
on using the accelerometers in twitch movement detection and further studies were
then performed to compare the recorded signal response to the continuous stimulation
response.
4.3.1 Twitch response vs. continuous stimulation response
Twitch response in the laboratory testing was carried out in four steps. The first was
to choose the appropriate twitch stimulation signal parameters for a particular control
subject, which would give a clear observed twitch response as measured by
oscilloscope, stimulation system and by eye. The second step was recording the twitch
response acceleration using the accelerometer from each combination of pairs of
electrodes within the array. The third step was to apply continuous stimulation and
observe the movement from each electrode in the twitch test, to help to identify the
observed continuous response, i.e. Dorsiflexion/plantarflexion and inversion/eversion.
The measurements were assessed by eye and ranked using the following arbitrary
scale:
0 – No visible contraction
1 – Visible contraction but no clear movement
2 – Partial weak movement performed in the direction specified
3 – Normal movement performed in the direction specified
4 – Strong movement performed. In the direction specified
The fourth step was to study and analyse each twitch and continuous stimulation
response data obtained from the same combination of electrodes. At the beginning of
the analysis stage, the twitch acceleration response was not clear because of the
acceleration peaks (spikes) positive and negative polarity.

Chapter 4 Electrode Array optimisation
78
As shown in Figure (4.5) The accelerometer twitch signal often started with a small
movement in the opposite direction of the actual twitch movement, which generated
acceleration peak (peak-1) response some time similar to the twitch acceleration peak
(peak-2) response but in the opposite direction. Due to these artefacts, the value of the
second acceleration signal peak was the one that used to predict the continuous
movement.
Figure (4.5) – Accelerometer twitch response signal
The twitch acceleration signals obtained from early tests on normals compared well to
the movement obtained with continuous using the same electrode combination. Table
(4.1) shows a typical set of data obtained from a control subject during the laboratory
trial. This shows the recorded twitch stimulation second acceleration peak and the
observed continuous stimulation movement. An array of 16 active electrodes placed
on top of the “tibialis anterior” muscle with one return electrode behind the knee. The
subject was seated with foot relaxing and not touching the ground. To help understand
the results in Table (4.1) a graphical form of these results are presented in Figure
(4.6), where the twitch acceleration response recorded from each electrode in the
(16x1) array are in the top graph and the observed continuous stimulation scoring for
each electrode are in the bottom graph.
peak-1
Xa
Ya
Dor
sifle
xion
/ Ev
ersi
on
Peaks recording time
peak-1
peak-2
peak-2

Chapter 4 Electrode Array optimisation
79
Electrode
Number
Twitch
Acceleration
mV
+ Dorsiflexion
- Plantarflexion
Continuous
scoring*
+ Dorsiflexion
- Plantarflexion
Twitch
Acceleration
mV
+ Eversion
- inversion
Continuous
scoring*
+ Eversion
- inversion
1 -200 -1 -50 -3
2 150 2 -20 -2
3 25 0 100 3
4 250 3 280 4
5 150 2 -90 -3
6 90 2 -10 0
7 80 0 110 4
8 80 0 100 3
9 100 3 -60 -3
10 110 3 10 -2
11 10 0 90 3
12 5 0 90 3
13 100 3 0 -1
14 110 3 0 -1
15 0 0 0 0
16 0 0 0 0
*No contraction = 0, Absent movement = 1, Weak = 2, Normal = 3, Strong = 4
Table (4.1) – Twitch acceleration responses and observed movement scoring for
control subject 1

Chapter 4 Electrode Array optimisation
80
Figure (4.6)-Graphical format of data in Table 1
By examining the data, there was a clear relationship between the twitch response and
the continuous response. To find how strongly they related, Pearsons’s correlation
coefficient was calculated between the observed sustained movement and the twitch
response using Equation (4.1) Where, 1 ≤ n ≤ 16.
∑ ∑∑
−−
−−=
22 )()(
))((),(
YnYnXnXn
YnYnXnXnYXCorrel Equation (4.1)
-100
-50
0
50
100
150
200
250
300
1 2 3 4 5 6 7 8 9 10 11 12 13 14 15 16
Twitc
h Ac
cele
ratio
n m
v(+ Dorsiflexion, - Plantarflexion) (+ Eversion, - inversion)
-4
-3
-2
-1
0
1
2
3
1 2 3 4 5 6 7 8 9 10 11 12 13 14 15 16
Sus
tain
ed O
bsirv
atio
n S
corin
g*
(+ Dorsiflexion, - Plantarflexion) (+ Eversion, - inversion)
* Absent = 0, Weak = 1, Normal = 2, Strong = 3

Chapter 4 Electrode Array optimisation
81
The R correlation coefficient calculation results was, R correlation = 0.77 for the
Dorsiflexion / Plantarflexion movement as shown in Figure 4.7, and 0.88 for the
Eversion / Inversion movement.
Figure (4.7) – Dorsiflexion/plantarflexion twitch/continuous movement correlation
When the correlation calculation is recalculated after considering the responses that
indicates dorsiflexion or eversion and neglecting all responses from both twitch and
continuous that indicates unwanted plantarflexion and inversion movements (all
negative values), the correlation coefficient was as follows; (Dorsiflexion) R
correlation = 0.75, (Eversion) R correlation = 0.80.
Reasonably good correlation was found from this control subject when considering or
neglecting the unwanted plantarflexion and inversion movements.
y = 0.017x - 0.1229
-1.5
-0.5
0.5
1.5
2.5
3.5
-250 -150 -50 50 150 250 350
Twitch response mV
Obs
erve
d co
ntin
uous
scor
ing*
R = 0.77

Chapter 4 Electrode Array optimisation
82
4.4 Twitch response Laboratory testing
To study the relationship between the twitch and continuous response, the same test
were applied to 12 normal healthy control subject 4 Females and 8 Males, age range
18 - 56 , weight 53 - 102Kg, and height 155-185cm, Table (4.2 ). The correlation
calculations for each subject are presented in Table (4.3) and graphical format for the
correlation results are presented in Figure (4.8) and (4.9).
Subject
number
Gender
Age
Weight
kg
Height
cm
1 Male 18 60 165 2 Male 42 85 175 3 Male 41 82 174 4 Female 26 53 160 5 Female 56 102 160 6 Female 29 82 175 7 Male 21 75 183 8 Male 22 93 171 9 Male 36 90 179 10 Male 27 80 160 11 Female 26 60 160 12 Male 26 85 171
Mean 4F/8M 30.833 78.917 169.417
Table (4.2) – Laboratory trial 12 subjects

Chapter 4 Electrode Array optimisation
83
Control Subject number
Dorsiflexion Plantarflexion
Correlation
Eversion Inversion
Correlation Dorsiflexion Correlation
Eversion Correlation
1 0.766 0.884 0.752 0.797 2 0.886 0.800 0.886 0.735 3 0.937 0.984 0.917 0.997 4 0.859 0.558 0.849 0.882 5 0.378 0.609 0.378 0.839 6 0.813 0.888 0.813 0.891 7 0.945 0.938 0.938 0.886 8 0.742 0.701 0.470 0.495 9 0.897 0.817 0.539 0.632
10 0.657 0.854 0.657 0.443 11 0.679 0.777 0.488 0.785 12 0.790 0.823 0.790 0.696
Average 0.779 0.706 0.803 0.756
Table (4.3) – correlation results for all 12 subjects
0.0
0.1
0.2
0.3
0.4
0.5
0.6
0.7
0.8
0.9
1.0
1 2 3 4 5 6 7 8 9 10 11 12
Controls
Cor
rela
tion
Dorsiflexion & Plantarflexion Correlation Dorsiflexion Correlation
Figure (4.8) – dorsiflexion/plantarflexion correlation results for all 12 subjects

Chapter 4 Electrode Array optimisation
84
0.0
0.2
0.4
0.6
0.8
1.0
1 2 3 4 5 6 7 8 9 10 11 12
Subjects
Cor
rela
tion
Eversion & Inversion Correlation Eversion Correlation
Figure (4.9) – Eversion/inversion correlation results for all 12 subjects
From these data, it is clear that there is a high correlation in more than half of the
subjects between the twitch and continuous stimulation response. This gives rise to
the possibility of using the twitch stimulation response instead of continuous
stimulation to optimise the electrode array.
4.5 Twitch signal problems and solutions
In some subjects there was poor twitch response and continuous stimulation
correlation, and due to this it will not be very accurate to use the twitch response in
optimising the electrode array. However, after studying the acceleration signals that
gave poor correlations, the problem was found to be mainly due to noise and the
accuracy of recording the acceleration.
The accelerometer is very sensitive, sometimes it record noise, and spikes as shown in
Figure (4.10). These will affect the recorded acceleration and it should be neglected
when determining the acceleration peaks.

Chapter 4 Electrode Array optimisation
85
Figure (4.10) – Accelerometer twitch signal show noise spikes
As discussed earlier the second peak is the one that gave the correct twitch movement
information that correlated strongly with the continuous movement. The peak
detection algorithm ensures that it is the correct second peak that is recorded and that
it is not missed due to any unusual peaks. The system will wait after firing each twitch
for at least 2s to make sure that there is no noise or amplitude variations in the
baseline accelerometer signals due to foot movements. The system was designed to
record the first 3 peaks in the twitch acceleration signal. The peak recording algorithm
also insure that the recorded peak are not within the noise level and the recorded
signal have smooth normal rise and fall time. Chart (4.1) shows how this algorithm
works.
Noise spikes
Gyroscope signals
Accelerometer signals Noise

Chapter 4 Electrode Array optimisation
86
Chart (4.1) – peak recording algorithm
When applying this peak recognition and recording algorithm to the accelerometer
signal recorded from these 12 subjects, better correlation was obtained in some
subjects as shown in Table (4.4).and Table (4.5). If no improvement was found,
effectively the correlation was left unchanged and this was recorded as a 0%
improvement.
Start peak recording immediately for 500 ms
Choose the first three actual acceleration peaks
(not noise or spikes)
Wait until noise go below the threshold for a period of 2s
Fire the twitch stimulation signal
Choose the second peak that is following peak of almost same peak magnitude value (±20%)
Compare the three peak values
Neglect the second peak if it is smaller than 30% of the first
peak

Chapter 4 Electrode Array optimisation
87
Control
Subject
number
Old
Dorsiflexion
Correlation
New
Dorsiflexion
Correlation
Percentage of
improvement
% 1 0.752 0.776 3.2% 2 0.886 0.886 0.0% 3 0.917 0.917 0.0% 4 0.849 0.892 5.1% 5 0.378 0.880 132.8% 6 0.813 0.813 0.0% 7 0.938 0.938 0.0% 8 0.470 0.819 74.3% 9 0.539 0.539 0.0%
10 0.657 0.657 0.0% 11 0.488 0.488 0.0% 12 0.790 0.809 2.4%
Average 0.706 0.784 11.0% Table (4.4) – New correlation after applying peak recording algorithm
Table (4.4) shows a comparison between the new correlation and the old correlation
results. There is clear correlation improvement in many subjects after applying the
peak recording algorithm, and the general average improvement was 11 % for the
dorsiflexion correlation and 5.2% for the eversion correlation. This shows that using
this recording algorithm improves the optimisation process accuracy.

Chapter 4 Electrode Array optimisation
88
Control
Subject
number
Old Eversion
Correlation
New Eversion
Correlation
Percentage of
improvement 1 0.797 0.981 23.1% 2 0.735 0.735 0.0% 3 0.997 0.997 0.0% 4 0.882 0.882 0.0% 5 0.839 0.839 0.0% 6 0.891 0.955 7.2% 7 0.886 0.886 0.0% 8 0.495 0.745 50.5% 9 0.632 0.632 0.0%
10 0.443 0.443 0.0% 11 0.785 0.663 -15.5% 12 0.696 0.785 12.8%
Average 0.756 0.795 5.2% Table (4.5) – New and old correlation result comparison
4.6 Laboratory trials
The aims of these trials were to test the ST32 system, to confirm the effectiveness in
using the twitch response and to develop the optimisation algorithm. The outcome of
these trials was mainly the base of the optimisation algorithm development explained
earlier in this chapter. These trials took place in the engineering lab on eight healthy
normal subjects, the details for these subjects are shown in Table (4.6).

Chapter 4 Electrode Array optimisation
89
Subject
number
Gender
Age
Weight
kg
Height
cm
1 M 26 78 181 2 F 31 71 175 3 M 25 85 168 4 M 23 78 165 5 M 28 79 173 6 M 25 70 169 7 M 36 65 173 8 F 24 75 179
Table (4.6) – Lab trial normal subject’s details
In these trials the test was done on the left leg and the subject was asked to sit on a
chair higher from the floor (i.e. foot not touching the floor) with foot relaxed in the
plantarflexion relaxing position. The tests were done on the left leg using 4x4 active
electrodes placed roughly on top of the tibialis anterior muscle and one return
electrode behind the knee or at the end of the tibialis anterior motor point.
Both continuous stimulation and twitch stimulation were applied to each electrode.
During these tests the ST32 stimulation performance was excellent as it provide all
the required stimulation signals parameters ranges, also the stimulation was very
comfortable.
4.6.1 Continuous and twitch stimulation movement recording
The same method explained in section (4.3.1) was used to record the twitch
stimulation acceleration response from the accelerometer signal after applying the
signal processing algorithm. Additionally the same method was used to observe the
continuous stimulation movement but the visual ranking score was reduced to Absent
= 0, Weak = 1, Normal = 2, Strong = 3.

Chapter 4 Electrode Array optimisation
90
The correlation between the obtained twitch and continuous stimulation test results
was calculated same as in section (4.3.1). The correlation results from all the eight
subjects are presented in Table (4.7).
Control
Subject
number
Dorsiflexion
Plantarflexion
Correlation
Eversion
Inversion
Correlation
Dorsiflexion
Correlation
Eversion
Correlation
1 0.950 0.909 0.907 0.779 2 0.939 0.919 0.934 0.862 3 0.909 0.863 0.841 0.757 4 0.956 0.907 0.895 0.742 5 0.840 0.931 0.806 0.782 6 0.912 0.876 0.874 0.838 7 0.699 0.884 0.841 0.679 8 0.941 0.909 0.939 0.884 Table (4.7) - Twitch and continuous correlation result for all 8 subjects
The high correlations found for all the 8 subjects confirms the concept of using the
twitch accelerating response to optimise the electrode array, but still to be tested and
approved on real patients.
4.6.2 Electrode array mapping
The electrode array optimisation algorithm was originally based on these laboratory
test trials. In these trials every single (active) electrode within the array was tested
using continuous stimulation as explained before to compare it to the twitch response.
These continuous response data for all the 8 subjects are shown on the electrode map
Figure (4.11). These maps indicate the observed movement obtained (dorsiflexion,
eversion, plantarflexion, inversion) by continuous stimulation from every electrode in
the array.

Chapter 4 Electrode Array optimisation
91
As explained earlier a score was giving according to the strength of observed
contraction, absent = 0, weak = 1, normal = 2, strong = 3. These results were plotted
in the following format for each electrode:
This means that data that produces the “wanted” movement ie: Dorsiflexion and
Eversion will appear on the left hand side.
The continuous stimulation using single (active) electrode results show that in some
subjects it was difficult to obtain good dorsiflexion with some eversion. For this
reason all possible combination of pairs of active electrodes was tested. The best pair
of electrodes was chosen on the basis of obtaining the desired comfortable
dorsiflexion/eversion movement; this was achieved by trying each combination of
paired electrodes in turn. The chosen pair of electrodes is highlighted in a different
colour on the same maps. The box at the top of the active 4x4 electrode array map
indicates the use of a return electrode behind the knee, the box at the bottom of the
map indicates using the return electrode at the lower end of the tibialis anterior
muscle.
These maps were generated to see if there was evidence that the selected combination
of electrodes selects similar patterns of electrodes between subjects and to see if there
were other electrodes that might, in combination, be used to effect a similar overall
movement for the same subject. By examining these maps it is clear that not
withstanding the different physical differences in geometry of different people, that
there is no clear electrode pair that contributes to an overall pattern. Each electrode
pair chosen shows unique differences. The chosen electrode pair after ranking mainly
includes dorsiflexion and eversion movements, with small differences in N2 and N8,
which show inverter movement, N1 shows evidence of one electrode with plantar
movement selected. The results also show that it may be possible to combine
electrodes that have everter and inverter movement so that they cancel out whilst still
giving dorsiflexion.
Where: D = Dorsiflexion E = Eversion P = Plantarflexion I = Inversion
D P
E I

Chapter 4 Electrode Array optimisation
92
N2
N5 N6 N7 N8
3
1
0
2
0
2
1
1
0
1
0
2
1
1
1
0
0
3
0
2
0
2
0
0
1
1
3
2
2
1
2
0
1
1
3
3
1
3
2
0
2
1
1
2
2
3
1
1
2
2
2
2
1
1
1
0
3
1
2
3
3
2
1
2
1
3
2
2
2
3
2
1
3
2
1
1
1
1
1
0
1
1
2
1
2
2
0
0
3
3
2
1
2
0
1
1
3
2
2
2
1
1
1
1
2
1
0
3
1
3
0
0
2
4
1
1
0
0
0
0
3
3
2
3
2
2
1
3
2
2
3
1
2
1
1
0
1
1
0
1
0
1
1
0
1
2
1
2
1
1
0
0
3
1
2
1
3
2
0
1
3
2
2
2
2
3
3
2
3
3
2
2
2
3
2
0
3
2
3
2
3
3
0
1
3
3
3
3
2
2
3
3
1
1
1
0
2
0
3
1
1
3
0
1
0
1
1
1
1
2
1
2
0
1
1
0
3
1
1
0
3
1
3
2
2
2
3
1
0
0
1
1
1
0
2
2
0
1
1
0
1
2
2
2
1
0
0
0
2
1
2
2
1
1
0
1
N1 N3 N4
Figure (4.11) – Normal Subjects Electrode Optimisation Map

Chapter 4 Electrode Array optimisation
93
4.7 Electrode array optimisation algorithm
Various optimisation techniques were investigated based on the twitch response
including using combinations of electrodes and comparing the twitch acceleration
response to that obtained with continuous stimulation. The best optimisation result
was obtained when using a trial and error algorithm that used a mixture of the
individual electrode twitch responses and the continuous movement response of
combinations of electrodes.
The following section explains in details how the electrode optimisation algorithm
worked. It is important to mention that the algorithm presented in this section was the
latest version after a long investigation and development during the laboratory and the
clinical trials, Chapter (5, 6).
4.7.1 First step:
The first step in the electrode optimisation process was to specify the numbers of
electrodes used and work out all combinations of pairs between these active and
return electrodes.
The ST32 system could use up to 32 channels; 24 channels were used to drive active
electrodes and 8 used to drive 8 return electrodes as shown in Figure (4.12). The
number of combinations between each active and return electrode was 24 x 8 = 192,
and the combinations will be as follow (25 & 1, 25 & 2, 25 & 3……………25&24),
(26&1, 26 & 2, 26 & 3….26&24) …………………………… (32&1, 32& 2, 32
&3……………….32&24)

Chapter 4 Electrode Array optimisation
94
24 Active electrode 8 Return Electrode
Figure (4.12) – Electrode array
4.7.2 Second step: The second step was to send a twitch stimulation signal with the tuned twitch pulse to
each combination of electrodes.
Before firing this twitch signal, it was important to make sure there was no noise or
signal detected by the accelerometer due to any activity like involuntary movement or
any vibration or unexpected movement due to the previous twitch. The twitch
response can last up to 1 second, only the first 500 µs carry useful information. A
waiting period of at least 2 seconds between the twitches was found to be required to
allow the muscle to relax preventing any possibility of mixing twitches responses.
1 2 5 6
10
3 4 7 8
9 13 14
11 12 15 16
17 18 21 22
19 20 23 24
28
31
32
27
30
29
26
25

Chapter 4 Electrode Array optimisation
95
After the inactivity-waiting period the stimulator would fire the twitch and then record
the first three peaks in the twitch acceleration signal from both the X and Y
accelerometer sensors. This was repeated for each electrode combination and the
twitch feedback data was saved.
4.7.3 Third step:
The third step applied the peak recording algorithm presented in section (4.5) to the
accelerometer signal peaks data saved during last step.
4.7.4 Fourth step:
This fourth step processed the chosen acceleration peaks data.
- For X axis the selected peak may be +ve = dorsiflexion or -ve = plantarflexion.
- For Y axis the selected peak may be +ve = eversion or -ve = inversion
Example An example of the data obtained from the last step is presented in Table (4.8).
Electrode
combination
Accelerometer X
Dorsiflexion (+)
Plantarflexion (-)
Accelerometer Y
Eversion (+)
Inversion (-)
(25,1) + 49 -12
(25,2) + 85 +27
= = =
(27,23) + 9 + 5
(27,24) - 7 -35
(28,1) + 65 +23
(28,2) + 53 +20
= = =
(32,23) -28 - 5
(32,24) 0 0
Table (4.8) -Example of peak processing data

Chapter 4 Electrode Array optimisation
96
4.7.5 Fifth step:
These data obtained from the fourth step were ranked into four (strong, normal, weak,
nothing). This ranking depended on the twitch acceleration response and it was
different from the ranking procedure explained earlier for the continuous movement
observation.
The ranks were defined by finding the maximum +ve and –ve acceleration responses
and the minimum value, which was usually zero. The difference between the
maximum and minimum was then divided into 4 and each quarter of the difference
represented 1 rank. This ranking process was applied separately for each of the X-axis
data that represented dorsiflexion and plantarflexion and the Y-axis data that
represented the eversion and inversion.
Example
In this example the ranking algorithm was applied to the data in Table (4.8), and
assumed that this data contained all maximum and minimum values for all different
responses
The dorsiflexion maximum value is 85 and minimum is zero, therefore (85 – 0)/4 =
21.25 per rank.
0 - 21.25 21.25 - 42.5 42.25 - 63.75 63.75 - 85 Nothing Weak Normal Strong
The plantarflexion maximum value is 28 and minimum is zero, therefore (28 – 0)/4 =
7 per rank.
0 - 7 7 - 14 14 - 21 21 - 28 Nothing Weak Normal Strong The eversion maximum value is 27 and minimum is zero, therefore (27 – 0)/4 = 6.75
per rank.

Chapter 4 Electrode Array optimisation
97
0 - 6.75 6.75 - 13.5 13.5 - 20.25 20.25 - 27 Nothing Weak Normal Strong
The inversion maximum value is 35 and minimum is zero, therefore (35 – 0)/4 = 8.75
per rank.
0 - 8.75 8.75 - 17.5 17.5 - 26.25 26.25 - 35 Nothing Weak Normal Strong
The results of the ranking of this example are shown in Table (4.9).
Electrode
combination
Accelerometer X
Dorsiflexion (+)
Plantarflexion (-)
Accelerometer Y
Eversion (+)
Inversion (-)
(25,1) + D Normal - I Weak
(25,2) + D Strong + E Strong
= = =
(27,23) Nothing Nothing
(27,24) - P Weak - I Strong
(28,1) + D Strong + E Strong
(28,2) + D Normal + E Normal
= = =
(32,23) - P Strong Nothing
(32,24) Nothing Nothing
Table (4.9) – Ranked data example
4.7.6 Sixth step:
In the sixth step, every active and return electrode combination would have a
dorsiflexion/ plantarflexion rank and eversion/ inversion rank. The algorithm assumed
“combination numbers” for all theoretically possible ranking combinations are as
follows:

Chapter 4 Electrode Array optimisation
98
1. Strong D & strong E
2. Strong D & normal E
3. Strong D & weak E
4. Strong D & nothing Strong Dorsiflexion & any other movement
5. Strong D & strong I
6. Strong D & normal I
7. Strong D & weak I
8. Normal D & strong E
9. Normal D & normal E
10. Normal D & weak E
11. Normal D & nothing Normal Dorsiflexion & any other movement
12. Normal D & strong I
13. Normal D & normal I
14. Normal D & weak I
15. Weak D & strong E
16. Weak D & normal E
17. Weak D & weak E
18. Weak D & nothing Weak Dorsiflexion & any other movement
19. Weak D & strong I
20. Weak D & normal I
21. Weak D & weak I
22. Nothing & strong E
23. Nothing & normal E
24. Nothing & weak E
25. Nothing & Nothing Nothing & any other movement
26. Nothing & strong I
27. Nothing & normal I
28. Nothing & weak I
29. Strong P & strong E
30. Strong P & normal E
31. Strong P & weak E
32. Strong P & nothing strong Plantarflexion & any other movement
33. Strong P & strong I
34. Strong P & normal I
35. Strong P & weak I

Chapter 4 Electrode Array optimisation
99
36. Normal P & strong E
37. Normal P & normal E
38. Normal P & weak E
39. Normal P & nothing Normal Plantarflexion & any other movement
40. Normal P & strong I
41. Normal P & normal I
42. Normal P & weak I
43. Weak P & strong E
44. Weak P & normal E
45. Weak P & weak E
46. Weak P & nothing Weak Plantarflexion & any other movement
47. Weak P & strong I
48. Weak P & normal I
49. Weak P & weak I
The optimisation Algorithm was designed to look for the combinations that gave good
dorsiflexion and some eversion. The highlighted combinations were expected to
produce unwanted movement (plantarflexion or inversion) and this was proven during
the laboratory trials and clinical trials as discussed later in chapter 6. By neglecting
these highlighted combinations and keeping the combinations that give dorsiflexion
and/or eversion, the combinations number reduced from 49 to 22.
As a result of the laboratory and clinical trials a ranking process was developed to
rearrange or rank these remaining combinations from best to worst for the optimum
electrode combinations as shown in Table (4.10):

Chapter 4 Electrode Array optimisation
100
Rank
Original
combination
number
1 2 Strong D & normal E
2 3 Strong D & weak E
3 4 Strong D & nothing
4 1 Strong D & strong E
5 9 Normal D & normal E
6 10 Normal D & weak E
7 11 Normal D & nothing
8 8 Normal D & strong E
9 7 Strong D & weak I
10 14 Normal D & weak I
11 6 Strong D & normal I
12 5 Strong D & strong I
13 15 Weak D & strong E
14 16 Weak D & normal E
15 17 Weak D & weak E
16 18 Weak D & nothing
17 21 Weak D & weak I
18 22 Nothing & strong E
19 23 Nothing & normal E
20 24 Nothing & weak E
21 43 Weak P & strong E
22 44 Weak P & normal E
Table (4.10) – Optimum electrode combinations ranking

Chapter 4 Electrode Array optimisation
101
Example
From the previous example, Table (4.9), these are the available combination:
Combination
number
Electrode
numbers Combination response
14 (25,1) + D Normal, - I Weak
1 (25,2) + D Strong, + E Strong
25 (27,23) Nothing, Nothing
47 (27,24) - P Weak, - I Strong
1 (28,1) + D Strong, + E Strong
9 (28,2) + D Normal, + E Normal
32 (32,23) - P Strong, Nothing
25 (32,24) Nothing, Nothing
After neglecting the unwanted responses and ranking the remaining combination are
presented in Table (4.11):
Combination
rank
Original
Combination
number
Electrode
numbers Combination response
3 14 (25,1) + D Normal, - I Weak
1 1 (25,2) + D Strong, + E Strong
1 1 (28,1) + D Strong, + E Strong
2 9 (28,2) + D Normal, + E Normal
Table (4.11) – Ranked remaining combinations

Chapter 4 Electrode Array optimisation
102
4.7.7 Seventh step:
In the seventh step, the electrode combinations were ranked in order of the desired
good dorsiflexion and/or eversion movement according to the trials. However, not all
these ranks gave dorsiflexion and eversion together. Trials using this technique prove
the effectiveness in using groups that mix the electrode combinations that produce
dorsiflexion and eversion. These groups can be groups of two, three, or four
combinations, but it was found that when using more combinations i.e. more
electrodes, the process became more complicated, and the resulting movement
become more difficult to predict based on the individual movement combination
responses. Also because of the size of the electrodes used (2 cm x 1 cm) during the
trials there was the possibility of fatiguing the muscle because of stimulation at
different sites at the same time and repeating the stimulation. For these reasons, the
algorithm formed groups of two combinations of electrodes, which was found to give
the desired movement as discussed in the results later on chapter 5 and 6. These
groups were put in order from 1 to 15 as shown below according to the existence and
availability of the combinations in Table (4.10). It should be noted that these 15
groups may contain in practice two electrodes, three electrodes, or four electrodes,
depending on whether one or two return electrodes are used. By using more return
electrodes increased the combinations of getting a repeated movement.
Optimisation grouping results:
1) First available + repeated* first available
2) First available (or repeated) + second available (or repeated)
3) First available (or repeated) + third available(or repeated)
4) First available (or repeated) + fourth available(or repeated)
5) First available (or repeated) + fifth available (or repeated)
6) Second available + repeated second available
7) Second available (or repeated) + third available (or repeated)
8) Second available (or repeated) + fourth available (or repeated)
9) Second available (or repeated) + fifth available (or repeated)
10) Third available + repeated third available
11) Third available (or repeated) + fourth available (or repeated)

Chapter 4 Electrode Array optimisation
103
12) Third available (or repeated) + fifth available (or repeated)
13) Fourth available + repeated fourth available
14) Fourth available (or repeated) + fifth available (or repeated)
15) Fifth available + repeated fifth available
Repeated* in the above, means that different electrodes combination gives almost the
same movement results.
These 15 groups are out of all the possible combinations of groups which originally
were 49 possible combinations of response representing 192 electrode combinations.
These possible 49 combinations can form (49x49) = 2401 groups of combination. So
these 15 groups were chosen out of the total 2401 possible combination groups.
Example
Applying this grouping algorithm to the example presented in Table (4.9) gives these
electrode groups ranked as :
1) (25,2) + (28,1)
2) (25,2) + (28,2)
3) (28,1) + (28,2)
4) (25,2) + (25,1)
5) (28,1) + (25,1)
6) (28,2) + (25,1)
4.7.8 Final step:
The final selection of the best pair of active electrodes from the 15 groups of
electrodes selected by the algorithm depended on a final user test with the
physiotherapist using the continuous stimulation and observing the movement
obtained and recording whether the stimulation was comfortable.
A summary of the optimisation algorithm is shown in Chart (4.2).

Chapter 4 Electrode Array optimisation
104
Specify number of electrodes and Work out all the combinations between
active and return electrodes
Sensors Inactivity waiting and noise free check up for at least 2 seconds
Fire twitch stimulation signal to the first (or next) electrode combination
For each combination record the X and Y sensors signals for 500 µs after the
firing the twitch stimulation signal
Apply digital filtering and peak recording algorithm to the stored sensor data
Rank the data into strong, normal, weak and nothing
Split these data into dorsiflexion, plantarflexion, eversion, inversion
Neglect all unwanted responses
Apply the ranking algorithm to the remaining combination responses
Use the grouping algorithm to form groups of 2 combinations ranked from
best to worse
Next electrode
combination
Test these groups using continuous stimulation to find the most effective and
comfortable one Chart 4.2

Chapter 4 Electrode Array optimisation
105
4.8 Summary
At the beginning of this chapter the system electrode array arrangement and topology
was discussed. The chapter discussed the sensors and the methods used to monitor the
foot movement. The philosophy behind the use of the twitch response was presented.
The basic behind uses a single pulse to each electrode, thereby avoiding muscle
fatigue and pain and reducing the setup time in comparison with continuous
stimulation. Trials were carried on 20 volunteer normal subjects in the engineering
laboratory, to study the relationship between the twitch response and the continuous
response. The effectiveness of using the twitch technique for optimising was
supported with some experimental results. The chapter also discuss how an
accelerometer feedback system was developed and used for optimising the electrode
array by measuring the twitch response. A signal processing algorithm was developed
to extract the useful twitch movement data from the accelerometer signal. This
chapter also discuss the new automatic electrode optimisation algorithm based on the
use of the twitch response. The result of the optimisation process is 15 combinations
of pairs of electrodes that are highly effective in producing the desired stimulation.
The user can select any of these combinations based on the comfort and the
effectiveness. The main advantage of using this array optimisation technique based on
the twitch response was the time required to find the best stimulation site.

Chapter 5 Foot-Drop Correction during Walking
106
Chapter 5
FOOT-DROP CORRECTION DURING WALKING

Chapter 5 Foot-Drop Correction during Walking
107
CHAPTER 5: FOOT-DROP CORRECTION DURING WALKING
The previous chapter discussed the electrode array optimisation process. The result
from this process was the best group of electrodes that gave the desired comfortable
good dorsiflexion movement with some eversion. This chapter will discuss the foot
drop correction during walking and how the foot gait monitoring sensors feedback
was used to control the stimulation which corrected and optimised the walking gait.
5.1 Foot-Drop monitoring The human normal walking gait and foot drop walking gait has been discussed earlier
in chapter 2 in this thesis. The foot gait events during walking stance and swing
phases that need to be detected to control the stimulation process are the beginning
and end of the swing phase as shown in Figure (5.1), heel contacts, toe contact, foot
angles and ground clearance during the swing phase. Investigations were carried out
using various sensors to find the best method to measure and monitor these gait
events.
Figure (5.1) - The human gait walking cycle, (Whittle, 1991).

Chapter 5 Foot-Drop Correction during Walking
108
5.1.1 FSR sensor
The force sensitive resistor presented in chapter 3 was used to detect the heel and the
toe contact. They can provide some information about the force and the body load
applied on them when they are placed under the foot heel and toe Figure (5.2).
Calibrating these FSR sensors will allow using them as a foot switch. This was
achieved by setting force thresholds to detect the force change as the heel or toe is in
contact with the floor.
Figure (5.2) - Force sensitive resistor placed under the heel and the toe
5.1.2 Gyroscope
During early investigations the gyroscope had been used to measure the foot
dorsiflexion/plantarflexion and eversion/inversion angular velocity (rotation rate)
during the foot swing phase as shown in Figure (4.2) in the previous chapter. The
ankle rotation angle was calculated from the angular velocity by integration if the
rotation movement start and stop time can be detected accurately. Foot switches were
used to detect the heel and the toe contact (on) and (off) and this information used to
define the time interval for the ankle angle integration calculation from the angular
velocity. The accelerometer was used to reset the foot tilt angle. The main problems
faced while using the gyroscope was defining the time interval and the starting angle
accurately, foot orientation during walking, integration drift and sensitivity to slow
movement.
FSR

Chapter 5 Foot-Drop Correction during Walking
109
5.1.3 Accelerometer
The accelerometer uses the force of gravity as an input vector to determine the
orientation of an object in the space. The same accelerometer used in measuring the
twitch movement responses can be used to measure tilt referenced to gravity but this
is in a static condition (no walking movement). Placing this accelerometer on top of
the toe in the same place as used in measuring the twitch responses Figure (5.4) allow
it to measure the tilt or the angle between the foot and the ground reference to gravity
with typical sensitivity up to 17.45 mg per degree of tilt when the axis is
perpendicular to the force of gravity parallel to the earth surface while goes down to
14.38 mg per degree at 40º (ADXL202 datasheet).
In this application the X axis is used to measure the dorsiflexion/plantarflexion tilt
angle reference to gravity and the Y axis to measure the eversion/inversion tilt angle
reference to gravity. However, this angle cannot be used in monitoring the ground
clearance angles or the ankle angle because of two reasons. The first reason is the
measured angle will depend mainly on the ground level angle reference to gravity,
which will change when going up or down hill also the foot orientation changes
during walking. The second reason is that the accelerometer can only measure the tilt
angle during static conditions and it cannot measure it during movement as there is a
dynamic acceleration component resulting in a superimposed unwanted interference
signal added to the tilt angle.
A new technique has been introduced in this research to measure the foot angle using
the same accelerometer. This technique is based on measuring the foot angle
reference to the leg shank. This was done using two accelerometers, placed parallel to
each other as possible, one on top of the foot and the other on top of the shank Figure
(5.3). Calculating the tilt angle difference between them will produce the absolute
angle. The X-axis difference is representing the dorsiflexion/plantarflexion (ankle
angle) and the Y-axis difference is representing eversion/inversion. As both of the
accelerometers placed on the same leg the difference in angle between them is not
affected by the ground level as both have the same angle reference to ground gravity.

Chapter 5 Foot-Drop Correction during Walking
110
This new foot angle measurement cannot work in the dynamic condition while the
foot is moving, unless the tilt angle sensor signal, which is lying within a certain
frequency domain, is extracted. After a long investigation and trials to find the best
way of extracting the static tilt angle information, specific analogue and digital
filtering was designed to filter the dynamic acceleration component and noise from
the accelerometers tilt signals.
Figure (5.3) - Measuring ankle angles using the tilt difference between two parallel
dual axis accelerometers
5.1.4 Filter design
When the accelerometer discussed in chapter 3 is used to measure tilt or static
(gravitational) acceleration it requires a very low noise floor which necessitates
restricting the bandwidth of the accelerometer, while dynamic acceleration is using
wide bandwidth. The accelerometer is setup to acquire acceleration from 0 to 50 Hz
(bandwidth of the maximum frequency of interest) using a low pass analogue filter as
Dorsiflexion Plantarflexion
Eversion Inversion
+ Dº - Pº
+ Eº - Iº Acc 2 X axis
Acc 1
Acc 2 X axis
Acc 2 Y axis
2 Dual axis Accelerometers
Acc 2 Y axis
Acc 1

Chapter 5 Foot-Drop Correction during Walking
111
described earlier in chapter 3, this set is used to filter the analogue output of the
accelerometer that is used in both twitch and tilt measurement. This will result a
noise floor of 6.1 mg, Equation (5.1), (ADXL202 datasheet, Analog Devices).
( ) ( )5.1)(500)( ××= BWHzgrmsNoise μ Equation (5.1)
This noise has to be reduced more for the tilt measurement and this can be achieved
using a digital filter. Different types of digital filters were designed and tested
including FIR (finite impulse response, non-recursive filter) and IIR (infinite impulse
response, recursive filter). The best filter performance during these trials was the FIR
low pass filter and this is due to its stability and phase linearity compared to IIR. The
filter cut off frequency is 1.5Hz and this is reduces the noise floor to 0.75 mg, using
Equation (5.1) above. This filter uses a Blackman-Harris window in its design based
on complex cosine offset window shown in Equation (5.2), which produces the
desired frequency response effect. The filter uses 51Hz sampling frequency that has
been chosen to match the microcontroller analogue digital converter specification.
The implemented filter transfer function, which has 32 coefficients presented in
Equation (5.3). The coefficients were calculated using “Filter Solution” design
software package (http://www.filter-solutions.com/). These coefficients are included
in Appendix B-3.
W(n) = .35875 - .48829*cos(n/(N+1)) + .14128*cos(2.*n/(N+1))-.01168*cos(3.*n/(N+1))
Equation (5.2)
ZZZZZZ aaaaaa
nn
31
12293031 012...............................293031 ++++++=
ΧΥ
Equation (5.3) The filter frequency response is shown in Figure (5.4), it has almost 0dB magnitude
up to 10mHz, -3dB at about 1.5 Hz and any frequencies above 6.4 Hz or below -83dB
will be distorted. The filter has 160ms group time delay which was found to be
acceptable for our application. Any additional delay resulting from the filter simply
added a small delay in measuring the final target angle from the accelerometers
during stimulation to lift the toes. This delay did not affect the function of the
stimulator during the walking tests. The impulse, step and ramp time responses are
shown in Figure (5.5).

Chapter 5 Foot-Drop Correction during Walking
112
Figure (5.4) Digital FIR filter frequency response
Figure (5.5) Digital FIR filter time response
5.3 Foot-Drop correction algorithm The foot drop walking gait was different from normal gait. One of the main
differences was the ankle angle at the start of the swing phase. In normal walking,
before and after the Heel off the foot tends to dorsiflex first to about 80° (between
foot and shank) or less, this is because of moving the body forward. This was
followed by plantarflexion just before the toe was off to about 95° (between foot and

Chapter 5 Foot-Drop Correction during Walking
113
shank) or more, while still touching the ground for push off to maintain the body
balance(Basmajian, 1985). When the toe left the ground the swing phase starts and
during this swing the foot must be dorsiflexed to prevent the toes catching the ground.
Foot drop patients do not perform all swing events through the gait cycle as normal;
they cannot dorsiflex the foot to prevent the toes from catching the ground during the
swing phase. The stimulation was intended to help foot drop patients to dorsiflex the
foot and clear the ground.
The walking algorithm was mainly based on placing an FSR sensor under the heel to
detect heel contact (on/off) as shown in Figure (5.2), and another FSR to detect toe
contact (on/off). Two accelerometers were mounted parallel to each other as presented
earlier in section (5.1.3), one mounted on the foot and the other mounted on the shank
of the lower leg (Tibia) to measure the dorsiflexion/plantarflexion angle and the
eversion/inversion angle. These combinations of accelerometer and FSR sensors have
been used as real time feedback to the stimulation system. According to this feedback
information the system controlled the stimulation signal envelope (start/stop time,
rise/fall time, extension time) and also controlled the stimulation pulse parameters
(amplitude, duty cycle).
This sensor combination provided the system with many feedback channels, but
because of the microcontroller’s speed there was a problem in reading and filtering all
the channels at an acceptable sampling rate. For this reason an investigation was
carried out using the dorsiflexion/plantarflexion angle with the heel and toe FSR as
feedback sensors to optimise the walking control algorithm.
The algorithm was originally developed based on normal subject trials comprising 18
volunteers, before trying it on real patients. After trying it on real patients some
modification was required to follow the unusual different patients walking gait
pattern, such as changing the FSR positions or depending only on heel FSR and ankle
angle in the control algorithm and excluding the toe event. Therefore more than one
algorithm was programmed into the ST32 system. The foot drop correction algorithm
using all the feedback channels (heel FSR, toe FSR, dorsiflexion angle, and eversion
angle) to correct foot drop during walking is illustrated in chart (5.1, 5.2, 5.3, 5.4, 5.5,
5.6 ) along with Figure (5.7 ) to help understanding it more clearly.

Chapter 5 Foot-Drop Correction during Walking
114
Figure (5.7) – walking algorithm diagram
Heel FSR Heel on
Heel off
Heel on
Toe on
Toe FSR Toe off
Ankle angle monitoring
Full body loading
Mid stance Mid swing
Stance phase
Swing phase
E Algorithm
process C B D A D F
Stimulation signal envelope
Rise time T1 Delay time Td
Fall time T2 Vr Vd
V0

Chapter 5 Foot-Drop Correction during Walking
115
5.3.1 Detailed algorithm description Process a, chart (5.1): During stance phase
As shown in Figure (5.7), at the stance phase (processes A) the body is loaded on the
ground, at this event both heel and toe FSR sensors is on. During process A the
algorithm is disabling all S32 system stimulation channels, stop generating
stimulation signal, reset signal amplitude and pulse width to defaults. Also during
this process the algorithm is always waiting for the heel-off event, which indicates the
end of the stance phase (process B) and the start of the swing phase.
Process B, chart (5.2): From stance to swing
Process B is one of the main features of this algorithm as it optimises the stimulation
signal amplitude to maintain the desired dorsiflexion. In this process the heel-off
event is used to trigger the start of the stimulation signal and also the start of ankle
angle monitoring. When the stimulation signals start, it starts from zero amplitude and
start to increase gradually using the rise time T1 up to the default amplitude Vd. This
rise time is needed mainly to make and sustain smooth dorsiflexion/eversion
movement as well as helping in body balancing.
During this stimulating signal amplitude increasing in process B after the heel-off
event, if the ankle target angle is not reached, the algorithm will continue increasing
the stimulation signal amplitude to the default amplitude Vd using the rise time T1. If
default stimulation amplitude is reached and the ankle target angle is not achieved
then the algorithm starts process C.
During this stimulating signal amplitude increasing in process B after the heel-off
event, if the ankle target angle is reached, the algorithm will check if this is due to
moving the body forward or not and this is done by knowing if the toe FSR is on or
not. If the toe FSR is off while the ankle target angle is achieved, that mean the foot is
clearing the ground and there is no need to increase the stimulating signal amplitude
to the default amplitude Vd and the algorithm will go to process D. this is because
there is enough stimulation to dorsiflex the foot to the target ankle angle to prevent
the toe from catching the ground. If the target angle is reached and the toe FSR is still

Chapter 5 Foot-Drop Correction during Walking
116
on then the algorithm continues to increase the stimulation signal amplitude to the
default Vd using the rise time T1. If the target angle is reached and stimulation signal
default amplitude is also reached while the toe FSR is on then the algorithm starts
process C.
Process C, chart (5.3 ): Increase stimulation amplitude and pulse width
In this process both the stimulation signal amplitude and pulse width will be increased
in turn to help reach the target ankle angle or lift the toe if the target ankle angle is
reached, but the toe sensor still in contact with the ground. This is the second main
optimisation feature in this algorithm.
Each time the stimulation signal amplitude increased it will be increased gradually by
5% of the original default amplitude and each stimulation signal pulse width is
increased by 50µs. The counter N is controlling the numbers of increase, three times
of increase is allowed for each of the stimulation signal amplitude and pulse width,
starting with the amplitude. This counter will be reset to 0 in process A (stance phase)
while resting and the stimulation signal amplitude and pulse width are set to the
default values. The time between the increases is about 15% of T1 but have to fire 2-4
pulses at least before deciding to increase signal amplitude and pulse width more or
not.
Process C starts first checking if the ankle angle target is reached or not , if not and
the N counter did not finish the allowed increasing then start increase the stimulation
signal amplitude and increase counter N by 1. If the ankle angle target is still not
reached and the N counter still did not finish the allowed increase, then the algorithm
will start increasing the stimulation signal pulse width by 50µs, the algorithm will
check the ankle angle again and do the increasing process three times again. During
this process if the ankle angle is reached at any time or if the allowed signal amplitude
and pulse width increasing is used then the algorithm will start process D.

Chapter 5 Foot-Drop Correction during Walking
117
Process D, chart (4.5): Swing phase
The main two aims of this process are to make sure that the foot is clearing the ground
during the swing phase by maintaining the target ankle angle and to wait for the end
of the swing phase detected by the heel FSR. During the process if the heel FSR
becomes on at any time the algorithm will start process E. To maintain the ankle angle
during the swing phase process the algorithm is always checking if the ankle angle
has decreased lower than the target or not, if yes it has been decreased and the
stimulation signal amplitude did not reach the default then the amplitude will be
increase until the target angle is reached. If the ankle angle is still less than the target
and the stimulation signal amplitude equal to or greater than the default then the
algorithm will start process C. For safety reasons, if the toe FSR become on during
the swing phase, while the target ankle angle is achieved, this is an indication of an
unexpected gait event or a problem with the stimulation system. If this happens the
algorithm will wait for 0.5 s and check again, if the FSR toe on confirmed the
algorithm will stop the stimulation signal immediately and restart from process A
again.
Process E, chart (5.5): Stimulation extension time
This process starts at any time the heel FSR become on during swing phase (process
D or B or C) as it detects the end of swing phase just before the start of the stance
phase. In this process when the heel FSR become on the stimulation signal will
continue for the extinction or delay time Td. If the toe FSR still off the extension time
will continue its end and then process F starts. During this extension time if the toe
FSR become on at any time the stimulation signal will stop and process A will start.
Process F, chart (5.6): Start of the stance phase
At the start of the stance phase after the heel touch the ground and FSR become on
this process will start after the extension time (process E). This process decreases the
stimulation signal amplitude using the delay time Td to zero amplitude. If during this
stimulation amplitude decrease the toe becomes on the stimulation signal will be
stopped and process A will start.

Chapter 5 Foot-Drop Correction during Walking
118
Chart (5.1)
Waiting for heel off
First swing phase event
Stance phase
N
Y
A
B
At any time during process
E or F or A If Heel becomes off
Stop stimulation signal
Restore stimulation signal amplitude
and pulse width defaults

Chapter 5 Foot-Drop Correction during Walking
119
Chart (5.2)
Start the Stimulation signal
Increase the stimulation signal amplitude gradually using the rise time T1 to reach to the default signal amplitude
During the rise time
Ankle angle ≥ threshold
Start measuring the ankle angle
Toe off
Y
N
Amplitude ≥ Vd
Continue increasing the amplitude using
rise time T1
N
Y
Stop increasing amplitude
N
Y
End of stance phase and start of swing phase
N = 0
C D
B

Chapter 5 Foot-Drop Correction during Walking
120
Chart (5.3)
No more amplitude or pulse width increase
Increase pulse amplitude by 5%
gradually
Ankle angle ≥ Threshold
Increase pulse width by 50µs gradually
N ≤ 5
N = N + 1
N = N + 1
N ≤ 5
Ankle angle ≥ Threshold
Increase stimulation amplitude and pulse width more than the default to achieve the ankle angle target
D
C
N
Y
N
Y
N
Y
N
Y

Chapter 5 Foot-Drop Correction during Walking
121
Chart (5.4)
Toe off
Wait 0.5 s
Check again if Toe off
Ankle angle ≥ Threshold
If toe is on during swing
C
D
Swing phase Maintain ankle angle And wait for heel on
N
Y
N
Y
N
Y
A
Amplitude ≥ Vd
Continue increasing the amplitude using
rise time T1
Heel off E
Y
N
Y
N

Chapter 5 Foot-Drop Correction during Walking
122
Chart (5.5)
Start the extension stimulation time Td
Toe off
Stop stimulation
signal immediately
End of swing phase and Start of stimulation extension time
Toe off
F
B
E
A
At any time during process
B or C or D If Heel become on
N
Y
N
Y
N
Y
Continue Wait for the extension stimulation
time Td
Td ended N
Y

Chapter 5 Foot-Drop Correction during Walking
123
Chart (5.6)
Start decrease stimulation signal amplitude using the fall time T2
Stop stimulation
signal immediately
Start of stance phase
Toe off
Continue decrease signal amplitude to zero amplitude
F
T2 end Amplitude = 0 A
A
N
Y
N
Y

Chapter 5 Foot-Drop Correction during Walking
124
5.4 Summary
This chapter discussed the investigation carried out using foot switches, gyroscopes
and accelerometers to monitor the foot movements. Two dual-accelerometer sensors
were utilised in a unique way to measure the angle that the foot makes with the shank
of the lower leg during walking. This chapter also discussed the signal processing
required for the measurements. In this chapter also the walking algorithm developed
for foot-drop correction was presented and discussed. This algorithm was mainly
used to make sure the foot did clear the ground and to maintain dorsiflexion at an
appropriate target angle. The testing results for using this algorithm to correct foot
drop based on the foot switch and accelerometer feedback was presented in chapter 6.

Chapter 6 Preliminarily Clinical Study
125
Chapter 6
PRELIMINARY CLINICAL STUDY

Chapter 6 Preliminarily Clinical Study
126
CHAPTER 6: PRELIMINARY CLINICAL STUDY
6.1 Introduction
During the designing process of the new FES system (chapter 3), the system was
tested within the laboratory to help in the development of a new electrode array
optimisation technique (chapter 4) and also the development of the foot drop walking
control algorithm (chapter 5). Toward the end of this laboratory based trials the new
ST32 FES system was completed successfully and embedded with all the optimisation
and control algorithms software.
The laboratory based trials on control (normal healthy) subjects was a preparation for
the preliminary clinical study on real foot drop patients. The preliminarily clinical
study was carried out between December 2004 and February 2005 in association with
the United Bristol Health care Trust (UBHT) MS Research Unit in Bristol General
Hospital. This MS research unit is one of the few clinical centres in the country who
have in depth experience in using the FES technology and testing its application with
neurological disability such as foot drop, (Jones, 1991, 1993, 1994, 1998, 2000),
(Whitlock, 1997).
6.1.1 The study objectives
1. Using the ST32 system on real foot drop patients
2. Test the ST32 system readability and compatibility
3. Ensure the ST32 stimulation signal comfort and effectiveness
4. Validate the correlation between the twitch and continuous stimulation response
5. Validate the use of the sensors feed back information in the algorithms developed
6. Examine the electrode array optimisation algorithms developed
7. Examine the foot drop control and correction algorithms developed during
walking

Chapter 6 Preliminarily Clinical Study
127
6.1.2 Study technical requirements
Before starting the study the ST32 FES system was tested and approved by the
Medical Equipment Management Organization (MEMO) of the UBHT, this approval
was mainly to confirm the system safety according to the (BS EN 60601-1:1990)
"Medical Electrical Equipment Part 1 General requirements for safety" and (BS EN
60601-2-10:2001) "Medical Electrical Equipment Part 2.10, particular requirements
for the safety of nerve and muscle stimulators".
The study protocol was approved by the UBHT local ethical committee. According to
the study protocol the system had to be tested first on control normal subjects before
testing it on patients. The number for the controls recruited has to be at least half the
patient number. The system should be tested on foot drop MS and Stroke patients
only. All participants should be screened according to the inclusion/ exclusion criteria
prior to entering the study. All study participants have to be introduced to the study
phases with the required information. They also have to sign a consent form on their
first visit to the MS Research Unit and were asked to consent to video registration
using the standard UBHT video/film consent form where appropriate. The study had
to follow the UBHT data protection policy, for this reason the collected data was
recorded originally on forms kept within the UBHT MS research unit.
6.1.3 Study participants recruitment
Ten control subjects and 14 foot drop patients were recruited in this study. These
subjects were recruited by a physiotherapist from Bristol General Hospital and by
notices placed in relevant departments of the hospital. These volunteer subjects were
not selected particularly for the study they were randomly selected MS and Stroke
foot drop patients. Some of them experienced using other FES systems and the others
did not. Due to this wide sample of foot drop patients two were excluded from the
beginning of the study and some of them did not complete all phases of study as
discussed later in this chapter in more detail.

Chapter 6 Preliminarily Clinical Study
128
6.2 Study methodology
The study was divided into three phases, starting with the subject assessment and then
the seated study phase and finally the walking study phase. The procedure and
methodology followed in each of these phases are presented in the following few
sections.
6.2.1 Subject assessment phase
The following assessment was carried out for each subject with the help of the
physiotherapist to study the condition of each subject individually.
• Gender, Age, Weight, Height
• Disability type (MS, Stroke) and time since diagnosis
• Foot drop whether present on left or right leg or both
• Expanded Disability Status Scale( EDSS ).
Kurtzke EDSS Scoring System (Kurtzke, 1983, 1989)
10 - Death from MS
--
8 - Require Wheelchair
--
6 - Intermittent or unilateral assistance to walk 100 meters
--
3 - Moderate disability in one Functional Systems or mild in 3-4
Functional Systems
--
0 - Normal
Full scale details presented in the Appendix C-1

Chapter 6 Preliminarily Clinical Study
129
• Eligibility and inclusion checklist.
o Control subjects: healthy adults
o MS patients: diagnosis of MS (8>EDSS), ability to walk at least 20 meters
with and without an aid.
o Stroke patients: hemiplegia causing visible foot drop, ability to walk at
least 20 meters with and without an aid.
• Exclusion checklist
o Control subjects: any lower limb weakness or limitation of movement,
lower limb skin abrasion, pregnancy, cardiac pacemakers or any electrical
implants.
o MS patients: recent relapse (prior 3 months), EDSS>8, lower limb skin
disorder, pregnancy, cardiac pacemakers or any electrical implants, ataxic
gait (lose of coordination during walking), fixed deformity at the ankle.
o Stroke patients: sensation loss in affected leg , skin disorder at affected leg,
expressive and/or receptive dysphasia, pregnancy, cardiac pacemakers or
any electrical implants, fixed deformity at the ankle.
• Muscle strength motricity index scale (MOT), this scale is used to assess the
motor impairment in a patient who has had a stroke or MS (Demeurise G, 1980),
(Collin C, 1990). The scale is presented in Appendix C-1
• Ashworth scale of lower limb calf muscle spasticity, (Bohannon,1987).
Modified lower limb spasticity scoring scale
0. No increase in muscle tone
1. Slight increase in tone with a catch and release or minimal resistance at
end of range
2. Same as 1 with minimal resistance through range following catch at less
than half of the ROM range

Chapter 6 Preliminarily Clinical Study
130
3. More marked increase tone through ROM but affected part easily moved
4. Considerable increase in muscle tone, passive movement difficult
5. Affected part rigid in flexion or extension
• Goniometry range of movement (ROM)
Goniometer Alignment
• Axis – lateral malleolus
• Stationary arm – aligned with fibular head
• Moving arm – aligned with fifth metatarsal
Ankle at 900 = 00
Flexion = + Degrees
Extension = - Degrees
6.2.2 Seated phase tests
Following the subject assessment and inclusion criteria the subject goes through the
seated phase. The seated phase aimed to achieve four testing targets, in the following
section each test target and how it was achieved is explained in details.
Test 1: The aim of this test is to set up the stimulation parameters defaults for both the twitch
and continuous stimulation according to the subject comfort to achieve effective
stimulation movement.
To achieve this aim this test included the following:
• Trying different wave form shapes, square, single sine, double and triple sine
• Varying the stimulation pulse amplitudes (10%-80%) of the maximum
amplitude
• Varying the stimulation pulse width (150µs-500µs)
• Tuning the stimulation frequency (20Hz-60Hz)

Chapter 6 Preliminarily Clinical Study
131
Test 2:
The aim of this test is to confirm the use of twitch stimulation acceleration response to
optimise the electrode array.
To achieve this aim this test included the following:
• Recording the twitch acceleration response from each electrode in the array.
• Observing the movement obtained (dorsiflexion, eversion, plantarflexion,
inversion) by continuous stimulation from every electrode in the array. A
score was giving according to the strength of observed contraction, Absent =
0, Weak = 1, Normal = 2, Strong = 3; this observation was done by more than
one physiotherapist.
• Correlating the twitch and the continuous stimulation responses.
Test 3:
The aim of this test is to test the electrode array optimisation algorithms software.
To achieve this aim this test included the following:
• Applying the optimisation algorithm manually to the collected electrode array
twitch responses
• Compare the ranked 15 group of electrodes generated from the manual
algorithm processing to the automatic software processing
• This test was performed on some randomly selected subjects but not on all
subjects due to time limitation and subjects availability.

Chapter 6 Preliminarily Clinical Study
132
Test 4:
The aim of this test is to test the automatic optimised selection of groups of electrodes
and select the preferred most comfortable group, which deliver the desired
dorsiflexion with some eversion movement.
To achieve this aim this test included the following:
• Trying each electrode group from the top 15 that is selected by the
optimisation algorithm starting from the highest ranked group.
• Tune the stimulation pulse parameters
Summary of data collected from the seated phase tests:
• Optimised default parameters for the twitch and continuous stimulation:
o Pulse shape
o Pulse width
o Pulse amplitude
o Stimulation frequency (pulse repetition rate)
• Twitch response for each electrode within the array
• Observation and scoring for movement obtained by every electrode in the
array
• Best group of electrodes out of the automatic optimised selected groups of
electrodes

Chapter 6 Preliminarily Clinical Study
133
6.2.3 Walking phase tests
Following the study seated phase test the walking phase test starts. The walking phase
aimed to achieve four testing targets, in the following section each test target and how
it was achieved is explained in details.
Test 1:
The aim of this test is to tune the stimulation pulse parameters and to set up the
walking stimulation signal envelope parameters that are needed for the walking
algorithm, these stimulation envelope parameters are the rise time, fall time and the
extension time.
To achieve this aim this test included the following:
• Asking the subject to walk with the system and observing the foot drop gait
and the walking speed as well as the subject comfort.
• Tune the stimulation pulse and the stimulation envelope parameters to give the
best observed results by the researchers and the subject themselves.
Test 2:
The aim of this test is to set up the targeted ankle angles thresholds that are required
for the walking algorithm.
To achieve this aim this test included the following:
• Choose stimulation parameters that gave enough angles to lift the foot and
clear the ground during the swing phase.
• Defining the desired ankle angles thresholds between the foot and the
shank that is measured by the sensors.

Chapter 6 Preliminarily Clinical Study
134
Test 3:
The aim of this test is to study the effect of using the system on the subject walking
speed, stride length and also the change in the gait cycle.
To achieve this aim this test was done using the technique recommended by (Wade,
1987). This technique was based on using a stop watch to measure the time taken to
walk 10 or 11 meter with 2 meters run in and run out distance, so that their gait was
not affected by accelerating and de-accelerating from/to standing. In 1999 O’Keeffe’s
study, a comparison of measuring walking speed using stop watch against using
optical beam and no significant difference was found between the 2 methods,
(O’Keeffe, 1999).
• Practise and exercise walking with the system for some time before doing
any walking recording
• Recording the time taken and the number of steps to walk 10 metres with
and without the ST32 system. Walking commenced before the timed 10
metres and subjects were asked to walk beyond the 10 metres “the subjects
were wearing the devices all the time during the test, with out knowing if it
is on or off.
• Video recordings were used to confirm the recorded results and to allow
more gait analysis with and without the ST32 system.
Test 4:
The aim of this test is to record the subject’s feedback on the stimulation comfort,
ankle movement achieved and ability to walk with and with out the ST32 system.
To achieve this aim the subject was asked make a mark on the following Visual
Analogue Scale (VAS) scores:
0 ________________________________ 10
Worst Best

Chapter 6 Preliminarily Clinical Study
135
• VAS score for the stimulation comfort
• VAS score for movement achieved at ankle
• VAS score for perception of walking ability with and without the ST32 system
Summary of data collected from the walking phase tests:
• Final stimulation pulse parameters
o Pulse width
o Pulse amplitude
• Stimulation signal envelope parameters
o Rise time
o Fall time
o Delay (extension) time
• Ankle angles thresholds
• Number of steps recorded over 10 metres without the ST32
• Number of steps recorded over 10 metres with the ST32
• Time taken to walk 10 metres without the ST32
• Time taken to walk 10 metres with the ST32
• Video recording to support all the walking collected data
• VAS score for comfort of stimulation
• VAS score for movement achieved at ankle
• VAS score for perception of walking ability with and without the ST32 system
The final step in the study was to analyse the patient’s walking gait with and without
the ST32 system. This was done initially during the walking by the research
physiotherapist, who is helping in the study. At the end of the study two independent
assessors watched the walking video recording for all patients and reassessed the
walking gait without knowing which walk was with the ST32 system switched on and
which one was switched off. After that they agreed on one final assessment results.

Chapter 6 Preliminarily Clinical Study
136
6.3 Study Results and Analysis
6.3.1 Control subjects
Ten control subjects 4 male, 6 female, within wide normal ranges of age and normal
ranges of height and weight were recruited as presented in Table (6.1). All controls
were recruited as healthy normal subjects.
Subject
number
Gender
Age
Weight
kg
Height
cm
1 Male 30 77 178 2 Female 47 75 170 3 Female 62 75 156 4 Female 22 51 165 5 Male 34 80 178 6 Female 25 70 165 7 Female 23 65 165 8 Female 20 60 172 9 Male 38 72 177 10 Male 23 82 189
Average 4M/6F 32.4 70.7 171.5 Table (6.1) - Control subjects details
In this phase the subject was asked to sit high from the floor (i.e. foot not touching the
floor) with foot relaxed in the plantarflexion relaxing position as shown in Figure
(6.1). The test was done on the left leg using 4X4 active electrode placed roughly on
top of the tibialis anterior muscle and one return electrode behind the knee or at the
end of the tibialis anterior motor point.

Chapter 6 Preliminarily Clinical Study
137
Figure (6.1) – subject during seated test phase
6.3.1.1 Seated phase results and analysis for control subject
The study seated phase tests were carried out on all 10 control subjects according to
the phase seated tests procedure explained earlier.
Test 1
The twitch stimulation signal parameters that were chosen during the seated phase and
the continuous stimulation signal parameters that were chosen after completing both
the seated phase and the walking phase are presented in Table (6.2).

Chapter 6 Preliminarily Clinical Study
138
Control
subject
number
Twitch
pulse
shape
1 – 6*
Continuous
pulse shape
1 – 6*
Twitch
pulse
width
µ sec
Continuous
pulse width
µ sec
Twitch
pulse
amplitude
% **
Continuous
pulse
amplitude
% **
Continuous
stimulation
frequency
Hz
1 3 5 350 300 65 52 40
2 3 4 350 350 40 34 33
3 3 4 400 350 40 32 33
4 3 5 350 300 40 35 33
5 3 3 350 300 55 43 40
6 3 3 400 350 55 48 33
7 3 5 400 350 50 45 40
8 3 3 400 350 65 50 40
9 4 5 400 350 50 45 40
10 5 4 400 350 60 55 33
*pulse shapes Pulse shape 1 = no wave stored
Pulse shape 2 = square wave
Pulse shape 3 = biphasic square wave
Pulse shape 4 = sine wave
Pulse shape 5 = double sine wave
Pulse shape 6 = triple sine wave
Pulse shape 7-12 = no wave stored
** This is a percentage of the maximum amplitude (400 V peak-peak with out load)
Table (6.2) - Chosen stimulation signal parameter for control subjects
The results show that in twitch stimulation the square biphasic charge balanced pulse
shape was selected the most with pulse width either 350 µs or 400 µs and amplitude
varying between 40% and 65 % of the maximum amplitude.
In continuous stimulation the parameters were slightly different, the biphasic square
sine and double sine biphasic charge balanced pulse shape are used mostly, the pulse
width were either 300 µs or 400 µs and the amplitude varied between 32% and 55 %
of the maximum amplitude at 33 Hz or 40 Hz stimulation frequency.
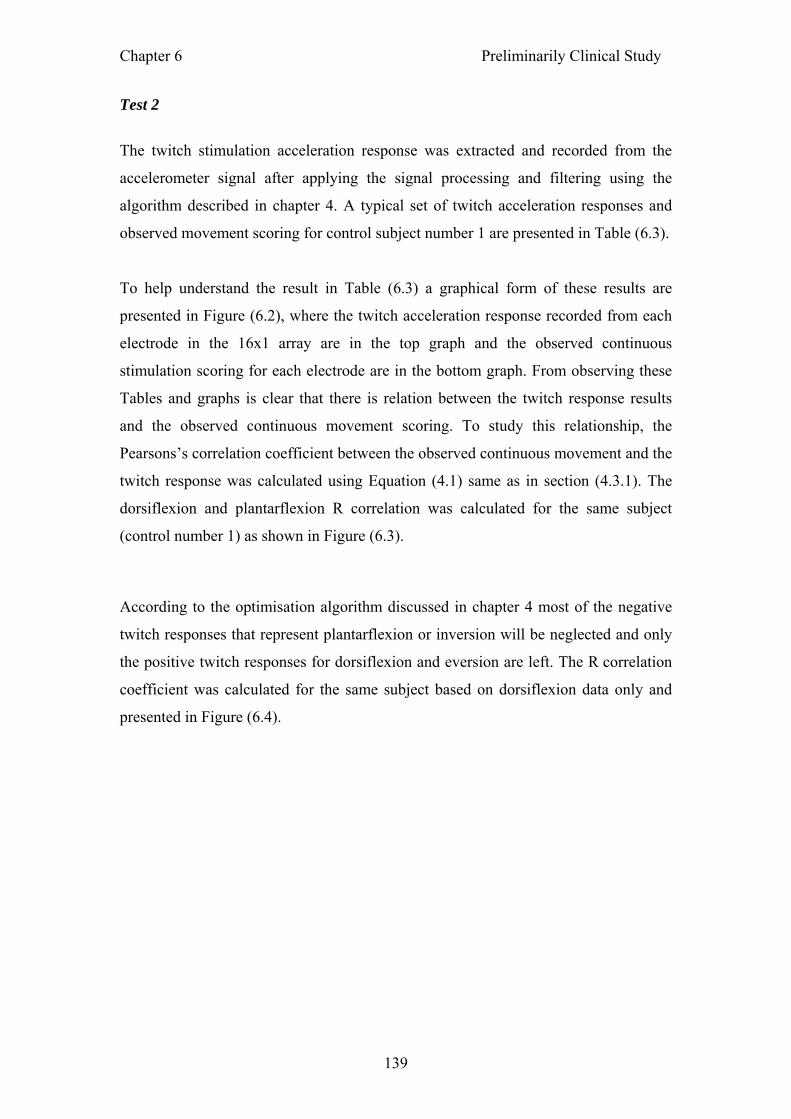
Chapter 6 Preliminarily Clinical Study
139
Test 2
The twitch stimulation acceleration response was extracted and recorded from the
accelerometer signal after applying the signal processing and filtering using the
algorithm described in chapter 4. A typical set of twitch acceleration responses and
observed movement scoring for control subject number 1 are presented in Table (6.3).
To help understand the result in Table (6.3) a graphical form of these results are
presented in Figure (6.2), where the twitch acceleration response recorded from each
electrode in the 16x1 array are in the top graph and the observed continuous
stimulation scoring for each electrode are in the bottom graph. From observing these
Tables and graphs is clear that there is relation between the twitch response results
and the observed continuous movement scoring. To study this relationship, the
Pearsons’s correlation coefficient between the observed continuous movement and the
twitch response was calculated using Equation (4.1) same as in section (4.3.1). The
dorsiflexion and plantarflexion R correlation was calculated for the same subject
(control number 1) as shown in Figure (6.3).
According to the optimisation algorithm discussed in chapter 4 most of the negative
twitch responses that represent plantarflexion or inversion will be neglected and only
the positive twitch responses for dorsiflexion and eversion are left. The R correlation
coefficient was calculated for the same subject based on dorsiflexion data only and
presented in Figure (6.4).

Chapter 6 Preliminarily Clinical Study
140
Electrode
Number
Twitch
Acceleration
mV
+ Dorsiflexion
- Plantarflexion
Continuous
scoring*
+ Dorsiflexion
- Plantarflexion
Twitch
Acceleration
mV
+ Eversion
- inversion
Continuous
scoring*
+ Eversion
- inversion
1 48 1 -48 -2
2 211 3 64 2
3 43 1 35 1
4 142 2 116 3
5 51 1 -87 -2
6 115 2 -8 0
7 163 3 53 1
8 18 0 27 2
9 126 2 -23 -1
10 59 1 10 -1
11 -20 -1 62 2
12 7 0 79 2
13 57 0 -11 -1
14 97 2 0 1
15 54 1 0 0
16 2 0 0 0
* Absent = 0, Weak = 1, Normal = 2, Strong = 3
Table (6.3) - Twitch acceleration responses and observed movement scoring for
control subject 1

Chapter 6 Preliminarily Clinical Study
141
Figure (6.2) - Twitch acceleration responses and observed movement scoring for
control subject 1
-100
-50
0
50
100
150
200
250
1 2 3 4 5 6 7 8 9 10 11 12 13 14 15 16Twitc
h Ac
cele
ratio
n m
v(+ Dorsiflexion, - Plantarflexion) (+ Eversion, - inversion)
-3
-2
-1
0
1
2
3
1 2 3 4 5 6 7 8 9 10 11 12 13 14 15 16
Con
tinuo
us O
bsirv
atio
n S
corin
g*
(+ Dorsiflexion, - Plantarflexion) (+ Eversion, - inversion)
* Absent = 0, Weak = 1, Normal = 2, Strong = 3

Chapter 6 Preliminarily Clinical Study
142
Absent = 0, Weak = 1, Normal = 2, Strong = 3
Figure (6.3) - dorsiflexion/plantarflexion twitch acceleration responses and observed
continuous movement scoring correlation for control subject 1
Absent = 0, Weak = 1, Normal = 2, Strong = 3
Figure (6.4) - Control subject 1 twitch acceleration responses and observed
continuous movement scoring correlation for dorsiflexion only
y = 0.017x - 0.1229
-2
-1
0
1
2
3
4
-50 0 50 100 150 200 250
Twitch response mV
Obs
erve
d co
ntin
uous
sco
ring*
R = 0.9455
y = 0.016x - 0.0049
-2
-1
0
1
2
3
4
-50 0 50 100 150 200 250
Twitch response mV
Obs
erve
d co
ntin
uous
sco
ring
*
R = 0.9402

Chapter 6 Preliminarily Clinical Study
143
Test 3
For more statistical analysis the correlation coefficient was calculated for all 10
control subjects between the observed continuous movement and the twitch response.
This calculation include; dorsiflexion and plantarflexion together, dorsiflexion only,
eversion and inversion together, eversion only. All the correlation results are
presented in Table (6.4) and also in graphical format in Figure (6.5). High correlations
were found for all 10 control subjects. This confirms the concept that was suggested
from the laboratory trials that twitch accelerating response can be used to optimise the
electrode array, but still to be tested on real patients.
Control
Subject
number
Dorsiflexion
Plantarflexion
Correlation
Eversion
Inversion
Correlation
Dorsiflexion
Correlation
Eversion
Correlation 1 0.946 0.914 0.940 0.818 2 0.891 0.931 0.859 0.795 3 0.913 0.948 0.895 0.869 4 0.893 0.984 0.849 0.960 5 0.829 0.932 0.785 0.898 6 0.873 0.922 0.837 0.920 7 0.966 0.925 0.965 0.854 8 0.952 0.947 0.947 0.880 9 0.954 0.963 0.958 0.983
10 0.959 0.876 0.948 0.872 Table (6.4) - Twitch and continuous correlation result for all 10 control subjects

Chapter 6 Preliminarily Clinical Study
144
0.00
0
0.10
0
0.20
0
0.30
0
0.40
0
0.50
0
0.60
0
0.70
0
0.80
0
0.90
0
1.00
0
12
34
56
78
910
Cont
rols
Correlation
Dor
sifle
xion
& P
lant
arfle
xion
Cor
rela
tion
Eve
rsio
n &
Inve
rsio
n C
orre
latio
nD
orsi
flexi
on C
orre
latio
nE
vers
ion
Cor
rela
tion
Figu
re (6
.5) -
twitc
h an
d co
ntin
uous
cor
rela
tion
resu
lt fo
r all
10 c
ontro
l sub
ject
s

Chapter 6 Preliminarily Clinical Study
145
Test 4:
This was the automatic electrode array optimisation test, which was performed by the
ST32 system software. The outcome of this optimisation process is 15 groups of pairs
of active and return electrodes ranked from 1 to 15 out of all the possible electrode
combinations (2 x 16 = 32) as explained earlier in the electrode array optimisation
algorithm, chapter 4. Each of these groups is then selected and tried in turn until the
best electrode group that gave comfortable good dorsiflexion with some eversion was
found. The selected electrode group ranks for each of these 10 control subjects are
presented in Table (6.5).
Control Subject number selected Group rank
1 2 2 2 3 1 4 1 5 1 6 5 7 1 8 2 9 3
10 2 Table (6.5) - Chosen electrode group ranks for each of these 10 control subjects
This electrode group rank results prove that the optimisation algorithm is very
satisfactory as good stimulation movement was achieved usually within the top three
ranked electrode groups from the original 15 group. This small variation of rank was
due few factors like the comfort and combining two pairs of electrodes instead of one
as explained in the optimisation algorithms, which was modified slightly based on
these results.

Chapter 6 Preliminarily Clinical Study
146
6.3.1.2 Electrode mapping analysis
Figure (6.6) is shown the electrode mapping of all the 10 control subjects. The test
following the same procedure explained section (4.6.2) for recording the continuous
stimulation response from each single active electrode but the observation scoring
was done this time by two physiotherapists.
As discussed earlier the electrode array optimisation algorithm used the twitch
response to select the optimum 15 group of electrode as explained earlier in chapter 4.
The subject chose the best combination that give the desired comfortable dorsiflexion
with some eversion, this was achieved by trying the electrode combinations in turn
starting from the highest ranked. The final chosen combination of pair of electrodes is
highlighted in a different colour on the same maps. The box at top of the active 4x4
electrode array map indicates the use of return electrode behind the knee, the box at
the bottom of the map indicates using the return electrode at the lower end of the
tibialis anterior muscle. By examining these maps it is clear that there is no common
electrodes that are used and this may be due to human muscles physiological and
geometry differences. This is a similar result to the electrode maps for the normal
group. Each electrode pair chosen shows unique differences. The chosen electrode
pair after ranking mainly includes dorsiflexion and eversion movements, with small
differences C6, C8, C9, and C10 which show inverter movement. These results show
that the electrode combinations chosen using the optimisation algorithm based on
individual electrode twitch was a successful way of optimising the electrode array.

Chapter 6 Preliminarily Clinical Study
147
C2
C6 C7 C9 C10
3
2
2
0
1
1
2
1
1
1
3
1
1
2
1
0
2
3
0
2
0
2
0
0
1
2
1
2
2
1
0
1
2
1
2
1
2
2
0
2
1
0
0
1
0
1
0
0
1
0
2
1
2
0
0
2
2
2
0
2
1
0
0
3
1
2
2
2
2
1
1
0
1
0
0
0
0
1
2
0
3
0
0
0
1
3
2
3
2
3
2
0
3
1
2
1
0
1
1
1
0
2
1
1
1
1
0
0
2
3
1
1
1
3
0
0
2
2
3
1
2
2
1
1
3
2
2
1
3
1
0
0
0
0
0
0
0
0
0
0
1
3
0
0
0
0
0
0
2
0
3
1
2
0
1
1
0
0
1
2
0
2
0
2
3
3
1
2
1
1
0
2
0
0
0
1
2
3
2
3
3
3
3
3
0
2
1
3
2
0 0
0
2
0
2
1
1
0
2
0
2
0
1
1
1
0
3
0
2
0
1
0
1
1
1
3
1
2
1
2
0
0
1
3
1
2
1
1
1
0
3
0
2
1
3
0
1
3
1
2
0
3
1
1
2
3
3
2
3
2
2
0
1
0
0
3
2
1
1
1
0
0
0
0
1
0
1
0
0
0
0
0
0
0
0
1
0
2
0
3
1
0
1
1
2
1
3
1
2
1
1
1
0
1
0
2
0
2
1
2
0
1
1
1
1
2
0
0
3
1
0
0
3
1
0
0
C3C1 C5C4
C8
Figure (6.6) – Control Subjects Electrode Optimisation Map

Chapter 6 Preliminarily Clinical Study
148
6.3.1.3 Walking phase results and analysis for control subjects:
Walking studies were carried out immediately after the seated phase on 5 randomly
selected control subjects from the original 10 using the parameters and electrode
groups selected by the ST32 system during the seated testing.
Test 1
The first step in this test was to set up the stimulation signal envelope parameters
required for walking, which were the stimulation rise time and fall time and also the
extension time if required. The subjects were asked to walk for few meters using the
default parameters, which was 80ms rise and fall time and zero extension time. Then
by observing the walking gait and the movement obtained by the stimulation these
parameters were tuned. The stimulation envelope rise time and fall time was set
mainly to optimise the subject’s comfort and speed. The extension time was not
needed and was always kept at zero. The chosen parameters for the 5 controls subjects
who did the walking are presented in table (6.6).
Control
subject
number
stimulation envelope
rise time (ms)
stimulation envelope
fall time (ms)
1 120 80
4 160 40
5 200 120
9 80 80
10 120 40
Table 6.6 – Control subjects walking stimulation envelope parameters

Chapter 6 Preliminarily Clinical Study
149
Test 2
This was the ankle angle threshold test. This was done by measuring the ankle angle
using the ST32 system sensors. Once the ankle angle is observed to be enough so that
the toes cleared the ground during the swing phase, the target angle was saved by
pressing a button on the ST32 system. The chosen ankle angles for the 5 controls
subjects who did the walking are presented in Table (6.7). The results show that the
measured ankle angles for these subjects vary within the normal range 65° – 80°. This
was also dependent on the sensor placement accuracy.
Control subject number Ankle angle threshold ( )°
1 72
4 68
5 74
9 81
10 63
Table (6.7) – Control subjects ankle angle thresholds
Test 3
After the walking parameters set-up, the subjects were asked to practise using the
system for 15-30 minutes. Then the walking test over 10 meters was performed. In the
10 meters walking test the subjects walk 10 meters without FES and 10 meters with
FES. The number of steps and time taken was recorded with and without FES. The
results obtained from the 5 control performed this test are illustrated in Table (6.8).
Video registration was taken for one control subject walking with and without FES
for gait comparison.

Chapter 6 Preliminarily Clinical Study
150
10m walk without FES 10m walk with FES
Subject no. No.steps Time (s) Speed
m/s
No.steps Time (s) Speed
m/s
C01 15 8 1.2 14 8.1 1.2
C04 15 7.1 1.4 15 7.4 1.3
C05 14 8.1 1.2 14 7.7 1.2
C09 7 9 1.0 9 9.9 1.0
C10 14 7 1.2 13 7.2 1.3
Table (6.8) – Control subjects walking test results
These results show that the stimulation did not interfere with the normal walking
speed for these control subjects.
Test 4 After the walking test each subject was asked two questions to be answer on a visual
analogue scale based on walking with and without the device:
1. On a scale of 0-10 how would you rate how you are able to walk with the device?
0 = worst, 10 = best
2. On a scale of 0-10 how would you rate how comfortable the stimulation feels on
your leg whilst walking with the device? 0 = most uncomfortable, 10 = most
comfortable
subject Comfort of stimulation Ability to walk
C01 8 8
C04 9 9.8
C05 10 10
C09 7.4 7.2
C10 9.1 10
Mean score 8.7 9
Table (6.9) - VAS scores test results
The results of VAS scores shown in Table (6.9) show that the ST32 system is
comfortable to use and is not upsetting or disturbing the normal walk of these healthy
control subjects.

Chapter 6 Preliminarily Clinical Study
151
6.3.2 MS and Stroke patient subjects
6.3.2.1 Assessment of Subjects
After applying the eligibility and exclusion criteria explained earlier of the 14
volunteer patient subjects recruited in this study, 12 patients were found to be eligible
to take part in the study one patient was excluded due to having a cardiac pacemaker
and another patient was excluded due to severe lower limb skin sensation. A summary
of these patients assessment results are presented in Table (6.10).
No. background Walking aid Muscle . strength Spasticity/ ROM P01 49 yrs. Male,
83Kg, 165cm, MS, diagnosed 10yrs. EDSS 6.0. Left footdrop Chronic back pain INCLUDED
Occasionally 1 stick ODFS outside, not in house. Used AFO in past
R leg- full strength. L leg: hip and knee- full range against some resistance but weaker than R. Ankle- some movement, not full range, not against resistance
Spasticity: none Ankle ROM some movement, not full range. Passive dorsiflexion 1000 Active dorsiflexion 1280
P02* 41yrs female, 55Kg, 175cm, MS, diagnosed 14 yrs. EDSS 5.5. Footdrop on left but only when fatigued or affected by heat. INCLUDED no footdrop 10m.
walking aid: nil Has been given an AFO to wear when needed.
R leg: full L leg: knee- full strength, hip and ankle- full range against some resistance but weaker than other side.
Spasticity, moderate Ankle ROM: passive dorsiflexion 700, active dorsiflexion 780 Tremor left upper and lower limb
P03
54 yrs female, 61Kg, 174cm, MS, diagnosed 30 years ago, EDSS 6.5. Footdrop on left when fatigued . INCLUDED
walking aid: 2 sticks Previously used an ODFS ,when used to walk longer distances. Now effort of putting it on outweighs benefit.
R leg and L leg: full strength Spasticity, mild ankle range of movement passive dorsiflexion 780, active dorsiflexion 850
P04* 56 yrs. Male, 79Kg, 179cm MS, diagnosed 35 years ago, EDSS 6.0. LOST TO FOLLOW UP (walking study)
walking aid: 1 stick
R leg: hip, knee and ankle- less than full strength, can move against resistance. L leg: hip- not move against resistance, knee- full strength, ankle- move against resistance, not full strength.
Spasticity: moderate. Ankle ROM passive dorsiflexion 900, active dorsiflexion 1020
P05 56yrs, male. 81Kg, 178cm Stroke 7 months ago. Ready for discharge from hospital. Right hemiplegia INCLUDED
walking aid: 1 stick Early stages post stroke. Leaning against the wall as well as using 1 stick.
L leg: full strength. R leg: hip and knee- no movement , knee- can move against gravity but not against resistance
Spasticity : mild Ankle ROM passive dorsiflexion 800, active dorsiflexion 1300 (no active range)

Chapter 6 Preliminarily Clinical Study
152
No. Background Walking aid Muscle . strength Spasticity/ ROM P06 47 yrs. Male.
74Kg, 186cm Stroke 16 months ago. Left hemiplegia. INCLUDED
walking aid: 1 stick Uses an ODFS
R leg: full strength. L leg: Hip and knee- movement against resistance, not full strength. Ankle- no active movement.
Spasticity: marked Ankle ROM: passive dorsiflexion 930, active dorsiflexion 1300 (no active range)
P07* 47yrs. Male MS, 89Kg, 156cm diagnosed 7 years ago, EDSS 6.0. INCLUDED no footdrop 10m
Walking aid: 1 stick, intermittently
L leg: full strength. R leg: knee- full strength. Hip and ankle- movement against resistance but not full strength.
Spasticity: mild ankle ROM: passive dorsiflexion 770, active dorsiflexion 770
P08* 39 yrs. Female.
72Kg, 176cm Stroke 2 months ago. Left hemiplegia. Inpatient receiving rehabilitation.
INCLUDED
Walking aid: 1 stick Walks with an ankle splint to correct lateral instability.
R leg full strength. L leg: hip- movement seen but not against gravity, knee- contraction but no movement, ankle- no movement.
Spasticity: severe ankle ROM: passive dorsiflexion 1100, active dorsiflexion, No movement, 1450
P09 54 yrs. Male, MS
85Kg, 176cm Diagnosed 5 years ago.
EDSS 6.0
INCLUDED
Walking aid: 1 stick
L leg: full strength. R leg: Knee- full strength, hip- move against gravity but not against resistance, aAnkle- palpable contraction but no movement.
Spasticity: mild Ankle ROM: passive dorsiflexion 1000, no active dorsiflexion 1360
P10# Female MS EXCLUDED (abnormal
Sensation)
P10 50 yrs. male MS
75Kg, 173cm diagnosed 5 years ago.
EDSS 6.0
INCLUDED
Walking aid: 1 stick
L leg: full strength. R leg: hip, knee, ankle- movement against gravity but not against resistance
Spasticity- none ankle ROM passive dorsiflexion 1060, no active dorsiflexion 1300
P11* 66yrs. female
80Kg, 171cm Stroke 14 months ago
INCLUDED
Walking aid: 1 stick
L leg: full strength. R leg: knee- full strength, hip- move against gravity but not against resistance, ankle- palpable contraction but no movement.
Spasticity- mild ankle ROM passive dorsiflexion 1000, no active dorsiflexion 1360
P12 59 yrs. Male
75Kg, 176cm Stroke 3 years ago. Hemiplegia right side
INCLUDED
Walking aid: nil
L leg: full strength. R leg: hip and knee- move against resistance but weaker than the other side. Ankle- no movement.
Spasticity- marked ankle ROM passive dorsiflexion 900, no active dorsiflexion 1530
P13# Male Stroke pacemakers EXCLUDED
Table (6.10) – Patients assessment results

Chapter 6 Preliminarily Clinical Study
153
The assessment data show that the selected volunteered patients subject are varying
in disability (7 MS, 5 stroke), gender, wide ranges of age(range 39-67), height and
weight also are in normal range.
6.3.2.2 Seated phase test results and analysis for patient subjects
Seated studies were carried out on all 12 patient subjects using the same 4X4
electrode array following the same procedure explained earlier. The only difference
was performing the test on the affected leg (left or right).
Test 1
The twitch stimulation signal parameters that been chosen during the seated phase and
the continuous stimulation signal parameters that been chosen after completing both
the seated phase and the walking phase are presented in Table (6.11).
These results show that, in continuous stimulation the biphasic square, sine and
double sine biphasic charge balanced pulse shape are used mostly, the pulse widths
were 300 µs or 350 µs or 400 µs and the amplitude is varying between 42% and 58 %
of the maximum amplitude at 33 Hz or 40 Hz stimulation frequency. In twitch
stimulation the square biphasic charge balanced pulse shape was selected the most
same as in controls with fixed 400 µs pulse width, the amplitude varying between
50% and 70 % of the maximum amplitude which was slightly higher than the
controls.

Chapter 6 Preliminarily Clinical Study
154
Patient
number
Twitch
pulse
shape
1 – 6*
Continuous
pulse shape
1 – 6*
Twitch
pulse
width
µ sec
Continuous
pulse width
µ sec
Twitch
pulse
amplitude
% **
Continuous
pulse
amplitude
% **
Continuous
stimulation
frequency
Hz
1 3 4 400 350 60 52 40
2 3 4 400 350 50 46 33
3 3 5 400 350 50 42 33
4 3 3 400 400 70 48 40
5 3 3 400 400 50 40 33
6 3 3 400 350 50 43 33
7 5 4 400 350 50 47 40
8 3 3 400 350 50 41 33
9 4 4 400 350 50 42 40
10 4 3 400 350 50 47 40
11 3 4 400 400 50 46 33
12 5 4 400 350 70 58 33
*pulse shapes Pulse shape 1 = no wave stored
Pulse shape 2 = square wave
Pulse shape 3 = biphasic square wave
Pulse shape 4 = sine wave
Pulse shape 5 = double sine wave
Pulse shape 6 = triple sine wave
Pulse shape 7-12 = no wave stored
** This is a percentage of the maximum amplitude (400 V peak-peak with out load)
Table (6.11) - Chosen stimulation signal parameter for patient subjects

Chapter 6 Preliminarily Clinical Study
155
Test 2
One of the aims of this test is to record the twitch stimulation acceleration response
and the continuous stimulation observation same as done for controls before. A
typical set of twitch acceleration responses and observed movement scoring for
patient number 1 are presented in Table (6.12). These results are presented in a
graphical form in Figure (6.7), where the twitch acceleration response recorded from
each electrode in the 16x1 array are in the top graph and the observed continuous
stimulation scoring for each electrode are in the bottom graph.
Studying these twitch and continuous stimulation responses obtained from foot drop
patients show clear relationship between the twitch response results and the observed
continuous movement scoring. To analyse this relationship, the Pearsons’s correlation
coefficient between the observed continuous movement and the twitch response was
calculated using Equation (4.1) same as in section (4.3.1). The dorsiflexion and
plantarflexion R correlation was calculated for the same subject (control number 1)
and the results was R = 0.95. According to the optimisation algorithm discussed in
chapter 4 most of the negative twitch responses that represent plantarflexion or
inversion will be neglected and only the positive twitch responses for dorsiflexion and
eversion are left. The R correlation coefficient was calculated for the same subject
based on dorsiflexion data only and the result was R = 0.94.

Chapter 6 Preliminarily Clinical Study
156
Electrode
Number
Twitch
Acceleration
mV
+ Dorsiflexion
- Plantarflexion
Continuous
scoring*
+ Dorsiflexion
- Plantarflexion
Twitch
Acceleration
mV
+ Eversion
- inversion
Continuous
scoring*
+ Eversion
- inversion
1 23 0 43 1
2 148 3 27 0
3 169 3 -17 -1
4 35 0 78 2
5 0 0 49 1
6 23 0 41 1
7 0 0 0 0
8 42 1 7 0
9 114 2 0 0
10 24 0 36 1
11 13 0 21 0
12 126 2 0 0
13 97 3 3 0
14 111 2 -37 -1
15 92 2 -19 -1
16 38 1 -15 -1
* Absent = 0, Weak = 1, Normal = 2, Strong = 3
Table (6.12) - Twitch responses and observed movement scoring for patient number 1

Chapter 6 Preliminarily Clinical Study
157
Figure (6.7) - Twitch responses and observed movement scoring for patient number 1
-50
0
50
100
150
200
1 2 3 4 5 6 7 8 9 10 11 12 13 14 15 16
Twitc
h A
ccel
erat
ion
m(+ Dorsiflexion, - Plantarflexion) (+ Eversion, - inversion)
-2
-1
0
1
2
3
1 2 3 4 5 6 7 8 9 10 11 12 13 14 15 16
Con
tinuo
us O
bsirv
atio
n Sc
orin
g
(+ Dorsiflexion, - Plantarflexion) (+ Eversion, - inversion)
* Absent = 0, Weak = 1, Normal = 2, Strong = 3

Chapter 6 Preliminarily Clinical Study
158
Test 3
To prove that the twitch response could be used to optimise the electrode array used
for patients suffering from foot drop. The correlation between the observed
continuous movement and the twitch response was done for all the 12 patients
recruited in the study. This calculation include; dorsiflexion and plantarflexion
together, dorsiflexion only, eversion and inversion together, eversion only. All the
correlation results are presented in Table (6.13) and also in graphical format in Figure
(6.8). Good high correlations were found for all 12 patients. This confirms that
concept that twitch accelerating response can be used to optimise the electrode array
on real patients.
Patient
number
Dorsiflexion
Plantarflexion
Correlation
Eversion
Inversion
Correlation
Dorsiflexion
Correlation
Eversion
Correlation
1 0.94 0.96 0.94 0.94 2 0.97 0.95 0.97 0.97 3 0.82 0.90 0.82 0.79 4 0.97 0.94 0.91 0.89 5 0.94 0.91 0.94 0.78 6 0.87 0.95 0.87 0.86 7 0.92 0.91 0.89 0.89 8 0.98 0.91 0.86 0.89 9 0.93 0.85 0.92 0.85 10 0.91 0.96 0.89 0.76 11 0.93 0.88 0.93 0.88 12 0.87 0.96 0.85 0.87
avarage 0.92 0.92 0.90 0.87 Table (6.13) - Twitch and continuous correlation result for all 12 patients

Chapter 6 Preliminarily Clinical Study
159
0.00
0.10
0.20
0.30
0.40
0.50
0.60
0.70
0.80
0.90
1.00
12
34
56
78
910
1112
Patie
nts
Correlation
Dor
sifle
xion
& P
lant
arfle
xion
Cor
rela
tion
Ever
sion
& In
vers
ion
Cor
rela
tion
Dor
sifle
xion
Cor
rela
tion
Ever
sion
Cor
rela
tion
Figu
re (6
.8) -
twitc
h an
d co
ntin
uous
cor
rela
tion
resu
lt fo
r all
12 p
atie
nts

Chapter 6 Preliminarily Clinical Study
160
Test 4:
This was the automatic electrode array optimisation test, which was performedby the
ST32 system software. The outcome of this optimisation process was 15 groups of
pairs of active and return electrodes ranked from 1 to 15 out of all the possible
electrode combinations (2 x 16 = 32 groups) as explained earlier in the electrode array
optimisation algorithm, chapter 4. Each of these groups was then selected and tried in
turn until the best electrode group that gave comfortable good dorsiflexion with some
eversion was found. The selected electrode group ranks for each of all 12 patients are
presented in Table (6.14).
Patient number selected Group rank
1 1 2 3 3 4 4 2 5 2 6 1 7 2 8 2 9 3
10 1 11 2 12 1
Table (6.14) - Chosen electrode group ranks for each of these 12 patient subjects
By examining the Table, it can be seen that for most patients the algorithm selects one
of the top 4 electrode groups that gives dorsiflexion with some eversion. This proves
that the optimisation algorithm works for patients. The variation of the selected rank
was due to few factors like the comfort and combining two pairs of electrodes instead
of one as explained in the optimisation algorithms.

Chapter 6 Preliminarily Clinical Study
161
6.3.2.3 Electrode mapping analysis
Figure (6.9a) and Figure (6.9b) shows the electrode mapping of all 12 patients. The
test followed the same procedure explained in section (4.6.2) for recording the
continuous stimulation response from each single active electrode but the observation
scoring was done this time by two physiotherapists. The electrode array optimisation
algorithm uses the twitch response to select the optimum 15 groups of electrode as
explained earlier in chapter 4. The subject chose the best combination that gave the
desired comfortable dorsiflexion with some eversion, this was achieved by trying the
electrode combinations in turn starting from the highest ranked. The final chosen
combination of pairs of electrode is highlighted in different colour on the same maps.
By examining the data presented in Figures (6.9) it is clear that there is no clear
electrode pair that contributes to an overall pattern. Each electrode pair chosen shows
unique differences. This may be due to different physical differences in anatomy of
different patients. The maps show that there is certainly a predominant selection of
dorsiflexion movement as required, but now there is also inverter movement in 7 of
the 12 patients. This may reflect differences in motor control of the patient group
and is interesting in that there is sometimes a general lack of everter movement in
most electrodes from the 7 patients showing inverter movement. By examining each
patient electrodes in turn it is evident that from observed movement, it may be
possible to combine electrodes that have everter and inverter movement so that they
cancel out whilst still giving dorsiflexion. The ranking algorithm electrodes showing
weak, normal or strong Inversion with Dorsiflexion would always be ranked lower
than those with Eversion and Dorsiflexion, which excludes certain combinations of
electrodes as pairs. This was designed so that the minimum amount of time was
required to setup the electrode array, otherwise if all paired combinations were
demonstrated this would have taken (16!/(16-2)!)/2 = 120 more measurements for a
4x4 array. In conclusion it would seem that the electrode combinations chosen by the
algorithm produce the desired response using the simple ranking procedure based on
individual electrode twitch.

Chapter 6 Preliminarily Clinical Study
162
P2
P5P6
P8
3
0
0
1
0
1
2
1
3
1
0
0
0
0
2
1
0
2
1
0
2
0
1
1
0
1
0
1
2
0
3
0
P3P1 P4
P7
0
1
0
3
0
1
0
0
3
0
1
0
1
0
0
0
2
0
1
1
0
1
0
0
3
3
3
2
1
0
0
0
3
3
3
1
0
0
0
0
3
2
3
1
3
0
0
0
3
1
3
1
3
2
3
0
3
2
2
1
3
1
0
0
1
2
1
2
2
2
2
2
3
0
1
2
1
2
3
0
1
3
2
1
1
2
3
0
3
1
2
1
2
2
1
2
2
1
2
2
2
2
1
1
0
0
2
1
0
0
0
0
0
0
0
0
0
0
0
0
1
0
1
1
2
2
0
0
2
1
2
0
2
0
2
0
0
2
1
3
0
3
0
2
2
3
0
3
1
2
1
2
2
2
2
2
3
2
3
1
2
1
1
0
1
0
3
1
0
3
0
1
1
1
1
1
1
3
1
2
0
1
1
0
3
2
1
0
3
1
3
1
1
0
1
0
1
1
1
0
1
3
1
1
1
1
1
0
2
3
1
1
2
1
1
1
2
1
1
2
1
0
2
1
Left leg Left Left Left
Left LeftRight Left
Figure (6.9a) – Patient Subjects Electrode Optimisation Map

Chapter 6 Preliminarily Clinical Study
163
P9 P10 P12
2
1
3
2
3
2
0
0
0
0
1
0
3
1
3
2
1
2
0
1
3
2
3
2
1
0
3
2
1
1
0
0
0
0
1
0
1
2
0
0
0
0
0
1
0
0
0
0
2
1
1
1
0
1
0
0
0
2
2
3
1
3
0
1
2
0
3
1
1
0
0
0
0
3
0
0
0
0
0
0
1
2
0
0
0
0
0
0
3
1
3
1
3
1
0
0
0
3
1
1
0
0
0
0
2
1
1
3
1
2
0
1
0
3
2
1
1
1
0
0
2
2
1
1
0
0
0
0
P11Right Right Right Left
Figure (6.9b) –Patient Subjects Electrode Optimisation Map

Chapter 6 Preliminarily Clinical Study
164
6.3.2.4 Walking phase results and analysis for patient subjects:
Walking studies were carried out immediately after the seated phase on the patients
using the parameters and electrode groups selected by the ST32 system during the
seated testing. Patient 4 did not have enough time to do the walking test. Patients 2
and 7 were excluded from the walking test because they only have foot drop when
they experience muscle fatigue. Patient 8 was also excluded because of severe
spasticity on the affected leg and patient 11 was excluded because of an unusual
walking gait that caused the system sensors to find some difficulty in detecting the
walking gait events.
Test 1
The first step in this test was to set up the stimulation signal envelope parameters
required for walking, which were the stimulation rise time and fall time and also the
extension time if required. The patients were asked to walk for a few meters using the
default parameters, which was 80ms rise and fall time and zero extension time. Then
by observing the walking gait and the movement obtained by the stimulation these
parameters were tuned. The stimulation envelope rise time and fall time was set
mainly to optimise the subject’s comfort and speed. The extension time was not
needed and was always kept at zero. The chosen parameters for all patients who
performed the walking are presented in Table (6.15).
Test 2
This was the ankle angle threshold test. This was done by measuring the ankle angle
using the ST32 system sensors. Once enough ankle angle is observed to be clearing
the ground during the swing phase it will be saved by pressing a button on the ST32
system. The chosen ankle angles for the 5 controls subjects who did the walking are
presented in Table (6.7). The results show that the measured ankle angles for these
subjects vary within the normal range 64° – 74°. This was also dependent on the
sensor placement accuracy.

Chapter 6 Preliminarily Clinical Study
165
Patient
subject
number
stimulation envelope
Rise time (ms)
stimulation envelope
fall time (ms)
1 160 60 3 80 20 5 80 40 6 100 40 9 160 60 10 100 40 12 180 40
Table 6.15 – Patients walking stimulation envelope parameters
Patient subject number Ankle angle threshold ( )°
1 64
3 72
5 71
6 66
9 70
10 74
12 68
Table (6.16) – Patients ankle angle thresholds
Test 3
After the walking parameters were set up the patients were asked to practise using the
system for 15-30 minutes. Then after that the walking test over 10 meters was
performed. In the 10 meters walking test the subjects walk 10 meters without FES and
10 meters with FES. The number of steps and time taken was recorded for each with
and without FES. The results obtained from the patients performed this test are given
in Table (6.17). Video registration was taken for patients walking with and without
FES for gait analysis. Table (6.19) show how the patient steps and time taken to walk
10 meters was improved, this Table also show how the speed and stride length was
improved.

Chapter 6 Preliminarily Clinical Study
166
10m walk without ST32 FES
Patient
number steps Time s
Speed
m/s steps/min stride length (m)
P01 23 16.9 0.59 81.8 0.87 P03 53 38.4 0.26 82.7 0.38 P09 20 14.4 0.69 83.3 1.00 P05 38 46.0 0.22 49.6 0.53 P06 30 49.4 0.20 36.4 0.67 P10 30 22.8 0.44 78.8 0.67 P12 20 13.6 0.73 88.1 1.00
Table (6.17) – patients walking test without FES
10m walk with ST32 FES
Patient
number steps Time s
Speed
m/s steps/min stride length (m)
P01 18 10.7 0.94 101.3 1.11 P03 42 31.5 0.32 79.9 0.48 P09 17 11.6 0.86 87.8 1.18 P05 26 41.0 0.24 38.1 0.77 P06 21 21.0 0.48 60.0 0.95 P10 26 20.3 0.49 76.8 0.77 P12 18 11.2 0.89 96.3 1.11
Table (6.18) – patients walking test with FES
Remove similar columns
subject no
Steps decrease
%
Walking time
improvement %
Walking speed
improvement %
Stride length
improvement %
P01 21.8 36.8 58.3 27.8
P03 20.8 18.0 21.9 26.2
P09 15.0 19.3 23.9 17.7
P05 31.6 10.9 12.2 46.2
P06 30.0 57.5 135.3 42.9
P10 13.3 11.0 12.4 15.4
P12 10.0 17.6 21.4 11.1 Table (6.19) – patients walking improvement using FES

Chapter 6 Preliminarily Clinical Study
167
The stride length is constant and walking speed is increased, the gait cycle time must
get smaller as walking speed= (stride length)/(gait cycle time). When walking at
average walking speed a subject instantaneous velocity is not fixed, instead their trunk
slows down and speeds up during each gait cycle, (Rosie, 1994).
Test 4
After the walking test each patient was asked four questions to be answer on a visual
analogue scale based on walking with and without the device:
3. On a scale of 0-10 how would you rate how comfortable the stimulation feels on
your leg whilst walking with the device?
0 = most uncomfortable, 10 = most comfortable
4. On a scale of 0-10 how would you rate your ankle movement with the device?
0 = worst, 10 = best
5. On a scale of 0-10 how would you rate how you are able to walk without the
device?
0 = worst, 10 = best
6. On a scale of 0-10 how would you rate how you are able to walk with the device?
0 = worst, 10 = best
The results of VAS scores shown in Table (6.20) show that the patients find the ST32
system comfortable and their ankle movement and ability to walk was improved
Patient
number
Comfort of
stimulation
Ankle
movement
Ability to walk
without FES
Ability to walk
With ST32 FES
P01 7 7.8 1.2 5.2 P03 6.7 7.1 3.8 7.9 P09 6.1 8.1 1.3 7.6 P05 7 7 5 6 P06 9.7 8.2 2.1 10 P10 9.2 4.9 4.5 4.5 P12 10 7.1 6.8 9.6
Table (6.20) - VAS scores test results
.

Chapter 6 Preliminarily Clinical Study
168
6.3.2.4.1 Patients visual walking gait analysis
Two independent gait analysis physiotherapist assessors have watched the recorded
gait videos for the patients without knowing any information about the patients and
without knowing if the FES system was ON or OFF. These assessors used the
Rivermead visual gait analysis scoring system.
0: normal
1: mild deviation from normal
2: moderate deviation from normal
3: severe deviation from normal
x: no data available
There were variations in scores between the two video assessors; this is not surprising
as no training or discussion of the assessment took place prior to viewing the videos.
The 2 assessors did collaborate after the assessment and watched the video again
(involving a 3rd assessor) and agreed scores concentrating on the main parameters of
gait that are known to be affected by FES. The assessment main gait cycle features
[1,2,3] are: [1] heel strike, are presented in Table (6.21), [2] inversion are presented in
Table (6.22)., and [3] plantarflexion presented in Table (6.23).
Subject
Stance phase
Heel strike no
FES
Heel strike with
FES change
P01 1 0 1
P03 2 0 2
P05 2 0 2
P06 2 0 2
P09 1 0 1
P10 0 0 0
P12 2 0 2
Table (6.21) - Heel strike score

Chapter 6 Preliminarily Clinical Study
169
Subject Swing phase
Inversion no
FES
Inversion with
FES change
P01 2 1 1
P03 1 0 1
P05 2 1 1
P06 3 1 2
P09 1 0 1
P10 2 0 2
P12 1 1 0
Table (6.22) - inversion score
Subject Swing phase
Plantarflexion
no FES
Plantarflexion
with FES change
P01 1 0 1
P03 0 0 0
P05 2 1 1
P06 3 0 3
P09 0 0 0
P10 2 0 2
P12 2 0 2
Table (6.23) - Plantarflexion score
These results show that the ST32 FES system has succeeded in this group of patients
to correct the heel strike to normal and reduce the inversion and plantarflexion to
normal and also helps the toes to be off and clear the ground.

Chapter 6 Preliminarily Clinical Study
170
6.4 Summary
This chapter discussed the ST32 system clinical trial that was carried out by
professional physiotherapist researchers in (UBHT) Bristol General Hospital. In these
trials 10 randomly-selected normal and control subjects and 14 patients were
recruited. The study objectives, requirements and methodology were discussed in
detail. The testing was split into three stages. The first stage was the clinical
assessment which was done in cooperation with a physiotherapist to study the
condition of each subject individually. The second stage was the system set up testing
that included using the system to optimise the best electrode stimulation site and
choosing the stimulation signal parameters. In this second stage the twitch
acceleration data from each electrode was collected as well as the continuous
stimulation response from each electrode. This data helped in developing the
optimisation algorithms during the trials. The third stage was to use the system to
correct foot drop during walking, based on the optimisation results and the walking
control algorithms.
In this chapter the trials results was presented in a different format to help in the
analysis. The correlation between the twitch response and continuous stimulation
response showed the validity of using the optimisation algorithms. The electrode
mapping analysis showed that stimulation of pairs of combinations of active
electrodes with a single return electrode always produced the desired movement for
the controls and patients in the trials. It was noticed that during the development of
the optimisation algorithm the use of two active electrodes simultaneously for
continuous stimulation gave a better overall effective movement than using a single
active electrode. However all combinations of pairs of active electrodes to give
similar movement to the top chosen pair were not investigated. Walking trials on
controls showed that the system did not affect their walking gait, under active
stimulation. Clinical trials on patients showed clear improvements in walking speed
and stride length when used with active stimulation compared to when the stimulator
was not used. The stimulation pulse output was reported to be comfortable by most of
the subjects. The walking gait for each patient was recorded and assessed by
independent physiotherapists. These trials prove the concept of optimising the
electrode array automatically in a very short time based on the twitch response.

Chapter 7 Conclusions and Future Work
171
Chapter 7
CONCLUSION AND FUTURE WORK

Chapter 7 Conclusions and Future Work
172
CHAPTER 7: CONCLUSION AND FUTURE WORK
7.1 The main objectives of the project were
1. To design an "intelligent" stimulator, which can have variable pulse shapes
(for comfort), pulse trains of variable frequency and pulse width for more
dynamic stimulation and control), and feedback (for measuring function using
appropriate sensors),
2. To use an electrode array to alleviate electrode placement problems associated
with obtaining the desired movement,
3. To design an algorithm that can drive the array using an appropriate selection
of electrodes.
The project achieved all of these main objectives.
Foot drop correction during walking was chosen as an application for this research as
it is the most common disability that is responsive to this type of therapy.
Three prototype stimulation systems have been built during this research to achieve
objectives [1] and [3]. The final prototype was based on the latest embedded and
microcontroller system technology with the following key specifications:
• LCD and keypad user interface
• Twelve differently-shaped digitally-synthesised stimulation waveforms with
variable pulse width and repetition rate
• Digital control of the amplitude rise time, extension time and fall time of the
stimulation signal envelope
• Ability to produce single twitch signal pulses, manually and automatically

Chapter 7 Conclusions and Future Work
173
• Digital control of 32-electrode array using a high voltage switching circuit
• Pulse parameter modification on a pulse-by-pulse or envelope-by-envelope
basis
• Analogue and/or digital interface to force-sensitive resistor, gyroscope and
accelerometer sensors providing real-time feedback
• Comfortable stimulation
• The prototype is small enough to be portable and is battery powered
• Built to meet the (BS EN 60601-1:1990) "Medical Electrical Equipment Part
1 General requirements for safety" and (BS EN 60601-2-10:2001) "Medical
Electrical Equipment Part 2.10, particular requirements for the safety of nerve
and muscle stimulators".
Initial trials were carried out on the prototypes using volunteer subjects in the
engineering laboratory. More rigorous clinical trials on the final version of the
instrument were supervised by professional physiotherapist researchers in (UBHT)
Bristol General Hospital. The results from these clinical trials were collected and
assessed by professional therapists at UBHT from within and outside the MS research
unit (in the case of independent assessments).
A new electrode optimisation technique was invented based on the use of the twitch
response. This uses a single pulse to each electrode, thereby avoiding muscle fatigue
and pain and reducing the setup time in comparison with continuous stimulation.
Trials were carried on 30 normal and control subjects and 12 patients (42 in total), to
study the relationship between the twitch response and the continuous response.
Generally a good correlation was found (70% < R < 98%).
An accelerometer feedback system was developed and used for setting up the
electrode array by measuring the twitch response. A signal processing algorithm was
developed to extract the useful twitch movement data from the accelerometer signal.
An automatic optimisation algorithm for the electrode array was designed based on
the twitch response. This optimisation process finds the 15 combinations of pairs of
electrodes that are highly effective in producing the desired stimulation. The patient
Chapter 7 Conclusions and Future Work
174
may then choose the most comfortable and effective combination. During clinical
trials the patient usually chose a combination within the best 5 ranks, which show that
the algorithm is effective.
The main achievement of using this array optimisation technique based on the twitch
response was the time required to find the best stimulation site, as it takes between 2-5
minutes to decide about the best electrodes to use within the electrode array.
These algorithms were based on (and the results were obtained using) a specific
electrode array size, shape, topology and material. The algorithm may need to be
developed if these are changed. These results were based on 30 randomly-selected
normal and control subjects and 12 patients, all of whom were volunteers. Whilst this
is a reasonable sample size for testing the prototypes, a larger sample would guarantee
these techniques and algorithms would work on most patients.
The electrode mapping analysis showed that each subject and patient was unique; this
may be due to different physiological differences of the leg and muscles. The result of
the trial presented in chapter 6 shows that, in most cases the stimulation of pairs of
combinations of active electrodes and return electrodes is more effective in producing
the desired movement than using a single active and return electrode in the array.
A method was developed, using two dual-accelerometer sensors, to measure the angle
that the foot makes with the shank of the lower leg during walking. A walking
algorithm for foot-drop correction was developed to maintain dorsiflexion at an
appropriate target angle, making sure that the toes do leave the ground at the start of
the swing phase using dynamic feedback control.
Investigation of the different stimulation signal parameters during the laboratory and
clinical trials using constant-voltage stimulation suggests that specific parameter
ranges are common to the different subjects:
• Square and Sine wave biphasic charge balanced stimulation signal
• 300 – 400 μs pulse width
• 30 – 40 Hz stimulation frequency

Chapter 7 Conclusions and Future Work
175
• 30 – 75% of the maximum amplitude (400Vp-p with no load)
• Stimulation envelope rise time 40-180 ms
• Stimulation envelope fall time 20-80 ms
Trials on “normals” and controls showed that the system did not inhibit their normal
walking. Preliminary clinical trials on patients showed good improvements in ankle
angle movement, walking speed, and number of steps required to walk a given
distance (in this case 10m). In all cases the stimulation was found to be comfortable.
These trials showed that control of the stimulation during walking, based on the
optimisation algorithms developed in this work, gives high quality correction of foot
drop. This was shown by gait assessment analysis by the physiotherapists involved in
the project and independent researchers at UBHT. These successful trials showed the
efficacy of using the concept of the electrode array for assisted foot-drop correction
using FES stimulation. This concept was proved for both automated setup and during
FES assisted walking. This may lead to an array based stimulator having some
advantages compared to using a conventional 2 electrode based single channel
conventional stimulator system. These include easier setting up, as it can optimise the
electrode array automatically and find a useable and effective stimulation site in a
very short time, and it may lead to benefits for the end user of maintaining stimulation
usage for longer by reducing the effects of muscle fatigue but this is left for future
work.
7.2 Future Work
The electrode array uses standard carbon hydrogel electrodes; for this project 16
individual electrodes were placed on the lower leg. These are not linked to a substrate
and some effort is required to design a single array with simplified wiring which
allows easier placement for donning and doffing. The electrode optimisation
algorithm may not be optimal in using all available electrodes to give the desired
movement. Further work is required to see if more electrodes can be combined to
give similar desired movements. Further patient trials should be performed to apply
the electrode array concept to a wider range of subjects to see if it can be used on a
broader range of patients.

Chapter 7 Conclusions and Future Work
176
The stimulator has been designed so that individual electrodes can be stimulated on a
pulse by pulse basis. If through further work on combining electrodes for the desired
movement and the electrode array shape and size was re-addressed, it may be possible
to switch to different combinations of electrodes to see if muscle fatigue can be
slowed. This would mean the electrode array stimulator would be more widely
accepted for use on a day to day basis and would alleviate one of the main problems
with existing 2 electrode stimulators.
The stimulation system could be applied to hand function to optimise pinch and grip,
without any major modification, other than adding more feedback channels and
accelerometer sensors.
The stimulator may be more acceptable if production units were smaller than the
prototypes. A simpler interface than that required for the trials could be also
developed.
Part of this research outcome was presented in more than 8 national and international
conferences and meetings and generated a lot of international interest. Four scientific
papers were published on some of the work (Elsaify, 2002), (Elsaify, 2003), (Elsaify
2004, IFESS),(Elsaify, 2004, IFESWS) two more journal papers are being prepared.
The project sponsors (EPSRC) and reviewers considered the project outcome as
Nationally Standing for Research Quality and Tending to Internationally Leading for
Scientific Impact in the final assessment report. It envisaged that this device can be
improved further via additional funding to work towards a device that would be
available through the NHS and have real benefits in improving patient quality of life.
This thesis is a cornerstone representing a true feedback controlled stimulator that
measures function directly. It is this principal that has been maintained throughout
the development process and has clearly proved to be beneficial in allowing the
system to adapt to physiological differences of the lower leg muscles in the patient
groups, without prior knowledge of these physiological differences.

References
1
REFERENCES

References
2
REFERENCES
Abbas J. J, Chizeck H. J, “Neural Network Control of Functional Neuromuscular
Stimulation Studies”, IEEE Transactions on Biomedical Engineering, (Vol:42,
PP:1117-1127), 1995.
Acimovic R, Gros N, Malezic M, Strojnik P, Kljajic M, Stanic U, and Simic V, “A
comparative study of the functionality of the second generation of peroneal
stimulators”, Proc. 10th RESNA Conf, (PP: 621–623), 1987.
Agnew W. F, McCreery D. B, Yuen T. G. H, Bullara L. A, “Histologic and
Physiologic Evaluation of Electrically Stimulated Peripheral Nerve: Consideration
for the Selection of Parameters”, Annals of Biomedical Engineering, (Vol: 17,
PP:39-60), 1989.
Akazawa K, Makifcawa M, Kawamura J, Aoki H, “Functional Neuromuscular
Stimulation System Using an Implantable Hydroxyapatite Connector and a
Microprocessor Based Portable Stimulator”, IEEE Transactions on Biomedical
Engineering, (Vol:36, No:7, PP: 746 – 752), 1989.
Alon G, “High voltage stimulation: effects of electrode size on basic excitatory
responses”, Physical Therapy, (Vol:65, PP:890–895), 1985.
Alon G, Kantor G, Ho H. S, “Effects of electrode size on basic excitatory
responses and on selected stimulus parameters”, Journal of Orthopaedic and Sports
Physical Therapy, (Vol:20(1), PP: 29–35), 1994.
Alon G, Kantor G, Ho HS, “The effects of selected stimulus waveforms on pulse
and phase characteristics at sensory and motor thresholds”, Phys Ther, (Vol: 74,
PP: 951-962), 1994.
Apkarian J.A, Naumann S, “Stretch reflex inhibition using electrical stimulation in
normal subjects and subjects with spasticity”, Journal of Biomedical Engineering
(N:13, PP: 67-73), 1991.

References
3
Arthur J. Vander, James H. Sherman, Dorothy S. Luciano, “Human physiology,
the mechanisms of body”, 1993, 1994.
Asmussen E, “Muscle fatigue”, Med. Sci. Sports. (N:11(4), PP: 313-321), 1979.
Baker L. L, McNeal. D. R, Barton L. A, Bowman B. R. and Waters R. L,
“Neuromuscular electrical stimulation: A practical guide”, Los Amigos Research
and Education Institute, Rancho Los Amigos Medical Centre, (ISBN 3-79985-
06221-1), 1993, 2000.
Baker LL, Cole K, Hart J, Smith D, Wong T, McNeal DR, “Effects of duty cycle
and frequency on muscle fatigue during isometric electrically stimulated
quadriceps contractions”, Physical Therapy, (N:68, P:835), 1988.
Basmajian J.V, Luca De. C, “Muscles Alive”, Fifth edition, Williams & Wilkins,
1985.
Bijelić G, Jorgovanović N, Bojanić D, Popović-Bijelić A, Popović D.B, “ACTI-
TRODE®: A new surface electrode-array for selective electrical stimulation”, Proc
10th Medicon Conf, Ischia, Italy, July 30-Aug 2, 2004.
Bogataj U, Gros N, Malezic M, Kelih B, Kljajic M, Acimovic R, “Restoration of
Gait During Two to Three Weeks of Therapy with Multichannel Electrical
Stimulation”, Physical Therapy, (Vol:69, No:5, PP:319-327), 1989.
Bogataj U, Kljajic M, Stanic U, Acimovic R, and Gros N, “Gait pattern behavior
of hemiplegic patients under the influence of a six-channel microprocessor
stimulator in a real environment”, Proc. 2nd Int. Conf. Rehabil. Eng, PP:529–530,
1984.
Bohannon R. W, Smith M. B. “Interrater reliability of modified Ashworth scale of
muscle spasticity”, Phys Therapy, (Vol: 67, PP: 206–207), 1987.
Boonstra A. M, Weerden Van T. W, Eisma W. H, Pahlplatz V. B. M, Oosterhuis
H. J.G. H, “The effect of low-frequency electrical stimulation on denervation
atrophy in man”, Scand. J. Rehabil. Med. (PP:127-134), 1987.

References
4
Borges G, Ferguson K, Kobetic R, “Development and Operation of Portable and
Laboratory Electrical Stimulation Systems for Walking in Paraplegic Subjects”,
IEEE Transactions on Biomedical Engineering, (Vol: 36, No: 7, PP: 798 – 805),
1989.
Bowman B, Meadows P, Su N, “Effects of stimulus pulse duration on comfort
during controlled motor contractions”, Proceedings of the Eighth International
Symposium on ECHE, (PP:429-439), 1984.
Bowman B. R, L. L. Baker, “Effects of waveform parameters on comfort during
transcutaneous neuromuscular electrical stimulation,” Ann. Biomed. Eng., (Vol:13,
PP:59–74), 1985.
Brandell H. B. R, “Study and Correction of Human Gait by Electrical
Stimulation”, The American Surgeon, (Vol:52, No:5), 1986.
Burridge J, Taylor P, Hagan S, and Swain I, “Experience of clinical use of the
Odstock Dropped Foot Stimulator”, Artific. Organs, (Vol:21, PP:254–260), 1997.
Campbell E.J.M, Dickenson C.J, Slater J.D.H, Edwards C.R.W, Sikora E.K,
“Clinical Physiology”, 5th Edition, Blackwell Scientific Publications. (ISBN:0-
632-00912-8), 1984.
Carlson, N.R, “Physiology of Behavior”, Fifth Edition, Allyn and Bacon
Publications, (ISBN: 0205308406),1994.
Carrioni-Burnett D, Webber K, “Mapping foot spatial measurements with small
movements of FES electrode positions 2002”, FESNet 2002 conference, Glasgow,
2002
Carroll S.G, Triolo R. J, Chizeck H. J, Kobetic R, Marsolais E. B, “Tetanic
Responses of Electrically Stimulated Paralyzed Muscle at Varying Interpulse
Intervals”, IEEE Transactions on Biomedical Engineering, (Vol:36, No:7, PP:644
– 652), 1989.

References
5
Crago P. E, Chizeck H. J, M. R. Neuman, and F. T. Hambrecht, “Sensors for use
with functional neuromuscular stimulation”, IEEE Trans. Biomed. Eng, (Vol:33,
PP:256–267), 1986.
Crago P.E, Lan N, Vetlink P.H, Abbas J.J, Kantor C, “New control strategies for
neuroprosthetic systems”, Journal of Rehabilitation Research and Development,
(VoI:33, PP:58-172), 1996.
Creasey G. H, Donaldson N, “Clinical neural prostheses beyond 2000,” in Proc.
6th international “Neural Prostheses: Motor Systems” Conference, (pp: 517–518),
2000.
Dai R, Stein R B, Andrews B J, James K B, Wieler M, “Application of tilt sensors
in functional electrical stimulation”, IEEE Trans Rehabil Eng, (Vol:4, PP:63–72),
1996.
Davies A, Blakeley A, Kidd C, “Human Physiology”, Churchill Livingstone,
ISBN: 0-443-04559-3, 2001.
Davis R, Eckhouse R, Patrick J. F, Delehanty A, “Computer-controlled 22-channel
stimulator for limb movement”, Acta Neurochir Suppl, (Vol:39, PP:117-20), 1987.
Donaldson N. D, Donaldson P. E, “When are Actively Balanced Biphasic ('Lilly')
Stimulating Pulses Necessary in a Neurological Prosthesis”, Historical
Background; Pt Resting Potential; Q Studies”, Mcd. & Biol. Eng. & Comput,
(Vol:24, PP:41 – 49), 1986.
Durfee W. K, MacLean K. E, “Methods for Estimating Isometric Recruitment
Curves of Electrically Stimulated Muscle”, IEEE Transactions on Biomedical
Engineering, (Vol:36, No:7, PP:654 – 667), 1989.
Eberstein A., Eberstein S, “Electrical stimulation of denervated muscle: is it
worthwhile?” Med.Sci.Sports Exerc.2 (No:12. PP:1463-1469), 1996.
Edwards S.J, “microcontroller based electrical stimulation”, third year project
report, University of Leicester, 2001.

References
6
Elsaify A, Fothergill J. C, Peasgood, W, “Portable FES System optimises
Electrode Array using Twitch Response”, Ann. Conf. International FES Society,
Bournemouth UK , (ISBN: 1-85899-191-9), (PP:389-391), 2004.
Elsaify A, Fothergill JC, Peasgood W, “A Portable FES System incorporating
Electrode Array and feedback sensors”, The Annual Work-shop of the
International FES Society, Vienna, Austria, (ISBN:3-900928-07-9), (PP:187-190),
2004.
Elsaify A, Fothergill JC, Peasgood W, “Functional Electrical Stimulation
Optimisation using an Electrode Array and Closed Loop Control” IPEM Annual
Scientific Meeting, University of Bath, ISBN: 1-903613-191-115, 2003.
ElSaify A, Peasgood W, Fothergill J. C, Edwards S. E “Improving the Quality of
Life in Nerve Injured Subjects Using Functional Electrical Stimulation”, IEEE
EMBSS Biomed. Eng. & Medical Phys Conf., Aston Uni., (ISBN:0-9543157-0-7),
July, 2002
FESTIVAL project report, University of Bristol, (EC TIDE No: 1250, 1994-1997).
Frank R, “Electrical nerve stimulation. Theory, experiments and applications”,
Springer, New York, Springer Verlag, (ISBN 038782247X), 1990.
Garland S.J, Garner S.H, McComas A.J, "Relationship Between Numbers and
Frequencies of Stimuli in Human Muscle Fatigue". Journal of Applied Physiology,
(Vol: 65, PP: 89 - 93. 1988).
Gracanin F, Trnkcozy F, Trnkcozy A, “Optimal stimulus parameters for minimum
pain in the chronic stimulation of innervated muscle”, Arch. Phys. Med. Rehab,
(Vol:56, No:6, PP:243–249), 1975.
Granat M, Heller B, Nicol D, Baxendale R, Andrews B, “Improving limb flexion
in FES gait using the flexion withdrawal response for the spinal cord injured
person”, Journal of Biomedical Engineering, (Vol:15, PP:51-55), 1993.

References
7
Granat M. H, Maxwell D. J, Ferguson A. C. B, Lees K. R, and Barbenel J. C,
“Peroneal stimulator: evaluation for the correction of spastic drop foot in
hemiplegia”, Arch. Phys. Med. Rehab, (Vol:77, PP:19–24), 1996.
Graupe D, Kohn K. H, Kralj A, Basseas S, “Patient controlled electrical
stimulation via EMG signature discrimination for providing certain paraplegics
with primitive walking functions”, J. of Biomed. Eng., (Vol:5, No:3, PP:220-226),
1983.
Graupe D, Kordylcwski H, “Neural Network Control of Ncuromuscular
Stimulation in Paraplegics for Independent Ambulalion”, Proceedings-19th
International Conferencc-IEEE/EMBS, (PP:1088-1091), 1997.
Griethuysen V. C. M, Paul J. P, Andrews B. J, Nicol A. C, “Biomechanics of
Functional Electrical Stimulation”, Prosthetics and Orthotics International, (Vol:6,
PP:152-156), 1982.
Hamill J, Knutzen M. K, “Biomechanical basis of human movement”, Lippincott
Williams & Wilkins, (ISBN: 0-7817-3405-3), 1995.
Handa Y. Handa T, Ichie M, Murakami H, Hoshimiya, Ishikawa S, Ohkubo K,
“Functional Electrical Stimulation Systems for Restoration of Motor Function of
Paralysed Muscles - Versatile Systems and a Portable System”, Frontiers of
Medical and Biological Engineering, (Vol:4, No:4, PP:241 – 255), 1992.
Haugland M. K, Sinkjær T, “Cutaneous whole nerve recordings used for correction
for footdrop in hemiplegic man”, IEEE Trans. Biomed. Eng.”, (Vol: 3, PP: 307–
317), 1995.
Heller B, Barker A.T, Sha N, Newman J, and Harron E, “Improved Control of
Ankle Movement using an Array of Mini-Electrodes”, Salisbury District Hospital
FES User Day Conference Birmingham, U.K, 2003.
Herbert M. A, Bobechko W. P, “Scoliosis Treatment in Children Using a
Programmable, Totally Implantable Muscle Stimulator (ESI)”, IEEE Transactions
on Biomedical Engineering, (Vol: 36, No: 7, PP: 801-802), 1989.

References
8
Herbison M.D, Teng C.S, Reyes T, Reyes P, Uni. T, “Effect of electrical
stimulation on denervated muscle of rat”, Arch. Phys. Med. Rehabil. (Vol:52, PP:
516-522), 1971.
Hertzler E. C, Kaminski R. J, “Compact Stimulator Using Integrated Circuits and
Battery Power”, Jour. Appli. Physiol, (Vol:24, No:2., PP:249 – 251),1968.
Hoshimiya N, Naito A, Yajima M, Handa V, “A Multichannel FES System for the
Restoration of Motor Functions in High Spinal Cord Injury Patients: A Respiration
Controlled System for Multijoint Upper Extremity”, IEEE Transactions on
Biomedical Engineering, (Vol: 36, No: 7, PP: 754 – 760), 1989.
Hutten A. I. R, Bultstra G, Buschman R, Kenney L, “The sensitivity and selectivity
of an implantable 2-channel peroneal nerve stimulator system for restoration of
dropped-foot”, In Proc. 7th International Functional Electrical Stimulation Society
Conference, Ljubljana , (PP:183-185), 2002.
Jimbo Y, Kasai N, Torimitsu K, Tateno T and Robinson H, “A system for MEA-
based multisite stimulation”, IEEE Trans. Biomed. Eng, (Vol:50, PP:241–8), 2003.
Jimbo Y, Kawana A, “Electrical stimulation and recording from cultured neurons
using a planar electrode array”, Bio. Electro. Chem. Bio Energy, (Vol:29, PP:193–
204), 1992.
Jones R, Davies-Smith A, Willis-Lee C, Page C, Merrilees J, Fry M, “EMG during
ambulation- clinical correlates and applications in functional electrical stimulation
(FES) Rehabilitation in MS (RIMS)”, Annual Meeting Venice. 2000
Jones R, Rees D. P, Campbell M. J, & Worthington J, “Neuromuscular parameters
in multiple sclerosis patients - significance for programmes of neuromuscular
stimulation”, in Proceedings of F.E.S Society, Lljubljana, 1993.
Jones R, Rees D. P, Campbell M. J,” EMG and force values during sustained
contraction in MS patients - implications for therapy” In Current Concepts in
Multiple Sclerosis” Wietholter, H., Dichgans, J., Merton, J (Eds) Excerpta Medica,
(PP:81-86). 1991.

References
9
Jones R, Rees, D. P, Campbell, M .J. “Tibialis anterior surface EMG parameters
change before force output in multiple sclerosis patients”, Clinical Rehabilitation
(Vol:8, PP:100-106), 1994.
Jones, R.J.S., Rees, D.P. & Davies-Smith , A. “Neuromuscular Parameters, Fatigue
and Function in MS”, Multiple Sclerosis, (Vol:4, Supplement 1), May,1998.
Khang G, Zajac F. E, “Paraplegic Standing Controlled by Functional
Neuromuscular Stimulation: Part I - Computer Model and Control System
Design”. IEEE Transactions on Biomedical Engineering), (Vol:36, PP:873-883),
1989.
Kirkwood C. A, Andrews B. J, Mowforth P, “Automatic detection of gait events: a
case study using inductive learning techniques”, J. of Biomed. Eng., (Vol: 11, PP:
511-516), 1989.
Kjajic M, Malezic M, Asimovic R, Vavken E, Stanic U, Pangrsic B, Rozman J,
“Gait Evaluation in Hemiparetic Patients Using Subcutaneous Peroneal Electrical
Stimulation”, Scand. J. Rehab. Med, (Vol:24, PP:121 – 126), 1992.
Koller R, Girsch W, Liegl C, Oruber H, Holle J, Losert U, Mayr W, Thoma H,
“Long Term Results of Nervous Tissue Alterations Caused by Epineural Electrode
Application”, An Experimental Study in Rat Sciatic Nerve, Pacing Clin.
Electrophysiol, (Vol: 15, PP: 108-115), 1992.
Kostov A, Andrews B. J, Popovic D. B, Stein R. B, Armstrong W. W, “Machine
Learning in Control of Functional Electrical Stimulation Systems for
Locomotion”, IEEE Transactions on Biomedical Engineering, (Vol:42, PP:541-
551), 1995.
Kostov A. Hansen M. Haugland M, Sinkjaer T, “Adaptive restriction rules Provide
functional and safe Stimulation Pattern for Foot Drop Correction”, Artificial
Organs, (Vol:23, PP:443 – 446), 1999.
Kottink A. I. R, Buschman R, Hendrik P. J, Kenney L, Veltink P, Slycke P,
Bultstra G, Hermens H, “The Sensitivity and Selectivity of an Implantable Two-

References
10
Channel Peroneal Nerve Stimulator System for Restoration of Dropped Foot”,
Neuromodulation, (Vol:7(4), PP:277-283), October, 2004.
Kralj A, Bajd T, “Functional electrical stimulation: standing and walking after
spinal cord injury”, CRC Press, (ISBN: 0-8493-4529-4), 1989.
Kralj A, Bajd T, Turk R, Benko H, “Postural switching for prolonging functional
electrical stimulation in paraplegic patients", Paraplegia (Vol:24, PP:221-230),
1986.
Kralj A, Trnkoczy A, Acimovic R, “Improvement in locomotion in hemiplegic
patients with multichannel electrical stimulation”, Human Locomotor Engineering
- A Review of Developments in the Field Including Advances in Prosthetics and
the Design of Aids and Controls, London Inst. Mechan. Eng. (PP: 45–50), 1971.
Kurtzke J. F, “Rating neurologic impairment in multiple sclerosis: an expanded
disability status scale (EDSS)”, Neurology, (Vol: 33, PP: 1444-1452), 1983.
Kurtzke J. F. “The Disability Status Scale for multiple sclerosis: apologia pro
DSS”, Neurology, (Vol:39, (2 pt 1), PP:291-302), 1989.
Lawrence M, Kirstein T, Keller T, “Electrical Stimulation of the finger flexors
using ‘Virtual Electrodes’”, International Workshop on Functional Electrical
Stimulation, Vienna, Austria, (No:8, PP: 191-194), September, 2004.
Leane G. E, G. M. Lyons, and D. J. Lyons, “The incidence of drop foot following
stroke in the St. Camillus’ Hospital catchment area within the Mid-Western Health
Board”, Ir. J. Med. Sc., 167, 4th Annual Conference of the Section of
Bioengineering of the Royal Academy of Medicine in Ireland, (No:167, Supp:4,
PP:275), 1998.
Lehmann J.F, Condon S.M., Price R, deLateur B. J, “Gait Abnormalities in
Hemiplegia, Their Correction by Ankle-Foot Orthoses”, Arch Phys Med Rehabil,
(Vol:68, PP:763-771), 1987.
Levitan I, Kaczmarek L. K, “The Neuron. Cell and Molecular Biology” Editors:
Publisher: Oxford University Press, ISBN:0195145232, 2001.

References
11
Liberson W. T, Holmquest H. J, Scot D, “Functional electrotherapy stimulation of
the personal verve synchronised with the swing phase of the gait of hemiplegics
patient”. Arch. Phys. Med. Rhabail, (Vol:42, PP:101–105), 1961.
Livshitz L. M, Mizrahi J, Einziger P. D, “Interaction of array of finite electrodes
with layered biological tissue: effect of electrode size and configuration” IEEE
Transactions on Rehabilitation Engineering, 9(4)2001, 355-361.
Luinge H. J, Veltink P. H, Baten C. T. M, “Estimating orientation with gyroscopes
and accelerometers”, in Proc. Int. Biomechatron workshop, (PP: 214–218), 1999.
Lyons G. M, Leane G. E, Clarke-Moloney M, O'Brien J. V, & Grace P. A, “An
investigation of the effect of electrode size and electrode location on comfort
during stimulation of the gastrocnemius muscle”, Medical Engineering and
Physics, (Vol:26, PP:873-878), 2004.
Lyons G. M, Sinkjaer T, Burridge J, Wilcox D. J, “A Review of Portable FES-
Based Neural Orthoses for the Correction of Drop Foot”, EEE Transactions on
Neural Systems and Rehabilitation Engineering, (Vol:10(4), PP:260–79), 2002.
Malezic M, Bogataj U, Gros N, Dccman I, Vrtacnik P, Kljajic M, Acimovic-
Janezic R, “Application of a Programmable Dual Channel Adaptive Electrical
Stimulation System for the Control and Analysis of Gait”, Journal of
Rehabilitation Research and Development, (Vol:29, No:4, PP: 41 – 53), 1992.
Malezic M, Hesse S, Schewe H, Mauritz K. H, “Restoration of Standing, Weight-
Shift and Gait by Multichannel Electrical Stimulation in Hemiparetic Patients”,
International Journal of Rehabilitation Research, (Vol:17, PP:169-179),1994.
Malezic M, Kljajic M, Acimovic-Janezic R, Gros N, Krajnik J, and Stanic U,
“Therapeutic effects of Mmultisite electric stimulation of gait in motor-disabled
patients”, Arch. Phys. Med. Rehab, (Vol:68, PP:553–560), 1987.
Malezic M, U. Stanic, M. Kljajic, R. Acimovic, J. Krajnik, N. Gros, and M. Stopar,
“Multichannel electrical stimulation of gait in motor disabled patients”,
Orthopedics, (Vol:7, PP:1187–1195), 1984.

References
12
Mathie M. J, Celler B. G, Lovell N. H, Coster A. C, “Classification of basic daily
movements using a triaxial accelerometer”, Med Biol Eng Comput, (Vol: 42(5),
PP:679-87), 2004.
Matthews B, “Multiple Sclerosis: The Facts”. Oxford University Press, ISBN:
0198508980, 2002.
McCreery D. B, Agnew W. F, Yuen T. G. H, Bullara L. A, “Damage in Peripheral
Nerve from Continuous Electrical Stimulation : Comparison of Two Stimulus
Waveforms”, Med. & Biol. Eng. & Comput, (Vol:30. PP: 109 – 114), 1992.
McDonald I. W, Kesselring J, “Multiple Sclerosis”, Cambridge University Press,
ISBN: 0521480183, 1996.
McNeal D. R, Baker L. L, “Effects of joint angle, electrodes and waveform in
electrical stimulation of the quadriceps and hamstrings”, Annals of Biomedical
Engineering, (Vol:16:299–310), 1988.
Meadows P, McNeal D. R, “A four channel IBM PC/AT compatable Biphasic
pulse generator for nerve stimulation”, IEEE Transactions on Biomedical
Engineering, (Vol:36, PP:802-804),1989.
Moe J. H, Post H. W, “Functional electrical stimulation for ambulation in
hemiplegia,” The Lancet, (Vol. 82, PP: 285–288), 1962.
Mourselas N, Granat M. H, “Correction of drop foot using a fuzzy logic controlled
miniature stimulator”, Proc. 5th Ann. IFESS Conf., (PP: 456–457), 2000.
Mourselas N, Granat M. H, “Evaluation of pattern stimulation for use in surface
functional electrical stimulation systems”, Medical Engineering and Physics, (Vol:
20, PP: 319-324), 1998.
Nilsson J, Ravits J, Hallett M, “Stimulus Artifact Compensation Using Biphasic
Stimulation. Muscle and Nerve”, (Vol: 11, PP: 597 – 602), 1988.
O’Keeffe D. T, “Salisbury Research Visit Report”, Centre of Biomedical
Electronics, University of Limeick, 1999.

References
13
Ott E, Munih M, Benko H, Kralj A, “Comparison of foot-switch and hand switch
triggered FES correction of foot drop”, Proc. of 6th Vienna International
Workshop on FES, PP:22-24, 1998.
Pancrazio J J, “Description and demonstration of a CMOS amplifier-based-system
with measurement and stimulation capability for bioelectrical signal transduction”,
Biosens. Bioelectron, (Vol:13, PP:971–9), 1998.
Patterson R.P, Lockwood J.S, Dykstra D.D, “A Functional Electric Stimulation
System Using an Electrode Garment”, Arch. Phys. Med. Rehabil, (Vol.:71, PP:
340 – 342), 1990.
Patterson RP, Lockwood JS, “The current requirements and the pain responses for
various sizes of surface stimulation electrodes”, Proceedings IEEE-EMBS,
(Vol:13, PP:1809–10),1991.
Petterson T, Smith G, Oldham J, Howe T, Tallis R, “The use of patterned
neuromuscular stimulation to improve hand function following surgery for ulnar
neuropathy”, J.Hand Surg., (No:19B, PT:4, PP: 430-433), 1994.
Popovic M. R, T. Keller, Pappas I. P. I, Muller P. Y, “Programmable and portable
electrical stimulator for transcutaneous FES applications - Complex motion”, in
Proc. 6th Ann. IFESS Conf, (PP:238–240), 2001.
Popović-Bijelić A, Bijelić G, Bojanić D, Jorgovanović N, Popović M. B, Popović
D. B, “Multi-Field Surface Electrode for Selective Electrical Stimulation”,
International Workshop on Functional Electrical Stimulation, Vienna, Austria,
(No:8), September, 2004.
PP:117 -120), 1987.
Prochazka A, Wiles C. M, “Electrical stimulation of paretic leg muscles in man,
allowing feedback controlled movements to be generated from the wrist”, J.
Physiol., (Vol:343, PP:20–21), 1983.
Rattay F, “Modelling the excitation of fibers under surface electrodes”, IEEE
Transactions on Biomedical Engineering, (Vol:35(3), PP:199–202), 1988.

References
14
Reed B, “The physiology of neuromuscular electrical stimulation”, Pediatric
Physical Therapy, (Vol:9, PP:96–102), 1997.
Regehr W G, Pine J, Cohan C S, Mischke M D, Tank D W, “Sealing cultured
invertebrate neurons to embedded dish electrodes facilitates long-term stimulation
and recording”, J. Neuro. sci. Methods, (Vol:30, PP:91–106),1989.
Robinson A. J, Snyder-Mackler L, “Clinical electrophysiology, electrotherapy and
electrophysiologic testing”, Williams & Wilkins, ISBN: 0-683-07817-8, 1994.
Rohlicek V, “A Device for Polarity Alternation of Pulses for Biological
Stimulation”, Med. Electron. Biof. Eng, (Vol: 2, PP: 439 – 441), 1964.
Royal College of Physicians London “Stroke Towards better management ”A
Report of the Royal College of Physicians London. 1989.
Rushton D. N, “Functional Electrical Stimulation. Physio”, Mcas, (Vol: 18, No: 4,
PP: 241 – 275), 1997.
Sandercock T. G, Faulkner J. A, Albers J. W, Abbrecht P. H, “Single motor unit
and fibre action potentials during fatigue”, Journal of Applied Physiology (N:58,
PP: 1073-1079), 1985.
Sepulveda F, Cliquet A, “An Artificial Neural Systems for Closed Loop Control of
Locomotion Produced via Neuromuscular Electrical Stimulation”, Artificial
Organs, (Vol: 19, PP: 231-237), 1995.
Sha N, Heller B. W, Barker A. T, “3D modelling of a hydrogel sheet - electrode
array combination for surface functional electrical stimulation”, Ann. Conf.
International FES Society, Bournemouth UK, (ISBN: 1-85899-191-9), 2004.
Soderkvist J, “Micromachined gyroscopes”, Sensors and Actuators A, (Vol: 43,
PP: 65-71), 1994.
Stanic U, Trnkoczy R, Acimovic N, Gros A, “Effect of gradually modulated
electrical stimulation on the plasticity of artificially evoked movements”, Med.
Biol. Eng. Comput, (Vol:15, PP:62), 1977.

References
15
Stanney K. M, Zyda M, “Handbook of virtual environments: Design,
implementation, and applications”, Mahwah, NJ: Lawrence Erlbaum Associates In,
(2002).
Stephens W. G. S, “The Assessment of Muscle Denervation by Electrical
Stimulation”, Physiotherapy, (Vol: 59, PP: 292-294), 1973.
Stephens W. G. S, “The Current - Voltage Relationship in Human Skin”, Med.
Electron. Biol. Eng, (Vol:1, PP: 389 – 399), 1963.
Strange K. D and Hoffer J. A, “Gait phase information provided by sensory nerve
activity during walking: applicability as state controller feedback for FES”, IEEE
Transaction on Biomedical Engineering, (Vol: 46(7), PP: 797-809), 1999.
Strojnik P, Kralj A, Ursic I, “Programmed six-channel electrical stimulator for
complex stimulation of leg muscles during walking”, IEEE Trans. Biomed. Eng,
(Vol: 26, PP:112–116), 1979.
Symons J, McNeal D, Waters R, Perry J, “Trigger switches for implantable gait
stimulation”, RESNA 9th annual conference, Minnesota. (PP: 319-321), 1986.
Takebe K, Kukulka C, Narayan M. G, Milner M, Basmajian J. V, “Peroneal Nerve
Stimulator in Rehabilitation of Hemiplegic Patients”, Arch. Phys. Mcd.
Rehabilitation, (Vol: 56, PP: 237 -240), 1975.
Takebe K, Kukulka C. G, Narayan M. G, Basmajian J. V, “Biofeedback Treatment
of Foot-Drop After Stroke Compared With Standard Rehabilitation Technique
(Part 2): Effects on Nerve Conduction Velocity and Spasticity”, Arch. Phys, Med.
Rehabil, (Vol:57, PP: 9-11), 1976.
Tanaka S, Motoi K, Nogawa M, Yamakoshi K, “A New Portable Device for
Ambulatory Monitoring of Human Posture and Walking Velocity Using Miniature
Accelerometers and Gyroscope”, Proceedings of the 26th Annual International
Conference of the IEEE EMBS, San Francisco, USA, 2004
Taylor P, Mann G, Wright P, Johnson C, “Introduction to Functional Electrical
Stimulation, notes to accompany the FES course”, 3rd edition, Department of

References
16
Medical Physics and Biomedical Engineering, Salisbury District Hospital,
Salisbury, Wiltshire, SP2 8BJ, UK, 1998.
Taylor P. N, “IMPULSE Questionnaire”, Salisbury FES Newsletter, Winter
2000/2001, (PP:10–11), 2000.
Taylor P. N, Burridge J. H, Dunkerley A. L, Lamb A, Wood D. E, Norton J. A,
Swain I. D, “Patient’s perceptions of the Odstock Dropped Foot Stimulator
(ODFS)”, Clin. Rehab, (Vol:13, PP:439–446), 1999.
Tong K and Granat M, “Gait control system for functional electrical stimulation
using neural networks”, Medical and Biological Engineering and Computing, (Vol:
37, PP: 35-41), 1999.
Tong K. and Granat H. M, “A practical gait analysis system using gyroscopes”,
Medical Engineering & Physics, (Vol: 21, PP: 87-94), 1999.
Tyldesley B, Grieve J. I, “Muscles, Nerves and Movement: Kinesiology in Daily
Living”, ISBN: 0632016434, 1989.
Upshaw B. J, Sinkjaer T, “Natural versus artificial sensors applied in peroneal
nerve stimulation”, Artificial Organs, (Vol: 21(3), PP: 227-31), 1999.
Vaughan C.L, Davis B. L, and O'Connor J.C, “Dynamics of Human Gait”, Human
Kinetics, (ISBN:0873223683 ),1992.
Veltink P. H, Bussmann H. B, de Vries W, Martens W. L, Van Lummel R. C,
“Detection of static and dynamic activities using uniaxial accelerometers”, IEEE
Trans Rehabil Eng, (Vol:4(4), PP:375-85), 1996.
Veltink P. H, Slycke P, Hemssems J, Buschman R, Bultstra G, Hermens H. J,
“Three dimensional inertial sensing of foot movements for automatic tuning of a
two-channel implantable foot drop stimulator”, Medical Engineering and Physics,
(Vol:25, PP: 21-28), 2003.
Vodovnik L, Dimitrijevic M. R, Prevec T, and Logar M, “Electronic walking aids
for patients with peroneal palsy”, in Proc. Europ. Symp. Med. Electron, (PP: 58–
61), 1965.

References
17
Wade D, Wood V, Heller A, Maggs J, Langton-Hewer R, “Walking after stroke”,
Scand. J. Rehab. Med, (Vol:19, PP:25-30),1987.
Waters R.L, McNcal D, Perry J, “Experimental Correction of Foot Drop by
Electrical Stimulation of the Pcroncal Nerve”, Journal of Joint and Bone Surgery,
(Vol:57-A, No:8, PP:1047-1054), 1975.
Webber D.J, “An Investigation into Electrical Stimulator Designs”, PhD thesis,
University of Bath, 1990.
Whitlock T. L, Peasgood W. Fry M. , Bateman A, Jones R, ”Self-optimising
electrode arrays”, Proceeding of 5th IPEM Clinical Functional Electrical
Stimulation Meeting, Salisbury, March, 1997.
Whittle M.W, “Gait Analysis – An Introduction, Istedn”, 3rd edition Butterworm
Heinmam, ISBN:0-7506-0045-4, 1991.
Willemsen A. T. M, Bloemhof F, Boom H. B. K, “Automatic stance-swing phase
detection from accelerometer data for peroneal nerve stimulation”, IEEE Trans.
Biomed. Eng., (Vol:37, PP:1201–1208), 1990.
Williamson R, Andrews B, “Gait event detection for FES using accelerometers and
supervised machine learning”, IEEE Trans. Rehabil. Eng, (Vol:8, No:3, PP:312–
319), 2000.
Wilson D. M, Larimer J. L, “The Catch Properties of Ordinary Muscle”, Proc.
Natt. Acad. Sci. (USA), (Vol: 61, PP: 909 – 916), 1968.
Winter D. A, "Biomechanics and Motor Control of Human Movement", Wiley-
Interscience, 2 edition, ISBN: 0471509086, 1990.
Yamaguchi G, Zajac F, “Restoring Unassisted Natural Gait to Paraplegics with
Functional Neuromuscular Stimulation: A Computer Simulation Study”, IEEE
Transactions on Biomedical Engineering, (Vol: 37, PP: 886-902), 1990.
Zeck G, Fromherz P, “Non-invasive neuro-electronic interfacing with synaptically
connected snail neurons immobilized on a semiconductor chip”, Proc. Natl Acad.
Sci. USA, (Vol:98, PP:10457–62), 2001.

Appendix
A
APPENDIX – A: PUBLICATIONS

Appendix
B
APPENDIX – B
B-1) Stimulation System Version 1 & 2
B-2) Feedback Sensors
B-3) Digital filter coefficients
B-4) Stimulation System Manual
B-5) Microcontroller Embedded Firmware (CD-ROM Enclosed)
B-6) MEMO Safety Test Results (CD-ROM Enclosed)

Appendix
C
APPENDIX – C
C-1) Clinical Assessment
C-2) Clinical Study Forms