Embed Size (px)
Citation preview

MST-1849
A SEISMIC INVESTIGATION OF THE
NORTH GOLDEN AREA, JEFFERSON COUNTY, COLORADO
by
Nancy R. Money
1977

•t > „T-1849
ABSTRACT
Two and one-half miles of continuous east-~west" 12-
fold seismic data were obtained across the zone of flank
deformation two miles north of Golden. The seismic section
was correlated with single-fold seismic data obtained from
Shell Oil Co. and to the formation-depth information from
the No. 1 Farmers Highline and Canal Reservoir well (7-3S-69W).
The data indicate that over 8,000 ft. of vertical Laramide
uplift has occurred along the four fault planes within the
survey area. All four faults trend north-south, with down-
to-the-east relative movement. In general, the fault throw
increases from fault-to-fault in a westerly direction.
The two westernmost faults detailed in this investigation
comprise the Golden fault zone. ' Major flank deformation
occur? in this zone, with a total vertical displacement of
about 8,000 ft. These high-angle reverse faults are dominantly
vertical and probably join at depth. Near the surface the
fault planes curve convex-upward, dipping west, causing vertical
and overturned dips on surface outcrops. Basin sedimentary units
are flat-lying or slightly tilted at depth. To the north the
Golden fault zone widens and the faults are separated at depth.
South of the thesis survey the faults converge. , ,
iii

T-1849
Two vertical basin-margin faults are located 1,500
and 4,500 ft. east of the Golden fault zone. The faults
down-drop Denver basin sedimentary rocks to the east. Fault
displacement is not observed at the surface but increases to
nearly 200 ft. at the Precambrian basement. Displacement
is greater across the western basin-margin fault. Between
the abrupt fault boundaries there is a rotation of basin
rocks controlled by differential basement uplift. This
evidence supports the idea of growth or intermittent movement
of the basement-controlled faults.
IV

T-1849
CONTENTS
ABSTRACT iii
LIST OF FIGURES AND PLATES — vi
ACKNOWLEDGMENTS viii
INTRODUCTION 1
PURPOSE AND SCOPE OF INVESTIGATION 4Objectives 4Previous Work 6
GEOLOGY OF THE GOLDEN AREA 10Stratigraphy 10Structure 16
SEISMIC INVESTIGATION 18Field Equipment 18Field Procedure 19Seismic Method 21Processing 21
INTERPRETATION 29Stratigraphic Correlation — 29Velocity Determination 31Structural Interpretation 33
Golden Fault Zone 35Basin Margin Fault Set 37Shot Point 188 40
Geologic Model 40Geologic Cross Section 49
Alternate Interpretation 49
CONCLUSIONS 52
REFERENCES 54
v

T-1849
LIST OF FIGURES AND PLATES
Page
1. Index map of thesis area 2
2. Location map of thesis area 5
3. Generalized stratigraphic column of thesis area n
4. Stratigraphy of the Pierre Formation 15
5. Field operations in progress 18
6. Vibroseis field array 20
7. Flow diagram of processing steps 23
8. Velocity functions used in processing 25
9. Golden Line 1, uninterpreted, non-migrated 27
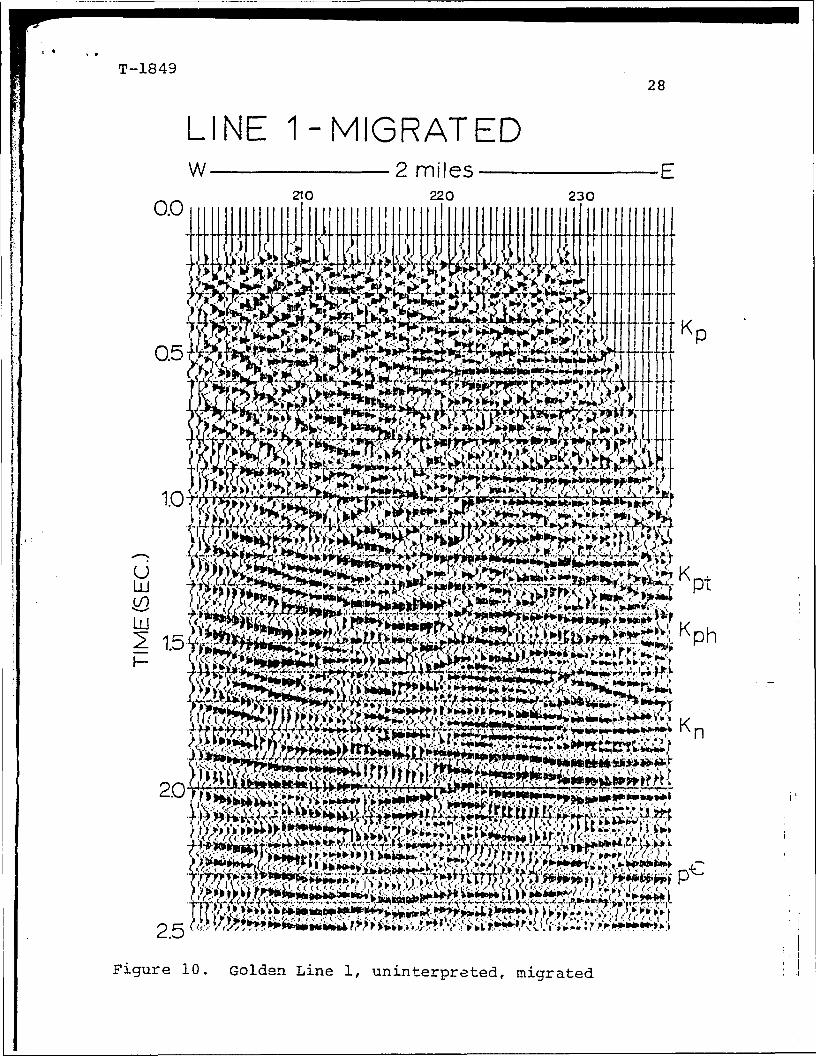
10. Golden Line 1, uninterpreted, migrated 28
11. Golden Line 1, interpreted, non-migrated 34
12. Golden Line 1, interpreted, migrated 36
13. Relative displacement of basin-margin faults 38
14a. Fault initiation in Late Cretaceous 42
14b. Differential uplift and block rotation, LateCretaceous to Early Tertiary 44
14c. Major uplift of the Front Range, Late Paleoceneto Eocene 46
15. Golden fault zone, Ralston area, Jefferson Co.,Colorado 47
16. Golden fault zone, Ralston area, Jefferson Co.,Colorado 48
17. Geologic map of thesis area 51
vi

T-1849
List of Figures and Plates continued Page
Table
1. Data from the No. 1 Fanners Highline and CanalReservoir well (7-3S-69) 32
Plate
1. Correlation between Golden Line 1 and Shot Point188
2. Geologic cross section A-A1
vii

T-18491 > ••*•
ACKNOWLEDGMENTS }—————————-- J
I
I wish to thank Dr. Thomas L. Davis for suggesting the
subject matter of this thesis and for his patient help and
encouragement throughout. In addition, he made available
to me seismic data released to him by Shell Oil Co. To
George Beggs, much appreciation for his continuing help
with operation of equipment, especially processing problems
on the Phoenix computer. Also, I would like to acknowledge
the cooperation of Ms. Gladys Ramstetter, Ms. Lida Ann
Ramstetter, and Mr. Herbert T. Young, manager of Table Mtn.
Corp., for allowing me to conduct this survey across their
land.
V1X1

T-1849
INTRODUCTION
The Front Range bounds the western margin of the Denver
basin, upturning the oldest basin sedimentary rocks to form
a prominent hogback paralleling the Front Range (Fig. 1).
The Denver basin is an asymmetric basin composed of sedimen-
tary rocks ranging in age from Recent to Pennsylvanian, lying
unconformably upon a Precambrian basement. The axis of the
Denver basin is approximately six miles from the surface ex-
posure of the Precambrian (Haun, 1968) . West of the basin axis
sedimentary rocks dip eastward while to the east there is a
very gentle westward dip. A zone of flank deformation extends
from the mountain front several miles into the Denver basin.
Flank deformation began in the Late Cretaceous with the onset
of the Laramide orogeny. Compensation for vertical uplift
results in monoclinal folding and high-angle reverse and
normal faulting of sedimentary rocks (Boos and Boos, 1957).
The Golden fault zone is associated with the vertical and
overturned hogback features in the thesis area. Basin-margin
faults, postulated by Weimer (1973), are also related to
Laramide tectonic forces.

T-1849
4 O ° O O '
39°45'
39' 30'
SCALE IN MILES
Figure 1. Location map of thesis area.

T-1849
To delineate the zone of flank deformation the VIBROSEIS
method of reflection seismic data acquisition was chosen.
The resulting 12-fold common-depth-point (CDP) seismic line
was correlated with single-fold seismic data from Shell Oil
Co. Formation-depth information from the No. 1 Farmers High-
line and Canal Reservoir well (7-3S-69W) coupled with forma-
tion travel time and velocities led to several conclusions
about flank deformation structures and fault history.
© Registered trade and service mark of Continental Oil Co.

"T-1849
PURPOSE AND SCOPE OF INVESTIGATION
Objectives
Previous methods of investigation of the Golden fault
zone have been limited to surface observation with the ex-
ception of Stommel's (1951) research. That data consisted
of seismic refraction and jump-correlation reflection work
in Jefferson County, but the results were inconclusive due
to two factors:
a) one-mile shot-point intervals prevent detection
of small displacement basin-margin faults;
b) data quality especially near the Front Range is
poor, so correlation of particular reflectors is
difficult.
This thesis involves the acquisition, processing, and
interpretation of a 12-fold seismic line (Golden Line 1).
The data were obtained using the VIBROSEIS method. Golden \\.\ !>
Line 1 is located in the northwest sector of T3S R70W (Fig. 2). i f <
The westernmost survey station is situated on the Lykins
Formation (Fig* 17). Golden Line 1 trends eastward for
two and one-half miles, extending stratigraphically
4

:,T-1849
\k vS&i P *»«V uNSSVKO v.
EXPLANATION
SCALE:
imi
INTERVAL:ICO »e*t
CAT'JM • M£AN SEA LEVEL
n
Figure 2. Location nap of thesis area.

Tr-1849
up-section onto the Denver Formation. Two and one-half
miles northeast of Golden Line 1 is located the NO; 1 Farmers
Highline and Canal Reservoir well (SE SF, NW 7-3S-69W) . Depths
to key formation tops have been obtained from the Schlumberger
electric log from the well (Table 1). Additional seismic
data used in the construction of the geologic cross section
(Plate 2) across the zone of flank deformation is Line 54-6;
shot point (SP)-188. The data is single-fold seismic data
obtained by Shell Oil Co. in 1953 using a dynamite source.
SP-188 allows correlation of the stratigraphic thicknesses
taken from the electric log with interval times.
The main objective of this seismic investigation is to
detail structurally the transition zone between the central
Front Range and the Denver basin. The multiplicity of stacked
data increases the signal-to-noise ratio allowing recovery
of good data even in structurally complex areas. The seismic
survey was carried out perpendicular to structural strike
eliminating the interference of reflections coming in from
out of the plane of the section. This thesis attempts to
resolve the controversy of the attitude and structural style
of the zone of flank deformation.
Previous Work
Zieglar (1917) described much of the early field geology
of the foothills area west of Denver. He was the first to
ARTHUR ?,/..--?- ;r:J.i>;-.p--iCOLORADO ,.:(;..;-.::.; Ji/.-i-GOLDEN, COLGK^Q QC

Tr-1849
interpret high-angle reverse faulting in the Golden area,
resulting from nearly vertical forces. Wahlstrom (1947)
discussed the Front Range structure as a result of inter-
mittant Laramide uplift with complex faulting and folding.
' He noted the dominant fault trend as northwest. From rela-
tionships between faults and Tertiary intrusives Wahlstrom
has shown repeated movement along faults.
Stommel (1951) and Stewart (1951). combined efforts
between the geology and geophysics departments of the Colorado
School of Mines. Stommel was in charge of a spot-correlation
seismic survey. Stewart mapped the field geology defining a
20 mile minimum length for the Golden thrust fault. The
seismic survey consisted of six reflection profiles with
shot-points every mile to determine the attitude of sub-
surface reflectors. A refraction line was conducted across
the fault trace to locate points on the fault plane. They
concluded that the Golden Fault was a single thrust dipping
4°W in the present area of study.
The Front Range was mapped by Boos and Boos (1957).
Over a 30-year study was conducted on the foothills structure.
They describe a Golden thrust-fault belt comprised of under-
thrusts in which the footwall, or Denver-basin block was |1 k ii
the active element of faulting.
i l l

"F-1849
Osterwald (1961) analyzed the Front Range and bordering
plains as a part of the Cordilleran foreland. He suggested
that the tectonic framework is controlled by basement struc-
ture yielding block-shaped mountains and asymmetric basins.
He mapped the Golden fault zone south of Golden as two high-
angle reverse faults with small-scale imbricate structures.
At depth these faults converge, originating from dominantly
vertical uplift between basement blocks.
Berg (1962) concluded that the structure at Golden was
initiated by vertical uplift which resulted in a thrusted-
overturned fold. He drew his conclusions from the geologic
information of two wells in the Soda Lakes area 10 miles
south of Golden. He states that at Golden, thrust 'faulting
is more prominent than at Soda Lakes. He assigns characteris-
tics to fold-thrust zones:
1. multiple faults, usually two;
2. fault zones consisting of overturned Paleozoics
and early Mesozoics, only the most competent rocks,
are 500 to several thousand feet thick;
3. dip varies, very steep to vertical at depth to
only a few degrees along the middle portion of
the overturned limb.
Harms (1965) studied Laramide faulting and the associated
stresses. He confirmed by analysis of sandstone dikes south

•»T-1849
of Denver that the necessary mechanism of injection is dip-
slip movement of steep west-dipping convex-up reverse faults,
The same theory is applied for the area near Golden.

'T-1849
80AQ1
GEOLOGY OF THE GOLDEN AREA
Stratigraphy
The Front Range of Colorado extends for 180 miles north-
south and 40 miles east-west across the center of the state.
Highly metamorphosed crystalline rocks with numerous igneous
intrusives compose the core of this dominantly "Laramide"
generated feature. Near the area of investigation Boos and
Boos (1957) describe the Precambrian as a biotite-sillimanite
schist, injection gneiss, and quartzite. Curtis (1960) be-
lieves these gneisses and schists to have developed from
sediments and lavas.
There is no Paleozoic section earlier than Pennsylvanian
present in the Denver basin. Berg (1960) describes the Siouxia
uplift as a broad gently undulating platform. Early Paleozoics
were believed to have been of intermittent shelf deposition
(Gilluly, 1963) which were eroded during regional epeirogeny
of Early and Middle Paleozoic time.
During Pennsylvanian time the Ancestral Rockies were
characterized by a major uplift which exposed huge expanses
of Precambrian basement. This ancient mountain chain was
10

T-1849 11
ERA
CE
NO
ZO
IC
1 1 M
ES
OZ
OIC
PA
LE
OZ
OIC
AGE
LOWER
TERTIARY
CR
ET
AC
EO
US
JURASSIC
TRIASSIC
PERMIAN
PE
NN
SY
LV
AN
IAN
FTo0to
0CM
oO
SO
GO
OO
-8
00
O
Onn
0CO•<?
Ooo<\j
ONC\J
65
O0T
120
OU>O1—
PREC AMBf t l A N
' FORMATION&8$&y&'s'&%?$&&&} GREEN MOUNTAIN'%&&$&l!&
^'"^Wjjtt
K^ DENVER-ARAPAHOE^y£X5£ aa
— . ^
^^4^ Ki LARAMIE-X^av^ r>^ L
Vs^^'j — "KffT FOX HILLS=£§^=P^3
^g Kp PIERRE
z4^§j Kn NIOBRARA1 • ' i ' t ' • i ' r- -7~\ ,
=--=CT-^
Kb BENTON— — i.
=j=-r=7fr- ;. K,J DAKOTA.<.;;/». .,«.o..c*.-.<!;-i CJ
- — —_-7^"- jf".~) j^ MORRISON
. — - — =< O IT Y 1- — — — - — i . ,
_ — >M/ Jrc RALSiON CRhtK
.v . j ^PL LYKINb.r H"T."TJii.~
PL LYONSr.'.°:-°.v;;:.°:-.r|
^^•-••;/?^{
•o •;'•'• • ' • = • . • . • . '-.y
V-c^ra^. pf FOUNTAIN;.'. • .-'. -.'•;•. ._'.•» ';.'. 1
•: :'•'•:'•' •'.•• '"•'•'• '.
^^^^pC PRECAMBRIAN
Figure 3. Generalized stratigraphic column of thesis areaaAfter LeRoy (1955)„

., T-1849 12
uplifted on an axis 30°NW to the present Front Range axis
(Harms, 1965). Rapid erosion of terrigenous sediments led
to fluvial deposition of the Fountain Formation upon the
Precambrian erosional surface. Red arkosic conglomerates
and sandstones were laid down as a series of coalescing allu-
vial fans or on an alluvial plain. A variety of depositional
environments are represented: stream channels, flood plains,
near-beach and near-shore marine.
The Lyons Formation overlies the Fountain Formation.
The Permian Lyons was deposited as beach sands and dunes ad-
jacent to beaches (Maughan and Wilson, 1960). It is a tan
fine-to-medium grained well-sorted sandstone with conspicuous
cross-bedding.
Transgression continued with shallow-sea deposition of
siltstones and mudstones, with the inclusion of two lime-
stone members. Age of the Lykins Formation spans the boun-
dary between the Permian and Triassic Periods. LeRoy (1955)
has placed this boundary at the top of the Glennon limestone
member. The Ancestral Rockies continued to be a dominant
positive feature which influenced sedimentation during the
Early Mesozoic, even though they were eroded and modified.
The Ralston Creek Formation is the result of non-marine
deposition in an area of poorly-drained lakes and marshes.

T-1849 13
The Morrison Formation was deposited over the Ralston
Creek Formation and is characterized by gypsum beds with
dense limestones and occasional claystones. Sediments were
entirely of continental origin; aggrading streams and lakes
on a relatively featureless surface.
The Denver basin is predominantly composed of Cretaceous
sedimentary rocks. Between deposition of Jurassic and Creta-
ceous sediments is an unconformity. Cretaceous sediments
are almost exclusively elastics derived from western sources.
During the Early Cretaceous sediments came from an eastern
source as well (Haun and Weimer, 1960).
The Dakota group is composed of marine sandstones and
shales that interfinger.with non-marine sands and shales.
This unit is a transgressive sequence covering huge Precam-
brian remnants and basins. Strandlines trend northwest;
marine waters transgressed southwest and regressed north-
eastward.
Overlying the Dakota Formation is the dark fine-grained
Benton shale, a neritic sequence. The Benton Formation has
been subdivided into the Carlile, Greenhorn limestone, and
the Graneros shale.
The Niobrara Formation is mainly a dark-gray thin-bedded
calcareous shale of marine origin. At the base of the Nio-
brara is a thin-bedded limestone. The Niobrara is a key

., T-1849 14
horizon in the correlation of seismic data used in this
thesis. Due to the fact that the Niobrara is overlain by
relatively low-velocity shales and siltstones the seismic
signature of the Niobrara is readily identifiable.
The most dominant formation in the Denver basin is the
Pierre shale (Fig. 4). The Pierre is composed of 6,000 to
8,000 ft. of uniform elastics. There are four zones (Davis,
1974) within the Pierre: the Transition zone, the Hygiene
zone, the Rusty zone, and the Sharon Springs zone. The
latter two make up only one-fourth of the total Pierre
thickness. These are siltstones and shales providing a
velocity contrast with the underlying Niobrara. The Middle
Pierre is composed of the Hygiene zone. Within ..this unit
are the Terry and Hygiene sandstone members which yield
identifiable seismic events. The Hygiene member is a grada-
tional siltstone grading upward to a clean sandstone of
shelf, bar margin, and central bar facies (Porter, 1976).
The Terry member is a 300 ft. sequence of interbedded silt-
stones, shales, and thick fine-grained sandstones deposited
in a near-shore environment (Moredock and Williams, 1976).
The Upper Pierre is composed of the Transition zone. This
zone has been interpreted as a high-constructive deltaic
sequence (Weimer, 1976). There are cycles of pro-delta shales
which are thought to indicate an unstable tectonic environment.
Davis (1974) has labeled two distinctive seismic markers

(D
£>
^ in> ftHI Hrt- (i)fl) (1-
o npj pj
W K^
0t-' i-hl£)i rt
*- tr— 0)
tiH-rohHn>^do
ftH-O
6000-8000 ft
PIERRE FORMATIONT! I2 >
O Oz
RUSTY
ZONE
HYGIENE
ZONE
TRANSITION
ZONE
ill s
IM00£*VO
Ul

T-1849 16
in the Transition zone: TZl and TZ2. Final regression of
the Cretaceous Sea ended Pierre deposition. The transition
between marine and continental deposition is represented by
the Laramie and Fox Hills Formations. The Fox Hills is a
delta-front sandstone. The Laramie is a thick sequence of7
coals, sands, shales, and clays. The old environment of
deposition was a delta plain (Weimer, 1976).
The Denver-Arapahoe Formation is composed of conglomerates,
sandstones, and claystones. These continental elastics were
deposited in alluvial valleys and plains. In the Cenozoic,
there was continued rapid deposition of poorly sorted
alluvium, theGreen Mountain Formation.
Structure
Front Range morphology is primarily the 'result of moun-
tain building and erosional action associated with the
Laramide orogeny. Two structural provinces abut forming
a complex boundary between a large uplifted block of Pre-
cambrian metasedimentary rocks and the down-dropped asymmetric
Denver-basin block. Sedimentary rocks has been faulted up
from the bottom of the basin to form a prominent hogback
paralleling the Front Range. Within six miles of the hog-
back these same rocks are buried as deep as 13,000 feet.

T-1849 17
Uplift during the Cretaceous continued from evidence
of uninterrupted deposition in the stratigraphic record.
Pleistocene terrace development supports the idea of inter-
mittant^of the Front Range (Wahlstrom, 1947) .
The Front Range is a large elongate block of uplifted
Precambrian rocks oriented approximately north-south. Asso-
ciated structures strike northwest to northeast. Analysis of
joint-failure patterns (Badgley, 1960) shows the major di-
rection of stress to be N 80°E. Paralleling the east flank
of the Front Range is a zone of flank deformation. Included
in this structural complex are the Golden fault zone and two
basin-margin faults (Weimer, 1973).

T-1849
SEISMIC INVESTIGATION
Field Equipment
All the equipment used in the organization and pro-
cessing of data is the property of the Colorado School of
Mines. The recording truck was equipped with a Texas In-
struments 10,000 Digital Field System, recording 24 data
traces on one-inch magnetic tape. The seismic source was
a single 15-ton vibrator (Fig. 5). The cable and geophor.es
are the standard type used in industry. Geophones strings
contain 14 Geopsace geophones stretched over a 200 ft. spacing,
Fig. 5. Field operations in progress.
18

T-1849 19
m
Field Procedure
The cable was laid out from west to east with a geo-
phone-group station spacing of 300 ft. Geophones were planted
in-line with the cable over a 200 ft. interval at each station,
The vibrator sent 28 sweeps into the ground for each vibra-
tor point (VP). The vibrator pattern was in-line over a
300 ft. spacing (Fig. 6). The VP's were 600 ft. apart.
The sweep used was an eight-second 48-to-8 Hz downsweep.
The recording time was 11 seconds; sweep length plus a
three second listening time. The sampling rate was two
milliseconds.
Field parameters were selected on a trial and error
basis. A noise spread was conducted in the area (Shuck,.
1976). Analysis of the noise spread showed that a geophone
array spacing of 200 ft. would cancel the low frequency
ground roll. Field experimentation-, however, proved that
300 ft. group spacings obtained much better data quality.
Data was collected in two groups; east and west of
Highway 93. Twenty stations were laid out west of the road.
With the recording equipment stationary, the VIBROSEIS vi-
brated through the twenty stations continuing across Highway
93 to obtain subsurface coverage across the road. The re-
cording equipment was relocated east of Highway 93, using
a full spread of 24 stations. The vibrator was able to
complete five VP's before terrain conditions became impassable.

II-103
VP 128
SWEEPS
-300'
VP 228
SWEEPS
300'
Figure 6. VIBROSEIS Field Array

T-1849 21
Seismic Method
The seismic reflection technique was chosen for this
investigation for the following reasons:
a) except for Stommel's research, only surface geology
mapping had been done in the area;
b) due to the complexity of faulting as well as the
Quaternary cover of alluvium over bedrock, complete
detailing of the-subsurface geology is impossible
with only outcrop information;
c) modern multifold seismic data are a good presen-
tation of subsurface geologic structure.
The sound waves sent into the earth by the VIBROSEIS
technique are partially reflected back to the surface by
each acoustic impedance boundary which is usually synonomous
i-_ with a lithologic interface. The reflected energy, or signal,
from each sweep is weak so 28 sweeps were used at each VP
and later summed in the processing to increase the signal-
to-noise ratio. The data were recorded, processed, and dis-
played. Interpretation of this seismic section provides a
structural insight to the subsurface configuration in the
zone of flank deformation, especially the Golden fault zone.
Processing
The Phoenix mini-computer was used to process the field
data. The data were recorded on 1-inch 21-track magnetic

T-1849 22
Blfield tape. To process the field data on the Phoenix, the
field-tape data format.was changed to a trace-sequential
Phoenix format in the DEMULT program. Poor quality records
were also dropped in this process. Records were resampled
from 2 to 4 milliseconds and transferred onto half-inch 9-
track magnetic tape. Digital trim was applied to increase
the amplitude of attenuated signal near the end of the record.
The processing steps from field data to final section are*•;.! outlines in Fig. 7.
After DEMULT, the SUM program summed the 28 records
from one VP into .a single record; digital trim was applied.
FDXCOR crosscorrelated the summed record with the field
sweep. At this point the record length is cut from 11 seconds
to 3 seconds. Crosscorrelation acts as a filter to random
noise. During data recording gravel trucks traveling along
the line introduced more ground motion than the vibrator.
That noise was effectively eliminated by the crosscorrela-
tion process.
A stacking table was constructed from spread configura-
tion and VP locations. This table served as a check on the
output of SSORT which also constructed a stacking table
and calculated static corrections of each trace to a datum
of 5800 ft. above sea level. The inputs were station eleva-
tion, station and shot location numbers, and datum elevation.
Once the SSORT parameters were checked, SSORTGO collected
the data into common-depth-point groups or gathers.

T-184923
FIELD DATA
COLLECTION
DEMULTTransfer and Reformat to Phoenix format
SUMSumming of 28 Sweeps into a single Record
FDXCORCrosscorrelation of Raw Data with Sweep
SSORTSorting of Traces into Common Depth Points
100% STACKSingle Fold Record to Pick Proper Mute Zones
PREVIEWConstant Velocity Stacks to Determine
Proper Velocity Functions
SEISPAKBrute Stack with NMO and Velocity Functions
CSTATAutomatic Statics Program to align Reflectors
FRELANFrequency Content Analysis
FINAL SECTION
Figure 7. Flow diagram of processing steps

T-1849 24
Stacking velocities were picked from constant velocity
stacks output by PREVIEW. This program applied a set of
specified velocities to the section. Three separate velo-
city functions were chosen across Golden Line 1 to accommodate
for structural and stratigraphic changes (Fig. 8). Velo-
cities in the western portion of Golden Line 1 were higher
to accommodate for the higher-velocity older sedimentary rocks
brought to the surface by faulting. Velocities increase
with depth; a result of compaction and cementation.
SEISPAK incorporated previously computed parameters:
static corrections, normal move out (NMO), velocity functions,
GDP groups, and mute patterns. A mute pattern was deter-
mined by first separating NMO-corrected traces into 100
percent groups. Early portions of these groups which were
dominated by refraction arrivals or "stretched" by NMO were
excluded, or muted. A BRUTE STACK was displayed after mute
zones and velocity functions were chosen.
Several computer techniques were subsequently employed
to enhance the section. The appearance of the BRUTE STACK
was ragged because no weathering corrections were applied
in processing the VIBROSEIS data. An automatic statics
program, CSTAT, was used. The application of CSTAT improved
the data quality of Golden Line 1 significantly.

T-1849 25
o.o -
-
1.0-
Uu
ai2
-
2D-
•
J
•
\
\
\\ \
V- \\\\\ \ V
A \ \
' V\\
(
"
3 9 1O 11 1
VELOCI
^
\-i
1
2 1
TY (F
-f VI Of lTY FIJMPTinM 1
STATIONS 201-220
STATIONS 221 -227
A VELOCITY FUNCTION 3
STATIONS 228-244
3 14 15
PS) x 10OO
Figure 8. Velocity functions used in processing.

T-1849 26
A frequency analysis was performed upon the data. The
frequency spectra indicated that the data contained fre-
quencies in the rage of 9 to 48 H2. The option for addi-
tional filtering of the data was not chosen. The final non-
migrated seismic section is shown in Fig. 9.
Golden Line 1 was migrated. This program shifted dip-
ping events into their true spatial position. Diffractions
were migrated to their point of origin. The final migrated
section is shown in Fig. 10.

T-184927
LINE 1-NON MIGRATEDw
0.0
K,
VSWH^M-S?'?*«ffl$Sss8»8s— ..A. _jwCi_4_,£.-.B:x«_.flK.aK._*-*-»v*«-W«
25Figure 9. Golden Line 1, uninterpreted, non-migrated
T-184928
LINE 1-MIGRATEDw
K,
m*&
Wmmtssfflft!r-J.S? < > .1 » »fc **•»*! •.' •. vVtaMlilhtex .—.
i<vv i \<'"'.•^•rr"H^**'«!|j»>"! 'ikV. ;i >»*'\r?,-'>» VcV-v;*.-1 •r*i' p»»f»>/T?*'r">f*fe//sitea ^-.- X-l. .J.'.:-:,;...-.,..,—,.,»., -,..,-_-,.-«rJ« »¥ll Cr.. .-..,.i.~<,.»-....,...,-r. . .i .w.',-I'--rt" *lr; »:>»sitr-r'.r"1'-Rfe ^ ^ ff!« ^ ^ ^ w >T k^ ^
:M/ *!i* tiii* 7 > i> rt>>yv>
Figure 10. Goldan Line 1, uninterpreted, migrated

INTERPRETATION
Interpretation of two and one-half miles of seismic
data across the zone of flank deformation north of Golden
required an integration of geophysical and geological know-
ledge. Golden Line 1 was tied to other regional seismic
surveys on the basis of seismic character. Surface geology
and well-log data provided stratigraphic correlations and
velocity information.
_ - " ., Stratigraphic Correlation
In the Golden area, seismic character and time intervals
are used to correlate seismic sections. From the seismic
work done in the area (Davis, 1974;' Shuck, 1976) the fol-
lowing stratigraphic units have been correlated:
a) Precambrian;
b) Niobrara;
c) Pierre Hygiene zone, Hygiene sandstone;
d) Pierre Hygiene zone, Terry sandstone;
e) Pierre Transition zone, marker 2 (TZ2);
f) Pierre Transition zone, marker 1 (TZ1);
g) Pierre.
29

T-1849 30
The Niobrara shows the most character on the seismic
section. This strong amplitude seismic marker event was
used as the key tie from Golden Line 1 to other seismic lines.
Once the Niobrara correlation was defined, time intervals
and seismic character were used to identify the remaining
seismic marker horizons. Surface geology was tied to Golden
Line 1. Seismic character of reflectors in the western
portion of the line is poor due to steep dip and interference
from diffractions, so geologic control is the only correla-
tion used in this zone.
Analysis of Line 54-6, recorded by Shell in 1953, pro-
vided an extension of seismic data into the Denver basin.
Seismic character of the Niobrara enpaled a correlation
across the two and one-half mile interval between Golden
Line 1 and SP-188 (Plate 1). A single record, SP-188, was
used for two reasons:
1) data quality was exceptional;
2) SP-188 is located three-quarters of a mile from
the No. 1 Farmers Highline and Canal Reservoir well.
The stratigraphic correlations made between SP-188 and
Golden Line 1 are shown in Plate 1. The zero time line is
referenced to a datum of 5800 ft. above sea level. Both
Golden Line 1 and SP-188 are displayed at the same time
scale. The horizontal distance across Golden Line 1 is about
J

T-1849 31
two miles, while the distance across SP-188 is only about
2,000 ft. The uphole method was used to correct SP-188 to
datum.
Velocity Determination
Velocity control is needed for complete interpretation
of a seismic time section. To realize the magnitude of
structure the two-way time interval must be converted to
depth. The velocity function used in processing the seismic
section was selected on the criterion of the "best stack" of
data. These stacking velocity values are too high for use
in converting time to depth, but provide a guide in selecting
proper values for average and interval velocity.
To obtain reliable velocity information the reflecting
horizons of SP-188 were tied to formation tops from the
Schlumberger electric log of the No. 1 Farmers Highline and
Canal Reservoir well (7-3S-69W). Assuming that there were
no significant interval thickness or velocity changes within
the three-quarters of a mile distance separating SP-188
from the well, interval velocities (Table 1) were calculated
from the time-thickness relationship:
•V, = 2 x
time

T-1849 32
TABLE 1
Formation depths and calculated velocities from electric
log of No. 1 Fanners Highline and Canal Reservoir well and
Shot Point 188 from Line 54-6.
Formation
Well Interval AverageDepth Elevation Thickness Velocity Velocity(ft.) (ft.) (ft.) (FPS) (FPS)
Laramie
Fox Hills
Pierre
TZ1
TZ2
Terry Sand
Hygiene Sand
Niobrara
Eenton
Dakota
Morrison
Lykins
Lyons
190
1160
1250
25SO
3780
5390
6390
8500
8790
9170
9450
9650
10259
+5363
- +4393
+4303
+3023
+1773
+ 163
- 837
-2947-
-3237
-3622
-3897
-4097
-4706
970
90 7,500
1280 8,000
125011,000
1610
1000 9,500
2110 10,000
290
38011,500
280
200
609
7,500
7,700
9,400
9,400
9,500
10,000

T-1849 33
where ^ = interval velocity
T- = formation thickness
time = formation two-way time interval.
From these interval velocities, average velocities to
the top of each mapped reflector were determined from the
equation:
N
V;ravgN
where V__r_ = average velocity;o. V
N = total number of intervals (i)
In conjunction, a sonic log from the Tom Jordan No. 1
Sam Rudd well (22-1S-70W) in the vicinity of Marshall Lake
ten miles north of the thesis area was used to check the
calculated interval velocities. The interval velocities were
found to be reasonable.
Structural Interpretation
The interpreted non-migrated display of Golden Line 1
(Fig. 11) depicts four faults labeled 1 to 4 , west to east.
The faults exhibit several significant structural characteristics,
a) all strike nearly north-south;
b) all have down-to-the-east relative movement,
generally decreasing in displacement to the east;
c) the fault planes are near-vertical. nn:^ r.r.J '. > ' '"FRAP"3LOR^C SGIr'AV ol MINES

T-1849 34
LINE 1-NON MIGRATEDw
K,
TZ1
1^fci^v • £ » • > > * S *
r& rtwK'Wl1
fe^Hji'M.:?
'.. '• ^*- ••- »- '^-'•-• _«T
>?yw*5fam fffpff p€t'.iii'. TV*">* kB^t^i •
Ij ^W^^^JiL•>»*s?A-jr- jftf&.i» f«-*25"
Figure 11. Golden Line 1, interpreted, non-migrated.

, *
T-1849 35
The zone of flank deformation contains two tectonically
related fault systems; the Golden fault zone and a basin-
margin fault set. The two fault systems are distinguished
on the basis of fault plane behavior near the surface and
magnitude of displacement.
Golden Fault Zone
The Golden fault zone contains two high-angle reverse
faults which have a combined throw of at least 8,000 ft.
Fault 2 has approximately 7,000 ft. of displacement. Both
faults 1 and 2 are near vertical and probably join at depth.
The fault planes diverge and become convex-up near the surface,
At the surface the fault traces are about 2,000 ft. apart.
The curvature of these faults can be seen more clearly on
the interpreted migrated section (Fig. 12). Diffractions
have been migrated to the apex of diffraction. Dipping
reflectors have been shifted up-dip to the proper spatial
position. With the elimination of diffractions, coherency
of reflectors was improved.
Looking at the geologic map (Fig. 17) the character
of the Golden fault zone changes. One mile north of the
thesis line, Shuck (1976) has mapped these same faults. Fault
1 veers to the northwest while Fault 2 continues on a north-
ward trend. Shuck has also found these faults to be vertical
at depth becoming convex-up near the surface. The faults
have separated at depth by 1,000 ft. From the geology as
mapped by Scott and Cobban (1965) and Van Horn (1972) the

T-1849 36
LINE 1-MIGRATEDV*
1 K,
T Z 1
T Z 2
;<2*€&M**'i--**1-*»'N^ **»**•
^tffSS^
1 ' *niiV _L. Ti'''• i_HL * c •'£
'< • Li'. :.••.• 7f•^ifVatiiffS'. Jv<. •* •'w-
' 1?T \*-*f'. V)**?'?':'iiS
R' ^^v^S>vS»ftw
A ^k^^j. '-. ; _. • '-. . .' l '. * ^TB-^TT-T * *rm. * * i—-T -.
sisssSP'S "* !SSSSSS* '**»'-i» *;s' ^
&«iO£?v*!£'£'1 j ^ fi* ' ,?** ''
':**»/> fr^>vsu'. .'•>>». iMrrr1" fvc»i»; £S .i>^ g^a^^V^^4Jitt S^ ;Sft g4'' ? rK££&2£K .w^ ij ft^ sgtess^^? $^ SMsP
u *^? tWr' * . ^ . ^^? ^StH^iU^ ?$,
'£W,fy!'&&&»*tiii±&if*ti&M^^^ :-ii
!%&mm m^w&&(Y':r^-:""'"^'"^\ ''.T'lT*' i .HWltr-i-s'r-r
W^tfV»'^?^'^^j >' kl J.iT^M-^O.l Ww» {C > »•. «*****!»V>
Figure 12. Golden Line 1, interpreted, migrated.

T-1849 37
Golden fault zone curves west a mile south of Golden Line 1
to account for the disappearance of the Dakota hogback.
Faults 1 and 2 converge into a narrow zone of imbricate
faulting.
Displacement of fault 2 is about 7>000 ft. as compared
to 1,000 ft.' across fault 1. Shuck measured displacements
of 6,000 and 2,000 ft. respectively. The separation of the
faults has affected the relative displacements but not sig-
nificantly. Further north, however, the degree of vertical
compensation for uplift of the Front Range by fault 2 could
be taken up solely by fault 1.
Basin Margin Fault Set
Two basin-margin faults are located a mile eastward of
the Golden fault zone. These faults are vertical as char-
acterized by very.distinct breaks across seismic reflectors.
Fault displacement increases with depth, downdropping basin
blocks to the east. A similar fault has been documented by
Weimer (1973) in the Leyden mine and was interpreted as a
basin-margin fault by him.
Figure 13 is a graph of the relative movements of the
two basin-margin faults. Amount of displacement is plotted
against geologic time. Time shifts of marker events were
measured across the fault plane and converted to displacement
with interval velocities. The displacement curves are parallel

: J*\ • * • • •
rn>
<
~n
oenu
m
rn
300-
200-
100-
IH00
T)POnin>203S3
I2
OCD is
5
MARGIN FAULT
-Tl
a
SEISMIC MARKERUJ00
Figure 1*3. Relative displacement of basin margin faults .Not to scale,

T-1849 39
indicating that fault movements were concurrent and result
from the same tectonic episodes of deformation.
The Fountain-Precambrian contact is an erosional surface;
a very poor seismic reflector throughout the Denver basin.
Displacement at the Precambrian level could not be reliably
picked and herein has been assumed equal to the Niobrara
offset. The displacement curves for faults 3 and 4 are both
level from Precambrian through Hygiene time. At this point
there is a rapid decrease in displacement in the Hygiene-TZ2
time interval. The displacement gradient shows a maximum about
TZ2 time and decreases in both curves after TZ2 time.
The S-shaped curves show a non-linear relationship
between displacement and geologic time. Faulting presumably
bega.n in the Hygiene-Terry time interval. There is decreasing
displacement in younger sedimentary rocks indicating growth
along the basin-margin faults with time. Fault 3, which is
closer to the Front Range uplift, shows more displacement than
fault 4. Fault 3 has been tied to Shuck's (1976) seismic line.
He estimates 200 ft. of displacement which is greater than the
displacement observed on Golden Line 1. Fault 4 seems to die
out to the north/ but has been documented by Young (personal com-
munication) on seismic data across North Table Mountain.
The basin-margin fault set could be tectonically related
to the initial uplift of the Front Range and influenced by
local deformation. These faults once activated bv Laramide

T-1849 40
orogenic forces act as a compensation mechanism for sediment
loading and areas of differential uplift.
Shot Point 188
Golden Line 1 has been tied to the 100 percent seismic
data of Line 54-6. These data covered the same ground as
Golden Line 1 as well as continuing several miles eastward
into the Denver basin. The data quality was poor throughout
the line. SP-188 was selected as the only tie. There is an
indication of minor faulting on this record by the offset
of the Niobrara reflector. The geophone array was oriented
NW-SE. Displacement is up to the northwest. Such a fault
may be analagous to a fault system northeast of Boulder.
Davis (1974) has mapped these northeast trending faults
associated with Late Cretaceous growth faulting. Young
(personal communication) has documented similar fault dis-
placement on Young Line 3 across South Table Mountain.
Geologic Model
During the Late Cretaceous there were at least three
delta complexes in northern Colorado contributing large
amounts of elastics to the epeiric sea covering Colorado
(Weimer, 1970). At this time the sea was regressing in
response to initial stages of Laramide uplift beginning in
the southwest. Regressive shorelines were pushed to the

T-1849 41
northeast. The structural compensation to this early moun-
tain building or epeirogenic uplift may have been the origin
of vertical basement faults. Figure 14A represents the
tectonic beginning of such basement-controlled faults during
deposition of the Middle Pierre.
Once tectonically activated/ these faults may have
reacted to sediment loading. A western thickening in the
Terry-TZ2 time interval can be seen between Golden Line 1
and SP-188. This 60 millisecond time thickening could be
explained by a regressing shoreline. Depositional rates
in the shoreline zone are much higher than out in the basin
(Weimer, 1970).
The Front Range became a positive tectonic element
within the Pierre seaway at this time. The localization of
this element presumably was controlled by the fault initia-
tion and growth described herein within the Pierre seaway.
This local Front Range uplift returned substantial amounts
of sediments back into the seaway which in turn resulted in
the loading of fault blocks.
Growth of the basin-margin faults occurred throughout
the remainder of deposition of the Pierre Formation. The
relative displacement of faults 3 and 4 became less in younger
sedimentary rocks. Less displacement occurs across the
easternmost basin-margin fault. Fault displacement cannot
ARTHUR CAKES OBRAffS!COLORADO SCHOOL of MINESGOLDEN, COLORADO. SQ4Q1

IMCO
FAULTS FAULT FAULT
1 8. 2 3 4
K— :
KDh
KP
Kb
(Pf - Kd . undiff. I
P-6
I
I i• t
PRESENT
-SEA LEVEL
-
- -5OOO
Figure 14a. Fault initiation in Late Cretaceous.NJ

T-1849 43
be measured above the Pierre seismic marker due to the low
frequency range obtained with the VIBROSEIS method and the
spread configuration. The amount of resolution is limited
to measuring displacements greater than five milliseconds.
Work by Weimer (1973) supports the hypothesis of recurrent
movement or growth of basin-margin faults. Uplift continued
on a gradual scale as evidenced by deposition of the Fox
Hills and Laramie Formations. Figure 14B represents differ-
ential Front Range uplift and rotation of basement blocks.
Block faulting similar to that shown by Stearns (1971) is
the dominant style of structural deformation. Sedimentary
rocks directly overlying the Precambrian basement are competent
and are therefore modeled as acting in the same manner.
Vertical forces are progressively stronger to the west
causing a tilting or rotation of fault blocks.
In the lower Paleocene there was a great amount of in-
trusive and extrusive volcanic activity associated with the
major uplift of the present Front Range. The time of this
greatest vertical uplift would presumably be during deposi-
tion of the conglomeratic Green Mountain Formation. The
character of faulting remains vertical at depth. Near the
surface fault planes curve convex-upward, possibly a reaction
to tilting of fault blocks and gravity effects. The tectonic
vertical uplift was largely concentrated over faults 1 and 2,

5OOO
(-3IMCO
- -5OOO
Figure 14b. Differential uplift and block rotation, Late Cretaceous toEarly Teriary.

T-1849 45
which possibly join at depth. The tilted blocks between
all the faults result from differing amounts of uplift west
to east. Figure 14C portrays this maximum uplift of the
Front Range from late Paleocene to Eocene time. There is
drape-folding of the Laramie and Fox Hills Formations. The
Pierre shale acts as the incompetent mass in the Stearns
(1971) drape-fold model.
Shuck (1976) has constructed a similar model (Fig. 15)
for flank deformation one mile north of Golden Line 1. He
depicts drape folding of the Laramie and Fox Hills Formations,
'He times the occurrence of the Golden fault zone after the
intrusion of the Ralston sill sometime in the early Paleocene.
Shuck accounts for the presence of a slump or landslide
feature composed of Pierre shale by the weight of the in-
truded volcanics and the possible existence of overpressued
shale in the Upper Pierre shale.
Berg (1962) has depicted the subsurface (Fig. 16) of the
Soda Lakes area. He has indicated the complex faulting from
the Golden fault zone to die-out within the Pierre shale.
Berg also implies one movement or episode of faulting. He
has shown a sharp fold in the competent sedimentary rocks
beneath the Pierre Formation. This structure is not seen on
Golden Line 1. Berg interpreted the anticline from dip-meter
information from the Johnson No. 1 well (7-5S-69W) and from
relative elongation of stratigraphic intervals from the Great

• T-1849
PRESENTSURFACE
Figure 14c. Major uplift of the Front Range, late Paleoceneto Eocene.

T-1849 47
•*1O,OOO
PRESENT SURFACE
-5000
Figure 15. Golden Fault zone, Ralston area, Jefferson Co.,Colorado. (After Shuck, 1976).

JOHNSON N*17-5S-S9W
TD 9655'
A
GREAT BASINS N« 16-5S-69W
T D 9587'
-»5000 FT
-SEA LEVEL
--5OOO
IM00
00
Golden Fault, Soda Lakes area, Jefferson Co., Colorado. From Berg (1962)

"" 1V
T-1849 49
Basins No. 1 well (6-5S-69W). He had no seismic control
for his interpretation.
Geologic Cross Section
Incorporating all the seismic data geologic cross section
A-A1 (Plate 2) was constructed to show flank deformation struc-
ture. The migrated seismic section (Fig. 12) with average
and interval velocities (Table 1) were used to plot depths
to formation tops and locations of faults. Electric log data
from the No. 1 Farmers Highline and Canal Reservoir well was
used as the eastern tie. A fault has been dashed in to repre-
•t sent possible faulting seen on SP-188.
Alternate Interpretation
Uplift of the Front Range may have occurred in a single
major episode of faulting. Previous authors sited in this
thesis have advocated the idea of a single period of uplift
in the Early Tertiary. The evidence suggesting growth or re-
current movement is the change in displacement along basin-
margin faults with time. These faults may have been formed
in a single period of movement with the fault displacement
dying out near the surface.
The Green Mountain Formation is a conglomerate indicating
the age of maximum uplift of the Front. Range. The intense
vertical.uplift of the Front Range was distributed almost com-
pletely over faults 1 and 2 of the Golden Fault zone. Lateral

T-1849
compensation by the basement and overlying competent sedi-
mentary rocks resulted in the brittle vertical faulting through
the Denver basin rocks. The Pierre Formation behaved as a
ductile material compared to the underlying competent sand-
stones. Throughout the 6,000 to 8,000 ft. of Pierre shale
much of the displacement could possibly be absorbed by the
ductile shale. A rock-mechanics type model would be required
to substantiate either interpretation of fault history pre-
sented in this thesis.
There are facts to support the hypothesis of growth of
these faults rather than as a single-stage Laramide event:
a) surface indications documented by Weimer (1973)
at the Leyden mine;
b) basin-margin faults are vertical;
c) basin-margin fault planes are very abrupt with
little evidence of drag by sedimentary rocks;
d) increasing displacement along basin-margin faults
with depth.
e) the displacement varies in a non-linear fashion,
i.e. displacement changes occur only in the Upper
Pierre section and above.

1-3IMCO£>ID
EXPLANATION
S C A L E :
CONIOUR I N T E R V A L :
100 left
UM MEAN sr:A LEVEL
DFNVEH -ARAPAHOE
I ARAM I K
KO.X HPILS
PlfRFiE
NIOOf'AK*
OEM ION
DAKOIA
MOiII'lOON
RALSTON CHECK
LVK1NS
I.VOMS
I OUNTAIN
PRt CAMUrilAN
Figure 17. Geologic map of thesis area. (After Van Horn, 1972; Shuck, 1976).

T-1849
CONCLUSIONS
From the analysis of data presented in this thesis
the following conclusions can be drawn:
a) North of Golden there exists a two mile wide zone
of flank deformation between the Front Range and the Denver
basin. The Golden fault zone and a basin-margin fault set
compose the zone of flank deformation.
b) The Golden Fault zone is a complex of high angle
reverse faulting. This faulting is the result of intense
local vertical uplift of the Front Range. Faults 1 and 2
(Fig. 14C) compensate for that amount of uplift in a narrow
zone between the Front Range and Denver basin blocks. These
faults are separate at the surface but seem to join at depth.
They are vertical at depth, becoming convex-up near the
surface. The Golden fault zone appears to converge to the
south and diverge to the north.
c) A basin-margin fault set parallels the Golden fault
zone. The displacement ranges from 100 to 200 feet at depth
to approximately 15 feet at the surface. These are growth
faults, vertical, controlled by deep Precambrian basement
block faulting.
52

T-1849 53
d) Faulting within the zone of flank deformation is
the result of Late Cretaceous uplift extending through the
Early Cenozoic. The Laramide orogeny probably began in the
Late Cretaceous with an epeirogenic type of uplift continuing
until the Late Paleocene with a major tectonic upthrust of the
Front Range. The vertical forces associated with uplift of
the Front Range were acting very intensely west of the zone
of flank deformation. Across the two mile wide zone of de-
formation, there is no evidence of vertical uplift, but rather
downdropping of Denver basin sedimentary rocks.
e) Faulting may be more prominent within the Denver
basin than suspected. Near the axis of the Denver basin,
possible faulting has been noted on SP-188. This faulting
could be similar to a northeast trending fault system east
of Boulder.

T-1849
REFERENCES
Badgley, Peter C., I960, Tectonic relationships of centralColorado: in Guide to the geology of Colorado: Geol.Soc. America, p. 165-169.
Berg, Robert R., 1960, Cambrian and Qrdovician. history ofColorado: in Guide to the geology of Colorado: Geol.Soc. America, p. 10-17.
, 1962, Subsurface interpretation of the GoldenFault at Soda Lakes, Jefferson County, Colorado: Am.Assoc. of Petroleum Geologists Bull., v. 46, p. 704-707.
, 1962, Mountain flank thrusting in Rocky Mountainforeland, Wyoming and Colorado: Am. Assoc. PetroleumGeologists Bull., v. 46, p. 2019-2032.
Boos, C.M., and Boos, M.F., 1957, Tectonics of eastern flankand foothills of Front Range, Colorado: Am. Assoc.Petroleum Geologist Bull., v. 41, p. 2603-2676.
Curtis, Bruce F., 1960, Major geologic features of Colorado:in Guide to the geology of Colorado: Geol. Soc. America,p. 1-8.
Davis, T.L., 1974, Seismic investigation of Late Cretaceousfaulting along the east flank of the Central Front Range,Colorado: Ph.D. thesis, Colorado School of Mines, 65 p.
Gilluly, James, 1963, The tectonic evolution of the westernUnited States: Geological Society London Quart. Journal,v. 119, p. 133-174.
Harms, J.C., 1965, Sandstone dikes in relation to Laramidefaults and stress distribution in the southern FrontRange, Colorado: Geol. Soc. America, v. 76, p. 981-1002.
Haun, J.D., 1960, Geology of mountain front west of Denver:in Guide to the geology of Colorado: Geol. Soc. America,p. 298-303.
, 1968, Structural geology of the Denver basin-regional setting of the Denver earthquakes: ColoradoSchool of Mines Quart., v. 63, no. 1, p. 101-112.
54ARTHUR EAKES ElBHARYf
COLORADO SCHOOL, oi M'lNL'GOLDEN, COLORADO SiMUI

T-1849 55
Haun, J.D. and Weimer, R.J., I960, Cretaceous stratigraphyof Colorado: in Guide to the geology of Colorado: Geol.Soc. America, p. 58-65.
LeRoy, L.W., 1955, Summary of surface stratigraphy: RMAGField Conf. Guidebook, Geology of Front Range foothillswest of Denver, p. 15-24.
Maughan, E.K., and Wilson, R.F., I960, Pennsylvanian andPermian strata in southern Wyoming and northern Colorado:in Guide to the geology of Colorado: Geol. Soc. America,p. 34-42.
Moredock, D.E., and Williams, S.J., 1976, Upper CretaceousTerry and Hygiene sandstones - Singletree, Spindle, andSurrey fields - Weld County, Colorado: in Professionalcontributions of Colorado School of Mines - Studies inColorado Field Geology, no. 8, p. 264-274.
Osterwald, Frank W., 1961, Critical review of some tectonicproblems in Cordilleran foreland: Am. Assoc. PetroleumGeologists Bull., v. 45, no. 2, p. 219-237.
Porter, K.W., 1976, Marine shelf model, Hygiene member ofthe Pierre shale, Upper Cretaceous, Denver basin,Colorado: in Professional contributions of ColoradoSchool of Mines - Studies in Colorado field geology,no. 8, p. 251-263.
Scott, G.R., and Cobban, W.A., 1965, Geologic and biostrati-graphic map of the Pierre shale between Jarre Creekand Loveland, Colorado: U.S. Geol. Survey MIC Geol.Inv. Map 1-439.
Shuck, E.L., 1976, A seismic survey of the Ralston area,Jefferson County, Colorado: M.Sc. thesis, ColoradoSchool of Mines, 45 p.
Stewart, W.A., 1951, Structure and oil possibilities of thewest flank of the Denver basin north-central, Colorado:Ph.D. thesis, Colorado School of Mines, 121 p.
Stommel, H.E., 1951, Seismic investigations in the Golden-Denver area: Ph.D. thesis, Colorado School of Mines, 83 p.
Van Horn, Richard, 1972, Surficial and bedrock geologic mapof the Golden Quadrangle, Jefferson County, Colorado:U.S. Geol. Survey Geol. Quad. Map 1-761-A.

T-1849 56
Wahlstrom, E.E., 1947, Cenozoic physiographic history ofhistory of the Front Range, Colorado: Geol. Soc. AmericaBull., v. 58, p. 551-572.
Weimer, R.J., 1973, A guide to Uppermost Cretaceous strati-graphy, Central Front Range, Colorado: deltaic sedimen-tation, growth faulting and Early Laramide crustalmovement: Mtn. Geologist, v. 10, no. 3, p. 53-97.
1976, Cretaceous stratigraphy, tectonics andenergy resources, western Denver basin: in Professionalcontributions of Colorado School of Mines - Studies inColorado field geology, no. 8, p. 180-227.
Zeiglar, Victor, 1917, Foothills structure in northernColorado: Journal of Geology, v. 25, p. 715-740.

i ^,AND
SHOTPOINT 188 OF LINE 54-6
210
L I N E 1
220 230 5 8 O O ' DATUM
COLORADO SCHOOL ot MINC.OC ; COLORADO 80401
Stmeone else wtn needthese MAPS too!PLEASE RETURN TO POOCE?
L I N E 54-6
SP 188
O.5-
f
?C"Ji £
1.O-S~\0
p^ l f iI K^ S^
> ^*- rtijr_".4-r^--^XKZBSS iiL'i^tUpi •XPzS*|H
KS^S '*^^*^^ *~*•Tt tt£2S)*KS¥biEf2£^i. jj***»«fe- J. »*i.fci> »" >•»»' B*«ulllap
<:'
F
•WKKSflMPARlS SP5
2.O-:
PIERRE
TZ 1
TZ 2
T E R R Y SAND
HYGIENE SAND
Nl OBRARA
PRECAMBRIA N

A14- LINE 1
-5000
L
^
• -— —
- .— — .
— — .
1
.
— *
f
~—~^
»*
1
—
" — — ,
DENVER-ARAPAHO
LARAMIE
X FOX H I L L S
PIERRE
NTZ2
TERRY
HYGIEr
i
NIOBRARA
BENTON
DAKOTAMORRISONRALSTON CREEKLYKINSLYONSFOUNTAIN
PRECAMBRIAN

CSM T-1849
A'
N*1 FARMERSHIGHLINE CANAL
TD 10,351'
member
E member
und i f ferent lated
0SCALE,FT
3000
GEOLOGIC CROSS SECTION
NORTH OF GOLDEN
BY: N R MONEY
RRTHUR CAKES dBRAiTO Someone else wflf needCOLORADO SCHOOL of MINES these MAPS too'
GOLDEN, COLORADO 8040J PLEASE RETURN TO PCX
LIBRARY
uiflaooeaTiDMtPLATE 2