Embed Size (px)
Citation preview
King Island Seabed Survey 27 June 2017
File: G:\asrg\Projects\King_Island_project\technical_report\KI_seabed_survey.doc Page i
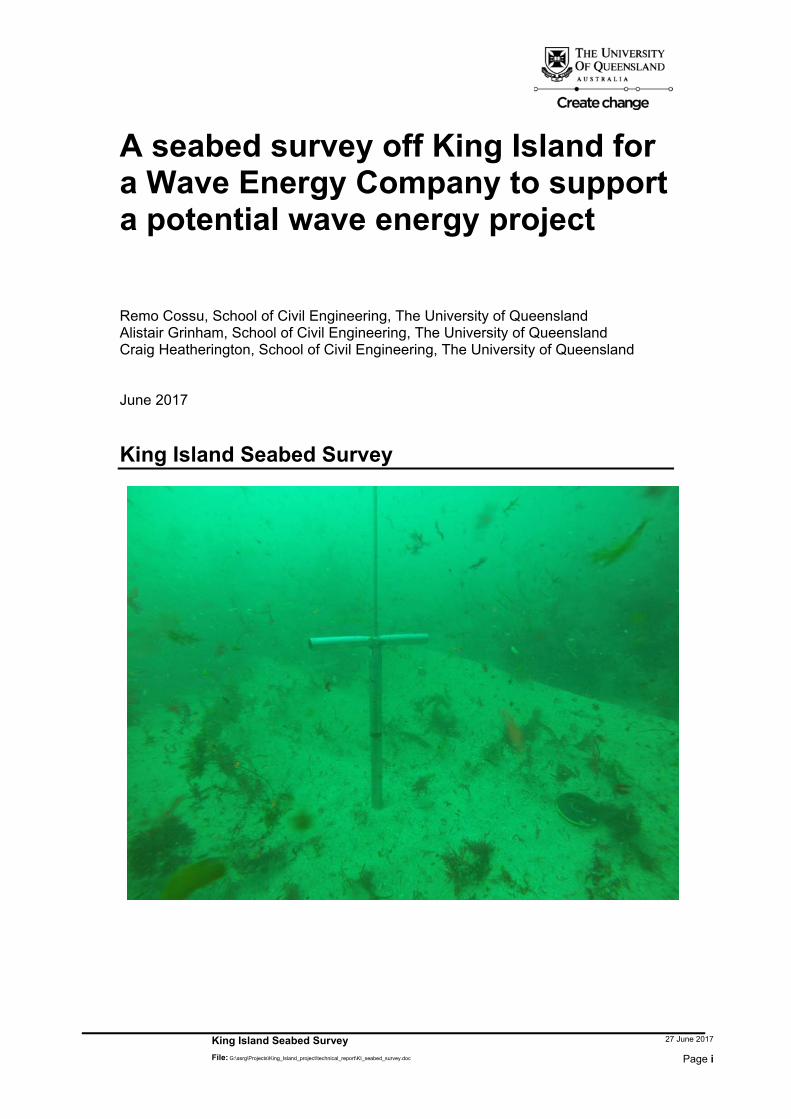
A seabed survey off King Island for a Wave Energy Company to support a potential wave energy project Remo Cossu, School of Civil Engineering, The University of Queensland Alistair Grinham, School of Civil Engineering, The University of Queensland Craig Heatherington, School of Civil Engineering, The University of Queensland June 2017
King Island Seabed Survey

King Island Seabed Survey 27 June 2017
File: G:\asrg\Projects\King_Island_project\technical_report\KI_seabed_survey.doc Page ii
Document Control Sheet
Document:
Draft Report
Title:
A seabed survey off King Island for a Wave Energy Company to support a potential wave energy project
Program:
Wave and tidal energy
Project Manager:
Remo Cossu
Prepared by:
Remo Cossu, Alistair Grinham, Craig Heatherington, Alex Scheuermann
Date Prepared:
27 June 2017
Version Number:
1
Document Location:
G drive
Synopsis:
Western side of target area is more sufficient for foundation of heavy concrete structure
Client:
AMC Search
Client Contact:
Kevin Sartipi
Client Reference:
Client Notes:
Revision ID
Revision Date Checked by Issued by
Document Distribution
Revision ID
0 1 2 3 4 5 Qty Form Qty Form Qty Form Qty Form Qty Form Qty Form

King Island Seabed Survey 27 June 2017
File: G:\asrg\Projects\King_Island_project\technical_report\KI_seabed_survey.doc Page iii
Key findings
Initial proposed location seems unsuitable to support seafloor structure due to boulder fields and very shallow sand layer (< 200 mm deep)
Sub-bottom profiling revealed relatively heterogeneous surface substrate with boulder and reef formations throughout the initial proposed location
Zone identified west of initial location approximately 50 m x 30 m cover in minimum of 800 mm sand and no boulder or reef structure
The sediment consists of 90% sand and 10% gravel with no fraction in the silt or clay class. Geotechnical tests revealed a loading capacity to qf = 3 MPa (considering eccentricity).
Observed water velocities and bed shear stresses exceeded 1 m/s and 1 N/m2, respectively, during relatively low wave energy conditions indicative of high rates of sediment transport. Scour was observed in the shallower part of the survey area but could also become a problem for identified placement area for larger wave climates.
Camera tows and sub-bottom profiling of proposed cable location revealed relatively flat and heterogeneous substrate with reef, boulder, sand and macrophyte covered substrates identified

King Island Seabed Survey 27 June 2017
File: G:\asrg\Projects\King_Island_project\technical_report\KI_seabed_survey.doc Page iv
Table of Contents Document Control Sheet ........................................................................................................... ii Key findings ............................................................................................................................. iii Table of Contents ..................................................................................................................... iv 1 Background ........................................................................................................................ 1 2 Methodology ...................................................................................................................... 2
2.1 Site characteristics ...................................................................................................... 2 2.2 Field monitoring.......................................................................................................... 3 2.3 Sediment coring .......................................................................................................... 3 2.4 Sub-bottom profiling ................................................................................................... 4 2.5 Underwater video tows ............................................................................................... 6 2.6 Laboratory analysis ..................................................................................................... 6 2.7 Geotechnical analysis .................................................................................................. 6 2.8 Hydrodynamics ........................................................................................................... 7
3 Results ................................................................................................................................ 8 3.1 Sediment cores ............................................................................................................ 8 3.2 Sub-bottom data ........................................................................................................ 10 3.3 Underwater Video ..................................................................................................... 13
3.3.1 Survey area ........................................................................................................ 13 3.3.2 Cable route ......................................................................................................... 16
3.4 Geotechnical Results ................................................................................................. 17 3.4.1 Material .............................................................................................................. 17 3.4.2 Triaxial Tests ..................................................................................................... 18 3.4.3 Bearing capacity ................................................................................................ 22
3.5 Hydrodynamics ......................................................................................................... 23 4 Summary .......................................................................................................................... 28 5 Recommendations ............................................................................................................ 29 Bibliography ............................................................................................................................ 30 Appendix ................................................................................................................................. 31
King Island Seabed Survey 27 June 2017
File: G:\asrg\Projects\King_Island_project\technical_report\KI_seabed_survey.doc Page 1
1 Background
On behalf of Wave Swell Energy (WSE) the School of Civil Engineering/University of Queensland
was contracted by AMC Search, the commercial arm of the Australian Maritime College, to conduct a
seabed survey in an area that was due west of the mouth of the Ettrick River on the south west corner
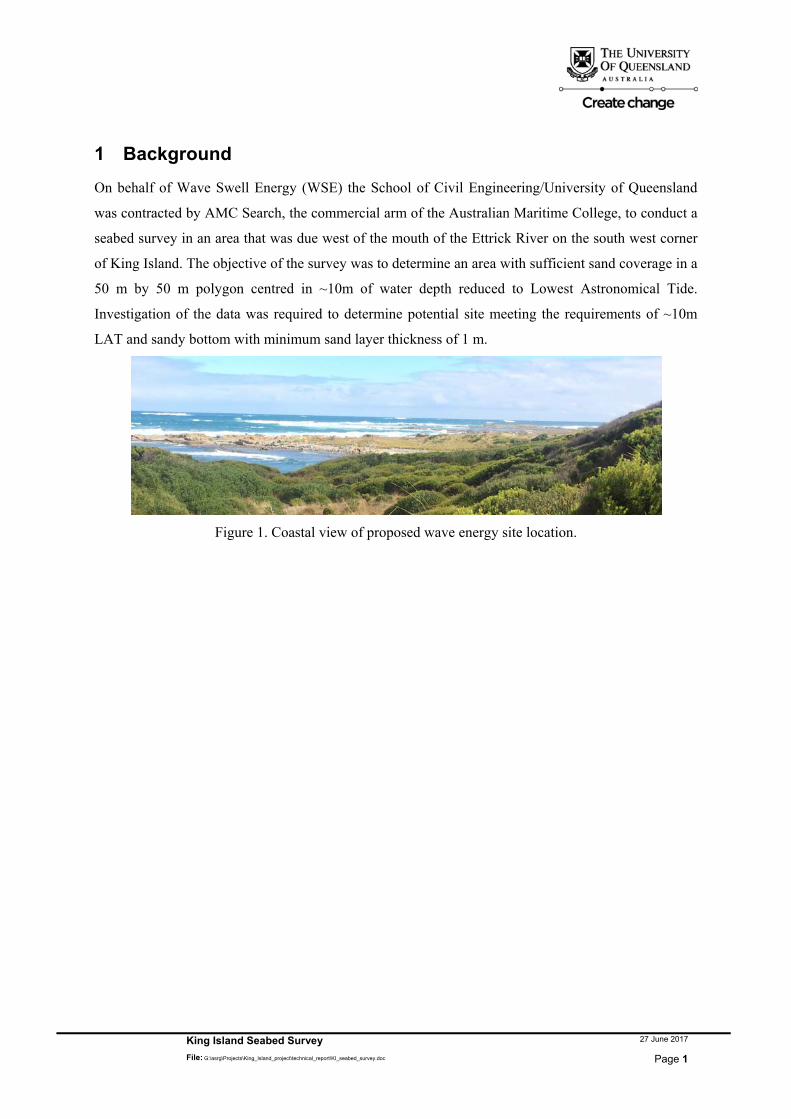
of King Island. The objective of the survey was to determine an area with sufficient sand coverage in a
50 m by 50 m polygon centred in ~10m of water depth reduced to Lowest Astronomical Tide.
Investigation of the data was required to determine potential site meeting the requirements of ~10m
LAT and sandy bottom with minimum sand layer thickness of 1 m.
Figure 1. Coastal view of proposed wave energy site location.
King Island Seabed Survey 27 June 2017
File: G:\asrg\Projects\King_Island_project\technical_report\KI_seabed_survey.doc Page 2
2 Methodology
2.1 Site characteristics
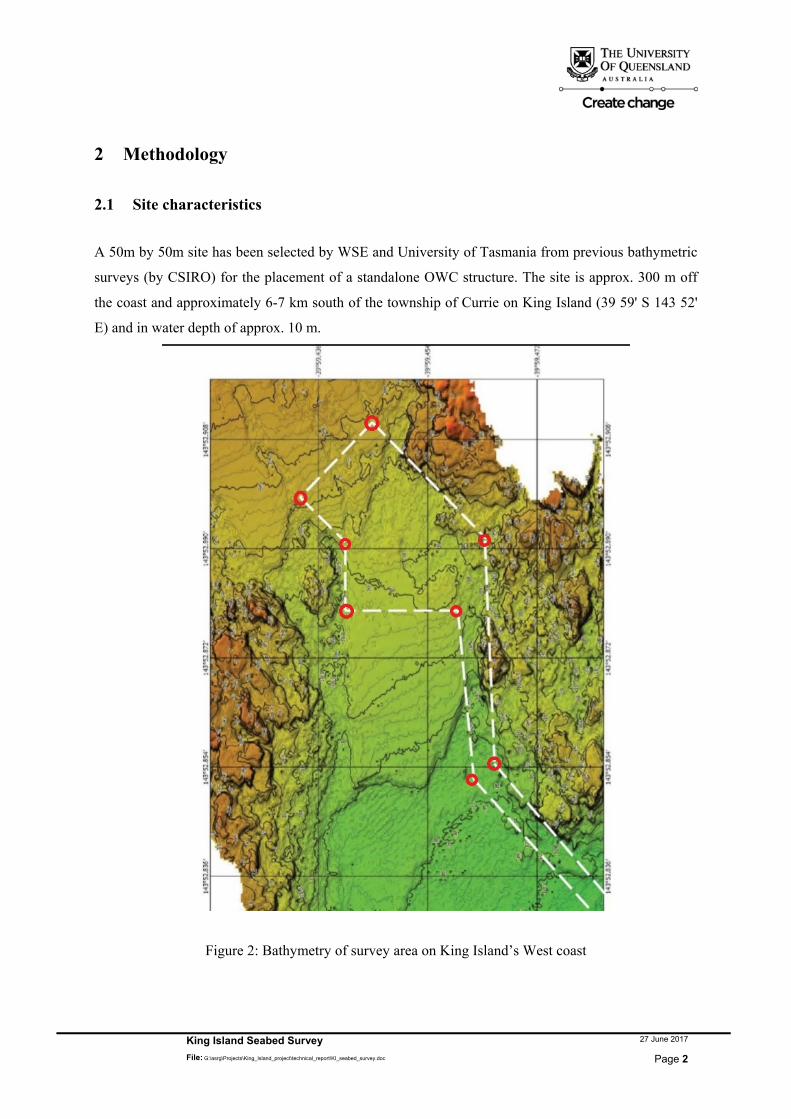
A 50m by 50m site has been selected by WSE and University of Tasmania from previous bathymetric
surveys (by CSIRO) for the placement of a standalone OWC structure. The site is approx. 300 m off
the coast and approximately 6-7 km south of the township of Currie on King Island (39 59' S 143 52'
E) and in water depth of approx. 10 m.
Figure 2: Bathymetry of survey area on King Island’s West coast
King Island Seabed Survey 27 June 2017
File: G:\asrg\Projects\King_Island_project\technical_report\KI_seabed_survey.doc Page 3
2.2 Field monitoring
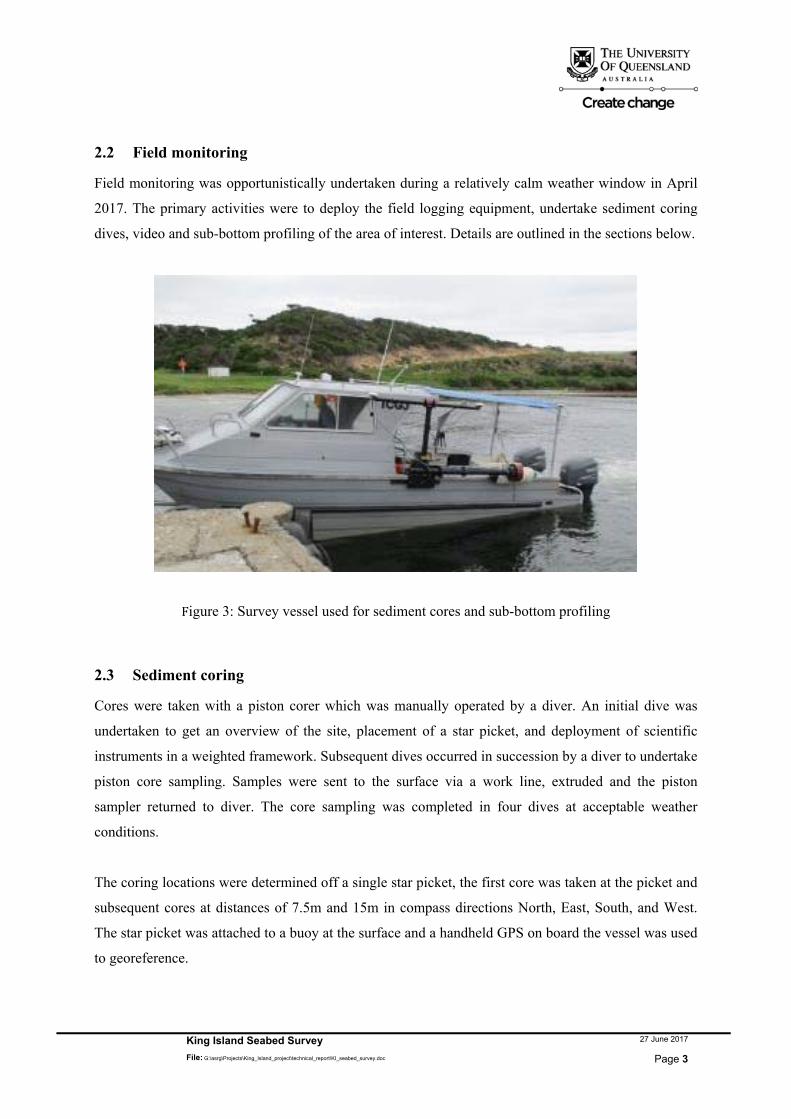
Field monitoring was opportunistically undertaken during a relatively calm weather window in April
2017. The primary activities were to deploy the field logging equipment, undertake sediment coring
dives, video and sub-bottom profiling of the area of interest. Details are outlined in the sections below.
Figure 3: Survey vessel used for sediment cores and sub-bottom profiling
2.3 Sediment coring
Cores were taken with a piston corer which was manually operated by a diver. An initial dive was
undertaken to get an overview of the site, placement of a star picket, and deployment of scientific
instruments in a weighted framework. Subsequent dives occurred in succession by a diver to undertake
piston core sampling. Samples were sent to the surface via a work line, extruded and the piston
sampler returned to diver. The core sampling was completed in four dives at acceptable weather
conditions.
The coring locations were determined off a single star picket, the first core was taken at the picket and
subsequent cores at distances of 7.5m and 15m in compass directions North, East, South, and West.
The star picket was attached to a buoy at the surface and a handheld GPS on board the vessel was used
to georeference.

King Island Seabed Survey 27 June 2017
File: G:\asrg\Projects\King_Island_project\technical_report\KI_seabed_survey.doc Page 4
All cores where the piston sampler did not penetrate more than 0.3m were disposed of on the seabed
and noted by the diver. Some loss of sediment is possible during the retrieval of the sampler out of the
seabed and compaction can occur when extruded into the larger plastic tube. Where the piston
sampler was able to penetrate 1m into the sediment, the sediment depth was greater than what could be
determined via coring alone.
25 % of the cores were shipped to the University if Queensland for the geotechnical analysis. The rest
of the core samples was left on King Island to be picked up by the client if needed).
2.4 Sub-bottom profiling
To further characterise the benthic surfaces within the survey area, a series of transects were
undertaken using a sub-bottom profiling system. Georeferenced, sub-bottom data was acquired using
an acoustic profiling system (StrataBox 3510 HD, Syqwest Inc., Cranston, RI, USA) operating at
10kHz. Differences in acoustic impedance (sediment layering) was examined to detect surface
expression of boulder and reef formations as well as determine the sand thickness layer. Transects
were focused on mapping the potential placement site as well as a single transect along the proposed
cable route.
The transducer was mounted mid-ships just aft of the cabin with a traditional pipe mount fastened to
the gunnel and fore and aft tensioned rope for support and to prevent reverberation once the vessel is
underway. A Garmin 72H GPS using a NMEA input was placed next to the mounting bracket and no
x,y offset used, however a 30cm z offset was used for the depth of the transducer below the waterline.
Vessel Master was given the coordinates of the target survey as well as using buoyed droplines at the
outer edges of the target area for visual reference on the surface. Transects were then performed along
the sand bed and then between the reefs with the Syqwest acoustic profiler recording. SyQwest
Hydrobox software v.2.45 was used to record the acoustic return and initial interpretation. The
Hydrobox was set to a Bottom Gate Limit of 20m depth in order to limit a ‘signal noise’ return via
surface reverberation. Speed of sound was set to the default of 1480 m/s in saltwater. As per previous
bathymetry profiles from CSIRO, tidal data was taken from Seal Bay AusTides prediction. An offset
of 0.27m was used to convert to LAT when importing the Hydrobox acoustic data into SonarWiz 6
V6.05.0009 64-bit for post processing.
During post-processing, the imported Sub-Bottom Profile (SBP) acoustic files were laid over a
basemap containing the area of interest and sediment core locations. The bottom tracking of the seabed
was then processed and a 7s-wave-period swell filter was used to remove the interference of the sites
large waves on the accuracy of the bottom profile. Partial trimming occurred on the SBP tracks where

King Island Seabed Survey 27 June 2017
File: G:\asrg\Projects\King_Island_project\technical_report\KI_seabed_survey.doc Page 5
GPS accuracy was lost and where the transducer was warming up. Visual clarity of the sub-bottom
was further improved with gain settings and blanking of the water column to remove any organic
interference.
Interpretation of the results was based on several factors including in-situ diver experience, base map,
backscatter information, and core sampling. This information along with a very strong single reflector
under the surface was used to outline the sand layer and estimate its depth. Core sample information
was placed as per georeferenced basemap and digitized on the side-view of the SBP showing actual
length of core in the seabed.
King Island Seabed Survey 27 June 2017
File: G:\asrg\Projects\King_Island_project\technical_report\KI_seabed_survey.doc Page 6
2.5 Underwater video tows
To aid interpretation of the benthic surface from sub-bottom profiling data, video tows were
undertaken through the potential placement area as well as along the proposed cable route. These tows
used a custom-built camera mount towed at low speed (<3 knots) with an operator maintaining a
constant tow angle by manually changing the tow cable length. The camera systems utilised a forward
facing, high definition underwater video camera (ASX ActionPro-X 1080P Full HD Camera) with
additional lighting provided using a wide angle dive light (Bigblue VTL5500P LED Video Tech
Light). Tows were georeferenced by matching the timestamps of the camera system and the vessel
mounted logging GPS system. Camera position relative to the vessel was estimated from tow cable
angle and water depth, sections where the water depth exceeded the towed cable length show little
information about the bottom substrate and were removed from the analysis.
2.6 Laboratory analysis
Samples for suspended particle size distribution were sonicated for one minute prior to measurement
to separate aggregated particles, allowing the true particle size to be calculated (Sperazza et al., 2004).
Particle sizing was undertaken using laser diffraction (Malvern Mastersizer 2000E, Malvern
Instruments Ltd., UK) and five measurement cycles were performed for each sample. Suspended
sediments were classified according to the Wentworth scale with mud fractions defined as sediment
particles with diameter <63 μm (Folk, 1974).
2.7 Geotechnical analysis
Geotechnical analysis was carried out at the Geotechnical Lab in the School of Civil engineering at
UQ. In total, three cores were used to determine the following parameters:
Soil classification
Density and void ratio
Internal angle of friction and cohesion (if any)
Nominal bearing capacity
The samples taken were more or less undisturbed, meaning that some sections of the samples were
firm and less disturbed while other sections were softer which could indicate a degree of disturbance.
Based on these samples the strength parameters of the sand for the density, stress and water content
conditions in situ were quantified. Furthermore, the bearing capacity was estimated and a sieving test
was implemented to characterise the soil and sediment characteristics.

King Island Seabed Survey 27 June 2017
File: G:\asrg\Projects\King_Island_project\technical_report\KI_seabed_survey.doc Page 7
2.8 Hydrodynamics
An array of instruments was deployed between Monday (03/04/2017) and Wednesday (05/04/2017)
near the southern reef (143°52'55.20"E 39°59'27.60"S) to capture hydrodynamic conditions at the
proposed deployment location. The array consisted of a pair HR Nortek Aquadopp ADCPs (upward
and downward looking), a Nortek Vector ADV, two RBR Concerto CTDs (1 in fast sampling mode
was attached to the ADCPs, the other one was used for vertical profiling during the sub-bottom
profiling to determine the speed of sound), a Sequoia LISST profiler, and a thermistor chain with 12
RBR Solo temperature loggers. Sampling intervals and type of measurements are outlined in Table 1.
Table1:Instruments, sampling intervals and parameters observed near King Island. Instrument Sampling interval Parameter
HR Nortek Aquadopp ADCP Every 60 s upward looking, water velocities within 10 m of the bottom (hab)
HR Nortek Aquadopp ADCP 1 Hz downward looking, water velocities within 1 m above the bottom
Nortek Vector 32Hz x,y,z velocity components approximately 10 cm above the bottom
RBR Concerto CTD 6 Hz
Temperature, salinity, turbidity, density approx. 15 cm above the bottom; water level fluctuations (wave heights, H) at the surface
RBR Concerto CTD 2 Hz Profiles of temperature, salinity and seawater density
RBR Solo T logger 2Hz Seawater temperature throughout the water column

King Island Seabed Survey 27 June 2017
File: G:\asrg\Projects\King_Island_project\technical_report\KI_seabed_survey.doc Page 8
3 Results
3.1 Sediment cores
The first coring location (143°52'54.188"E 39°59'26.637"S, location 1 in figure below) was
determined to be in the eastern area of interest according to information from the client and
bathymetry survey. However, sediment depth results proved to be unacceptable due to presence of
boulder fields and very shallow sand layer coverage (< 400 mm deep, cores 1 -6 in table 2).
The second coring area was moved further west and due to difficult surface conditions and low
visibility in the water, the second star picket was placed close to the northern reef. (143°52'52.443"E
39°59'26.637"S, location 7 in figure below). Positive results occurred for all cores in the eastern,
southern and western coring locations with sufficient sediment cover of > 1000 mm (cores 7 -13
except core 9 with 800 mm, in table 2).
The third coring location (143°52'53.156"E 39°59'26.873"S, location 14) was placed in-between the
previous two coring sites and an additional four cores was taken at a distance of 15m from centre in-
between the major cardinal points (cores 14 to 25 in table 2). Two cores had a penetration depth of 800
mm while all others showed sufficient sediment cover of > 1000 mm.
Figure 4: Location of cores taken inside and outside of the survey area. Survey polygon is depicted by the light-blue dashed line. The black stars depict the centre locations which were the bases for sediment coring. Cores without labels were taken but disposed of on the seafloor due to small penetration depth.

King Island Seabed Survey 27 June 2017
File: G:\asrg\Projects\King_Island_project\technical_report\KI_seabed_survey.doc Page 9
Table 2 : Length after water drainage, weight and piston penetration of retrieved cores from Figure 3.
Core number Length Weight Piston core penetration [-] [mm] [g] [mm] 1 400 1604 500 2 500 2011 500 3 360 1196 500 4 430 1613 500 5 400 1418 500 6 80 130 400 7 580 2430 1000 8 610 2386 1000 9 560 2309 800
10 640 2643 1000 11 580 2450 1000 12 520 2230 1000 13 630 2600 1000 14 580 2380 1000 15 600 2380 1000 16 650 2195 1000 17 630 2530 1000 18 610 2512 1000 19 640 2623 1000 20 610 2426 1000 21 610 2420 1000 22 550 2190 800 23 590 2420 1000 24 610 2590 1000 25 550 2310 800
Figure 5: Photo of 25 cores retrieved from the seafloor on 03 to 04/04/2017 taken on King Island on the 06/04/217. Core specifics are outlined in table 2.
King Island Seabed Survey 27 June 2017
File: G:\asrg\Projects\King_Island_project\technical_report\KI_seabed_survey.doc Page 10
3.2 Sub-bottom data
Sub-bottom profiling (SBP) revealed relatively heterogeneous surface substrate with boulder and reef
formations throughout the initial proposed location. A zone west of the initial location was identified
as more suitable with approx. 50 by 30 m cover in minimum of 800 mm sand and no boulder or reef
structure.
Figure 6 shows the vessel track lines (blue line) for the sub-bottom survey in the target area and the
vessel track for the cable track line is depicted in Figure 7 (black line).
Using the Syqwest StrataBox 3510 HD at 10kHz allowed for an accurate representation of the seafloor
strata. The frequency and output power had to be calibrated to resolve the results in an acceptable
parameter range (~1 meter of sand depth) in post-processing. Higher frequencies have higher signal
loss in sediment, but they also have higher resolution, particularly in the top layers. Decreasing power
output can give less penetration in addition to less noise. The application of the 7 second swell filter
(in SonarWiz 6) was necessary to reduce the enormous signal noise from the wave swell present
during the survey. The swell filter created a much smoother representation of the seafloor and sub-
bottom strata. Furthermore, a smaller loss of vertical detail was achieved. It is noted that the post-
processing did not remove any acoustic data, nor influence the depth of the main reflector. In
summary, a high resolution map of the top 2m of sediment in a highly energetic marine environment
was achieved. Sub-bottom data of individual transects are shown in the appendix and as high-
resolution pictures on the USB stick.
Physical sediment cores are still favourable (where possible) to confirm SBP results, in total 25 cores
(see section 3.1) were taken and 10 core locations synced with sub-bottom navigational paths. These
10 cores were implemented in the digitized cross section of acoustic data with an accurate
representation of the piston corer penetration (not length of recovered material). This method provided
confidence in the accuracy of the SBP results by physical validation.

King Island Seabed Survey 27 June 2017
File: G:\asrg\Projects\King_Island_project\technical_report\KI_seabed_survey.doc Page 11
Figure 6: Overview of sub-bottom tracks in survey area (excluding the cable track line)
Figure 7: Overview of the cable track line (black line) used for the sub-bottom profiling. Bathymetry of the survey area is shown in the north at the beginning of the track line.

King Island Seabed Survey 27 June 2017
File: G:\asrg\Projects\King_Island_project\technical_report\KI_seabed_survey.doc Page 12
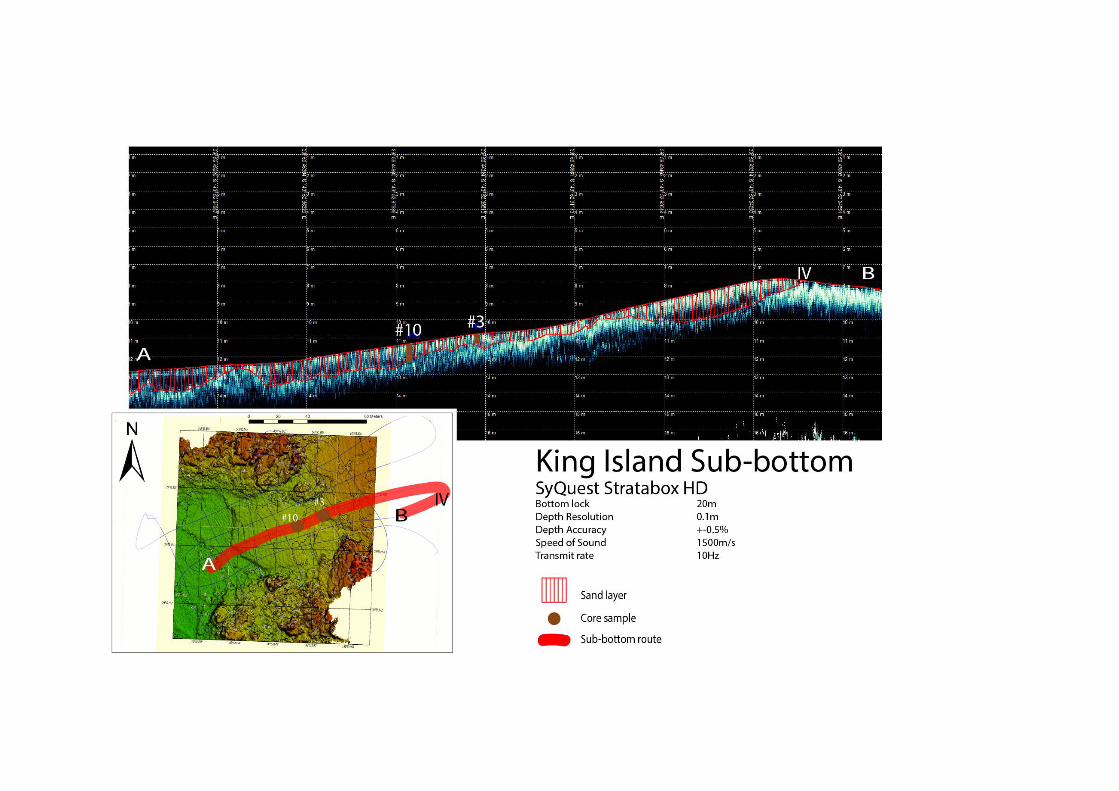
In the first image (see appendix KI subbottom segment 1-01) the SBP criss-crosses the area of interest
in North-South direction. The highly variable sediment depth is evident in, particularly after the “I”-
marker and near the middle of the channel with a minimum of 0.35m and maximum of 1.10m. Further
to the west (in images KI subbottom segment 1-02 and KI subbottom segment 1-03) an increase in
sediment depth to 1.60m avg. can be identified. This sediment layer coverage is confirmed to 1meter
with sediment cores # 8 and #10. Images KI subbottom segment 1-04 to KI subbottom segment 1-07
follow the path in between the reefs (East –West-direction). Image KI subbottom segment 1-05 clearly
shows a substantial sediment layer in the area East of the survey zone (up to 3.10m) before returning
to a thin layer of sand in the Eastern target area and thickening again in the Western target area. These
findings are supported in image KI subbottom segment 1-06 with core #10 (1m penetration) and core
#3 (0.5m penetration).
Table 3 : High resolution date are provided on USB Stick
KI subbottom segment 1-01.png North - South transect
KI subbottom segment 1-02.png North - South transect
KI subbottom segment 1-03.png East -West transect
KI subbottom segment 1-04.png East -West transect
KI subbottom segment 1-05.png East -West transect
KI subbottom segment 1-06.png East -West transect
KI subbottom segment 1-07.png North - South transect
KI subbottom segment 1-08.png Cable route
KI subbottom segment 1-09.png Cable route
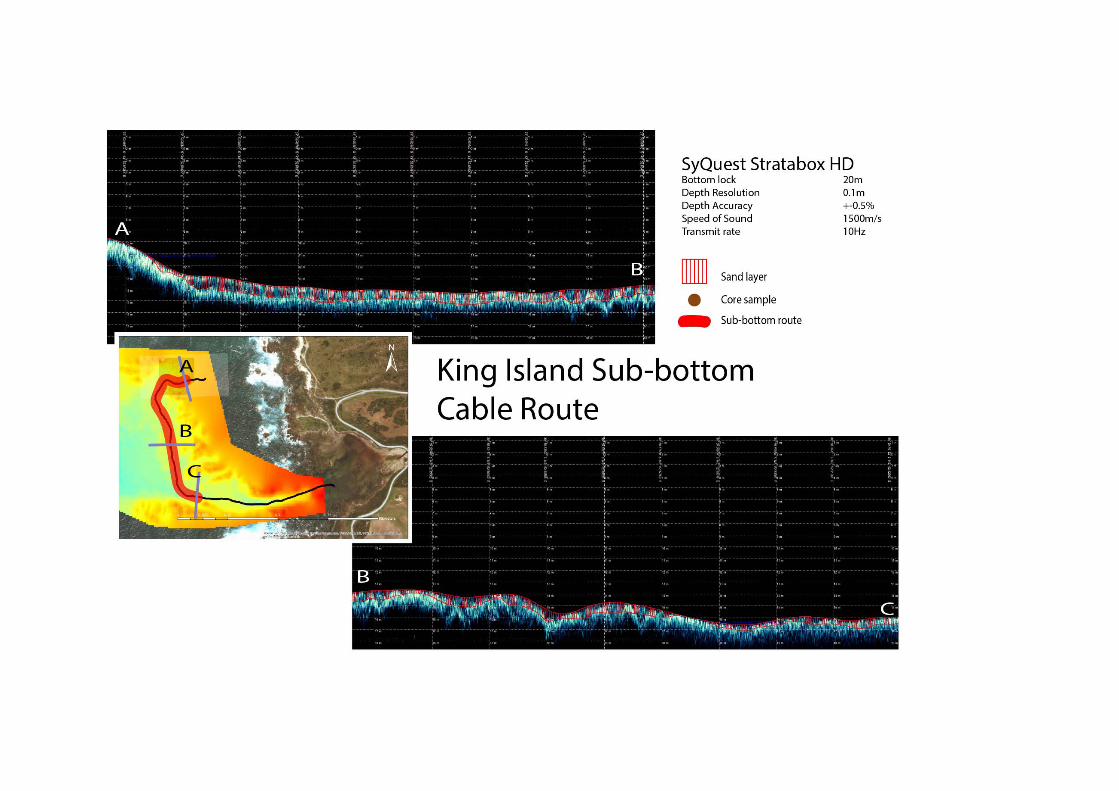
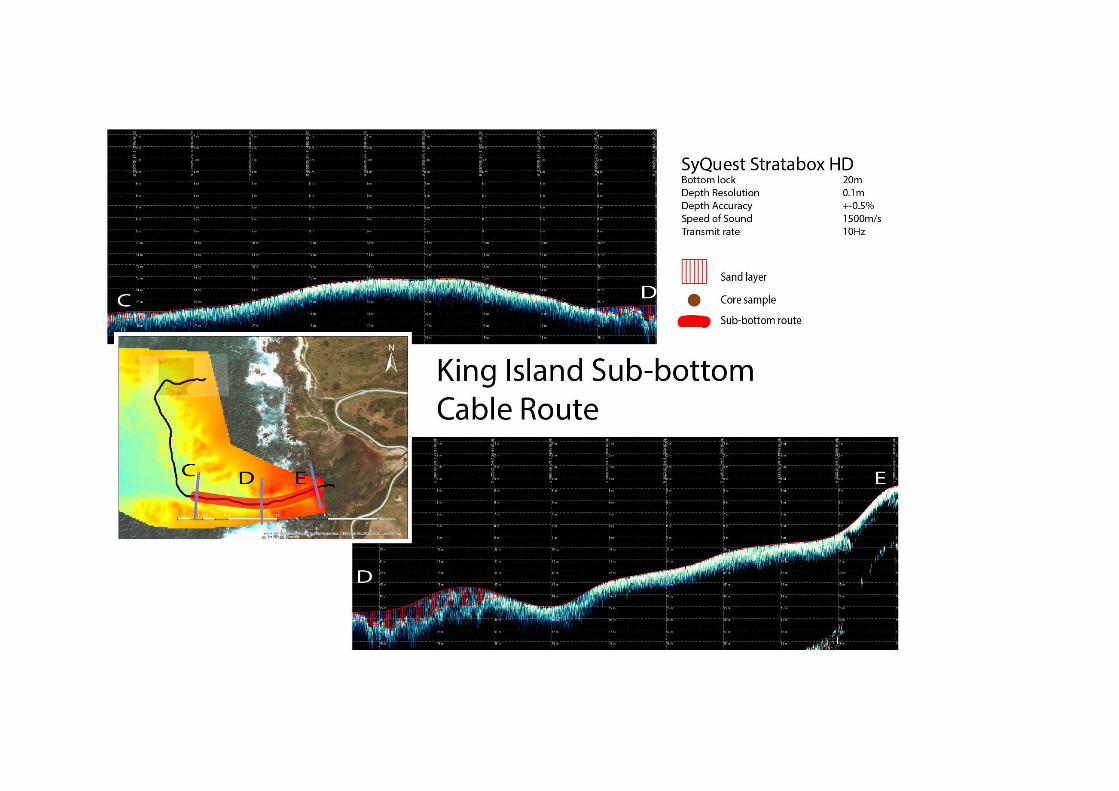
The use of the SBP for the cable route was not validated with sediment cores, but can be cross-
referenced with the video tow (section 3.3). Starting off the SBP in image KI subbottom segment 1-08,
the run began over the south-side rock/reef ‘A’ before heading down into the more sandy prolific areas
between 13m to 16m depth LAT (Videotow 1:45 minute-14:00 minute) ‘C’. In a number of areas the
sandy seabed gives way to a benthic layer of pebbles and cobbles with significant retention of seaweed
(Videotow, 9:55 minutes), and again when the navigational track turns east around the 13:30 minute
mark before transitioning back to sand (14:50 minute). The remaining SBP transitions from a
significant reflector to none discernible (‘D’ to ‘E’), particularly in the later area approaching the
shallow inlet of the Ettrick River. Whereas the videotow transitions significantly between sandy
bottom to pebble and cobbles before (24:15 minute) shifting to sandy seabed for the remainder of the
transect. None of the SBP or videotow data showed significant rocky/reef stretches like that bordering
the main survey area to the north or south.

King Island Seabed Survey 27 June 2017
File: G:\asrg\Projects\King_Island_project\technical_report\KI_seabed_survey.doc Page 13
3.3 Underwater Video
3.3.1 Survey area
Video footage was taken on April 04 to get general overview of the site and look for seafloor
characteristics, location of reefs and obstacles. Several transects were carried out from instrument
string (143°52'53.583"E 39°59'27.236"S) and one from the first star picket (143°52'54.188"E
39°59'26.637"S) Five video files of the survey area along the north, north-east, southern and western
direction respectively are located on the USB stick and tabulated in Table 4.
Table 4: Video footage and file name convention
Location File name Description
Northeast transect GOPR1113.MP4 From star picket to north / north-eastern area
Northeast transect GOPR1101.MP4 From instrument string to northern reef
Northern transect: GOPR1105.MP4 From instrument string to northern reef
Southern transect GOPR1108.MP4 From instrument string to southern reef)
Western transect GOPR1109.MP4
Western area (video shows transect from outer end towards instrument string
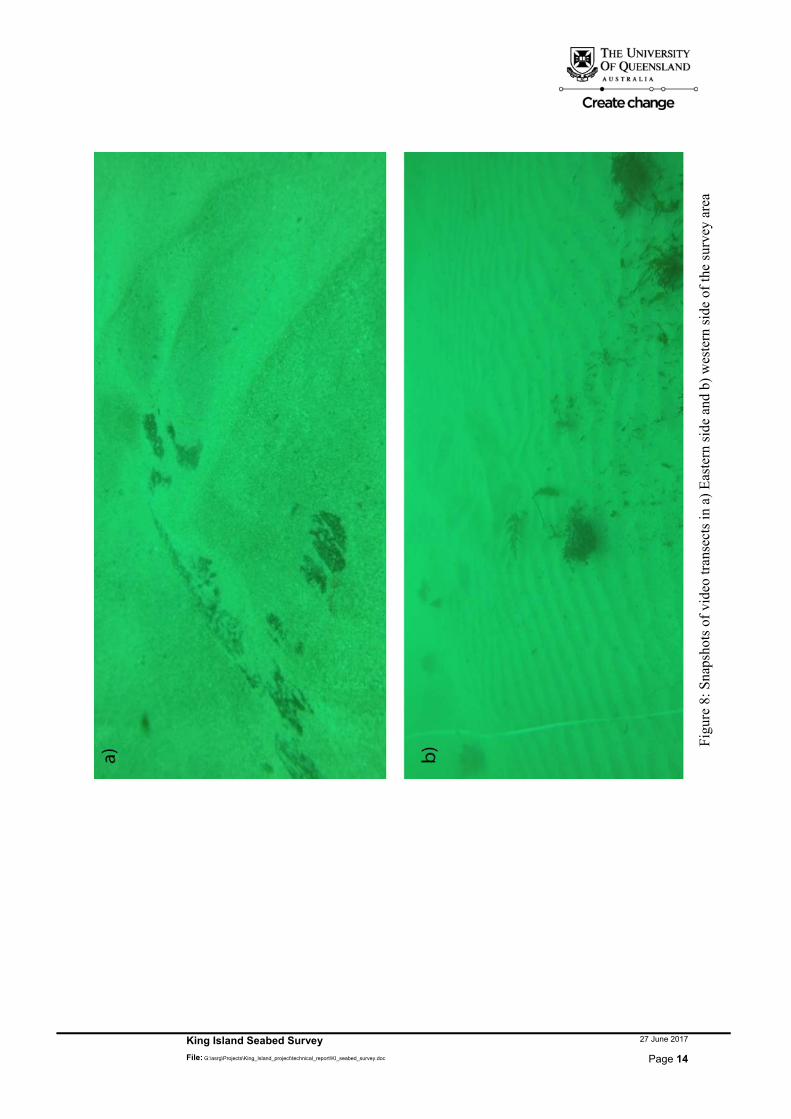
These transects confirm findings from the coring results showing weak sand coverage in the eastern
part and a more substantial sand coverage in the western area. It should be noted that the videos show
significant amount of boulders in the eastern part of the survey area, in particular towards the northern
reef. On the other hand, the western side (and even beyond the polygon outlined in Figure 4) has a
more sandy character with significantly less evidence of hard substrate and boulders. The contrast of
these two parts of the survey site is provided in Figure 8.
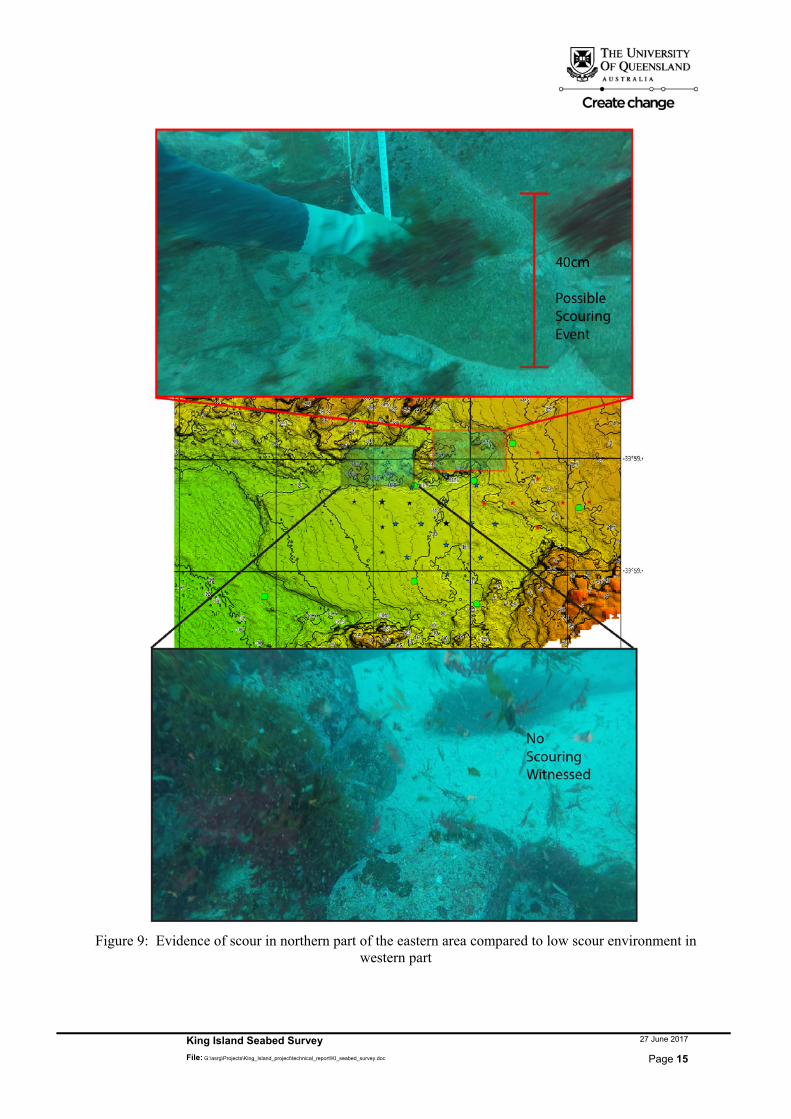
Figure 9 reveals another important aspect observed during site inspection video transects. The edge of
the northern reef has different characteristics in relation to the apparent smoothness of boulders,
sediment and encrusting algae coverage. The top panel of Figure 9 shows the eastern area at a depth of
approx. 9 m (LAT) whilst the bottom panel is taken at a depth of > 10 m (LAT). It is evident that the
shallower location has significantly less algae near the bottom 40cm of exposed rock than the deeper
area. This could be related to greater scour potential and higher impact of waves due to the smaller
water depth and consistent with findings from cores and sub-bottom data.
King Island Seabed Survey 27 June 2017
File: G:\asrg\Projects\King_Island_project\technical_report\KI_seabed_survey.doc Page 14
Fig
ure
8: S
naps
hots
of
vide
o tr
anse
cts
in a
) E
aste
rn s
ide
and
b) w
este
rn s
ide
of th
e su
rvey
are
a
King Island Seabed Survey 27 June 2017
File: G:\asrg\Projects\King_Island_project\technical_report\KI_seabed_survey.doc Page 15
Figure 9: Evidence of scour in northern part of the eastern area compared to low scour environment in western part

King Island Seabed Survey 27 June 2017
File: G:\asrg\Projects\King_Island_project\technical_report\KI_seabed_survey.doc Page 16
3.3.2 Cable route
Photo grabs of the video footage and the path of the cable track line is shown in Figure 10. The video
footage for the entire cable route and superimposed vessel position is provided on the USB drive
(20170405_095929.avi). The quality of the video diminishes in the deeper areas (between location A
and B, Figure 10) due to vessel speed and difficulties with maintaining a proper camera angle at this
depth. However, generally the seafloor has a sandy characteristic with patches of seaweed. Around
location B in Figure 10 there a some cobbles and pebbles visible but the seafloor quickly returns to a
sandy substrate along the track line. As outlined in section 3.2 there were no significant rocky/reef
stretches detectable along the cable route.
Figure 10: Snap shots of the video footage along the cable route

King Island Seabed Survey 27 June 2017
File: G:\asrg\Projects\King_Island_project\technical_report\KI_seabed_survey.doc Page 17
3.4 Geotechnical Results
3.4.1 Material
Figure 11 shows the particle size distribution of the sample taken from the seabed. The sediment
consists of 90% sand and 10% gravel with no fraction in the silt or clay class. The characteristic
particle diameters at 10%, 30% and 60% finer by weight are 0.21mm, 0.41mm and 0.7mm,
respectively. Based on these diameters, the coefficient of uniformity is Cu = 3.3 (<0.6) and the
coefficient of curvature Cc = 1.1. With these characteristic values, the sample material can be
classified as poorly graded Sand SP according the Unified Soil Classification System. This sediment
distribution was confirmed by another sediment analysis outlined in section 2.6. The particle size
distribution for the top of cores along the centre of the East-West transect (cores 2, 4, 9, 10 and 14, see
Figure 4) is attached in the appendix. It is recommended that tests on the maximum and minimum dry
densities should be conducted. These tests are required to be able to quantify the in situ density
conditions. With the available data (and somewhat disturbed cores) the specific gravity of the sand
was tested to be G = 2.657 kg/m3.
Figure 11: Particle size distribution of the seabed sand.

King Island Seabed Survey 27 June 2017
File: G:\asrg\Projects\King_Island_project\technical_report\KI_seabed_survey.doc Page 18
3.4.2 Triaxial Tests
Fully drained triaxial tests were conducted with the sand samples. The preparation of undisturbed
samples is complex with the material retrieved from the sediment cores. Thus, to a certain degree
disturbed samples were used to prepare samples at dense conditions. The radial effective stress was
taken as 3’ = 35 kPa, which corresponds to a horizontal stress in a depth of approximately 7 m. At
initial conditions, the effective vertical stress was set to 1’ = 35 kPa (isotropic conditions). Starting
from this condition, the vertical stress was linearly increased by 10 kPa per minute until failure
occurred and beyond. The tests were conducted under fully drained conditions, which means that
water was allowed to flow into or out of the sample. Test 2 started at 18.5 kPa representing the stress
conditions in approximately 3.5 m depth. Test 3 was a repetition of Test 1.
Figure 12 shows the shear or deviatoric stress q = (1’-3’)/2 versus the vertical strain z for all three
tests. A linear increase of shear strength is followed by a non-linear evolution until failure occurs at
the peak of the curve. This curve shows a characteristic evolution of the shear failure for a dense sand.
After failure softening occurs which means that the shear strength reduces with further deformation.
Another characteristic curve for a dense sand is given by the evolution of the volumetric strain with
increasing vertical strain given in Figure 13. Test 1 showed first some slight densification –
characterised by a negative volumetric strain indicating compression – before volumetric strain
increased dramatically. In Test 2, the volumetric strain started to increase immediately, which means
that the sample was at a very dense state. The increase in volumetric strain was caused by the
production of volume during shearing which occurs typically with dense sands. A plateau of the
volumetric strain was not reached, which suggests that more than one shear plane was created during
failure. Test 3 showed an immediate increase in volumetric strain, which was caused by a fast outflow
of water when the valve was opened at the beginning of the test. Volumetric strain is measured from
the water flowing out of or into the sample. This volumetric strain caused by the flow of water to reach
equilibrium can be neglected. The stress condition leading to the failure was not affected by this
outflow of water. However, the resulting volumetric strain was somewhat biased, but this was not
relevant for defining the yield surface for the soil.
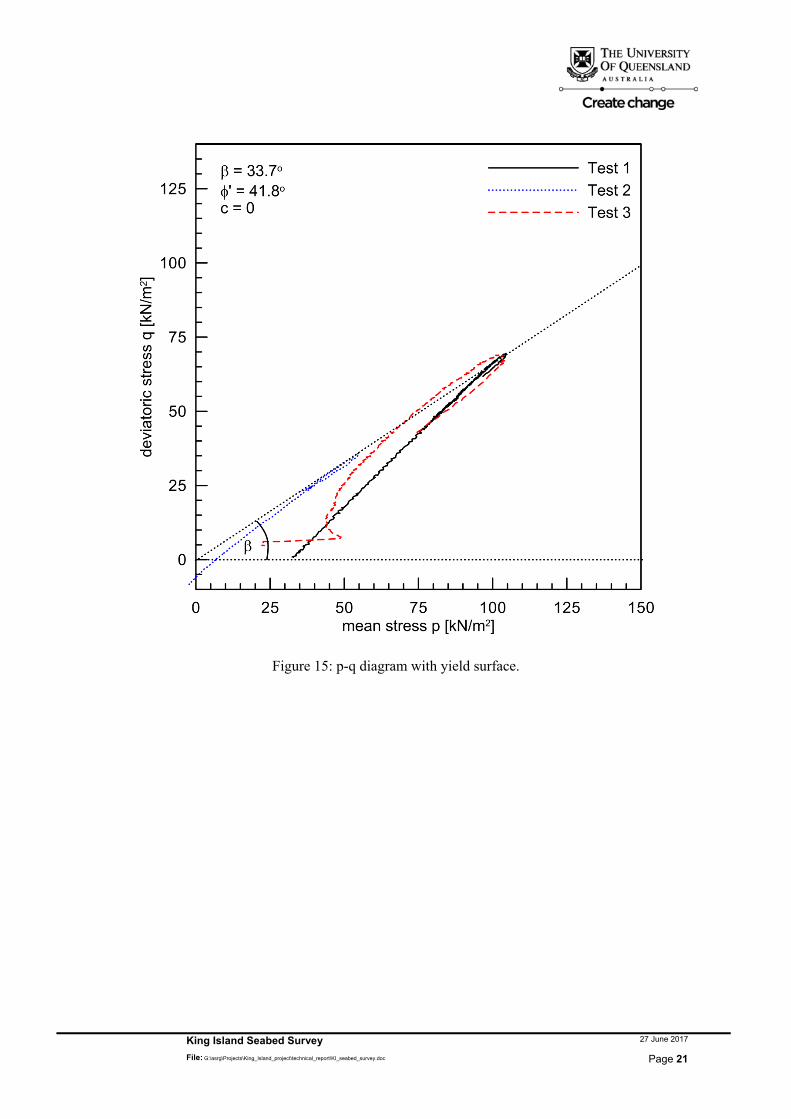
The stress conditions at failure for all three tests are summarised in Table 5. The corresponding Mohr
Circles are given in Figure 14 and the stress paths in the p-q diagram are shown in Figure 15. The tests
define a yield surface without cohesion, and a friction angle can be determined to be φ’ = 41.8°. Test 3
has verified the result of Test 1.

King Island Seabed Survey 27 June 2017
File: G:\asrg\Projects\King_Island_project\technical_report\KI_seabed_survey.doc Page 19
Table 5: Stress conditions at failure
Test No vertical effective stress
1’ [kPa]
radial effective stress
’ [kPa]
1 174 35
2 90.4 18.5
3 172 35
Figure 12: Deviatoric stress vs vertical strain.

King Island Seabed Survey 27 June 2017
File: G:\asrg\Projects\King_Island_project\technical_report\KI_seabed_survey.doc Page 20
Figure 13: Volumetric strain vs vertical strain.
Figure 14: Mohr Circle at failure state with failure plane.
King Island Seabed Survey 27 June 2017
File: G:\asrg\Projects\King_Island_project\technical_report\KI_seabed_survey.doc Page 21
Figure 15: p-q diagram with yield surface.

King Island Seabed Survey 27 June 2017
File: G:\asrg\Projects\King_Island_project\technical_report\KI_seabed_survey.doc Page 22
3.4.3 Bearing capacity
Based on the friction angle of φ’ = 41.8° a first simplified estimate of the bearing capacity is made.
According to Bjerrum (1973) simple static considerations can be used to assess the bearing capacity of
offshore footings. Under the following simplified assumptions:
No eccentricity of the load
Horizontal load is neglected
Cohesion does not exist
Structure is sitting on the surface (shallow footing)
the bearing capacity can be calculated as
qf = Pv / BL = ½ ’ N’ B sy
with sy = 1 – 0.4 B’/L (without eccentricity B’ = B) and with B ≈ L we receive sy ≈ 0.6. According to
Brinch Hansen (1970) N’ ≈ 100 for ' = 41.8°. With these parameters, the bearing capacity qf can be
calculated for a shallow footing with a width of approximately 20m and an effective unit weight of the
sediment of ’ = 10 kN/m3 to be approximately qf = 6 MPa. If the width is reduced to 10 m due to
eccentricity or loss of material under the footing qf is reduced to qf = 3 MPa.
Please note that cyclic and dynamic loading due to wave impact or water currents were not considered.
Further tests with more detailed information on the in situ conditions with regard to horizontal and
cyclic load, and building parameters are required for a more precise estimate of bearing capacity.

King Island Seabed Survey 27 June 2017
File: G:\asrg\Projects\King_Island_project\technical_report\KI_seabed_survey.doc Page 23
3.5 Hydrodynamics
General conditions during the survey The wind on the survey days was relatively mild (< 10 knots) but the swell from previous days was
still prominent during Monday and Tuesday morning with wave heights (Hmax) exceeding 2 m. The
waves reduced during the survey period until the afternoon of Wednesday (05/04/2017).
Generally, the survey period can be split up into two periods: a) Monday (03/04/2017) with less
favourable weather and wave conditions and b) Tuesday/Wednesday (04-05/04/2017) with reasonably
fair conditions to conduct the sub-bottom profiling, video-taping and sediment coring.
Due to harsh conditions on the seafloor, the LISST’s magnetic switch was turned off and information
about particle size distribution (PSD) and concentration was not recorded. However, PSD information
could be retrieved through particle size analysis in the laboratory (see geotechnical section).
Nonetheless, sediment concentration rates in the water column have to be estimated via turbidity
measurements near the seafloor.
Figure 16: a) Observed velocities in the water column with the upward looking ADCP and distance to the seafloor (height above bottom, hab). Water velocities are 60s averages and represent ambient currents due to tides. b) Water level fluctuations due to tides during the observation period. c) Wave heights recorded at 6Hz.
King Island Seabed Survey 27 June 2017
File: G:\asrg\Projects\King_Island_project\technical_report\KI_seabed_survey.doc Page 24
Figure 16 displays basic hydrodynamic conditions during the observation period. Tidal currents are
relatively weak with maximum velocities of 0.2 m/s throughout the water column (Figure 1a). The
tidal range during the survey was in the micro-tidal range with maximum water level differences of
0.75m between low tide and consecutive high tide (Figure 1b). The recorded water level fluctuations
relate to the observed tidal water level fluctuations (with respect to the MSL) based on the pressure
transducers of various instruments. We note that astronomical tide information from tide gauges refer
to LAT and may therefore differ with respect to the datum. The wave heights are correlated to the
wind conditions and show a continuous decline between Monday morning and Tuesday afternoon
(Figure 1c). Maximum wave heights exceeded Hmax > 2m on Monday but the swell decreased to Hm <
1.25 m which were favourable conditions for the survey. Nonetheless, the more energetic conditions at
the beginning of the survey period on Monday (03/04) give better insight into the local dynamics of
the potential placement area.
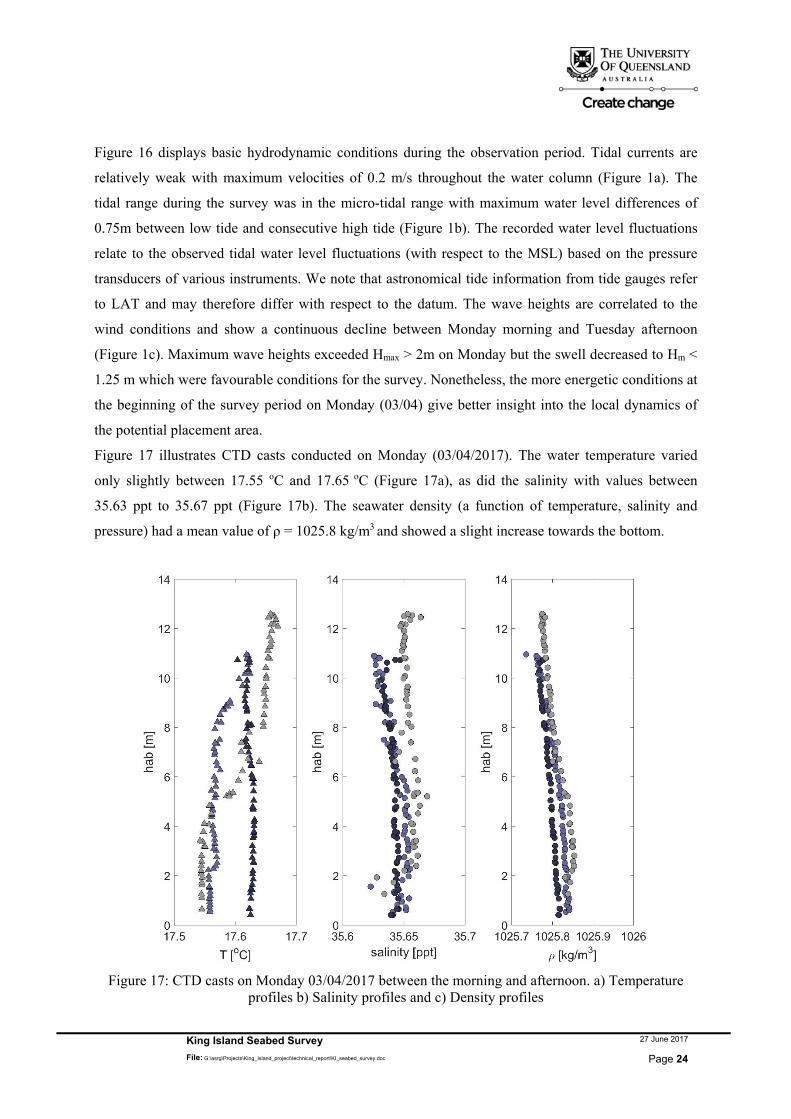
Figure 17 illustrates CTD casts conducted on Monday (03/04/2017). The water temperature varied
only slightly between 17.55 oC and 17.65 oC (Figure 17a), as did the salinity with values between
35.63 ppt to 35.67 ppt (Figure 17b). The seawater density (a function of temperature, salinity and
pressure) had a mean value of ρ = 1025.8 kg/m3 and showed a slight increase towards the bottom.
Figure 17: CTD casts on Monday 03/04/2017 between the morning and afternoon. a) Temperature
profiles b) Salinity profiles and c) Density profiles

King Island Seabed Survey 27 June 2017
File: G:\asrg\Projects\King_Island_project\technical_report\KI_seabed_survey.doc Page 25
Figure 18 provides a more detailed description of the hydrodynamics. For better visualization, the
timeframe encompasses a 15-minute-interval between 10:40am to 10:55am on Monday. Similar
conditions prevailed for the majority of Monday until the wave heights started to decrease on Tuesday.
Wave heights varied between 0.75 m – 1.5 m but exceeded 2 m on numerous occasions (Figure 18a).
Velocities near the seafloor reveal periodic velocity fluctuations which correlate well with passing
waves (Figure 18b). Small waves led to small increases in horizontal velocities whilst large wave
groups generated velocities at the order of > 1 m/s. Periods of increased velocities can be directly
linked to sediment resuspension near the seafloor. Figure 18c shows turbidity levels observed
approximately 15 cm above the seafloor. Particularly, large waves in passing wave trains show good
agreement with elevated turbidity levels (>200 NTU) which are much larger compared to ambient
turbidity levels at the order of ~40 NTU. Snapshots of velocity profiles in the bottom meter for small
and large waves are illustrated in Figures 18d and Figure18e, respectively. During the passage of small
waves velocities hardly exceeded 0.15 m/s with a typical logarithmic profile near the bottom. In
contrast, larger waves during the observation significantly accelerate the water in the bottom meter
ranging from 0.7 m/s to > 1 m/s near the seafloor (Figure 18e). High velocity periods and increased
turbidity levels are further supported by video footage and visual observations during dive operations
on Monday when large waves resuspended sediments from the seafloor causing very poor visibility.
The conditions outlined in Figures 18 with periodic velocities of > 1 m/s and visibility less than 1 m
are unacceptable for dive operations and indicate the energy present during relatively “calm periods”
at the potential deployment site.
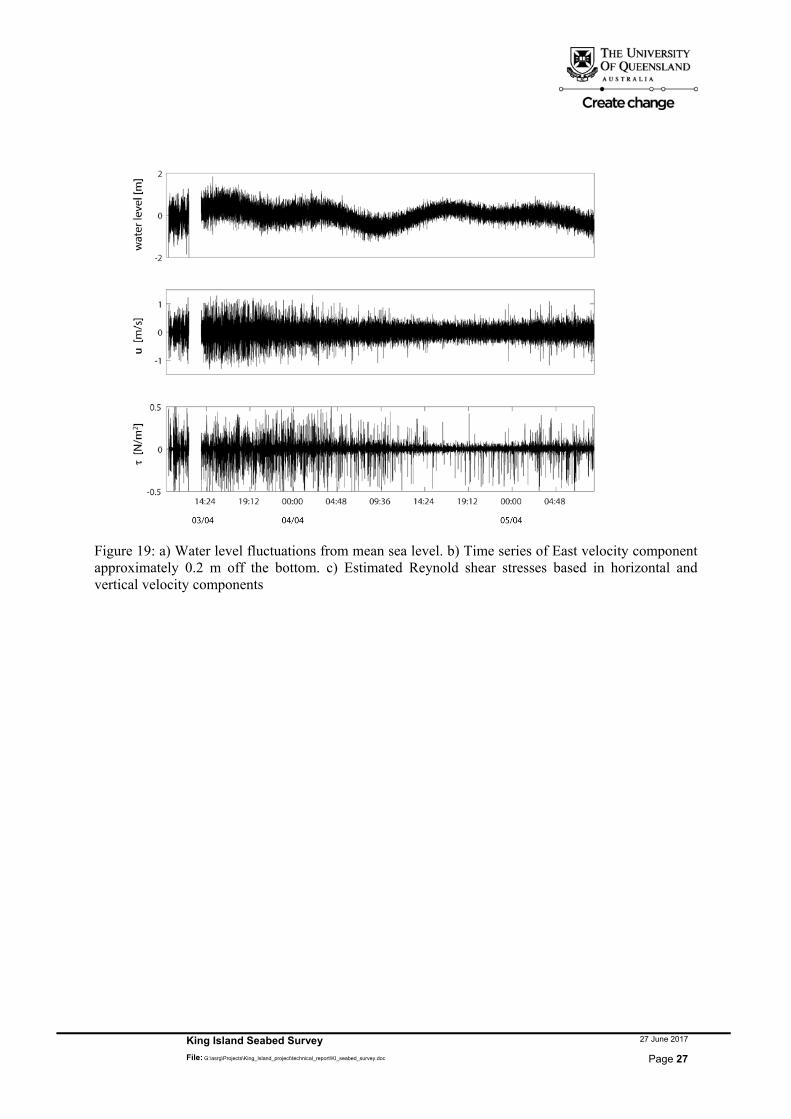
Figure 19 shows similar wave data (Figure 19a) and turbulent velocity data (Figure 19b) as shown in
previous figures. However, this data set was obtained with a fast sampling (32Hz) Acoustic Doppler
Velocimeter which allows for the estimate of shear stresses near the bed. Correlated with large wave
heights are large velocity fluctuations which led to Reynolds stress estimates at the order of τ = 1 N/m2
(Figure 19c). Such shear stress magnitudes are significant and comparable to high energy coastal
systems that are subjected to active sediment transport.

King Island Seabed Survey 27 June 2017
File: G:\asrg\Projects\King_Island_project\technical_report\KI_seabed_survey.doc Page 26
Figure 18: Hydrodynamic conditions during a 15-minute-interval representative of the energetic sea state on Monday 03/04/2017. a) Water level fluctuations from mean sea level. b) Horizontal velocity magnitudes within the bottom meter. c) Recorded turbidity approximately 15 cm above the seafloor. d) Velocity profile during small wave passage. Error bars indicate velocity range observed over several seconds before and after the wave crest / trough. e) Velocity profile during large wave passage. Error bars indicate velocity range observed over several seconds before and after the wave crest / trough.
King Island Seabed Survey 27 June 2017
File: G:\asrg\Projects\King_Island_project\technical_report\KI_seabed_survey.doc Page 27
Figure 19: a) Water level fluctuations from mean sea level. b) Time series of East velocity component approximately 0.2 m off the bottom. c) Estimated Reynold shear stresses based in horizontal and vertical velocity components

King Island Seabed Survey 27 June 2017
File: G:\asrg\Projects\King_Island_project\technical_report\KI_seabed_survey.doc Page 28
4 Summary
Site location and characteristics:
The most suitable locations for the wave energy converter seems to be the western side of the survey
polygon and even beyond the western boundary. All cores taken in this area had a penetration depth of
> 800 mm and the sediments showed a more consistent and homogenous layering. These results were
confirmed and supported by sub-bottom profiles and video surveys. The eastern side shows
significantly less sediment coverage, a larger density of boulders while an area with approx. 50 by 30
m cover in minimum of 800 mm sand and no boulder or reef structures was found in the western side.
The cable route has a flat and mainly sandy bottom and seems suitable for supporting the cable as a
shore connection.
Geotechnical conditions and sediment characteristics:
The sediment consists of 90% sand and 10% gravel with no fraction in the silt or clay class with
overall good weight-bearing characteristics. The friction angle was determined to be φ’ = 41.8° and
the bearing capacity was estimated under simplifying assumptions to be qf = 3 MPa (considering
eccentricity). The cyclic loading, wave impact or flow of water were not considered. The bearing
capacity can be more precisely determined with more details on in situ conditions with respect to
dynamic loads. Some factors that would increase the accuracy include: (better) description of the wave
climate (Hs, Hmax, wave and directionality period, frequency of events), horizontal forces due to waves
and currents which all affect the dynamic loading on the structure. Further questions regarding the
bearing capacity relate to the tolerable degree of settlement, pressure distribution around the structure
during wave loading, the weight distribution and eccentricity due to dynamic loading.
Hydrodynamic conditions:
A swell of Hmax ~2 m during the first days of the survey were experienced. Nonetheless, the impact on
conditions near the seafloor and consequently on work and deployment operations was already severe.
Large waves resuspended many sediment particles and orbital velocities exceeded 1 m/s near the
seabed. The induced turbulence underneath these waves was significant with Reynolds stress
fluctuations at the order of 1 N/m2. This indicates a very dynamic system, in particular with respect to
sediment transport. Our observations were supported by dives and video footage showing active
scouring in the eastern area but less pronounced scour evidence in the deeper western area of the
survey polygon.
King Island Seabed Survey 27 June 2017
File: G:\asrg\Projects\King_Island_project\technical_report\KI_seabed_survey.doc Page 29
Miscellaneous:
During the survey we noticed that the GPS coordinates between CSIRO survey data the UQ survey
seem to be slightly offset by approximately 5 meters. We found the position of the southern reef to be
further north than indicated by the bathymetry.
During the first hours of our instrument deployments the transport capacity of water under waves
became an issue. In particular, kelp was caught by instrument frames and increased the drag on objects
so that moorings had to be reconfigured.
5 Recommendations
The highly active sediment regime is a concern. If the eastern part has scoured between February and
April, further scouring in the preferred western side could occur, especially during the stormy season
when waves have a greater potential to transport more sediment into or out of deeper areas. The long-
term transport regime and the local scour potential under waves should be monitored as long as
possible before the wave energy converter is brought to the site.
The hydrodynamic conditions have only been analysed for a fraction of a tidal cycle (two days). This
short observation period has already shown i) large fluctuations; and ii) the dynamic potential at the
site. Larger waves will have a much bigger influence on the sediment transport regime but also around
the structure (once it has been deployed). This should be further investigated, at least over a tidal cycle
in two different seasons of the year.
The knowledge of the wave climate and local conditions allow only a non-conservative estimate of the
bearing capacity. The aforementioned parameter would aid in getting a more robust estimate and
predict the behaviour of the structure under dynamic loading. Such calculations can be done with
physical or numerical modelling to test mitigation measures and scour protection.

King Island Seabed Survey 27 June 2017
File: G:\asrg\Projects\King_Island_project\technical_report\KI_seabed_survey.doc Page 30
Bibliography Folk, R.L. 1974. Petrology of sedimentary rocks. Hemphill Publishing Company, Austin, Texas. Accessed: http://www.lib.utexas.edu/geo/folkready/folkprefrev.html accessed 16 Oct 2016. Sperazza, M., Moore, J.N., Hendrix, M.S. 2004. High-resolution particle size analysis of naturally occurring very fine-grained sediment through laser diffractometry. Journal of Sedimentary Research. 74, 736-743. Bjerrum, L. (1973): Geotechnical problems involved in foundations of structures in the North Sea. Géotechnique 23 (3), 319-358.
Hansen, J.B. (1970): A revised and extended formula for bearing capacity.
King Island Seabed Survey 27 June 2017
File: G:\asrg\Projects\King_Island_project\technical_report\KI_seabed_survey.doc Page 31
Appendix
King Island Seabed Survey 27 June 2017
File: G:\asrg\Projects\King_Island_project\technical_report\KI_seabed_survey.doc Page 32
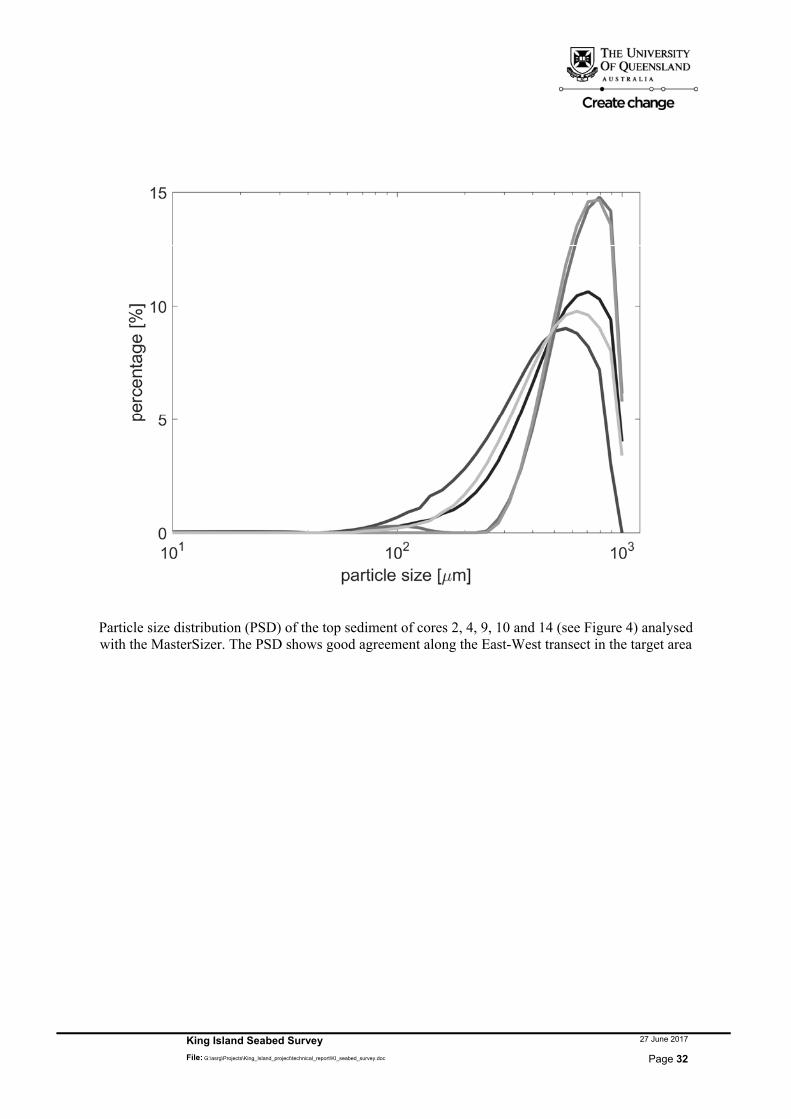
Particle size distribution (PSD) of the top sediment of cores 2, 4, 9, 10 and 14 (see Figure 4) analysed with the MasterSizer. The PSD shows good agreement along the East-West transect in the target area