Embed Size (px)
Citation preview

Parallel Computing 39 (2013) 132–145
Contents lists available at SciVerse ScienceDirect
Parallel Computing
journal homepage: www.elsevier .com/ locate /parco
A scalable infrastructure for the performance analysis of passivetarget synchronization
Marc-André Hermanns a,b,⇑, Sriram Krishnamoorthy d, Felix Wolf a,b,c
a German Research School for Simulation Sciences, 52062 Aachen, Germanyb Dept. of Computer Science, RWTH Aachen University, 52056 Aachen, Germanyc Jülich Supercomputing Centre, Forschungszentrum Jülich, 52425 Jülich, Germanyd Computer Science and Mathematics Division, Pacific Northwest National Laboratory, Richland, WA, USA
a r t i c l e i n f o
Article history:Available online 8 October 2012
Keywords:Performance analysisEvent tracingOne-sided communicationRemote memory access
0167-8191/$ - see front matter � 2012 Elsevier B.Vhttp://dx.doi.org/10.1016/j.parco.2012.09.002
⇑ Corresponding author at: German Research SchoE-mail addresses: [email protected] (M.
a b s t r a c t
Partitioned global address space (PGAS) languages combine the convenient abstraction ofshared memory with the notion of affinity, extending multi-threaded programming tolarge-scale systems with physically distributed memory. However, in spite of their obviousadvantages, PGAS languages still lack appropriate tool support for performance analysis,one of the reasons why their adoption is still in its infancy. Some of the performanceproblems for which tool support is needed occur at the level of the underlying one-sidedcommunication substrate, such as the Aggregate Remote Memory Copy Interface (ARMCI).One such example is the waiting time in situations where asynchronous data transferscannot be completed without software intervention at the target side. This is notuncommon on systems with reduced operating-system kernels such as IBM Blue Gene/Pwhere the use of progress threads would double the number of cores necessary to runan application. In this paper, we present an extension of the Scalasca trace-analysisinfrastructure aimed at the identification and quantification of progress-related waitingtimes at larger scales. We demonstrate its utility and scalability using a benchmarkrunning with up to 32,768 processes.
� 2012 Elsevier B.V. All rights reserved.
1. Introduction
The evolution of high-performance computing (HPC) systems in the last decade has led to an exponential increase in par-allelism. Computing systems in the top ten of the world’s 500 fastest supercomputers today feature an average of more than180,000 cores [1]. In 2011, the largest system in terms of the number of cores (RIKEN’s K Computer) offers a total of 548,352cores on 68,544 distributed-memory nodes. At larger scales, even small waiting times can propagate and accumulatethroughout the application and significantly hinder acceptable application performance [2]. Performance-analysis toolsfor HPC platforms are designed to aid application and library developers, as well as compiler writers, in the oftenoverwhelming task of investigating and understanding the application’s behavior at such a large scale. However, they areoften focused only on the predominant programming paradigm—message passing using the Message Passing Interface(MPI) [3].
With the advent of partitioned global address space (PGAS) languages, purely one-sided communication libraries gainedmore momentum, as these are employed in the communication runtime of those languages. In one-sided communication, allcommunication parameters, such as source and destination memory locations, are provided by one of the communication
. All rights reserved.
ol for Simulation Sciences, 52062 Aachen, Germany. Tel.: +49 241 80 99753; fax: +49 241 80 6 99753.-A. Hermanns), [email protected] (S. Krishnamoorthy), [email protected] (F. Wolf).
M.-A. Hermanns et al. / Parallel Computing 39 (2013) 132–145 133
partners only—the origin. The second communication partner—the target—does not explicitly call a communication functionto match the origin’s communication call. Seen from the programmer’s view, one-sided data transfers are completed withoutactive participation of the target. One of these one-sided communication libraries is the Aggregate Remote Memory CopyInterface (ARMCI) [4], used as the communication back-end of Global Arrays [5], a PGAS-style library. The efficiency ofthe communication relies greatly on whether the data exchange can be completed without the active participation of theother process. This is often provided through the communication hardware’s remote direct memory access (RDMA) support.When this support is unavailable either for the entire platform or only for a specific type of communication construct, a soft-ware component provides this progress. While this component can sometimes be executed by a helper thread, large-scalearchitectures with reduced kernels such as IBM’s Blue Gene/P require an extra core to run it, effectively doubling therequired hardware. Interrupt-driven progress, an alternative to a dedicated thread, on the other hand, introduces the costof an interrupt for every communication call and may pollute the cache. Without a separately scheduled progress engine,however, progress can only occur when the application calls the communication library directly. Yet, one of the inherentcharacteristics of PGAS applications is that individual processes do not necessarily communicate at the same time. Signifi-cant waiting times can therefore occur at the origin of a one-sided operation, while it is waiting for progress at the targetside. In addition, inter-process dependencies may induce further waiting times on remote processes via propagation, evenif the original waiting times are small [2]. The impact of the lack of remote communication progress on application perfor-mance has not been studied before, although this knowledge is crucial to assess the costs of alternatives such as extrathreads or interrupts.
To assist in performance tuning at a larger scale, performance-analysis tools must be scalable as well. Event tracing is awidely used method for performance analysis of parallel applications, and it has been successfully applied by several perfor-mance-analysis tools [6–10] available on typical HPC platforms. We have shown in previous work that trace-based perfor-mance analysis can be successfully employed at a large scale [11]. The main advantage of event tracing is the richness of theinter-process information that can be captured, allowing the analysis of extremely complex inter-process relationships.
Waiting time induced by insufficient message progress on the remote side is an example of such an inter-process rela-tionship, where event data from multiple processes have to be taken into account. The waiting time on the remote processcan only be quantified by knowing the start and end time of the communication call on the origin, as well as of the progressfunction on the target.
The number of performance analysis tools supporting one-sided communication libraries is currently rather small. TheParallel Performance Wizard (PPW) [10] supports the analysis of general one-sided communication constructs. It relies onthe GASP interface [12], a callback interface specifically designed for the analysis of PGAS applications and one-sided com-munication. Although now supported by several Unified Parallel C (UPC) compilers, it is unfortunately not yet widely sup-ported by current one-sided communication libraries. To the best of our knowledge, only GASNet [13] and Quadrics SHMEM[14] support this measurement interface so far.
The asynchronous parallel-programming framework Charm++ [15] supports the investigation of one-sided communica-tion through its proprietary performance tool Projections. MPI Peruse [16] allows implementation-internal events related toMPI one-sided implementations to be captured, and could be used to measure the necessary internal information. However,it is limited to MPI and to the best of our knowledge is only supported by OpenMPI [17]. The Cray Pat and Apprentice per-formance tools [18] support measurement of Cray SHMEM [19] using a mixture of instrumentation and sampling. The TAUperformance toolkit [9] has recently been extended to support measurement and analysis of Global Arrays and ARMCI calls[20], however, it records only time profiles and the communication matrix. In their study [21], Balaji and colleagues showthat system-specific waiting times can be an important factor when analyzing application performance. They investigatedoverheads in the MPI implementation on Blue Gene/P due to computations done by the implementation itself, focusingon another architecture characteristic of these systems—the comparatively low clock rate of the compute elements.
In our earlier work in the context of the Scalasca performance analysis tool [22], we showed how large-scale parallel traceanalysis can be facilitated using parallel message replay. So far, supported communication constructs include MPI point-to-point, collective, and one-sided operations with active target synchronization. The latter can be easily accomplished[23] because the active target synchronization following the one-sided exchange, which involves both parties, provides awelcome opportunity to exchange relevant information during the replay.
However, ARMCI one-sided communication provides only passive target synchronization, which does not actively involvethe target process. During the replay, the origin process, where the progress-related waiting time occurs, would not know thelocation of relevant information on the target processes, and the target process would not know how to locate this informa-tion on behalf of the origin process. This missing opportunity for data exchange poses serious challenges for Scalasca’s trace-based performance-analysis approach. In this work, we present two advanced techniques for data exchange during thereplay of one-sided communication that overcome the absence of triggering events on the target side. We describe howwe use these techniques to detect and quantify the waiting times caused by untimely remote progress in one-sidedcommunication. We demonstrate this functionality using three different applications based on either Global Arrays orARMCI directly across multiple scales on up to 32,768 processes.
The remainder of this paper is organized as follows. Section 2 gives an overview of the Aggregate Remote Memory CopyInterface (ARMCI), the one-sided library which is the subject of our investigation. We present the event model that we use tomodel ARMCI communication in Section 3. Based on this model, we define the Wait for Progress inefficiency pattern inSection 4. Section 5 gives a short introduction to Scalasca’s message-replay-driven analysis and presents our extension to

134 M.-A. Hermanns et al. / Parallel Computing 39 (2013) 132–145
the replay-mechanism in detail, followed in Section 6 by the results of analyzing three different applications. Concluding thispaper, Section 7 summarizes our work and makes a suggestion for future applications of our technique.
2. ARMCI
The Aggregate Remote Memory Copy Interface (ARMCI) is a library that provides one-sided communication functionalityon distributed memory architectures. It is a portable library optimized for most major communication substrates, includingSockets, Infiniband, Portals, Gemini, DCMF, and the MPI two-sided API. It forms the basis of the Global Arrays library,GPSHMEM, and an earlier version of Rice University’s Co-Array Fortran compiler.
ARMCI is compatible with the Message Passing Interface (MPI) and shares its process model. The remote memory used asa target of communication is collectively allocated by all processes through the ARMCI API. ARMCI supports a variety of com-munication idioms that correspond to copying data between local and remote memory regions. This includes blocking andnon-blocking communication of contiguous, strided, and vector data, remote atomic operations, and memory synchroniza-tion primitives. In addition to the put and get primitives, ARMCI supports the accumulate primitive to atomically add a valueto a remote location.
ARMCI provides blocking and non-blocking variants for a subset of communication primitives. The blocking variantsreturn after the operation is completed locally at the origin. The non-blocking variants return to the application as soonas possible after initiating the operation. To ensure local completion at the origin, a separate test or wait function has tobe called. It is the developer’s responsibility to ensure that the communication buffer remains valid between initiationand completion of the operation.
ARMCI has been designed in close collaboration with developers from different application domains, and the design of itsfunctionality has been directed by usage modes in higher-level libraries employed in applications. While the supported basefunctionality, such as contiguous put and get operations, can be handled on many systems by the network interface card(NIC), extended functionality, such as accumulate operations, often requires computation at the remote side for efficientimplementation. ARMCI has been designed to support a partitioned global address space view that is closely aligned withdistributed shared memory (DSM). In the spirit of DSM systems, one-sided access to remote data does not require anyparticipation from the remote process. For operations that cannot be supported by the NIC, a data server thread is launchedon each SMP node to satisfy incoming requests. This simplifies programming since the user does not have to reason aboutperiodic invocation of calls to the runtime to ensure progress of incoming communication. However, this additional dataserver thread incurs a performance overhead by consuming computational resources. Architectures with reduced threadingsupport, such as IBM Blue Gene/P, either do not support data server threads in certain configurations or require an extra coreto be reserved for every progress thread, effectively doubling the required number of cores per process.
3. Event model
The current version of Scalasca is based on direct instrumentation, which means that extra code is inserted at specificpoints in the code—typically at routine entries and exits and inside wrappers around communication routines. The latteris necessary for the acquisition of communication metrics. Whenever the control flow passes one of these instrumentationpoints, an event is triggered and with it the associated measurement logic. The types and attributes of these events togetherwith their usage constraints are defined in an event model. Direct instrumentation as opposed to statistical sampling not onlyensures that all performance-relevant events are properly captured but also simplifies access to parameters of communica-tion routines, an important ingredient of parallel performance data. If needed, the resulting runtime dilation, which is highlyapplication-dependent, can be reduced by filtering irrelevant events such as those around many frequently called but other-wise very short functions (e.g., getters and setters). In tracing mode, Scalasca simply collects all encountered events alongwith a timestamp and their event-type-dependent attributes in a memory buffer, which is later flushed to disk. At theend of the execution, the events of every process are stored in a separate file. The whole set of files is then subjected toan automatic pattern search, which is outlined in Section 5.
In our earlier paper [24], we introduced an event model to record MPI one-sided communication. Here, we reuse thisevent model, and extend it to accommodate the additional features provided by ARMCI, namely the notify-wait1 andread-modify-write constructs. Fig. 1 illustrates the semantics of the different event types in a timeline diagram. Each call tothe ARMCI application programming interface (API) creates an enter event after entering a function, and an exit event beforeleaving the function. Collective calls, such as ARMCI_Barrier, use the special collective exit event collexit to indicate thatthe function call has collective semantics, which can be exploited during analysis. The call to ARMCI_Fence uses another specialexit event called RMA exit sync to mark its explicit synchronization with another process.
For remote memory operations, the start of the individual operation is recorded directly after signaling the function entry.The model distinguishes between put events for put and accumulate, get events for get, and rmw events for read-modify-write operations. For each of these operations, two distinct events are defined to mark their beginning and their end. Forthe blocking interface, start and end event are both enclosed in the same region instance (e.g., get from D to C in Fig. 1).
1 The analysis of waiting times using notify-wait synchronization is not the subject of this paper and is mentioned here only for the sake of completeness.

Fig. 1. Type and location of events used to model ARMCI communication.
M.-A. Hermanns et al. / Parallel Computing 39 (2013) 132–145 135
For the non-blocking interface, the start event is recorded during the initiating call, whereas the event marking the end of theoperation is recorded during the completion call that actually completes the operation (e.g., non-blocking get from B to A inFig. 1). This effectively models the operation as occuring within its completion interval at the origin. For put and accumulatecalls this might denote the time when the operation is also completed at the target. Completion at the target is currently notexplicitly modeled. However, when considering the performance of put and accumulate calls, only the completion at theorigin is relevant. The call to fence generates its own events along with the necessary synchronization information.
We instrumented the calls to the ARMCI library using a performance tool interface similar to that available for theMessage Passing Interface (MPI) [25]. With the introduction of Global Arrays 5.0, the underlying ARMCI communicationlibrary provides two symbols for every API call.2 The weak symbol with the prefix ARMCI can be overridden by an interposedmeasurement library that provides the measurement instrumentation. A strong symbol with the prefix PARMCI is available tobe used in the interposed wrappers to call the original library routines. This interface enables software tools to create wrappersfor each ARMCI API call to track the individual parameters the application uses when calling ARMCI.
4. The Wait for Progress pattern
The Wait for Progress pattern describes the waiting time on the origin process due to untimely progress on the target pro-cess. We define the waiting time for calls with a single target, as shown in Fig. 2(a), as the timespan between the enter eventof the ARMCI call on the origin and the enter event of the first potentially advancing function call on the target side. For theBlue Gene/P platform, we assume any call to ARMCI and MPI to be capable of advancing an ongoing communication.
For put operations the situation is slightly different. Here, local completion can be achieved through buffering, or injectionof the message into the network, even if the put operation itself is not necessarily complete at the target location. Therefore,with the given inquiry methods waiting time for the put operation cannot be inferred. However, if the user waits for thecompletion of puts at the target using the non-collective synchronization call ARMCI_AllFence (as shown in Fig. 2(b)), pro-gress-related waiting times can naturally occur.3 We define the waiting time to be the time on the origin process that has nooverlap with the first potentially progressing call on one of the targets it communicates with. The waiting time is therefore notnecessarily a contiguous interval at the beginning of the function call, but can consist of multiple parts. While this may under-estimate the real waiting time, it ensures the time needed for the actual transfer is never assessed as waiting time.
2 Prior to Global Arrays 5.0, we used the GNU binutils to create a similar effect, renaming existing symbols and adding new symbols to the library.3 Note that the fence call is not mandatory for the put completion in ARMCI.

Fig. 2. Wait for Progress inefficiency pattern.
136 M.-A. Hermanns et al. / Parallel Computing 39 (2013) 132–145
Neither the origin nor the targets have the complete view of the timespans involved to compute this pattern directly. Allnecessary timespans are therefore collected at the origin, which then performs the severity computation. We assume thatthe target completes all pending communication whenever it reaches a progress-enabling function. That is, the targetprocess will not split the advancement of a communication between several calls to the higher-level API. This is absolutelyrequired in polling mode, which we consider here, because it would be risky to delay pending remote communicationrequests more than necessary. After all, the target cannot guarantee a timely re-entering of the communication layer tocontinue the progress. Thus, for our progress detection heuristic, only the first occurrence of a region potentially advancingthe communication is included in the evaluation. In situations where the implementation chooses to split the advancementof a message between several calls on the target side, our heuristic will therefore underestimate the waiting time incurred.
Without measurement data from lower communication layers the waiting time inside the ARMCI and MPI layer has to beestimated. Our initial assumption is that the origin process is idle during waiting time not overlapped with remote regions ofits targets. However, we concede that the timespan attributed to waiting time could in principle be used to progress anon-going remote call. Although this is currently not taken into account by our analysis, it could be addressed by two exten-sions. First, in the presence of locally pending non-blocking calls, it can be checked whether the identified waiting time couldpossibly be used for progressing the pending messages. This can be done by an additional request to the target for everytimespan spent in the communication layer, between the initiation of the non-blocking call and its completion. Second, withtracking of local waiting patterns as well as search requests by remote processes, local regions that may progress remotecalls can be identified. In this way, timespans in which the implementation can potentially progress a call of a remote originon the target can be found. Nevertheless, since it is much less complicated, we think that even in its current form ourheuristic will give a valuable indication of the inter-process dependencies and the amount of waiting time induced by them.
5. Replay methodology
The Scalasca trace analyzer [8] searches an event trace, which is distributed across multiple files (i.e., one file per process),in parallel for predefined inefficiency patterns and quantifies their performance impact, such as the amount of waiting timeincurred. This impact is called the severity of the pattern in Scalasca terminology. The pattern definition is usually based onthe relationships between events on two or more processes. To ensure the scalability of the parallel analysis, it is conductedat the same scale (i.e., the same number of processes) as the measurement run. This enables each analyzing process to load asingle local trace into memory and to traverse it simultaneously along with the other processes using a replay infrastructurecalled PEARL [26], a parallel C++ library for high-level event trace access. Forming the backbone of many of the parallel toolsin the Scalasca toolset, it provides random access to the local event trace and abstractions such as links between relatedevents through its event access API. Furthermore, it supplies a sophisticated callback subscription mechanism to triggeractions when seeing specific events during trace traversal. Such triggering events include basic events as defined in the eventmodel as well as higher-level events triggered from within another callback.
The general idea of the replay-based analysis is to traverse the trace file in parallel and to re-enact the recorded commu-nication based on the information available in the trace. When reaching a communication event, information relevant to thedetection and quantification of inefficiency patterns associated with this communication is exchanged using a communica-tion operation of the same class. That is, an MPI point-to-point communication is analyzed using an MPI point-to-pointcommunication, but not necessarily using precisely the same call that was recorded in the trace. This is an important detailto keep in mind when we discuss the analysis of ARMCI operations.
Using similar communication operations for the exchange of event data enables efficient communication, as the commu-nication specific semantics can be leveraged. Collective communication can be used efficiently in the replay, because in thepresence of a correct communication trace the local process can safely call the collective calls, as all other participatingprocesses will also call the operation at the appropriate time. Likewise, with point-to-point communication, a receivingprocess can issue a receive call with the communication parameters obtained from the application trace, as it can rely onthe matching message being sent by the corresponding communication partner. For one-sided communication with passivetarget synchronization, this scheme needed modification, as we will explain later in more detail.

Fig. 3. Data exchange for point-to-point communication during trace analysis.
M.-A. Hermanns et al. / Parallel Computing 39 (2013) 132–145 137
For all communication constructs previously supported by the pattern search [8,23], both processes of the data exchangeare able to rely on local events on both sides of the inter-process relation to trigger the communication needed for the anal-ysis. Even the active target synchronization of MPI one-sided communication involves both processes in each RMA epoch,and therefore enables data exchange regarding the communication within such an epoch.
As an example, Fig. 3 shows how the point-to-point communication pattern Late Sender is analyzed using this replayinfrastructure. The Late Sender pattern describes waiting time at the receiver due to a belated start of the correspondingtransfer at the sender. The send event (S) with the recorded parameters of this transfer is stored in the sender’s local trace,while the receive event (R) is stored in the receiver’s local trace. Both local traces are traversed from beginning to end (left toright in the figure). Upon reaching the send event, the analysis process representing the sender invokes a callback that sendslocal timestamp information to the receiver. Likewise, upon reaching the receive event, the analysis process representing thereceiver invokes a callback that accepts the timestamp information from the sender. After the data has been exchanged (3),the receiver can compute the pattern severity (4) from remote and local timestamp information.
Unfortunately, in the case of one-sided communication constructs that do not involve active participation of the targetprocess, the target trace does not contain any events related to the exchange that could be used to trigger the collectionof local information required to compute the pattern severity. This is due to the fact that only the communication parametersstored at the origin of a one-sided operation are present in the trace.
Another notable characteristic of the Scalasca trace analyzer is that the measured pattern severity needs to be saved at theprocess where it occurred. This requirement is motivated by the memory-footprint reduction that is possible if the processcoordinate of the severity data is implicitly stored. This means that waiting times, regardless of where they are calculatedduring the replay analysis, have to be communicated to the process where they occur before the analysis report is written.For one-sided communication constructs this is the origin process. The complete data needed to calculate the inter-processbehavior, however, are not always locally available at the origin, and the target lacks events to efficiently trigger theexchange of data needed at the origin.
To enable this data exchange in the context of purely one-sided communication, we implemented two request-responseschemes as an extension of Scalasca’s replay engine, which are selected depending on the number of target processesinvolved in the pattern to be analyzed. In the case of a single target, the analyzer employs a lightweight approach, wherea single put operation is needed to send the timestamp information of the origin to the target process. In the case of twoor more target processes, the analyzer employs a full request-response message exchange with more than two communica-tion partners. The latter imposes a stricter synchronization between the origin and its targets. In the following, we elaborateon these data exchange schemes and the necessary infrastructure to enact them.
5.1. Decoupled data exchange
For patterns that involve only a single target process, such as the Wait for Progress pattern inside get (as depicted inFig. 2(a)), accumulate, read-modify-write or fence calls to a single target, the computation of the pattern severity can be splitinto two parts: the request and an aggregated response. As shown in Fig. 4(a), the origin process (1) deposits a request with
Fig. 4. The two one-sided data exchange schemes. The decoupled data exchange is used for a single target. The direct exchange is used for multiple targets.

138 M.-A. Hermanns et al. / Parallel Computing 39 (2013) 132–145
the enter and exit timestamps of the RMA operation in the memory of the target process. Once the request is discovered bythe target process, it (2) searches for a local region capable of advancing the message overlapping with the get or accumulatecall, and (3) directly computes the waiting time from the available information, which is then saved and aggregated on a percall-path basis. At the end of the replay, all aggregated severities are transferred back to their respective origin to be saved inthe final analysis report.
Local progress regions can be any call into the communication layer of the specific platform. For ARMCI, and the presentedmeasurements, we assume all ARMCI and MPI calls to possibly advance the communication. In future developments instru-mentation of the DCMF layer on Blue Gene may also become an option for identification of progress regions.
5.2. Direct data exchange
Fig. 2(b) in Section 4 shows the Wait for Progress pattern for calls with multiple target processes, such as the synchro-nization call ARMCI_AllFence. In this case, the pattern severity cannot be computed remotely, as no process can obtainthe complete view of the pattern with a single data transfer. All necessary timespans are therefore collected at the origin,which then performs the severity computation. Thus, in the direct data exchange, as depicted in Fig. 4(b), the origin process(1) sends requests to all targets involved, which (2) conduct the local search as they would do in the decoupled case. How-ever, instead of computing the severity, each target (3) sends its corresponding timestamp information to the requestingprocess. When all remote timestamps have been received by the origin, it can compute the overall waiting time. To ensuretimeliness of the overall analysis and to reduce propagation of waiting times in the analysis process itself, the origin processcontinues its local replay. The progress callback, discussed in greater detail below, tracks whether all replies to a requesthave arrived and eventually computes the pattern severity.
5.3. Replay infrastructure
To enable the above-mentioned data exchange schemes, the existing replay infrastructure of our toolset had to be ex-tended. First, timely and correct handling of requests and responses had to be ensured in the absence of appropriate triggerson the target side. Secondly, communication buffers had to be provided for use with one-sided communication. Finally, afinalization of the data exchange had to be implemented.
Analogous to the data server in ARMCI, a progress callback was added to Scalasca’s replay infrastructure. This callbackserves as the analysis’s own progress engine—a virtual progress thread—and is multiplexed into the standard replay mech-anism by registering it for all available basic event types. This ensures that the progress callback is called at least once foreach event encountered during the local replay. In case the local analysis process is required to wait, it can do so by repeat-edly triggering the progress callback, to ensure request-response completion, and then checking the condition it is waitingfor again. The main advantage of using a callback instead of periodically calling a specific function to ensure progress of thelocal analysis is that it enables the support of multiple one-sided communication libraries at the same time. As long as all ofthese libraries implement and register their progress callbacks appropriately, their progress is ensured. An example of such acombination would be a one-sided library layered on top of another. Implementation of the progress callback needs to fulfillthe following tasks: (1) provide progress for the one-sided library it analyzes to ensure requests from remote processes areadvanced properly, (2) check for and process requests and responses available in local buffers, and (3) check previouslycached requests and send appropriate responses.
For point-to-point and collective communication, the buffer space can be created ad hoc during the analysis. In ARMCI, aswith many one-sided communication libraries, communication buffers need to be allocated collectively. This implies that allbuffers used to exchange performance-relevant data have to be allocated in advance. Unfortunately, the optimal buffer sizescannot be computed in advance. Moreover, it is not trivial to reallocate additional communication buffers once the localreplay has started, as this can only be facilitated at global synchronization points in the parallel replay. The presence ofadditional global synchronization points other that its start and end, however, cannot be guaranteed in the general case.
The performance advantage of one-sided communication can only be leveraged when all communication parameters areknown to the origin process in advance. Additional queries by the origin process to obtain a remote address that can be usedto exchange the relevant information are usually too costly. Likewise, using a single buffer on the target to be used by multi-ple remote processes will require locks to ensure data integrity. This will again result in degraded communication perfor-mance, as it serializes otherwise unrelated communication operations. Each process therefore obtains the address of anexclusive memory location to exchange data by performing a single atomic read-modify-write operation on its first commu-nication with a specific communication partner. This minimizes the communication and synchronization overhead amongthe processes during the data exchange. Using exclusive memory locations, expensive locking can be avoided completely.In the current implementation, it is guaranteed that each process has an exclusive memory location on every remote processto hold a single request. However, this implies that the memory consumption is bounded by OðpÞ on p processes. To reducememory consumption of our implementation, we plan to reduce the memory footprint to a user-configurable size. The usercan then specify the maximum number of request slots to be reserved for communication. Depending on the application’scommunication pattern, this may then consequently amount to an Oð1Þ memory footprint (e.g., nearest neighbor commu-nication). In cases where it cannot be guaranteed that processes can exclusively access the request slots, the latter need

M.-A. Hermanns et al. / Parallel Computing 39 (2013) 132–145 139
to be protected by locks. The user will then have to trade performance for lower memory consumption, but can however usean application-dependent sweet spot.
To ensure data integrity, a process may only send data to the remote buffer if it can be guaranteed that the remote processhas finished processing the data currently residing in the buffer. Therefore, each process has a local array of flags registeredfor one-sided communication, with one entry for each remote process. As this flag resides on the origin, it can be queriedwith low cost prior to any data transfer. The remote process updates the flag through a one-sided operation (put) after ithas processed the data in its buffers. Depending on the flag, a request or response is sent or buffered (or remains buffered).Each call to the progress callback checks the flags of processes with pending communication, and eventually sends the data.As soon as an analyzer process reaches the finalization of the ARMCI replay, it has to ensure that no other remote processeswill send requests before it can start with its local finalization. This is facilitated through a non-blocking barrier, imple-mented using ARMCI communication. Instead of directly disabling request handling, it initiates the non-blocking barrier,and then continues to alternately notify the progress callback and check for barrier completion. Once the barrier is com-pleted, every process is guaranteed to have reached the finalization phase, and no additional request will be made. Therefore,all processes can then collectively engage in the finalization of the replay.
5.4. Backward replay
Identifying wait states in an application is a first step toward understanding its performance. Automatic identification oftheir root causes is an important next step. In our earlier work, we demonstrated how such a root-cause analysis can be facil-itated for MPI applications using Scalasca’s parallel replay infrastructure [2]. However, to do this the process-local traceshave to be traversed in reverse direction—in a so-called backward replay. The analysis techniques discussed so far in thispaper all employed a forward replay: the parallel traversal of the individual local traces from their first to their last event.Messages are then replayed in the same direction as they were recorded. During a backward replay, the individual localtraces are traversed from their last to their first event, also reversing the flow of messages. That is, a receive event will triggerthe sending of data, while a send event will trigger their receipt.
However, with passive target synchronization, there are no events available to trigger a data transfer in the reverse direc-tion. A backward replay is therefore not directly supported in the current state of implementation. However, in the light ofthe enhanced analysis options it could offer, a backward replay would be highly desirable. To enable this, additional eventswould need to be sent to the target during the forward replay and inserted into the target trace as triggers for backwardcommunication. While the first requirement could be handled by the decoupled data exchange presented here, the efficientevent insertion in data structures optimized for space efficiency and fast serial traversal remains the main obstacle to a one-sided backward replay. As this would imply critical changes to the runtime system of the parallel analyzer, it was unfortu-nately beyond the scope of this work. Nevertheless, it may be a direction for further research.
5.5. Further communication approaches
Instead of replaying the communication step-by-step, re-enacting every communication operation separately, one couldintroduce a bulk replay that accumulates the event data to be exchanged locally and then facilitate the actual exchange onlyin certain intervals using an all-to-all operation. However, this would require well-defined global synchronization points atwhich a self-contained exchange is possible and every process knows that now the exchange must be pursued. While someapplications do perform global synchronization such as ga_sync in regular intervals, this cannot be assumed in the generalcase. Therefore, only the end of the parallel replay is a guaranteed safe point for such a collective data exchange. Aggregatingall communication requests to individual targets across the complete local trace would imply an increased memory footprintroughly proportional to the number of local events. The data exchange techniques presented here are not only architectur-ally simpler, but also much less memory-intensive. With memory requirements independent of the number of events, theyoffer a much better balance between communication and memory costs.
6. Results
We evaluated our infrastructure and the impact of Wait for Progress on Jugene, a 72-rack IBM Blue Gene/P system at theJülich Supercomputing Centre in Germany. It is the installation with the second-highest number of cores and ranks 12th inthe Top500 list of June 2011 [1]. It is composed of 73,728 four-way SMP PowerPC 450d compute nodes, resulting in a total of294,912 cores. The compute nodes run a reduced kernel—the compute node kernel (CNK)—with limited system call function-ality. As mentioned above, one of these limitations is that only a single thread per core can be executed. The Blue Gene/Psystem provides three different execution modes: virtual node, dual node, and SMP. The virtual node mode spawns oneprocess per core, leaving no room for additional threads. The dual node mode spawns two processes, leaving room fortwo more threads, and the SMP mode spawns just one single process per compute node, and three additional threads canbe spawned. We performed our test in the virtual node mode, with interrupts disabled, to investigate the influence of remoteprogress on application behavior in the absence of additional progress threads. A comparison with a version with interruptsenabled was impossible because the support for interrupts in the current ARMCI version was broken.
140 M.-A. Hermanns et al. / Parallel Computing 39 (2013) 132–145
6.1. Matrix multiplication benchmark
We used the SRUMMA algorithm [27] for scalable matrix–matrix multiplication as a test case. The procedure, which isbased on remote memory access, is implemented in Global Arrays to support the multiplication of global arrays. This algo-rithm, invoked as the ga_dgemm call, employs an owner-computes model with each process computing a block of the outputmatrix. The relevant blocks of the input matrices are obtained through non-blocking get operations. The different block-block products are structured to avoid contention from numerous simultaneous get requests directed at a target process.
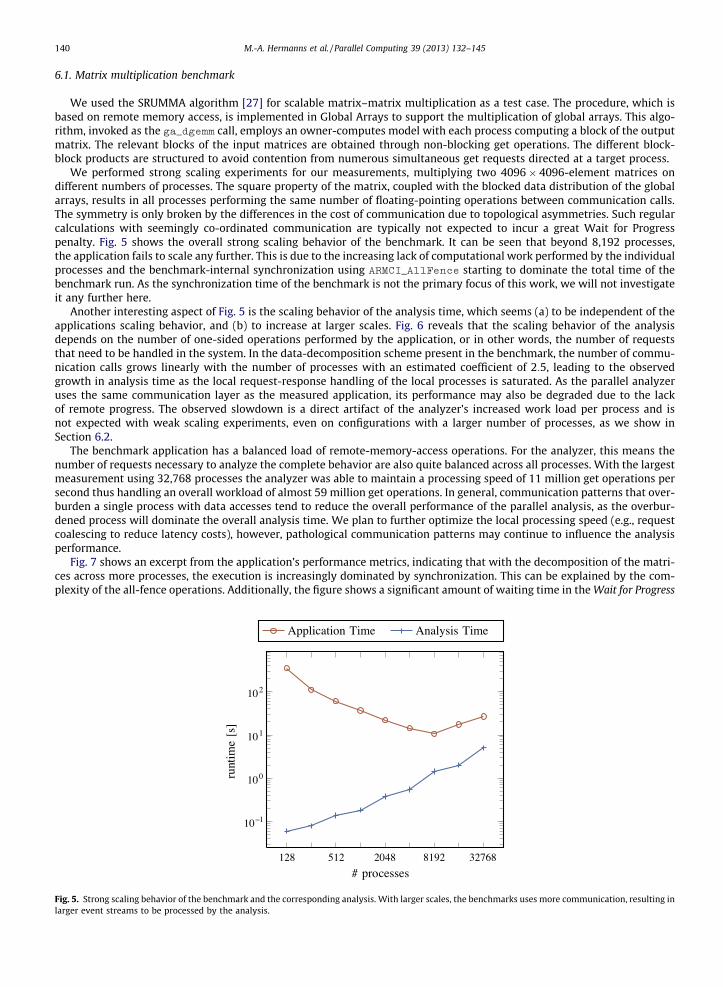
We performed strong scaling experiments for our measurements, multiplying two 4096� 4096-element matrices ondifferent numbers of processes. The square property of the matrix, coupled with the blocked data distribution of the globalarrays, results in all processes performing the same number of floating-pointing operations between communication calls.The symmetry is only broken by the differences in the cost of communication due to topological asymmetries. Such regularcalculations with seemingly co-ordinated communication are typically not expected to incur a great Wait for Progresspenalty. Fig. 5 shows the overall strong scaling behavior of the benchmark. It can be seen that beyond 8,192 processes,the application fails to scale any further. This is due to the increasing lack of computational work performed by the individualprocesses and the benchmark-internal synchronization using ARMCI_AllFence starting to dominate the total time of thebenchmark run. As the synchronization time of the benchmark is not the primary focus of this work, we will not investigateit any further here.
Another interesting aspect of Fig. 5 is the scaling behavior of the analysis time, which seems (a) to be independent of theapplications scaling behavior, and (b) to increase at larger scales. Fig. 6 reveals that the scaling behavior of the analysisdepends on the number of one-sided operations performed by the application, or in other words, the number of requeststhat need to be handled in the system. In the data-decomposition scheme present in the benchmark, the number of commu-nication calls grows linearly with the number of processes with an estimated coefficient of 2:5, leading to the observedgrowth in analysis time as the local request-response handling of the local processes is saturated. As the parallel analyzeruses the same communication layer as the measured application, its performance may also be degraded due to the lackof remote progress. The observed slowdown is a direct artifact of the analyzer’s increased work load per process and isnot expected with weak scaling experiments, even on configurations with a larger number of processes, as we show inSection 6.2.
The benchmark application has a balanced load of remote-memory-access operations. For the analyzer, this means thenumber of requests necessary to analyze the complete behavior are also quite balanced across all processes. With the largestmeasurement using 32,768 processes the analyzer was able to maintain a processing speed of 11 million get operations persecond thus handling an overall workload of almost 59 million get operations. In general, communication patterns that over-burden a single process with data accesses tend to reduce the overall performance of the parallel analysis, as the overbur-dened process will dominate the overall analysis time. We plan to further optimize the local processing speed (e.g., requestcoalescing to reduce latency costs), however, pathological communication patterns may continue to influence the analysisperformance.
Fig. 7 shows an excerpt from the application’s performance metrics, indicating that with the decomposition of the matri-ces across more processes, the execution is increasingly dominated by synchronization. This can be explained by the com-plexity of the all-fence operations. Additionally, the figure shows a significant amount of waiting time in the Wait for Progress
128 512 2048 8192 32768
10−1
100
101
102
# processes
runtime[s]
Application Time Analysis Time
Fig. 5. Strong scaling behavior of the benchmark and the corresponding analysis. With larger scales, the benchmarks uses more communication, resulting inlarger event streams to be processed by the analysis.

128 512 2048 8192 32768
104
105
106
107
108
# processes
Get Operations Get Operations/s
Fig. 6. Total number of get operations in the trace and the processing speed of the analyzer at different scales.
Fig. 7. Breakdown of the time spent within ARMCI during the execution of the SRUMMA benchmark.
M.-A. Hermanns et al. / Parallel Computing 39 (2013) 132–145 141
pattern, which we contrast with actual communication in Fig. 8 at different scales. The dominance of waiting time in com-parison to actual communication is significant. Nonetheless, the overall fraction of waiting time is still low enough that theuse of a dedicated core to run a helper thread is not justified. The severity of the pattern is attenuated slightly at larger scales,as more overall communication increases the probability of a target process immediately providing progress.
Although we expected the impact of remote progress to be visible in our runtime configurations, we were surprised by itsdominance in the ARMCI communication profile. As the application performs a quite regular and equalized amount of work,this is even more surprising, and reinforces our plan to study more irregular applications.
6.2. SOR benchmark
Whereas the matrix multiplication benchmark demonstrated the performance of our analysis under strong scaling, weconducted experiments with the SOR benchmark to investigate its performance under weak scaling. SOR solves the Poissonequation using a red–black successive over-relaxation method. The two main communication steps are halo exchange and

Fig. 8. Percent of waiting time in ARMCI communication.
142 M.-A. Hermanns et al. / Parallel Computing 39 (2013) 132–145
scalar reduction. The former was adapted to use ARMCI get operations instead of the original non-blocking point-to-pointcommunication. The latter still uses MPI collective communication as before. The global domain is a three-dimensional gridof the size Nhoriz � Nhoriz � Nvert , which is partitioned along the two horizontal dimensions using a 2D process mesh. The com-munication pattern of this application is typical of grid-point codes used in earth and environmental sciences.
The solver was configured to create measurements with roughly the same number of events per process, and specificallynot to converge within the predefined maximum number of 1000 iterations. This was needed to reliably evaluate the weak-scaling behavior of our analysis approach.
The time exclusively needed for the replay analysis (i.e., without loading the traces and writing the results, which to-gether took less than 90 s for the 32,768-core run) is reasonably low. As can be seen in Fig. 9, it roughly mimics the overallscaling behavior of the application itself, which is to be expected when using a replay-based approach. At this point, it isworth noting that the time of the replay does not depend on the work load of the application during measurement, but ratherdirectly correlates with the number of communication operations employed during the data exchange. In combination withthe benchmark results of the matrix multiplication, it can be seen that our replay analysis strategy is not bound by the num-ber of processes in the measurement, but rather the number of events generated by each process.
Fig. 9. Weak scaling experiments with an ARMCI-based SOR solver. Due to the communication constructs employed in the benchmark the analyzer onlyuses the decoupled exchange algorithm.

Fig. 10. Performance analysis report on a simulation run of NWChem using the SiOSi3 input conducted on 4096 cores.
M.-A. Hermanns et al. / Parallel Computing 39 (2013) 132–145 143
6.3. NWChem
As a third test case, we investigated the NWChem [28] framework for computational chemistry. We performed a densityfunctional theory (DFT) calculation on the SiOSi3 input. DFT is a widely used single-determinant approach to the many-elec-tron problem [29–31]. All integral evaluations were performed using the direct method, and the Fock matrix was constructedusing the distributed data approach [32].
The NWChem framework exhibits a vast amount of call paths in this experiment. To keep the overhead and trace size in amanageable range, we disabled all user function instrumentation at runtime, recording a rather flat call tree, as can be seenin the middle pane of the report browser, as shown in Fig. 10. In the left pane, the major source of waiting time is a com-putational imbalance at global synchronization points. Although the Wait for Progress inefficiency pattern described in thiswork is not a major part of the overall waiting time in the presented NWChem measurement, it still has a significant influ-ence on the one-sided communication employed in Global Arrays. In this example, it accounts for 20 percent of the ARMCIcommunication time, which is used for the one-sided data accesses. Fig. 10 also reveals that the attributed waiting time issparsely scattered across the processes. It is likely that these highly irregular waiting times induce imbalances which them-selves lead to further waiting times—a possibility that should be subject of a more detailed investigation of NWChemperformance.
7. Conclusion
We extended the Scalasca trace-analysis infrastructure to investigate the performance of purely one-sided applicationsusing a scalable trace-replay methodology. We presented two novel techniques for the efficient exchange of relevant infor-mation during the replay of one-sided communication traces, overcoming the problem of communication operations notbeing reflected in the target-local trace. We furthermore demonstrated the usability and scalability of our extended infra-structure using three applications based on Global Arrays, a global-address-space library, and its one-sided communicationsubstrate ARMCI, respectively. With up to 32,768 processes, we were able to measure a previously unstudied inefficiencypattern related to the absence of remote progress, which can occur in some configurations of today’s massively parallel sys-tems. Our findings revealed a significant impact of stalled remote progress on the one-sided communication of the measuredapplications, both in smaller benchmarks as well as in the NWChem computational chemistry application [28].
Our results encourage us to study this phenomenon in NWChem with further data sets in pursuit of a generic optimiza-tion potential which is independent of the input. On a general level, our techniques can be helpful in examining the com-

144 M.-A. Hermanns et al. / Parallel Computing 39 (2013) 132–145
munication behavior of other one-sided communication libraries used in the runtime components of partitioned global-ad-dress-space languages such as Unified Parallel C [33] or Co-Array Fortran [34]. Combined with measurement data obtainedthrough the GASP interface [12], we would like to enable the investigation of such languages on a very large scale. Further-more, we plan to optimize our implementation, focusing on higher throughput of analyzed one-sided operations to compen-sate for the effects of uneven analysis workloads. Finally, we intend to use our measurement technique to better understandthe circumstances under which alternative progress mechanisms such as a thread running on a dedicated core or interruptswill deliver better or poorer performance.
Acknowledgments
This work was supported in part by the Extreme Scale Computing Initiative, a Laboratory Directed Research and Devel-opment Program at Pacific Northwest National Laboratory. The Pacific Northwest National Laboratory is operated for the U.S.Department of Energy by the Battelle Memorial Institute under Contract DE-AC06-76RLO-1830.
References
[1] H. Meuer, E. Strohmaier, J. Dongarra, H. Simon, The Top500 list, 2011, Electronically published at <http://www.top500.org/lists/2011/06>.[2] D. Böhme, M. Geimer, F. Wolf, L. Arnold, Identifying the root causes of wait states in large-scale parallel applications, in: Proceedings of the 39th
International Conference on Parallel Processing (ICPP), IEEE Computer Society, San Diego, CA, USA, 2010, pp. 90–100.[3] MPI Forum, MPI: A Message-Passing Interface Standard, Version 2.2, MPI Forum, 2009, Available at: <http://www.mpi-forum.org/>.[4] J. Nieplocha, V. Tipparaju, M. Krishnan, D.K. Panda, High performance remote memory access communication: the ARMCI approach, Int. J. High
Perform. Comput. Appl. 20 (2006) 233–253.[5] J. Nieplocha, R.J. Harrison, R.J. Littlefield, Global Arrays: a nonuniform memory access programming model for high-performance computers, J.
Supercomput. 10 (1996) 169–189.[6] J. Labarta, S. Girona, V. Pillet, T. Cortes, L. Gregoris, Dip: a parallel program development environment, in: L. Bougé, P. Fraigniaud, A. Mignotte, Y. Robert
(Eds.), Euro-Par’96 Parallel Processing, Lecture Notes in Computer Science, vol. 1124, Springer, Berlin/Heidelberg, 1996, pp. 665–674, http://dx.doi.org/10.1007/BFb0024763.
[7] W.E. Nagel, A. Arnold, M. Weber, H.C. Hoppe, K. Solchenbach, VAMPIR: visualization and analysis of MPI resources, Supercomputer 12 (1996)69–80.
[8] M. Geimer, F. Wolf, B.J.N. Wylie, B. Mohr, Scalable parallel trace-based performance analysis, in: Proceedings of the 13th European PVM/MPI Users’Group Meeting (EuroPVM/MPI), Lecture Notes in Computer Science, vol. 4192, Springer, Bonn, Germany, 2006, pp. 303–312.
[9] S.S. Shende, A.D. Malony, The TAU parallel performance system, International Journal of High Performance Computing Applications 20 (2006)287–311.
[10] A. Leko, H.-H. Su, D. Bonachea, B. Golden, M. Billingsley III, A.D. George, Parallel Performance Wizard: a performance analysis tool for partitionedglobal-address-space programming models, in: SC ’06: Proceedings of the 2006 ACM/IEEE Conference on Supercomputing, ACM, New York, NY, USA,2006, p. 186.
[11] B.J.N. Wylie, M. Geimer, B. Mohr, D. Böhme, Z. Szebenyi, F. Wolf, Large-scale performance analysis of Sweep3D with the Scalasca toolset, ParallelProcessing Letters 20 (2010) 397–414.
[12] A. Leko, D. Bonachea, H.-H. Su, A.D. George, GASP: a performance analysis tool interface for global address space programming models, TechnicalReport LBNL-61606, Lawrence Berkeley National Lab, 2006, Version 1.5 (09/14/2006).
[13] D. Bonachea, GASNet specification, v1.1, Technical Report, University of California, Berkeley, 2002.[14] The Quadrics SHMEM manual, 2004, Electronically available at <http://downloads.hpc.vega.co.uk/documentation/ShmemMan6.pdf>.[15] L.V. Kalé, S. Kumar, G. Zheng, C. Lee, Scaling molecular dynamics to 3000 processors with projections: a performance analysis case study, in: P. Sloot, D.
Abramson, A. Bogdanov, Y. Gorbachev, J. Dongarra, A. Zomaya (Eds.), Computational Science — ICCS 2003, volume 2660 of Lecture Notes in ComputerScience, Springer, Berlin, Heidelberg, 2003,pp. 23–32.
[16] T. Jones, R. Dimitrov, K. Rajaram, K. Mohror, MPI PERUSE: an MPI extension for revealing unexposed implementation information, Technical Report,Lawrence Livermore National Laboratory, 2006.
[17] B. Mohr, J.L. Träff, J. Worringen, J. Dongarra (Eds.), Recent Advances in Parallel Virtual Machine and Message Passing Interface, 13th European PVM/MPI User’s Group Meeting, Lecture Notes in Computer Science, vol. 4192, Springer, Bonn, Germany, 2006.
[18] W. Williams, T. Hoel, D. Pase, The MPP apprentice performance tool: delivering the performance of the Cray T3D, in: Programming Environments forMassively Parallel Distributed Systems, Birkhäuser Verlag, 1994, pp. 334–345.
[19] Cray Inc. Cray application developer’s environment user’s guide. Manual, Cray Inc., May 2012.[20] J.R. Hammond, S. Krishnamoorthy, S. Shende, N.A. Romero, A.D. Malony, Performance characterization of global address space applications: a case
study with NWChem., Concurrency and Computation: Practice and Experience 24 (2012) 135–154.[21] P. Balaji, A. Chan, W. Gropp, R. Thakur, E. Lusk, The importance of non-data-communication overheads in MPI, International Journal of High
Performance Computing Applications 24 (2010) 5–15.[22] M. Geimer, F. Wolf, B.J.N. Wylie, B. Mohr, A scalable tool architecture for diagnosing wait states in massively parallel applications, Parallel Computing
35 (2009) 375–388.[23] M.-A. Hermanns, M. Geimer, B. Mohr, F. Wolf, Scalable detection of MPI-2 remote memory access inefficiency patterns, in: Proceedings of the
16th European PVM/MPI Users’ Group Meeting (EuroPVM/MPI), Lecture Notes in Computer Science, vol. 5759, Springer, Espoo, Finland, 2009, pp. 31–41.
[24] M.-A. Hermanns, B. Mohr, F. Wolf, Event-based measurement and analysis of one-sided communication, in: Proceedings of the 11th Euro-ParConference, Lecture Notes in Computer Science, vol. 3648, Springer, Lisboa, Portugal, 2005, pp. 156–165.
[25] MPI Forum, Profiling Interface, in: [3], pp. 453–458, Dec. 2009, Available at: <http://www.mpi-forum.org/>.[26] M. Geimer, F. Wolf, A. Knüpfer, B. Mohr, B.J.N. Wylie, A parallel trace-data interface for scalable performance analysis, in: Proceedings of the 8th
International Workshop on State-of-the-Art in Scientific and Parallel Computing (PARA), Lecture Notes in Computer Science, vol. 4699, Springer, Umeå,Sweden, 2006, pp. 398–408.
[27] M. Krishnan, J. Nieplocha, SRUMMA: a matrix multiplication algorithm suitable for clusters and scalable shared memory systems, in: Parallel andDistributed Processing Symposium, 2004. Proceedings 18th International, p. 70.
[28] M. Valiev et al, NWChem: a comprehensive and scalable open-source solution for large scale molecular simulations, Computer PhysicsCommunications 181 (2010) 1477–1489.
[29] W. Kohn, L.J. Sham, Self-consistent equations including exchange and correlation effects, Physical Review 140 (1965) A1133–A1138.[30] R.G. Parr, W. Yang, Density-Functional Theory of Atoms and Molecules, Oxford University Press, Inc., New York, 1989.

M.-A. Hermanns et al. / Parallel Computing 39 (2013) 132–145 145
[31] J.P. Perdew, K. Schmidt, Jacob’s ladder of density functional approximations for the exchange-correlation energy, AIP Conference Proceedings 577(2001) 1–20.
[32] R.J. Harrison et al, Toward high-performance computational chemistry: II. A scalable self-consistent field program, Journal of Computational Chemistry17 (1996) 124–132.
[33] UPC Language Specification, 1.2 edition, 2005.[34] J. Reid, Coarrays in the next fortran standard, SIGPLAN Fortran Forum 29 (2010) 10–27.