Embed Size (px)
Citation preview

A SAMPLE OF PUBLIC REVENUES AND ECONOMIC
IMPACTS OF VARIOUS LAND-USES ALONG THE
RICHMOND HIGHWAY CORRIDOR IN FAIRFAX
COUNTY, VIRGINIA: 2009, 2013 AND 2014
Prepared for
Southeast Fairfax Development Corporation
Alexandria, Virginia
Prepared by
Dean D. Bellas, Ph.D.
President
Urban Analytics, Inc.
Alexandria, Virginia
December 9, 2014

A Sample of Public Revenues and Economic Impacts of Various Land-Uses along the Richmond Highway Corridor in Fairfax County, Virginia: 2009, 2013 and 2014 (December 9, 2014)
Urban Analytics, Inc. – Alexandria, Virginia (www.UrbanAnalytics.com) Page 2
Table of Contents
Executive Summary .............................................................................................................3
Public Revenues .......................................................................................................3
Economic Impacts ....................................................................................................4
Analysis of Various Residential and Non-residential Land-Uses ........................................5
Public Revenues to Fairfax County, Virginia ....................................................................13
Public Revenue Analysis Model ............................................................................14
Public Revenue Analysis Findings ........................................................................15
Economic Impacts to Fairfax County, Virginia .................................................................15
Annual Economic Impacts from Household Spending ..........................................15
Data Limitations.................................................................................................................16
Appendix
Contact Information ...........................................................................................................17
List of Tables and Charts
Table 1: Public Revenues Summary (Fiscal Year 2013) .....................................................3
Table 2: Economic Impact Summary (2013) .......................................................................4
Table 3: Residential Land-Use Data (Transactional Only): 2009, 2013, 2014 ...................6
Table 4: Selected Population, Housing and Income Characteristics ...................................7
Table 5: Household Income Characteristics Inflation-Adjusted to 2014 dollars .................9
Table 6: Non-residential Land-Use Data: 2009, 2013, 2014 .............................................11
Table 7: Non-residential Assessment Data: 2009, 2013, 2014 ..........................................12
Appendix Table A-1: Annual Economic Impact of Household Spending (2009) .............19
Appendix Table A-2: Annual Economic Impact of Household Spending (2013) .............20
Appendix Table A-3: Annual Economic Impact of Household Spending (2014) .............21
Appendix Table A-4: Personal Consumption Expenditure Price Index (2009 = 100) ......22
Appendix Table B-1: Revenues by Source Multipliers – Fairfax County, VA .................23
Chart 1: Economic Impact of Residential Land-Uses (% Contribution) .............................5
Chart 2: Nominal vs. Inflation-adjusted Household Income (adjusted to 2014 dollars) ...10
Chart 3: Nominal vs. Inflation-adjusted Non-residential Assessment Data ......................13

A Sample of Public Revenues and Economic Impacts of Various Land-Uses along the Richmond Highway Corridor in Fairfax County, Virginia: 2009, 2013 and 2014 (December 9, 2014)
Urban Analytics, Inc. – Alexandria, Virginia (www.UrbanAnalytics.com) Page 3
Executive Summary
In this report, the findings of a public revenues and economic impact analysis prepared to
quantify the potential gross benefits to Fairfax County from various land uses located in and
around the Richmond Highway Corridor are presented. The findings presented in this report
indicate that these land-uses contribute to the vitality of the Fairfax County economy.
Public Revenues
In Fiscal Year 2013, Fairfax County collected almost $3.5 billion in general fund operating
revenues from various sources including taxes, non-tax revenues, and intergovernmental
transfers. Of this $3.5 billion in operating revenues, $3.1 billion was generated from the nine
categories listed in Table 1. An analysis of 1,410 housing units and 5,514,132 square feet of
non-residential space in and along the Richmond Highway Corridor indicates that these land-
uses generate $30.9 million (or one percent of total County revenues) annually. These public
revenues are summarized in Table 1.
Table 1
Public Revenues Summary (Fiscal Year 2013)
Residential and Non-residential Land-Uses1
In and Around the Richmond Highway Corridor
Fairfax County, Virginia
Estimated Public Revenues Generated from:
Single-Family Townhouse Condominium Non-residential
Public Revenue Category Units Units Units Space Total
1 Real Estate 5,222,317$ 1,240,880$ 532,217$ 13,490,602$ 20,486,016$
2 Personal Property 394,160$ 166,714$ 105,121$ 2,941,418$ 3,607,413$
3 Sales and Use Taxes 429,377$ 181,609$ 114,513$ 1,058,237$ 1,783,736$
4 Utilities (Consumer) 31,548$ 13,343$ 8,414$ 590,494$ 643,799$
5 BPOL -$ -$ -$ 3,147,477$ 3,147,477$
6 Other Local Taxes 42,073$ 17,795$ 11,221$ 264,776$ 335,865$
7 Licenses, Fees, Permits 51,351$ 21,720$ 13,695$ 211,774$ 298,540$
8 Fines & Forfeitures 22,588$ 9,554$ 6,024$ 71,045$ 109,211$
9 Charges for Services 115,815$ 48,985$ 30,887$ 285,613$ 481,300$
Total 6,309,229$ 1,700,600$ 822,092$ 22,061,436$ 30,893,357$
Source:
Urban Analytics, Inc.
Note:1 See Tables 3 and 6 in the report (with accompanying text) for a complete discussion of land-uses analyzed.
A Sample of Public Revenues and Economic Impacts of Various Land-Uses along the Richmond Highway Corridor in Fairfax County, Virginia: 2009, 2013 and 2014 (December 9, 2014)
Urban Analytics, Inc. – Alexandria, Virginia (www.UrbanAnalytics.com) Page 4
The findings from the residential units in Table 1 is based on a smple of 1,410 housing units.
If a public revenues analysis had been conducted for all 40,830 housing units in and around
the Richmond Highway Corridor, the findings from the residential component would have
been substantially higher.
Economic Impacts
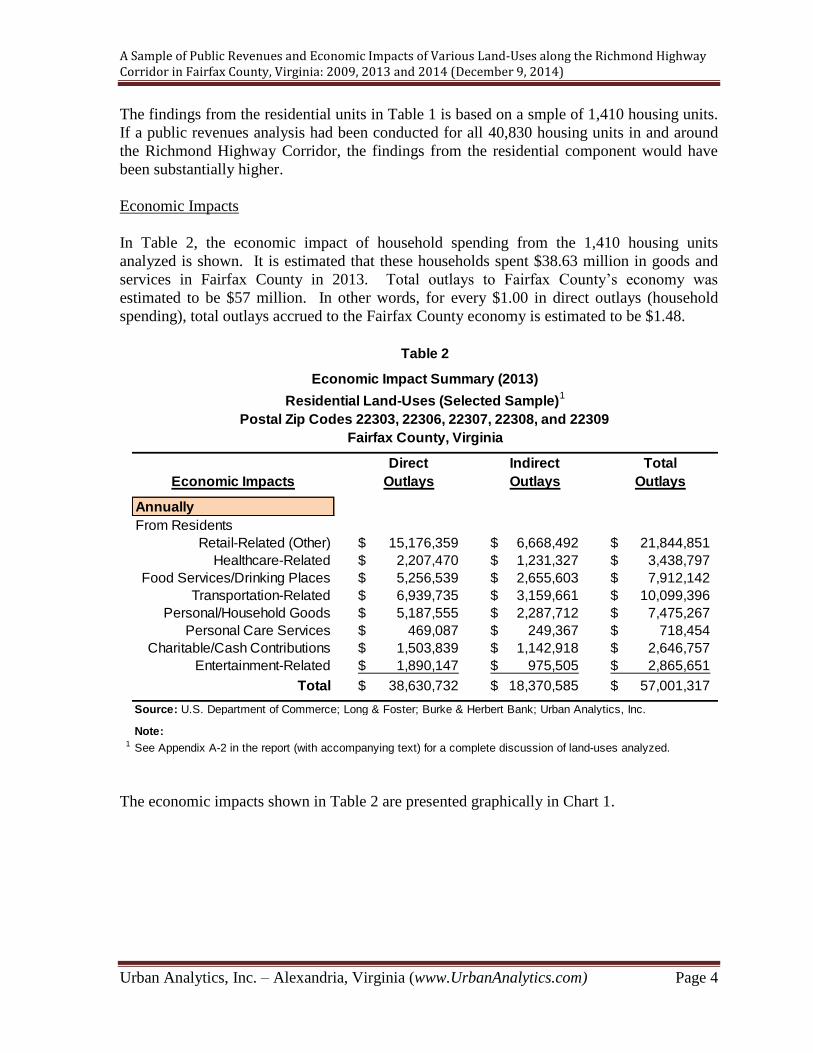
In Table 2, the economic impact of household spending from the 1,410 housing units
analyzed is shown. It is estimated that these households spent $38.63 million in goods and
services in Fairfax County in 2013. Total outlays to Fairfax County’s economy was
estimated to be $57 million. In other words, for every $1.00 in direct outlays (household
spending), total outlays accrued to the Fairfax County economy is estimated to be $1.48.
The economic impacts shown in Table 2 are presented graphically in Chart 1.
Table 2
Economic Impact Summary (2013)
Residential Land-Uses (Selected Sample)1
Postal Zip Codes 22303, 22306, 22307, 22308, and 22309
Fairfax County, Virginia
Direct Indirect Total
Economic Impacts Outlays Outlays Outlays
Annually
From Residents
Retail-Related (Other) 15,176,359$ 6,668,492$ 21,844,851$
Healthcare-Related 2,207,470$ 1,231,327$ 3,438,797$
Food Services/Drinking Places 5,256,539$ 2,655,603$ 7,912,142$
Transportation-Related 6,939,735$ 3,159,661$ 10,099,396$
Personal/Household Goods 5,187,555$ 2,287,712$ 7,475,267$
Personal Care Services 469,087$ 249,367$ 718,454$
Charitable/Cash Contributions 1,503,839$ 1,142,918$ 2,646,757$
Entertainment-Related 1,890,147$ 975,505$ 2,865,651$
Total 38,630,732$ 18,370,585$ 57,001,317$
Note:1 See Appendix A-2 in the report (with accompanying text) for a complete discussion of land-uses analyzed.
Source: U.S. Department of Commerce; Long & Foster; Burke & Herbert Bank; Urban Analytics, Inc.

A Sample of Public Revenues and Economic Impacts of Various Land-Uses along the Richmond Highway Corridor in Fairfax County, Virginia: 2009, 2013 and 2014 (December 9, 2014)
Urban Analytics, Inc. – Alexandria, Virginia (www.UrbanAnalytics.com) Page 5
Source: Urban Analytics, Inc.
Just as a rising tide lifts all boats, future economic development strategies for the Richmond
Highway Corridor should encompass a wide range of programs and efforts to bolster
aggregate income across all land uses, both residential and non-residential. While the Retail
sector has remained steady at about 71 percent of the non-residential land-use base from
2009 – 2014, economic development efforts to diversify this base are strongly encouraged.
In addition to new office and hotel space, market-rate residential land uses (single-family,
town houses, condominiums, and apartments) in and around the Richmond Highway
Corridor can be a significant source of new aggregate income to this area of Fairfax County.
Analysis of Various Residential and Non-residential Land-Uses
Residential land-uses in postal zip codes 22303, 22306, 22307, 22308, and 22309 were
analyzed for the years 2009, 2013 and 2014. Residential land-uses analyzed were limited to
transactional (re-sale) data only. Although there was new residential construction in these
zip codes, the data available for analysis were limited both in number (14 units in 2009, 15
units in 2013, and 3 units in 2014) and in price point (all new residential construction was
priced between $1,000,000 and $1,500,000). These newly constructed units did not reflect
the overall market characteristics of housing in the five zip codes. Additionally, while new
apartment building construction occurred during this time period (as well as renovations of
existing apartment buildings), the data were limited in terms of number, value, unit size, and
0% 10% 20% 30% 40% 50% 60% 70% 80% 90% 100%
Retail-Related (Other)
Healthcare-Related
Food Services/Drinking Places
Transportation-Related
Personal/Household Goods
Personal Care Services
Charitable/Cash Contributions
Entertainment-Related
Total
Chart 1Economic Impact of Residential Land-uses (% Contribution)
Postal Zip Codes 22303, 22306, 22307, 22308 & 22309Fairfax County, Virginia
Direct Outlays Indirect Outlays Total Outlays
A Sample of Public Revenues and Economic Impacts of Various Land-Uses along the Richmond Highway Corridor in Fairfax County, Virginia: 2009, 2013 and 2014 (December 9, 2014)
Urban Analytics, Inc. – Alexandria, Virginia (www.UrbanAnalytics.com) Page 6
rental rates; thus, limiting the ability to draw statistically significant conclusions.1
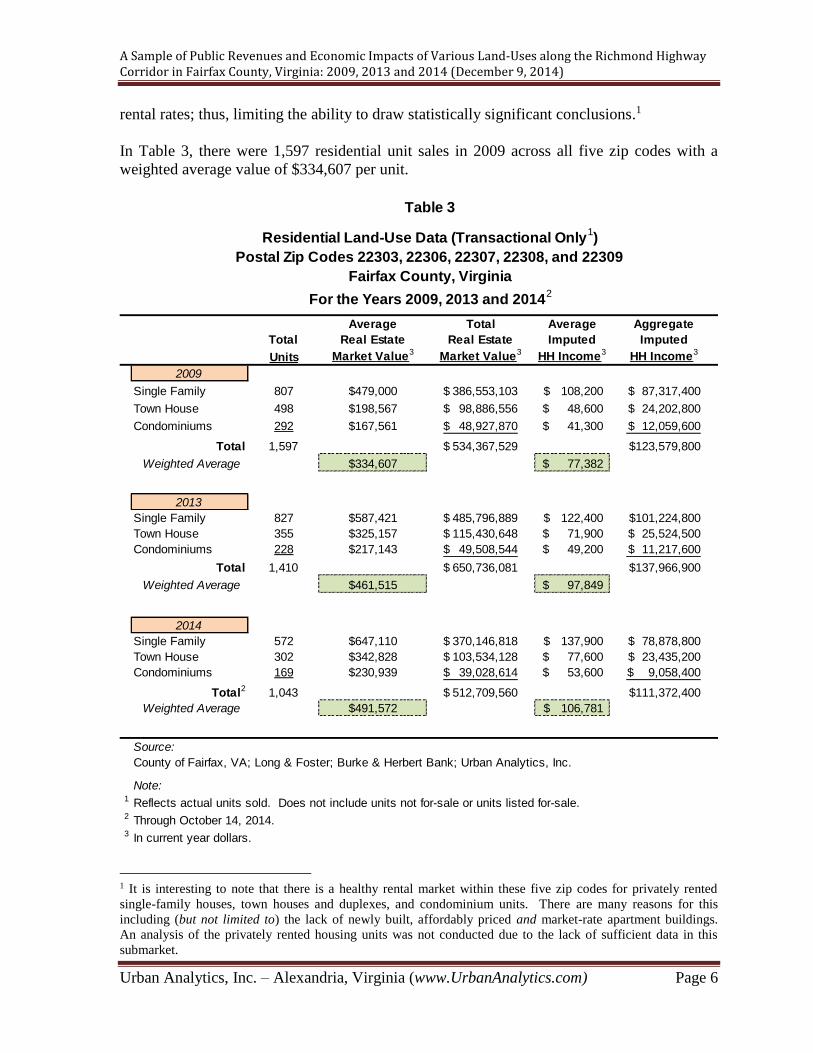
In Table 3, there were 1,597 residential unit sales in 2009 across all five zip codes with a
weighted average value of $334,607 per unit.
1 It is interesting to note that there is a healthy rental market within these five zip codes for privately rented
single-family houses, town houses and duplexes, and condominium units. There are many reasons for this
including (but not limited to) the lack of newly built, affordably priced and market-rate apartment buildings.
An analysis of the privately rented housing units was not conducted due to the lack of sufficient data in this
submarket.
Table 3
Residential Land-Use Data (Transactional Only1)
Postal Zip Codes 22303, 22306, 22307, 22308, and 22309
Fairfax County, Virginia
For the Years 2009, 2013 and 20142
Average Total Average Aggregate
Total Real Estate Real Estate Imputed Imputed
Units Market Value3 Market Value3 HH Income3 HH Income3
2009
Single Family 807 $479,000 386,553,103$ 108,200$ 87,317,400$
Town House 498 $198,567 98,886,556$ 48,600$ 24,202,800$
Condominiums 292 $167,561 48,927,870$ 41,300$ 12,059,600$
Total 1,597 534,367,529$ 123,579,800$
Weighted Average $334,607 77,382$
2013
Single Family 827 $587,421 485,796,889$ 122,400$ 101,224,800$
Town House 355 $325,157 115,430,648$ 71,900$ 25,524,500$
Condominiums 228 $217,143 49,508,544$ 49,200$ 11,217,600$
Total 1,410 650,736,081$ 137,966,900$
Weighted Average $461,515 97,849$
2014
Single Family 572 $647,110 370,146,818$ 137,900$ 78,878,800$
Town House 302 $342,828 103,534,128$ 77,600$ 23,435,200$
Condominiums 169 $230,939 39,028,614$ 53,600$ 9,058,400$
Total2 1,043 512,709,560$ 111,372,400$
Weighted Average $491,572 106,781$
Source:
County of Fairfax, VA; Long & Foster; Burke & Herbert Bank; Urban Analytics, Inc.
Note:1 Reflects actual units sold. Does not include units not for-sale or units listed for-sale.2 Through October 14, 2014.3 In current year dollars.

A Sample of Public Revenues and Economic Impacts of Various Land-Uses along the Richmond Highway Corridor in Fairfax County, Virginia: 2009, 2013 and 2014 (December 9, 2014)
Urban Analytics, Inc. – Alexandria, Virginia (www.UrbanAnalytics.com) Page 7
By 2013, sales had declined to 1,410 units but the weighted average value increased to
$461,515. For the first ten months of 2014, there were 1,043 recorded transactions at a
weighted average value of $491,572 per unit.
In Table 4, the median household income across all five zip codes during the 2008-2012
period was estimated to be $86,831 (in 2012 dollars). When adjusted for inflation to constant
2014 dollars, the median household income across all five zip codes was $89,582 (see Table
5). As the recession ended in 2009, the weighted average imputed household income needed
to purchase housing in 2009 was $84,630 (inflation-adjusted to 2014 dollars), slightly less
than the weighted average income of $89,582 across these five zip codes (see Table 5). This
reflected lower pricing opportunities for housing (as well as declining 30-year fixed-rate
mortgage interest rates) in the five zip codes immediately after the 2007-2009 national
recession.
However, by 2013, housing values had increased at a rate greater than the rate of inflation in
these zip codes and newcomers to the area required a minimum weighted average household
income of $99,766 (in 2014 dollars) to purchase housing in 2013 (see Table 5). By 2014, the
minimum weighted average household income needed to purchase housing in the five zip
codes increased to $106,781.
Table 4
Selected Population, Housing and Income Characteristics
Postal Zip Codes 22303, 22306, 22307, 22308, and 22309
Selected Years
Selected Characteristics 22303 22306 22307 22308 22309 Total
1 Total Population 12,601 32,326 9,581 12,737 33,220 100,4651 Total Population in Households (HH) 12,601 32,130 9,561 12,640 33,185 100,1171 Total Housing Units 6,858 12,312 4,655 4,741 12,264 40,8301 Total Occupied Housing Units 6,234 11,734 4,417 4,610 11,614 38,609
Average HH Size 2.0213 2.7382 2.1646 2.7419 2.8573 2.5931
Percent of Total Population in HH 12.59% 32.09% 9.55% 12.63% 33.15% 100.00%
2 Median Household Income (MHI)3,4 $76,950 $59,243 $103,026 $161,953 $83,092 $86,8312 Total Household Base for MHI 6,360 11,644 4,514 4,683 10,917 38,118
Aggregate HH Income3 $489,402,000 $689,825,492 $465,059,364 $758,425,899 $907,115,364 $3,309,828,119
Percent of Aggregate HH Income 14.79% 20.84% 14.05% 22.91% 27.41% 100.00%
Source - Data:1
2
Source - Table Construction and Data Analysis:
Urban Analytics, Inc.
Note:3 In constant 2012 dollars.4 Total reflects weighted-average median household income.
U.S. Census. DP-1 Profile of General Population and Housing Characteristics: 2010 Demographic Profile Data.
U.S. Census. DP03 Selected Economic Characteristics. 2008-2012 American Community Survey 5-Year Estimates (in 2012
inflation-adjusted dollars).
A Sample of Public Revenues and Economic Impacts of Various Land-Uses along the Richmond Highway Corridor in Fairfax County, Virginia: 2009, 2013 and 2014 (December 9, 2014)
Urban Analytics, Inc. – Alexandria, Virginia (www.UrbanAnalytics.com) Page 8
As can be seen in Table 4, aggregate household income in the five zip codes was estimated to
be $3.31 billion (in 2012 inflation-adjusted dollars). Of this $3.31 billion in aggregate
household income, $907 million (or 27.41 percent) was generated by the residents living
within the postal zip code area 22309, followed by residents living within zip code 22308
(22.91 percent), and residents living within zip code 22306 (20.84 percent). While the
residents living within postal zip code 22308 had the highest median household income at
$161,953 and residents living within postal zip code 22307 had the second highest median
household income ($103,026), the residents in these two zip codes only accounted for
slightly under 37 percent of aggregate household income in the five zip codes. Alternatively
stated, residents living within postal zip codes 22303, 22306 and 22309 generated slightly
more than 63 percent of the $3.31 billion in aggregate household income in and around the
Richmond Highway Corridor. The data shown in Table 4 help to explain the current mix and
type of retail land-uses currently existing along the Richmond Highway Corridor.2
2 The findings presented in Table 4 do not reflect or explain current spatial (geographical) household spending
patterns for retail goods and services. The concept of “if you build it, they will come” is not applicable. The
findings in this table simply suggest the relationship between the current mix in number and type of national
and regional retailers located along the Richmond Highway Corridor and the quantity of household income
(“rooftops”) in and around the Richmond Highway Corridor. As the level of aggregate household income
changes in the future (up or down), so will the mix in the number and type of retail establishments, goods and
services along the Corridor.

A Sample of Public Revenues and Economic Impacts of Various Land-Uses along the Richmond Highway Corridor in Fairfax County, Virginia: 2009, 2013 and 2014 (December 9, 2014)
Urban Analytics, Inc. – Alexandria, Virginia (www.UrbanAnalytics.com) Page 9
Nominal and inflation-adjusted weighted average household incomes needed to purchase
housing across all postal zip codes are graphically shown in Chart 2. Weighted average
housing values for all transactional sales for the years 2009, 2013 and 2014 are shown in
Table 3. Nominal weighted average household incomes are estimated for each year and are
subject to mortgage financing conditions such as rate, term, debt-to-income ratio, real estate
taxes, and hazard insurance.
Table 5
Household Income Characteristics Inflation-Adjusted to 2014 dollars
Postal Zip Codes 22303, 22306, 22307, 22308, and 22309
Selected Years
Selected Characteristics 22303 22306 22307 22308 22309 Total
Reported in 2012 dollars1 Median Household Income (MHI)2 $76,950 $59,243 $103,026 $161,953 $83,092 $86,8311 Total Household Base for MHI 6,360 11,644 4,514 4,683 10,917 38,118
Aggregate HH Income $489,402,000 $689,825,492 $465,059,364 $758,425,899 $907,115,364 $3,309,828,119
Percent of Aggregate HH Income 14.79% 20.84% 14.05% 22.91% 27.41% 100.00%
Adjusted to 2014 dollars
Median Household Income (MHI)2 $79,388 $61,120 $106,290 $167,083 $85,724 $89,582
Total Household Base for MHI 6,360 11,644 4,514 4,683 10,917 38,118
Aggregate HH Income $504,904,570 $711,676,788 $479,790,843 $782,450,219 $935,849,654 $3,414,672,074
Percent of Aggregate HH Income 14.79% 20.84% 14.05% 22.91% 27.41% 100.00%
Inflation-Adjusted3 Weighted-Average HH Income Needed to Purchase Housing across all Zip Codes (From Table 3)
2009 dollars $77,382 2014 dollars $84,630
2013 dollars $97,849 2014 dollars $99,766
2014 dollars $106,781 2014 dollars $106,781
Source - Data:1
Source - Table Construction and Data Analysis:
Urban Analytics, Inc.
Note:2 Total reflects weighted-average median household income.3 See Appendix Table A-4 for Personal Consumption Expenditure (PCE) Price Index.
U.S. Census. DP03 Selected Economic Characteristics. 2008-2012 American Community Survey 5-Year Estimates (in 2012
inflation-adjusted dollars).

A Sample of Public Revenues and Economic Impacts of Various Land-Uses along the Richmond Highway Corridor in Fairfax County, Virginia: 2009, 2013 and 2014 (December 9, 2014)
Urban Analytics, Inc. – Alexandria, Virginia (www.UrbanAnalytics.com) Page 10
Source: Urban Analytics, Inc. Note: Inflation-adjusted to constant 2014 dollars.
Non-residential land-use data along the Richmond Highway Corridor are presented in Table
6. In 2009, there was 5,555,506 square feet of existing office, retail and hotel space along the
Corridor.3 Of the 5,555,506 square feet of non-residential space, 1,044,644 square feet (or
18.8 percent) consisted of office space, 3,915,008 square feet (or 70.47 percent) consisted of
retail space, and the remaining 595,854 square feet (or 10.73 percent) consisted of hotel
space.
By 2014, total non-residential space decreased by a net 41,374 square feet to 5,514,132
square feet. Office space decreased to 936,799 square feet (a decrease of 107,845 square feet
from 2009) while hotel space increased to 662,325 square feet (an increase of 66,471 square
feet from 2009). Overall, the total real estate assessed value of all non-residential space
increased 7.29 percent from $1.18 billion in 2009 to $1.27 billion in 2014. On a per square
foot basis, the weighted average assessed value increased from $212.76 per square foot in
2009 to $229.97 per square foot in 2014.
3 There are data inconsistencies among the various data sources reviewed, including the CoStar database, the
Fairfax County Economic Development Authority and Department of Tax Administration databases. There are
also definitional and classification issues in the databases. Within the office and retail space are land-uses
designated as commercial and these land-uses may include light-industrial land uses.
$0 $20,000 $40,000 $60,000 $80,000 $100,000 $120,000
2009
2013
2014
Chart 2Nominal vs. Inflation-adjusted Household IncomeZip Codes 22303, 22306, 22307, 22308 & 22309
Fairfax County, Virginia
Inflation-adjusted Nominal

A Sample of Public Revenues and Economic Impacts of Various Land-Uses along the Richmond Highway Corridor in Fairfax County, Virginia: 2009, 2013 and 2014 (December 9, 2014)
Urban Analytics, Inc. – Alexandria, Virginia (www.UrbanAnalytics.com) Page 11
When current year dollar assessments are adjusted to constant year dollar assessments (the
value of the assessments are adjusted for inflation), a different trend emerges. In Table 7,
inflation-adjusted non-residential data are presented. In 2014 inflation-adjusted dollars, the
total assessed value of the non-residential space analyzed decreased 1.9 percent from $1.29
billion in 2009 to $1.27 billion in 2014.
Table 6
Non-Residential Land-Use Data
Richmond Highway Corridor
Fairfax County, Virginia
For the Years 2009, 2013 and 2014
Total Average
Total Real Estate Assessed
Sq. Ft. % of Total Market Value1 Value/Sq. Ft.1
2009
Office 1,044,644 18.80%
Retail 3,915,008 70.47%
Hotel 595,854 10.73%
Total 5,555,506 100.00% 1,181,987,530$ 212.76$
2013
Office 936,799 16.99%
Retail 3,915,008 71.00%
Hotel 662,325 12.01%
Total 5,514,132 100.00% 1,254,939,720$ 227.59$
2014
Office 936,799 16.99%
Retail 3,915,008 71.00%
Hotel 662,325 12.01%
Total 5,514,132 100.00% 1,268,104,450$ 229.97$
Source:
Note:1 In current year dollars.
County of Fairfax, Virginia Department of Tax Administration and Economic Development
Authority; CoStar; Southeast Fairfax Development Corporation; Urban Analytics, Inc.

A Sample of Public Revenues and Economic Impacts of Various Land-Uses along the Richmond Highway Corridor in Fairfax County, Virginia: 2009, 2013 and 2014 (December 9, 2014)
Urban Analytics, Inc. – Alexandria, Virginia (www.UrbanAnalytics.com) Page 12
Nominal and inflation-adjusted non-residential assessment trends for properties along the
Richmond Highway Corridor are graphically shown in Chart 3. The numbers behind the
trend lines come from Table 7. Current year dollars are inflation-adjusted to constant year
2014 dollars.
Table 7
Non-residential Assessment Data
Richmond Highway Corridor
2009, 2013 and 2014
Total
By Year Assessed Value % Change
Assessed Value (current year dollars)1 Year 2009 in 2009 dollars $1,181,987,5301 Year 2013 in 2013 dollars $1,254,939,720 6.17%1 Year 2014 in 2014 dollars $1,268,104,450 1.05%
Assessed Value (constant year dollars)2 Year 2009 in 2014 dollars $1,292,704,3022 Year 2013 in 2014 dollars $1,279,531,929 -1.02%2 Year 2014 in 2014 dollars $1,268,104,450 -0.89%
Source:
Fairfax County, Virginia Department of Tax Administration; Urban Analytics, Inc.
Note:1
2 See Appendix Table A-4 for Personal Consumption Expenditure (PCE) Price Index.
Raw data smoothed by Urban Analytics to eliminate duplicative tax map number and
assessed value entries in the database.

A Sample of Public Revenues and Economic Impacts of Various Land-Uses along the Richmond Highway Corridor in Fairfax County, Virginia: 2009, 2013 and 2014 (December 9, 2014)
Urban Analytics, Inc. – Alexandria, Virginia (www.UrbanAnalytics.com) Page 13
Source: Urban Analytics, Inc. Note: Inflation-adjusted to constant 2014 dollars.
Further research needs to be conducted to explain the causative reasons behind the decline in
non-residential assessed values when adjusted for inflation. While the national economic
recovery from the 2007-2009 U.S. recession has been uneven and this can explain, in part,
the overall slower than expected growth rates across the country, differences in intra-county
growth rates (e.g., Tysons Corner versus Richmond Highway, Bailey’s Crossroads versus
Seven Corners) are subject to a number of local economic variables.
The data shown in Table 7 (and the trend lines shown in Chart 3), however, underscore the
need for continued public-private partnerships in the field of local economic development.
While Fairfax County’s Economic Development Authority is one of the top economic
development agencies in the country, local counties cannot be solely responsible for business
expansion and business retention strategies and implementation. Quasi-public entities (such
as the Southeast Fairfax Development Corporation) and private-sector entities (such as the
Mt. Vernon-Lee Chamber of Commerce) play a vital and important role in the on-the-
ground, day-to-day operations of local economic development.
Public Revenues to Fairfax County, Virginia
A review of various existing databases at the time that this report was prepared determined
that there were insufficient or inconsistent data on new residential and non-residential
construction projects in and around the Richmond Highway Corridor. Furthermore, the
characteristics of existing office, retail and hotel land uses along the Richmond Highway
Corridor are sufficiently differentiated in terms of age, quality, use and function, type, mix,
number, and value as to make a comparative analysis of public revenue of selected projects
problematic. Therefore, a sample of potential public revenues that would be generated to
Fairfax County from the 1,410 new households moving into existing housing (re-sale
housing) in 2013 as well as a public revenues sample of aggregate non-residential square feet
$1,100,000,000
$1,150,000,000
$1,200,000,000
$1,250,000,000
$1,300,000,000
$1,350,000,000
2009 2013 2014
Chart 3Nominal vs. Inflation-adjusted
Non-residential Assessment DataRichmond Highway Corridor
Fairfax County, Virginia
Nominal Inflation-adjusted

A Sample of Public Revenues and Economic Impacts of Various Land-Uses along the Richmond Highway Corridor in Fairfax County, Virginia: 2009, 2013 and 2014 (December 9, 2014)
Urban Analytics, Inc. – Alexandria, Virginia (www.UrbanAnalytics.com) Page 14
was prepared.4
Public revenue flows are different for each type of land use in the County. Thus, the revenue
analysis of a single-family house will be different than a revenue analysis of a town house
which would be different than a revenue analysis of a retail establishment, and so forth.
Additionally, the inputs (the financial and socio-economic variables) employed in the
revenue analysis model are based on local, jurisdiction-specific data. The revenue analysis
findings presented in this report are specific to Fairfax County only. These revenue benefits
are not transferable to other jurisdictions. That is, if this public revenues analysis were
conducted for the same housing and household characteristics but located in the City of
Alexandria or in Arlington County, then the revenue findings on the budget of those
jurisdictions would be different than the revenue findings for Fairfax County.
Public Revenue Analysis Model
In order to accurately measure these distinct fiscal flows, a revenue analysis model was
developed that allocates local revenues by land use type including distributions across
different types of residential and non-residential land uses. The County’s actual operating
revenues for FY 2013 as well as the allocation factors used to distribute actual operating
revenues for each budget category are shown in Appendix Table B-1. The allocation factors
calculated for Fairfax County are based on a detailed analysis of County data provided by the
County’s various departments and agencies. For example, in Appendix Table B-1, a detailed
analysis of revenues from Other Local Taxes indicated that 60.7 percent of these revenues
were generated by the occupants of residential land uses while the remaining 39.3 percent
was generated by workers and visitors associated with non-residential land uses.
This revenue analysis model has been calibrated to reflect the schedule of tax rates and
revenue sources, as reflected in the Fairfax County Comprehensive Annual Financial Report
(CAFR) for fiscal year 2013. This analysis, therefore, reflects 2013 real dollar values and
provides an accurate measurement of revenues reflecting these 2013 tax rates. If tax rates are
changed in future years, then respective revenue estimates would also change. Similarly, if
assessments change at a rate exceeding the rate of inflation, then the value base for
calculating revenues would also change. For the purposes of this analysis, all of these values
are held constant and this provides an accurate portrayal of the estimated revenues of
residential land uses in the County as they existed as part of the tax base in 2013.
In Appendix Table B-1, operating revenues by source, land-use allocation factors, and the
revenue contribution margin by land-use type and by revenue category for Fairfax County as
of fiscal year-end 2013 are presented. At the end of fiscal year 2013, Fairfax County
reported total operating revenues of $3.5 billion (specifically, $3,498,853,809). Land-use
allocation factors were developed to estimate the contribution of revenues within each
operating revenue category by land use type. The categories of land uses in the revenue
analysis model are as follows: single-family; town house, multifamily, retail, office,
industrial, and other (which includes government and non-profit land uses). For ease of
4 Please see the section on Data Limitations for a more complete discussion.

A Sample of Public Revenues and Economic Impacts of Various Land-Uses along the Richmond Highway Corridor in Fairfax County, Virginia: 2009, 2013 and 2014 (December 9, 2014)
Urban Analytics, Inc. – Alexandria, Virginia (www.UrbanAnalytics.com) Page 15
presentation, these land uses are bifurcated into two land use classifications: residential and
non-residential.
To the extent that the data were available as of the date of this report, the land-use allocation
factors (and the revenue analysis multipliers calculated by the revenue model) were localized
to Fairfax County, Virginia. Of the $3,498,853,809 in total operating revenues reported as of
fiscal year end 2013, it was estimated that $2,679,550,777 (or 76.58 percent) in revenues
were generated by the residential sector of the County while $819,303,032 (or 23.42 percent)
were generated by the non-residential sector of the County.
Public Revenue Analysis Findings
Based on an examination of all potential local revenue sources generated by the residential
and non-residential land uses currently existing in the County, the total annual operating
revenues to Fairfax County from the residential and non-residential land-uses analyzed was
found to equal an estimated $30,893,357 annually (see Table 1). Of this estimated
$30,893,357 annual public revenue contribution, it was estimated that $8,831,921 in revenues
were generated by the 1,410 residential units and $22,061,436 by the non-residential land-
uses annually (see Table 1).
Economic Impacts to Fairfax County Due to the data limitations previously discussed, the economic impact findings presented in
this report are limited to an analysis of the estimated annual household spending from 1,410
households. Direct outlays are defined in this report as the estimated outlays incurred
(captured) within Fairfax County from annual household spending. Indirect outlays are
defined in this report as the net increase in direct outlays (in Fairfax County) that deliver a
dollar of output to its final use. For example, the multiplier for direct “food services and
drinking places” outlays in Fairfax County is 1.5052. For every $1.00 spent on food services
and drinking places captured in Fairfax County, a total of $1.51 is generated (captured) in the
local economy. The direct impact is 1.0. The indirect impact is 0.5052. The total economic
impact of household spending from various housing units within the five zip codes for the
years 2009, 2013 and 2014 are shown in Appendix Tables A-1, A-2, and A-3.
Annual Economic Impacts from Household Spending
The economic impact of household spending from the 1,410 households in 2013 in the five
zip codes is shown both in Table 2 and in Appendix Table A-2. These households were
estimated to have an estimated median household income of $97,849 for a total of $137.97
million in gross household income.5 Approximately 28 percent of this household income (or
$38.63 million) is estimated to be captured within the local Fairfax County economy. It is
estimated that direct spending from these households will generate an additional $18.37
5 This is the estimated weighted-average median household income required to obtain a
mortgage subject to mortgage financing terms (or to rent a multifamily unit) in 2013. Actual
median household incomes may be higher or lower.

A Sample of Public Revenues and Economic Impacts of Various Land-Uses along the Richmond Highway Corridor in Fairfax County, Virginia: 2009, 2013 and 2014 (December 9, 2014)
Urban Analytics, Inc. – Alexandria, Virginia (www.UrbanAnalytics.com) Page 16
million in indirect outlays for a total of $57 million annually in Fairfax County. Direct
household income captured locally includes spending for goods and services such as retail
and other personal services, local health care services, entertainment (including restaurants),
transportation costs, and home maintenance expenditures.
Data Limitations
The findings presented in this report are limited by both the type and amount of data
available at the time this report was prepared. Data did not exist on whether buyers
purchasing housing within the five zip codes were coming from outside Fairfax County or
whether they were existing homeowners within the five zip codes that were simply trading up
(or down) from one house to the next. Data on down payment size by wealth and asset
categories were not available. A review of various existing databases at the time that this
report was prepared determined that there were insufficient or inconsistent data on new
residential and non-residential construction projects in and around the Richmond Highway
Corridor. Furthermore, the characteristics of existing office, retail and hotel land uses along
the Richmond Highway Corridor are sufficiently differentiated in terms of age, quality, use
and function, type, mix, number, and value as to make a comparative analysis of public
revenues of a selected project problematic. Data provided in the Fairfax County Department
of Taxation database on assessed values were (in some instances) duplicative with the
appearance of the same tax map number and assessed value entries. These data were
smoothed to eliminate potential double-counting. As with any county in the United States,
there are issues concerning economic activity and the measurement of cross-border leakage
for county residents who live in close proximity to the county’s geographic borders. At the
time of this report, data were not available on spatial spending patterns for the residents
within the five zip codes analyzed. The reader is cautioned that the findings in this report
might change if the data limitations identified are resolved.

A Sample of Public Revenues and Economic Impacts of Various Land-Uses along the Richmond Highway Corridor in Fairfax County, Virginia: 2009, 2013 and 2014 (December 9, 2014)
Urban Analytics, Inc. – Alexandria, Virginia (www.UrbanAnalytics.com) Page 17
Appendix
A Sample of Public Revenues and Economic Impacts of Various Land-Uses along the Richmond Highway Corridor in Fairfax County, Virginia: 2009, 2013 and 2014 (December 9, 2014)
Urban Analytics, Inc. – Alexandria, Virginia (www.UrbanAnalytics.com) Page 18
Contact Information
Author: Dean D. Bellas, Ph.D.
Mailing Address: Urban Analytics, Inc.
Post Office Box 877
Alexandria, Virginia 22313-0877
Telephone: 703.780.8200
Fax: 703.780.8201
Web Site: www.UrbanAnalytics.com
Email - #1: [email protected]
Email - #2: [email protected]
Dean D. Bellas, Ph.D., is president of Urban Analytics, Inc., an Alexandria, Virginia-
based real estate and urban planning consulting firm providing urban development
analytical services to public, private, and institutional-sector clients. Consulting
services include fiscal and economic impact studies, market research and economic
base analyses, real estate asset management, real estate development economics, and
project feasibility studies. Since 1996, Dr. Bellas has provided consulting services in
Arizona, California, Illinois, Indiana, Kansas, Maryland, Michigan, Virginia, West
Virginia, Wisconsin, and the District of Columbia. Dr. Bellas has analyzed the fiscal
impact on over 16,000 residential units and over 38.7 million square feet of non-
residential space. The total estimated value of all land-uses analyzed is over $5
billion. In addition, Dr. Bellas has authored or co-authored over sixty research reports
on the fiscal and economic impact of real estate development. Dr. Bellas has been a
consultant to the Department of the Treasury and to the State Department.
In addition to Urban Analytics, Dr. Bellas is also an adjunct faculty member in the
Real Estate Development concentration within the School of Architecture and
Planning at the Catholic University of America where he teaches Real Estate Finance,
Real Estate Investment, Urban Economics, and Asset Management and Strategy.
Previously, he has been an adjunct faculty member in the School of Professional
Studies in Business and Education at the Johns Hopkins University, and an adjunct
faculty member in the School of Management at George Mason University. Dr.
Bellas has also taught candidates for the CFA designation on behalf of the
Washington Society of Investment Analysts.
Dr. Bellas received a Bachelor of Science in Business Administration from Western
New England University with a concentration in Finance (1982), a Master of Urban
and Regional Planning from the George Washington University (1993), and his

A Sample of Public Revenues and Economic Impacts of Various Land-Uses along the Richmond Highway Corridor in Fairfax County, Virginia: 2009, 2013 and 2014 (December 9, 2014)
Urban Analytics, Inc. – Alexandria, Virginia (www.UrbanAnalytics.com) Page 19
Doctorate in Public Policy with a concentration in regional economic development
policy at George Mason University (2005). His doctoral dissertation was entitled,
“Fiscal Impact Simulation Modeling: Calculating the Fiscal Impact of
Development.” His research interests include regional and local developmental
growth patterns, economic and fiscal impact effects of real estate development on
municipal government, and economic development policy. Dr. Bellas is a member of
Lambda Alpha International, an honorary society for the advancement of land
economics. He is a full member of the Urban Land Institute. Dr. Bellas sits on ULI’s
national Public Development and Infrastructure Council, regionally on the ULI
Washington, DC/Baltimore Transportation Oriented Development (TOD) Council,
and locally on ULI’s Washington District Regionalism Initiatives Council. Dr. Bellas was the economic advisor to the Southeast Fairfax Development Corporation
Board of Directors in calendar year 2012. He was appointed to the Board of Directors for the
2013 – 2014 term by Supervisor Jeffrey C. McKay (Lee District). His term on the Board of
SFDC expires on December 31, 2014. Both Dr. Bellas and Urban Analytics, Inc., were not
compensated for this report. The analyses conducted and the findings presented in this report
were independently conducted by Urban Analytics, Inc., and Dr. Bellas.

A Sample of Public Revenues and Economic Impacts of Various Land-Uses along the Richmond Highway Corridor in Fairfax County, Virginia: 2009, 2013 and 2014 (December 9, 2014)
Urban Analytics, Inc. – Alexandria, Virginia (www.UrbanAnalytics.com) Page 20
Appendix Table A-1
Annual Economic Impact of Household Spending
Residential Land-Use Data (Transactional Only)1
Postal Zip Codes 22303, 22306, 22307, 22308, and 22309
Fairfax County, Virginia
2009
Estimated Minimum Estimated
Calculation of HH Income Average Per Unit Estimated Per Unit HH Minimum
Real Estate Purchase Income Required Total HH
Units Market Value Down Payment for Purchase 2 Income3
Single Family 807 $479,000 20% $108,200 $87,317,400
Town House 498 $198,567 15% $48,600 $24,202,800
Condominiums 292 $167,561 10% $41,300 $12,059,600
Total 1,597 $334,607 $77,382 $123,579,800
Local HH Income Captured HH Income Estimated Per Unit Estimated Total
Average Per Unit Captured HH Income HH Income
Units HH Income Locally Captured Locally Captured Locally
All Housing Units 1,597 $77,382 28% $21,667 $34,602,344
Local Direct & Indirect Outlays
Estimated Total Estimated Total Estimated Total
HH Income HH Income Regional Data HH Income HH Income
Captured Captured Locally RIMS II Captured Locally Captured Locally
Locally Direct Outlays Multiplier Indirect Outlays Total Outlays
Retail-Related (Other) 11.00% $13,593,778 1.4394 $5,973,106 $19,566,884
Healthcare-Related 1.60% $1,977,277 1.5578 $1,102,925 $3,080,202
Food Services/Drinking Places 3.81% $4,708,390 1.5052 $2,378,679 $7,087,069
Transportation-Related 5.03% $6,216,064 1.4553 $2,830,174 $9,046,238
Personal/Household Goods 3.76% $4,646,600 1.4410 $2,049,151 $6,695,751
Personal Care Services 0.34% $420,171 1.5316 $223,363 $643,534
Charitable/Cash Contributions 1.09% $1,347,020 1.7600 $1,023,735 $2,370,755
Entertainment-Related 1.37% $1,693,043 1.5161 $873,780 $2,566,823
Total 28.00% $34,602,344 $16,454,912 $51,057,256
Source:
U.S. Department of Commerce, Bureau of Economic Analysis Regional Multipliers-RIMS II (2010); County of Fairfax, VA;
Long & Foster; Burke & Herbert Bank; Urban Analytics, Inc.
Note:1 Reflects actual units sold. Does not include units not-for-sale or units listed for-sale.2 Subject to mortgage financing terms such as: rate, term, debt-to-income ratio, real estate taxes, and hazard insurance.3 In current (2009) dollars.

A Sample of Public Revenues and Economic Impacts of Various Land-Uses along the Richmond Highway Corridor in Fairfax County, Virginia: 2009, 2013 and 2014 (December 9, 2014)
Urban Analytics, Inc. – Alexandria, Virginia (www.UrbanAnalytics.com) Page 21
Appendix Table A-2
Annual Economic Impact of Household Spending
Residential Land-Use Data (Transactional Only)1
Postal Zip Codes 22303, 22306, 22307, 22308, and 22309
Fairfax County, Virginia
2013
Estimated Minimum Estimated
Calculation of HH Income Average Per Unit Estimated Per Unit HH Minimum
Real Estate Purchase Income Required Total HH
Units Market Value Down Payment for Purchase 2 Income3
Single Family 827 $587,421 20% $122,400 $101,224,800
Town House 355 $325,157 15% $71,900 $25,524,500
Condominiums 228 $217,143 10% $49,200 $11,217,600
Total 1,410 $461,515 $97,849 $137,966,900
Local HH Income Captured HH Income Estimated Per Unit Estimated Total
Average Per Unit Captured HH Income HH Income
Units HH Income Locally Captured Locally Captured Locally
All Housing Units 1,410 $97,849 28% $27,398 $38,630,732
Local Direct & Indirect Outlays
Estimated Total Estimated Total Estimated Total
HH Income HH Income Regional Data HH Income HH Income
Captured Captured Locally RIMS II Captured Locally Captured Locally
Locally Direct Outlays Multiplier Indirect Outlays Total Outlays
Retail-Related (Other) 11.00% $15,176,359 1.4394 $6,668,492 $21,844,851
Healthcare-Related 1.60% $2,207,470 1.5578 $1,231,327 $3,438,797
Food Services/Drinking Places 3.81% $5,256,539 1.5052 $2,655,603 $7,912,142
Transportation-Related 5.03% $6,939,735 1.4553 $3,159,661 $10,099,396
Personal/Household Goods 3.76% $5,187,555 1.4410 $2,287,712 $7,475,267
Personal Care Services 0.34% $469,087 1.5316 $249,367 $718,454
Charitable/Cash Contributions 1.09% $1,503,839 1.7600 $1,142,918 $2,646,757
Entertainment-Related 1.37% $1,890,147 1.5161 $975,505 $2,865,651
Total 28.00% $38,630,732 $18,370,585 $57,001,317
Source:
U.S. Department of Commerce, Bureau of Economic Analysis Regional Multipliers-RIMS II (2010); County of Fairfax, VA;
Long & Foster; Burke & Herbert Bank; Urban Analytics, Inc.
Note:1 Reflects actual units sold. Does not include units not-for-sale or units listed for-sale.2 Subject to mortgage financing terms such as: rate, term, debt-to-income ratio, real estate taxes, and hazard insurance.3 In current (2013) dollars.

A Sample of Public Revenues and Economic Impacts of Various Land-Uses along the Richmond Highway Corridor in Fairfax County, Virginia: 2009, 2013 and 2014 (December 9, 2014)
Urban Analytics, Inc. – Alexandria, Virginia (www.UrbanAnalytics.com) Page 22
Appendix Table A-3
Annual Economic Impact of Household Spending
Residential Land-Use Data (Transactional Only)1
Postal Zip Codes 22303, 22306, 22307, 22308, and 22309
Fairfax County, Virginia
20144
Estimated Minimum Estimated
Calculation of HH Income Average Per Unit Estimated Per Unit HH Minimum
Real Estate Purchase Income Required Total HH
Units Market Value Down Payment for Purchase 2 Income3
Single Family 572 $647,110 20% $137,900 $78,878,800
Town House 302 $342,828 15% $77,600 $23,435,200
Condominiums 169 $230,939 10% $53,600 $9,058,400
Total 1,043 $491,572 $106,781 $111,372,400
Local HH Income Captured HH Income Estimated Per Unit Estimated Total
Average Per Unit Captured HH Income HH Income
Units HH Income Locally Captured Locally Captured Locally
All Housing Units 1,043 $106,781 28% $29,899 $31,184,272
Local Direct & Indirect Outlays
Estimated Total Estimated Total Estimated Total
HH Income HH Income Regional Data HH Income HH Income
Captured Captured Locally RIMS II Captured Locally Captured Locally
Locally Direct Outlays Multiplier Indirect Outlays Total Outlays
Retail-Related (Other) 11.00% $12,250,964 1.4394 $5,383,074 $17,634,038
Healthcare-Related 1.60% $1,781,958 1.5578 $993,976 $2,775,935
Food Services/Drinking Places 3.81% $4,243,288 1.5052 $2,143,709 $6,386,998
Transportation-Related 5.03% $5,602,032 1.4553 $2,550,605 $8,152,637
Personal/Household Goods 3.76% $4,187,602 1.4410 $1,846,733 $6,034,335
Personal Care Services 0.34% $378,666 1.5316 $201,299 $579,965
Charitable/Cash Contributions 1.09% $1,213,959 1.7600 $922,609 $2,136,568
Entertainment-Related 1.37% $1,525,802 1.5161 $787,466 $2,313,268
Total 28.00% $31,184,272 $14,829,471 $46,013,743
Source:
U.S. Department of Commerce, Bureau of Economic Analysis Regional Multipliers-RIMS II (2010); County of Fairfax, VA;
Long & Foster; Burke & Herbert Bank; Urban Analytics, Inc.
Note:1 Reflects actual units sold. Does not include units not-for-sale or units listed for-sale.2 Subject to mortgage financing terms such as: rate, term, debt-to-income ratio, real estate taxes, and hazard insurance.3 In current (2014) dollars.4 Through October 14, 2014.
A Sample of Public Revenues and Economic Impacts of Various Land-Uses along the Richmond Highway Corridor in Fairfax County, Virginia: 2009, 2013 and 2014 (December 9, 2014)
Urban Analytics, Inc. – Alexandria, Virginia (www.UrbanAnalytics.com) Page 23
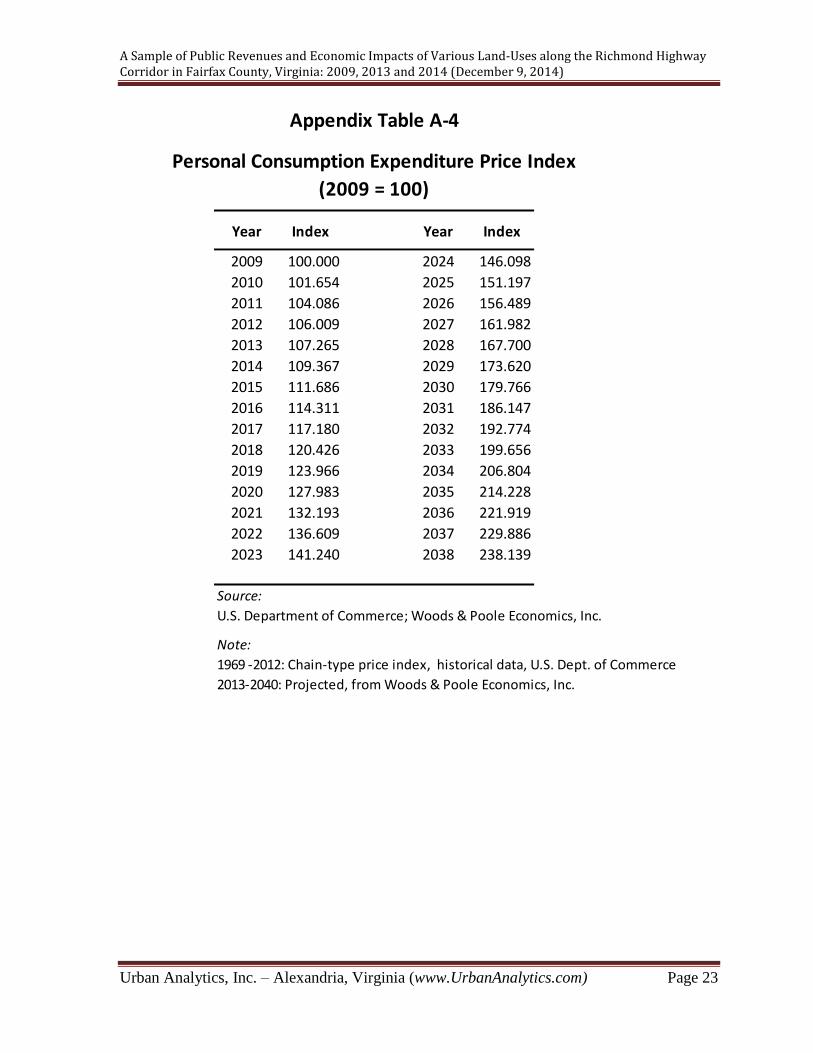
Appendix Table A-4
Personal Consumption Expenditure Price Index
(2009 = 100)
Year Index Year Index
2009 100.000 2024 146.098
2010 101.654 2025 151.197
2011 104.086 2026 156.489
2012 106.009 2027 161.982
2013 107.265 2028 167.700
2014 109.367 2029 173.620
2015 111.686 2030 179.766
2016 114.311 2031 186.147
2017 117.180 2032 192.774
2018 120.426 2033 199.656
2019 123.966 2034 206.804
2020 127.983 2035 214.228
2021 132.193 2036 221.919
2022 136.609 2037 229.886
2023 141.240 2038 238.139
Source:
U.S. Department of Commerce; Woods & Poole Economics, Inc.
Note:
1969 -2012: Chain-type price index, historical data, U.S. Dept. of Commerce
2013-2040: Projected, from Woods & Poole Economics, Inc.

A Sample of Public Revenues and Economic Impacts of Various Land-Uses along the Richmond Highway Corridor in Fairfax County, Virginia: 2009, 2013 and 2014 (December 9, 2014)
Urban Analytics, Inc. – Alexandria, Virginia (www.UrbanAnalytics.com) Page 24
Appendix Table B-1
Revenue by Source Multipliers
Fairfax County, Virginia
FYE June 30, 2013
Allocation Factor Contribution Margin Multiplier
2013
Category Revenues 1 Resident Non-Res. Residential Non-Residential
1 Real Estate
Residential $1,768,024,389 100.0% 0.0% $1,768,024,389 65.98%
Non-Residential $371,404,929 0.0% 100.0% $371,404,929 45.33%
2 Personal Property $340,539,570 56.6% 43.4% $192,677,289 7.19% $147,862,281 18.05%
3 Sales Tax $263,088,819 79.8% 20.2% $209,892,260 7.83% $53,196,559 6.49%
4 Utilities (Consumer) $45,104,967 34.2% 65.8% $15,421,388 0.58% $29,683,579 3.62%
5 BPOL $158,220,681 0.0% 100.0% $0 0.00% $158,220,681 19.31%
6 Other Local Taxes $33,876,414 2 60.7% 39.3% $20,566,371 0.77% $13,310,043 1.62%
7 Licenses, Fees, Permits $35,747,734 70.2% 29.8% $25,102,059 0.94% $10,645,675 1.30%
8 Fines & Forfeitures $14,612,835 75.6% 24.4% $11,041,458 0.41% $3,571,377 0.44%
9 Use of Money $18,160,015 65.3% 34.7% $11,854,858 0.44% $6,305,157 0.77%
10 Charges for Services $70,971,358 79.8% 20.2% $56,613,852 2.11% $14,357,506 1.75%
11 Miscellaneous $32,044,332 3 94.9% 5.1% $30,422,889 1.14% $1,621,443 0.20%
12 Recovered Costs $14,858,461 98.3% 1.7% $14,604,381 0.55% $254,080 0.03%
13 Intergovernmental $332,199,305 97.3% 2.7% $323,329,584 12.07% $8,869,721 1.08%
Total $3,498,853,809 $2,679,550,777 100.00% $819,303,032 100.00%
Contribution Margin: 76.58% 23.42%
Note:
1 Operating revenues (General Fund) only. Does not include Nonmajor Governmental Funds.
2 Includes Occupancy, Tobacco, Other.
3 Includes Recovered Costs, Gifts, Donations, Contributions, Developers' Contributions, and Other.
Source:
Fairfax County Comprehensive Annual Financial Report (CAFR) for the FYE June 30, 2013
Urban Analytics, Inc.

A Sample of Public Revenues and Economic Impacts of Various Land-Uses along the Richmond Highway Corridor in Fairfax County, Virginia: 2009, 2013 and 2014 (December 9, 2014)
Urban Analytics, Inc. – Alexandria, Virginia (www.UrbanAnalytics.com) Page 25
This Page Intentionally Left Blank