Embed Size (px)
Citation preview
1
A Risk and Complexity Rating Framework for InvestmentProducts
Benedict KOH*Francis KOH*
David LEE Kuo Chuen*LIM Kian Guan*
David NG*PHOON Kok Fai*
May 2014
Abstract
While risk indicators have been developed and widely accepted by the financial industry, hitherto nometric has been developed to measure a product’s complexity. In the aftermath of the 2008 globalfinancial crisis, regulators are increasingly concerned about consumer protection. The Lehman Bondscrisis showed that many investors who bought such investments did not have a clear understanding ofthe product’s features. Part of the reasons is that such products are quite complex and embed featureswhich are difficult to understand. This suggests that if the inherent risk and the complexity of aproduct’s structure are not clearly understood by investors, they would not be in a position to makeinformed investment decisions. In recognizing that complexity is different from risk, somepractitioners have recently attempted to calibrate product complexity. This paper proposes a simpleframework to classify the risk and complexity of investment products. We propose to calibrate riskand complexity separately with a list of factors that contribute these attributes. The proposedframework is then used to calibrate a wide variety of investment products to demonstrate its simplicityand usefulness in helping investors make informed investment decisions.
*Sim Kee Boon Institute for Financial Economics, Singapore Management University, 50, Stamford Road,Singapore 178899. This work is supported by Sim Kee Boon Institute for Financial Economics and originatedfrom a project commissioned by the Investment Management Association of Singapore. The first draft wascompleted in September 2013.

2
Introduction
Since the Global Financial Crisis of 2008-2009, the discussion to better regulate financial productshas intensified. While risk assessment of products has a longer history and continues to attract keeninterest in financial markets, the crisis has intensified the debate on regulation of complex financialproducts (see Brunnermeier and Ochmeke (2009), Schwarcz (2009) and Valentine (2008)).Understandably, research has been focused on issues of systemic risk to the financial system (seePagliari and Stefano (2012) and Pearson and Pearson (2007)), risk management, analytics andmeasurement (see Bisias, Flood, Lo and Valavanis (2012), Billio, Getmansky, Lo and Pelizzon (2010)and Jorion (2009)). Given the public outcry and the increase in the number of law suits related to themis-selling of financial products, regulators and market participants alike, have begun to discuss thedevelopment of a classification framework for complexity of financial products, in addition toclassification of risk, to address the issue of suitability of such products for investors. In particular,there have been great efforts in focusing on the assessment of product suitability for retail investorswho may not possess depth of knowledge, experience and sophistication.
A Joint Forum of the Bank of International Settlements (2006) has stated that the way financial firmsapproach the sale of financial products and services is at the core of consumer confidence in financialmarkets. Subsequently, the adopted sales approach by the industry has implications for soundness forthe individual firm, the stability of the financial system, as well as the protection of the investors.Different supervisory authorities have adopted different approaches to regulate the sale of retailproducts. However, the basic approach and building block to investors’ protection is to focus on mis-selling. Mis-selling refers to the inappropriate and legally questionable method of presenting thefinancial product as an attractive form of investment to the retail investor without sufficientexplanation of the risk and complexity underlying the product. There is a strong belief that the mainsource of system stability and the weakest link of investor protection can be traced to mis-selling. Thelinkages among mis-selling, systematic risk and soundness of the firms are important topics to beexplored.
The objective of this study is to provide a lead into these sets of complex linkages. This paperproposes a framework to rate risk and complexity of investment products. The contribution of thispaper by way of the classification framework is an innovation and it provides a guide forimplementation that will be of interest to regulators, product developers, product distributors andconsumer advocates. In Section 1, we review the issues and measures currently adopted by variousregulatory authorities. The sub-sections of the introduction provide a brief overview of the regulatoryframework on investment suitability implemented in Europe, followed by a discussion on risk andcomplexity concepts and the state of discussion on product complexity by various regulators andinvestment consultants. In Section 2, we give an overview of the proposed risk and complexityframework. Sections 3 and 4 present the method of identification and calibration of the risk andcomplexity factors respectively. Section 5 provides a synthesis of the framework and the conclusion ispresented in Section 6.
1. A Review of Regulatory Issues and Measures
1.1 Investment Suitability
In Europe, a uniform regulatory framework on investment suitability (the EU Markets in FinancialInstruments Directive, MiFID) was implemented in 2007. The need for this recommendation grew outof concerns by institutions and private investors who had incurred losses on their investment

3
portfolios. One key focus of the MiFID investment suitability framework is a risk classification ofcomplex and non-complex products to match the risk tolerance, knowledge, experience andinvestment objectives of investors.
Regulations and guidelines on investment suitability have also been adopted by various regulatoryauthorities in Asia such as the Monetary Authority of Singapore (MAS) and the Hong KongMonetary Authority (HKMA). Besides EU, the Swiss Financial Market Supervisory Authority,FINMA, also amended its regulation regarding the sale process of financial instruments.
Besides regulatory bodies, private consultancy firms also attempt to develop frameworks relating toproduct risk and complexity. These firms include Ernst and Young1 which developed a frameworkand proprietary tools to classify products to meet the multidimensional needs of investors.
In January 2012, the independent Financial Industry Regulatory Authority in U.S. (FINRA) releasedRegulatory Notice 12-03 titled “Complex Products: Heightened Supervision of Complex Products.”The Notice identifies the types of products that may be considered “complex” and provides guidanceto member firms regarding supervisory concerns associated with sales of complex products. Untilthen, U.S. regulators have not addressed the issues pertaining to “complex” products.
1.2 Risk
Risk has been fairly well defined in many jurisdictions using various measures to capture thedispersion of or extent of downward movement in investment returns. Standard deviation is the mostcommonly used measure. Other statistical measures include Value-at-Risk (VaR), expected shortfall,semi-variance and so on.
Some countries also introduced product risk classification. For example, Germany enacted the“Investor Protection and Capital Markets Improvement Act” (Anlegerschutz- undFunktionsverbesserungsgesetz) to provide investors and savers better protection against mis-selling.A key objective is to improve product transparency and comparability using standardized information.A Synthetic Risk and Reward Indicator (SRRI) was devised and used to calibrate risk. Themethodology used to compute the SRRI follows the Commission of European Securities Regulators(CESR) technical advice 09/1026 dated December 2009. The SRRI is a proxy for the annual volatilityof each fund. Funds are assigned to one of seven risk categories using the SRRI. The SRRI has to beshown to investors before funds are sold.
For structured products, the German Derivative Association (Deutscher Derivate Verband, DDV)assigns each product to one of five risk categories based on its VaR , ranging from conservative(category 1) to speculative (category 5). However, there are occasions when the risks of products areclassified differently using SSRI and DDV, resulting in confusion (see Structured Report (2011) byWestLB Equity Market Commentaries).
There are many useful studies on risk concepts pertaining to hedge funds (see Lambert (2012), Lo(2008) and Koh, Lee and Phoon (2002)). These studies have discussed various risk measures andfactors, including the use of leverage and liquidity. These factors are included in this study.
1 “Investment Suitability,” Ernst & Young Publications, 2009; Marc Ryser and Allesandro Lana, “InvestmentSuitability and Product Classification,” GARP Switzerland Chapter Meeting, 14 January 2010.

4
1.3 Complexity
The main motivation to add the complexity dimension in a study of product suitability is that investorsophistication has lagged behind the growing complexity of retail financial markets. Carlin andGustavo (2011) developed a dynamic model to study the interaction between obfuscation and investorsophistication in mutual fund markets. They found that educational initiatives that were directed tofacilitate learning by investors induced providers to increase wasteful obfuscation. Carlin (2009)discussed the benefits of complexity for strategic retailing of financial products. While complexityvaries across different investment products, mis-selling of structured products has resulted in calls toregulate the issue of complexity that has challenged regulators (see Glen and Pinedo (2013)).
Products and portfolio investments have also been studied to ascertain various impacts due to theirlevel of complexity. Franck and Walter (2012) examined the herd behaviour among equity funds inGermany and found the most pronounced levels of herding for funds choosing their stock portfoliosfrom a broad, international and hence, more complex investment universe. Bigda and Wong (2012)and Roseen (2012) have expressed their concerns over the increasingly complicated and complexexchange-traded fund (ETF) contracts. Good (2011) concluded that the growing complexity of ETFswas seen as damaging to the business. On the other hand, Jackson (2012) found that Trusts’complexity did not sway investors who viewed discounts as a more important feature.
In the literature, many studies have discussed “complexity” but there is no commonly accepteddefinition. However, the International Organization of Securities Commissions (IOSCO) has provideda useful description of complex financial products. According to IOSCO, complex financial productsrefer to financial products:
(a) With terms and features which are not likely to be understood by an average retail customer, (asopposed to more traditional or plain vanilla investment instruments);
(b) Which are difficult to value (so that their valuations require specific skills and/or systems);and/or
(c) Have a very limited or no secondary market (and are therefore potentially illiquid).
We used a similar characterisation of complex financial products in this study. Complex financialproducts generally include structured instruments, credit-linked notes, hybrid instruments, equity-linked instruments and instruments whose potential pay-off is linked to market parameters, asset-backed securities (ABSs), mortgage-backed securities (MBSs), collateralized debt securities, andother financial derivative instruments (including credit default swaps and covered warrants).
There are few international standards for classifying or evaluating complex products for complianceprocedures. We are aware of only one jurisdiction (Denmark) that has classified products into threespecific classes using product risk and complexity. Other regulators actively working to managecomplex products include:
(a) USA. FINRA has published a paper, “Characteristics of Complex Products and HeightenedSupervision,” Regulatory Notice 12-03 in January 2012.
(b) Denmark. The Danish Ministry of Economic and Business Affairs, issued a paper, “Risk-labelling of Investment Products” in October 2010.

5
(c) France. France Autorite Des Marches Financiers issued “Criteria of Structured InvestmentFunds and Complex Debt Services (AMF Position No 2010-05-15) in October 2010.
(d) MiFID. The European MiFID, issued the “Review of the Markets in Financial InstrumentsDirective” in December 2010.
(e) U.K. The UK Financial Services Authority issued 3 papers: (a) “Indicators of Problems withProducts: Flaw and Detrimental,” DP11/1, Jan 2011 and FS11/3, Jun 2011; (b) “Moratorium onthe Distribution of Particularly Complex Structured Products”; July 2011 and (c) “Guidance onProduct Design and Features”, Nov 2011.
(f) Belgium. The Belgian Financial Services and Markets Authorities (FSMA) issued “Criteria forMoratorium on Sales of Complex Products,” in September 2011.
(g) Singapore. Management Consultant Ernst and Young has developed a product suitabilityevaluation framework which incorporated product complexity as a risk factor.
2. BRIEF OVERVIEW OF RISK AND COMPLEXITY FRAMEWORK
Recent crises have shown that supposedly low-risk products have suffered massive losses with returnsfalling outside the normal range as predicted by historical or model-simulated data. One of theexplanations for such shocking deviation is the degree of uncertainties in the pay-out caused by thecomplexity embedded in the structure of the product.
The proposed framework decomposes the degree of uncertainties into two components: risk andcomplexity. Risk can be quantified on a ratio scale and can be suitably managed. However,complexity is quantifiable perhaps only on an ordinal scale. We will use the findings from theliterature and other empirical findings to define the factors contributing separately to risk andcomplexity. In the proposed framework, risk and complexity will form the axes in a 5-by-5 diagramas shown in Table 2.1. Constructed in this manner, products can be ranked by risk and complexity inthe 2-dimensional space.
The basic rule of no free lunch is implicit in the framework. Given constant return, any attempt tolower risk by re-structuring may make a product more complex. The framework ensures that thestructure of any product is made more transparent and will therefore provide investors moreinformation to make informed decisions.

6
Table 2.1 shows that the risk-complexity characteristics of an investment product are represented by apoint in the 2-dimensional space. A location further to the right indicates higher complexity, while alocation further to the top indicates higher risk. A risk-free asset would be positioned at the origin.
2.1 Risk MappingIn the proposed framework, investment risk will be measured by six factors defined in section 3. Eachinvestment product is fully assessed based on these factors and finally mapped into a 5-point riskscale as illustrated on the right-hand side of the diagram below:
RISK
RAT
ING
COMPLEXITY RATING
Table 2.1: 5x5 Matrix for Risk andComplexity Rating

7
Each risk factor on the left-hand side is scaled as low, medium or high by a set of criteria. Theassigned scale is translated into factor scores contributing to the overall risk rating on the right-handside. The calibration of risk is illustrated in section 4.3.
2.2 Complexity Mapping
In the proposed framework, investment complexity will be measured by five factors defined in section4. Each investment product is fully assessed based on these factors and mapped into a 5-pointcomplexity scale.
Each factor on the left-hand side is scaled as low, medium or high by a set of criteria. The assignedscale is translated into factor scores contributing to the overall complexity rating on the right-handside of the diagram. The calibration of complexity is illustrated in section 4.
2.3 Product Sample
To develop the 2-dimension risk-complexity framework, a sample of 100 investment products areused for calibration. The sample used for calibration includes the following:
(a) single securities and fixed deposits that were added to complete the framework;(b) money market funds and bond funds;(c) multi-asset classes funds;(d) unit trusts (mutual funds);(e) alternative assets funds; and(f) structured products.
2.4 Illustration
The outcome of the calibration exercise is a 5 by 5 matrix with each evaluated product occupying a“location” within the matrix based on its risk and complexity scores. This is illustrated as follows.

8
3. IDENTIFICATION AND CALIBRATION OF RISK FACTORS
3.1 Identification of Risk Factors
Risk will be defined as the probabilistic random losses which may arise from a number of factors thatare systematic (market) or unsystematic (idiosyncratic) in nature. The factors as well as parametersunderlying the probability distributions of the factors impact on the risk. These factors and parametersare:
(a) Volatility
(b) Liquidity
(c) Issuer/counterparty credit worthiness and risks
(d) Duration of cash flows
(e) Leverage
(f) Degree of diversification / Concentration of investments.
While we recognize that these attributes are affected by the underlying market conditions and may notbe independent of each other, the various measures provide a comprehensive description of the riskenvironment for the investor. The overall risk rating of each product will be based on a combinationof scores for each of the above key risk factors.
1
2
3
4
5
1 2 3 4 5
RISKRATING
COMPLEXITY RATING
MatrixforRiskandComplexityRating
ComplexStructuredProducts
Unit Trust
S$ FixedDeposit
9
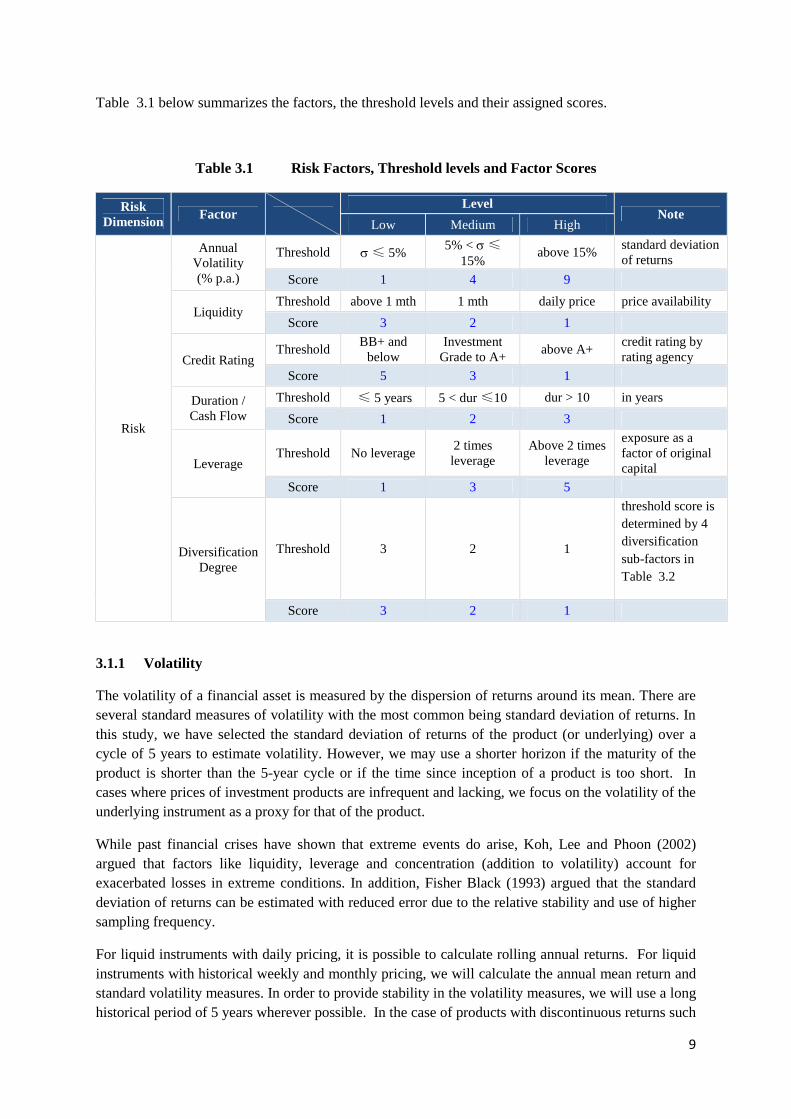
Table 3.1 below summarizes the factors, the threshold levels and their assigned scores.
Table 3.1 Risk Factors, Threshold levels and Factor Scores
RiskDimension
FactorLevel
NoteLow Medium High
Risk
AnnualVolatility(% p.a.)
Threshold ≤ 5%5% < ≤
15%above 15%
standard deviationof returns
Score 1 4 9
LiquidityThreshold above 1 mth 1 mth daily price price availability
Score 3 2 1
Credit RatingThreshold
BB+ andbelow
InvestmentGrade to A+
above A+credit rating byrating agency
Score 5 3 1
Duration /Cash Flow
Threshold ≤ 5 years 5 < dur≤10 dur > 10 in years
Score 1 2 3
LeverageThreshold No leverage
2 timesleverage
Above 2 timesleverage
exposure as afactor of originalcapital
Score 1 3 5
DiversificationDegree
Threshold 3 2 1
threshold score isdetermined by 4diversificationsub-factors inTable 3.2
Score 3 2 1
3.1.1 Volatility
The volatility of a financial asset is measured by the dispersion of returns around its mean. There areseveral standard measures of volatility with the most common being standard deviation of returns. Inthis study, we have selected the standard deviation of returns of the product (or underlying) over acycle of 5 years to estimate volatility. However, we may use a shorter horizon if the maturity of theproduct is shorter than the 5-year cycle or if the time since inception of a product is too short. Incases where prices of investment products are infrequent and lacking, we focus on the volatility of theunderlying instrument as a proxy for that of the product.
While past financial crises have shown that extreme events do arise, Koh, Lee and Phoon (2002)argued that factors like liquidity, leverage and concentration (addition to volatility) account forexacerbated losses in extreme conditions. In addition, Fisher Black (1993) argued that the standarddeviation of returns can be estimated with reduced error due to the relative stability and use of highersampling frequency.
For liquid instruments with daily pricing, it is possible to calculate rolling annual returns. For liquidinstruments with historical weekly and monthly pricing, we will calculate the annual mean return andstandard volatility measures. In order to provide stability in the volatility measures, we will use a longhistorical period of 5 years wherever possible. In the case of products with discontinuous returns such

10
as structured products, it may not be possible to construct a time series of returns given that periodicprices may not be obtainable. In this case, the volatility of the underlying may be used as a proxywhere the delta is approximately constant at unity.
In order to simplify the need to calculate historical prices for each product, it would be best to adoptcomprehensive proxy indices across various asset classes and geographical regions. The volatility ofthe indices may then be used as a substitute for the underlying assets.
Where multiple asset classes exist the overall exposure contribution may be determined by assumingappropriate levels of co-movement between asset classes. This assumption is made with theexpectation that in distressed periods, various asset classes move in tandem.
The use of other risk measures such as the Value-at-Risk (VaR), maximum drawdown and downsidedeviation has also been considered. We chose to use the standard deviation in the light of thefollowing modelling principles:
(a) Simplicity and parsimony
(b) Relevance and usefulness
(c) Effectiveness
(d) Adaptable to a portfolio context
(e) Ease of implementation
(f) Ease of explanation and understanding
(g) Universal applicability for all financial product types.
In order to use VaR, we need to estimate the underlying probability distribution of returns . The use ofVaR is difficult to extend to more complex products with low liquidity and complex payoffs. Forcomplex product, we measure the standard deviation of the underlying. In addition to the previousissues, maximum drawdown of complex products based on past history can be dichotomous at zeroor total loss. Using maximum drawdown for complex products may therefore under-estimate the riskor over-penalize a product. Using standard deviation of the underlying or indices rather than downsiderisk measure is much simpler to implement. It is important to note that skewness, kurtosis and entirereturns distribution also have an impact on the results. Our calibration results which are based on thestability of the relative ranking of the products suggest that skewness and kurtosis are not expected tobe severe for the underlying assets or indices.
3.1.2 Liquidity
Many empirical studies, especially on hedge funds have highlighted that liquidity is a risk factor thatimpacts investment performance. Gibson and Wang (2013) found that outperformance weakensconsiderably after accounting for liquidity risk and the alphas of some funds entailed rents for theirservice as liquidity providers. Jawadi and Khanniche (2012) motivated the need in accounting ofnonlinearity when modelling hedge fund exposure to risk factors due to the use of short selling,leverage, derivatives and illiquid assets by such funds.
Especially during market dislocations or when there is a specific risk associated with a particularproduct, illiquidity can result in severe losses in the quick exit of an investment. Thus having a

11
normally liquid market would greatly help exit of investments without incurring additional expensesthrough a distressed sale.
On the other hand, certain funds or investments that are infrequently traded or that the market makerprovides bid prices infrequently would increase the risks to the investor should adverse events occur.Liquidity measures should include trading volume and bid-offer spreads. However, most unlistedproducts that are over-the-counter do not have two-way prices and volume data. Thus, we will needto set up criteria based on the frequency of trading, size of trades and quoted prices. We believe thatwhile a trader would be concerned with liquidity from the standpoint of market clearing of trades, theinvestor would be more concerned about having the required window to exit the investment in anormal fashion. This applies to normal market conditions as during stressed conditions, prices wouldbe additionally depressed due to overall illiquidity of the underlying instruments.
We use the measure of price availability as a proxy for liquidity. For example, a unit trust with dailyprices quoted by its manager is deemed liquid even if the redemption amount is paid after two or moreworking days. Price availability of more than a day and less than a month is a measure of intermediateliquidity. Where prices are only available after more than a month, the investment is deemed mostilliquid. While this is not a direct measure of liquidity from the standpoint of the ability of the marketto clear trades quickly, it is a pertinent feature for general investors investing in financial products.Investors are concerned about the ability to exit a position through liquidation, prices notwithstanding.
3.1.3 Credit and issuer risk
Counter-party risk can give rise to credit contagion (see Brigo, Morini and Pallavinci (2013), Gregoryand Gregory (2012) and Jorion and Zhang (2009)). Investment products carry the credit risk of theissuer and secondary parties linked to them. These parties include the note issuer, fund sponsor, fundguarantor or custodian. Such credit risks can be reflected by the credit ratings of the various parties,particularly that of the issuing entity. If a public rating is unavailable, an equivalent internal ratingmay be needed. The credit exposure will be the exposure to the underlying instruments. Besides thenote issuer, the derivative swap that is responsible for the return performance of the product may befrom a third party thus requiring further credit risk assessment of the third party.
Similarly, for balanced funds with bond investments, these funds carry the credit risk of the issuer andtheir riskiness may be factored by way of the underlying credit rating, parentage, covenants andembedded terms.
Counter-party risks also exist when investors face the distributor rather than the manufacturer of thefinancial product. This risk is most critical when the investor relies on such a provider to perform itsobligations to deliver the stated performance according to the outcome of the investment. Most fundsare ring-fenced with separate custody of the underlying assets and as such the investor does not faceany default risk of the investment manager or fund distributor. We will also include the swapcounter-party involved if derivative structures are being used. An assessment would have to be madeof counter-party risks, including the use of custodians or trustees.
As a start and for uniformity, only ratings by the three key rating agencies (namely Standard &Poor,Moody’s and Fitch) are used. Depending on the need, practical implementation may also take intoconsideration the equivalent outcomes from other local rating agencies and also internal ratings byfinancial institutions. Scores which are based on usual grades and their equivalence are categorized asA+ or better, A+, BB+, and below.

12
3.1.4 Duration risk
We have included duration risk especially to cater to fixed income instruments with attached cashflows. Daxner writing in Benefits Canada (2009) reiterated that in addition to balancing risk inpursuit of capital market returns, investors are also mindful of the need to set active duration targets.For such instruments, price volatility increases as duration lengthens. While certain long-durationbond prices may seem to be stable in a less liquid market, the instability will be more pronouncedwhen uncertainty arises in the market. While not all financial instruments or products behave likebonds with clearly defined cash flows, we can nevertheless look at them as investments with cashflow even if they are irregular or uncertain. Thus a stock can be modelled as an investment with aseries of dividends (if any) and a final sale price. Private equity does not have dividends but a finalredemption price and proceeds are paid once the investment is liquidated. This approach allows us toassign a duration score to a financial product or instrument.
3.1.5 Leverage
Leverage is known to affect asset return volatility and has been regarded as a key risk factor (seeJawadi and Khanniche (2012) and Charath, Christie-Davis, Ramchander (2012)). Leverage utilizedwithin a product or financial instrument is intended to magnify the potential returns. As such, theprice volatility will also be magnified accordingly. The end result is an increase in the risk of theproduct or instrument from an investor’s baseline position. It is important to determine the level ofinternal leverage in an instrument that utilizes derivatives. Leverage may also exist in a managedproduct such as funds through borrowing within the portfolio. Hence, we have to determine the levelof such strategies being deployed in order to factor in the resultant additional risks incurred.
In our implementation we examine the overall leverage that is allowed in the mandates or structure. Incases where leverage ratio is greater than 1 but less than 2, the product is considered to haveintermediate leverage. Only products that do not use leverage are given a low factor score. Ultimatelythe determination on how much the exposure to the underlying instrument is magnified beyond theoriginal investment is a key determinant of risk and volatility.
3.1.6 Degree of diversification/Concentration of investments
Investments with a concentration of holdings in a few assets or classes expose investors to significantrisks. Broadly diversified investments reduce risk to investors due to reduction in idiosyncratic risks.It is not always possible to model what is the resultant risk of the product based on the mix ofinstruments or asset class exposure2. For funds with mixed asset classes, it would be useful tocalculate the combined exposure using proxy indices and their corresponding degree of associationacross different market conditions.
The degree of diversification of a financial product is dependent on the geographical spread of itsunderlying investments, the number of asset classes and sector distribution as well as theconcentration of investments in specific securities.
Table 3.2 provides a means of assessing the contribution to risk according to the presence or absenceof diversification.
2 See Hasse, Johanning, Rudolph and Schweizer (2012) for a discussion on diversification benefits with liquidityrisks for open-ended property funds and Markowitz (1991) for a discussion on diversification benefits

13
Table 3.2 Diversification Sub-Factors
FactorLevel
WeightsLow Medium High
GeographicalThreshold Country Regional Global
0.2Score 3 2 1
Asset ClassMin 1 2 3
0.4Score 3 2 1
SectorDistribution
Min 1 2 30.2
Score 3 2 1Single
InstrumentConcentration
Max 100% 10% 5%0.2
Score 3 2 1
Total 1
Extreme Market ConditionsThe proposed risk-rating methodology is based on long-term stable parameters characteristic of theproduct or underlying asset being modelled. This provides some level of stability to the relativeranking or position within the sample for the product risk categorization and avoids potential pitfallsof frequently changing risk ratings in an investor’s portfolio.
However, under extreme market conditions when the risk of market crashes for investment products ishigh, it is prudent to use a distressed market scenario. This is because the majority of investmentlosses and investor unhappiness would happen during such periods when severe price declines acrossvolatile asset classes take place. Moreover, during such periods of market dislocation, major assetclasses that are normally un-associated may start to fall in tandem. Low co-movement or negativelyassociated assets may develop into volatile high co-movement or positively associated assets underextreme events. In order to take into account such severe market scenarios, we can adopt appropriatepenalty factors in the calculation of risk exposure for each of the risk factors wherever possible. Thesecan be further fine tuned and adjusted by product providers in response to severe market conditions.
3.2 Calibration of Risk Factors
For each risk factor, scores are assigned according to the level of input measure used for each factor.The input measure is carefully chosen to best reflect the contribution to risk of that factor and itsapplicability across most products and financial instruments.
For example, we can use the volatility range of the underlying security or securities to scale thevolatility factor. The advantage of looking at the generic underlying volatility is that we do not haveto concern ourselves with other factors such as leverage that will alter the eventual volatility of theproduct. On the other hand, we are still able to determine the volatility of a hybrid such as a mix ofstocks or even asset classes. This can be done by assigning appropriate proxies for those instrumentsor asset classes and by examining the volatility of the blended portfolio.
For each risk factor, calibration is made to determine the amount of contribution of that risk factor tothe overall risk rating. This can be done on a continuous basis where the absolute value of the measureis translated to a common scoring scale. The score for each risk factor will take into account both theinput measure level as well as the relationship between the measure and its contribution to overallinvestment risk.
14
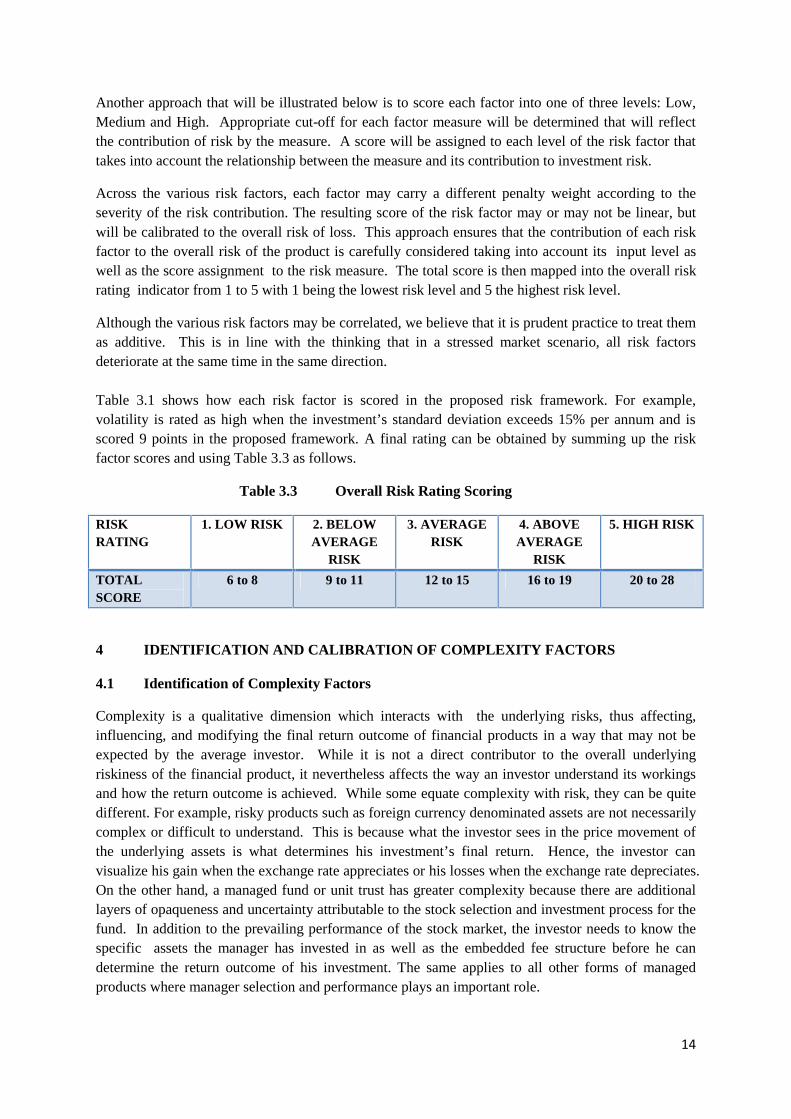
Another approach that will be illustrated below is to score each factor into one of three levels: Low,Medium and High. Appropriate cut-off for each factor measure will be determined that will reflectthe contribution of risk by the measure. A score will be assigned to each level of the risk factor thattakes into account the relationship between the measure and its contribution to investment risk.
Across the various risk factors, each factor may carry a different penalty weight according to theseverity of the risk contribution. The resulting score of the risk factor may or may not be linear, butwill be calibrated to the overall risk of loss. This approach ensures that the contribution of each riskfactor to the overall risk of the product is carefully considered taking into account its input level aswell as the score assignment to the risk measure. The total score is then mapped into the overall riskrating indicator from 1 to 5 with 1 being the lowest risk level and 5 the highest risk level.
Although the various risk factors may be correlated, we believe that it is prudent practice to treat themas additive. This is in line with the thinking that in a stressed market scenario, all risk factorsdeteriorate at the same time in the same direction.
Table 3.1 shows how each risk factor is scored in the proposed risk framework. For example,volatility is rated as high when the investment’s standard deviation exceeds 15% per annum and isscored 9 points in the proposed framework. A final rating can be obtained by summing up the riskfactor scores and using Table 3.3 as follows.
Table 3.3 Overall Risk Rating Scoring
RISKRATING
1. LOW RISK 2. BELOWAVERAGE
RISK
3. AVERAGERISK
4. ABOVEAVERAGE
RISK
5. HIGH RISK
TOTALSCORE
6 to 8 9 to 11 12 to 15 16 to 19 20 to 28
4 IDENTIFICATION AND CALIBRATION OF COMPLEXITY FACTORS
4.1 Identification of Complexity Factors
Complexity is a qualitative dimension which interacts with the underlying risks, thus affecting,influencing, and modifying the final return outcome of financial products in a way that may not beexpected by the average investor. While it is not a direct contributor to the overall underlyingriskiness of the financial product, it nevertheless affects the way an investor understand its workingsand how the return outcome is achieved. While some equate complexity with risk, they can be quitedifferent. For example, risky products such as foreign currency denominated assets are not necessarilycomplex or difficult to understand. This is because what the investor sees in the price movement ofthe underlying assets is what determines his investment’s final return. Hence, the investor canvisualize his gain when the exchange rate appreciates or his losses when the exchange rate depreciates.On the other hand, a managed fund or unit trust has greater complexity because there are additionallayers of opaqueness and uncertainty attributable to the stock selection and investment process for thefund. In addition to the prevailing performance of the stock market, the investor needs to know thespecific assets the manager has invested in as well as the embedded fee structure before he candetermine the return outcome of his investment. The same applies to all other forms of managedproducts where manager selection and performance plays an important role.

15
In a similar way, structured products with its embedded derivatives can result in a change ofbehaviour of the final return outcome that is significantly different from that of the underlying asset.A derivative typically alters the outcome of the investment by changing the risk and return profile ofthe underlying instrument. Thus, the embedded selling of puts in a structured product provides incometo buffer against stock price declines but at the same time limits the upside return potential. Selling anamount of put beyond the notional value of the investment would provide greater income but wouldaccelerate loss in any decline of the stock price. There are many ways derivatives can be introducedto products and they all alter the variability of the final outcome of the investment with respect to theunderlying instrument.
Complexity is related to the ability of the investor to comprehend how an investment product worksand how its potential return is derived. The introduction of derivatives may complicate an investor’sunderstanding of how the potential investment return is determined. In addition, various derivativesare traded in sophisticated markets with prescribed rules and conditions that affect the valuation ofderivatives and hence the final return received. Examples of these include market disruption events,defaults, counter-party performance and conditional triggers that may severely affect the outcome ofinvestments. While most of these special conditions and events will be somehow documented in theproduct brochure or prospectus, the detailed information as well as technical jargon will be difficultfor the average investor to digest. Investors may omit reading them, resulting in unexpected surprisesduring extreme events.
There may be a host of factors that contribute to complexity, but it is generally difficult to quantifythem. This is because unlike risk, complexity affects the level of transparency of return outcomewhich is itself dependent on the sophistication level of investors. As such, it is best to simplify theproblem by grading the complexity of products using factors that determine the difficulty ofunderstanding the full impact of return outcomes to the average retail investor.
The key factors of complexity proposed in the framework include:
(a) Structures and layers affecting payoffs of financial products
(b) Expansiveness of derivatives used in financial products
(c) Availability and usage of pricing and valuation models to price these products
(d) Number of scenarios determining return outcomes
(e) Amount of information disclosure required to describe a financial product and simplicity oflanguage used
4.1.1 Structures and number of layers defining payoffs
Most financial products possess a basic structure which specifies the underlying securities, theproduct type and the characteristics of payoffs. The underlying security specifies whether theinvestment is linked to fixed income, equity, foreign exchange, commodities or some combination ofthese such as unit trusts. The product type specifies whether the primary source of return for theinvestment is income or growth in capital value. The characteristics of payoffs show how returns arecomputed in the interim or at maturity of the investment.
Investment products that are complex in nature have payoffs that are not solely dependent on thespecification of the primary payoff structure. Additional layers of structure in complex products caninclude:

16
(a) Conditions which reduce or enhance the payoffs specified in the primary structure (such as a
call feature);
(b) Specific selection features that specify how the payoffs depend on characteristics of severalunderlying assets (such as best performing underlying asset or worst performing underlyingasset);
(c) Exotic option conditions using complex formula (for example, the final index level is
calculated as the average of the last readings over a given period); and
(d) Term feature specifying how payoffs are terminated or aggregated during the duration ofinvestment (such as a callable feature where an issuer can terminate the product on anycoupon date).
The more layers of structure the investment product possesses, the more complex it is for investors tounderstand how returns are computed for their investment. Hence, the complexity of the product canbe scored according to the number of layers of structure embedded in the product.
4.1.2 Expansiveness of derivatives and non-standard investment vehicles used
Investors generally regard derivatives as complex instruments due to the difficulty in determining itspayoffs as well as the complexity of the pricing formula. The types and number of derivativesembedded in the investment product can be used to gauge its degree of complexity. The more typesof derivatives or the number of derivatives structured into the product, the higher will be thecomplexity rating assigned to the product.
4.1.3 Amenability to valuation by standard and known valuation models
Investors generally do not regard common shares as a complex financial product as they can pricethem easily with well-known valuation models, and the data required by these models are readilyavailable. For example, shares can be valued using the P/E model which requires as inputs an industryor peer P/E multiple and the company’s prospective earnings per share. These inputs are easilyobtainable from information providers such as Bloomberg or Reuters. The P/E pricing model is easyto understand and apply without the need to write complex computer programming codes.
In contrast, a CDO’s (Collateralised Debt Obligation) cash flow tranches are difficult to value due tothe lack of established valuation models can calibrate default risk and early repayment behaviour.Hence, such products, that are not easily valued with known asset pricing models, are perceived to bemore complex. This problem is further exacerbated if market prices are not readily available. LikeCDOs, structured products are generally traded OTC (over-the-counter) by the product provider whois also the market-maker. Thus, prices are not publicly available but can only be provided by themarket-maker and investors will face great difficulties in valuing their investment holdings.
4.1.4 Number of scenarios required to quantify cashflows of investment product
Financial products with similar number of structural layers may have different degrees of complexityif their return outcomes have different dependencies on contingent events. For example, a productwith a “knock-out” feature is more complex than one without this feature. Therefore, beyond thenumber of structural layers, another measure of complexity is the number of potential scenarios thatcan determine the final return outcome of the investment product. One way of gauging this is to map

17
the different possible pathways throughout the life of the product until maturity that will determine itsfinal payoff.
4.1.5 Amount of information disclosure required and the simplicity of language used
A simple financial product is one that can be easily communicated to potential investors with a briefdescription. However, complex products often require very detailed description as well as illustrationto convey their essential features to investors. Hence, a complex product whether because of structurallayering or embedded derivatives would generally be accompanied with additional documentations inorder to describe the terms and conditions of the investment and how various outcomes may arisedepending on events and triggers. As such, the large amount of literature to be read and understoodby potential investors may act as a hindrance to a full understanding of the way the investmentbehaves. During time-sensitive situations, naive investors, who are not knowledgeable about suchcomplex products, may over-react and suffer large losses during extreme events.
Even with full documentation available to the investor, an investment product can sometimes beconstrued as complex due to vagueness of disclosure or technical jargon. The crux of the matter iswhether an investor is able to understand the disclosed information easily in order to ascertain thereturn and risk trade-off of such products. Consequently, financial products that require prospectus aswell as complex schedules and addendums would be regarded as complex.
4.2 Calibration of Complexity Factors
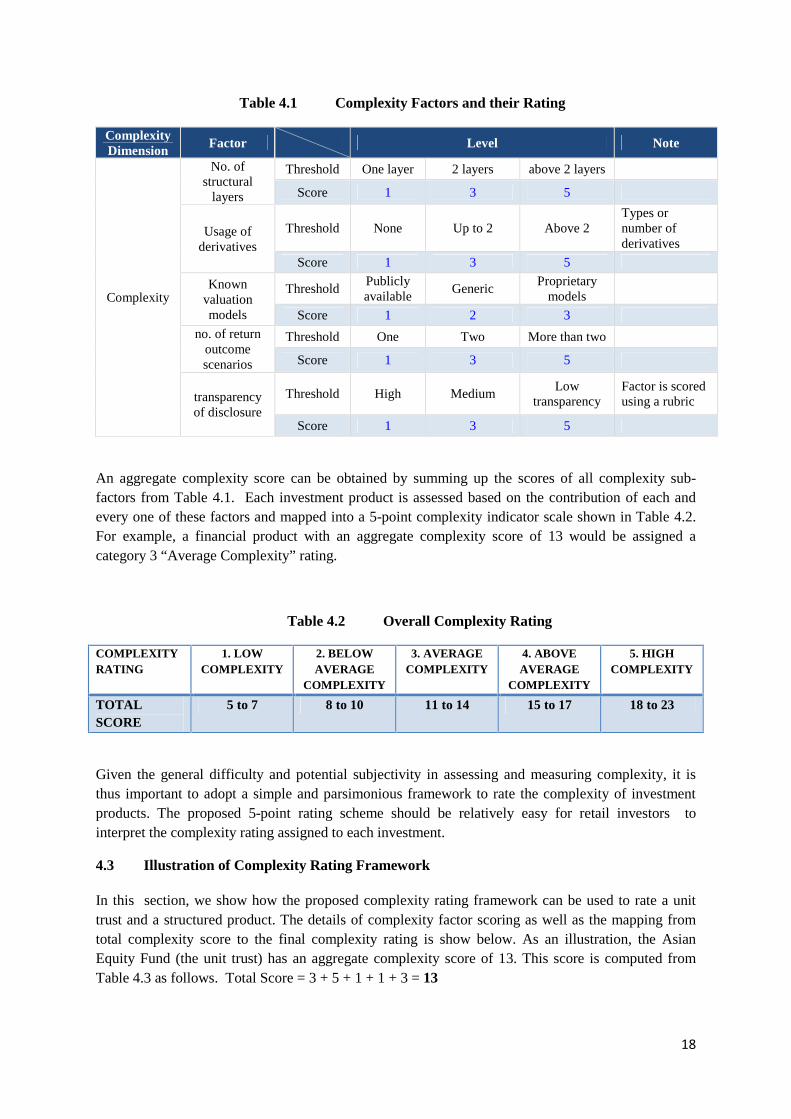
For each of the 5 complexity factors, scores are assigned according to the level of input measure usedfor each factor. The input measure will be carefully chosen to best reflect the overall degree ofcomplexity of a wide pool of financial products. Each complexity factor is scored and classified intoone of three levels: Low, Medium and High. Appropriate cut-offs for each factor measure will bedetermined that will reflect the contribution of complexity by the measure. A score will be assignedto each level of the complexity factor that takes into account the relationship between the measure andits contribution to overall degree of complexity of the investment product. For example, a financialproduct is gauged to be highly complex if the number of structural layers is 3 or more. The inputscore assigned to such highly complex products with many structural layers is 5. The higher the inputscore, the higher is the deemed complexity rating of the product.
Across the various complexity factors, each factor may carry a different weight according to theseverity of the complexity contribution. The resulting score of the complexity factor may or may notbe linear, but is calibrated to gauge the clarity of the likely investment outcomes at the point of entryinto the investment. Table 4.1 illustrates how each complexity factor is scored in the proposedframework. For example, the usage of derivatives is measured by counting the number of derivativesembedded in the investment product. Usage of derivatives is rated as high when the number ofderivatives embedded in the financial product is 3 or more and is scored 5 points in the proposedframework.
18
Table 4.1 Complexity Factors and their Rating
ComplexityDimension
Factor Level Note
Complexity
No. ofstructural
layers
Threshold One layer 2 layers above 2 layers
Score 1 3 5
Usage ofderivatives
Threshold None Up to 2 Above 2Types ornumber ofderivatives
Score 1 3 5
Knownvaluationmodels
ThresholdPubliclyavailable
GenericProprietary
models
Score 1 2 3
no. of returnoutcomescenarios
Threshold One Two More than two
Score 1 3 5
transparencyof disclosure
Threshold High MediumLow
transparencyFactor is scoredusing a rubric
Score 1 3 5
An aggregate complexity score can be obtained by summing up the scores of all complexity sub-factors from Table 4.1. Each investment product is assessed based on the contribution of each andevery one of these factors and mapped into a 5-point complexity indicator scale shown in Table 4.2.For example, a financial product with an aggregate complexity score of 13 would be assigned acategory 3 “Average Complexity” rating.
Table 4.2 Overall Complexity Rating
COMPLEXITYRATING
1. LOWCOMPLEXITY
2. BELOWAVERAGE
COMPLEXITY
3. AVERAGECOMPLEXITY
4. ABOVEAVERAGE
COMPLEXITY
5. HIGHCOMPLEXITY
TOTALSCORE
5 to 7 8 to 10 11 to 14 15 to 17 18 to 23
Given the general difficulty and potential subjectivity in assessing and measuring complexity, it isthus important to adopt a simple and parsimonious framework to rate the complexity of investmentproducts. The proposed 5-point rating scheme should be relatively easy for retail investors tointerpret the complexity rating assigned to each investment.
4.3 Illustration of Complexity Rating Framework
In this section, we show how the proposed complexity rating framework can be used to rate a unittrust and a structured product. The details of complexity factor scoring as well as the mapping fromtotal complexity score to the final complexity rating is show below. As an illustration, the AsianEquity Fund (the unit trust) has an aggregate complexity score of 13. This score is computed fromTable 4.3 as follows. Total Score = 3 + 5 + 1 + 1 + 3 = 13

19
Table 4.3 Complexity Rating of the Asian Equity Fund
Factor ScaleComplexity Factors LOW MEDIUM HIGH
Number of Structural Layers One Layer 2 Layers Above 2 Layers
Score 3Expansiveness of DerivativesUsed
None Up to Two Above Two
Score 5Availability and Usage of KnownValuation Model
PubliclyAvailable
Generic Models Proprietary Models
Score 1Number of ScenariosDetermining Return Outcomes
One Two More than Two
Score 1Transparency/Ease ofUnderstanding
High Medium Low
Score 3
This aggregate complexity score of 13 is mapped into a 5-point complexity rating scheme in Table 4.2giving a category 3 “Average complexity rating” for the Asian Equity Fund.
COMPLEXITYRATING
1. LOWCOMPLEXITY
2. BELOWAVERAGE
COMPLEXITY
3. AVERAGECOMPLEXITY
4. ABOVEAVERAGE
COMPLEXITY
5. HIGHCOMPLEXITY
TOTALSCORE
5 to 7 8 to 10 11 to 14 15 to 17 18 to 23
As our second illustration, we rate the complexity level of a structured product “An equityparticipation note”. The details of complexity factor scoring for this product is shown in Table 4.4.Based on the complexity sub-factor scores, this structure product has an aggregate complexity scoreof 20 (Total Score = 3 + 5 + 2 + 5 + 5 = 20).

20
Table 4.4 Complexity Rating of the Equity Participation Note
Factor ScaleComplexity Factors LOW MEDIUM HIGH
Number of Structural Layers One Layer 2 Layers Above 2 Layers
Score 3Expansiveness of DerivativesUsed
None Up to Two Above Two
Score 5Availability and Usage of KnownValuation Model
PubliclyAvailable
Generic Models Proprietary Models
Score 2Number of ScenariosDetermining Return Outcomes
One Two More than Two
Score 5Transparency/Ease ofUnderstanding
High Medium Low
Score 5
Using Table 4.2 , the structured product’s aggregate complexity score of 20 maps it into category 5“High Complexity” as show below.
COMPLEXITYRATING
1. LOWCOMPLEXITY
2. BELOWAVERAGE
COMPLEXITY
3. AVERAGECOMPLEXITY
4. ABOVEAVERAGE
COMPLEXITY
5. HIGHCOMPLEXITY
TOTALSCORE
5 to 7 8 to 10 11 to 14 15 to 17 18 to 23
5. SYNTHESIS OF RISK AND COMPLEXITY IN PROPOSED FRAMEWORK
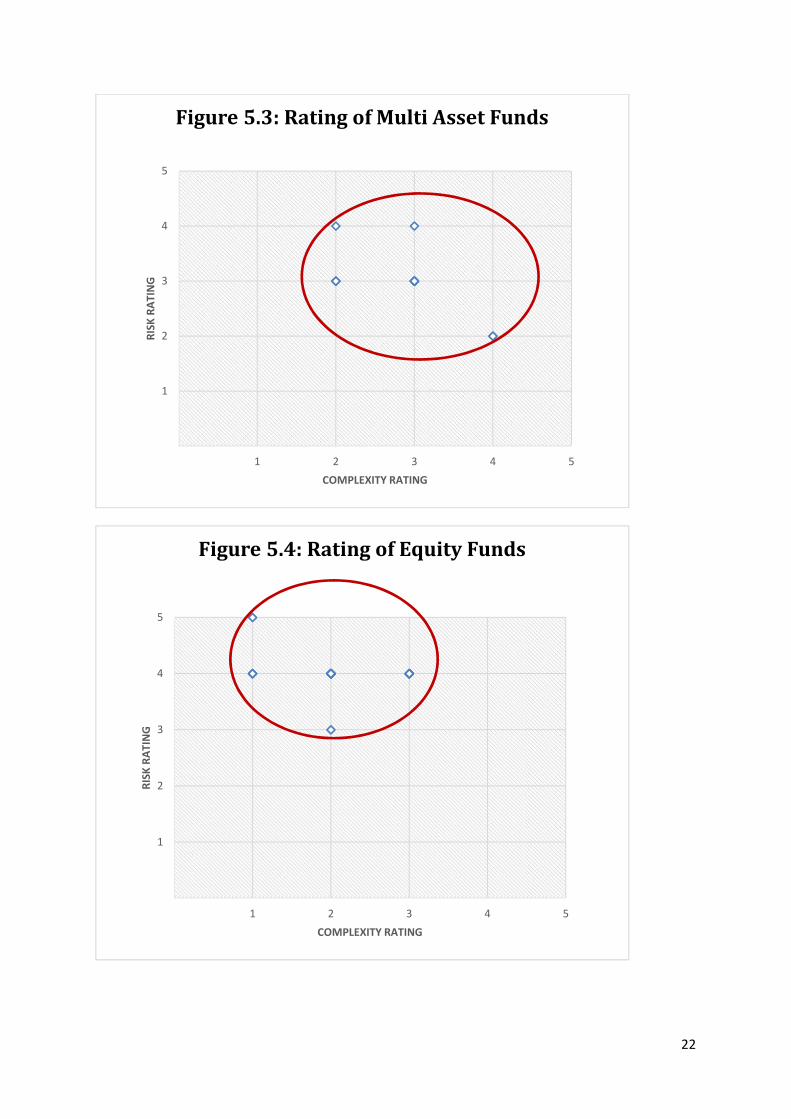
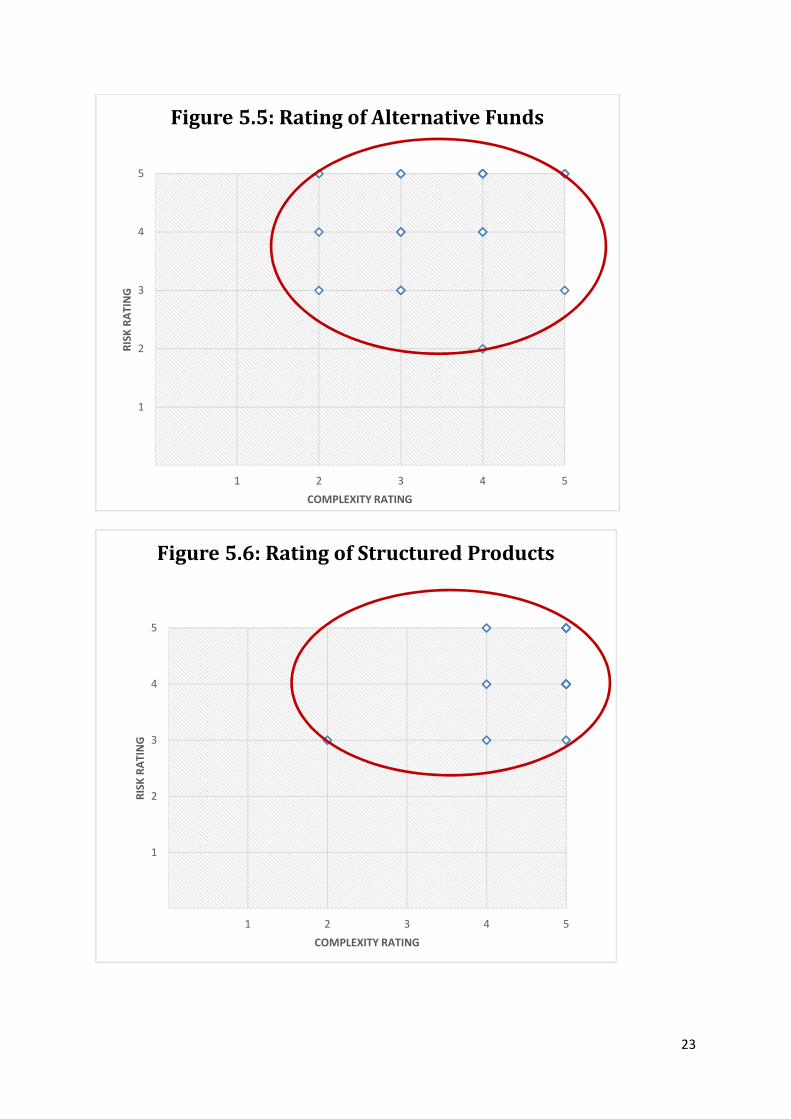
5.1 Tabulation of Results
Sections 3 and 4 respectively discussed the methodology used to evaluate an investment product’srisk and complexity. Each of the 100 investment products was then rated using the same methodology.The ratings of different clusters of products are presented in Figures 5.1 to 5.6.
Our results are consistent with findings in the literature. In particular, we find that alternativeinvestments (see Decker (2003)) and structured products (see Knop (2002) and Glen and Pinedo(2013) ) can take on a wide range of risk levels and complexity (see article by Decker (2013)).

21
1
2
3
4
5
1 2 3 4 5
RISK
RAT
ING
COMPLEXITY RATING
Figure 5.1: Rating of Single Securities
1
2
3
4
5
1 2 3 4 5
RISK
RAT
ING
COMPLEXITY RATING
Figure 5.2: Rating of Money Market andBond Funds
22
1
2
3
4
5
1 2 3 4 5
RISK
RAT
ING
COMPLEXITY RATING
Figure 5.3: Rating of Multi Asset Funds
1
2
3
4
5
1 2 3 4 5
RISK
RAT
ING
COMPLEXITY RATING
Figure 5.4: Rating of Equity Funds
23
1
2
3
4
5
1 2 3 4 5
RISK
RAT
ING
COMPLEXITY RATING
Figure 5.5: Rating of Alternative Funds
1
2
3
4
5
1 2 3 4 5
RISK
RAT
ING
COMPLEXITY RATING
Figure 5.6: Rating of Structured Products

24
6. CONCLUDING NOTE
As financial markets develop, product vendors are innovating and introducing more sophisticatedproducts to retail investors. These products are not your typical plain vanilla investments but arecomplicated investment schemes with derivatives embedded in them. While investors recognized thatsuch products can be risky, they are less aware of their complexity. The structuring embedded in theinvestments makes it difficult for investors to determine the final outcome of their investment atmaturity. To make informed investment decisions, investors would like to be cognizant of key productfeatures, primarily its return, risk and contingent events that can result in potential loss. A frameworkthat calibrates a financial product’s underlying risk and complexity level can be useful in aidinginvestors make such trade-offs. It is also useful to financial institutions which are keen to get the rightmatch between products and investors based on their risk tolerance and investment sophistication.
Extensive literature research on risk or complexity classifications adopted by other countries showedthat no financial market regulator has hitherto implemented a robust framework that integrates bothrisk and complexity as two separate distinct dimensions. While classifying products into different riskclasses has been widely adopted by regulators and practitioners for many years, classifyingcomplexity is not as prevalent. Some practitioners have placed complex products into 3 categories,from highly complex products to simple products. Such a simple classification method does not breakdown complexity into contributing factors and is too subjective and not robust.
This paper proposed a framework which first characterizes product with two key dimensions, namely,risk and complexity. Risk is then decomposed into 6 main factors of volatility, liquidity, credit rating,duration, leverage and degree of diversification. Product complexity can be measured by 5 basicfactors of number of structured layers, expansiveness of derivatives used, availability and usage ofknown valuation models, number of scenarios determining return outcomes and transparency /ease ofunderstanding.
Some financial institutions in Singapore and Switzerland have started using in-house or proprietaryclassification of risk, and in some cases included complexity as a sub-factor of the overall risk. Butour observation is that, the industry, as a whole, does not have a common coherent methodology.Addressing complexity through a risk classification system is an ad hoc adjustment.
We believe the proposed integrated framework can readily be adopted widely by industry players tomake financial products more transparent for investment. This will ultimately help to spur financialproduct innovation and design, taking into consideration the appropriate combination of risk andcomplexity that will correspond with the investment suitability profile of investors. The methodologythat we have developed can be further extended in future efforts towards building a portfolio riskassessment framework. This is made easier by having all portfolio products rated for risk andintroducing an approach to amalgamate the individual contributions to the overall portfolio risk.
In developing an overall risk and complexity framework, the authors are well aware that it cannot beused without the corresponding “client investment profiling” process that is mandatory for allfinancial institutions as part of the sales and investment suitability process. In focusing solely on theproduct characteristics and in not dealing with client’s investment preferences in this framework, weavoid making a judgment call on the type of clients who can invest in any product. This is best left tothe distributor of the financial product and the Client Relationship Manager or Investment Advisorwho can evaluate the disposition of his client holistically.

25
The advantage of our approach is that service providers retain the flexibility to segment their ownmarket and match products to the appropriate risk tolerance and sophistication of these clients.Products properly classified by risk and complexity may, therefore, be offered to clients with thecorresponding risk tolerance and levels of sophistication. In order for this to be possible, there wouldof course be some form of calibration and alignment of the risk profiling inputs so as to preserve theconsistency and common language with regards to the levels of risks and complexity in question.
It is interesting to note that so far, low complexity products that generally have lower margins areusually offered to the more conservative public. More complex structured products that generallyhave higher margins are offered to the more sophisticated and high net-worth clients. In the absenceof a comprehensive risk and complexity framework, this may be the best way to go about it. However,the proposed framework has the potential for better client-customization and risk/sophistication tuningto reach out to a wider group of investors who are offered products based appropriately on theirappetite for risk and complexity.
We have simulated and stress-tested the proposed framework with a range of weights for the chosenfactors. The proposed framework is technically robust and the relative classification by risk andcomplexity would not deviate drastically if factor scores are varied marginally. However, there is acaveat in the use of the proposed classification framework. The results, though robust under currentnormal and extreme market environment, is still largely sample specific and the initial classificationhas depended on the sample of funds. The relative ranking of products by risk or complexity will holdunder normal and extreme conditions, but the factor scores may change if an evaluated productencounters new factors or situations not previously assessed. That is, while the current rankings areconsistent with professional consensus, the relative positions may change if the market structure altersconsiderably.
The envisaged portability of the framework is not limitless. Though it could be rare, there could besituations where a qualitative assessment is further required to properly interpret or clarify thefindings. This can happen within the same asset class or product offering when occasionally, one ortwo product rankings differ substantially from some preconceived experts’ opinion. Hence, it maywell be that some products would have to be evaluated on a “case-by-case” basis, particularly,individual products that are significantly “more complicated.”
To implement such a classification scheme for the whole financial sector, the following should betaken into consideration:
(a) All investment products are evaluated by a single agency to be appointed by the regulatorybody to ensure uniformity and consistency;
(b) Investment products will be evaluated by product distributors, allowing for minimal disruptionto the distributors’ own rating system and amicable to their own investment suitabilityframework and clientele; or
(c) Products will be evaluated by product producers at factory door, given that producers know theproducts best and there is a single risk or complexity rating when a product is sold in thevarious distributors’ network.
Implementation requires recalibration at regular intervals incorporating a wide range of differentproducts. Regular monitoring and update are essential to ensure relevance to investors with the

26
changing investment environment. In general, there should at least be an annual review exercise forall products while maintaining flexibility to change any product rating anytime due to material changein the characteristic input factor conditions.
The implementation of the framework could initially be carried out on a voluntary basis. In this case,product producers or distributors may wish to voluntarily evaluate their investment products usingrating procedures with the proposed or a similar framework of risk and complexity. This approachwould promote wider understanding and acceptance for the concepts of, and factors contained withinrisk and complexity.
Organizations implementing or administering a framework for risk and complexity need to analysethe associated costs and benefits prior to implementation. A risk and complexity rating scheme mayassist firms to communicate the product features and provide for effective branding. However, it isconceivable that some firms may not find the rating scheme useful and prefer to delayimplementation until a later time.
A well-constructed framework will also provide warning to investors regarding the uncertainty ofreturns. Investors who require a higher rate of return should take cognizance of the higher complexitythat often comes with seemingly lower risks. Besides simply evaluating risk and complexity offinancial products, the advisors have to ensure that the range of products matches the needs ofinvestors with average to high net worth. More importantly, producers and distributors of financialproducts have a common platform to develop and offer appropriate products to investors. Theproducers and distributors can also select their preferred market segments to focus on.
The successful implementation of any classification system of risk and complexity requires the buy-inand strong support of all interested parties. This may not be easy but is plausible. It would provide amajor step forward in the smooth and efficient running of the financial markets.

27
REFERENCES
Investment Suitability
“The Joint Forum on Customer Suitability in the Retail Sale of Financial Products and Services,”Bank of International Settlements, 2006.
Mark Ryser and Allesandro Lana, “Investment Suitability and Product Classification,” GARPSwitzerland Chapter Meeting, 14 January 2010.
“Investment Suitability,” Ernst & Young Publications, 2009.
Risk
“Structured Report,” WestLB Equity Market Commentaries, May, 2011.
“Investor Protection and Capital Markets Improvement Act” (Anlegerschutz- undFunktionsverbesserungsgesetz), Commission of European Securities Regulators (CESR) technicaladvice 09/1026 dated December 2009.
Andy Lo (2008), “Hedge Funds, Systemic Risk, and the Financial Crisis of 2007-2008.” Writtentestimony prepared for the House of Representatives on Oversight and Government Reforms: Hearingon Hedge Funds.
Koh, F, Lee D, and Phoon, KF (2002), “An Evaluation of Hedge Funds: Risk, Return and Pitfalls.”Singapore Economic Review, Volume 27, No. 1, pp. 153-171.
Black, Fisher (1993), “Estimating Expected Return,” Financial Analyst Journal, Vol. 49, No. 5, pp.36-38.
Lambert, M. “Hedge Fund Market Risk Exposures: A Survey,” Revue de l'association française definance, Vol.33, No. 1, pp. 39-77.
Jawadi, Fredj and Khanniche, Sabrina (2012), “Modeling Hedge Fund Exposure to Risk Factors,”Economic Modelling, Jul 2012.
Decker, Tim, “Alternative Funds: You Have Been Warned about their Differences,” Central PennBusiness Journal, Oct 2013, Vol 29 Issue 41, pp. 14-17.
Brandon, Rajna Gibson and Wang, Songtao (2013), “Liquidity Risk, Return Predictability, and HedgeFunds’ Performance: An Empirical Study,” Journal of Financial and Quantitative Analysis, Vol. 48,No. 1, Feb 2013, pp. 219-244.
Zhou, Jian (2012), “Extreme Risk Measure for REITs: a Comparison among Alternative Methods,”Applied Financial Economics, 2012, pp. 113-126.
Lu, Chia-Wu, Chen, Tsung-Kang and Liao, Hsien-Hsing (2013), “Underlying Asset Liquidity,Heterogeneously Informed Investors, and REITs Excess Returns,” Managerial Finance, Aug 2013,Vol. 40 Issue 1, pp. 72-96.
Chatrath, Arjun, Christie-David, Rohan A. and Ramchander, Sanjay (2012), “Public Information,REIT Responses, Size, Leverage, and Focus,” Journal of Real Estate Research, Dec 2012, Vol. 34Issue 4, pp. 463-513.

28
Pan, Lance (2008), “How Safe are Money Market Funds? Risk Assessment and Selection Criteria,”Journal of Corporate Treasury Management, May 2008, Vol. 2, No. 1, pp. 20-26.
Kacperczyk, M and Schnabl, P (2013), “How Safe are Money Market Funds?” Quarterly Journal ofEconomics, Aug 2013, Vol. 128 Issue 3, pp. 1073-1122.
Hasse, Lars Helge, Johanning, Lutz, Rudolph, Bernd and Schweizer, Denis (2012), “Open-endedProperty Funds: Risk and Return Profile - Diversification Benefits and Liquidity Risks,” InternationalReview of Financial Analysis, Jan 2012.
Complexity
“Characteristics of Complex Products and Heightened Supervision,” Regulatory Notice 12-03,FINRA, Jan 2012.
“Guidance on Product Design and Features,” UK Financial Services Authority, Nov 2011.
“Criteria for Moratorium on Sales of Complex Products,” The Belgian Financial Services andMarkets Authorities (FSMA), Sep 2011.
“Moratorium on the Distribution of Particularly Complex Structured Products,” UK FinancialServices Authority, 29 July 2011.
“Indicators of Problems with Products: Flaw and Detrimental,” FS11/3, UK Financial ServicesAuthority, Jun 2011.
“Indicators of Problems with Products: Flaw and Detrimental,” DP11/1, UK Financial ServicesAuthority, Jan 2011.
“Review of the Markets in Financial Instruments Directive,” The European MiFID, Dec 2010.
“Risk-labelling of Investment Products,” The Danish Ministry of Economic and Business Affairs, Oct2010.
“Criteria of Structured Investment Funds and Complex Debt Services (AMF Position No 2010-05-15),France Autorite Des Marches Financiers, Oct 2010.
Carlin, Bruce Ian and Manso, Gustavo (2011), “Obfuscation, Learning, and the Evolution of InvestorSophistication,” Review of Financial Studies, Mar 2011.
Franck, Alexander and Walter, Andreas (2012), “Portfolio Complexity and Herd Behaviour: Evidencefrom the German Mutual Fund Market,” Kredit und Kapital, 2012.
Good, Nick,“iShares Exec: ETF Complexity Hurting Business,” Fund Action, Oct 2011, pp. 36.
Jackson, Gary “Trusts’ Complexity does not Sway Investors, Morningstar Finds,” Fundweb, May2012, pp. 9.
Roseen, Tom, “The Changing Complexity of Exchange-Traded Funds,” On Wall Street, Dec 2012,Vol. 22 Issue 12, pp. 40-41.
Bigda, Carolyn and Wang, Penelope, “ETFs Why So Complicated?” Money, Sep 2012, Vol 41 Issue8, pp. 88-93.

29
Daxner, Alan, “Balanced Funds – Three Levels of Complexity,” Benefits Canada, Dec 2009, Vol. 33Issue 12, pp. 3.
Brunnermeier, Markus K. and Oehmke, Martin (2009), “Complexity in Financial Market,” WorkingPaper, Sep. 2009.
Carlin, Bruce Ian (2009), “Strategic Retail Complexity in Financial Markets,” Journal of FinancialEconomics, 2009, pp. 278-287.
Regulation
Valentine, Tom (2008), “The Regulation of Investments,” Economic Papers, Sep 2008, Vol. 27, No. 3,pp. 272-285.
Pearson, Thomas C. and Pearson, Julia Lin (2007), “Protecting Global Financial Market Stability andIntegrity: Strengthening SEC Regulation of Hedge Funds,” North Carolina Journal of InternationalLaw & Commercial Regulation, 2007, Vol. 33 Issue 1, pp. 1-82.
Pagliari, Stefano (2012), “Who Governs Finance? The Shifting Public-Private Divide in theRegulation of Derivatives, Rating Agencies and Hedge Funds,” European Law Journal, Jan 2012, Vol.18, No. 1, pp. 44-61.
Rae, Glen and Pinedo, Anna (2013), “Structured Products: the Challenges of Regulating Complexity,”International Financial Law Review, Feb 2013, Vol. 32 Issue 1, pp. 83-83.
Schwarcz, Steven (2009), “Regulating Complexity in Financial Markets,” Washington UniversityLaw Review, Vol. 87 Issue 2, pp. 211-268.
Structured Product
Knop, Roberto (2002), “Structured Structured Products: a Complete Toolkit to Face ChangingFinancial Markets,” West Sussex, England: John Wiley.
GARP book reference
Jorion, Philippe (1997) “Value at Risk: The New Benchmark for Managing Financial Risk.” NewYork : McGraw-Hill.
Alexander, C (2008), “Market Risk Analysis, Volume IV: Value at Risk Models.” Chichester: JohnWiley & Sons.
Credit Risk and Counterparty Risk, Diversification and Systemic risk:
Jorion, Philippe, and Gaiyan Zhang (2009), "Credit Contagion from Counterparty Risk." The Journalof Finance Volume.64, No.5, pp. 2053-2087.
Jorion, Philippe (2009), "Risk Management Lessons from the Credit Crisis." European FinancialManagement Volume.15, No.5, pp. 923-933.
Brigo, Damiano, Massimo Morini, and Andrea Pallavicini (2013), “Counterparty Credit Risk,Collateral and Funding: With Pricing Cases for All Asset Classes.” Chichester: Wiley.

30
Gregory, Jon, and Jon Gregory (2012), “Counterparty Credit Risk and Credit Value Adjustment: AContinuing Challenge for Global Financial Markets.” Hoboken, NJ: Wiley.
Markowitz, Harry M (1991), “Portfolio Selection: Efficient Diversification of Investments.”Cambridge (Mass.): Basil Blackwell.
Bisias, Dimitrios, Mark Flood, Andrew W. Lo, and Stavros Valavanis (2012), "A Survey of SystemicRisk Analytics." Annual Review of Financial Economics, Volume.4, No.1, pp. 255-296.
Billio, Monica, Mila Getmansky, Andrew W. Lo, and Loriana Pelizzon (2010),"Measuring SystemicRisk in the Finance and Insurance Sectors." MIT Sloan School Working Paper Volume.4774, No.10.


![COMPLEX CLASSICAL FIELDS: A FRAMEWORK FOR ... … · complex classical fields: a framework for reflection positivity ... eld theory [15, 16]. assuming ... complex classical fields](https://img.dokumen.tips/doc/110x75/5b3c1d957f8b9a560a8d3241/complex-classical-fields-a-framework-for-complex-classical-fields-a-framework.jpg)