Embed Size (px)
Citation preview

A Risk-Adjusted Operating Model:
A Transformation Strategy for Insurers

2
A Volatile External Environment
Today, insurers are grappling with external challenges posed by a relatively volatile economic environment and the increased frequency of catastrophic events. These challenges have, in turn, increased the internal pressures within some organizations to better manage costs and possibly increase operational efficiency.
Globalization has increased the exposure of insurers to some risks because of adverse natural events across geographies and industries. On a worldwide level, the insured catastrophe losses totaled $65 billion in 2012, well above the $29 billion inflation-adjusted average of the last 30 years, revealing unexpected losses and unforeseen risk accumulation across global supply chains.1
A survey of insurance equity analysts commissioned by Accenture in 2012 indicated that, while the challenges facing many insurers worldwide are similar, their relative importance varies.2 Analysts believe that investment volatility (71 percent) and new regulations and reform (52 percent) are the biggest threats to North American companies. For European companies, regulations come first (61 percent) and investment volatility second (57 percent).2
Continuing low interest rates have also made it increasingly difficult for some insurers to meet their obligations. Facing moderately low returns on their investments in long-term debt securities, we believe many insurers are seeking alternate ways to improve their returns.
Other challenges loom on the regulatory front. The continued uncertainty around implementation dates for Solvency II and interdependencies with IFRS (International Financial Reporting Standards) regulation is a contributing factor related to the increased complexity and costs of implementation.3 While some firms have already made significant investments in preparing for implementation, they still face some uncertainty regarding both the timelines and the final implementation measures.3 A recent Standard & Poor’s (S&P) analysis indicates that such delays can undermine investor confidence in the industry sector.4 While there is no doubt that the regulations are needed and can help to add value to the industry, in the short-term the industry could consider addressing ongoing uncertainty and manage costs accordingly.
Regulatory concerns seem particularly significant for the nine global insurers identified in July 2013 as global systemically important insurers (G-SIIs).5 Specific policy measures may apply to them, affecting areas including recovery and resolution planning, enhanced group-wide supervision and higher loss absorbency requirements.

3

Evolution of the Risk Function: From Compliance Management to Value Generation As a result of the financial crisis, the importance of risk management has increased and, today, risk management has visibility at the board level.3
Firms understand the importance of risk management; the chief risk officer is often part of the executive leadership team and is typically involved in key business decisions.
The Accenture 2013 Global Risk Management Study identified a trend toward integration of risk into the strategic process and into areas outside the traditional scope of risk management, such as product development and pricing.6 This, we believe, can enhance the overall quality of decision-making.
Among insurers surveyed, the study revealed increased integration of risk management into core insurance processes. While insurers’ risk management and underwriting functions report a high degree of integration, many insurers are still in the process of integrating risk within their product development and innovation processes (Figure 1).
Figure 1. Integration of risk management with core insurance functions
What are the risk-oriented bodies currently in place within your organization?
To what extent is risk management embedded into the following core insurance functions within your organization?
Select survey results• Large majority have an underwriting committee (85%) and a financial risk committee (81%). In comparison the level of integration in other areas is relatively low
• More than 55% report a high degree of integration between the risk management and underwriting functions as well as corporate strategy
• Less than one-third report the existence of a new product committee and strong risk function integration with product development
• Low priority was assigned to the role of risk management in innovation
Underwriting committee 85%
81%
58%
56%
48%
40%
37%
31%
0%
Financial risk committee
Operational risk committee
Compliance committee
Technical risk committee
New product committee
Reinsurance committee
None of the above risk-oriented bodies exist
ALM* committee or ALCO
Underwriting 57%
54%
53%
53%
50%
50%
47%
38%
32%
Risk profile analysis and corporate strategy
Reinsurance and risk financing decision-making
Claims and benefits management
Policy administration
Capital management
Product pricing
Distribution and sales
Asset allocation management
31%Product development
*ALM - Asset Liability ManagementSource: Accenture 2013 Global Risk Management Study
4

Generating Returns on Large Investments Made for Regulatory ComplianceOver the past few years, surveyed insurers have made significant investments to achieve regulatory compliance. As seen in Accenture’s 2013 Global Risk Management Study, respondent firms are seeking to leverage the investments made for regulatory compliance to improve
reporting—both internally and with external stakeholders—and to improve their risk-adjusted performance management (Figure 2).
Insurers tend to be switching gears from project implementation to generating value from investments that have already been made.
Figure 2. Benefits from regulatory compliance investments
Improved internal reporting capabilities
Source: Accenture 2013 Global Risk Management Study
65%
61%
60%
60%
54%
53%
48%
44%
32%
Improved communication to the public
Improved risk-adjusted performance management
Better integration of finance and risk
Reduced financial risk
Improved external reporting capabilities for supervisors and regulators
Stronger integration of risk in rewards and incentives for employees
Exploitation of synergies in data sourcing and management, model development and asset valuation
Reduced costs through joint compliance to accounting standards and insurance regulation
No improvements expected 0%
5

Operational Efficiency for IT System and Data Integration Today there is increased focus on data management, integration and quality of data. The need for accurate data to drive timely reporting is a factor driving greater integration at the operational level.
Applying sound data management principles through increased transparency, clear governance and ownership—along with a clear data management road map—will not only help reduce the operational costs of meeting changing regulations but can also enhance the quality of external reporting.
In addition, as insurers have expanded their business product offerings and grown across geographies, we believe the overall IT support structure needs to move from a disparate architecture to a more comprehensive IT landscape which can typically handle more
volume and greater complexity. As the level of automation increases, it can help drive down the overall cost of operations. Insights derived from the Accenture 2013 Global Risk Management Study3 support our perspective that increasing the usage of internal models and strengthening governance processes can also help drive the need for the timely availability of data. Longer-term, this might also support new requirements for data storage and retrieval such as “big data” and high-performance storage and retrieval.
Figure 3. Data management drivers
Rising external and internal demand for data …
… leads to new challenges for data management …
Source: Accenture Risk Management, November 2013
… resulting in increased operational costs for many insurance companies
Country and EU Supervisors• Local GAAP and IFRS financial reporting
• Solvency II quantitative and qualitative reporting and ORSA
Central Banks • Ad-hoc requests due to instability of financial markets
Capital Markets/Rating Agencies• New demands on speed and detail of disclosure after catastrophes/market events
Internal• Value-based management
• New executive compensation schemes based on risk-weighted results
• Increased data requirements regarding number, granularity and structure of key figures
• New requirements regarding alignment of finance and risk closing data flows to meet overlapping and demanding timelines
• Increasing dependencies between risk and finance data flows resulting in new reconciliation requirements
• Timeline to implement new requirements leads to “patchwork” of systems and data flows
• Increased resource requirements and cost for non-value adding data management tasks both for IT and business department
• Missed reporting deadlines and quality issues in internal and external disclosure
6

7

From Planning to Action: An Approach to RAOM
The large programs in which insurers have invested to meet regulatory requirements can form the foundation blocks for an operating model transformation. Such a transformation can help drive down costs and generate value for the organization.
In our view, the risk and finance functions are two of the key catalysts for such transformations, which can be typically implemented at multiple levels within each of the capabilities listed below:
Strategy and visionRisk management processes can be integrated into strategic planning. Using a clear definition of risk appetite can support risk-adjusted decision-making. If the risk appetite is clearly assessed, confirmed and communicated within the organization, it can also serve as an input for business decisions, helping to drive efficient use of capital.
Process (re-)design and integrationRedesigning core insurance processes can help spur consideration and use of relevant risk techniques. For example, the new product development process might be strengthened by incorporating a detailed scenario analysis. And the use of industry standard tools for process analysis and design can help insurers identify and possibly reduce duplicative processes and activities that add less value.
Refinement of IT framework, methods and toolsIndustry-specific reference architectures can help firms identify gaps, derive solution options and enhance existing capabilities. In our experience, using a comprehensive and common IT landscape for multiple functions tends to increase synergy and may reduce long-term total cost of ownership. In addition, the implementation of a consistent data management and quality framework along with data integration provides a vehicle for embedding risk within the business and can generate real benefits from the firm’s recent regulatory investment.
Use of centralized, managed services solutionsTo derive economies of scale and drive down operating costs, best-of-breed managed services solutions with strong analytic models may be considered if they conform to the firm’s overall strategy and help drive down costs. In large global organizations, these tend to be centralized solutions meeting specific management and external needs. For example, the firm can have a managed services function address different regulatory reporting needs across jurisdictions. This can be integrated with the different business units across regions to handle various regulatory needs.
8

Risk-Adjusted Operating Model Approach
The Accenture RAOM Approach was first described in “A New Risk-Adjusted Operating Model for the Insurance Industry”.7 The RAOM can help clients build robust risk management capabilities which are consistent with their target level of sophistication.
There are four key phases in the RAOM Approach (Figure 4):
Target and deliver value – Get a clear view of the client’s situation and challenges to identify high level opportunities for creating value. These opportunities are then tracked and measured over the life of the project. A strategic assessment is carried out which helps identify opportunities to create value, and multiple ready-made diagnostic tools and repositories are used to identify the maximum value generators.
Diagnose and explore – Performing an in-depth assessment of the firm’s market, business model and operating model can help determine improvement areas and options for value capture. Relevant process analysis tools are deployed to benchmark the organization’s existing processes against market leading practices.
Blueprint solution design – Translating high level options into concrete, detailed, and actionable recommendations at the capability level can enable execution teams to implement and capture value. This phase covers specific changes which may need to be made to the existing operating model to generate value.
Execute – Implementing changes in collaboration, in ways that can maintain value creation, momentum, and organizational alignment, transferring skills and knowledge along the way.
Figure 4. Accenture Risk-Adjusted Operating Model Approach
Target and Deliver ValueHigh-level strategic assessment
• Maturity assessment
• Operating model adjustments identified and socialized
• Indicative industry benefit benchmarks
• Strategic assessment to define business case for diagnostics and identify compliance opportunities
• Metrics to track results
Source: Accenture, A New Risk-Adjusted Operating Model for the Insurance Industry, 2012
Diagnose and ExploreGap analysis and closure approach
• Benchmark risk management (RM) function
• Assess RM processes, technology, data capabilities against industry best practices
• Adjustment to operating model
• Strategy
• Organizational design
• Process and technology architectures
• Sourcing strategy
ExecuteImplement changes
• Organization and governance
• Technology architecture
• Efficient and effective risk management function supporting business units
• Strong risk culture across the organization
Blueprint Solutions Design
• Design required organization adjustments (functions and processes)
• Software implementation roadmap defined
• Business case for change developed
Value generation
Improved business decision-making
Improved business results
Enhanced operational efficiency
9
Operating Model Transformation Measures
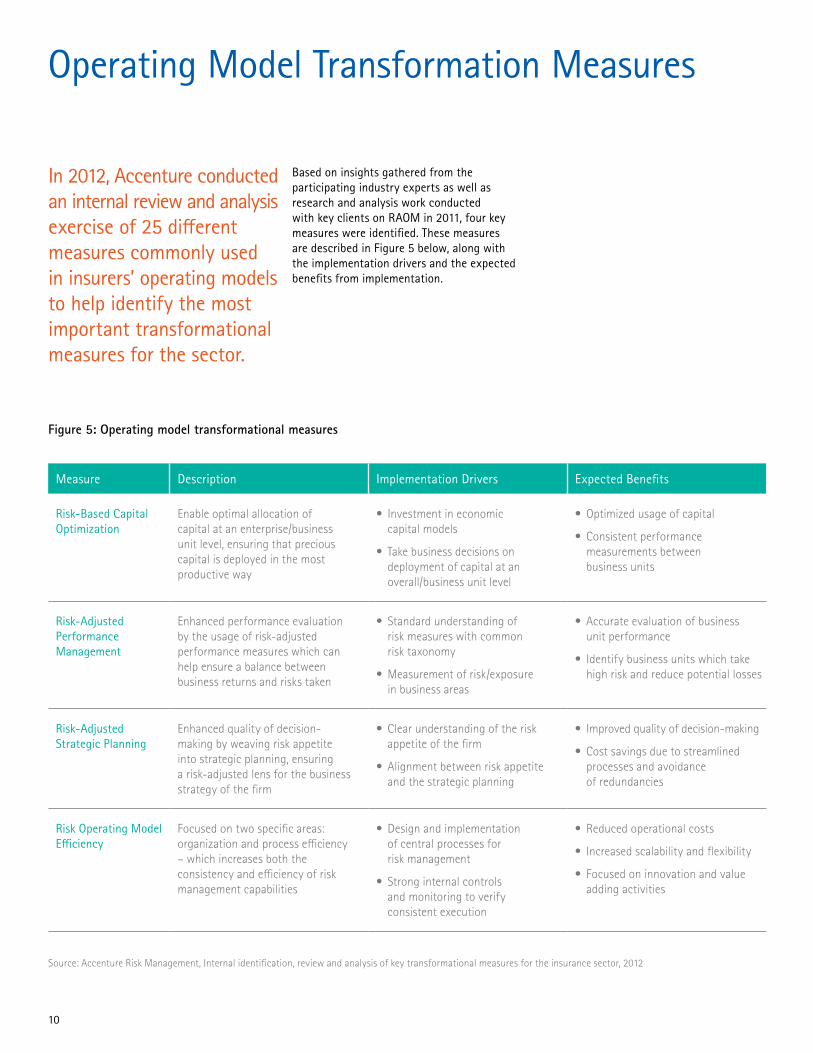
In 2012, Accenture conducted an internal review and analysis exercise of 25 different measures commonly used in insurers’ operating models to help identify the most important transformational measures for the sector.
Figure 5: Operating model transformational measures
Measure Description Implementation Drivers Expected Benefits
Risk-Based Capital Optimization
Enable optimal allocation of capital at an enterprise/business unit level, ensuring that precious capital is deployed in the most productive way
• Investment in economic capital models
• Take business decisions on deployment of capital at an overall/business unit level
• Optimized usage of capital
• Consistent performance measurements between business units
Risk-Adjusted Performance Management
Enhanced performance evaluation by the usage of risk-adjusted performance measures which can help ensure a balance between business returns and risks taken
• Standard understanding of risk measures with common risk taxonomy
• Measurement of risk/exposure in business areas
• Accurate evaluation of business unit performance
• Identify business units which take high risk and reduce potential losses
Risk-Adjusted Strategic Planning
Enhanced quality of decision-making by weaving risk appetite into strategic planning, ensuring a risk-adjusted lens for the business strategy of the firm
• Clear understanding of the risk appetite of the firm
• Alignment between risk appetite and the strategic planning
• Improved quality of decision-making
• Cost savings due to streamlined processes and avoidance of redundancies
Risk Operating Model Efficiency
Focused on two specific areas: organization and process efficiency – which increases both the consistency and efficiency of risk management capabilities
• Design and implementation of central processes for risk management
• Strong internal controls and monitoring to verify consistent execution
• Reduced operational costs
• Increased scalability and flexibility
• Focused on innovation and value adding activities
Source: Accenture Risk Management, Internal identification, review and analysis of key transformational measures for the insurance sector, 2012
Based on insights gathered from the participating industry experts as well as research and analysis work conducted with key clients on RAOM in 2011, four key measures were identified. These measures are described in Figure 5 below, along with the implementation drivers and the expected benefits from implementation.
10

Value Generation for the Insurer
A RAOM implementation can help generate multiple benefits for insurers. Applying the RAOM consistently throughout the organization can help achieve a positive impact on both the top and the bottom lines. Figure 6 presents RAOM benefit drivers and the possible value generated for the insurers.
In our view, RAOM can benefit insurers by adding value along the following dimensions:
• Increased enterprise value by improving business decision-making through alignment of risk appetite and overall strategy.
• Improvement in business results through the integration of risk and core insurance processes and alignment of processes and systems. By removing non-value adding processes, removing
duplicate processes and embedding risk into the core business processes, firms can make risk-adjusted decisions.
• Enhanced operational efficiency through an integrated and robust IT landscape as well as increased automation and robust IT support. And the use of a standard risk architecture, with no duplicate systems as well as improved data quality, can help reduce operating costs and improve the quality of decision-making through enhanced information.
Figure 6. RAOM benefits and possible value created
Benefit Drivers Key Outcomes
• Greater certainty can reduce cost of capital (insurance and operational risk)• Identifying/understanding diversification benefits
• Claims aligned with appetite (manage surprises)• Enhanced analytics make it easier to identify loss drivers (insurance and operations)
• Processes become more transparent, duplication is reduced and control made easier• Leaner functions with less overhead
• Improved risk-adjusted returns• Higher level of confidence in pricing/reserving assumptions (best estimate setting)
• Appropriate reward for risk taken• Targeted sales/marketing, aligned with appetite
Source: Accenture Risk Management, November 2013
• Reduced operational risk• Reduced underwriting risk• Reduced financial (liquidity) risk• Reduced enterprise risk
• Data-driven decision-making (appetite, strategy, product development and price)• Improved stakeholder confidence (happy to deploy their capital)
RAOM Benefits
Capital
Losses
Operational Efficiency
Competitive Advantage
Profitability
Revenue Enhancement
Value Increase
Cost Savings
Risk Reduction
11

A Risk-Adjusted Lens: Risk-Adjusted Performance Management (RAPM) A number of elements need to be considered to generate the full benefits of a Risk-Adjusted Operating Model. One of the key components of a successful transformation is the implementation of a capital optimization and steering approach which covers all phases, from planning, to evaluation and monitoring, and, finally, to execution.
From our work with large insurers across regions, and as shown in Figure 7, RAPM components tend to play an important role as prerequisites for the execution of capital optimization initiatives such as alignment of capital management and performance management with a shared metric system to embed risk management in the business.
Capital optimization is closely linked to RAPM. For example, one of the most important steps in the “Capital Optimization and Steering Approach” is the definition of risk appetite during the planning phase. This serves to create strategic guidelines along which the company can set its targets. Risk appetite, therefore, should be translated into a specific “risk metric” (such as economic capital) to steer the performance of the company.
This is where RAPM comes into play. By building risk-adjusted key performance indicators (KPIs) into the framework, insurers are able to steer operations based on the formulated risk appetite. Through the adaptation of performance based KPIs to risk-adjusted metrics such as RaRoRac (risk-adjusted return on risk-adjusted capital) and EVA (economic value-added), performance results can be reflected.
An important outcome of the introduction of risk-adjusted performance management is that it can help align discussions around target profit margin to those related to the value-at-risk—something shareholders would typically find desirable—and a potential step to enhancing overall enterprise value generation. In addition, a consistent performance management approach can offer insurers the possibility of measuring performance consistently across territories, different lines of business and functions within the company, which can lead to improved performance evaluation of business units and entities. This enables the insurer to improve existing capabilities for elements such as loss reduction, pricing, product development, portfolio optimization and sales force utilization.
Finally, RAPM can provide management with invaluable information about the different sources of value creation and, ultimately, the company’s key value drivers.
Figure 7. Capital optimization and steering approach
Capital Optimization and Steering Approach
Action
Capital optimization and management actions
Evaluation
Risk and capital valuation
Monitor
Monitoring and reporting
Risk mapping
Planning
Risk appetite definition and capital planning
Capital allocation
Risk policies and limits
Source: Accenture Risk Management, November 2013
1
2
34
5
6
12
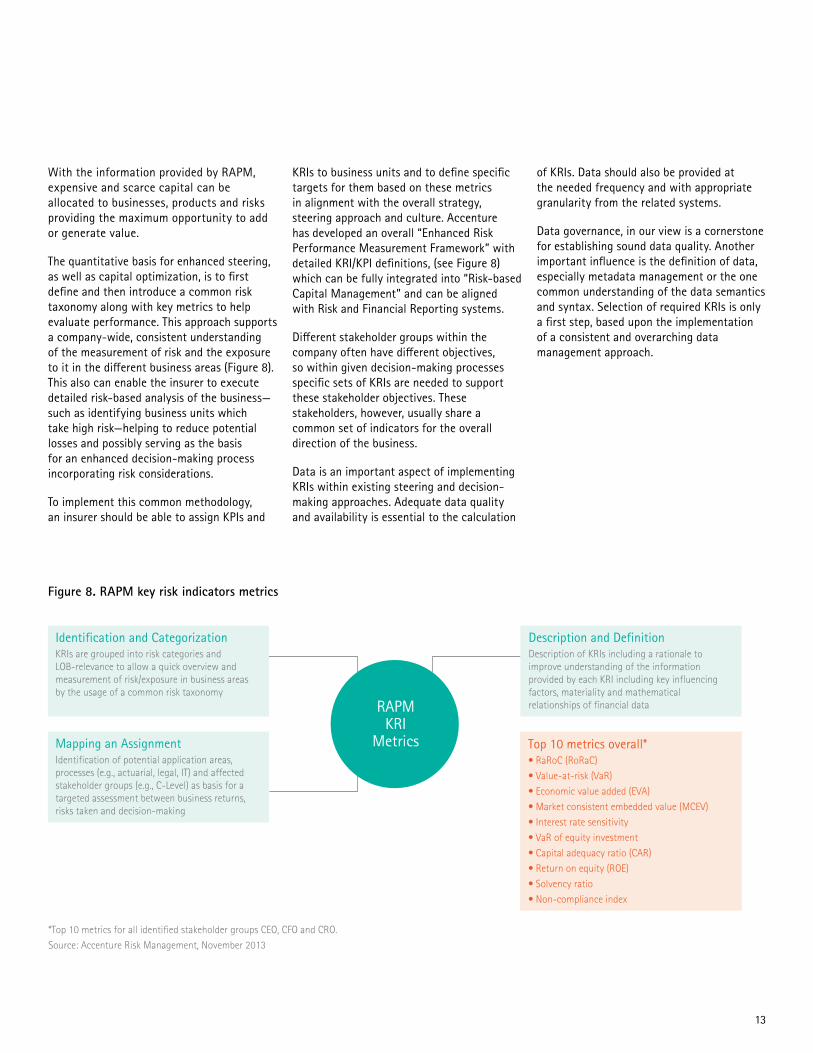
Figure 8. RAPM key risk indicators metrics
With the information provided by RAPM, expensive and scarce capital can be allocated to businesses, products and risks providing the maximum opportunity to add or generate value.
The quantitative basis for enhanced steering, as well as capital optimization, is to first define and then introduce a common risk taxonomy along with key metrics to help evaluate performance. This approach supports a company-wide, consistent understanding of the measurement of risk and the exposure to it in the different business areas (Figure 8). This also can enable the insurer to execute detailed risk-based analysis of the business—such as identifying business units which take high risk—helping to reduce potential losses and possibly serving as the basis for an enhanced decision-making process incorporating risk considerations.
To implement this common methodology, an insurer should be able to assign KPIs and
KRIs to business units and to define specific targets for them based on these metrics in alignment with the overall strategy, steering approach and culture. Accenture has developed an overall “Enhanced Risk Performance Measurement Framework” with detailed KRI/KPI definitions, (see Figure 8) which can be fully integrated into “Risk-based Capital Management” and can be aligned with Risk and Financial Reporting systems.
Different stakeholder groups within the company often have different objectives, so within given decision-making processes specific sets of KRIs are needed to support these stakeholder objectives. These stakeholders, however, usually share a common set of indicators for the overall direction of the business.
Data is an important aspect of implementing KRIs within existing steering and decision-making approaches. Adequate data quality and availability is essential to the calculation
of KRIs. Data should also be provided at the needed frequency and with appropriate granularity from the related systems.
Data governance, in our view is a cornerstone for establishing sound data quality. Another important influence is the definition of data, especially metadata management or the one common understanding of the data semantics and syntax. Selection of required KRIs is only a first step, based upon the implementation of a consistent and overarching data management approach.
Description and DefinitionDescription of KRIs including a rationale to improve understanding of the information provided by each KRI including key influencing factors, materiality and mathematical relationships of financial data
Identification and CategorizationKRIs are grouped into risk categories and LOB-relevance to allow a quick overview and measurement of risk/exposure in business areas by the usage of a common risk taxonomy
Mapping an AssignmentIdentification of potential application areas, processes (e.g., actuarial, legal, IT) and affected stakeholder groups (e.g., C-Level) as basis for a targeted assessment between business returns, risks taken and decision-making
*Top 10 metrics for all identified stakeholder groups CEO, CFO and CRO.
Source: Accenture Risk Management, November 2013
RAPM KRI
Metrics Top 10 metrics overall*• RaRoC (RoRaC)
• Value-at-risk (VaR)
• Economic value added (EVA)
• Market consistent embedded value (MCEV)
• Interest rate sensitivity
• VaR of equity investment
• Capital adequacy ratio (CAR)
• Return on equity (ROE)
• Solvency ratio
• Non-compliance index
13

Risk-Adjusted Steering through the Introduction of KRI DashboardsThe implementation of commonly shared and stakeholder group-specific sets of KRIs is an important step on the journey towards establishing a risk-adjusted operating model.
Once the KRIs are defined and the required data is available within the firm, the next step is to embed this information into management decision-making and steering processes.
Management usually bases its decisions on reports, scenarios, quantitative models, internal analysis and KPIs. A dashboard solution, can help ensure that the risk perspective is taken into account in the respective management processes, and illustrate the KRIs relevant for decision-making. The dashboard can
also be used to add key performance indicators already used by management for decision-making.
The dashboard solution shown in Figure 9 provides a general idea of how KRIs can be presented and tracked at a management level. As the different stakeholder groups have specific needs for their areas of responsibility, a flexible dashboard solution can offer drill-downs and individual views of KRIs and KPIs, supporting stakeholder-specific content and focus.
Figure 9. Example of a KRI dashboard
KRI Name: Description
KRI-0048: Product waivers
Monthly Red
Green
Green
Green
Green
Green
Yellow
Yellow
Dec 15, 2010 Feb 11, 2011
Feb 6, 2011
Feb 6, 2011
Feb 6, 2011
Feb 6, 2011
Feb 11, 2011
Feb 11, 2011
Feb 16, 2011
Jan 10, 2011
Jan 13, 2011
Jan 13, 2011
Jan 10, 2011
Sep 15, 2010
Jan 11, 2011
Jan 10, 2011
Monthly
Monthly
Monthly
Monthly
Monthly
Monthly
Monthly
Source: Accenture Risk Management, November 2013
Collection Frequency
Current Breach Status
Current Value Date
Next Value Date
Indicator Trend
KRI Value Last 12 Months
KRI-0046: Nostro breaks
KRI-0044: Money laundering
KRI-0043: Client complaints
KRI-0045: Non-standard contracts
KRI-0047: Payment frauds
KRI-0049: Suspense account balances
KRI-0050: Unauthorized transactions
Source: Accenture Risk Management, November 2013
14

15

Impact of RAPM on the Operating Model of the FirmWhile the use of KRIs can help implement RAPM, in our view changes in the performance management and evaluation framework are needed to fully transform the existing operating model to a RAPM. To achieve this, changes would be needed in selected components of the operating model to help ensure that the risk-adjusted view is executed consistently within the company. Figure 10 below illustrates the various operating model components.
One of the first steps in the adoption of an overall strategic framework and governance model is to consider risk in the decision-making and objective-setting processes. To integrate the strategic objectives
and to activate the governance system, consideration should be given to aligning and integrating the risk, finance and core insurance processes. This would also apply to relevant tools and architectures, integrated to develop a robust IT structure with an adequate level of automation. The implementation of a consistent data management approach is another prerequisite.
We expect insurers can realize some substantial benefits through the introduction of RAPM, including:
Process integration — Integration of risk management, tolerances, measurement and use of KRIs in processes such as strategic, financial and operational planning. The RAOM implementation can also offer the opportunity to centralize and rationalize risk and finance resources involved in risk measurement, reporting and analysis.
Financial impact – volatility, returns — Active management of interest rate sensitivity can help reduce earnings volatility and improve identification and prioritization of risk issues.
Productivity enhancement — Improved efficiency and transparency through improved monitoring of risks as well as “live-tracking” of risks typically without delay.
Process automation — Reduced risk related costs for reporting, workflow, auditing, control mechanisms, and data, as well as fewer errors due to standardized and fully automated processes.
Data - improved information and drill back — Achieved by implementing data models for KRIs, risk reporting, analysis and dashboards as well as enterprise-wide harmonized implementation and tracking of KRIs.
Technology/tool enablement — Improved performance reporting through the use of automated IT solutions and can help reduce legacy system retirement and maintenance costs.
Quality and content improvement — Enhanced ability to meet external regulatory, compliance and rating agency risk information requests as well as improved identification and prioritization of risk issues.
Figure 10. Integration of RAPM across core insurance capabilities
How should we align the organization to enable RAPM?
What RAPM processes are critical and how should they operate?
How should capabilities continuously evolve?
What are the data and data sources required for RAPM/KRIs?
What tools will enable efficient execution?
How do we integrate RAPM/KRIs into strategic planning?
What are the right skills required for each function?
How do we measure business partnering?
Source: Accenture Risk Management, November 2013
Who should be accountable for RAPM?
1. Strategy, Sponsorship and LeadershipAligning ERM vision, goals and RAPM
8. Value Identification and RealizationMeasuring success
2. GovernanceData, accountability, transparency and standardization
4. Process and Service DeliveryExecuting RAPM on a cost-efficient basis; optimizing business partnering
5. Talent ManagementLearning, development and engagement
6. Systems, Technologyand DataEnabling efficiency and effectiveness
3. Organizational Structure
Integrating RAPM across enterprise
7. Capability Development
Evolution of riskIntegrating RAPM with strategic planning and target setting
Aligning RAPM with capital allocation, optimization and KRIs
Integrating RAPM across core insurance capabilities (policy, U/W, claims, service, etc.)
Optimizing RAPM data, process, talent, technology and outputs
Source: Accenture Risk Management, November 2013
16

17

Risk-Based Capital Optimization
Insurers are generally required to optimize economic capital to evaluate the combined effects of risk-taking activities and the impact of such activities on economic value.
By incorporating risk-based capital models in their strategic decision-making processes, insurers can help optimize capital allocation from a risk versus reward viewpoint, and possibly achieve competitive advantage.
In our view, the lowered interest rates and flat yield curves speak to the growing importance of the cost of capital, while regulations such as Solvency II also help emphasize the need for capital optimization. As for rating agencies, they too seem to be feeling increased pressure to consider risk-based capital optimization methods.
Figure 11. Integration of risk-based capital model in an existing operating model
Operating Model
Risk-Based Capital Model
Business model Governance Processes IT and data
• Asset mgmt., ALM, SCR aggregation
• Capital planning
• Capital allocation
Source: Accenture Risk Management, November 2013
Risk governance (RM ⇔ actuary ⇔ compliance ⇔ internal audit)
• Risk policy
• “Risk-enabled processes”
• RM systems and solution(s)
• DWH, source system integration (ETL)
18

The Need for a Group-Wide Risk-Based Capital Model
Figure 12. Operating model transformation through RAOM
The risk-based capital model may be integrated into the day-to-day business of a traditional company. To obtain a risk-sensitive framework, insurers should consider including business models, governance, processes and IT infrastructure in this integration.
As a result, the transformed models are risk-adjusted and the processes are risk-driven (Figure 12).
The underlying IT architecture for risk and finance should reflect the right level of integration supporting a sound risk and capital position for the company, and deriving corrective actions through a focused risk and business reporting approach.
Operating Model Transformation Risk-Adjusted Operating Model
Risk-Adjusted Business Model and Governace
Risk-Based Capital Model
+
Operating Model
Business model Governance Processes IT and data
• Asset mgmt., ALM, SCR aggregation
• Capital planning
• Capital allocation
Risk governance (RM ⇔ actuary ⇔ compliance ⇔ internal audit)
• Risk policy
• “Risk-enabled processes”
• RM systems and solution(s)
• DWH, source system integration (ETL)
• (Re-)Pricing, product review
• Risk transfer (reinsurance, SPV)
• Asset management
• Cost and claims management
• Compensation
Risk-Driven Processes
• Decision-making processes
• Roles and responsibilities at BU level in risk taking and managing activities
• Risk policy implementation in business policy (pricing, UW, AM, reins., market, credit, strategic, etc.)
• Business standard review (UW, finance, reins. distribution, claims management, legal, IT, operations)
IT and Data • Integrated risk/finance architecture
• Risk and business reporting integration (e.g., risk-adjusted performance measurement, KRIs, risk dashboard, risk process effectiveness)
Source: Accenture Risk Management, November 2013
19

Figure 13. RAOM-based budgeting and planning process
Interactions in the budgeting and planning processes
Projected economic/available capital for business plan
• Market risk
• Underwriting risk
• Default risk
• Operational risk
Risk Capital Planning
• Definition of capital absorption underlying the business plan assumptions (e.g., sensitivities, stress tests, what-if-analysis)
• Verification of appropriateness with the strategic objectives including feedback to board of directors
Strategic Objectives
Market• Growth rates
• Market share
• Dividend policy
• Shareholders return
Budgeting and Planning
• Definition of business plan(s) per each entity/business unit
• Adjustments of business plan(s) to consider risk aspects
Source: Accenture Risk Management, November 2013
Risk appetite• Solvency ratio
• Credit rating
• Profit volatility
• Risk/return objectives
Risk Capital Quantification
Freq
uenc
y
0Tim
e
to
nt
Value
-
+
Capital planning The capital planning process is a core element of the RAOM transformation.
In capital planning, the strategic objectives are usually defined by the board of directors, with a primary focus on market objectives. The risk-based capital model allows for risk and risk appetite as additional strategic objectives for the company. The business and planning function can also incorporate market strategic objectives into the business plan, projecting estimated profit and loss and the financial statement for the duration of the business plan. The underlying planning assumptions can have a direct effect on capital required during the entire duration of the plan, measured by the risk management function with the support of the actuarial department. The required capital can be compared to the defined risk
appetite objectives to help see whether they are attainable based upon the simulated business plan.
If the RAPM objectives are not attainable at the tested levels of risk, the company should consider reviewing the underlying business plan assumptions, the strategic risk objectives, or the market objectives (Figure 13).
Capital allocation modelsFrom the group level the planning process is then moved to the business units, which adopt consistent processes based on RAOM principles.
An objective here is to measure the capital absorbed by the different business units—according to the business plan—and to perform a consistency analysis of the results
obtained in terms of the defined RAPM (and, in the case of modifying assumptions, the strategic risk or market objectives). Another consideration for insurers is to promote value by increasing their stake in profitable business units while reducing it in low-profitability business units.
Objectives in allocating capital to business units may include:
• Maximizing value of the company, giving management the ability to invest only in projects (or business units) that are profitable, and to plan and control the marginal contribution of each unit to the creation of sustainable value.
• Risk sensitivity/consciousness, increasing the awareness of the effective risk supported by the different business units in terms of capital, and the marginal
20

contribution of business units’ risk capital to the overall company risk capital.
• Planning and solvability by discouraging short-term solutions in favor of medium-to-long term stability, also ensuring a correct matching between the insurer’s own funds and the risk profile of the entity at different points in time.
• “De-risking” by reducing exposure to the risk of certain products and/or portfolios in favor of others.
• Performance measurement allowing management to compare performance among different business units.
Risk policies and limits based on risk appetite and business standardsRisk policies set out the requirements necessary to ensure an acceptable level of
risk the firm is willing to take, defined by RAPMs, limits or thresholds, at a business unit or process level. In addition, risk policies can interlink risk appetite and business standards. Risk policies should consider products (including life and non-life), investment management, operational risk and the firm’s own risk management framework.
Risk policies are divided among business standards focusing on processes and procedures required for all business areas. Each business standard usually refers to several operative requirements to be implemented across each affected process or control. Each risk policy provides guidelines to be followed during a “business as usual” scenario which can support a continuous, correct adaptation of risk policies.
These business standards are either product focused (in areas such as product
development, product approval, technical pricing, or claims handling) or investment focused (in credit and collateral management, asset valuation, liquidity and related areas).
Business standards implementation typically requires the involvement of the board of directors and all three lines of defense as outlined in Solvency II guidelines.8 Figure 14 presents a framework for addressing these lines of defense.
Figure 14. Risk and internal control framework for lines of defense (LoD)
Strategy and Risk Appetite Definition
Definition and approval of the strategy and the risk appetite of the company
Board sign off and closure of the business standard implementation
Identification of the main gaps with the standard and indication of a rating of compliance for all raised issues
Definition of a remedial action plan to cover the gaps identified in the gap analysis
Action plan implementationself-assessment on the closure of the gaps
Support to the risk committee in order to define an adequate risk appetite statement
Production of the risk policies, taking into consideration the risk appetite of the company
Collection of all evidence supporting the activities performedIndependent opinion on the adequateness and coherence of the risk and internal control framework used by 1° and 2° LoD
Production of the business standards, with a detailed definition which is aligned with the risk policies
Sign off of the gap analysis produced by the 1° LoD
Support, assessment and challenge/sign off on the remedial action plan defined by the 1° LoD
2° LoD review on the closure of the gaps
Risk Policy Definition
Business Standard Definition
Gap Analysis
Action Plan Definition
Business Standard Implementation
BOARD
1˚ LoD
2˚ LoD
3˚ LoD
Source: Accenture Risk Management, November 2013
21

Conclusion
A risk-adjusted operating model such as the one developed by Accenture can help firms integrate risk management into core operations, capital management and business processes.
This, in turn, can help insurers maximize enterprise value by allowing their management to invest in projects or business units that are profitable after taking into account the cost of needed capital. The risk-adjusted approach discussed can enable “de-risking” by reducing some of the firm’s exposure to high risk products and/or portfolios in favor of products/portfolios with more favorable risk/return metrics.
For more information about Accenture’s experience in managing end-to-end risk projects at an enterprise level, please contact us.
22

23

References1. “World, Natural Catastrophes, First Half 2013 Natural Catastrophes,” Insurance Information Institute, Catastrophes: Global, 2013. Accessed at: http://www.iii.org/facts_statistics/catastrophes-global.html
2. “Accenture Insurance Equity Analyst Survey – Outperforming the market in uncertain times,” Accenture, September 25, 2012. Accessed at: http://www.accenture.com/us-en/Pages/insight-pc-insurance-equity-analyst-survey.aspx
3. “Accenture 2013 Global Risk Management Study,” Accenture, September 17, 2013. Accessed at: http://www.accenture.com/microsites/risk-management-research/2013/Pages/home.aspx
4. “Q&A On The Future Of Solvency II: Pragmatism Is Likely To Prevail,” Standard & Poor’s Rating Services, RatingsDirect, May 15, 2013. Accessed at: http://static.ow.ly/docs/RatingsDirect_Commentary_1132107_05_15_2013_09_02_06_1ftj.pdf
5. “Global systemically important insurers (G-SIIs) and the policy measures that will apply to them,” Financial Stability Board communication, July 18, 2013. Accessed at: http://www.financialstabilityboard.org/publications/r_130718.pdf
6. “Property and Casualty Insurance Equity Analyst Survey: Outperforming the Market in Uncertain Times,” Accenture, September 25, 2012. Accessed at: http://www.accenture.com/us-en/Pages/insight-pc-insurance-equity-analyst-survey.aspx
7. “A New Risk-Adjusted Operating Model for the Insurance Industry,” Accenture, June 15, 2012. Accessed at: http://www.accenture.com/SiteCollectionDocuments/PDF/Accenture-A-New-Risk-Adjusted-Operating-Model-for-the-Insurance-Industry.pdf
8. “Guidelines on Preparing for Solvency II,” European Insurance and Occupational Pensions Authority. Accessed at: https://eiopa.europa.eu/consultations/consultation-papers/2013-closed-consultations/march-2013/guidelines-on-preparing-for-solvency-ii/index.html
About the AuthorsMarkus SalcheggerMarkus Salchegger is a managing director, responsible for Accenture Finance & Risk Services insurance in Austria, Germany and Switzerland. Markus holds a PhD in Mathematics, and over the past 18 years, he has used his extensive experience in insurance, reinsurance, banking, asset management and software development to analyze, design and deploy solutions for risk management and financial service applications that help clients become high-performance businesses.
Gerald R. RoopGerry Roop is a managing director working with the Accenture insurance practice in North America. Gerry has extensive industry and consulting experience in financial services, primarily insurance and reinsurance, as well as brokerage, banking and capital markets. He has led initiatives to establish finance strategy, target operating models, talent management capabilities, in addition to insurance risk management initiatives focused on risk processes, technology and measurement, and the integration of core insurance capabilities.
Daniel KimmerleDaniel is a senior manager with Accenture Finance & Risk Services group, based in Munich. Daniel uses his extensive experience in risk management and compliance to support insurers and reinsurers in analyzing, designing and implementing their risk management solutions and helping them comply with regulatory requirements and become high-performance businesses.
About AccentureAccenture is a global management consulting, technology services and outsourcing company, with approximately 319,000 people serving clients in more than 120 countries. Combining unparalleled experience, comprehensive capabilities across all industries and business functions, and extensive research on the world’s most successful companies, Accenture collaborates with clients to help them become high-performance businesses and governments. The company generated net revenues of US$30.0 billion for the fiscal year ended Aug. 31, 2014. Its home page is www.accenture.com.
Disclaimer: This document is intended for general informational purposes only, does not take into account the reader’s specific circumstances, and may not reflect the most current developments. Accenture disclaims, to the fullest extent permitted by applicable law, all liability for the accuracy and completeness of the information in this document and for any acts or omissions made based on such information. Accenture does not provide legal, regulatory, audit or tax advice. Readers are responsible for obtaining such advice from their own legal counsel or other licensed professional.
Stay ConnectedAccenture Finance & Risk Services: http://www.accenture.com/microsites/financeandrisk/pages/index.aspx
Connect With Us https://www.linkedin.com/ groups?gid=3753715
Join Us https://www.facebook.com/ accenturestrategy
https://www.facebook.com/ accenture
Follow Us http://twitter.com/accenture
Watch Us www.youtube.com/accenture
Copyright © 2015 Accenture All rights reserved.
Accenture, its logo, and High Performance Delivered are trademarks of Accenture.
14-6085/11-10079