Embed Size (px)
Citation preview

Natural England Joint Publication JP025
A Review of the Population and Conservation Status of British Mammals: Technical Summary
First published June 2018
www.gov.uk/natural-england

Authors Mathews F., The Mammal Society & University of Sussex
Kubasiewicz L. M., The Mammal Society
Gurnell J., Queen Mary University of London
Harrower C. A., Centre for Ecology and Hydrology
McDonald R. A., Environment and Sustainability Institute, University of Exeter
Shore R. F., NERC Centre for Ecology & Hydrology
Further information Natural England evidence can be downloaded from our Access to Evidence Catalogue. For more information about Natural England and our work see Gov.UK. For any queries contact the Natural England Enquiry Service on 0300 060 3900 or e-mail [email protected]
Copyright This report is published by Natural England under the Open Government Licence - OGLv3.0 for public sector information. You are encouraged to use, and reuse, information subject to certain conditions. For details of the licence visit Copyright. Natural England photographs are only available for non-commercial purposes. If any other information such as maps or data cannot be used commercially this will be made clear within the report.
ISBN 978-1-78354-485-1 © Natural England and other parties 2018

A Review of the Population and Conservation Status of British
Mammals: Technical Summary
Mathews F.,1 Kubasiewicz L. M.,2 Gurnell J.,3 Harrower C. A.,4
McDonald R. A.,5 Shore R. F.6
A report by the Mammal Society under contract to Natural England, Natural Resources Wales and Scottish Natural
Heritage
1 The Mammal Society & University of Sussex, John Maynard Smith Building, Falmer, BN1 9QG. 2 The Mammal Society, 18 St John’s Church Road, London, E9 6EJ. 3 Queen Mary University of London, Mile End Road, London, E1 4NS. 4 Centre for Ecology and Hydrology, MacLean Building, Crowmarsh Gifford, Wallingford, OX10 8BB. 5 Environment and Sustainability Institute, University of Exeter, Penryn Campus, Penryn, Cornwall, TR10 9FE. 6 NERC Centre for Ecology & Hydrology, Lancaster Environment Centre, Library Avenue, Bailrigg, Lancaster, LA1 4AP.
Author for correspondence: Fiona Mathews [email protected]; [email protected]
This publication should be cited as: Mathews F, Kubasiewicz LM, Gurnell J, Harrower CA, McDonald RA, Shore RF. (2018) A
Review of the Population and Conservation Status of British Mammals: Technical Summary.
A report by the Mammal Society under contract to Natural England, Natural Resources
Wales and Scottish Natural Heritage. Natural England, Peterborough.

Executive summary
1. We present the first comprehensive review of the status of British mammal populations
for over 20 years. The population size, range size, temporal trends and future prospects
of Britain’s 58 terrestrial mammals are assessed. Island races and feral mammals are
excluded from the main review, but are considered in the appendix.
2. Britain has 44 native species that arrived before the formation of the English Channel.
Previously extinct in the wild, the beaver has been reintroduced into Scotland and
England in the last decade. The wild boar, also previously extinct, has been the subject
of several illegal releases over recent years: the provenance of current populations is
unknown. There are 7 species that, although introduced by human activities, are
considered naturalised and have formed part of Britain’s fauna since at least Roman
times. The remaining 7 species are more recent introductions.
3. The geographical ranges of 18 species have increased since 1995; 4 have declined;
and 22 have remained stable. A lack of data prevented assessment of the remaining 14
species.
4. Population sizes have increased since 1995 in 15 species; 9 have declined; and 4 have
remained stable. A lack of data prevented assessment of the remaining 30 species.
5. All of the species recently introduced to Britain show an increase in geographical range
except the brown rat, which is stable, and the American mink, where there are
differences between countries. Additionally, all show an increase in population size
except the brown rat which appears — on the basis of very poor data — to be stable,
and the American mink which appears to be in decline. There are important data
deficiencies for all introduced species that need to be addressed urgently.
6. Among native and naturalised species where change could be assessed with
reasonable confidence, there have been increases in the geographical range of the
following animals:
• Otter, pine marten and polecat.
• Red, fallow and roe deer.
• Greater and lesser horseshoe bat.
• Beaver and wild boar (both of which have become established since the last
review, following releases from unknown sources).

Population sizes have increased for the following species:
• Otter, pine marten, polecat and badger.
• Red and roe deer.
• Greater and lesser horseshoe bat.
• Beaver and wild boar.
7. Among native and naturalised species where change could be assessed with
reasonable confidence, there have been decreases in the range of the following
species:
• Red squirrel.
• Black rat.
• Wildcat.
• Grey long-eared bat.
8. Population sizes have declined for the following species:
• Hedgehog.
• Rabbit.
• Red squirrel.
• Hazel dormouse.
• Orkney vole.
• Water vole.
• Black rat.
• Wildcat.
9. Formally approved Regional Red List assessments were conducted for native species in
Great Britain according to the International Union for Conservation of Nature (IUCN)
criteria. Approved assessments were also made for the Orkney vole, which is
naturalised, because it is officially recognised as an island sub-species; and for the
lesser white-toothed shrew because of uncertainty about whether it is naturalised or
native. The assessments placed 26 species in the Least Concern category (meaning
that the risk of extinction in the near future is low).Ten native species, plus the Orkney
vole, were classified as Threatened (meaning that they face a high risk of extinction).
Four native species, plus the lesser white-toothed shrew, were classified as Near
Threatened (meaning that they were close to qualifying as Threatened, or are likely to
qualify in the near future). Insufficient evidence was available to allow assessment of the
other 4 species.
10. All species under review lacked some of the data required for robust estimation of
population size. The most common issue was that no information was available on the
percentage of potentially suitable habitat within the range that was actually occupied. In
these cases, 100% occupancy was assumed, which will usually have led to
overestimated population sizes. For example, the Bechstein’s bat was assumed to be
present in all deciduous woodland, and the red deer in all woodland, within their
geographical range.
Robust population density data were lacking for all bats, with the exception of the
greater and the lesser horseshoe. There were insufficient data to permit population size
estimation at all for the whiskered, Brandt’s and Alcathoe bats (cryptic species),
barbastelle bat, Leisler’s bat, and the potentially migratory Nathusius’ pipistrelle bat.
One other bat, the noctule, also had a score of zero for population estimate reliability.
For this species, estimates could be computed, but they were based on very restricted
data, resulting in correspondingly large confidence intervals.
Reliability scores of zero were also assigned to the population estimates for the water
shrew, lesser white-toothed shrew, harvest mouse, and weasel, and it was not possible
to compute a population estimate at all for the Orkney vole. Overall, 40% of the non-bat
species, including all of the shrews, had very poor reliability scores (<=1).
11. Several drivers were associated with temporal changes in population size or range.
Fifteen species are currently controlled to reduce their impact on the environment or on
other species. Eighteen species have been affected by changes in habitat quality or
availability since 1995.
12. The review presents the most up-to-date assessment of population size and status for
the 58 terrestrial mammals in Britain. It highlights an urgent requirement for more
research to assess population densities in key habitats, and to assess the percentage of
potentially suitable habitat where a given species actually occurs: at present, uncertainty
levels are unacceptably high. It is possible that declines in many species are being
overlooked because a lack of robust evidence precludes assessment. There is also an
urgent need to quantify precisely the scale of declines in species such as the hedgehog,
rabbit, water vole and grey long-eared bat, and, where necessary, to identify the causal
factors. Finally, effective and evidence-based strategies for mammal conservation and
management must be developed.
Contents Executive summary Contents Methods ............................................................................................................................... 1
Overall approach ................................................................................................................. 1
Literature search .................................................................................................................. 2
Habitat data ........................................................................................................................ 2 Species status ...................................................................................................................... 3 Species’ distribution maps ..................................................................................................... 4 Population size assessment .................................................................................................... 5 Reliability assessment ........................................................................................................... 6 Changes through time ........................................................................................................... 7 Future prospects .................................................................................................................. 7 Species-specific methods ....................................................................................................... 7
ERINACEOMORPHA Hedgehog Erinaceus europaeus .............................................................................................. 8
SORICOMORPHA European Mole Talpa europaea ............................................................................................... 9 Common Shrew Sorex araneus ............................................................................................. 10 Pygmy shrew Sorex minutus .................................................................................................. 11 Water shrew Neomys fodiens ................................................................................................. 12 Lesser white-toothed shrew Crocidura suaveolens .............................................................. 13
LAGOMORPHA European rabbit Oryctolagus cuniculus ................................................................................. 14 Brown hare Lepus europaeus ................................................................................................ 15 Mountain hare Lepus timidus ................................................................................................. 16
RODENTIA Red Squirrel Sciurus vulgaris ................................................................................................. 17 Grey squirrel Sciurus carolinensis .......................................................................................... 18 Eurasian beaver Castor fiber ................................................................................................. 19 Hazel dormouse Muscardinus avellanarius ............................................................................ 20 Edible dormouse Glis glis ...................................................................................................... 21 Bank vole Myodes glareolus ................................................................................................... 22 Field vole Microtus agrestis .................................................................................................... 23 Orkney vole Microtus arvalis orcadensis ................................................................................ 24 Water vole Arvicola amphibius ............................................................................................... 25 Harvest mouse Micromys minutus ......................................................................................... 26 Wood mouse Apodemus sylvaticus ........................................................................................ 27 Yellow-necked mouse Apodemus flavicollis .......................................................................... 28 House mouse Mus musculus ................................................................................................. 29

Brown rat Rattus norvegicus ..................................................................................................... 30 Black rat Rattus rattus .............................................................................................................. 31
CARNIVORA Wildcat Felis silvetris .............................................................................................................. 32 Red fox Vulpes vulpes ............................................................................................................ 33 Badger Meles meles ............................................................................................................... 34 Otter Lutra lutra ....................................................................................................................... 35 Pine marten Martes martes .................................................................................................... 36 Stoat Mustela erminea ............................................................................................................ 37 Weasel Mustela nivalis ............................................................................................................ 38 Polecat Mustela putorius ........................................................................................................ 39 Mink Neovision vision ............................................................................................................. 40
ARTIODACTYLA Wild boar Sus scrofa .............................................................................................................. 41 Red deer Cervus elaphus ....................................................................................................... 42 Sika deer Cervus Nippon ........................................................................................................ 43 Fallow deer Dama dama ........................................................................................................ 44 Roe deer Capreolus capreolus ............................................................................................... 45 Chinese water deer Hydropotes inermis ................................................................................ 46 Reeves’ muntjac Muntiacus reevesi ....................................................................................... 47
CHIROPTERA Greater horseshoe bat Rhinolophus ferrumequinum ............................................................. 48 Lesser horseshoe bat Rhinolophus hipposideros .................................................................. 49 Alcathoe bat Myotis alcathoe ................................................................................................. 50 Whiskered bat Myotis mystacinus .......................................................................................... 51 Brandt’s bat Myotis brandtii .................................................................................................... 52 Bechstein’s bat Myotis bechsteinii ......................................................................................... 53 Daubenton’s bat Myotis daubentonii ...................................................................................... 54 Greater mouse-eared bat Myotis myotis ................................................................................ 55 Natterer’s bat Myotis nattereri ................................................................................................ 56 Serotine bat Eptesicus serotinus ............................................................................................ 57 Leisler’s bat Nyctalus leisleri .................................................................................................. 58 Noctule bat Nyctalus noctula .................................................................................................. 59 Common pipistrelle bat Pipistrellus pipistrellus ..................................................................... 60 Soprano pipistrelle bat Pipistrellus pygmaeus ...................................................................... 61 Nathusius’ pipistrelle bat Pipistrellus nathusii ....................................................................... 62 Barbastelle bat Barbastella barbastellus ................................................................................ 63 Brown long-eared bat Plecotus auritus ................................................................................. 64 Grey long-eared bat Plecotus austriacus ............................................................................... 65
Research priorities ..................................................................................................................................... 66 References .................................................................................................................................................... 71

1
Methods Overall approach The objective of the review was to produce the most accurate assessment possible of
population size, geographical range, and conservation trends since 1995. The project
therefore drew on both published and unpublished literature that has appeared since that
date; or, where insufficient information was available, expert opinion.
The general approach for estimating population size was to multiply habitat-specific density
estimates by the extent of these habitats within the geographical range. Where multiple
estimates were available, the median of these values was used, and 95% confidence
intervals were created. Habitats were defined following the classifications in the Land Cover
Map 2007 (Morton et al., 2011), because this dataset provided the best estimates of habit
availability at a national scale. The Countryside Survey was used to derive information on
hedgerows (Scott, 2007, Carey et al., 2008), and the lengths of riparian habitats were
derived from the previous review (Harris et al., 1995). The general approach for estimating
population size could not be applied to most bats because densities in one habitat (e.g., built
environments) depend on the extent and configuration of other habitats (e.g., broadleaved
woodland, unimproved grassland, etc.). Therefore, estimates were made of roost density at
a landscape scale, and these were combined with estimates of roost size and geographical
range. The estimation of geographical range for all species benefited from the use of
biological records provided at finer resolution than those available on publicly-accessible
databases.
For many species, the assessments presented in this review are based on very limited data.
The mission of the Mammal Society is to support evidence-based decision making. This
report is therefore transparent about potential sources of error, and the data — range maps,
density estimates, etc. — on which the calculations are based are freely available. To
facilitate inter-species comparisons, a deliberate choice has been made to use standardised
methodology that could be widely applied. For example, for most species it was not possible
to distinguish records that represented established or breeding populations from occasional
records, and therefore no attempt was made to make this distinction.
Readers are encouraged to consider the caveats documented in the reports for each
species. The population sizes for each species are provided with confidence intervals (or
plausible intervals (PI) for bats) that give a measure of the precision of the estimate. Where
a species has a reliability score of <=1, where the upper confidence limit is more than an
order of magnitude greater than the central estimate, or where it was not possible to
calculate confidence intervals (except for the beaver where total counts are assumed to

2
have included most of the population) the population size is placed within square brackets.
However, not all potential sources of variability are captured, so the estimates should
generally be considered as optimistic. Uncertainty in the size of the geographical range was
not considered. For some species, data were completely lacking for habitats known to be
used (for example, estimates for brown rats were based on dwellings and farms only,
because no evidence was available on riparian habitats, sewers etc.). Given that it was
impossible to know the extent to which these habitats contributed to the population size or
distribution, they are not included in the reliability scores.
Details of the methods used in each stage of the review are outlined below, and are
described in full in the Methods section of the main report.
Literature search A literature search was conducted using the databases ISI Web of Knowledge and Google
Scholar. The search terms used included the common and taxonomic names as well as at
least one of the terms from the following lists: British, UK, England, Scotland, and Wales;
‘population density’, ‘population estimate’, ‘abundance’, ‘population size’, ‘survey’ or
‘census’. The collated publications were then screened for inclusion based on relevance,
and limited to publication dates between 1995 and 2015. Government and Non-
Governmental Organisation reports were sourced directly from the organisations.
The following details were recorded from each paper/report: estimate type (i.e. minimum
number alive, absolute population size/density); survey method; area or length (for linear
features) of the study site; habitat type; start date; time of year; and duration of study.
Habitat data To quantify changes in habitat availability over time, data were taken from the 2007
Countryside Survey (CS2007). The area of each broad habitat class within the species’
range was extracted from the Land Cover Map 2007 (LCM2007) land-use layer using
ArcGIS (version 10.3). Further information on the correspondence between the LCM2007
data and the land cover data used in the previous report (Harris et al., 1995), together with
additional details on the classification of grassland habitats, is provided in the text of the
main report.
The total length of hedgerows in each country was taken from the CS2007 linear features
estimates. The proportion of hedgerows under management as part of an Agri-Environment
Scheme (AES), given its likely superiority in terms of habitat quality, was quantified for each
country using data supplied by Natural England (NE), Natural Resources Wales (NRW), and
Scottish Natural Heritage (SNH). AES hedgerows were assumed to be evenly distributed

3
throughout each country, and the proportion of AES hedgerows was used to divide the total
length of hedgerows within each species distribution into lengths for non-AES and AES
hedgerows.
The total length of riparian habitats in each country were taken from Table 4 of the previous
review of British mammals by Harris et al. (1995). The length of riparian habitats within each
species’ distribution was calculated by multiplying the total length by the percentage of the
country included in the species’ distribution.
Species status The conservation status of each species is presented as the global listing on the IUCN Red
List of Threatened Species, together with the Regional Red List status. Each species is
indicated as being native, non-native or naturalised. Species are considered naturalised if
they were introduced in or before the 12th century, whereas they are considered native if
they have been resident — without being dependent on human transportation — since the
formation of the English Channel about 8,000 years ago.
Under the IUCN Red List criteria, each species is allocated to one of the following
categories, relating to imminent risk of extinction:
Critically Endangered (CR).
Endangered (EN).
Vulnerable (VU).
Near Threatened (NT).
Least Concern (LC).
Data Deficient (DD).
The categories CR, EN and VU indicate an appreciable risk of extinction in the near future
(generally within the next decade, or 3 generations — whichever is longer), and are
collectively described as ‘Threatened’: CR indicates the highest level of extinction risk in the
wild, and EN and VU indicate progressively lower levels of risk. Near Threatened indicates
that the species is close to qualifying as Threatened, or is likely to qualify as such in the near
future.
The assessments of Regional Red List status for Great Britain have been formally approved
by the Inter-Agency IUCN Red Listing Group. Country-level assessments and those
conducted for non-native (naturalised) species followed the same IUCN Regional Red List
Criteria. Whilst there is flexibility within the guidelines to allow these assessments to be
made, there is no mechanism for these to be formally approved. Exceptions were made for
the Great Britain assessments of the Orkney vole and the lesser white-toothed shrew, on the

4
grounds that the Orkney vole is officially recognised as an island sub-species; and there is
doubt over whether the lesser white-toothed shrew is naturalised or native. Country-level
assessments are therefore presented in square brackets in this report, and the assessments
for non-native (naturalised) species are reported separately by the Mammal Society (see
www.mammal.org.uk/science-research/population-review-red-list). Red List assessments
can be difficult to make for small geographical areas, particularly if the species has a
restricted range within a particular country but is mobile and mixes with neighbouring
populations. This should be borne in mind when interpreting the country-level classifications.
Where relevant, the national conservation status as assessed for Article 17 of the EU
Habitats Directive is also shown.
Species’ distribution maps Presence data collected between 1995 and 2016 at 10km resolution or higher were gathered
for each species from the NBN gateway, local record centres, national and local monitoring
schemes, and iRecord. Only data that had been verified by the source organisation were
included in the distribution maps, with the exception that we also included data for species
that were highly unlikely to be misidentified (namely moles, rabbits, badgers, foxes, and
hedgehogs) from organisations whose primary objective was not to survey mammals.
Experts were consulted to ensure the maps for each species represented current
distributions as accurately as possible. They were presented with maps at a 10km
resolution, and asked to remove any squares that, they were certain, had not had a recorded
species sighting since 1995. Deletions were only accepted when two or more experts
agreed.
Smoothed distribution maps were created by fitting alpha hulls to the presence data for each
species using an alpha value of 20km, a process that excludes isolated datapoints (for full
details see Methods section of Main Report (Mathews et al., 2018)). An additional 10km
buffer was added to the final hull polygon to provide smoothing to the hull, and to ensure that
the hull covered all the grid squares recorded as positive in the original dataset rather than
intersecting them.
The use of this method means that the maps should be viewed with the following limitations
in mind:
• Areas that contain very isolated records may not have been included in the area of
distribution.
• Gaps may represent low recorder effort rather than true absences.
• The maps do not show population density.
5
• All verified records, including occasional and transient individuals, are included, so
some areas may not represent an established breeding population. This is a particular
problem for more mobile species as ranges may be overestimated.
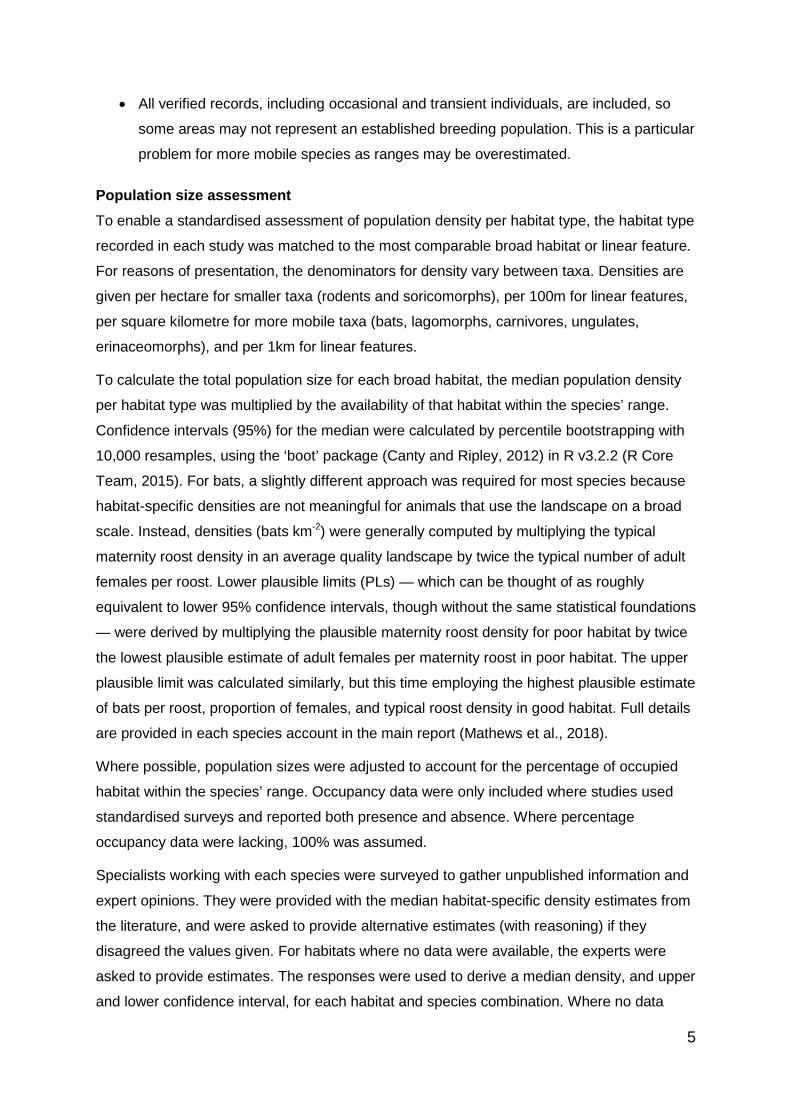
Population size assessment To enable a standardised assessment of population density per habitat type, the habitat type
recorded in each study was matched to the most comparable broad habitat or linear feature.
For reasons of presentation, the denominators for density vary between taxa. Densities are
given per hectare for smaller taxa (rodents and soricomorphs), per 100m for linear features,
per square kilometre for more mobile taxa (bats, lagomorphs, carnivores, ungulates,
erinaceomorphs), and per 1km for linear features.
To calculate the total population size for each broad habitat, the median population density
per habitat type was multiplied by the availability of that habitat within the species’ range.
Confidence intervals (95%) for the median were calculated by percentile bootstrapping with
10,000 resamples, using the ‘boot’ package (Canty and Ripley, 2012) in R v3.2.2 (R Core
Team, 2015). For bats, a slightly different approach was required for most species because
habitat-specific densities are not meaningful for animals that use the landscape on a broad
scale. Instead, densities (bats km-2) were generally computed by multiplying the typical
maternity roost density in an average quality landscape by twice the typical number of adult
females per roost. Lower plausible limits (PLs) — which can be thought of as roughly
equivalent to lower 95% confidence intervals, though without the same statistical foundations
— were derived by multiplying the plausible maternity roost density for poor habitat by twice
the lowest plausible estimate of adult females per maternity roost in poor habitat. The upper
plausible limit was calculated similarly, but this time employing the highest plausible estimate
of bats per roost, proportion of females, and typical roost density in good habitat. Full details
are provided in each species account in the main report (Mathews et al., 2018).
Where possible, population sizes were adjusted to account for the percentage of occupied
habitat within the species’ range. Occupancy data were only included where studies used
standardised surveys and reported both presence and absence. Where percentage
occupancy data were lacking, 100% was assumed.
Specialists working with each species were surveyed to gather unpublished information and
expert opinions. They were provided with the median habitat-specific density estimates from
the literature, and were asked to provide alternative estimates (with reasoning) if they
disagreed the values given. For habitats where no data were available, the experts were
asked to provide estimates. The responses were used to derive a median density, and upper
and lower confidence interval, for each habitat and species combination. Where no data

6
were found for a particular broad habitat in the 1995-2015 literature search, and experts
were also unable to an estimates, then the value previously used by Harris et al. (1995) was
applied.
The population estimates were derived by multiplying each habitat-specific density estimate
by the area of that habitat within the species’ geographical range.
Reliability assessment For species where population density data are lacking, the population size can be strongly
influenced by a single density estimate if the estimate is particularly extreme, or if the habitat
to which it applies accounts for a high percentage of the total species’ distribution. To identify
which data have the strongest influence on population size for each species, we carried out
two assessments: first, we calculated the percentage of the total population found in each
habitat; then we identified which habitat-specific population sizes account for more than 25%
of the total population size. This information was used to assess whether a habitat was
particularly influential by virtue of its size or its density values.
We performed a sensitivity analysis by re-calculating population size with stepwise deletion
of individual density estimates from habitats which met the following conditions:
• The habitat contains >25% of the estimated population.
• Median population density is supported by fewer than 10 individual density estimates.
Where density estimates were found in the literature and also provided by experts, a
comparison was made between the population sizes calculated using the estimates from the
literature and a re-calculated estimate using median expert opinion values in place of those
from the literature. This comparison was made only under the following conditions:
• Confidence limits for median density estimates from the literature did not overlap with
the upper and lower ranges provided by experts.
• Fewer than 10 separate density estimates were obtained from the literature.
A reliability score has been calculated for each habitat containing more than 25% of the
species’ distribution, or accounting for more than 25% of the total population size. These
scores are based on the number of locations in which individual assessments of population
density were conducted, on the sample size (number of individual density estimates
contributing to the median), and on whether data on the percentage of occupied habitat were
available. A higher score indicates a more reliable estimate. The values across each of
these criteria were summed to give a score per habitat; and where more than one habitat
was assessed, the mean of the different scores is presented (the maximum value is 5). For

7
bats, a slightly different scoring scheme was used — based on the availability of data on
roost density, roost size and sex ratio — reflecting the different methods employed for
calculating population density. The choice of values given to each component in the scoring
systems, and the decision of how to combine these values, are to some extent arbitrary: the
absolute value of the score therefore has no inherent meaning. In addition, the reliability
scores do not give weight to the differing scientific quality or precision of the estimates
provided in the original studies. Nevertheless, they can be used as a rough index for ranking
reliability across different species, and are also helpful in highlighting data deficiencies. A
value of 1 indicates very poor reliability, and 4 indicates very good reliability. The population
estimate is shown in brackets where the reliability score was <=1, where the upper
confidence limit for the British population was more than 5 times larger than the central
estimate, or where it was not possible to compute confidence intervals (except for the
beaver, where total counts are assumed to account for most of the population), to highlight
the uncertainty.
Changes through time Temporal changes in population size were assessed by comparing population size estimates
from Harris et al. (1995) and with any others sourced from the literature, whenever the
estimation methods used were comparable. Trends in range size were identified by changes
in the number of occupied hectads between the previous Mammal Atlas period (1960-1992)
(Arnold, 1993) and the current Atlas period (1995-2016; except for species currently
undergoing rapid changes in range, where the start date was set as 2005 (the water vole
and black rat) or 2010 (the red squirrel and grey squirrel)). No comparisons were made for i)
bats where the radical change in survey methodologies invalidates time-trends; and ii)
species where there were very few records in the first Atlas period.
Future prospects The future prospects for each species were assessed, in terms of the likely changes in
population size, range size and habitat quality, based on a combination of empirical
evidence and expert opinion. The assessment considered historical changes in population
size and range over the preceding 20 years, and evaluated direct and indirect drivers of
change (for example, hunting pressure, habitat loss, and climate change).
Species-specific methods The methods described above were used for each species in this review. However, the
diverse nature of the species covered meant it was necessary, on occasion, to apply
species-specific methods. Full details are provided within the text of the main report
(Mathews et al., 2018).

8
Hedgehog Erinaceus europaeus
British population estimate [522,000] (95%CI not available).
Reliability score = 2.
Conservation status Native. IUCN Red List: GB: VU; England: [VU]; Scotland: [VU]; Wales: [VU]; Global: LC.
Caveats Population size estimate may be affected by the following factors not included in the analysis: • Recent density estimate data were available for
improved grasslands and urban areas only.
• Population size is largely determined by the density estimates in unimproved grassland and broadleaved woodland. This is owing to their large areas within the range, and because their density estimates — derived from expert opinion in Harris et al. (1995) — were high (40km-2 in each case; cf. 0.54km-2 for urban, and 0.04km-2 for improved grassland).
• Percentage occupancy estimates for each habitat are based on limited data, and were not able to account for variability owing to region or habitat quality.
• More empirical data on population density and occupancy of hedgehogs is needed to improve confidence in the current population density and subsequent size estimates.
Changes through time
• Harris et al. (1995) estimated a British population size of 1,555,000. The current estimate is 66% lower. However, both estimates are extremely uncertain.
• Other reviews based on indices of relative abundance have estimated declines ranging from 1.25% to 40% over 10 years (Roos et al., 2012, Hof and Bright, 2016).
• Population size — Decline. Range — Stable.
Drivers of change
• Prey declines resulting from changes in agricultural practice and possibly pesticide use, although effects are not quantified.
• Anthropogenic influences such as vehicle collisions and loss of nesting habitat.
• Predation and possible competitive exclusion by badgers.
Future prospects
• Population status — Decline
• Range status — Stable
• Habitat status — Decline
Range based on 1995-2016 presence data. Areas with very isolated records may not have been included in the distribution — see main report Methods section 2.5 for more details.

9
European Mole Talpa europaea
British population estimate [41,400,000] (95%CI not available).
Reliability score = 1.
Conservation status Native. IUCN Red list: GB: LC; England: [LC]; Scotland: [LC]; Wales: [LC]; Global: LC.
Caveats Population size estimate may be affected by the following factors, which were not included in the analysis:
• No percentage occupancy data were available, so the population size is likely to be overestimated.
• 46% of the estimated population size for moles was derived from improved grassland habitat, with a further 19% from arable and horticulture. These habitats represent 38% and 33% of the species’ range, respectively. The density estimates are based only on expert opinion (Harris et al., 1995).
Changes through time
• The density estimates used in the current analysis are taken from Harris et al. (1995), so any differences are entirely owing to changes in the species’ distribution and land classification. Accounting for probable temporal changes in the British landscape generates a population size of 38,400,000, and a 23% increase in population size since 1995. However, it was not possible to assess whether the difference is significant.
• Mole signs are recorded in the British Trust for Ornithology (BTO) Breeding Bird Survey. The number of 1km survey squares with signs of moles was 7% in 1995, 32% in 2003, and 18% in 2015.
• Population size — Data deficient. Range — Stable.
Drivers of change
• Prey declines resulting from changes in agricultural practice and possibly pesticide use, although effects are not quantified.
• Habitat quality — changes in land management, e.g., reduction in unimproved grassland and removal/neglect of hedgerows.
Future prospects
• Population status — Stable
• Range status — Stable
• Habitat status — Stable/Decline
Range based on 1995-2016 presence data. Areas with very isolated records may not have been included in the distribution — see main report Methods section 2.5 for more details.

10
Range based on 1995-2016 presence data. Areas with very isolated records may not have been included in the distribution — see main report Methods section 2.5 for more details.
Common Shrew Sorex araneus
British population estimate [21,100,000] (95%CI = 6,520,000– 58,500,000).
Reliability score = 1.
Conservation status Native. IUCN Red list: GB: LC; England: [LC]; Scotland: [LC]; Wales: [LC]; Global: LC.
Caveats Population size estimate may be affected by the following factors, which were not included in the analysis:
• No percentage occupancy data were available for most habitats, so the population size is overestimated.
• Population density in improved grassland is low, yet this habitat covers 48% of the species’ range. This density estimate is based on the opinion of one expert, so any uncertainty will have a major impact on population size.
• Most of the estimated population is derived from unimproved grassland (24%) and from bog habitats (32%). With the exception of unimproved grassland, only sparse data on population density was available for any habitat, and there was considerable within-habitat variability. Further data are therefore urgently needed to increase confidence in the density estimates.
Changes through time
• Harris et al. (1995) estimated a British population size of 41,700,000. Inferences about temporal trends are not possible because of the lack of robust data.
• Population size — Data deficient. Range — Stable (England, Wales); Decline (Scotland).
Drivers of change
• Prey declines resulting from changes in agricultural practice and possibly pesticide use, although effects are not quantified.
Future prospects
• Population status — Stable/Decline
• Range status — Stable
• Habitat status — Decline

11
Pygmy shrew Sorex minutus
British population estimate [6,300,000] (95%CI = 999,000–38,900,000).
Reliability score = 0.5.
Conservation status Native. IUCN Red list: GB: LC; England: [LC]; Scotland: [LC]; Wales: [LC]; Global: LC.
Caveats Population size estimate may be affected by the following factors, which were not included in the analysis:
• No percentage occupancy data were available, so the population size is overestimated.
• All of the population density estimates, except those for unimproved grassland, are based on the opinion of two to four experts.
• Gaps in the species’ distribution in England and Wales are likely to result from a lack of survey effort, rather than true absences. It is less clear whether larger gaps in Scotland represent true gaps in distribution or are influenced by survey effort.
Changes through time
• Harris et al. (1995) estimated a British population size of 8,600,000, compared with the current estimate of 6,300,000. Comparisons with the current review are difficult because of changes in methodology.
• Impacts of general invertebrate declines and pesticide use are not quantified.
• Population size — Data deficient. Range — Stable (England, Wales); Decline (Scotland).
Drivers of change
• Prey declines resulting from changes in agricultural practice and possibly pesticide use, although effects are not quantified.
Future prospects
• Population status — Stable/Decline
• Range status — Stable
• Habitat status —Decline
Range based on 1995-2016 presence data. Areas with very isolated records may not have been included in the distribution — see main report Methods section 2.5 for more details.

12
Water shrew Neomys fodiens
British population estimate [714,000] (95%CI = 237,000–1,942,000).
Reliability score = 0.
Conservation status Native. IUCN Red list: GB: LC; England: [LC]; Scotland: [LC]; Wales: [LC]; Global: LC.
Caveats Population size estimate may be affected by the following factors, which were not included in the analysis:
• The population size is derived from the ratio with the common shrew. Common shrew population size is uncertain, and ratios are likely to vary by habitat.
• Gaps in the species’ distribution in England and Wales are likely to represent lack of survey effort, rather than true absences. Unclear whether larger gaps in Scotland reflect true gaps in distribution or lack of survey effort.
• 56% of the population size for common shrews is derived from estimates for unimproved grassland and bog: the reliability scores for these habitats were 2 and 0 respectively.
• The previous estimates of population size were not adjusted to account for the smaller distribution of water shrews compared to common shrews (Harris et al., 1995) so populations are likely to have been overestimated.
Changes through time
• Harris et al. (1995) estimated a British population size of 1,900,000 (or 1,500,000 if comparable re-assessment methods are used). Cf. our current estimate of 714,000.
• Both the current and previous estimates for common shrews are uncertain, with few density estimates to use as a basis. Therefore, a comparison of population size for water shrews between the two time periods retains the same level of uncertainty.
• Population size — Data deficient. Range — Increase (England, Wales); Stable (Scotland).
Drivers of change
• Bank clearance and modification may destroy burrows and alter water supplies.
• Prey declines resulting from changes in agricultural practice and possibly pesticide use, although effects are not quantified
Future prospects
• Population status — Decline
• Range status — Stable
• Habitat status — Decline
Range based on 1995-2016 presence data. Areas with very isolated records may not have been included in the distribution — see main report Methods section 2.5 for more details.

13
Lesser white-toothed shrew Crocidura suaveolens
British population estimate [14,000] (95%CI not available).
Reliability score = 0.
Conservation status Naturalised (possibly native). IUCN Red list: GB: NT; England: [NT]; Scotland: n/a; Wales: n/a; Global: LC.
Caveats Population size estimate may be affected by the following factors, which were not included in the analysis:
• No percentage occupancy data were available; the population size may therefore be overestimated.
• The density estimates are very out of date, and may have altered following a reduction in predation pressure.
Changes through time
• Harris et al. (1995) estimated a British population size of 14,000. The current review uses the same information on habitat availability and density, and it is therefore not possible to infer any trends over time since the reports are subject to the same errors.
• Monitoring on St Agnes, Gugh and Bryher has been conducted since 2013 following rat eradication. This has shown an increase in the proportion of occupied footprint tunnels on St Agnes and Gugh. On Bryher, there was a rapid decline in 2014, and only a partial recovery since then.
• Population size — Stable (England). Range — Stable (England).
Drivers of change
• Successful predator eradication initiatives.
Future prospects
• Population status — Stable
• Range status — Stable
• Habitat status — Stable
Range based on 1995-2016 presence data. Areas with very isolated records may not have been included in the distribution — see main report Methods section 2.5 for more details.

14
European rabbit Oryctolagus cuniculus
British population estimate [36,000,000] (95%CI not available).
Reliability score = 1.
Conservation status Naturalised. IUCN Red list: GB: n/a; England: n/a; Scotland: n/a; Wales: n/a; Global: NT.
Caveats Population size estimate may be affected by the following factors, which were not included in the analysis:
• No occupancy data were available; the population size is therefore overestimated.
• 42% of the population estimate is derived from arable habitats, despite showing a preference for improved grassland (Lush et al., 2014). Density estimate for arable land is taken from Harris et al. (1995).
• Density estimates for improved grassland are based on small samples (Petrovan et al., 2011a), and values are low relative to other habitat types.
• Factors such as myxomatosis and rabbit haemorrhagic disease have severe local impacts (Petrovan et al., 2011b), resulting in highly variable population densities both within and between habitat types.
Changes through time • Harris et al. (1995) estimated a British population size of 37,500,000. After accounting for
probable temporal changes in the landscape, a 9% decline is likely since 1995.
• The National Gamebag Census reports a 24% decline (95%CI = 45% decline to 4% increase) in the number of rabbits culled between 1995 and 2014 in Britain. However, the survey does not account for effort, so it may not represent a true decline in population size. The BTO Breeding Bird Survey inferred a 48% decline (95%CI = 56%-33%) between 1995 and 2012 in Britain.
• Population size — Decline. Range — Stable.
Drivers of change
• Disease — population recovery from disease epidemics (myxomatosis and rabbit haemorrhagic disease).
• Human management — culling to limit impacts on agriculture, although culling effort may have reduced owing to a lower demand for rabbit meat or fur.
Future prospects
• Population status – Decline
• Range status – Stable
• Habitat status – Decline
Range based on 1995-2016 presence data. Areas with very isolated records may not have been included in the distribution — see main report Methods section 2.5 for more details.

15
Brown hare Lepus europaeus
British population estimate 579,000 (95%CI = 427,000–1,990,000). Reliability score = 3.
Conservation status Naturalised. IUCN Red list: GB: n/a; England: n/a; Scotland: n/a; Wales: n/a; Global: LC.
Caveats Population size estimate may be affected by the following factors, which were not included in the analysis:
• Population size is adjusted to reflect the occupancy of habitat, but there are geographical gradients in distribution that are not captured by the use of a single percentage occupancy figure.
Changes through time
• Harris et al. (1995) estimated a British population size of 817,000, which falls within the confidence limits of the current estimate. However, comparisons between surveys are not reliable owing to differences in methodology.
• The National Gamebag Census reports a 38% (95%CI = 3%-76%) increase in brown hares culled in Britain between 1995 and 2009.
• Population size — Data deficient. Range — Stable.
Drivers of change
• Changes to agricultural practice and competition with livestock may reduce food and shelter opportunities.
• Human management — suppression of the population during specified times of year by culling.
• Climate change.
Future prospects
• Population status — Stable
• Range status — Stable
• Habitat status — Decline
Range based on 1995-2016 presence data. Areas with very isolated records may not have been included in the distribution — see main report Methods section 2.5 for more details.

16
Mountain hare Lepus timidus
British population estimate 135,000 (95%CI = 81,000–526,000).
Reliability score = 2.
Conservation status Native. IUCN Red list: GB: NT; England: n/a; Scotland: [NT]; Wales: n/a; Global: LC.
Article 17 overall assessment 2013: UK: Favourable; England: Favourable; Scotland: Favourable; Wales: n/a.
Caveats Population size estimate may be affected by the following factors, which were not included in the analysis:
• No percentage occupancy data were available, so the population size is overestimated.
• The population estimate is derived from dwarf shrub heath habitat only.
• The population density of mountain hares is highly variable under differing environmental conditions. The densities used in this review were taken from moorland managed for grouse, a habitat with particularly high densities that does not represent the range of densities and will therefore have overestimated the population size. Densities are usually 30-69 km-2, but exceptionally can be >200 km-2 or more (Harris and Yalden, 2008).
Changes through time • Harris et al. (1995) estimated a British population size of 350,500 (350,000 in Scotland
and 500 in England). A comparison with the current estimate is not meaningful owing to differences in methodology.
• The National Gamebag Census reports a 40% (95%CI = 68%-20%) decline in numbers culled between 1995 and 2009.
• Population size — Data deficient. Range — Increase (Scotland); Decline (England).
Drivers of change
• Altered land use and fragmentation.
• Human management — culling.
• Hybridisation with, and competitive exclusion by, brown hares.
Future prospects
• Population status — Decline
• Range status — Stable
• Habitat status — Decline
Range based on 1995-2016 presence data. Areas with very isolated records may not have been included in the distribution — see main report Methods section 2.5 for more details.

17
Red Squirrel Sciurus vulgaris
British population estimate 287,000 (95%CI = 218,000–553,000).
Reliability score = 2.
Conservation status Native. IUCN Red list: GB: EN; England: [EN]; Scotland: [NT]; Wales: [EN]; Global: LC.
Caveats Population size estimate may be affected by the following factors, which were not included in the analysis:
• No percentage occupancy data are available, so the population size is overestimated.
• There may be some overestimation resulting from the inclusion of extensive Sitka spruce plantations, which support only very low densities of red squirrels.
• Population estimates for England, Wales and southern Scotland are likely to be too high owing to overlapping ranges of grey squirrels.
Changes through time
• Harris et al. (1995) estimated a British population size of 61,000. Lack of occupancy data means that comparison between this estimate and the current review is not informative.
• A marked decline in the distribution of red squirrels since 1995 (Gurnell et al., 2004).
• Population size — Decline. Range — Stable (Scotland); Decline (England, Wales).
Drivers of change
• Disease epidemics, including squirrelpox — transmitted by grey squirrels — and adenovirus.
• Competition with grey squirrels for resources.
• Habitat quality deterioration, including increased proportion of unfavourable Sitka spruce in plantations.
• Conservation measures, including control of grey squirrels.
Future prospects
• Population status — Decline
• Range status — Decline
• Habitat status — Stable
Range based on 2010-2016 presence data. Areas with very isolated records may not be included in the distribution — see main report Methods section 2.5 for more details. A gap in the distribution between northern and southern parts of the Scottish range is likely; range in Surrey does not represent an established population.
18
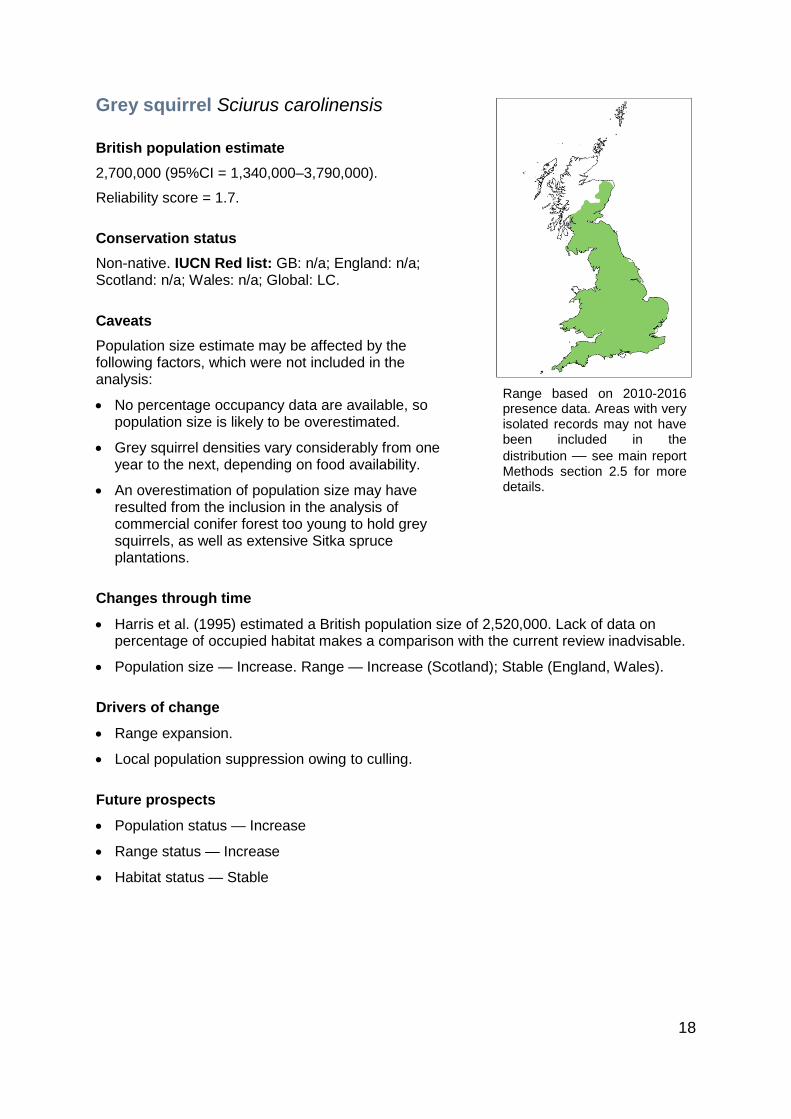
Grey squirrel Sciurus carolinensis
British population estimate 2,700,000 (95%CI = 1,340,000–3,790,000).
Reliability score = 1.7.
Conservation status Non-native. IUCN Red list: GB: n/a; England: n/a; Scotland: n/a; Wales: n/a; Global: LC.
Caveats Population size estimate may be affected by the following factors, which were not included in the analysis:
• No percentage occupancy data are available, so population size is likely to be overestimated.
• Grey squirrel densities vary considerably from one year to the next, depending on food availability.
• An overestimation of population size may have resulted from the inclusion in the analysis of commercial conifer forest too young to hold grey squirrels, as well as extensive Sitka spruce plantations.
Changes through time
• Harris et al. (1995) estimated a British population size of 2,520,000. Lack of data on percentage of occupied habitat makes a comparison with the current review inadvisable.
• Population size — Increase. Range — Increase (Scotland); Stable (England, Wales).
Drivers of change
• Range expansion.
• Local population suppression owing to culling.
Future prospects
• Population status — Increase
• Range status — Increase
• Habitat status — Stable
Range based on 2010-2016 presence data. Areas with very isolated records may not have been included in the distribution — see main report Methods section 2.5 for more details.

19
Eurasian beaver Castor fiber
British Population estimate 168 (95%CI not available).
Reliability score = n/a.
Conservation status Native. IUCN Red list: GB: EN; England: n/a; Scotland: n/a; Wales: n/a; Global: EN.
Caveats Population size estimate may be affected by the following factors, which were not included in the analysis:
• Three areas of Britain currently have established free-living beaver populations. The numbers in each region were summed to derive a British population estimate. However, there are anecdotal reports of additional individuals elsewhere that were not included.
• New surveys have recently been conducted in Scotland, and revised population estimates will be published shortly.
Changes through time
• Beaver populations were not assessed by Harris et al. (1995).
• Owing to their recent reintroduction, a detailed assessment of temporal trends has not yet been made.
• Population size — Increase (England, Scotland). Range — Increase (England, Scotland).
Drivers of change
• Releases in specific locations.
• Conflicts with socioeconomic interests have led to localised persecution.
Future prospects
• Population status — Increase
• Range status — Increase
• Habitat status — Stable
Range based on 1995-2016 presence data. Areas with very isolated records may not have been included in the distribution — see main report Methods section 2.5 for more details.

20
Hazel dormouse Muscardinus avellanarius
British population estimate 930,000 (95%CI = 389,000–2,640,000).
Reliability score = 2.
Conservation status Native. IUCN Red list: GB: VU; England: [VU]; Scotland: n/a; Wales: [VU]; Global: LC.
Article 17 overall assessment 2013: UK: Bad; England: Bad; Scotland: n/a; Wales: Bad.
Caveats Population size estimate may be affected by the following factors not included in the analysis:
• Percentage occupancy values were estimated from hazel woodlands, and wider habitats were not considered.
• Recent research suggests that the species is much more adaptable than previously thought (Juskaitis and Büchner, 2013). The occupancy values derived from hazel woodland are unlikely to be suitable for all habitats.
Changes through time
• Harris et al. (1995) estimated a British population size of 500,000, but this was based on ancient woodlands alone.
• The current review includes all woodland types and also hedgerows. Population sizes are therefore unlikely to be directly comparable.
• The National Dormouse Monitoring Survey indicates a 52% population decline between 1995 and 2015.
• Population size — Decline (England, Wales). Range — Stable (England, Wales).
Drivers of change
• Fragmentation and reduction in woodland species’ diversity.
• Climate change may cause a change in food availability through alteration of fruiting cycles, invertebrate egg-laying and disease. The net direction of effects is unclear.
Future prospects
• Population status — Decline
• Range status — Stable
• Habitat status — Decline
Range based on 1995-2016 presence data. Areas with very isolated records may not have been included in the distribution — see main report Methods section 2.5 for more details.

21
Edible dormouse Glis glis
British population estimate [23,000] (95%CI = 9,800–82,000).
Reliability score = 1.
Conservation status Non-native. IUCN Red list: GB: n/a; England: n/a; Scotland: n/a; Wales: n/a; Global: LC.
Caveats Population size estimate may be affected by the following factors, which were not included in the analysis:
• The density estimates used in this review were all derived from one location, so no account is taken of spatial variability in abundance.
• Occupancy has not been investigated, so the population size is likely to be overestimated.
Changes through time
• Harris et al. (1995) estimated a British population size of 10,000, but this was based on sparse data.
• Distribution appears to have expanded only very slightly in the last 20 years.
• Methodological differences between the current review and that of Harris et al. (1995) may explain part of the apparent increase in population size.
• Population size — Increase. Range — Increase (England).
Drivers of change
• Expansion into suitable habitat.
• Climate change may affect fruiting cycles and hibernation patterns.
• Human management by culling of local populations.
Future prospects
• Population status — Increase
• Range status — Increase
• Habitat status — Increase
Range based on 1995-2016 presence data. Areas with very isolated records may not have been included in the distribution — see main report Methods section 2.5 for more details.

22
Bank vole Myodes glareolus
British population estimate 27,400,000 (95%CI = 15,100,000–54,100,000). Reliability score = 1.7.
Conservation status Native. IUCN Red list: GB: LC; England: [LC]; Scotland: [LC]; Wales: [LC]; Global: LC.
Caveats Population size estimate may be affected by the following factors, which were not included in the analysis:
• Percentage occupancy data were not available for most habitats, so the population size is overestimated.
• Only a low proportion of the population estimate is derived from improved grassland, although this forms a high proportion of the habitat within the range. The density estimate for improved grassland is based on just two expert opinions.
• Most of the population estimate is derived from broadleaved woodland (39%). Yet this habitat forms a low proportion of the land cover within the species’ range, and its importance is therefore largely a consequence of high density estimates relative to other habitats. Further data on densities in improved grassland and broadleaved woodland would improve the population estimates.
Changes through time
• Harris et al. (1995) estimated a British population size of 23,000,000, using a slightly different methodology from the current review.
• Population size — Data deficient. Range — Stable (England, Wales); Decline (Scotland).
Drivers of change
• None known.
Future prospects
• Population status — Stable
• Range status — Stable
• Habitat status — Stable
Range based on 1995-2016 presence data. Areas with very isolated records may not have been included in the distribution — see main report Methods section 2.5 for more details.

23
Field vole Microtus agrestis
British population estimate 59,900,000 (95%CI = 37,000,000–80,300,000).
Reliability score = 2.
Conservation status Native. IUCN Red list: GB: LC; England: [LC]; Scotland: [LC]; Wales: [LC]; Global: LC.
Caveats Population size estimate may be affected by the following factors, which were not included in the analysis:
• No percentage occupancy data are available, so the population size is likely to be overestimated.
• Improved grassland is excluded from the analysis although some of this habitat could potentially be suitable (e.g., if grazing intensity is low). Because of the large area involved, this could have a significant impact on the population size.
Changes through time
• Harris et al. (1995) estimated a British population of 75,000,000. This was based on the ratio of field voles to other small mammals, so comparison with the current population estimate is not advised.
• Population size — Data deficient. Range — Stable.
Drivers of change
• Decline in habitat quality because of habitat fragmentation, nitrogen deposition and change of management practices.
Future prospects
• Population status — Stable
• Range status — Stable
• Habitat status — Decline
Range based on 1995-2016 presence data. Areas with very isolated records may not have been included in the distribution — see main report Methods section 2.5 for more details.

24
Orkney vole Microtus arvalis orcadensis
British population estimate Not available (95%CI not available).
Reliability score = 0.
Conservation status Naturalised. IUCN Red list: GB: VU; England: n/a; Scotland: [VU]; Wales: n/a; Global: LC.
Caveats There was no evidence on which to base a population estimate for this review.
Changes through time
• It is not possible to make a comparison because no estimate could be made here, and the value in the previous report also had low reliability.
• Population size — Decline (Scotland). Range — Stable (Scotland).
Drivers of change
• Reduction in suitable habitat owing to agricultural intensification.
• Conversion of natural habitats to agriculture, leading to reduced habitat availability.
• Introduction of the stoat, a predator not native to Orkney.
Future prospects
• Population status — Decline
• Range status — Stable
• Habitat status — Decline
Range based on 1995-2016 presence data. Areas with very isolated records may not have been included in the distribution — see main report Methods section 2.5 for more details.

25
Water vole Arvicola amphibius
British population estimate 132,000 (95%CI = 99,000–329,000).
Reliability score = 3.
Conservation status Native. IUCN Red list: GB: EN; England: [EN]; Scotland: [NT]; Wales: [CR]; Global: LC.
Caveats Population size estimate may be affected by the following factors not included in the analysis:
• Population density varies depending on a number of factors not accounted for in this estimate: density will be higher in areas with dense ground vegetation and fewer mink; and wider water channels may contain water voles on both banks.
• Occupancy values reflect the effect of mink predation and habitat quality to some degree. However, these factors are subject to rapid change, so the values used may no longer be appropriate.
• Insufficient data were available to permit separate estimates to be made for upland and lowland areas, even though these may vary substantially in water vole density and occupancy.
Changes through time
• Harris et al. (1995) estimated a British population of 1,169,000. Strachan et al. (2000), using the same approach as Harris et al. (1995), estimated the overwintering population in 1996-1998 to be 262,000, and inferred a 78% population decline between 1989-1990 and 1996-1998.
• The current population size estimates suggest a further decrease by 50% since 1998.
• Population size — Decline (England, Wales); Increase (Scotland). Range — Increase (but recent decline) (Scotland); Stable (England, Wales).
Drivers of change
• Predation by American mink.
• Change in land management, including wetland drainage, arable cultivation and watercourse canalisation. Habitat improvements, driven by Water Framework Directive.
• Captive breeding projects.
Future prospects
• Population status — Decline
• Range status — Stable
• Habitat status — Stable
Range based on 2005-2016 presence data. Areas with very isolated records may not have been included in the distribution — see main report Methods section 2.5 for more details.

26
Harvest mouse Micromys minutus
British population estimate [566,000] (95%CI = 288,000–934,000).
Reliability score = 0.
Conservation status Native. IUCN Red list: GB: NT; England: [LC]; Scotland: n/a; Wales: [VU]; Global: LC.
Caveats Population size estimate may be affected by the following factors, which were not included in the analysis:
• Estimates are difficult to make with any level of certainty because of naturally wide fluctuations in population size.
• Harvest mice are easy to overlook in surveys, so estimates are unlikely to be precise.
• The population estimate is based on the ratio of wood mice and — because of a lack of information — does not take into account how this ratio may change between different habitat types.
Changes through time
• Harris et al. (1995) estimated a British population of 1,425,000. However, this estimate is based on the ratio of harvest mice:wood mice, and is not adjusted to reflect the smaller distribution of harvest mice. The population is therefore likely to be overestimated.
• Further surveys are needed to increase confidence in the estimated population sizes and trends over time.
• Population size — Data deficient (England, Wales). Range — Data deficient (England, Wales).
Drivers of change
• Wetter summers may limit range expansion, but warmer temperatures may increase survivorship and reproductive success.
• Change in agricultural practice, leading to a decline in habitat suitability.
Future prospects
• Population status — Decline
• Range status — Stable
• Habitat status — Decline
Range based on 1995-2016 presence data. Areas with very isolated records may not have been included in the distribution – see main report Methods section 2.5 for more details.

27
Wood mouse Apodemus sylvaticus
British population estimate 39,600,000 (95%CI = 20,400,000–64,300,000).
Reliability score = 2.
Conservation status Native. IUCN Red list: GB: LC; England: [LC]; Scotland: [LC]; Wales: [LC]; Global: LC.
Caveats Population size estimate may be affected by the following factors, which were not included in the analysis:
• No percentage occupancy data were available for most habitats, so the population is likely to be overestimated.
Changes through time
• Harris et al. (1995) estimated a British population of 38,000,000 using literature and expert opinion. There is no evidence of a significant change in population size in the current review.
• Population size — Stable. Range — Stable.
Drivers of change
• None known
Future prospects
• Population status — Stable
• Range status — Stable
• Habitat status — Stable
Range based on 1995-2016 presence data. Areas with very isolated records may not have been included in the distribution — see main report Methods section 2.5 for more details.

28
Yellow-necked mouse Apodemus flavicollis
British population estimate 1,500,000 (95%CI = 467,000–4,360,000).
Reliability score = 2.5.
Conservation status Native. IUCN Red list: GB: LC; England: [LC]; Scotland: n/a; Wales: [LC]; Global: LC.
Caveats Population size estimate may be affected by the following factors, which were not included in the analysis:
• Confidence limits for broadleaved woodland density are wide but account for a large percentage of the species’ range and population.
• Population density estimates provided by experts apply only to a restricted part of the species’ range.
Changes through time
• Harris et al. (1995) estimated a British population size of 750,000. This is within the confidence limits of the current estimate, but neither figure is highly reliable.
• Population size — Data deficient. Range — Increase (England, Wales).
Drivers of change
• Change in management of ancient and/or coppiced woodlands.
• Climate change may permit range expansion through greater food availability in warmer summers.
Future prospects
• Population status – Potential Increase
• Range status – Potential Increase
• Habitat status – Stable
Range based on 1995-2016 presence data. Areas with very isolated records may not have been included in the distribution — see main report Methods section 2.5 for more details.

29
House mouse Mus musculus
British population estimate [5,203,000] (95%CI not available).
Reliability score = 2.
Conservation Naturalised. IUCN Red list: GB: n/a; England: n/a; Scotland: n/a; Wales: n/a; Global: LC.
Caveats Population size estimate may be affected by the following factors, which were not included in the analysis:
• Estimates are difficult to make with any level of certainty because of naturally wide fluctuations in population size.
• Gaps in distribution are likely to reflect a lack of survey effort, rather than true absences.
• Population density estimates are lacking, and it was not possible to account for any variation resulting from differing environmental conditions.
• Adjustments for occupancy were made on the assumption that the proportion of farm buildings occupied by house mice was the same as for rural houses generally (for which some data were available). The figures are therefore likely to provide a reasonable estimate of the numbers of animals across farm buildings of all types. However, the extent to which the two farms on which the estimates were based are typical of those found nationally is unclear.
• No information was available to permit the estimation of populations of house mice resident in field margins, woodland or agricultural land.
Changes through time
• Harris et al. (1995) estimated a British population of 5,192,000.
• Population size — Stable. Range — Stable (England, Wales); Decline (Scotland).
Drivers of change
• Human management through pest control.
Future prospects
• Population status — Stable
• Range status — Stable
• Habitat status — Stable
Range based on 1995-2016 presence data. Areas with very isolated records may not have been included in the distribution — see main report Methods section 2.5 for more details.
30
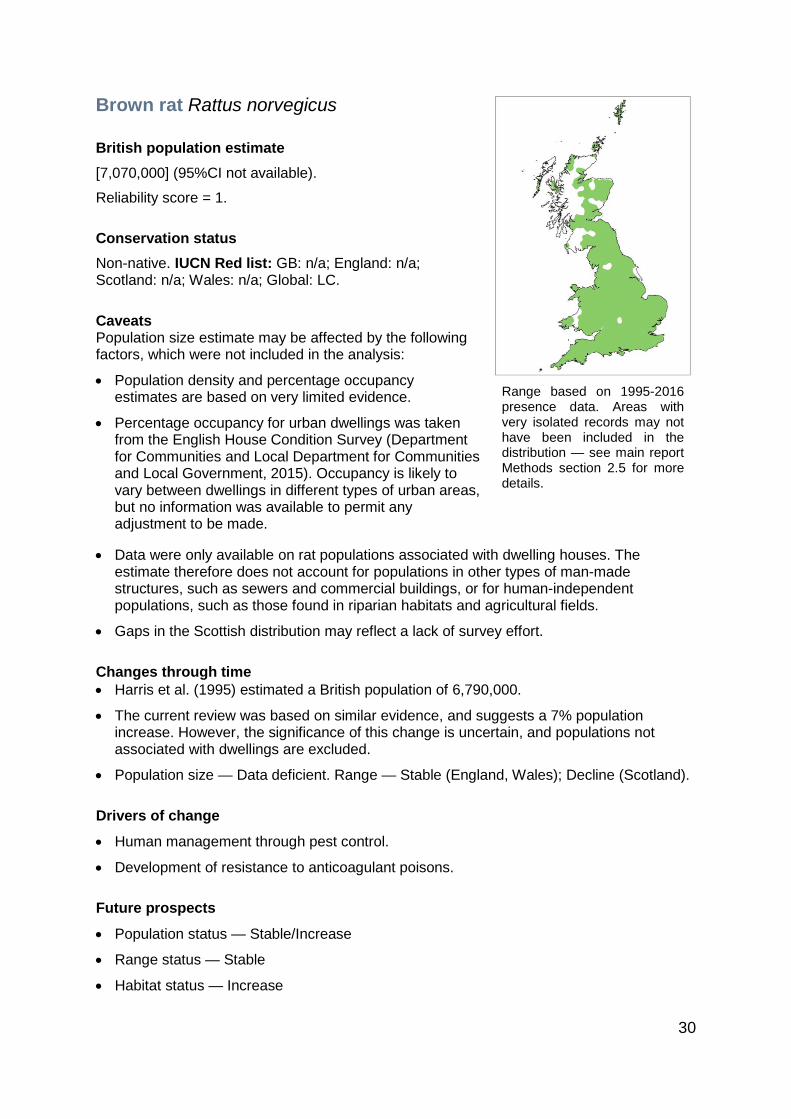
Brown rat Rattus norvegicus
British population estimate [7,070,000] (95%CI not available).
Reliability score = 1.
Conservation status Non-native. IUCN Red list: GB: n/a; England: n/a; Scotland: n/a; Wales: n/a; Global: LC.
Caveats Population size estimate may be affected by the following factors, which were not included in the analysis:
• Population density and percentage occupancy estimates are based on very limited evidence.
• Percentage occupancy for urban dwellings was taken from the English House Condition Survey (Department for Communities and Local Department for Communities and Local Government, 2015). Occupancy is likely to vary between dwellings in different types of urban areas, but no information was available to permit any adjustment to be made.
• Data were only available on rat populations associated with dwelling houses. The estimate therefore does not account for populations in other types of man-made structures, such as sewers and commercial buildings, or for human-independent populations, such as those found in riparian habitats and agricultural fields.
• Gaps in the Scottish distribution may reflect a lack of survey effort.
Changes through time • Harris et al. (1995) estimated a British population of 6,790,000.
• The current review was based on similar evidence, and suggests a 7% population increase. However, the significance of this change is uncertain, and populations not associated with dwellings are excluded.
• Population size — Data deficient. Range — Stable (England, Wales); Decline (Scotland).
Drivers of change
• Human management through pest control.
• Development of resistance to anticoagulant poisons.
Future prospects
• Population status — Stable/Increase
• Range status — Stable
• Habitat status — Increase
Range based on 1995-2016 presence data. Areas with very isolated records may not have been included in the distribution — see main report Methods section 2.5 for more details.

31
Black rat Rattus rattus
British population estimate Not available (95%CI not available).
Reliability score = n/a.
Distribution Infrequent scattered records only. Therefore, no map is shown.
Conservation status Naturalised. IUCN Red list: GB: n/a; England: n/a; Scotland: n/a; Wales: n/a; Global: LC.
Caveats
• It is plausible that there are still small populations of this species or occasional individuals present: all commensal animals tend to be under-recorded. There is also a high likelihood of confusion with the brown rat.
• There has been no systematic exhaustive survey of areas likely to retain the species.
Changes through time
• Harris et al. (1995) estimated a British population size of 1,300.
• The current review suggests that the population size has been reduced to zero.
• Similarly, the distribution across 80 hectads shown by Arnold (1993) has been reduced to zero.
• Population size — Decline. Range — Decline.
Drivers of change
• Pest control measures have resulted in widespread eradication.
Future prospects
• Population status – Unknown
• Range status – Unknown
• Habitat status – Unknown

32
Wildcat Felis silvetris
British population estimate 200 (95%CI = 30-430).
Reliability score = 2.
Conservation status
Native. IUCN Red list: GB: CR; England: n/a; Scotland: [CR]; Wales: n/a; Global: LC.
Article 17 overall assessment 2013: UK: Bad; England: n/a; Scotland: Bad; Wales: n/a.
Caveats Population size estimate may be affected by the following factors not included in the analysis:
• Population size and reliability score are likely to be overestimates because they do not account for misidentification of feral cats and the presence of feral-wildcat hybrids.
• There were no habitat-specific density estimates.
• All surveys providing population density estimates and percentage occurrence focused on areas particularly suitable for wildcats. Therefore, these densities and occurrences are likely to be higher than the average for the species’ range.
Changes through time
• Harris et al. (1995) estimated a British population of 3,500, but this figure was likely to include hybrids (Harris et al., 1995).
• A population size of approximately 400 animals was estimated in the mid-2000s by extrapolating from samples of free-living wildcats collected during the 1990s (Macdonald et al., 2004).
• A more recent population size of 115-314 wildcats was estimated by Kilshaw (2015), which accords with the current estimate.
• Population size — Decline (Scotland). Range — Decline (Scotland).
Drivers of change
• Loss of genetic integrity owing to hybridisation with feral and domestic cats.
Future prospects
• Population status — Decline
• Range status — Decline
• Habitat status — Stable
Range based on 1995-2016 presence data. Areas with very isolated records may not have been included in the area of distribution – see main report Methods section 2.5 for more details.

33
Red fox Vulpes vulpes
British population estimate 357,000 (95%CI = 104,000–646,000).
Reliability score = 2.5.
Conservation status Native. IUCN Red list: GB: LC; England: [LC]; Scotland: [NT]; Wales: [LC]; Global: LC.
Caveats Population size estimate may be affected by the following factors not included in the analysis:
• No percentage occupancy data were available, so the population size is overestimated.
• The highest densities are found in rural lowland and urban areas because of higher food availability. The population estimate may be overestimated owing to the application of a high median population density across all rural areas, including upland Wales and Scotland where food is scarcer.
• Density estimates used for urban areas may be higher than typically found in Great Britain.
Changes through time
• Harris et al. (1995) estimated a British population of 240,000, but methodological differences make direct comparisons with the current review difficult.
• Between 1995 and 2009, no significant change in relative abundance was detected by the National Gamebag Census, whilst a small but significant increase was reported in the BTO Breeding Bird Survey (BBS). The most recent BBS report indicates a 34% decline (95% CI = 44%-23%) between 1996 and 2014.
• Population size — Data deficient. Range — Increase (Scotland); Stable (England, Wales).
Drivers of change
• Local population suppressed by outbreaks of mange.
• Potential increase in urban populations owing to high food availability.
• Culling of local populations.
Future prospects
• Population status — Stable
• Range status — Stable
• Habitat status — Stable
Range based on 1995-2016 presence data. Areas with very isolated records may not have been included in the distribution – see main report Methods section 2.5 for more details.

34
Badger Meles meles
British population estimate 562,000 (95%CI = 391,000–1,014,000).
Reliability score = 4.
Conservation status Native. IUCN Red list: GB: LC; England: [LC]; Scotland: [LC]; Wales: [LC]; Global: LC.
Caveats Population size estimate may be affected by the following factors, which were not included in the analysis:
• No percentage occupancy data are available, so the population size is likely to be overestimated.
• Several of the habitat-specific density estimates were derived by multiplying sett densities by average social group size. However, social group size can be highly variable.
• A somewhat larger estimate (760,000 (95%CI = 528,000-1,370,000)) is obtained if habitat-specific densities in broadleaved woodland are included. It is unclear whether this estimate includes some double counting of animals accounted for in other habitats.
Changes through time
• Harris et al. (1995) estimated a British population size of 250,000, but comparisons are difficult because of methodological differences.
• Recent population size estimates for England and Wales, made on the basis of sett density surveys and habitat-specific social group sizes (derived from genetic analysis), are similar to those in the current review, and indicate a population increase over time (Judge et al., 2017).
• Population size — Increase. Range — Stable.
Drivers of change
• Reduction of persecution following the implementation of the Protection of Badgers Act (1992).
• Legal culls aimed at reducing bovine tuberculosis incidence in cattle.
• Anthropogenic effects such as vehicle collisions.
Future prospects
• Population status — Stable
• Range status — Stable
• Habitat status — Stable
Range based on 1995-2016 presence data. Areas with very isolated records may not have been included in the distribution — see main report Methods section 2.5 for more details.

35
Otter Lutra lutra
British population estimate [11,000] (95%CI not available).
Reliability score = 1.
Conservation status Native. IUCN Red list: GB: LC; England: [LC]; Scotland: [VU]; Wales: [VU]; Global: NT.
Article 17 overall assessment 2013: UK: Favourable; England: Favourable; Scotland: Favourable; Wales: Favourable.
Caveats Population size estimate may be affected by the following factors, which were not included in the analysis:
• A single density estimate for each country is applied to riparian habitats, so variation owing to habitat heterogeneity is not accounted for.
• In England and Wales, estimates derived from riparian habitats are applied to coastlines as no other information is available.
• Percentage occupancy for Scotland was based on the latest Otter Survey of Scotland, which was conducted during poor field conditions.
Changes through time
• Harris et al. (1995) estimated a British population of 7,350.
• The current review employs the same density estimates as Harris et al. (1995), so changes in population size reflect trends in occupancy and range size only.
• The population size appears to have increased in Britain by 49% compared with the previous review period (Harris et al., 1995).
• Population size — Increase. Range – Increase.
Drivers of change
• Gradual recovery from impacts of organic pollutants following legislative control.
Future prospects
• Population status — Increase
• Range status — Increase
• Habitat status — Stable
Range based on 1995-2016 presence data. Areas with very isolated records may not have been included in the distribution — see main report Methods section 2.5 for more details.

36
Pine marten Martes martes
British population estimate 3,700 (95%CI = 1,600–8,900).
Reliability score = 2.
Conservation status Native. IUCN Red list: GB: LC; England: [CR]; Scotland: [LC]; Wales: [CR]; Global: LC.
Article 17 overall assessment 2013: UK: Favourable; England: Bad; Scotland: Favourable; Wales: Bad.
Caveats Population size estimate may be affected by the following factors not included in the analysis:
• Occupancy data were not available, so population size may be overestimated.
• Estimates of population size were based entirely on woodland. The species uses other habitats, but expert opinion suggests that most British pine martens have woodland as a core part of their range, so this error is unlikely to be serious.
• The estimates do not take into account the relationship between density and forest cover.
• The calculated range was based on all records (see Vincent Wildlife Trust map, above).
Changes through time
• Harris et al. (1995) estimated a British population of 3,650. This is similar to the current estimate, but used different methods, so it is unclear whether the population is stable.
• There has been a continual range expansion in Scotland over the last 20 years, which implies that there is also likely to have been a population increase. Expert opinion suggests population size likely to be close to upper confidence limit shown in this review.
• Population size — Increase (Scotland, Wales). Range — Increase (Scotland, Wales).
Drivers of change
• Legal protection has reduced persecution.
• Increase of habitat availability such as woodland cover.
• Reinforcement of local populations to Wales.
Future prospects
• Population status – Increase
• Range status – Increase
• Habitat status – Stable
Left: Range based on 1995-2016 presence data. Areas with very isolated records may not have been included in distribution – see main report Methods section 2.5 for more details. Right: Current range (up to 2016) provided by the Vincent Wildlife Trust (Croose et al., 2014, Croose et al., 2013). Dark green areas show established populations, and light green areas represent occasional records.

37
Stoat Mustela erminea
British population estimate [438,000] (95%CI not available).
Reliability score = 1.
Conservation status Native. IUCN Red list: GB: LC; England: [LC]; Scotland: [LC]; Wales: [NT]; Global: LC.
Caveats Population size estimate may be affected by the following factors not included in the analysis:
• No percentage occupancy data were available, so population size is likely to be overestimated.
• Density estimates were based on expert opinions included in the previous review (Harris et al., 1995).
• Changes through time
• Harris et al. (1995) estimated a British population of 462,000. The current review uses the same density estimates, so any changes reflect differences in habitat availability only.
• The National Gamebag Census suggests a 28% increase (95%CI = 12%-42%) in the numbers of stoats culled between 1995 and 2009 (Aebischer et al., 2011), but this trend is not adjusted for trapping effort.
• Population size — Data deficient. Range — Stable.
Drivers of change
• Decline in prey populations, particularly rabbits. Future prospects
• Population status — Unknown
• Range status — Unknown
• Habitat status — Stable
Range based on 1995-2016 presence data. Areas with very isolated records may not have been included in the distribution — see main report Methods section 2.5 for more details.

38
Weasel Mustela nivalis
British population estimate [450,000] (95%CI not available).
Reliability score = 0.
Conservation status Native. IUCN Red list: GB: LC; England: [LC]; Scotland: [LC]; Wales: [LC]; Global: LC.
Caveats The population size estimate for weasels was based on population density data from the previous review (Harris et al., 1995), because no further evidence was available.
Changes through time
• Harris et al. (1995) estimated a British population of 450,000. It has not been possible to provide an updated figure.
• The only indicator of trends is from the GWCT National Gamebag Census (Aebischer et al., 2011). This suggests a 51% increase (95%CI = 23%-80%) between 1995 and 2009, but this trend is not adjusted for trapping effort.
• Population size — Data deficient. Range — Increase (Scotland); Stable (England, Wales).
Drivers of change
• Unknown
Future prospects
• Population status — Unknown
• Range status — Unknown
• Habitat status — Stable
Range based on 1995-2016 presence data. Areas with very isolated records may not have been included in the distribution — see main report Methods section 2.5 for more details.

39
Polecat Mustela putorius
British population estimate 83,300 (95%CI = 68,000-99,000).
Reliability score = 4.
Conservation status
Native. IUCN Red list: GB: LC; England: [LC]; Scotland: [EN]; Wales: [LC]; Global: LC.
Article 17 overall assessment 2013: UK: Favourable; England: Favourable; Scotland: Unknown; Wales: Favourable.
Caveats Population size estimate may be affected by the following factors not included in the analysis:
• No habitat-specific density estimates were available. Assessments are therefore based on regional density estimates.
• Classification of true polecats is difficult, so percentage occupancy is likely to be overestimated, particularly in Scotland, where feral ferret-polecat hybrids are common.
Changes through time
• Harris et al. (1995) estimated a British population of 15,000 (Harris et al., 1995).
• The current estimate suggests a significant increase in population size, which appears to be caused by range expansion.
• Similar increases in range and population sizes, albeit with smaller absolute population sizes, are reported elsewhere: a population size of 38,000 in 1997 (Birks and Kitchener, 1999) was reported to have increased to 47,000 in 2006 (Birks, 2015).
• Population size — Increase. Range — Increase (England); Stable (Wales). Scotland unclear: a high proportion of the population are hybrids with feral ferret.
Drivers of change
• Alleviation of hunting pressure.
• Rodenticide intake via consumption of rats may have a negative impact.
• Hybridisation with ferrets.
• Releases have resulted in the establishment of new populations.
Future prospects
• Population status — Increase
• Range status — Increase
• Habitat status — Stable
Range based on 1995-2016 presence data. Areas with very isolated records may not have been included in the distribution — see main report Methods section 2.5 for more details.

40
Mink Neovision vison
British population estimate [122,000] (95%CI not available).
Reliability score = 1.
Conservation status Non-native. IUCN Red list: GB: n/a; England: n/a; Scotland: n/a; Wales: n/a; Global: LC.
Caveats Population size estimate may be affected by the following factors not included in the analysis:
• Population size was estimated in riparian habitats from one density report, and for coastal habitats from two reports.
• Widely differing percentage occupancy values were available for coastal and riparian habitats, but these are likely to result from methodological differences.
• Gaps in the species’ distribution in the Scottish Borders and Argyll are likely to reflect a lack of survey effort rather than true absences.
Changes through time
• Harris et al. (1995) estimated a British population of >110,000.
• Both the Water Vole and Mink Survey of Britain (Jefferies et al., 2003), and data from the National Otter Surveys (Bonesi et al., 2006), suggest declining occupancy.
• The current review suggests a 65% decline in population size between 1989-1990 and 1996-1998 (from 105,650 to 36,950); and a 45% decline between 1996-1998 and 2016 (from 36,950 to 20,500). The largest declines are in Scotland, particularly in areas with widescale co-ordinated mink control programmes.
• The National Gamebag Census suggests a 41% decline (95%CI = 49%-33%) between 1995 and 2009 (Aebischer et al., 2011), but this trend is not adjusted for hunting effort.
• Population size — Decline. Range — Increase (England, Wales); Decline (Scotland).
Drivers of change
• Competition by increasing otter populations.
• Culling of local populations.
Future prospects
• Population status — Stable/Decline
• Range status — Stable/Decline
• Habitat status — Stable
Range based on 1995-2016 presence data. Areas with very isolated records may not have been included in the distribution — see main report Methods section 2.5 for more details.

41
Wild boar Sus scrofa
British population estimate 2,600 (95%CI = 200–8,400).
Reliability score = 2.
Conservation status Native. IUCN Red list: GB: DD; England: [DD]; Scotland: [DD]; Wales: [DD]; Global: LC.
Caveats Population size estimate may be affected by the following factors, which were not included in the analysis:
• No percentage occupancy data were available; the population size is therefore overestimated.
• Population density estimates are based on focal areas which are unlikely to be representative of the entire range.
• Wild boar may be present in additional locations not currently defined as part of their range. However, records of culled animals were included in the presence records used to generate the distribution maps, and these may have inflated the geographical range. These two sources of error act in opposite directions.
• Current populations are of unknown provenance, but are also under strong selection pressure for wild-type characteristics so their genetic profile is likely to change rapidly even if they originate from farmed stock.
Changes through time
• Harris et al. (1995) did not produce a British population estimate.
• Escapes from captive populations and/or deliberate illegal releases, stemming from the 1990s onwards, have established breeding populations. Several of these appear to be increasing (DEFRA, 2008), particularly in the Forest of Dean where there are approximately 1,000 mature animals (Gill and Waeber, 2016).
• Population size — Increase. Range — Increase (England, Scotland).
Drivers of change
• Escapes from captive populations.
• Human management by culling.
Future prospects
• Population status — Increase
• Range status — Increase
• Habitat status — Stable
Range based on 1995-2016 presence data. Areas with very isolated records may not have been included in the f distribution — see main report Methods section 2.5 for more details.

42
Red deer Cervus elaphus
British population estimate 346,000 (95%CI = 212,000–516,000).
Reliability score = 4.
Conservation status Native. IUCN Red list: GB: LC; England: [LC]; Scotland: [LC]; Wales: [LC]; Global: LC.
Caveats Population size estimate may be affected by the following factors not included in the analysis:
• Red deer have a patchy distribution in England and Wales. No occupancy data were available, so the species was assumed to be present in all potentially suitable habitat in the range. The population size is therefore overestimated.
• Density estimates for woodland in England and Wales are derived from a single source.
• No account is taken of the regional variations in deer density trends in Scotland.
Changes through time
• Harris et al. (1995) estimated a British population size of 360,000.
• Methodological differences between the current review and Harris et al. (1995) complicate assessments of trends over time.
• The Deer Management Report (Scottish Natural Heritage, 2016) suggests opposing trends in abundance for different habitats in Scotland: a 12% decline in National Forest Estate woodlands between 2001 and 2016 contrasts with an increase (which has plateaued in recent years) in open ground. Over the longer term, population densities increased across Scotland between 1961 and 2000-2001, and have remained roughly stable since then (Scottish Natural Heritage, 2016).
• Population size — Increase (likely to have plateaued). Range — Increase.
Drivers of change
• Hybridisation with sika deer.
• Human management by culling.
• Human management by supplementary feeding on game estates.
Future prospects
• Population status — Increase
• Range status — Increase
• Habitat status — Stable
Range based on 1995-2016 presence data. Areas with very isolated records may not have been included in the distribution — see main report Methods section 2.5 for more details.

43
Sika deer Cervus nippon
British population estimate [103,000] (95%CI = 27,000–266,000).
Reliability score = 0.5.
Conservation status Non-native. IUCN Red list: GB: n/a; England: n/a; Scotland: n/a; Wales: n/a; Global: LC.
Caveats Population size estimate may be affected by the following factors, which were not included in the analysis:
• Sika deer have a patchy distribution. No occupancy data were available, so the species was assumed to be present in all woodland and dwarf shrub heath (excluding Scotland) in the range. The population size is therefore overestimated.
• Population density estimates are based focal areas which are unlikely to be representative of the entire range.
• The population density estimate for coniferous woodland is derived from southern Scotland, and may not reflect the variability throughout the range.
Changes through time
• Harris et al. (1995) estimated a British population of 11,500.
• Methodological differences between the current review and Harris et al. (1995) complicate assessments of trends over time.
• The National Gamebag Census found that numbers of sika deer culled since 1995 has increased by 35% (95%CI = -8% to 74%) (Nicholas Aebischer, pers. comm.). However, this trend is not adjusted for hunting effort.
• Population size — Increase. Range — Increase.
Drivers of change
• Human management by culling.
• Hybridisation with red deer limits the spread of pure sika deer.
Future prospects
• Population status — Increase
• Range status — Increase
• Habitat status — Stable
Range based on 1995-2016 presence data. Areas with very isolated records may not have been included in the distribution — see main report Methods section 2.5 for more details.

44
Fallow deer Dama dama
British population estimate 264,000 (95%CI = 194,000–343,000).
Reliability score = 3.
Conservation status Naturalised. IUCN Red list: GB: n/a; England: n/a; Scotland: n/a; Wales: n/a; Global: LC.
Caveats Population size estimate may be affected by the following factors, which were not included in the analysis:
• Fallow deer density is highly variable within and between habitats.
• Population density estimates are based on focal areas which are unlikely to be representative of the entire range, and are likely to have overestimated the population size.
• Fallow deer have a patchy distribution. Percentage occupancy is based on a very small sample size, and may not accurately represent the situation throughout the species’ range.
Changes through time
• Harris et al. (1995) estimated a British population of 100,000.
• Methodological differences between the current review and Harris et al. (1995) complicate assessments of trends over time.
• The National Gamebag Census has found a non-significant increase of 45% (95%CI = -2% to-196%) in fallow deer culled in Britain since 1995 (Nicholas Aebischer, pers. comm.).
• Range size increased by 1.8% per year between 1972 and 2002 (Ward, 2005), followed by a further recorded increase between 2007 and 2011 mainly in England and Wales.
• Population size — Increase. Range — Increase.
Drivers of change
• Human management by culling.
Future prospects
• Population status — Increase
• Range status — Increase
• Habitat status — Stable
Range based on 1995-2016 presence data. Areas with very isolated records may not have been included in the distribution — see main report Methods section 2.5 for more details.

45
Roe deer Capreolus capreolus
British population estimate 265,000 (95%CI = 215,000–296,000).
Reliability score = 4.
Conservation status Native. IUCN Red list: GB: LC; England: [LC]; Scotland: [LC]; Wales: [LC]; Global: LC.
Caveats Population size estimate may be affected by the following factors not included in the analysis:
• A single density estimate was used for both coniferous and broadleaved woodland.
• It is assumed that population density estimates for woodlands represent the whole population. The computed population size may be an underestimate if woodland patches surrounded by other favourable foraging resources (such as arable crops) support higher densities than the same size area of continuous woodland.
• Availability of population density estimates for woodlands varies between country: it is likely that estimates for England are more robust than for Wales or Scotland.
• Percentage occupancy is based on a low number of surveys, and may not accurately represent the situation throughout the species’ range.
Changes through time
• Harris et al. (1995) estimated a British population of 500,000, based on cull rates.
• Methodological differences between the current review and Harris et al. (1995) complicate assessments of trends over time.
• The National Gamebag Census found a 31% increase (95%CI = 18%-54%) in deer culled in Britain between 1995 and 2014, but these trends do not account for hunting effort.
• Population size — Increase (England, Wales), Stable (Scotland). Range — Increase (England, Wales), Stable (Scotland).
Drivers of change
• Competition with muntjac deer.
• Vehicle collisions on roads.
Future prospects
• Population status – Stable
• Range status – Stable
• Habitat status – Stable
Range based on 1995-2016 presence data. Areas with very isolated records may not have been included in the distribution — see main report Methods section 2.5 for more details.

46
Chinese water deer Hydropotes inermis
British population estimate [3,600] (95%CI = 200–43,000).
Reliability score = 1.
Conservation status Non-native. IUCN Red list: GB: n/a; England: n/a; Scotland: n/a; Wales: n/a; Global: VU.
Caveats Population size estimate may be affected by the following factors not included in the analysis:
• No percentage occupancy data were available, so the population size is overestimated.
• Population density estimates are derived from expert opinion and may not represent values across the whole geographical range.
Changes through time
• Harris et al. (1995) estimated a British population of 650 (all in England).
• There are methodological differences between the current review and that of Harris et al. (1995), but comparisons are considered reliable because of the low population size.
• A population size of 7,000 was estimated in 2010, which also suggests a population increase (Cooke, 2011). However, it was based on different methodology from the current report.
• Population size — Increase. Range — Increase (England).
Drivers of change
• Continued expansion into suitable habitat.
• Changes in land management increasing habitat quality.
Future prospects
• Population status — Increase
• Range status — Increase
• Habitat status — Stable
Range based on 1995-2016 presence data. Areas with very isolated records may not have been included in the distribution — see main report Methods section 2.5 for more details.

47
Reeves’ muntjac Muntiacus reevesi
British population estimate 128,000 (95%CI = 115,000–147,000).
Reliability score = 4.
Conservation status Non-native. IUCN Red list: GB: n/a; England: n/a; Scotland: n/a; Wales: n/a; Global: LC.
Caveats Population size estimate may be affected by the following factors not included in the analysis:
• Only a single population density, from coniferous woodland, was available. This value has been applied to all woodland.
• Percentage occupancy was based on surveys from 15 sites, and may not account for variation across the geographical range.
• The population estimates were derived from woodland habitat only. This is likely to have resulted in an underestimate since the species is known occupy small patches of rough vegetation, hedgerows and ditches away from woodland.
Changes through time
• Harris et al. (1995) estimated a British population of 40,000. This is substantially smaller than the current estimate, even after adjusting for methodological differences.
• The range has expanded over time; this is likely to account for the increasing population size.
• The National Gamebag Census reports a 219% increase (95%CI = 152%-325%) in the numbers culled between 1995 and 2015 (Nicholas Aebischer, pers. comm.), but this trend does not account for hunting effort.
• Population size – Increase. Range — Increase.
Drivers of change
• Continued expansion into suitable habitat.
• Climate change, providing milder winters.
• Vehicle collisions on roads.
Future prospects
• Population status — Increase
• Range status — Increase
• Habitat status — Stable
Range based on 1995-2016 presence data. Areas with very isolated records may not have been included in the distribution — see main report Methods section 2.5 for more details.

48
Greater horseshoe bat Rhinolophus ferrumequinum
British population estimate
12,900 (Plausible Intervals (PIs) = 9,200–18,500).
Reliability score = 4.
Conservation status Native. IUCN Red list: GB: LC; England: [LC]; Scotland: n/a; Wales: [NT]; Global: LC.
Article 17 overall assessment 2013: Annex II and IV; UK: Favourable; England: Favourable; Scotland: n/a; Wales: Favourable.
Caveats Population size estimate may be affected by the following factors not included in the analysis:
• Not all maternity roosts are known, but confidence in the estimate is high owing to extensive study.
• Sex ratio in maternity colonies is uncertain.
Changes through time • Harris et al. (1995) estimated a British population of 4,000-6,600. This was likely to be an
underestimate owing to restricted knowledge of several key maternity roosts.
• Increases in indices of abundance have been measured by the National Bat Monitoring Programme at 32 maternity sites (5.2% per year since 1997) and hibernacula (4.8% per year since 1990).
• Population size — Increase (England, Wales). Range — Increase (England, Wales).
Drivers of change
• Reduction in prey availability owing to agricultural intensification.
• Protection of maternity roosts, but loss of mating roosts and disturbance of hibernation sites.
• Climate change, providing milder winters.
• Roads pose threat of habitat fragmentation and vehicle collisions.
• Artificial night lighting reducing habitat suitability.
Future prospects
• Population status — Increase
• Range status — Increase
• Habitat status — Stable
Range based on 1995-2016 presence data. Areas with very isolated records may not have been included in the distribution — see main report Methods section 2.5 for more details.

49
Lesser horseshoe bat Rhinolophus hipposideros
British population estimate 50,400 (Plausible Intervals = 36,000–72,000).
Reliability score = 3.
Conservation status Native. IUCN Red list: GB: LC; England: [LC]; Scotland: n/a; Wales: [LC]: Global: LC.
Article 17 overall assessment 2013: Annex II and IV; UK: Favourable; England: Favourable; Scotland: n/a; Wales: Favourable.
Caveats Population size estimate may be affected by the following factors not included in the analysis:
• Not all maternity roosts are known, but confidence in the estimate is high owing to extensive study.
• Sex ratio in maternity colonies is uncertain.
Changes through time
• Harris et al. (1995) estimated a British population of 14,000.
• Increase in hibernation records from the north of England and the Midlands.
• Increases in indices of abundance have been measured by the National Bat Monitoring Programme at maternity sites (3.6% per year since 1993) and hibernacula (5.6% per year since 1990).
• The JNCC 2012 Article 17 Report also notes an increasing population size trend.
• Population size — Increase (England, Wales). Range — Increase (England, Wales)
Drivers of change
• Reduction in prey availability owing to agricultural intensification.
• Climate change, providing milder winters.
• Roads pose a threat of habitat fragmentation and vehicle collisions..
• Artificial night lighting, reducing habitat suitability.
• Protection of maternity roosts, but disturbance of hibernation roosts.
Future prospects
• Population status — Increase
• Range status — Increase
• Habitat status — Stable
Range based on 1995-2016 presence data. Areas with very isolated records may not have been included in the area of distribution – see main report Methods section 2.5 for more details.

50
Alcathoe bat Myotis alcathoe
British population estimate Not available. (Plausible Intervals not available).
Reliability score = 0.
Conservation status Native. IUCN Red list: GB: DD; England: [DD]; Scotland: [DD]; Wales: [DD]; Global: DD.
Article 17 overall assessment 2013: Annex IV; UK: Unknown; England: Unknown; Scotland: n/a; Wales: n/a.
Caveats It is not currently possible to estimate population size, and ranges are extremely poorly defined.
Changes through time
• The species was not identified at the time of the previous report, so comparisons are not possible. The range is somewhat larger than that given in the Article 17 Report (Joint Nature Conservation Committee, 2013b), largely because intensive survey effort in Surrey, Kent and Sussex has increased the number of known sites.
• Population size — Data deficient. Range — Data deficient.
Drivers of change
• Unknown
Future prospects
• Population status — Unknown
• Range status — Unknown
• Habitat status — Unknown
Range based on 2010-2016 presence data. Areas with very isolated records may not have been included in the distribution — see main report Methods section 2.5 for more details.
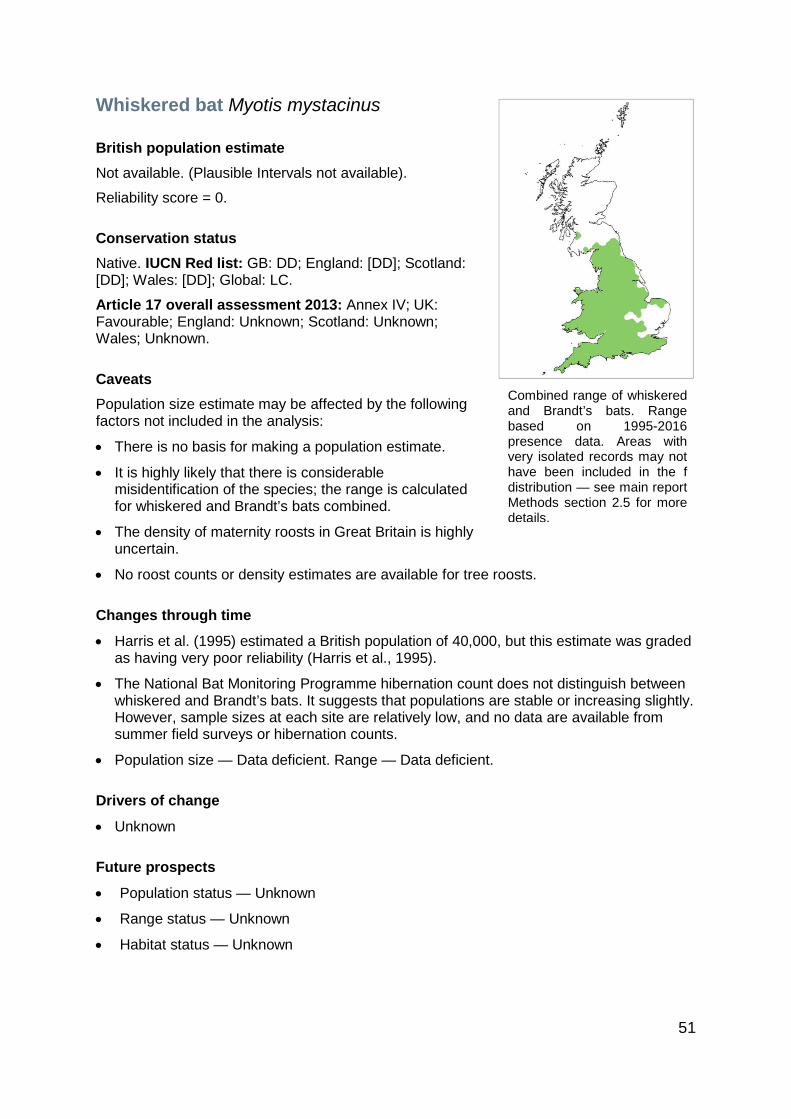
51
Whiskered bat Myotis mystacinus
British population estimate Not available. (Plausible Intervals not available).
Reliability score = 0.
Conservation status Native. IUCN Red list: GB: DD; England: [DD]; Scotland: [DD]; Wales: [DD]; Global: LC.
Article 17 overall assessment 2013: Annex IV; UK: Favourable; England: Unknown; Scotland: Unknown; Wales; Unknown.
Caveats Population size estimate may be affected by the following factors not included in the analysis:
• There is no basis for making a population estimate.
• It is highly likely that there is considerable misidentification of the species; the range is calculated for whiskered and Brandt’s bats combined.
• The density of maternity roosts in Great Britain is highly uncertain.
• No roost counts or density estimates are available for tree roosts.
Changes through time
• Harris et al. (1995) estimated a British population of 40,000, but this estimate was graded as having very poor reliability (Harris et al., 1995).
• The National Bat Monitoring Programme hibernation count does not distinguish between whiskered and Brandt’s bats. It suggests that populations are stable or increasing slightly. However, sample sizes at each site are relatively low, and no data are available from summer field surveys or hibernation counts.
• Population size — Data deficient. Range — Data deficient.
Drivers of change
• Unknown
Future prospects
• Population status — Unknown
• Range status — Unknown
• Habitat status — Unknown
Combined range of whiskered and Brandt’s bats. Range based on 1995-2016 presence data. Areas with very isolated records may not have been included in the f distribution — see main report Methods section 2.5 for more details.

52
Brandt’s bat Myotis brandtii
British population estimate Not available. (Plausible Intervals not available).
Reliability score = 0.
Conservation status
Native. IUCN Red list: GB: DD; England: [DD]; Scotland: [DD]; Wales: [DD]; Global: LC.
Article 17 overall assessment 2013: Annex IV; UK: Favourable; England: Unknown; Scotland: n/a; Wales: Unknown.
Caveats Population size estimate may be affected by the following factors not included in the analysis:
• There is no basis for making a population estimate.
• It is highly likely that there is considerable misidentification of the species; the range is calculated for whiskered and Brandt’s bats combined.
• The density of maternal roosts in Great Britain is highly uncertain.
• No roost counts or density estimates are available for tree roosts.
Changes through time
• Harris et al. (1995) estimated a British population of 30,000, but this estimate was graded as having very poor reliability (Harris et al., 1995).
• The National Bat Monitoring Programme hibernation count does not distinguish between whiskered and Brandt’s bats. It suggests that populations are stable or increasing slightly. However, sample sizes at each site are relatively low, and no field or summer roost data are available.
• Population size — Data deficient. Range — Data deficient..
Drivers of change
• Unknown
Future prospects
• Population status — Unknown
• Range status — Unknown
• Habitat status — Unknown
Combined range of whiskered and Brandt’s bats. Range based on 1995-2016 presence data. Areas with very isolated records may not have been included in the distribution — see main report Methods section 2.5 for more details.

53
Bechstein’s bat Myotis bechsteinii
British population estimate 21,800 (Plausible Intervals = 10,000–56,000).
Reliability score = 2.
Conservation status Native. IUCN Red list: GB: LC; England: [LC]; Scotland: n/a; Wales: [EN]; Global: NT.
Article 17 overall assessment 2013: Annex II and IV; UK: Unknown; England: Unknown; Scotland: n/a; Wales: Unknown.
Caveats Population size estimate may be affected by the following factors not included in the analysis:
• There is likely to be a bias towards identifying and counting larger roosts.
• It has not been possible to adjust the estimates for occupancy rates owing to a lack of data.
• The range may be underestimated, as it is difficult to identify Bechstein’s bats with certainty using acoustic surveys, and tree roosts are difficult to find.
• The estimates do not account for the possibility that some woodlands appear to be occupied exclusively by males. This error is likely to overestimate the population size.
• The extent to which Bechstein’s bats use hedgerows and parkland is unknown. Focusing on broadleaved woodlands may therefore have underestimated the true population size.
Changes through time
• Harris et al. (1995) estimated a British population of 1,500, but this estimate was graded as having very poor reliability. Comparison with the estimate from the current review is not appropriate owing to the very large increase in survey effort over the past decade.
• The population has suffered a historical bottleneck (Durrant et al., 2009), but recent evidence suggests that the genetic status of the population is better than previously thought, except for one population in Buckinghamshire (Wright et al., 2018).
• Population size — Data deficient. Range — Data deficient.
Drivers of change
• Unknown
Future prospects
• Population status — Unknown
• Range status — Stable
• Habitat status — Decline
Range based on 1995-2016 presence data. Areas with very isolated records may not have been included in the distribution – see main report Methods section 2.5 for more details.

54
Daubenton’s bat Myotis daubentonii
British population estimate [1,030,000] (Plausible Intervals 27,000–4,440,000).
Reliability score = 1.
Conservation status Native. IUCN Red list: GB: LC; England: [LC]; Scotland: [LC]; Wales: [LC]; Global: LC.
Article 17 overall assessment 2013: Annex IV; UK: Favourable; England: Favourable; Scotland: Favourable; Wales: Favourable.
Caveats The plausible intervals are very wide. Population size estimate may be affected by the following factors not included in the analysis:
• There is uncertainty about roost size.
• Roost density is likely to be underestimated owing to difficulty of locating roosts in trees, bridges and tunnels,
• The sex ratio in maternity colonies pre-parturition is poorly understood.
• Density variation across habitat and geographical gradients unknown for most of Britain.
• The species is likely to be under-recorded in non-riparian habitats, particularly in woodland, as call parameters are similar to other Myotis spp.
• Occupancy data are not available.
Changes through time
• Harris et al. (1995) estimated a British population of 150,000, but this estimate was graded as having very poor reliability.
• The National Bat Monitoring Programme has indicated an increasing trend at hibernation sites. However, this result may be unreliable because of an outlying value for 2015.
• Population size — Unknown. Range — Stable.
Drivers of change
• Loss of roosts during works to bridges, tunnels and other structures.
• Alteration to water quality resulting in a change in prey abundance.
• Artificial lighting of waterways and bridges affecting habitat quality and connectivity.
Future prospects
• Population status — Unknown
• Range status — Stable
• Habitat status — Unknown
Range based on 1995-2016 presence data. Areas with very isolated records may not have been included in the distribution — see main report Methods section 2.5 for more details.

55
Greater mouse-eared bat Myotis myotis
British population estimate Not available. (Plausible Intervals not available). Only a single individual male is known.
Reliability score = n/a.
Conservation status Native. IUCN Red List: GB: CR; England: [CR]; Scotland: n/a; Wales: n/a; Global: LC.
Distribution Restricted to a small area of Sussex. Therefore, no map is shown.
Caveats Although extensive monitoring has been conducted at the hibernation sites where greater mouse-eared bats have been recorded in England, there have not been exhaustive searches of potential summer roosting locations or swarming sites. It is therefore plausible that other individuals are present in Great Britain.
Changes through time
• Harris et al. (1995) showed a population size of one, as in the current review (though this is known not to be the same individual animal).
• Population size — Stable. Range — Stable.
Drivers of change
• There is no evidence for a change in population size or distribution. If no additional populations are found, then the species will disappear on the death of the currently-known individual. However, there is potential for climate change to make conditions in Great Britain more suitable in future, provided that habitat quality is appropriate.
Future prospects
• Population status — Decline
• Range status — Decline
• Habitat status — Stable

56
Natterer’s bat Myotis nattereri
British population estimate 973,000 (PIs = 510,000–1,360,000) based on woodland; OR
[414,000] (PIs =15,000–2,630,000) based on mixed habitat.
Reliability score = 2.
Conservation status
Native. IUCN Red list: GB: LC; England: [LC]; Scotland: [LC]; Wales: [LC]]; Global: LC.
Article 17 overall assessment 2013: Annex IV; UK: Favourable; England: Favourable; Scotland: Favourable; Wales: Favourable.
Caveats The plausible intervals (PIs)are very wide. Population size estimate may be affected by the following factors not included in the analysis:
• Roost densities are extremely uncertain, and no data were available for tree roosts.
• Woodland habitat estimates were based on sites with substantial bat populations (and established bat box schemes), so the population is likely to be overestimated.
• It is unclear whether bats roosting within woodland make extensive use of other habitats: effective density may be much lower than that estimated from woodland area alone.
• The sex ratio in maternity colonies pre-parturition is poorly understood.
• Range in Scotland may be underestimated owing to low recording effort.
Changes through time
• Harris et al. (1995) estimated a British population of 100,000, but this was graded as having very poor reliability (Harris et al., 1995).
• The National Bat Monitoring Programme counts suggest no change over time.
• Population size — Data deficient. Range — Data deficient.
Drivers of change
• Increased availability of broadleaved woodland for foraging and roosting.
• Loss of foraging and roosting habitat through barn conversions, urban expansion, and changes in agricultural landscape.
• Vehicle collisions and artificial night lighting fragmenting habitat.
Future prospects
• Population status — Unknown
• Range status — Stable
• Habitat status — Decline
Range based on 1995-2016 presence data. Areas with very isolated records may not have been included in the distribution — see main report Methods section 2.5 for more

57
Serotine bat Eptesicus serotinus
British population estimate 136,000 (Plausible Intervals = 7,300–413,000).
Reliability score = 3.
Conservation status Native. IUCN Red list: GB: VU; England: [VU]; Scotland: n/a; Wales: [VU]; Global: LC.
Article 17 overall assessment 2013: Annex IV; UK: Favourable; England: Unknown; Scotland: n/a; Wales: Unknown.
Caveats Population size estimate may be affected by the following factors not included in the analysis:
• Roost densities are uncertain.
• Information on variability in roost densities or colony sizes across habitat and geographical gradients is lacking. The populations in the east and the west appear distinct, yet most data come from the south of east England.
Changes through time
• Harris et al. (1995) estimated a population of 15,000, but this judged very unreliable.
• The National Bat Monitoring Programme field and roost count data suggest a non-significant long-term decline since 1998 in Britain.
• Expert opinion suggests declining populations in the east of England.
• The present range is larger than the Article 17 report (Joint Nature Conservation Committee, 2013b) and Arnold (1993), with the range expanding west and north.
• Population size — Data deficient. Range — Data deficient.
Drivers of change
• Legal protection of roosts owing to dependency on building roosts.
• Prey declines resulting from changes in agricultural practice and possibly pesticide use, although effects are not quantified.
• Climate change owing to potential vulnerability to poor summer weather.
• Alteration to roost conditions in buildings.
Future prospects
• Population status — Unknown
• Range status — Increase
• Habitat status — Decline
Range based on 1995-2016 presence data. Areas with very isolated records may not have been included in the distribution — see main report Methods section 2.5 for more details.

58
Leisler’s bat Nyctalus leisleri
British population estimate Not available. (Plausible Intervals not available).
Reliability score = 0.
Conservation staus Native. IUCN Red list: GB: NT; England: [NT]; Scotland: [NT]; Wales: [NT]; Global: LC.
Article 17 overall assessment 2013: Annex IV; UK: Favourable; England: Unknown; Scotland: Unknown; Wales: Unknown.
Caveats
• There is no basis for making a population estimate.
• The density of maternity roosts is highly uncertain. No expert could provide estimates. It is therefore concluded that there is currently no understanding of Leisler’s bat roost (or colony) density. Given the generalist nature of the species, and the likelihood that very large numbers of roosts are unreported, models of roost distribution would be speculative. From current data, estimates of expected roost density are not possible.
• The range of the species is uncertain. Modern broadband bat detectors have increased the number of records based on acoustic data, but the scale of misidentification when Nyctaloid bats are classified to species is unclear. In Wales, all of the records for this species are based on acoustic data, and have not been verified by either the capture of animals or the genetic profiling of droppings.
• Many acoustic records, and all of those in Wales, are not supported by regional records of bats identified in the hand (or by genetic analysis), raising doubts about their validity.
Changes through time
• Harris et al. (1995) estimated a British population size of 10,000, but this estimate was graded as having very poor reliability.
• The distribution of this species is larger than that reported by Arnold (1993) but smaller than that given in the Article 17 Report (Joint Nature Conservation Committee, 2013b). However, these differences may reflect different methodological approaches.
• Population size — Data deficient. Range — Data deficient.
Drivers of change
• Unknown
Future prospects
• Population status — Unknown
• Range status — Unknown
• Habitat status — Stable
Range based on 1995-2016 presence data. Areas with very isolated records may not have been included in the distribution — see main report Methods section 2.5 for more details.

59
Noctule bat Nyctalus noctula
Population estimate Britain not calculated.
England [565,000] (PIs 17,700-1,872,000); Wales [91,900] (PIs 2,900-304,000); Scotland not calculated.
Reliability score = 0.
Conservation status
Native. IUCN Red list: GB: LC; England: [LC]; Scotland: [LC]; Wales: [LC]; Global: LC.
Article 17 overall assessment 2013: Annex IV; UK: Favourable; England: Unknown; Scotland: Unknown;
Wales: Unknown.
Caveats Population size estimate may be affected by the following factors not included in the analysis:
• The density of maternity roosts is highly uncertain.
• The sex ratio in maternity colonies pre-parturition is poorly understood.
• Roost count estimates were based on a relatively small sample size. Whilst these are comparable with the literature, it is unclear whether there is variation across Great Britain.
• No data on occupancy or density trends across geographical gradients are available.
Changes through time • Harris et al. (1995) estimated a British population of 50,000. The estimates in the current
review are an order of magnitude greater than those given in either Harris et al. (1995) or the Article 17 Report(Joint Nature Conservation Committee, 2013a).
• The distribution is larger than reported in the first Mammal Atlas by (Arnold, 1993)), which showed the species as being virtually absent from Scotland. It is unclear whether this represents true range expansion or an increase in observer effort.
• The National Bat Monitoring Programme field survey suggests, based on bat acoustic records, that there has been no change since 1998.
• Population size — Data deficient. Range — Data deficient.
Drivers of change
• Collisions with wind turbines.
Future prospects
• Population status — Unknown
• Range status — Unknown
• Habitat status — Unknown
Range based on 1995-2016 presence data. Areas with very isolated records may not have been included in the distribution — see main report Methods section 2.5 for more details.

60
Common pipistrelle bat Pipistrellus pipistrellus
British population estimate 3,040,000 (Plausible Intervals = 991,000–7,510,000).
Reliability score = 2.
Conservation status IUCN Red list: GB: LC; England: [LC]; Scotland: [LC]; Wales: [LC]; Global: LC.
Article 17 overall assessment 2013: Annex IV; UK: Favourable England: Favourable; Scotland: Favourable; Wales: Favourable.
Caveats Population size estimate may be affected by the following factors not included in the analysis:
• The density of maternity roosts is highly uncertain.
• No data on occupancy or density trends across geographical gradients are available.
• The sex ratio in maternity colonies pre-parturition is poorly understood.
Changes through time
• Comparisons with the report by Harris et al. (1995) are not possible, as the two phonic types, common and soprano pipistrelle, were not separated at that time.
• The distribution of P. pipistrellus sensu stricto. (i.e., strictly defined) is similar to that given for P. pipistrellus sensu lato (i.e., including both phonic types) in earlier reports (Harris et al., 1995, Arnold, 1993, Joint Nature Conservation Committee, 2013b).
• The National Bat Monitoring Programme field survey has recorded a significant increase in acoustic records, whereas the roost counts show a consistent and significant decline.
• Population size — Data deficient. Range — Data deficient.
Drivers of change
• Collisions with wind turbines and road vehicles.
• Protection of maternity roosts and condition improvements but changes to construction and insulation methods used in new buildings..
• Predation by cats.
Future prospects
• Population status — Unknown
• Range status — Stable
• Habitat status — Stable
Range based on 1995-2016 presence data. Areas with very isolated records may not have been included in the distribution — see main report Methods section 2.5 for more details.

61
Soprano pipistrelle bat Pipistrellus pygmaeus
British population estimate 4,670,000 (Plausible Intervals = 1,970,000–8,400,000).
Reliability score = 2.
Conservation status IUCN Red list: GB: LC; England: [LC]; Scotland: [LC]; Wales: [LC]; Global: LC.
Article 17 overall assessment 2013: Annex IV; UK: Favourable; England: Favourable; Scotland: Favourable; Wales: Favourable.
Caveats Population size estimate may be affected by the following factors not included in the analysis:
• The density of maternity roosts is highly uncertain.
• The sex ratio in maternity colonies pre-parturition is poorly understood.
• No data on occupancy or density trends across geographical gradients are available.
Changes through time
• Comparisons with the report by Harris et al. (1995) are not possible, as the two phonic types, common and soprano, were not separated at that time.
• The distribution of P. pygmaeus sensu stricto. (i.e., strictly defined) is similar to that given for P. pipistrellus sensu lato (i.e., including both phonic types) in earlier reports (Harris et al., 1995, Arnold, 1993, Joint Nature Conservation Committee, 2013).
• The National Bat Monitoring Programme field survey has recorded a significant increase, whereas the roost counts have shown a consistent and significant decline.
• Population size — Data deficient. Range — Data deficient
Drivers of change
• Collisions with wind turbines and road vehicles.
• Protection of maternity roosts and condition improvements, but changes to construction and insulation methods used in new buildings.
• Predation by cats.
Future prospects
• Population status — Unknown
• Range status — Stable
• Habitat status — Stable
Range based on 1995-2016 presence data. Areas with very isolated records may not have been included in the distribution — see main report Methods section 2.5 for more details. Few records prior to 1999 because of the recent identification of the species.

62
Nathusius’ pipistrelle bat Pipistrellus nathusii
British population estimate Not available. (Plausible Intervals not available).
Reliability score = 0.
Conservation status IUCN Red list: GB: NT; England: [NT]; Scotland: [VU]; Wales: [VU]; Global: LC.
Article 17 overall assessment 2013: Annex IV; UK: Unknown; England: Unknown; Scotland: Unknown; Wales: Unknown.
Caveats
• There is insufficient information on roost density or counts to enable an estimate of population size to be derived. No alternative sources of information (e.g., from population genetics) are available for Great Britain. No estimates were made in the most recent Article 17 Reports (Joint Nature Conservation Committee, 2013b).
Changes through time
• The number of Nathusius’ pipistrelle bat acoustic records has increased rapidly over the past decade. This is partly owing to increased observer effort and improved species identification. The scale of the change is such that it seems reasonable to infer that there could be a genuine increase in the number of Nathusius’ pipistrelle bats in Great Britain.
• Population size — Data deficient. Range — Data deficient.
Drivers of change
• Climate change affecting migration routes and summering/wintering grounds.
Future prospects
• Population status — Unknown
• Range status — Unknown
• Habitat status — Stable
Range based on 1995-2016 presence data. Areas with very isolated records may not have been included in the distribution – see main report Methods section 2.5 for more details.

63
Barbastelle bat Barbastella barbastellus
British population estimate Not available. (Plausible Intervals not available).
Reliability score = 0.
Conservation status IUCN Red list: GB: VU; England: [VU]; Scotland: n/a; Wales: [VU]; Global: NT.
Article 17 overall assessment 2013: Annex II and IV; UK: Unknown; England: Unknown; Scotland: n/a; Wales: Unknown.
Caveats Population size estimate may be affected by the following factors not included in the analysis:
• As very little information is available for this species, it is not possible to make a population size estimate. Further information on occupancy is urgently required in order to estimate the range more precisely.
• The density of maternity roosts in Great Britain is unknown. The extent to which maternity colonies can use isolated trees is also unknown, so population estimates based solely on broadleaved woodland may be unsafe.
• No occupancy data are available for woodlands of different structure or in different regions. The ability of barbastelle bats to use almost any type of tree with suitable cavities further compounds the difficulty of creating habitat suitability models for this species.
• Information on roost size is based on very limited information, and the relationship with overall colony size is unclear.
• This species is recorded using acoustic detectors relatively uncommonly, but is found across a wide geographical area in Wales and the south of England.
Changes through time
• Harris et al. (1995) estimated a British population of 5,000, but this was entirely based on expert opinion. No population estimate has been made in the current review.
• Population size — Data deficient. Range — Data deficient.
Drivers of change
• There is no evidence regarding any drivers of change.
Future prospects
• Population status — Unknown
• Range status — Unknown
• Habitat status — Decline
Range based on 1995-2016 presence data. Areas with very isolated records may not have been included in the distribution — see main report Methods section 2.5 for more details.
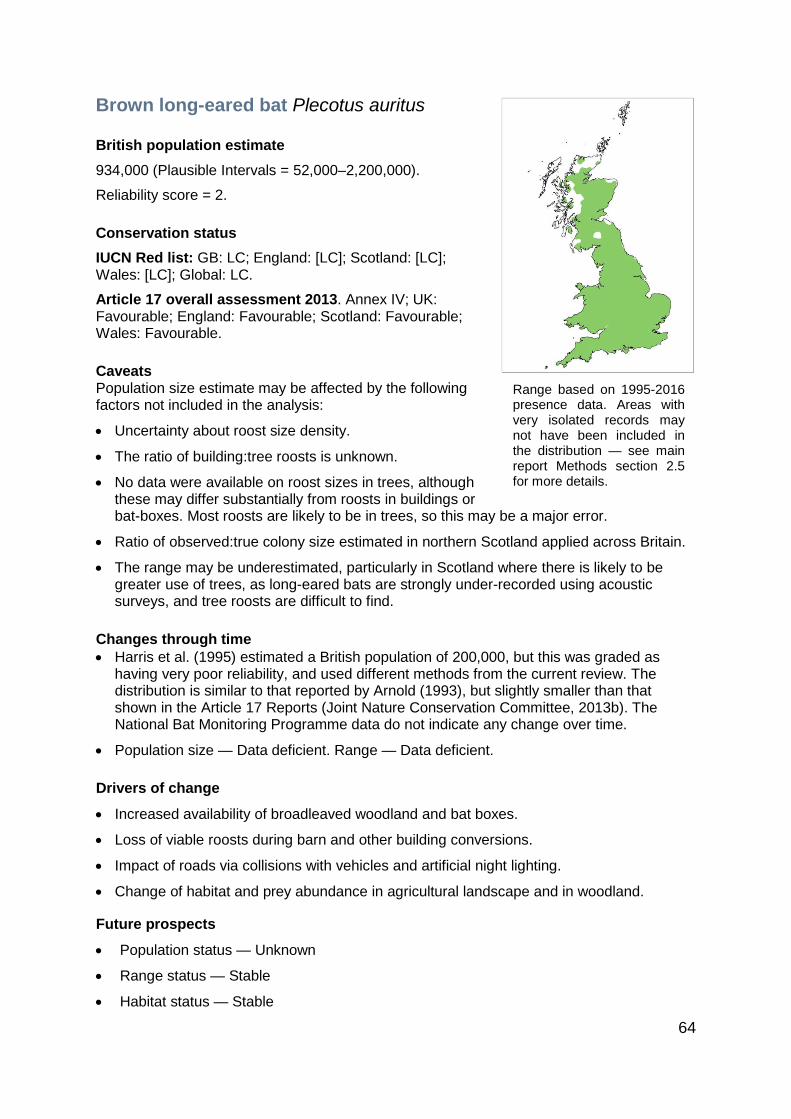
64
Brown long-eared bat Plecotus auritus
British population estimate 934,000 (Plausible Intervals = 52,000–2,200,000).
Reliability score = 2.
Conservation status
IUCN Red list: GB: LC; England: [LC]; Scotland: [LC]; Wales: [LC]; Global: LC.
Article 17 overall assessment 2013. Annex IV; UK: Favourable; England: Favourable; Scotland: Favourable; Wales: Favourable.
Caveats Population size estimate may be affected by the following factors not included in the analysis:
• Uncertainty about roost size density.
• The ratio of building:tree roosts is unknown.
• No data were available on roost sizes in trees, although these may differ substantially from roosts in buildings or bat-boxes. Most roosts are likely to be in trees, so this may be a major error.
• Ratio of observed:true colony size estimated in northern Scotland applied across Britain.
• The range may be underestimated, particularly in Scotland where there is likely to be greater use of trees, as long-eared bats are strongly under-recorded using acoustic surveys, and tree roosts are difficult to find.
Changes through time • Harris et al. (1995) estimated a British population of 200,000, but this was graded as
having very poor reliability, and used different methods from the current review. The distribution is similar to that reported by Arnold (1993), but slightly smaller than that shown in the Article 17 Reports (Joint Nature Conservation Committee, 2013b). The National Bat Monitoring Programme data do not indicate any change over time.
• Population size — Data deficient. Range — Data deficient.
Drivers of change
• Increased availability of broadleaved woodland and bat boxes.
• Loss of viable roosts during barn and other building conversions.
• Impact of roads via collisions with vehicles and artificial night lighting.
• Change of habitat and prey abundance in agricultural landscape and in woodland.
Future prospects
• Population status — Unknown
• Range status — Stable
• Habitat status — Stable
Range based on 1995-2016 presence data. Areas with very isolated records may not have been included in the distribution — see main report Methods section 2.5 for more details.

65
Grey long-eared bat Plecotus austriacus
British population estimate [1,000] (Plausible Intervals 400–3,000).
Reliability score = 1.
Conservation status IUCN Red list: GB: EN; England: [EN]; Scotland: n/a; Wales: n/a; Global: LC.
Article 17 overall assessment 2013: Annex IV; UK: Declining; England: Declining; Scotland: n/a; Wales: n/a.
Caveats Population size estimate may be affected by the following factor not included in the analysis:
• The main potential source of error is under-recording of roosts, particularly given the difficulty of distinguishing the species from the much more common brown long-eared bat.
Changes through time
• Harris et al. (1995) estimated a population size of 1,000, based on expert opinion, but this estimate was given a poor reliability score.
• Most of the sites historically recorded as having grey long-eared bat roosts no longer had any evidence of the species when they were revisited (Razgour, 2012).
• The range in this report is smaller than that given in the Article 17 Reports (Joint Nature Conservation Committee, 2013b).
• Population size — Data deficient. Range — Decline.
Drivers of change
• Loss of viable roosts during barn and other building conversions.
• Change of habitat, particularly loss of wet and species-rich meadows.
• Urban development encroaching on traditional roosts.
• Impact of roads via collisions with vehicles.
• Artificial night lighting.
Future prospects
• Population status — Decline
• Range status — Unknown
• Habitat status — Decline
Range based on 1995-2016 presence data. Areas with very isolated records may not have been included in the distribution — see main report Methods section 2.5 for more details.

66
Research priorities
1. Distributions were poorly defined for many species. Uncertainty about whether a lack of observer effort or true absence accounted for gaps in the distribution was a particular problem, particularly towards the peripheries of geographical ranges. Delimiting ranges, and understanding the potential impacts of climate change, are vital in planning for ecosystem resilience.
Current mammal monitoring depends very largely on citizen science initiatives
and casual recording. Additional effort needs to be directed to surveying i)
towards the edges of known distributions; ii) in areas considered likely to be
suitable because of habitat suitability assessments, but where the species is not
known to be established; and iii) in areas with isolated records that could
represent pioneer or remnant populations. Existing citizen science schemes such
as the National Bat Monitoring Programme (NBMP) and the National Dormouse
Monitoring Programme (NDMP) are not designed to delineate species
distributions; and with the exception of a small number of species that are difficult
to misidentify (the badger, fox, hedgehog and rabbit), the data from other
established schemes are insufficiently robust for inclusion in this review.
2. Time trend analyses of both distribution and population size were severely compromised by a lack of systematic monitoring.
Establishing a network of sites that are repeatedly monitored at relevant time
intervals (3-5 years), using standardised protocols, will address this issue. It is
particularly important that the peripheries of known distributions are monitored
systematically. This has been a recognised objective for many years (e.g.,
through the Tracking Mammals Partnership), but has been hindered by a lack of
resources and/or methodological weaknesses in the methods applied. For some
species, particularly those that are cryptic or difficult to observe, genetic
estimations of population sizes and trends are likely to prove a much more robust
and cost-effective approach to monitoring than count-based techniques.
3. Occupancy data are lacking for most species and habitats. The assumption that all areas of potentially suitable habitat within the range are occupied could severely overestimate population sizes. This problem is particularly acute for species which are likely to be patchily distributed among suitable habitat within their range, such as the Bechstein’s bat and the red deer.

67
This issue should be addressed through widespread presence/absence surveys,
which require much less resource than comprehensive monitoring of population
size. Effort for each species should focus on those habitats that contribute the
greatest proportion of the population in the current estimates.
4. Estimates of mammal densities are often derived from studies in areas considered likely a priori to hold good populations, and are usually in restricted geographical areas rather than in areas of representative habitat quality in each country. Any changes in density with latitude or habitat quality are therefore poorly defined, limiting the ability to plan strategically for the maintenance of ecosystem function and services.
This issue is partly a consequence of the fact that density estimation is generally a
secondary objective of projects designed to address a different issue (e.g.,
behavioural ecology or epidemiology). Even where relevant data are collected,
there is often a lack of academic interest in publication, so the information remains
in project reports and theses that are difficult to access. In addition, some parts of
Great Britain — remote areas of Scotland and Wales for example — are much
less well-studied than others. Stratified randomised sampling, prioritising habitats
that contribute most to the current overall population size estimate, provides an
efficient and cost-effective means of addressing this difficulty. This network of
sites can align with those used in (2). The density data for each species-habitat
combination should be stored in an open-access repository.
5. There has been very little survey effort deployed on abundant species, despite their likely importance to ecosystem services and function: survey effort is, instead, strongly skewed towards rare animals.
This bias has arisen partly as a consequence of protected species legislation and
the focus of conservation effort on key species. Brexit, and the departure from the
Common Agricultural Policy, provide an opportunity to improve the monitoring of
population trends and estimates for other key species. Monitoring should include
invasive common species such as the grey squirrel and the brown rat, which are
likely to have significant ecological impacts. In addition, several abundant and
naturalised species are very poorly quantified. For example, the available
evidence for the rabbit suggests that the species is in decline, most notably in
Scotland. This decline may be temporary if disease outbreaks are the major
driver, but monitoring is required to verify this assumption. Robust population

68
estimates are also lacking for many of the most abundant bats, including the
common and soprano pipistrelle. This information is necessary to understand the
impact of current threats (such as wind turbines or roost loss), and to design
appropriate and proportionate monitoring and mitigation strategies.
6. Current estimates are crude as they depend on applying a single density estimate to land-cover types (or in the case of bats, regional roost density estimates). It is known that for many mammals, density and distribution are strongly affected by habitat quality as well as type. There is evidence that the quality of habitats for wildlife is in decline, even where total availability is constant (e.g., the decline of species-rich grassland and hedgerow quality as assessed in the Countryside Survey 2007 (Carey et al., 2008))). Evidence of the impact of such changes is needed for a wide range of species, including common species vital to ecosystem function such as the field vole.
Effort should be deployed in understanding the associations between habitat
quality (including configuration and linkages) and mammal abundance and
distribution. Wild mammals make extensive use of marginal habitats within
agricultural landscapes, such as hedgerow bottoms and unmanaged field corners;
these areas are very poorly estimated by the Land Cover Map. This exercise
needs to be aligned with data that can permit extrapolation on a national scale.
Examples of suitable datasets include the Countryside Survey and LiDAR. It may
also be possible to integrate citizen science mapping or assessment of habitat
quality with the surveys described in (2) where species have particular habitat
requirements that are not well captured by remote survey methods (e.g., the
availability of tree holes, or of habitats free from light pollution, both of which may
determine bat presence or abundance).
7. Some species groups, including many that are of conservation concern and some invasive species, are notable for the poor quality of data available to determine population size or distribution. Species with very poor reliability scores for habitat-specific density and occupancy estimates (score <=1) were: mole, all shrews, rabbit, edible dormouse, Orkney vole, harvest mouse, black rat, otter (for which data on occupancy are excellent, but on density, poor), stoat, weasel, mink, sika deer, and Chinese water deer.
Resource needs to be deployed to collect evidence on these species. Several are
inherently difficult to study (e.g., the small mustelids), and consideration should be

69
given to the development of alternative monitoring techniques, such as non-
invasive genetic sampling.
8. Robust density data are lacking for all bats, with the exception of greater and lesser horseshoe bats. There were insufficient data to permit population size estimation at all for the whiskered, Brandt’s and Alcathoe bats (cryptic species); barbastelle bat; Leisler’s bat; and the potentially migratory Nathusius’ pipistrelle bat. One other bat, the noctule, also had a score of zero for population estimate reliability. For this species, estimates could be computed but they were based on very restricted data, resulting in correspondingly large confidence intervals.
Resource needs to be invested in obtaining robust data for these species.
Although acoustic techniques can contribute to occupancy data for some species
(with the caveat that there is high potential for identification error or under-
recording for many groups, such as the Myotis spp., Nyctaloid and long-eared
bats), this approach cannot, at present, yield density information. Consideration
should be given to genetic approaches to monitor population size trends.
9. The importance of trees and woodland to bats is extremely poorly understood. Population estimates were impossible for several species particularly associated with woodland. Confidence intervals around estimates for some widespread species, including the noctule, Natterer’s and brown long-eared bat, were unacceptably high owing to an almost total reliance on data from buildings to estimate population size. Without information on tree roosts, it is not possible to make informed decisions about whether developments are likely to have a material impact on local populations.
There is an urgent need to establish roost densities in woodland and also in other
trees (e.g., parkland and mature hedgerow trees). Roost sizes in trees also need
to be established for most species. Genetic identification of droppings in rural
buildings and those at the rural/suburban interface should be undertaken to
improve roost identification for the small Myotis.
10. The sex ratio of pre-breeding roosts is not known for bats. This has a major impact on the population estimates.
This research need could be rapidly and economically addressed through co-
ordinated effort of local bat groups and researchers.

70
11. The scale and nature of the impact associated with many potential future threats (e.g., major infrastructure developments; new housing allocations; increased traffic volume; and changes to farming practice in the face of climate change and altered subsidy scenarios) are extremely poorly characterised, and many of the approaches currently used to monitor them are not suitable for answering these questions. Almost nothing is known about the cumulative effects of such threats, with the loss of foraging habitat, decreased habitat connectivity, and increased light pollution being of particular concern. Most mitigation activities lack a robust evidence base, meaning that resource may be wasted on ineffective actions.
This information is vital to planning sustainable development in the UK,
particularly in the context of the current pressure for new housing and
infrastructure. Without it, survey and mitigation methods are unlikely to be either
suitable or proportionate. Methods to improve the capture, sharing and
standardised interpretation of ecological data are urgently required. The large-
scale changes to the agricultural landscape anticipated over the next 20 years are
subject to much less legislative control than the changes to the built environment.
Given the correspondingly fewer opportunities to take advantage of data collected
by industry, there is a need for strategic research, which should include
assessment of the effectiveness of new agri-environmental schemes.
71
References
AEBISCHER, N. J., DAVEY, P. D. & KINGDON, N. G. 2011. National Gamebag Census: Mammal Trends to 2009. Fordingbridge: Game & Wildlife Conservation Trust.
ARNOLD, H. R. 1993. Atlas of Mammals in Britain, Joint Nature Conservation Committee / Institute of Terrestrial Ecology.
BIRKS, J. D. S. 2015. Polecats, Whittet Books Ltd. BIRKS, J. D. S. & KITCHENER, A. 1999. The distribution and status of the polecat Mustela putorius.
London: The Vincent Wildlife Trust. BONESI, L., STRACHAN, R. & MACDONALD, D. W. 2006. Why are there fewer signs of mink in
England? Considering multiple hypotheses. Biological Conservation, 130, 268-277.
CANTY, A. & RIPLEY, B. 2012. boot: Bootstrap R (S-Plus) functions. R package version, 1. CAREY, P. D., WALLIS, S., CHAMBERLAIN, P. M., COOPER, A., EMMETT, B. A., MASKELL, L. C.,
MCCANN, T., MURPHY, J., NORTON, L. R., REYNOLDS, B., SCOTT, W. A., SIMPSON, I. C., SMART, S. M. & ULLYETT, J. M. 2008. Countryside Survey: UK Results from 2007. NERC Centre for Ecology & Hydrology. CEH Project Number: C03259.
COOKE, A. 2011. Deer in Huntingdonshire and the Soke of Peterborough. Huntingdonshire Fauna & Flora Society Report.
CROOSE, E., BIRKS, J. D. S. & SCHOFIELD, H. W. 2013. Expansion zone survey of pine marten (Martes martes) distribution in Scotland. Scottish Natural Heritage Commissioned Report, No. 520.
CROOSE, E., BIRKS, J. D. S., SCHOFIELD, H. W. & O’REILLY, C. 2014. Distribution of the pine marten (Martes martes) in southern Scotland in 2013. Scottish Natural Heritage Commissioned Report, No. 740.
DEFRA 2008. Feral wild boar in England: an action plan. Department for Environment, Food and Rural Affairs.
DEPARTMENT FOR COMMUNITIES AND LOCAL GOVERNMENT 2015. English House Condition Survey, 2007. 3rd edition ed.: UK Data Service.
DURRANT, C. J., BEEBEE, T. J. C., GREENAWAY, F. & HILL, D. A. 2009. Evidence of recent population bottlenecks and inbreeding in British populations of Bechstein’s bat, Myotis bechsteinii. Conservation Genetics, 10, 489-496.
GILL, R. & WAEBER, K. 2016. Feral Wild Boar and Deer in the Forest of Dean - Survey and Population Projections in the Public Forest Estate 2016 Forest Research Report.
GURNELL, J., LURZ, P. W. W., SHIRLEY, M. D. F., CARTMEL, S., GARSON, P. J., MAGRIS, L. & STEELE, J. 2004. Monitoring red squirrels Sciurus vulgaris and grey squirrels Sciurus carolinensis in Britain. Mammal Review, 34, 51-74.
HARRIS, S., MORRIS, P., WRAY, S. & YALDEN, D. 1995. A review of British mammals: population estimates and conservation status of British mammals other than cetaceans. University of Bristol.
HARRIS, S. & YALDEN, D. 2008. Mammals of the British Isles: handbook, Mammal Society. HOF, A. R. & BRIGHT, P. W. 2016. Quantifying the long-term decline of the West European hedgehog
in England by subsampling citizen-science datasets. European Journal of Wildlife Research, 62, 407-413.
JEFFERIES, D. J., STRACHAN, C. & STRACHAN, R. 2003. Estimating numbers of the three interacting riparian mammals in Britain using survey data. In: JEFFERIES, D. J. (ed.) The water vole and
72
mink survey of 1996- 1998 with a history of the long-term changes in the status of both species and their causes. Ledbury: Vincent Wildlife Trust.
JOINT NATURE CONSERVATION COMMITTEE. 2013a. Individual Species Reports - 3rd UK Habitats Directive Reporting 2013 [Online]. Available: http://jncc.defra.gov.uk/page-6391 [Accessed 25th February 2018 2018].
JOINT NATURE CONSERVATION COMMITTEE. 2013b. Species Conservation Status Reports - 3rd UK Habitats Directive Reporting 2013 [Online]. Available: http://jncc.defra.gov.uk/page-6564 [Accessed 28.02.2018 2018].
JUDGE, J., WILSON, G. J., MACARTHUR, R., MCDONALD, R. A. & DELAHAY, R. J. 2017. Abundance of badgers (Meles meles) in England and Wales. Scientific Reports, 7, 276.
JUSKAITIS, R. & BÜCHNER, S. 2013. The Hazel Dormouse: Muscardinus avellanarius, Wolf, Verlagskg. KILSHAW, K. 2015. Introgression and the current status of the Scottish wildcat (Felis silvestris
silvestris). University of Oxford / Wildlife Conservation Research Unit. LUSH, L., WARD, A. I. & WHEELER, P. 2014. Opposing effects of agricultural intensification on two
ecologically similar species. Agriculture Ecosystems & Environment, 192, 61-66. MACDONALD, D. W., DANIELS, M. J., DRISCOLL, C., KITCHENER, A. & YAMAGUCHI, N. 2004. The
Scottish Wildcat: Analyses for Conservation and an Action Plan. Wildlife Conservation Research Unit, University of Oxford.
MATHEWS, F., KUBASIEWICZ, L. M., GURNELL, J., HARROWER, C. A., MACDONALD, R. A. & SHORE, R. F. 2018. A Review of the Population and Conservation Status of British Mammals. A report by the Mammal Society under contract to Natural England, Natural Resources Wales and Scottish Natural Heritage. , Peterborough, Natural England.
MORTON, D., ROWLAND, C., WOOD, C., MEEK, L., MARSTON, C., SMITH, G., WADSWORTH, R. & SIMPSON, I. C. 2011. Final Report for LCM2007 - the new UK Land Cover Map. CS Technical Report No 11/07. Centre for Ecology & Hydrology (Natural Environment Research Council).
PETROVAN, S. O., BARRIO, I. C., WARD, A. I. & WHEELER, P. M. 2011a. Farming for pests? Local and landscape-scale effects of grassland management on rabbit densities. European Journal of Wildlife Research, 57, 27-34.
PETROVAN, S. O., WARD, A. I. & WHEELER, P. 2011b. Detectability Counts when Assessing Populations for Biodiversity Targets. Plos One, 6, 8.
R CORE TEAM 2015. R: a language and environment for statistical computing, version 3.2. 2. R Foundation for Statistical Computing, Vienna, Austria.
RAZGOUR, O. N. 2012. From genes to landscapes: conservation biology of the grey long-eared bat, Plecotus austriacus, across spatio-temporal scales. PhD Thesis, University of Bristol.
ROOS, S., JOHNSTON, A. & NOBLE, D. 2012. UK hedgehog datasets and their potential for long-term Monitoring. BTO Research Report No. 598.
SCOTT, W. A. 2007. CS Technical Report No.4/07 Statistical Report. Lancaster: NERC/Cenrtre for Ecology & Hydrology.
STRACHAN, C., STRACHAN, R. & JEFFERIES, D. J. 2000. Preliminary report on the changes in the water vole population of Britain as shown by the national surveys of the 1989-1990 and 1996-1998. London: The Vinent Wildlife Trust.
WARD, A. I. 2005. Expanding ranges of wild and feral deer in Great Britain. Mammal Review, 35, 165-173.
WRIGHT, P. G., HAMILTON, P. B., SCHOFIELD, H., GLOVER, A., DAMANT, C., DAVIDSON-WATTS, I. & MATHEWS, F. 2018. Genetic structure and diversity of a rare woodland bat, Myotis bechsteinii: comparison of continental Europe and Britain. Conservation Genetics, 1-11.