Embed Size (px)
Citation preview

85Articles
A review of the pharmaceutical market in Portugal1
Manuel Coutinho Pereira2 | Hugo Vilares2
AbstrAct
This article examines the main developments of the pharmaceutical market in Portugal over the last decade. There has been a growth in the quantities traded and a reduction in retail pric-es, resulting from an intense legislative interven-tion. This price reduction has stalled expend-iture on outpatient medicines, making it even possible some reduction in the last years. Such an evolution reflects a cutback in the economic rents of market agents, benefiting the National Health Service. The enhanced competition in the market segments open to generic drugs has contributed importantly to this outcome.
The estimation of a demand function for phar-maceutical drugs indicates a relatively reduced price-sensitivity of quantities consumed, at the upper bound of the estimates in several studies for other countries. Furthermore, it is inferred that the resistance to the prescription of gener-ics is waning as, holding constant other factors, prescribers already induce consumers to pref-erably acquire generics. In the future, a further increase in the penetration of generics is likely to take place by the extension of the range of active ingredients covered by them.
IntroductionA pharmaceutical drug is economically a merit good, and thus its availability to the population is a priority in most member states of the European Union, in which, on average, about two thirds of the expenditure is financed by government (Vogler et al. 2011). This leading role of government in medicine dispensing, jointly with the technological progress that diversified the treatments offered and increased their efficacy, have enhanced living standards and longevity. At the same time, such an achievement has meant that the nominal growth of public expenditure with pharmaceutical drugs has substantially surpassed that of the gross domestic product. According to Vogler et al. (2011), public expenditure in the member states of the European Union increased, on average, by 76 percent between 2000 and 2009, corresponding to a yearly growth rate of about 5.8 percent, while the average nominal GDP growth was about 2.8 percent.
The escalation of public expenditure in this field has exerted a growing pressure on public ac-counts. Therefore, since the beginning of the 1990s, the member states of the European Union have paid increasing attention to the pharmaceutical market and adopted measures designed to ensure drug availability, while controlling costs and limiting the economic rents of agents. In the recent context of sluggish economic growth, the regulation of the European markets became more intense (see, for example, Brandt, 2013, or Carone et al. 2012). The countries more squeezed from the fiscal viewpoint have been in the lead of this trend. Vogler et al. (2011) concluded that the leg-islative interventions of the 1990s allowed some public expenditure control, based fundamentally on passing costs on to patients. In contrast, the more recent cost-containment measures have mostly reduced the profits of pharmaceutical industry without placing an additional burden on patients.
The Portuguese system of pharmacological assistance is founded on the National Health Service (NHS) as a universal default insurer of the population, positively discriminating certain groups and patients affected by serious diseases (see below). In this context, supplementary healthcare sub-systems and private insurance play a secondary role, benefiting workers of some sectors of activity and firms and only marginally complementing the NHS coverage.
BANCO DE PORTUGAL • Economic Bulletin • October 201486
Barros (2012) characterizes market regulation in Portugal over the last decade as very strong, and Vogler et al. (2011) places Portugal among the countries with the largest number of legisla-tive actions, together with the Baltic states, Spain, Greece and Iceland. Unsurprisingly in the recent years pharmaceutical drugs policy in Portugal has been heavily conditioned by the Economic and Financial Assistance Program, which imposed a sharp expenditure reduction as an objective. Legislative actions have been focused on the entry of drugs into the market, rules of price for-mation, copayment formulas, prescription patterns, margins of participants in the supply chain, and monitoring agents’ conduct.
In spite of an intensified and more sophisticated public intervention in several countries, Merino-Castelló et al. (2003), Fiorio et al. (2008) e Contoyannis et al. (2005) report a lack of empirical stud-ies and an emphasis on behavioral analyses of decision-makers as relevant limitations to a sys-tematic knowledge of the market. As regards the existing work, Cabrales et al. (2013) mention the reduced samples of products and the scarcity of studies involving a representative set of countries as prominent limitations. Kim (2009) mentions further that the United States market is most often studied, despite its significant differences to other countries and notably Europe. For Portugal, Barros (2013) points out the lack of knowledge about the sensitivity of demand as a limitation in the setting of policy objectives.
In this context, the present article characterizes the pharmaceutical market in Portugal over the last decade, with a special focus on the determinants of demand. For this purpose, the article uses a comprehensive database of NHS prescription drugs dispensed by pharmacies in an ambulatory care setting, on a monthly basis, between 2003 and 2013. The institutional framework and the da-tabase are presented in the next two sections. A descriptive analysis of the market is performed in the fourth section and, in the fifth section, a model for the demand for pharmaceutical drugs is discussed. The main conclusions are summarized the last section.
Institutional framework of the pharmaceutical marketHealth assistance is constitutionally guaranteed in Portugal (as in about two-thirds of the countries in the world – see Clarke et al., 2004) to ensure that all citizens, regardless of their socioeconomic conditions, have access to an extended range of healthcare services. As stated, the regulation of the pharmaceutical market seeks to reconcile this constitutional aim with the sustainability of public expenditure in medicines. However, a prominent public intervention is also justified from an eco-nomic point of view by several market failures, namely the fact that a drug is an experience and a merit good, there are legal monopolies that ensure the remuneration of research and develop-ment costs, and medicine consumption entails an interaction between the patient, the experts who advise, and government that, on average, mostly bears the costs.
In the Portuguese case, firstly, the Infarmed (national authority for pharmaceutical drugs) analyzes the value added of each drug against the preexisting range of treatments, both from a therapeutic and a relative price3 standpoint. The retail price is set taking into account the international system of reference prices – a methodology that is implemented in 24 Member States of the European Union.4 The retail price is calculated as the average price charged for that drug in the European countries that serve as a reference for the Portuguese system (in 2014, Spain, France and Slovenia). Subsequently the economic margins of the agents downstream in the supply chain, namely ware-houses and pharmacies, are defined and regulated. Finally, the NHS copayment is defined.
In general the NHS co-pays the expenditure on medicines for diseases deemed relevant, assum-ing the function of a universal insurer that provides a base coverage to all citizens. If there is at
87Articles
least one generic drug within the homogeneous group of drugs with the same therapeutic purposes (see section “The pharmaceutical drugs market database”), the NHS copayment comprises two dis-tinct mechanisms, as it happens in other European Union countries. Firstly, drugs are stratified into five classes of indicative copayment (Chart 1A), ranging currently from zero to 90 percent of the retail price. Then, the actual copayment results from the combination of the indicative chart with an analysis of retail prices of the medicines within the same homogeneous group.5 This measure – the internal system of price referencing – regulates the effective contribution of the NHS, which is higher (lower) than the indicative copayment for drugs with a lower (higher) relative price within the homogeneous group.6 Chart 1B (lines in gold and blue) shows that the average actual copayment has always stood below the indicative one – the gap has increased in recent years, given the change in the calculation of the reference price7 and the introduction of medicines, especially generics, which tend to be cheaper than the alternatives with the same therapeutic purposes.
In a complementary way the NHS ensures more beneficial copayments in two cases: vulnerable groups both from a medical or an economic standpoint. The first case covers patients who are affected by life-threatening diseases and for whom drugs are essential to sustain life. Medicines for these diseases benefit from a higher copayment and, in many cases, are freely dispensed at the hospital level. The second case includes pensioners who receive an annual pension lower than 14 minimum wages. They enjoy a higher contribution than the one in the standard scheme (by about 5 percent in the highest group and 15 percent in the other indicative copayment groups). Moreover, these patients benefit from an indicative copayment rate of 95 percent on the cheapest five drugs within a given homogeneous group (in the past, they benefited from free dispensing of all generic drugs). Such positive discrimination mechanisms justify the differential between the average copayment rate reported by the Infarmed (for the NHS), and the actual rate calculated resorting to our database (Chart 1B). The evolution of this differential indicates a significant reduction of special copayments in the ambulatory care setting under the Economic and Financial Assistance Program.
There are cohorts of the population benefiting from assistance arrangements which are more beneficial than the NHS. These encompass primarily the public subsystems for the civil servants in general (ADSE) or specific professional categories (ADNE and, in the past, Ministry of Justice), and private subsystems usually associated with certain sectors or companies (the subsystem for the banking sector – SAMS, CTT, CGD and Portugal Telecom). Such types of coverage correspond to a supplementary remuneration of employees. Private insurance does not universally guaran-tee an extension of the NHS copayments for outpatient drugs and, when this happens, the ad-ditional protection tends to be in line with the one in the public subsystems. Chart 1B shows that, as a whole, the additional coverage in the various subsystems has a limited size compared to the NHS coverage level.
The pharmaceutical drugs market databaseThe empirical analysis of pharmaceutical markets in the economic literature is either based on samples of medicines intake at the patient level or databases of traded products. The first ap-proach allows an analysis of the behavior of the involved agents, namely the doctor, the pharma-cist and the patient. The second approach – used in this article – gives a broader perspective of the market, which despite the non-differentiation of each agent’s behavior enables an analysis of final consumption decisions, and presents itself as a viable alternative, particularly for studying the demand for pharmaceutical drugs.
In this article a database at the product level is used, including extractions in different moments of the National Database of Medicines of Infarmed, and monthly information on the sales of each

BANCO DE PORTUGAL • Economic Bulletin • October 201488
medicine between January 2003 and December 2013. This allowed the construction of an unbal-anced8 panel including the characteristics and quantities of all pharmaceutical drugs sold in the Portuguese market. A first group of variables comprises name, pharmaceutical form, dosage, type of packaging, generic drug indicator, and the number of months since market entry. With regard to prices, it is included the retail price (i.e. before copayment), the reference price, and the indicative NHS copayment rate (standard scheme).9 The database also includes information about the struc-ture of the market, both at the International Nonproprietary Name (INN) level and the anatomical-therapeutic-chemical classification level (see below). The panel used is based on the information
Chart1A• Weight of
the indicative copayment
classes
30 %
40 %
50 %
60 %
70 %
80 %
90 %
100 %
0 %
10 %
20 %
2003 2004 2005 2006 2007 2008 2009 2010 2011 2012 2013
Without copayment Cohort D (from 15 to 20 percent) Cohort C (from 37 to 50 percent)Cohort B (from 69 to 80 percent) Cohort A (from 90 to 100 percent)
Source: Authors’ computation.
Notes: (a) The weight of the classes is calculated on the basis of pharmaceutical labels (see section “The pharmaceutical drugs market database”). (b) Includes the unrestricted prescription drugs and those not subject to special copayments.
Chart1B• Evolution of the average copayment rate in the database
and charts reported by
Infarmed| Percentage
55
60
65
70
75
Percen
tage
502003 2004 2005 2006 2007 2008 2009 2010 2011 2012 2013
Average copayment of the standard scheme of the NHS in the databaseAverage indicative copayment of the standard scheme of the NHS in the databaseAverage copayment of the NHS reported by InfarmedAverage copayment of the health subsystems reported by Infarmed
Source: Authors’ computation and Infarmed.
Notes: (a) The indicative copayment within each class has been adjusted by successive legislative changes. (b) The calculation of the average copayment of the NHS standard scheme in the database assumes that all patients are covered by this scheme and takes the annual expenditure as weighting variable; the average indicative copayment excludes the effect of the internal system of price referencing. (c) The average copayment reported by Infarmed considers all patient groups and medicines, including those subject to special copayments. (d) Quantities sold, which are used as weights in the calculation of the average copayment in the database, include from April 2013 the public subsystems beyond the NHS.

89Articles
that the competent authority uses to monitor the market and thus it should be fully consistent over time and virtually unaffected by measurement errors.
The universe considered in this article is the set of prescription medicines sold by pharmacies and not subject to restricted dispensing, capturing the relevant market portion in the sense that it emanates from general regulations. In detail, the over-the-counter medicines, also sold in the para-pharmacies (created in 2005), are excluded from the analysis, as are the medicines with dis-pensing circumscribed to the hospitals or restricted by any regulatory provision. In the calculation of average copayments, price, quantity and value indexes, and in the estimation of the demand function, drugs intended for chronic diseases requiring ongoing treatments were also excluded. Such drugs are usually covered by special copayment regulations. It becomes thus possible to focus the analysis on the distribution channels and the decision-making processes typical for the market (see Vilares and Pereira, 2014). Also note that the available information does not allow taking into account co-payments benefiting special cohorts of the population, including those benefiting the pensioners with an income below the minimum wage and, more generally, patients holding private health insurance or belonging to public health subsystems.
The database in its cross-sectional dimension is structured by labels of medicines. A label refers to the intersection of the name, the pharmaceutical form, and dosage of the pharmaceutical drug with the characteristics of its packaging. In this article, the term pharmaceutical drug (or medicine) is generally used in its economic meaning and refers mainly to the name, which is associated with an active ingredient and a pharmaceutical company. However, it is sometimes employed as a statistical concept that is slightly narrower and fixes beyond the name, the pharmaceutical form and dosage. In the database there is information about the INN or active ingredient10 which is the main chemical compound of the medicine. On the supply side, the market can be seen as structured around groups of drugs that share a given active ingredient and, in that sense, are almost perfect substitutes (also called bioequivalent – a typical example is the generic drug and its reference brand-name medicine). One assumes in the analysis that the substitute labels compete among themselves, thus abstracting from possible differences in their secondary characteristics. In contrast, the homogeneous groups defined in the legislation take into account such differences.11 The labels are further grouped in the database, on the demand side, in accordance with the anatomical-therapeutic-chemical classification (i.e. by therapeutic purposes), which however may group medicines with distinct active ingredients.
In this framework, the panel tracks, on average, approximately 6,200 labels over 132 months, total-ing about 820,000 observations.
Description and evolution of the marketTable 1 presents some data on the pharmaceutical drugs market in Portugal between 2003 and 2013. The table distinguishes between brand-name drugs and generics and, for the former, between those that share their active ingredient (and therefore compete) with generics, and the remaining ones. The possibility of prescription by active ingredient, leaving to the pharmacist the presentation of detailed consumption alternatives to the patient has made competition dynamics more depend-ent from those groups of substitutes. This phenomenon is also becoming more relevant with the evolution of the regulatory framework, particularly with the generalization of homogeneous groups. The legislation restricts the introduction of pharmaceutical drugs into the market to an analysis of pre-existing substitute therapeutics, limits the retail price of non-innovative drugs, and makes the NHS copayment levels to depend on the retail price of other elements within homogeneous groups.
The number of medicines in the market as a whole has steadily increased as a result of the intro-duction of generic drugs, which represented about 2/3 of the total in 2013. The number of brand-

BANCO DE PORTUGAL • Economic Bulletin • October 201490
name drugs, in contrast, recorded some reduction. In terms of sales, the penetration of generics is less evident; these held about one fourth of the market in 2013. This is explained by the fact that these drugs tend to be cheaper and to sell, on average, smaller quantities. Even considering only the portion of the market where there are generics as substitutes, their market share is still less than 1/2. In contrast, the drugs that do not compete with generics are only 1/5 of the total but hold about half of the market in terms of sales. Considering drug sales as a whole, these have recorded a sustained growth until 2010, followed by a decline in recent years. Sales in 2013 stand at a level identical to the one at the beginning of the period. Such an evolution is broken down below between the variation of prices and quantities.
Table1 • Medicines market (ambulatory care setting), 2003-2013
2003 2004 2005 2006 2007 2008 2009 2010 2011 2012 2013
Number of pharmaceuti-cal drugs of which: 2,909 3,385 3,869 4,208 4,263 4,537 4,973 5,488 5,621 6,060 6,317
brand-name drugs 2,614 2,667 2,725 2,628 2,431 2,356 2,357 2,415 2,293 2,262 2,214
substitutes include generics 633 724 819 892 838 861 925 964 925 971 1,018
substitutes do not include generics 1,981 1,943 1,906 1,736 1,593 1,495 1,432 1,451 1,368 1,291 1,196
generics 295 718 1,144 1,580 1,832 2,181 2,616 3,073 3,328 3,798 4,103
Total sales (million €) of which: 1,770 1,961 2,052 2,087 2,081 2,168 2,208 2,264 1,986 1,659 1,710
brand-name drugs 1,652 1,755 1,742 1,733 1,664 1,720 1,764 1,721 1,558 1,340 1,324
substitutes include generics 400 521 551 612 580 577 614 582 472 402 458
substitutes do not include generics 1,252 1,234 1,191 1,121 1,084 1,143 1,149 1,139 1,086 938 866
generics 117 206 310 354 417 448 444 543 427 318 386
Source: Authors’ computation.
Notes: (a) A statistical concept of medicine is used in this table (see section “The pharmaceutical drugs market database”). (b) Includes unrestricted prescription medicines. (c) A branded drug is classified in the category of drugs that have generics as substitutes from the year the first generic con-taining the respective active ingredient enters the market. (d) Quantities sold include from April 2013 the public health subsystems beyond the NHS.
The pharmaceutical market in Portugal is generally characterized by large entry and exit flows (Chart 2A). Indeed, only about 50 percent of the drugs which constituted the market in 2003 still remained there in 2013, making up by then only 1/4 of the sales. The importance of these flows reflects, besides the already mentioned strong expansion of generic drugs, other phenomena such as the appearance of new and relatively more effective molecules, and market positioning strate-gies by the pharmaceutical industry. Some flows can also stem from rearrangements with respect to the pharmaceutical form or dosage. In 2013 generics had a major role among drug entries (about 85 percent), but also exits (about 60 percent); about 25 percent of exits related to branded drugs that did not compete with generics.
Generic drugs still comprise a relatively small range of active ingredients in the Portuguese market (Chart 2B), in particular because many branded drugs are still protected by patents, as a compensa-tion for the research costs incurred in the development of the drug and that usually prevent the release of generics for 20 to 25 years (EFPIA, 2013).12 Notwithstanding some increase in the penetra-tion of generics also with respect to active ingredients, this is much less evident than for the number of medicines. Therefore competition within groups of substitutes including generics has strength-ened up from an average of about 15 drugs per group, in 2003, to 25 drugs in 2013 (for INNs exclu-sively covered by brand-name drugs this indicator remained stable between 2 and 3 over the period).

91Articles
We present now a breakdown of the evolution of medicine sales (see Table 1) between the variation of quantities sold and prices. Given that there have been ongoing changes in the product composi-tion of the market, one uses moving-base indexes taking the previous month as the base period. Chart 3A shows the value and quantity indexes; chart 3B shows the indexes for the retail price and price net of copayment i.e. paid by the patient (considering the standard NHS scheme only).
In the period 2003-2013 there has been an increase in the quantity of medicines sold, with some deceleration from 2011, coinciding with the implementation of the Economic and Financial Assis-tance Program. This rising trend in dispensed medicines is common to most countries, and it is consistent with the enlargement of the spectrum of outpatient treatments and the efforts to make them available to the population. Such a trend materializes simultaneously with the increase in life expectancy. In contrast, retail prices have steadily declined over the period, primarily reflecting various legislative interventions, such as price caps for a significant part of the period, the adminis-trative price reductions of 2005 and 2007, and the introduction of the international system of price referencing. The pace and diversity of the measures imposed has strengthened up since 2010, as a response to more stringent fiscal consolidation needs. This has accentuated the drop in retail prices which, in turn, made the value of sales and quantities sold to drift apart.
Prices net of copayments had a different evolution than that of retail prices, fluctuating without a defined trend over the period under review. The trajectory of the indicator relates to the evolu-tion of the average (actual) copayment rate in the standard NHS scheme (Chart 1B).13 The latter recorded a progressive decrease until 2006, at a time when the fall of retail prices was still feeble, bringing about an increase in prices net of copayments. Between 2007 and 2009, there was a gradual rise in copayments, corresponding to a stabilization and subsequent fall in net prices. The year 2010 saw a significant drop in copayments and an increase in the costs borne by patients, but this was reversed from 2011 on, given a sizable reduction in retail prices and some recovery of copayment levels.
Chart 4 shows the quantity and price indexes corresponding to the partition of drugs in the three categories considered above, namely, branded drugs that compete and that do not compete with generics, and generics. Chart 4A indicates a substitution of branded drugs by the competing gener-ic drugs. The remaining brand-name drugs recorded, however, an increase in the quantity sold, accompanying in particular the introduction of innovative therapeutics. Chart 4B shows that the drop in retail prices was generalized to the three categories of drugs considered. As one would expect, the prices of branded drugs not competing with generics were more resilient, in line with a stronger market power. At the same time, the very sharp reduction in the price of generic drugs suggests that their introduction in Portugal has been able to materialize significant gains resulting from economies of scale and scope. While at the beginning of this process, the tiny sales of generics gave rise to prices often not competitive (higher than the prices of branded drugs) and supported by larger NHS copayments, the efforts to raise agents’ awareness and positively discriminate gener-ics allowed a significant lowering of their price.
Modeling the demand for pharmaceutical drugs in Portugal
Impact of prices, market structure and prescription patternsA pharmaceutical drug has a set of relevant specificities vis-à-vis a typical consumption good that must be considered when modeling its demand. Firstly, consumption choices are mediated by authorized specialists, especially the doctor and the pharmacist. Secondly, the valuation of the

BANCO DE PORTUGAL • Economic Bulletin • October 201492
good, which depends on the benefits the consumer is able to extract from it, is comparatively more uncertain, given the heterogeneity of possible drug-patient interactions. In this context, a medicine is intrinsically an experience good whose consumption depends particularly on the stock of knowledge accumulated by the physician and the pharmacist about its properties, and the
Chart3A • Pharmaceutical drug sales | Value and quantity indexes (2003m1=100)
Chart3B • Pharmaceutical drug sales | Retail price index and price net of copayment index (2003m1=100)
Source: Authors’ computation.
Notes: (a) The value index is a chain index obtained from monthly Laspeyres in-dexes, calculated by reference to the retail price and taking the previous month as the base period (the corresponding Paasche index shows essentially the same evolution). (b) Quantities sold include from April 2013 the public sub-systems beyond the NHS.
Source: Authors’ computation.
Notes: (a) Chain indexes obtained from monthly Paasche indexes, taking the previous month as the base period. (b) Prices net of copayments consider the standard scheme of SNS only. (c) The red dots are annual averages of the index.
Chart2A • Substitution of pharmaceutical drugs in the market since 2003
Chart2B • Active ingredients in the market
Source: Authors’ computation.
Note: Includes unrestricted prescription medicines.
Source: Authors’ computation.
Note: Includes unrestricted prescription medicines.

93Articles
patient’s medication experience. Thus, several characteristics of medicines that are perceived by the agents although not observed by the researcher are of importance.
At the same time, one should consider the regulatory interventions that do not operate through the price system, for example, the introduction of mandatory electronic prescribing. Such interventions have a systemic character (insofar as they affect the market as a whole) and give rise to exogenous shocks to demand. Other shocks to medicine consumption may occur, such as a sporadic pro-nounced incidence of certain diseases; seasonal effects may also be present. It is assumed that population aging can be modeled as a systemic effect, although this phenomenon does not affect the market as a whole, because the pattern of incidence of elderly diseases does not match the pattern of incidence for the whole population. Anyway, given that the analysis covers eleven years, the effect of aging – a long-term process – on the demand should be limited. Another relevant dimension is the abovementioned substitution among medicines, which is taken into account in the model through the consideration of the respective submarkets.
The model of demand for medicines can be summarized in the following equation:
, , , , , ,i t t i i t i t i t i tQuant λ φ β δ η ε= + + Ρ + Μ + Κ +
where Quant is the logarithm of the monthly quantity sold (of drug label i, in month t). Price vari-ables (P), include the logarithm of the price net of copayments and the logarithm of the average price of substitutes (labels within the same INN). Market structure variables (M), are the market share of generics and the number of labels within the INN. A fourth degree polynomial in the num-ber of months since market entry is meant to capture the stock of knowledge (K). Finally, a time fixed-effect (λ ) and a label fixed-effect (φ ) were introduced, as a way to control, among others,
Chart4A • Sales of pharmaceutical drugs by categories | Quantity indexes (2003m1=100)
Chart4B • Sales of pharmaceutical drugs by categories | Retail price indexes (2003m1=100)
Source: Authors’ computation.
Notes: (a) Chain indexes obtained from monthly Laspeyres indexes, taking the previous month as the base period. (b) The categories of branded drugs have a stable composition from the beginning to end of the period, excepting entries and exits of the market (note the difference with respect to Table 1, in which these drugs are reclassified where applicable). (c) Quantities sold include from April 2013 the public health subsystems beyond the NHS.
Source: Authors’ computation.
Notes: (a) Chain indexes obtained from monthly Paasche indexes, taking the previous month as the base period. (b) The categories of branded drugs have a stable composition from beginning to end of the period, excepting entries and exits of the market (note the difference with respect to Table 1, in which these drugs are reclassified where applicable).

BANCO DE PORTUGAL • Economic Bulletin • October 201494
for abnormal movements of demand, seasonal effects, and the initial knowledge of the system about each drug and its unobserved characteristics.
Given the institutional and regulatory framework in place, it is possible to assume exogeneity of prices in modeling demand. In this context, a fixed-effect estimator is used (see Vilares and Pereira, 2014). Furthermore, in order to take into account the importance of each disease in the Portuguese market and its treatment options that may not be limited to a single active ingredi-ent, the model was weighted using the anatomical-therapeutic-chemical classification. Hence one considers not only the importance of each prescription drug in the outpatient market, but also the typical pattern of diseases and the relative importance of each drug in their treatment.
The sample starts in January 2003 and ends in March 2013, in order to exclude the subsequent integration of some public health subsystems in the database. The results obtained in the main model regarding the impact of the explanatory variables on the quantity sold are summarized in Chart 5. Chart 5A shows the direct and cross price-elasticities of demand14, and the impact of dissemination of generics and the number of labels within the INN, keeping constant all the other variables. Chart 5B shows the sales profile as the tenure of the pharmaceutical label increases.
The average estimate for the direct price-elasticity of demand (-0.71) is in the upper threshold of the estimates presented in previous studies for other countries, pointing to a market where con-sumers are relatively insensitive to changes in the price net of copayment.15 Specifically, an increase in the label’s price by one percent implies, on average, a fall in the traded quantity of 0.71 percent. This result is understandable given the essential nature of the good, its moderate weight in the patients’ budget, in part due to the relevance of NHS copayments (Granlund, 2007), and the exist-ence of persistence in prescription patterns (allowing a reduction in the uncertainty regarding the specific patient-drug interaction – Coscelli et al. 2004). It is also possible, in line with Ellison et al. (1997), that doctors lack knowledge about prices, and so this information is left out at this stage of the decision making process. Legislative intervention has attempted to mitigate such an aspect, namely by including the minimum price of medicines in the prescriptions.
Charts5Aand5B • Impacts of the explanatory variables
Source: Authors’ computations.
Notes: (a) In chart 5A, the coefficients for the price of the label, price of substitutes, and the market share of generics indicate, respectively, the percentage change in quantity demanded, if the first two variables increase by one percent, and the third one by one percentage point. In the case of the number of competitors, the coefficient multiplied by one hundred indicates the percentage change in quantity demanded, if an additional label is introduced within the INN. (b) Chart 5B shows the evolution of the quantity sold (in logarithms), as a function of the number of months it has been in the market.
95Articles
The evidence indicates that in a context of reduction in retail prices, if the NHS does not internal-ize the inherent gains, a significant increase in demand is not expected. Similarly, increases in net prices, for example, originating in copayment reductions, as it happened in 2010, do not seem to call into question, on average, and significantly, the accessibility to pharmaceutical drugs. On the other hand, the cross-price elasticity of demand points to a tiny substitution effect due to changes in relative prices within the INN, reinforcing the evidence around a relatively inelastic consump-tion pattern. In interpreting these results one should bear in mind that the data have limitations with regard to the calculation of prices net of copayments (see section “The pharmaceutical drugs market database”).
Regarding market structure, the penetration of generics in terms of sales at the INN level tends to lower, on average, consumption of each substitute label, keeping the other factors unchanged. This reflects the effect of generic drugs competition, as the existing legal monopolies become oligopolistic or monopolistic competition settings, something that is more evident as new drugs enter the market. This result may also reflect the dynamics of replacement of older drugs by innovators. In fact, drugs that have higher tenures, besides competing with generics, may con-tain molecules that no longer belong to the frontier of biomedical knowledge and, consequently, tend to be replaced by other with better therapeutic results.
The same idea emerges from the analysis of the impact of tenure. While, as theoretically expected, a drug requires an initial marketing period to become a reference in the prescription patterns, from a certain point onwards, it tends to lose market share in favor of its generics and other molecules capable of increasing the efficacy of treatments or mitigate side effects. In interpreting the estimated maturity peak of drug’s sales – about 50 years – one should, however, take into account that a part of the sample period is not affected by the relatively recent generics’ diffusion that tends to shorten such maturity. Finally, with regard to the number of labels within an INN, there is a non-significant effect. This result may stem from the persistence of prescription patterns, given that the mere administrative introduction of a label into the market, other factors remaining
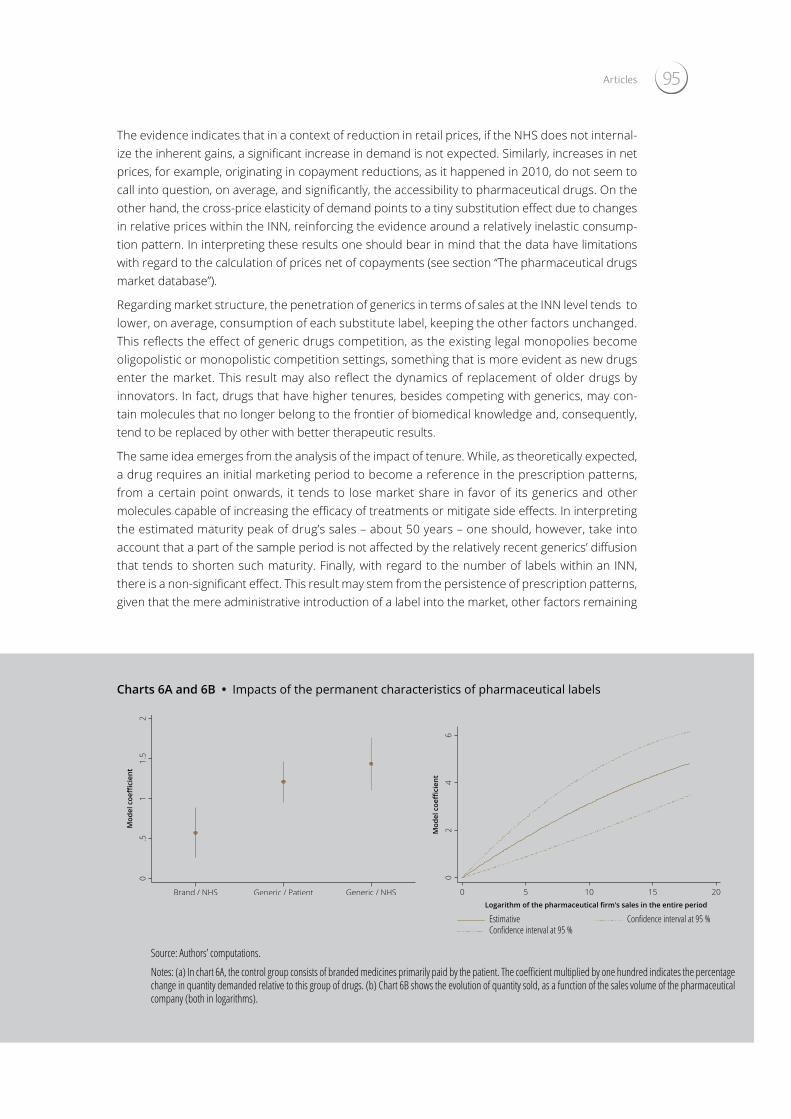
Charts6Aand6B • Impacts of the permanent characteristics of pharmaceutical labels
Source: Authors’ computations.
Notes: (a) In chart 6A, the control group consists of branded medicines primarily paid by the patient. The coefficient multiplied by one hundred indicates the percentage change in quantity demanded relative to this group of drugs. (b) Chart 6B shows the evolution of quantity sold, as a function of the sales volume of the pharmaceutical company (both in logarithms).
BANCO DE PORTUGAL • Economic Bulletin • October 201496
constant (notably, the proportion of generics within the INN), does not guarantee per se significant changes in the quantity of substitute labels sold.
Impact of characteristics of pharmaceutical drugsIn a second modeling phase, using the estimated impact of the permanent characteristics of the label, that is, the label fixed-effect in the above equation (
16/19
dosagem ( dξ ) foram também incluídos como controlos. Assim, estimou-se a seguinte equação:
.i m f d i iφ ϕ η ξ γ υ= + + + Ο +
Relativamente às estimativas dos impactos marginais das características permanentes dos medicamentos, obtidas na segunda fase da modelização da procura (Gráficos 6A e 6B) ressaltam três resultados significativos.
Gráficos 6A e 6B – Impactos das características permanentes da apresentação
Fonte: Cálculos dos autores Nota: (a) No gráfico 6A, o grupo de controlo consiste nos medicamentos de marca maioritariamente pagos pelo paciente. O coeficiente multiplicado por cem indica a variação percentual da quantidade procurada face a este grupo de medicamentos. (b) O gráfico 6B mostra a evolução da quantidade vendida, em função do volume de negócios da empresa (ambos em logaritmos).
Em primeiro lugar, em média, fixando todos os determinantes da procura incluídos na primeira e segunda fase de modelização, o utente tende a adquirir mais genéricos do que medicamentos de marca, o que aponta para um mercado onde a eventual desconfiança face aos genéricos se encontra em remissão, independentemente de quem assume a maioria da despesa. Em segundo lugar, os pacientes tendem a ter uma maior propensão para consumir os medicamentos que são maioritariamente pago pelo SNS. Tal facto pode dever-se a um sistema de comparticipação em que o SNS assume uma maior fatia da despesa em medicamentos destinados a quadros clínicos mais graves, onde a toma dos fármacos é mais fundamental, e resulta numa utilidade superior para o paciente16. Por último, regista-se um crescimento da quantidade vendida, a um ritmo decrescente, com o aumento da quota da farmacêutica no total do mercado. Tal evidência indica a possibilidade de retornos positivos de despesas de publicidade, naturalmente maiores em empresas com quotas de mercado superiores.
6. Conclusões
Este artigo acompanha os principais desenvolvimentos do mercado de medicamentos de
cruzado entre a entidade que assume a maior parte da despesa e a categoria do medicamento. Mais detalhes encontram-se em Vilares e Pereira (2014). 16 Relembra-se que o facto se considerar, na primeira fase da estimação, o preço após comparticipação como regressor, faz com que a análise compare dois medicamentos com o mesmo preço no consumidor. Assim, um medicamento em que o consumidor assume a maioria da despesa é na globalidade mais barato, enquanto um medicamento em que o SNS assume a maioria da despesa é na globalidade mais caro. O paciente paga o mesmo em ambos os casos.
0.5
11.5
2Coeficiente do m
odelo
Marca/SNS Genérico/Utente Genérico/SNS
), we undertook to determine the impact on the demand of some of these characteristics which are observable ( iΟ ). We consid-ered the market share of pharmaceutical companies, the entity that assumes the majority of the expenditure, the classification of the drug as generic or branded, and, as a control a variable, the pack size16. Fixed-effects for the INN ( mϕ ), the pharmaceutical form ( fη ) and the dosage ( dξ ) were also included as controls. The following equation was thus estimated:
16/19
dosagem ( dξ ) foram também incluídos como controlos. Assim, estimou-se a seguinte equação:
.i m f d i iφ ϕ η ξ γ υ= + + + Ο +
Relativamente às estimativas dos impactos marginais das características permanentes dos medicamentos, obtidas na segunda fase da modelização da procura (Gráficos 6A e 6B) ressaltam três resultados significativos.
Gráficos 6A e 6B – Impactos das características permanentes da apresentação
Fonte: Cálculos dos autores Nota: (a) No gráfico 6A, o grupo de controlo consiste nos medicamentos de marca maioritariamente pagos pelo paciente. O coeficiente multiplicado por cem indica a variação percentual da quantidade procurada face a este grupo de medicamentos. (b) O gráfico 6B mostra a evolução da quantidade vendida, em função do volume de negócios da empresa (ambos em logaritmos).
Em primeiro lugar, em média, fixando todos os determinantes da procura incluídos na primeira e segunda fase de modelização, o utente tende a adquirir mais genéricos do que medicamentos de marca, o que aponta para um mercado onde a eventual desconfiança face aos genéricos se encontra em remissão, independentemente de quem assume a maioria da despesa. Em segundo lugar, os pacientes tendem a ter uma maior propensão para consumir os medicamentos que são maioritariamente pago pelo SNS. Tal facto pode dever-se a um sistema de comparticipação em que o SNS assume uma maior fatia da despesa em medicamentos destinados a quadros clínicos mais graves, onde a toma dos fármacos é mais fundamental, e resulta numa utilidade superior para o paciente16. Por último, regista-se um crescimento da quantidade vendida, a um ritmo decrescente, com o aumento da quota da farmacêutica no total do mercado. Tal evidência indica a possibilidade de retornos positivos de despesas de publicidade, naturalmente maiores em empresas com quotas de mercado superiores.
6. Conclusões
Este artigo acompanha os principais desenvolvimentos do mercado de medicamentos de
cruzado entre a entidade que assume a maior parte da despesa e a categoria do medicamento. Mais detalhes encontram-se em Vilares e Pereira (2014). 16 Relembra-se que o facto se considerar, na primeira fase da estimação, o preço após comparticipação como regressor, faz com que a análise compare dois medicamentos com o mesmo preço no consumidor. Assim, um medicamento em que o consumidor assume a maioria da despesa é na globalidade mais barato, enquanto um medicamento em que o SNS assume a maioria da despesa é na globalidade mais caro. O paciente paga o mesmo em ambos os casos.
0.5
11.5
2Coeficiente do m
odelo
Marca/SNS Genérico/Utente Genérico/SNS
Three results regarding the marginal impact of some permanent characteristics of medicines, obtained in this second stage, are noteworthy (Charts 6A and 6B).
Firstly, on average, holding constant all demand determinants included in the first and second mod-eling stages, the user tends to acquire more generics than branded drugs, pointing to the receding of a possible distrust of generics, regardless of who assumes the majority of expenditure. Secondly, patients have a higher propensity to consume medicines that are mostly paid by the NHS. This may be due to a copayment system in which the NHS finances a larger expenditure share for drugs ad-ministered in more serious cases, i.e. when drug intake is more fundamental and results in a higher utility for the patient.17 Finally, there is an increase (at a decreasing rate) in the quantity sold with the size of pharmaceutical companies in terms of sales volume. Such an evidence indicates the pos-sibility of positive returns to advertising expenditure, naturally higher in larger companies.
Final remarksThis article examines the main developments in the outpatient drug market in Portugal over the last decade, focusing on the study of demand determinants. Several conclusions result from the article. On the one hand, there has been a continuous increase in the quantities traded, despite some deceleration in the recent period. This trend is associated with the scientific progress, and the effort to secure a widespread medicine’s provision to the population, and also emerges as a cause and consequence of increased longevity. Moreover, since 2005, there has been a continued decline in retail prices, achieved through an intensification of legislative intervention, which initially attenuated the progression of the value of sales and, in recent years, has led to its fall.
The pharmaceutical drug’s policy implemented since the middle of last decade, and more markedly in recent years, seems to have achieved some degree of control of outpatient drug expenditure, without jeopardizing its level of provision. In this process, the spreading of generic drugs in the Portuguese market has assumed an important role, as the most significant price reductions were registered in the submarkets where generics are present. Legislative action over the last decade, which was mainly focused on retail prices, resulted in a decrease in the value of the rents earned by the various economic agents (primarily for the benefit of the NHS). Considering the sample period as a whole, there is no upward trend in the prices paid by the patients.18
In a behavioral analysis of consumers, the average estimates of demand elasticities indicate that patients are relatively nonreactive to changes in prices, in line with the upper limit of the estimates obtained in studies for other markets. Thus, price changes are not likely to bring about major varia-

97Articles
tions in the quantity demanded. Consequently, measures to encourage consumption of certain drugs based merely on price differentials tend to have a limited impact given the rigid pattern of consumption estimated, and may be less effective than measures focusing on the behavior of prescribers (e.g. deepening the adoption of medical guidelines and monitoring of prescription pat-terns, as implemented at the European level).
In this field, distrust of generics has progressively faded away and ceteris paribus prescribers al-ready induce consumers to buy generics. Furthermore, further penetration of this market segment is expected through a broadening of the INN submarkets where generics are present (still a minor-ity), and not so much by additional substitution of branded drugs in submarkets where generics already entered. Of course, this whole process is conditioned, among other factors, by entry bar-riers originating in patents, which aim to reward the pharmaceutical industry for the investment in research and development.
In the future, in a scenario of continuous increase in the quantities consumed, there is uncertainty as to how long expenditure control can be based on combining the analysis of treatments offered with a periodic revision of their price and the profits of market participants. When this is no longer effective, the pressure on the public budget may force a larger pass-through of costs to patients by means of a fall in copayments.
ReferencesBarros P., 2012, “Pharmaceutical market reforms in Portugal under the Memorandum of Under-standing”, Eurohealth Systems and Policies 18(1).
Barros P., 2013, “Aspetos económicos da es-colha do sistema de comparticipação de medi-camentos”, mimeo.
Brandt L., 2013, “Price tagging the priceless: international reference pricing for medicines in theory and practice”, Policy Briefs 4.
Cabrales A. and Martín S., 2013, “The determi-nants of pricing in pharmaceuticals: are us prices really high?”, Health Economics 22: 1377-1397.
Carone G., Schwierz C. and Xavier A., 2012, “Cost-containment policies in public pharma-ceutical spending in the EU”, European Commis-sion Economic Papers #461.
Clark A. and Kinney E., 2004, “Provisions for health and healthcare in the Constitutions of the countries in the World”, Cornell International Law Journal 285.
Contoyannis P., Hurley J., Grootendorst P., Jeon S. and Tamblyn R., 2005, “Estimating the price elasticity of expenditure for prescription drugs in the presence of non-linear price schedules: an illustration from Quebec”, Canada, Health Economics 14(9): 909-923.
Coscelli A. and Shum M., 2004, “An empirical model of learning and patient spillovers in new
drug entry”, Journal of Econometrics 122: 213-246.
Vilares H. and Coutinho Pereira M., 2014, “Phar-maceuticals demand and public expenditure control in Portugal”, forthcoming.
European Federation of Pharmaceutical In-dustries and Associations, 2013, “The pharma-ceutical industry in charts”, mimeo.
Ellisson P., Stern S. and Trajtenberg M., 1999, “Patient welfare and patient compliance: an em-pirical framework for measuring the benefits from pharmaceutical innovation”, working paper NBER 6890.
Fiorio C. and Siciliano L., 2008, “The demand for pharmaceuticals: evidence from Italy”, mimeo.
Granlund, 2007, “Are private physicians more likely to veto generic substitution of prescribed pharmaceuticals?”, HUI working paper 14.
Kim D., 2009, “Price regulation of pharmaceuti-cals: a policy experiment”, mimeo.
Merino-Castelló, A., 2003, “Demand for pre-scription drugs: a choice modeling experiment”, PhD thesis – Universitat Pompeu Fabra.
Vogler S., Zimmermann N., Leopold C. and Joncheere K., 2011, “Pharmaceutical policies in European countries in response to the global fi-nancial crisis”, Southern Med Review 4(2): 22-32.

BANCO DE PORTUGAL • Economic Bulletin • October 201498
Notes1. The authors thank the Infarmed for the preparation of the data and the valuable contributions and clarifications, without which this article would not have been feasible. The authors are also grateful for the comments and suggestions of Ana Soares, João Amador, José Ferreira Machado, Jorge Correia da Cunha, Pedro Portugal, Nuno Alves and Rafael Barbosa. The opinions expressed in the article are those of the authors and do not neces-sarily coincide with those of Banco de Portugal or the Eurosystem. Any errors and omissions are the sole responsibility of the authors.
2. Banco de Portugal, Economics and Research Department.
3. This type of evaluation (Health-technology assessment), used in most European countries, aims at ensuring that the price of each drug reflects its true marginal benefit to the population given the existing offer, and that only drugs with guaranteed therapeutic efficiency and a suitable relative price are available for administration (see Carone et al. 2012, for a thorough discussion).
4. The widespread external reference pricing systems in the European Union make the prices in most countries a function of the prices recorded in the few countries that do not follow this approach. However, the different calculation formulas and choices of anchor countries originate some heterogeneity in retail prices between member states.
5. In the absence of a generic drug in the homogeneous group, the actual copayment rate is the indicative one.
6. Since 2010 the NHS copayment is the indicative copayment applicable to the average of the five drugs with lowest price within the same homogeneous group. Thus, drugs priced below the reference price have an actual copayment that exceeds the indicative one, while the opposite occurs for drugs priced above. The patient assumes the differential between the price of the drug and the reference price in force for the homo-geneous group. Prior to 2010 for drugs priced below the reference price, the NHS copayment was the indicative one.
7. The reference price was previously given by the price of the most expensive generic in the homogeneous group.
8. In this context, an unbalanced panel means that a label may stay in the database for less than the full extension of the panel, either due to its entry into the market later than January 2003 or/and its exit before December 2013. Therefore, it is not imposed that the labels be in the database throughout the period analyzed.
9. The initially available observations on retail prices concerned the moments of extraction of the database (end of year and several additional months over the period, coinciding with systemic price changes). Information about the last revision of retail prices was also available. Based on these elements, we performed the imputation of retail prices for the missing months.
10. The two terms are taken as synonyms, although they may differ from the technical point of view, due to issues related to patent regulations.
11. Homogeneous groups are formed by labels (including generic and branded pharmaceutical drugs) that share the INN, pharmaceutical form, way of administration, dosage and pack size.
12. It is also possible that the profile of demand, the behavior of market agents, the production process or the interaction between potential generic producers and incumbents lead the former not to enter into the submarkets of certain active ingredients, albeit not protected by patents.
13. Recall that the data used do not cover the special NHS copayments, which also does not allow a full assessment of the phenomenon in question.
14. It is understood by direct and cross price-elasticities the percentage impact on the quantity demanded of one-percent variations of, respec-tively, the price of the label and the average price of substitute labels.
15. See Vilares and Pereira (2014) for a more detailed discussion of the estimates of price-sensitivity of demand in other studies.
16. In this model, given the possibility of nonlinear relationships between the variables, we adopted a polynomial formulation of the second degree for the sales volume of the pharmaceutical company, and a polynomial formulation of the third degree for the pack size. For the sake of flexibility, we considered the cross effect between the entity which assumes most of the expenditure and the classification of the drug (more details in Vilares and Pereira, 2014).
17. Recall that the price net of copayment is one of the regressors in the first stage, and therefore drugs with the same price to the consumer are being compared. Thus, a drug for which the majority payer is the patient is cheaper at retail, while a drug for which the NHS assumes the majority of the expense is overall more expensive. The patient pays the same in both cases.
18. Limitations in the database prevent, however, a full assessment of this aspect.