Embed Size (px)
Citation preview

A review of the applicability of existing tree and forest characteristics prediction models to forest inventory in Vietnam and Nepal
Kalle Eerikäinen, Vu T. Hinh, Bao Huy, Dao C. Khanh, Phung V. Khoa, Ngo K. Khoi, Nguyen N. Lung, Ram A. Mandal, Vu T. Phuong, Yam P. Pokharel, Him L. Shrestha, Tran N. The, and Bechu Yadav
Working Papers of the Finnish Forest Research Institute 235 http://www.metla.fi/julkaisut/workingpapers/2012/mwp235.htm ISBN 978-951-40-2368-2 (PDF)ISBN 978-951-40-2373-6 (paperback) ISSN 1795-150X
www.metla.fi
Institutional Cooperation Instrument (ICI) Project ‘Improving Research Capacity of Forest Resource Information Technology in Vietnam and Nepal’

Working Papers of the Finnish Forest Research Institute 235 http://www.metla.fi/julkaisut/workingpapers/2012/mwp235.htm
2
Working Papers of the Finnish Forest Research Institute publishes preliminary research results and conference proceedings.
The papers published in the series are not peer-reviewed.
The papers are published in pdf format on the Internet only.
http://www.metla.fi/julkaisut/workingpapers/ISSN 1795-150X
OfficePost Box 18FI-01301 Vantaa, Finlandtel. +358 10 2111fax +358 10 211 2101e-mail [email protected]
PublisherFinnish Forest Research InstitutePost Box 18FI-01301 Vantaa, Finlandtel. +358 10 2111fax +358 10 211 2101e-mail [email protected]://www.metla.fi/

Working Papers of the Finnish Forest Research Institute 235 http://www.metla.fi/julkaisut/workingpapers/2012/mwp235.htm
3
Authors
Eerikäinen, Kalle, Hinh, Vu T., Huy, Bao, Khanh, Dao C., Khoa, Phung V., Khoi, Ngo K., Lung, Nguyen N., Mandal, Ram A., Phuong, Vu T., Pokharel, Yam P., Shrestha, Him L., The, Tran N. & Yadav BechuTitle
A review of the applicability of existing tree and forest characteristics prediction models to forest inven-tory in Vietnam and NepalYear
2012
Pages
72
ISBN
978-951-40-2368-2 (PDF)978-951-40-2373-6 (paperback)
ISSN
1795-150X
Unit / Research programme / Projects
Joensuu Unit / Improving Research Capacity of Forest Resource Information Technology in Vietnam and Nepal / 7391Accepted by
Prof. Jari Parviainen, Regional Director, Eastern Unit, 4 May 2012Abstract
Forest inventories provide vital and up-to-date information for use in basic decision making on the ma-nagement and conservation of forest resources. Data collected in forest inventories are stored and pro-cessed in databases which can be updated by conducting additional measurements or by applying pre-dictive models for imputing missing values of tree and forest stand-level variables. The inventory results can thereafter be calculated based on sample units, i.e. sample plots or forest stands within them, after which the forest inventory variables can be aggregated using different stratification units. For strategic decision-making, however, the future development of forest resources needs to be predicted. For this purpose, growth and yield simulators comprising tree and stand-level growth models are utilised to ob-tain prediction results for alternative scenarios based on inventory information, i.e. sample-based field data. In large-scale forest inventories, only easily assessable characteristics are measured for all tallied trees, whereas height characteristics and other variables, which are difficult to measure accurately, are collected from a sub-sample only. In order to generalise the variables measured from sample trees to also cover tally trees, generalization techniques need to be applied. The ongoing national-level forest as-sessments conducted in Nepal and Vietnam require efficient calculation procedures for reporting inven-tory results and quantifying the availability and location of forest resources. The aim of this review was to assess the availability of the existing models for the prediction of tree and forest characteristics and their applicability to large-scale forest inventory in Nepal and Vietnam. Through comparisons made bet-ween country- and species-specific models and prediction systems and through an assessment based on modelling literature, recommendations are also given for further developing the model-based prediction systems used in the ongoing national forest inventories of Nepal and Vietnam. The existing model sets can be used to estimate conventional stand volume characteristics for the inventoried areas. However, according to the new reporting requirements set for the current National Forest Inventory (NFI) of Viet-nam and the Forest Resource Assessment (FRA) of Nepal, it is recommended that their model bases, which are currently under upgrading, be updated and improved in the future.Keywords
data collection, dependent variable, forest inventory, forest models, independent variable, parametric predictor, simulation systemAvailable at
http://www.metla.fi/julkaisut/workingpapers/2012/mwp235.htmReplaces
Is replaced by
Contact information
Dr. Kalle Eerikäinen, Docent, Researcher. P.O. Box 68, FI-80101 Joensuu, Finland. E-mail [email protected] information
Institutional Cooperation Instrument (ICI) Project ‘Improving Research Capacity of Forest Resource In-formation Technology in Vietnam and Nepal’

Working Papers of the Finnish Forest Research Institute 235 http://www.metla.fi/julkaisut/workingpapers/2012/mwp235.htm
4
Contents
Preface ............................................................................................................................51 Introduction ...............................................................................................................6
1.1 The role of models in forest inventory ............................................................................. 61.2 General principles related to forest models and modelling .............................................. 91.3 Objectives ....................................................................................................................... 11
2 Assessing existing models ...................................................................................122.1 Models for predicting increment .................................................................................... 122.2 Models predicting stand and tree development .............................................................. 122.3 Static relation models for predicting volume, biomass and carbon content ................... 13
3 Discussion ...............................................................................................................154 Conclusions ............................................................................................................17Literature cited .............................................................................................................18Index to authors of the review ...................................................................................22Appendix 1: Model descriptions 1.01–1.11 for the parametric Vietnamese predictors. ................................................................... 24-52 Appendix 2: Model descriptions 2.01–2.09 for the parametric Nepalese predictors. On the pages ............................................... 53-72

Working Papers of the Finnish Forest Research Institute 235 http://www.metla.fi/julkaisut/workingpapers/2012/mwp235.htm
5
Preface
This publication was compiled as a joint effort between Nepalese, Vietnamese and Finnish re-searchers and experts representing the different partner institutes of the project ‘Improving Re-search Capacity of Forest Resource Information Technology in Vietnam and Nepal‘. The inter-institutional development cooperation project was initiated with the support of the Ministry for Foreign Affairs (MFA) of Finland, and its activities are financed through the Institutional Cooper-ation Instrument (ICI), a financing tool of the MFA of Finland designed for inter-institutional co-operation between Finnish government institutions and their counterparts in the developing coun-tries. The six partner agencies of the ICI project are as follows: the Department of Forest Research and Survey (DFRS) of Nepal, the Finnish Forest Research Institute (Metla), the Forest Inventory and Planning Institute (FIPI) of Vietnam, Kathmandu Forestry College (KaFCoL, Nepal), Tribhu-van University Institute of Forestry (IoF/TU, Nepal), and the Vietnam Forestry University (VFU).
The main aim of the ICI project is to develop the existing inventory techniques and data analysis procedures applied in large-scale forest inventories in Nepal and Vietnam. The development ac-tivities of the project have been designed and implemented with a special focus on human capac-ity development within the governmental forest research organisations participating in the project in Nepal, Vietnam and Finland. Special emphasis has therefore been given to hands-on-training periods, workshops and dissemination of information on forest inventory-related techniques and procedures. Of these objectives, the latter covers the goal of the present model review: to increase and share knowledge on the existing techniques and procedures developed by research organiza-tions, forestry agencies and projects operating in Nepal and Vietnam. The review can also be used as a reference manual and utilised in ongoing and forthcoming inventory campaigns conducted in the two target countries, and should also be carefully considered when planning new growth and yield studies and related data collection surveys for modelling the trees and forests of Vietnam and Nepal. Readers should, however, bear in mind that this work is not intended to replace the original publications referenced herein, the contents of which have been drawn from various ear-lier published scientific articles, research reports, technical notes and other forestry publications. It is therefore recommended that readers refer to the original source documents referenced in the text and appendices when more comprehensive and detailed information is required on the mate-rials and methods used for constructing the models listed in this review.
Finally, I wish to thank my co-authors for their fruitful collaboration and the partner institutions of the ICI project for extending their resources and assistance. Thanks are also due to the For-est Research Assessment in Nepal (FRA Nepal) project and its Regional Forest Mensuration and Data Collection Expert, Mr. Kiran Timalsina, for technical support and assistance. The financial support provided by the MFA of Finland is also gratefully acknowledged.
Joensuu, Finland, 29th February 2012
Dr. Kalle EerikäinenICI Project Coordinator

Working Papers of the Finnish Forest Research Institute 235 http://www.metla.fi/julkaisut/workingpapers/2012/mwp235.htm
6
1 Introduction
1.1 The role of models in forest inventory
The decision-making process regarding the management and conservation of forest resources re-quires up-to-date information. This information is collected by means of forest inventories. Inven-tory data are stored in a database which can be updated by conducting additional measurements or by applying models for imputing missing values of tree and forest stand-level attributes. The inventory results can thereafter be calculated based on sample units, i.e. sample plots or forest stands within them, after which the forest inventory variables can be aggregated using different stratification units. If wall-to-wall estimates of summation characteristics are preferred, then mul-ti-source forest inventory techniques are utilized, i.e. sample plot-level estimates are used as refer-ence data for satellite image-based interpretation, for instance (e.g., Tomppo 1993, 2006; Tuom-inen et al. 2010). These phases, starting from the collection of the sample-based data, continuing with the data processing stages of the calculation system, and ending in reporting the tabulated or mapped results, comprise the forest inventory system as illustrated in Figure 1. Moreover, through repeated inventories, changes in forest cover and stand characteristics can be assessed directly (see e.g., Päivinen 1987). For strategic decision-making, however, the future development of for-est resources needs to be predicted. For this purpose, growth and yield simulators comprising tree and stand-level growth models are used to obtain prediction results by alternative scenarios based on inventory information, i.e. sample-based field data (e.g., Eerikäinen 2001a).
In large-scale forest inventories, the assessment of stand and tree attributes must be conducted efficiently in terms of costs and accuracy. When optimising the use of resources available for the inventory fieldwork, the main task is to determine an appropriate set of characteristics to be measured and a suitable sample size in terms of the sample plots and the individual trees con-tained within them. Therefore, only easily assessable characteristics such as species and diameter at breast height are measured for all tallied trees, whereas height characteristics and other vari-ables which are difficult to measure accurately, are collected from a sub-sample only. In order to generalise the variables measured from sample trees to also cover the tally trees, generalization techniques need to be applied. These may be either parametric (see Lappi 1991, Lappi et al. 2006, Temesgen et al. 2008, Eerikäinen 2009) or nonparametric (see Korhonen and Kangas 1997). Vol-ume and biomass characteristics are also extremely time consuming to measure in field inven-tories, and they therefore need to be predicted using statistical prediction models (e.g., Sharma and Pukkala 1990a, Laamanen et al. 1995, Hinh 2000, Eerikäinen 2001b, Repola 2009). In many cases, however, there are no models available for predicting different volume and biomass com-ponents that can be deemed to be country-specific and based, for instance, on data covering the different physiographic zones of the inventory area.
Due to the increasing importance of carbon sequestration and REDD (Reducing Emissions from Deforestation and Forest Degradation) related issues and commitments, new demands are also be-ing set for country-level forest inventories: there is a specific need, especially, for up-to-date, accu-rate and multifunctional models for predicting biomass attributes for inventoried trees and forests comprising not only the above-ground but also the below-ground components of tree biomass (cf., GOFC-GOLD 2011). The models for predicting stem volumes, merchantable volumes of trees and different components of tree biomass require data collection surveys that are separate to those of operational forest inventories (cf., Sharma and Pukkala 1990a, Eerikäinen 2001b, Eerikäinen 2010).

Working Papers of the Finnish Forest Research Institute 235 http://www.metla.fi/julkaisut/workingpapers/2012/mwp235.htm
7
Figure 1. Thematic illustration of the data processing chain in the forest inventory system.
In the Forest Resource Assessment (FRA) Nepal project (Draft. 2010), for instance, the estima-tion of forest stand-level characteristics by sample plots is based on tree-level data, i.e. lists of tally trees. The systematic cluster sampling procedure used by FRA Nepal is comparable, for in-stance, to that of the National Forest Inventory (NFI) of Finland (Tomppo 2006). In these situa-tions, it is logical to derive volume and biomass estimates at the forest stand level by using statisti-cal prediction models for the given tree-level characteristics (see Tuominen et al. 2010). The tally and sample tree-wise measured characteristics, such as diameter at breast height and total tree height, are thus accordingly used as independent variables for prediction models (e.g., Sharma and Pukkala 1990a, Repola 2009). A process flow diagram showing the components required for estimating biomass at the stand level in forest inventories is illustrated in Figure 2.
Forest area
Production of information- Stratum and spatial scale-specific results by variables- Error estimates- “Wall-to-wall” maps by attributes
Sample
CALCULATION SYSTEM
Data base- Field-measured data
Model base- Development of models
Data imputation- Generalization of sample tree characteristics to cover tally trees- Prediction and processing of tree and stand level characteristics
Updated database - Information by sample units at different
levels of aggregation
Generalization of ground truth by means of remote sensing data
INVENTORY REPORT

Working Papers of the Finnish Forest Research Institute 235 http://www.metla.fi/julkaisut/workingpapers/2012/mwp235.htm
8
Figure 2. Data flow and phases of the model-aided calculation from temporary sample plots.
The stem analysis comprises measurements carried out for determining empirical stem taper curves over and under bark, i.e. diameters along the stem, needed for estimating volumes of the wood and bark components of the tree stem. In the statistical analyses, the stem analysis data are further utilised for modelling stem volumes and taper curves over and under bark (e.g., Laamanen et al. 1995, Eerikäinen 2001b). The tree analysis is conducted to measure different components of tree biomass and includes the collection of biomass samples (e.g., Repola 2009). The stem analy-sis and tree analysis are relatively laborious, time-consuming procedures and therefore cannot be carried out simultaneously within normal field inventories such as the FRA in Nepal. Collecting a priori information for the allocation of sampling sites and preplanning of the analysis tree selec-tion would, however, be a demanding task if implemented as an individual action separate from an ongoing inventory protocol. Therefore, the procedure for collecting analysis tree data needs to be implemented as a consequential action of the actual forest inventory. In order to obtain a statisti-cally sound and cost-efficient sampling scheme, information collected from previous or ongoing inventories should be carefully considered and efficiently utilised when designing the collection of analysis tree data (see Eerikäinen 2010).
Models are also required when volume and biomass increments need to be predicted as a part of the forest inventory calculations. In the case of measurement setups based on concentric circular-type sample plots, as applied in FRA Nepal, or samplings of tally trees from relascope plots, as applied in the NFI of Finland, the growth predictions of forest stand-level or plot-level volume and biomass characteristics are obtained as differences between the aggregated tree-level estimates (at the beginning of the growth period) and predictions (values at the end of the growth period), respectively. When predicting the development of independent variables of volume and biomass models, prediction models for height and diameter increment are required. Determining the di-ameter increment can be based on models that predict the diameter increment directly or that pre-dict the tree basal area increment at breast height (e.g., Korhonen et. al. 1992, Huang and Titus 1995, Rautiainen 1999). The height increment, on the other hand, can be obtained either by using models that predict the height increment directly (e.g., Huang and Titus 1999) or by using localis-able or non-localisable models for the relationship between tree height and diameter (Lappi 1991, Korhonen et al. 1992, Rautiainen 1999, Eerikäinen 2009). If analysis tree data are not available, the increment models for diameter and height are, in practice, only obtainable based on data col-lected from re-measured permanent inventory plots or permanent sample plots of experimental de-signs, the latter of which are often established for research purposes (e.g., Eerikäinen et al. 2007).
Forest stand- and tree-level
data from inventory plots
Stem analysis and tree
analysis data
Mixed generalisation models for height (h) and crown ratio (cr) based on the inventory data characteristics obtained for
sample trees (h and cr) to cover tally trees
Tree-level prediction models for biomass (bm) and volume (v) based on stem and tree analysis data v and bm components for all trees tallied in the inventory
Calculation phaseEstimates based on the imputed data for biomass (BM) and volume (V) at the forest stand level and by inventry plots
Reporting phaseResults aggregated by Development Regions, physiogarphic zones, etc. for the components of V and BM
Modelling phase for data imputation

Working Papers of the Finnish Forest Research Institute 235 http://www.metla.fi/julkaisut/workingpapers/2012/mwp235.htm
9
Localised mixed-effects models for the generalisation of sample tree heights can be used not only to obtain missing heights at the beginning (tally trees) but also at the end of the growth period (tal-ly and sample trees), and can therefore be regarded as an alternative to the direct height increment prediction approach. A thematic illustration of the combined data collection survey designed for obtaining models and calculating inventory results for sample-based data and for obtaining pre-dictions of the development of forest resources is given in Figure 3.
Figure 3. Phases of the data collection and processing chain used for obtaining inventory reports and pre-dicting future development of forests in the target inventory area.
1.2 General principles related to forest models and modelling
The existing models of Nepal and Vietnam described in more detail in Appendices 1 and 2 can be categorised into three main types: 1) increment models, 2) development models, and 3) static relation models for predicting relations between dependent and independent variables (Eerikäinen 2001a).
Prediction models for the static relationship between total over bark stem volume, tree diameter at breast height and total tree height are examples of relation models (see e.g. Honer 1965, Laasas-enaho 1982, Reed and Green 1984). Sometimes a relation model has an embedded attribute of temporal development. In model formulations, this can be implemented by using stand age and other stand characteristics as regressors of the dependent variable (e.g., Lappi 1997, Eerikäinen 2003). Development models are generally considered to indicate the development of the given characteristic as a function of time. With a growth model, the variable modelled is the increment of a given characteristic (see e.g., Hynynen et al. 1998, Rautiainen 1999). Sometimes, however, even models that do not explicitly predict incremental growth are called growth models. Even if it is possible to determine the increment using the development model by differentiation, i.e. by calculating the difference between the values of the predicted variable at the end and beginning of the growth period, most of the models for stand variables should be regarded as static relation or development models.
Data collection phase
Forest stand and tree-level
data from inventory
plots
Mixed models for the generalisation of sample tree characteristics based on the inventory data
Modelling phase
Tree-level prediction models for biomass (bm) and volume (v) based on stem and tree analysis data
Calculation phase Reporting phase
Stem analysis and tree analysis
data
Stand- and tree-level data from existing
growth experiments
height (h) and crown ratio (cr) obtained for sample trees to cover tally trees
v and bm components for all trees tallied in the inventory
Individual tree growth models for diameter (id) or basal area (ig) (and height, ih) increment and models for survival (+ stand-level predictor for self-thinning effect)id or ig and ih for all trees tallied in the inventorysurvival/mortality for all trees tallied in the inventory
Estimates for stand biomass (BM) and volume (V) by PSPs based on the measured or predicted tree-level characteristics
Predicting the development of forest stand characteristics
Results aggregated by Development Regions or physiographic zones for the components of V and BM and their predicted increment

Working Papers of the Finnish Forest Research Institute 235 http://www.metla.fi/julkaisut/workingpapers/2012/mwp235.htm
10
Projection models, called ‘difference equations’ by Clutter et al. (1983), are examples of genu-ine development models for tree and stand characteristics (see Eerikäinen 2002). Models of this category have a conditioned form of regressors because characteristics both at the beginning and at the end of growth periods are used as predictors of the dependent variable. The Algebraic Dif-ference Approach (ADA) introduced by Bailey and Clutter (1974) is an example of a method used to formulate projection models for stand characteristics. Bailey and Clutter (1974) used this method to determine a polymorphic model for dominant height development (see also Borders et al. 1984, Cieszewski and Bailey 2000), after which the ADA has been applied in the construction of simultaneous growth and yield models, i.e. systems of equations, obtained, for example, for predicting the development of mean stand characteristics (e.g., Borders and Bailey 1986, Pienaar and Harrison 1989, Eerikäinen 2002) and percentiles of basal area distributions (e.g., Eerikäinen and Maltamo 2003).
Parametric regression models for biometric variables can also be categorised according to their structures and the level of accuracy of the modelled characteristics, from the simplest, i.e. least descriptive, to the most complex, i.e. most descriptive. Models for predicting stand growth and yield can be categorised according to the level of detail of stand description as follows: 1) mod-els for stand mean and summation characteristics (e.g., Clutter 1963, Borders and Bailey 1986, Pienaar and Harrison 1989, Sterba and Monserud 1995), 2) size or frequency distribution mod-els combined with models for the height-diameter relationship (e.g., Matney and Sullivan 1982, Knoebel et al. 1986, Borders and Patterson 1990, Pukkala et al. 1990a, Forss et al. 1998), and 3) individual tree growth models for prediction of tree diameter or basal area and height increment (see e.g., Huang and Titus 1995, 1999; Hasenauer et al. 1998; Hynynen et al. 1998). It is impor-tant to note that only models of the first category can be independently used as stand yield models in simulators, whereas models of the first category are, in practice, required when applying the second and third category models, which use stand characteristics as independent variables, to construct simulators.
Compatibility between tree- and stand-level models is crucial, especially, when constructing growth and yield simulators. Compatibility in this context means that the variables predicted us-ing separate models for stand-level characteristics should equal those derived from predicted tree-level characteristics. A classical example can be found in plantation forestry, where the site ef-fect is often embedded in the simulation model via the modelled development of stand dominant height (e.g., Sterba 1982, Knoebel et al. 1986, Eerikäinen 2002), which indicates the site quality in terms of stand growth rate and yield capacity. Here, the predicted height distribution develop-ment should also follow the predicted dominant height development (e.g., Eerikäinen 2003). The temporal development of growing organisms can be generally characterised by two key elements: 1) form and 2) asymptotic development. Biological definition and conditioning of the model pa-rameters is especially important when modelling the form and asymptotic development of a given characteristic over time. Due to the compatibility requirement, nonlinear model forms and analyt-ically solved conditions of model parameters are often utilised when constructing model systems for growth and yield simulators (e.g., Bailey and Clutter 1974, Clutter et al. 1983, Borders and Bailey 1986, Pienaar and Harrison 1989), which differs from the traditional and straightforward modelling of characteristics using separate models for different characteristics. In the latter case, models are not mutually and explicitly conditioned and therefore do not necessarily yield a logi-cal system of prediction equations for the phenomenon under study (see Eerikäinen 2001a, 2002).

Working Papers of the Finnish Forest Research Institute 235 http://www.metla.fi/julkaisut/workingpapers/2012/mwp235.htm
11
In the modelling of biometric characteristics, the number and combinations of independent vari-ables should be restricted to characteristics which have a true correlation with the dependent vari-able and which improve the model fit and accuracy. As a part of variable selection and model vali-dation, the reliability of the model as a predictor is assessed within the range of variable-specific variation in the modelling data. If a model performs well, its applicability in extrapolations will also be high. In biometrics, extrapolation means that the model is applied outside the range of variable-specific variation present in the modelling data. Assessing the behaviour of models in extreme areas of data is crucial, since extrapolations are very probable events in forestry applica-tions of growth and yield simulators.
In growth and yield modelling, the dependencies and relations between dimensions of grow-ing organisms are analysed based on allometry (see e.g., Crow and Schlaegel 1988). An accu-rate mathematical definition of allometric dependencies is usually achieved by using nonlinear model forms and by adding numerous parameters to the model; the more parameters included in the model, the more flexibly it describes the growth patterns of stand characteristics. However, the risk of over-parameterisation should also be taken into consideration in regression modelling (e.g., Ratkowsky 1990). It is generally recommended that the number of estimated parameters is kept low and nonlinearity minimized when logical model behaviour is preferred (e.g., Ratkowsky 1990, Eerikäinen 2001a).
In addition to the selection of variables, statistical factors, such as basic model forms and esti-mators, must also be simultaneously considered when modelling tree and stand dimensions. As-sumptions on model errors must also be made by assessing the study data and the structures of the individual models and model systems used, which in turn guides the selection of estimators of the model parameters (e.g., Zellner 1962; Zellner and Theil 1962; Searle 1971, 1987; Hender-son 1975; Lappi 1993; Goldstein 1995). Because of the spatially hierarchical (plantations, stands and trees) and temporal (measurement occasions) correlation structures of the data used for for-est modelling, the basic assumption of non-correlated residuals does not hold in most cases (see e.g., Goldstein 1995). The assumption should therefore be that some of the variables will vary randomly according to the spatial and, probably, temporal correlation structures of the data, and therefore mixed-effects modelling techniques should be applied, i.e. random effects taken into consideration in the model formulation and estimation of fixed and random model parameters (e.g., Lappi 1986, 1991; Lappi and Bailey 1988, Pinheiro and Bates 2002).
1.3 Objectives
The aim of this review is to assess the applicability of the existing models for the prediction of tree and forest characteristics available in Nepal and Vietnam to the calculations conducted in large-scale forest inventories. Through comparisons made between country- and species-specific models and prediction systems, and through an assessment based on modelling literature, rec-ommendations are also given for developing model-aided prediction systems for the ongoing na-tional forest inventories conducted in Nepal and Vietnam.

Working Papers of the Finnish Forest Research Institute 235 http://www.metla.fi/julkaisut/workingpapers/2012/mwp235.htm
12
2 Assessing existing models
2.1 Models for predicting increment
Determining periodic increment
Growth can be generally defined as the increase in dimensions of an organism or its fraction (for-est – forest stand – individual tree – etc.) over time, whereas increment is regarded as the rate of change within a specific period of time (see e.g., Weiskittel et al. 2011). Modelling incremen-tal stand or tree characteristics thus requires either data collected from permanent sample plots or specific measurements of radial growths and height increments of individually sampled and measured trees. Destructive techniques (collecting increment core samples or conducting stem analyses of individual trees) can also be used to determine periodical diameter or basal area incre-ments of individual trees if data from permanent experimental designs or inventory plots are not available. However, only species that produce visible annual rings may be used for the estimation of radial tree growth based on past tree growth data derived from core or disc samples.
In boreal and temperate climates, woody plants must go through a period of cold dormancy in order to survive. The dormancy period completes a yearly cycle in which tree growth follows a regular annual rhythm, which includes a relatively short period of shoot growth during spring and early summer. This enables the annual height growth of standing coniferous trees to be measured where branch whorls are visible. Stem analysis data can also be used for determining height incre-ments. Height increment modelling is, however, normally based on individual-tree data collected from permanent sample plots providing clearly identifiable tree-wise height recordings.
Models for stand-level incremental characteristics
The only examples of the stand-level increment models assessed in this review are the prediction models obtained by Khoi (2002) for predicting current annual stand volume increments of planted Manglietia stands in Huu Lung district, Lang Son province. Khoi’s (2002) models can be applied to predicting annual volume increments at the stand level when the annual height and diameter increments of so-called ‘mean standard trees’ and the number of stems per hectare are measured.
Models for diameter and height increment of individual trees
The models developed by Korhonen et al. (1992) for predicting the radial growth of individ-ual trees in Nepalese conditions comprise basal area increment models for Shorea robusta, Adina cordifolia, A. latifolia and a mixed-species group called ‘others’. In the case of Sal trees growing in the Terai region of Nepal, diameter increments can be predicted using the distance-dependent and distance-independent mixed-effects models constructed by Rautiainen (1999).
2.2 Models predicting stand and tree development
Models for stand characteristics
The growth and yield prediction system by Lung and Khanh (1999), developed for Pinus kesiya plantations in Vietnam, includes linear models for predicting the development of stand basal area and volume over age. A growth and yield model by Huy (2009) for predicting forest carbon in Litsea glutinosa and Cassava agroforestry systems comprises logarithmic prediction models for

Working Papers of the Finnish Forest Research Institute 235 http://www.metla.fi/julkaisut/workingpapers/2012/mwp235.htm
13
stand mean characteristics, total volume, biomass, and quantity of wood carbon. Species-specific models for the relationship between stand dominant height and stand age (Hdom/T) are utilised in the management planning of Vietnamese forest plantations. Hdom/T -models and direct site index predictors reported here comprise the models by Hinh (2000) and Huy (2008).
A system of equations by Rautiainen (1995) consists of models for predicting the development of Sal (Shorea robusta) stands over age in Terai, Nepal. Rautiainen’s (1995) nonlinear and linear equations were obtained for stand dominant height, stand mean height and diameter weighed by basal area, basal area median diameter, number of stems, and stand basal area and volume. An-other study by Rautiainen (1999) reports a classical predictor for the self-thinning of Sal forests in Terai, Nepal.
Models for the relationship between tree height and diameter
A study on the growth and yield prediction of planted Pinus kesiya stands by Lung and Khanh (1999) reports parameters for the Chapman-Richards type of nonlinear height/diameter model. Species-spe-cific parameters of a logarithmic, linear height model have been developed for inventory purposes by the Forest Inventory and Planning Institute (FIPI) of Vietnam (Forest Inventory and... 1995).
In their study, Korhonen et al. (1992) presented two alternative parameterisations for a height/diameter model with species-specific parameters. The predictors used by Korhonen et al. (1992) can be used in forest inventories when not only diameters of tally trees but also basal area weighed stand mean diameter and stand basal area are measured. The h/d model by Rautiainen (1999) can be applied to predict heights of Sal trees growing in even-aged stands in Terai, Nepal when diam-eters of tallied trees and stand age are known.
2.3 Static relation models for predicting volume, biomass and carbon content
Stand-level models
Growth and yield tables are prime examples of predictors in tabular format. The ‘Inventory and trading tables for 14 main plantation species’ publication by the Department of Science, Tech-nology and Product Quality and the Ministry of Agriculture and Rural Development of Vietnam (MARD) comprises local growth and yield tables for 14 common plantation species in Vietnam (see Inventory and trading tables for... 2003). More advanced and flexible stand-level growth and yield predictors are provided by the models developed by Khanh (2001). Khanh’s (2001) volume and yield equations can be used to predict the stand volumes of six common plantation species throughout Vietnam based on stand mean characteristics that are commonly measured in forest inventories. Logarithmic functions developed by Huy (2009) are available for predicting volumes, fresh and dry biomasses (stem, bark, leaf, branch and total) and carbon contents (stem, bark, leaf, branch and total) of Litsea glutinosa stands, but are only applicable to the Litsea – Cassava type of agroforestry system.
The stand-level volume functions available for Nepalese tree species include a logarithmic model for Sal (Shorea robusta) developed by Rautiainen (1995), and three forest type-specific logarith-mic models by Sarkeala and Tokola (1993). Stand basal area and mean height weighed by basal area are both used as independent variables in the volume models by Sarkeala and Tokola (1993) and Rautiainen (1995).
Working Papers of the Finnish Forest Research Institute 235 http://www.metla.fi/julkaisut/workingpapers/2012/mwp235.htm
14
Tree-level models
The existing Vietnamese volume models using diameter at breast height and total height as inde-pendent variables comprise the functions for six common plantation species developed by Khanh (2001), the multiplicative local volume functions for Cunninghamia lanceolata, Pinus massoni-ana and Manglietia glauca developed by Hinh (2000), the local volume functions for planted Cin-namomum cassia developed by Hinh (2001), and the general over- and under-bark volume predic-tors for Acacia auriculiformis developed by Hinh (1999).
An example of the form factor-based predictor for over- and under-bark stem volumes of Pinus kesiya in Vietnam is the model system developed by Lung and Khanh (1999). General volume tables for nine tree species groups in Vietnam are available in a forest inventory handbook pub-lished by the Forest Inventory and Planning Institute of Vietnam (Forest Inventory and... 1995). Multiplicative functions for predicting carbon quantities in different components of individual-trees (incl. stem, branches, leaves, roots and total above-ground biomass) based on diameter at breast height were developed by Phuong (2009). Phuong’s (2009) functions are available for five common plantation species and their mixtures.
The existing volume models available in Nepal can be used to predict the total and merchantable stem volumes of major tree species or groups of species (see e.g., Sharma and Pukkala 1990a, Laamanen et al. 1995, Tamrakar 2000). Acharya et al. (2003) and Department of Forest Research and Survey of Nepal (Local volume tables for... 2006) also report estimated parameters for local stem volume models, although the models were obtained using volumes that were predicted using models developed earlier by Sharma and Pukkala (1990a). If the biomass prediction and allocation system based on the mean density estimators developed by the Ministry of Forests and Soil Con-servation of Nepal (Master plan for... 1988) and further developed by Pukkala and Sharma (1990a) are not taken into consideration, it can be concluded that the tree-wise models for predicting dif-ferent components of tree biomass are available for the smaller number of species existing in Ne-pal compared to species having volume prediction models (see also Acharya and Acharya 2004). Moreover, there are no models available for predicting the below-ground components of tree bio-mass, i.e. stump and root biomasses, based on the data collected by tree species existing in Nepal.
In Nepal, biomass prediction systems and models are only available for predicting the above-ground components of tree biomass and only for some of the major tree species (see e.g., Sharma and Pukkala 1990a, b; Laamanen et al. 1995; Tamrakar 2000; Acharya et al. 2003; Local volume tables for... 2006). Models by Khatry Chhetri and Fowler (1996) are examples of tree-level pre-dictors applicable to the inventory of Nepal’s lower temperate broad-leaved forests when the di-ameter at breast height or basal diameter of trees from stump measurements are needed, or when diameter at breast height is to be converted from basal diameter and vice versa.

Working Papers of the Finnish Forest Research Institute 235 http://www.metla.fi/julkaisut/workingpapers/2012/mwp235.htm
15
3 Discussion
Based on this assessment of the existing models, it is possible to summarise that the published prediction systems and models developed using Nepalese data do not completely cover the re-quirements identified for the ongoing Forest Research Assessment in Nepal (FRA Nepal) project. It is also likely that the reporting requirements set for the NFI of Vietnam, which is currently be-ing upgraded, will result in the model base of the inventory calculation system needing to be up-dated and improved. The models with species-specific components required for calculating the inventory results in FRA Nepal are as follows:
1. models for generalising the total height and height to base of living crown of sample trees to cover tally trees;
2. models for predicting total stem volumes and merchantable volumes; 3. models for predicting biomass components of individual trees;4. increment models for tree basal area or diameter and total height; and5. models for stand-level self-thinning and tree-level survival.
The generalisation models for sample tree characteristics (1) are obtainable based on the FRA data itself, whereas volume (2) and biomass (3) predictions should be based on existing or new models obtained using geographically representative sets of analysis tree data. The sets of model types 1–3 are enough if no predictions are required for the development of forest resources. If volume incre-ments need to be predicted, then species-specific increment models for diameter at breast height or basal area at breast height (4) and predictors for stand-level self-thinning and tree-level survival (5) are required, at least. Finally, taper curve models are needed if merchantable volumes are required for predictions for commercially valuable tree species (see e.g., Eerikäinen 2001).
Species representativeness is important, but not the main reason for highlighting the need to up-date and redesign the model base for national-level forest inventory in Nepal. The current volume models as well as their counterparts for predicting biomass have been deemed either too local or as having limited applicability for predicting characteristics for large-sized trees (see e.g., Tam-rakar 2000, Local volume tables for... 2006). This means that the earlier models were obtained using data characterised by strong locality, i.e. unproven geographical representativeness, and rel-atively low ranges of variation across tree size classes. Other modelling data related issues, such as the shortage of large-sized tree individuals and poor variation in terms of site factors, are also limiting their applicability to national-level forest inventories (see Tamrakar 2000, Local volume tables for... 2006).
In some of the cases, the stem analysis data used for modelling volume characteristics, for in-stance, were collected using measurement procedures that are sensitive to measuring errors (see e.g., Pukkala and Sharma 1990b). In addition, the data collection procedures have not been clearly documented or reported in most of the studies conducted. It is also not clear how widely and pro-foundly the good practices based on the earlier guidelines by Applegate et al. (1985) and Pukka-la et. al. (1990b) have been applied in data collection, storing, processing and documentation. Moreover, the earlier published manuals only focused on the collection of data for above-ground characteristics, which does not meet the current standards and requirements on forest biomass and carbon established by the Intergovernmental Panel on Climate Change (IPCC) and the guide-lines for implementing Reducing Emissions from Deforestation and Forest Degradation (REDD) projects (e.g., Pearson et al. 2005). The existing models are thus deemed to be local, preliminary

Working Papers of the Finnish Forest Research Institute 235 http://www.metla.fi/julkaisut/workingpapers/2012/mwp235.htm
16
predictors appropriate for making indicative assessments of stand and tree characteristics, for example in compartment-specific inventories. In addition, there are no published and compat-ible biomass models available for dividing the total individual-tree biomass into crown (branches and foliage), stem (wood and bark), stump, and root system components (see e.g., Repola 2009). These allocation models are, however, urgently required for providing accurate biometric data-in-puts for forest carbon assessments. As a result, the forthcoming activities on the collection of tree-level biomass data should not only comprise measurements of above-ground components (stem wood and bark volume, branches and foliage) but also the below-ground components (stump and root system) of trees.
The availability of general increment models for tree-level characteristics, such as diameter at breast height or tree height, is even poorer than that of predictors of volume and biomass. The preliminary models compiled and reported by Korhonen et al. (1992) for basal area increment and the diameter increment model for Sal (Shorea robusta) by Rautiainen (1999) are the only ex-amples of models that could be used in the calculation of incremental characteristics in Nepalese conditions. These models are, however, based on very limited and geographically narrow sets of data, and therefore their applicability is restricted. So far, the only predictor of stand-level self-thinning of Nepalese tree species is the model presented by Rautiainen (1999) for Sal. To the au-thors’ knowledge, no models for predicting survival at the tree-level have been observed either in the case of Nepal or Vietnam.

Working Papers of the Finnish Forest Research Institute 235 http://www.metla.fi/julkaisut/workingpapers/2012/mwp235.htm
17
4 Conclusions
Constructing the model base for FRA Nepal will be implemented as a joint effort between the ICI and FRA projects. In order to obtain new prediction models for the purposes of FRA Nepal, specific data collection surveys are however, required. Similar attempts have also been conducted through the ICI process for supporting the implementation of the National Program on Forest Re-sources Change Monitoring and Evaluation in Vietnam (National Program... 2010).
Data for modelling tree-level volume and biomass characteristics are obtainable through a specif-ic data collection survey designed for collecting information in stem and tree analyses (see Apple-gate et al. 1985, Pukkala et al. 1990, Chakanga et al. 1996, Eerikäinen 2010). The stem analysis comprises measurements carried out for determining empirical stem taper curves over and under bark, i.e. diameters along the stem, needed for estimating volumes of stem wood and bark. In the statistical analyses, the stem analysis data are further utilised for modelling purposes (e.g., stem volume models and taper curve models for predicting stem volumes and diameters, respectively, over and under bark) (e.g., Eerikäinen 2001b). The tree analysis is conducted to measure different components of tree biomass and includes the collection of biomass samples (e.g., Repola 2009). The stem analysis and tree analysis are relatively laborious and time-consuming procedures and cannot, therefore, be carried out simultaneously as part of normal field inventories such as the FRA in Nepal. Collecting a priori information for the allocation of sampling sites and preplanning of the analysis tree selection would, however, be a demanding task if implemented as an individ-ual action separate from an ongoing inventory protocol. Therefore, the procedure for collecting analysis tree data needs to be implemented as an action that is separate from the FRA inventory, yet designed to efficiently utilise the information collected from the permanent inventory plots in order to obtain a statistically sound sampling scheme. A data collection survey for obtaining new tree-level models for volume and biomass characteristics in Kon Tum, Vietnam, has already been launched by the Forest Inventory and Planning Institute (FIPI) and the Vietnam Forestry Univer-sity (VFU) with the aid and support of the ICI project.
Collection of growth data for modelling diameter increment, stand-level self-thinning and tree survival, on the other hand, should be based on the existing monitoring plots established by the Tribhuvan University’s Institute of Forestry (IoF/TU) (see Meilby et al. 2006) and permanent sample plots established by the Department of Forest Research and Survey (DFRS). Remeasure-ment data collected from the 32 permanent sample plots of the DFRS in eastern Terai forms a basis for the development of preliminary models and demonstration of the modelling measures needed for FRA Nepal. Another source of data which could be utilised in developing growth mod-els for Nepalese conditions is the setup of experimental trials of IoF/TU in Chitwan district. Based on the experiences gained, the data collection could later be expanded to cover other two experi-mental sites of IoF/TU as the implementation of FRA Nepal widens to cover the entire country. When remeasurement of the inventory plots established by FRA Nepal commences in the future, modelling of growth and survival characteristics can be based on the repeatedly measured inven-tory data itself. In Vietnam, the permanent sample plot design established for the implementation of the National Program on Forest Resources Change Monitoring and Evaluation (National Pro-gram... 2010) offers a very interesting setup for obtaining data appropriate for developing general models for national-level forest inventories and simulation studies.
Working Papers of the Finnish Forest Research Institute 235 http://www.metla.fi/julkaisut/workingpapers/2012/mwp235.htm
18
Literature cited
Acharya, K.P., Regmi, R. and Acharya, B. 2003. Biomass and volume tables for Terai Sal (Shorea robusta) forest of Nepal. Department of Forest Research and Survey, Ministry of Forests and Soil Conservation. Kathmandu, Nepal. Forest Research Leaflet No. 15. 9 p.
Acharya, K.P. and Acharya, B. 2004. Early growth performance of natural Sal (Shorea robusta) forest in Central Nepal. Department of Forest Research and Survey, Ministry of Forests and Soil Conservation, Kathmandu, Nepal. 8 p.
Applegate, G.B. Hawkins, T. and Thompson, I. 1985. Preliminary guidelines for biomass studies in Nepal. Nepal – Australia Forestry Project. Technical Note 2/85. 22 p.
Bailey, R.L. and Clutter, J.L. 1974. Base-age invariant polymorphic site curves. Forest Science 20: 155−159.
Borders, B.E. and Bailey, R.L. 1986. A compatible system of growth and yield equations for slash pine fit-ted with restricted three-stage least squares. Forest Science 32: 185–201.
Borders, B.E. and Patterson, W.D. 1990. Projecting stand tables: A comparison of the Weibull diameter distribution method, a percentile-based projection method, and a basal area growth projection method. Forest Science 36: 413–424.
Borders, B.E., Bailey, R.L. and Ware, K.D. 1984. Slash pine site index from a polymorphic model by joining (splining) nonpolynomial segments with an algebraic difference method. Forest Science 30: 411–423.
Chakanga, M., Juola, V. and Korhonen, K. 1996. Field instructions: Collection of sample tree data for volume and biomass tables. National Forest Inventory Project, Directorate of Forestry, Namibia. 9 p. + Appendices.
Cieszewski, C.J. and Bailey, R.L. 2000. Generalised algebraic difference approach: Theory based derivation of dynamic site equations with polymorphism and variable asymptotes. Forest Science 46: 116−126.
Clutter, J.L. 1963. Compatible growth and yield models for loblolly pine. Forest Science 9: 354–371.
Clutter, J.L., Fortson, J.C., Pienaar, L.V., Brister, G.H. and Bailey, R.L. 1983. Timber management: A quan-titative approach. John Wiley & Sons, New York. 333 p.
Crow, T.R. and Schlaegel, B.E. 1988. A guide to using regression equations for estimating tree biomass. Northern Journal of Applied Forestry 5: 15−22.
Draft Field Manual. 2010. Version 16th October, 2010. Forest Resource Assessment, Nepal. 77 p.
Eerikäinen, K. 2001a. Modelling stand development on Pinus kesiya plantations in southeastern Africa. D.Sc. (Agr. and For.) thesis summary. University of Joensuu, Faculty of Forestry. Research Notes 133. 49 p.
Eerikäinen, K. 2001b. Stem volume models with random coefficients for Pinus kesiya in Tanzania, Zambia, and Zimbabwe. Canadian Journal of Forest Research 31(5): 879–888.
Eerikäinen, K. 2002. A site dependent simultaneous growth projection model for Pinus kesiya plantations in Zambia and Zimbabwe. Forest Science 48: 518–529.
Eerikäinen, K. 2003. Predicting the height-diameter pattern of planted Pinus kesiya stands in Zambia and Zimbabwe. Forest Ecology and Management 175: 355–366.
Eerikäinen, K. 2009. A multivariate linear mixed-effects model for the generalization of sample tree heights and crown ratios in the Finnish National Forest Inventory. Forest Science. 55(6): 480–493.
Eerikäinen, K. 2010. Justification and best practices for collecting stem and tree analysis data for modelling purposes in Nepal. Forest Resource Assessment in Nepal. Draft technical note compiled in collabora-tion with the Institutional Cooperation Instrument (ICI) project “Improving Research Capacity of Forest Resource Information Technology in Vietnam and Nepal”. 16 p + Appendices.
Eerikäinen, K. and Maltamo, M. 2003. A percentile based basal area diameter distribution model for pre-dicting the stand development of Pinus kesiya plantations in Zambia and Zimbabwe. Forest Ecology and Management 172: 109–124.
Eerikäinen, K., Miina, J. and Valkonen, S. 2007. Models for the regeneration establishment and the devel-opment of established seedlings in uneven-aged, Norway spruce dominated forest stands of southern Finland. Forest Ecology and Management 242(2007): 444–461.

Working Papers of the Finnish Forest Research Institute 235 http://www.metla.fi/julkaisut/workingpapers/2012/mwp235.htm
19
Forest Inventory and Planning Handbook. 1995. Forest Inventory and Planning Institute. Hanoi, Vietnam. Ha Noi Agricultural Publishing House. 252 p. (In Vietnamese.)
Forss, E., Maltamo, M. and Saramäki, J. 1998. Static stand and tree characteristics models for Acacia man-gium plantations. Journal of Tropical Forest Science 10: 318–336.
GOFC-GOLD. 2011. A sourcebook of methods and procedures for monitoring and reporting anthropogenic greenhouse gas emissions and removals caused by deforestation, gains and losses of carbon stocks in forests remaining forests, and forestation. GOFC-GOLD Report version COP17-1 edited by Achard, F., Brown, S., Brady, M., DeFries, R., Grassi, G., Herold, M., Mollicone, D., Pandey, D., and Souza Jr., C. GOFC-GOLD Project Office, Natural Resources Canada, Alberta, Canada. 203 p.
Goldstein, H. 1995. Multilevel statistical models. Second edition. Institute of Education, University of London. 178 p.
Hasenauer, H., Monserud, R.A. and Gregoire, T.G. 1998. Using simultaneous regression techniques with individual-tree growth models. Forest Science 44: 87–95.
Henderson, C.R. 1975. Best linear unbiased estimation and prediction under a selection model. Biometrics 31: 423–447.
Hinh, V.T. 1999. Drawing up the increment and yield tables for Acacia auriculiformis planted in the whole country. Vietnam Forestry Review 10: 31–33 and 41–43. (In Vietnamese.)
Hinh, V.T. 2000. A study of the growth and yield of three species (Cunninghamia lanceolata Hook, Pinus massoniana Lamb, Manglietia glauca Blume) in northern Vietnam. Vietnam Forestry University and Ministry of Agriculture and Rural Development (MARD) of Vietnam. Scientific research report. 134 p. (In Vietnamese.)
Hinh, V.T. 2001. Establishment of a yield table for Cinnamomum cassia Blume planted in Van Yen district, Yen Bai province. Vietnam Forestry University and Ministry of Agriculture and Rural Development (MARD) of Vietnam. Scientific research report. 61 p. (In Vietnamese.)
Honer, T.G. 1965. A new total cubic foot volume function. For. Chron. 41: 476–493.
Huang, S. and Titus, S.J. 1995. An individual tree diameter increment model for white spruce in Alberta. Canadian Journal of Forest Research 25(9): 1455–1465.
Huang, S. and Titus, S.J. 1999. An individual tree height increment model for mixed white spruce–aspen stands in Alberta, Canada. Forest Ecology and Management 123(1): 41 – 53.
Huy, B. 2008. Yield table of the Canarium album. Vietnamese-German cooperation project. Ministry of Agriculture and Rural Development (MARD) of Vietnam. 71 p. (In Vietnamese.)
Huy, B. 2009. CO2 sequestration estimation for the Litsea glutinosa in Litsea - Cassava agro-forestry model in Mang Yang district, Gia Lai province in the Central Highlands of Vietnam. Research sponsored by the Swedish International Development Cooperation Agency (SIDA) through the World Agroforestry Center (ICRAF) and Southeast Asian Network for Agroforestry Education (SEANAFE). 44 p.
Hynynen, J., Burkhart, H.E. and Allen, H.L. 1998. Modelling tree growth in fertilized midrotation loblolly pine plantations. Forest Ecology and Management 107: 213–229.
Inventory and trading tables for 14 main plantation species. 2003. Department of Science, Technology and Product Quality and Ministry of Agriculture and Rural Development. Forestry sector’s standard no.04-TCN-66-2003 (promulgated according to decision no. 433/QD-BNN-KHCN dated Feb 18, 2003). Ag-riculture Publishing House, Hanoi, Vietnam. 182 p. (In Vietnamese.)
Khanh, D.C. 2001. Establishment of growth and yield tables for plantations of Eucalyptus urophylla, Aca-cia mangium, Tectona grandis, Pinus merkusii and verification of yield tables of Zhizophora apiculata and Melaleuca cajuputi plantations. Forest Science Institute of Vietnam (FSIV), Ministry of Agriculture and Rural Development (MARD) of Vietnam. Research report. 158 p. (In Vietnamese.)
Khatry Chhetri, D.B. and Fowler, G.W. 1996. Estimating diameter at breast height and basal diameter of trees from stump measurements in Nepal’s lower temperate broad-leaved forests. Forest Ecology and Management 81(1996): 75–84.
Khoi, N.K. 2002. A mathematical model for forecasting current annual increment of forest growing stock. Science and Technology Journal of Agriculture and Rural Development No. 4/2002: 324–325. (In Viet-namese with English summary.)

Working Papers of the Finnish Forest Research Institute 235 http://www.metla.fi/julkaisut/workingpapers/2012/mwp235.htm
20
Knoebel, B.R., Burkhart, H.E. and Beck, D.E. 1986. A growth and yield model for thinned stands of yellow-poplar. Forest Science 27. Monograph. 62 p.
Korhonen K.T., Sharma, E.R. and Rajbhandari, R.D. 1992. Diameter growth and height models for forest trees in Kapilbastu District. HMGN Ministry of Forest and Environment, Forest Survey and Statistics Division, FSIPS/FRIS. Technical report. 17 p.
Korhonen, K.T. and A.S. Kangas. 1997. Application of nearest-neighbour regression for generalizing sam-ple tree information. Scandinavian Journal of Forest Research 12(1): 97–101.
Laamanen, R., Joshi, M.R. and Sharma, S.P. 1995. Biomass and volume models for Sal (Shorea robusta) in the central Terai of Nepal. Forest Resource Information System Project (FRISP), HMGN/FINNIDA, Finnish Forest and Park Service. Kathmandu, Nepal. FRIS Project Paper No. 7. 12 p. + Appendices.
Laasasenaho, J. 1982. Taper curve and volume functions for pine, spruce and birch. Communicationes Instuti Forestalis Fenniae 108. 74 p.
Lappi, J. 1986. Mixed linear models for analyzing and predicting stem form variation of Scots pine. Com-municationes Instuti Forestalis Fenniae 134. 69 p.
Lappi, J. 1991. Calibration of height and volume equations with random parameters. Forest Science 37: 781–801.
Lappi, J. 1993. Biometrical methods for forest sciences. Faculty of Forestry, University of Joensuu. Univer-sity Press, Joensuu, Finland. Silva Carelica 24. 182 p. (In Finnish).
Lappi, J. 1997. A longitudinal analysis of height/diameter curves. Forest Science 43: 555–570.
Lappi, J. and Bailey, R.L. 1988. A height prediction model with random stand and tree parameters: An alternative to traditional site index methods. Forest Science 34: 907−927.
Lappi, J., Mehtätalo, L. and K.T. Korhonen. 2006. Generalizing Sample Tree Information. In: Kangas A. and M. Maltamo (eds.). Forest Inventory – Methodology and Applications. Springer, the Netherlands. P. 85–106.
Local volume tables for major tree species in Dhaulagiri area. 2006. Department of Forest Research and Survey, District Forest Offices: Pardat, Baglung & Myagdi, Livelihoods and Forestry Programme, Dhaulagiri area, Nepal. 7 p. + Appendices.
Lung, N.N. and Khanh, D.C. 1999. Research on growth and yield of plantations – Applied for Pinus kesiya Royle ex. Gordon in Viet Nam. Agricultural Publishing House, Ho Chi Minh City, Vietnam. 207 p.
Master plan for the forestry sector – Nepal. 1988. Forest resources information status and development plan. His Majesty’s Government of Nepal, Ministry of Forests and Soil Conservation. Kathmandu, Nepal. 106 p. + Appendices.
Matney, T.G. and Sullivan, A.D. 1982. Compatible stand and stock tables for thinned and unthinned loblol-ly pine stands. Forest Science 28: 161–171.
Meilby, H., Puri, L., Christensen, M. and Rayamajhi, S. 2006. Planning a system of permanent sample plots for integrated long-term studies of community-based forest management. A Journal of Forestry Information of Nepal. Banko Janakari 16(2): 3–11.
National Program on Forest Resources Change Monitoring and Evaluation. 2010. Ministry of Agriculture and Rural Development (MARD) of Vietnam, Period 1991-2010. A handout from ICI Follow-up Mis-sion in Hanoi 2010. 6 p.
Päivinen, R. 1987. A planning model for forest inventory. D.Sc. (Agr. and For.) thesis. Joensuun yliopiston luonnontieteellisiä julkaisuja – University of Joensuu. Publications in Sciences N:o 11. 179 p. (In Finn-ish with English summary.)
Pearson, T., Walker, S. and Brown, S. 2005. Sourcebook for land use, land-use change and forestry projects. Winrock International and the BioCarbon Fund of the World Bank. 57 p. URL: http://www.winrock.org/ecosystems/files/winrock-biocarbon_fund_sourcebook-compressed.pdf (Site visited on 30th May, 2012.)
Phuong, V.T. 2009. Forest valuation in Vietnam. Science and Technology Publishing House, Hanoi, Viet-nam. 177 p.
Pienaar, L.V. and Harrison, W.M. 1989. Simultaneous growth and yield prediction equations for Pinus el-liottii plantations in Zululand. South African Forestry Journal 149: 48–53.
Pinheiro, J.C. and D.M. Bates. 2002. Mixed-Effects Models in S and S-PLUS. Corrected third printing. Springer-Verlag, New York. 528 p.

Working Papers of the Finnish Forest Research Institute 235 http://www.metla.fi/julkaisut/workingpapers/2012/mwp235.htm
21
Pukkala, T., Saramäki, J. and Mubita, O. 1990a. Management planning system for tree plantations. A case study for Pinus kesiya in Zambia. Silva Fennica 24: 171–180.
Pukkala, T., Sharma, E.R. and Rajbandhari, M.D. 1990b. A guide to biomass modeling for forest inven-tory in Nepal. Forest Survey and Statistics Division, Ministry of Forests and Soil Conservation, Babar Mahal, Kathmandu, Nepal. Publication 51. 41 p.
Ratkowsky, D.A. 1990. Handbook of nonlinear regression models. Marcel Dekker, New York. 241 p.
Rautiainen, O. 1995. Growth and yield models for uniform sal (Shorea robusta Gaertn. f.) forests in the Bhabar – Terai in Nepal. Forest Management and Utilization Development Project, HMGN/The Gov-ernment of Finland. Kathmandu, Nepal. FMUDP Technical Report No. 17. 15 p. + Appendices.
Rautiainen, O. 1999. Spatial yield model for Shorea robusta in Nepal. Forest Ecology and Management 119: 151–162.
Reed, D.D. and Green, E.J. 1984. Compatible stem taper and volume ratio equations. Forest Science 30: 977–990.
Repola, J. 2009. Biomass equations for Scots pine and Norway spruce in Finland. Silva Fennica 43(4): 625–647.
Sarkeala, J. and Tokola, T. 1993. Stand volume equations and tables for western Terai. Forest Survey and Statistics Division, Ministry of Forests and Soil Conservation. Babar Mahal, Kathmandu. Publication 58. 12 p. + Appendices.
Searle, S.R. 1971. Linear models. John Wiley & Sons, Inc. New York. 532 p.
Searle, S.R. 1987. Linear models for unbalanced data. John Wiley & Sons, Inc. New York. 536 p.
Sharma, E.R. and Pukkala, T. 1990a. Volume equations and biomass prediction of forest trees of Nepal. Forest Survey and Statistics Division, Ministry of Forests and Soil Conservation. Babar Mahal, Kath-mandu, Nepal. Publication 47. 16 p.
Sharma, E.R. and Pukkala, T. 1990b. Volume tables for forest trees of Nepal. Forest Survey and Statistics Division, Babarmahal, Kathmandu. Publication 48. 85 p. + Appendices.
Sterba, H. 1982. On forest’s yield theory. A lecture given at the Faculty of Agriculture and Forestry, Uni-versity of Helsinki, 26 August 1981. University of Helsinki, Department of Forest Mensuration and Management. Research Notes 15. 12 p.
Sterba, H. and Monserud, R.A. 1995. Potential volume yield for mixed-species Douglas-fir stands in the northern Rocky Mountains. Forest Science 41: 531–545.
Tamrakar, P.R. (Ed.). 2000. Biomass and volume tables with species description for community forest management. His Majesty’s Government of Nepal, Ministry of Forests and Soil Conservation, Natural Resource Management Sector Assistance Programme (NARMSAP), Tree Improvement and Silvicul-ture Component. 90 p.
Temesgen, H., Monleon, V.J., and D.W. Hann. 2008. Analysis and comparison of nonlinear tree height prediction strategies for Douglas-fir forests. Canadian Journal of Forest Research 38(3): 553–565.
Tuominen, S., Eerikäinen, K., Schibalski, A., Haakana, M. and Lehtonen, A. 2010. Mapping biomass vari-ables with a multi-source forest inventory technique. Silva Fennica 44(1): 109–119.
Tomppo, E. 1993. Multi-source national forest inventory of Finland. In: Nyyssönen, A., Poso, S. & Rautala, J. (eds.). Proceedings of Ilvessalo Symposium on national forest inventories, 17–21 Aug. 1992, Finland. The Finnish Forest Research Institute Research Papers 444. pp. 52–60
Tomppo, E. 2006. The Finnish multi-source national forest inventory – small area estimation and map production. In: Kangas, A. & Maltamo, M. (eds.). Forest inventory – methodology and applications. Springer, Netherlands. pp. 195–224.
Weiskittel, A.R., Hann, D.W., Kershaw, Jr., J.A. and Vanclay, J.K. 2011. Forest growth and yield modeling. John Wiley & Sons, Ltd., Markono Print Media Pte Ltd, Singapore. 415 p.
Zellner, A. 1962. An efficient method of estimating seemingly unrelated regressions and tests for aggrega-tion bias. Journal of the American Statistical Association 57: 348–368.
Zellner, A. and Theil, H. 1962. Three-stage least squares: Simultaneous estimation of simultaneous equa-tions. Econometrica 30: 54–78.

Working Papers of the Finnish Forest Research Institute 235 http://www.metla.fi/julkaisut/workingpapers/2012/mwp235.htm
22
Index to authors of the review
Name of author Position Institute
Dr. Kalle Eerikäinen Researcher Finnish Forest Research Institute (Metla)Joensuu UnitYliopistokatu 6FI-80100 Joensuu, FINLAND
Prof. Vu T. Hinh Professor of Silviculture and Forest Inventory
Vietnam Forestry University (VFU)Xuan Mai, Chuong My, Hanoi, VIETNAM
Prof. Bao Huy Professor of Silviculture and Forest Inventory, Head of Department of Forest Resources and Environment Management
Tay Nguyen University (TNU)No. 567, Le Duan, Buon Ma Thuot, Daklak, VIETNAM
Dr. Dao C. Khanh Researcher Sustainable Forest Management and Forest Certification Institute (SFMI) - Vietnam Scientific Forestry Association (VIFA)No. 114, Hoang Quoc Viet, Cau Giay, Hanoi, VIETNAM
Dr. Phung V. Khoa Deputy Dean of the Postgraduate Studies Faculty
Vietnam Forestry University (VFU)Xuan Mai, Chuong My, Hanoi, VIETNAM
Dr. Ngo K. Khoi Researcher Ministry of Education and Training (MOET) No. 49, Dai Co Viet, Hanoi, VIETNAM
Prof. Nguyen N. Lung Researcher Sustainable Forest Management and Forest Certification Institute (SFMI) - Vietnam Scientific Forestry Association (VIFA)No. 114, Hoang Quoc Viet, Cau Giay, Hanoi, VIETNAM
Mr. Ram A. Mandal Faculty member and lecturer in Forest Mensuration
Kathmandu Forestry College (KaFCoL)G.P.O. Box 9594 Koteswor Kathmandu, NEPAL
Mr. Vu T. Phuong Director of Research Centre for Forest Ecology and Environment
Forest Science Institute of Vietnam (FSIV)Dong Ngac, Tu Liem, Hanoi, VIETNAM
Mr. Yam P. Pokharel Survey Officer Department of Forest Research and Survey (DFRS)BabarmahalG.P.O. Box 3339Kathmandu, NEPAL
Mr. Him L. Shrestha Faculty member and lecturer in Remo-te Sensing
Kathmandu Forestry College (KaFCoL)G.P.O. Box 9594 Koteswor Kathmandu, NEPAL
Mr. Tran N. The Researcher Vietnam Forestry University (VFU)Xuan Mai, Chuong My, Hanoi, VIETNAM
Mr. Bechu Yadav Faculty member and lecturer in Forest Management
Kathmandu Forestry College (KaFCoL)G.P.O. Box 9594 Koteswor Kathmandu, NEPAL

Working Papers of the Finnish Forest Research Institute 235 http://www.metla.fi/julkaisut/workingpapers/2012/mwp235.htm
23
Appendices
Appendix 1: Model descriptions 1.01–1.11 for the parametric Vietnamese predictors. On the pages 24-52.
Appendix 2: Model descriptions 2.01–2.09 for the parametric Nepalese predictors. On the pages 53-72.

Working Papers of the Finnish Forest Research Institute 235 http://www.metla.fi/julkaisut/workingpapers/2012/mwp235.htm
24
Appendix 1: Model descriptions 1.01–1.11 for the parametric Vietnamese predictors.
Appendix 1Model description 1.01
Author: Ministry of Agriculture and Rural Development (MARD), Vietnam.
Name of model/set of models:Inventory and yield tables for 14 main plantation species in the Northeast region of Vietnam.
Complete reference: Inventory and trading tables for 14 main plantation species. 2003. Department of Science, Tech-
nology and Product Quality and Ministry of Agriculture and Rural Development. Forestry sector’s standard no.04-TCN-66-2003 (promulgated according to decision no. 433/QD-BNN-KHCN dated Feb 18, 2003). Agriculture Publishing House, Hanoi, Vietnam. 182 p. (In Viet-namese.)
Purpose: Support for managing and guiding planting activities and evaluation of plantation productivity.
Tree species: 1. Acacia auriculiformis2. A. mangium3. Cunninghamia lenceolata4. Cinnamomum cassia Blume5. Dipterocarpus alatus Roxb6. Eucalyptus camaldulensis7. E. urophylla8. Manglietia conifera9. Pinus merkusii10. P. massoniana11. P. kesiya12. Styrax tonkinensis13. Tectona grandis
Sample size by model(s) and species: Information not available.
Origin of data: Different provinces of Vietnam including Phu Tho, Tuyen Quang, Ha Giang, Yen Bai, Lang Son, Quang Ninh, Bac Giang, Thai Nguyen, Lao Cai, Quang Tri, Thua Thien Hue, Da Nang, Quang Nam, Dong Nai, Lam Dong and Khanh Hoa.
Physiographic applicability: Tables can be used to a limited extent in the provinces listed above.
Site, soil and climatic factors: Different site, soil and climatic conditions.
Forest establishment: Most data originated from artificial plantations.

Working Papers of the Finnish Forest Research Institute 235 http://www.metla.fi/julkaisut/workingpapers/2012/mwp235.htm
25
Appendix 1: Model descriptions 1.01–1.11 for the parametric Vietnamese predictors.
Appendix 1 Appendix 1
Silvicultural constraints (thinnings, soil preparation, etc.): Information not available.
Short description of models: Volume tables, productivity tables, growth tables, product tables, commodity tables.
Instructions for application:Growth and productivity tables were created based on local data resulting in limited applicability.
Description compiled by:Department of Science, Technology and Product Quality and Ministry of Agriculture and Rural Development (MARD).
Parametric presentation:Independent variables of the growth tables are: diameter at breast height, height, stand age, and trees per hectare.

Working Papers of the Finnish Forest Research Institute 235 http://www.metla.fi/julkaisut/workingpapers/2012/mwp235.htm
26
Appendix 1: Model descriptions 1.01–1.11 for the parametric Vietnamese predictors.
Appendix 1Model description 1.02
Author: Khanh, D.C.
Name of model/set of models: Growth and yield tables for Eucalyptus urophylla, Acacia mangium, Tectona grandis, Pinus merkusii plantations and verification of yield tables for Zhizophora apiculata and Melaleuca ca-juputi plantations.
Complete reference: Khanh, D.C. 2001. Establishment of growth and yield tables for plantations of Eucalyptus uro-
phylla, Acacia mangium, Tectona grandis, Pinus merkusii and verification of yield tables of Zhizophora apiculata and Melaleuca cajuputi plantations. Forest Science Institute of Vietnam (FSIV), Ministry of Agriculture and Rural Development (MARD) of Vietnam. Research re-port. 158 p. (In Vietnamese.)
Purpose: Research aimed at establishing new growth tables and verifying the existing yield tables of the given plantation species in order to apply the tables across whole country.
Tree species: 1. Eucalyptus urophylla2. Acacia mangium3. Tectona grandis4. Pinus merkusii5. Zhizophora apiculata6. Melaleuca cajuputi
Sample size by model(s) and species: Information not available.
Origin of data: Research data comprised observations covering all ecological regions throughout the country where Eucalyptus urophylla, Acacia mangium, Tectona grandis and Pinus merkusii have been planted. In the case of Zhizophora apiculata and Melaleuca cajuputi, however, data were only available from South Vietnam.
Physiographic applicability: Tables can be used throughout Vietnam.
Site, soil and climatic factors: Different site, soil and climatic conditions (five ecological regions and stand ages from 2 to 12 years).
Forest establishment: Mainly plantation.
Silvicultural constraints (thinnings, soil preparation, etc.): Information not available.
Working Papers of the Finnish Forest Research Institute 235 http://www.metla.fi/julkaisut/workingpapers/2012/mwp235.htm
27
Appendix 1: Model descriptions 1.01–1.11 for the parametric Vietnamese predictors.
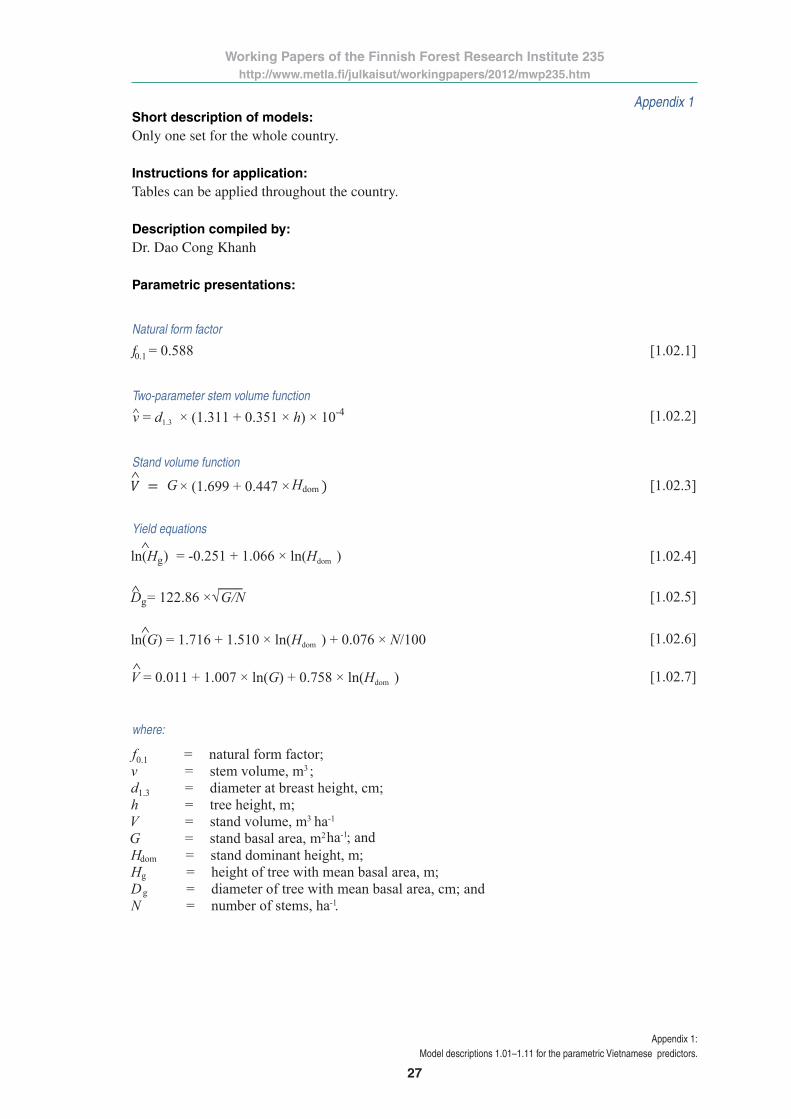
Appendix 1 Appendix 1Short description of models: Only one set for the whole country.
Instructions for application:Tables can be applied throughout the country.
Description compiled by:Dr. Dao Cong Khanh
Parametric presentations:
Natural form factor
Two-parameter stem volume function
Stand volume function
Yield equations
where:
ƒ0.1 = 0.588 [1.02.1]
v = d1.3 × (1.311 + 0.351 × h) × 10-4 [1.02.2]
[1.02.3]
ln(Hg) = -0.251 + 1.066 × ln(Hdom ) [1.02.4]
Dg= 122.86 ×√G/N [1.02.5]
ln(G) = 1.716 + 1.510 × ln(Hdom ) + 0.076 × N/100 [1.02.6]
V = 0.011 + 1.007 × ln(G) + 0.758 × ln(Hdom ) [1.02.7]
f0.1 = natural form factor; v = stem volume, m3 ; d1.3 = diameter at breast height, cm; h = tree height, m; V = stand volume, m3 ha-1 G = stand basal area, m2 ha-1; and Hdom = stand dominant height, m; Hg = height of tree with mean basal area, m; Dg = diameter of tree with mean basal area, cm; and N = number of stems, ha-1.
∧
∧
∧G × (1.699 + 0.447 × Hdom
∧
∧
∧

Working Papers of the Finnish Forest Research Institute 235 http://www.metla.fi/julkaisut/workingpapers/2012/mwp235.htm
28
Appendix 1: Model descriptions 1.01–1.11 for the parametric Vietnamese predictors.
Appendix 1Model description 1.03
Author: Hinh, V.T.
Name of model/set of models: Growth and yield models for three species (Cunninghamia lanceolata Hook, Pinus massoniana Lamb, Manglietia glauca Blume) in northern provinces of Vietnam.
Complete reference: Hinh, V.T. 2000. A study of the growth and yield of three species (Cunninghamia lanceolata
Hook, Pinus massoniana Lamb, Manglietia glauca Blume) in northern Vietnam. Vietnam Forestry University and Ministry of Agriculture and Rural Development (MARD) of Vietnam. Scientific research report. 134 p. (In Vietnamese.)
Purpose: Support for the identification of planting techniques and yield inventories.
Tree species: 1. Cunninghamia lanceolata Hook 2. Pinus massoniana Lamb3. Manglietia glauca
Sample size by model(s) and species: Information not available.
Origin of data: Different regions of northern Vietnam (North and Northeast border regions, North Central region and Northeast region).
Physiographic applicability: Growth and yield tables can be used in North Vietnam.
Site, soil and climatic factors: Varying site and soil conditions.
Forest establishment: Mainly plantation.
Silvicultural constraints (thinnings, soil preparation, etc.): Managed with thinnings.
Short description of models: Not available.
Instructions for application:Growth tables were created based on local data. Therefore, the applicability is limited. In the case of P. massoniana, the study only focused on population growth studies and establishment of growth and yield tables for supporting inventories and management of plantations. In addition, data used and methods and results published in earlier studies were utilised in this study.

Working Papers of the Finnish Forest Research Institute 235 http://www.metla.fi/julkaisut/workingpapers/2012/mwp235.htm
29
Appendix 1: Model descriptions 1.01–1.11 for the parametric Vietnamese predictors.
Appendix 1 Appendix 1Description compiled by:Prof. Vu Tien Hinh
Parametric presentation:
C. lanceolata
P. massoniana
M. glauca
where:
0.0000614 1.0121.8581 hdv ××= [1.03.1]
1.2671 0.9425gg HD ×= [1.03.2]
1.22 0.96gdom HH ×= [1.03.3]
0.0000894 0.89661.8415 hdv ××= [1.03.4]
0.5306gg 1577.1 HD ×= [1.03.5]
2296.1 0.9518gdom HH ×= [1.03.6]
60.00009003 0.7843751.933371.3 hdv ××= [1.03.7]
0.87gg 898.1 HD ×= [1.03.8]
0.9404gdom 279.1 HH ×= [1.03.9]
v = stem volume, m3;d1.3 = diameter at breast height, cm;h = tree height, m;Hg = mean stand height weighted by basal area, m;Dg = mean stand diameter weighted by basal area, cm ; andHdom = stand dominant height, m.
∧
∧
∧
∧
∧
∧
1.3
1.3
∧
∧
∧

Working Papers of the Finnish Forest Research Institute 235 http://www.metla.fi/julkaisut/workingpapers/2012/mwp235.htm
30
Appendix 1: Model descriptions 1.01–1.11 for the parametric Vietnamese predictors.
Appendix 1Model description 1.04
Author: Hinh, V.T.
Name of model/set of models: Yield table for Cinnamomum cassia Blume planted in Van Yen District of Yen Bai Province.
Complete reference: Hinh, V.T. 2001. Establishment of a yield table for Cinnamomum cassia Blume planted in Van
Yen district, Yen Bai province. Vietnam Forestry University and Ministry of Agriculture and Rural Development (MARD) of Vietnam. Scientific research report. 61 p. (In Vietnamese.)
Purpose: Support for inventory, bark quantity estimation, especially, and promoting planting techniques in order to enhance the productivity of Cinnamomum plantations.
Tree species: Cinnamomum cassia Blume.
Sample size by model(s) and species: Information not available.
Origin of data: Van Yen District in Yen Bai Province of Vietnam.
Physiographic applicability: Growth and yield table is applicable to North Vietnam.
Site, soil and climatic factors: Fertile soils with deep and porous soil layers and high-quality mulch.
Forest establishment: Planted.
Silvicultural constraints (thinnings, soil preparation, etc.): Managed with thinnings.
Short description of models: Three model-sets obtained for constructing growth and yield tables and predictors for stem vol-ume, bark mass of individual trees and stand-level growth and yield characteristics.
Instructions for application:Growth and yield models were created using local data and therefore their applicability should be considered limited.
Description compiled by:Prof. Vu Tien Hinh

Working Papers of the Finnish Forest Research Institute 235 http://www.metla.fi/julkaisut/workingpapers/2012/mwp235.htm
31
Appendix 1: Model descriptions 1.01–1.11 for the parametric Vietnamese predictors.
Appendix 1 Appendix 1Parametric presentation:
Form factors
Stem volume
Dry mass of bark
Height increment by productivity classes I–III
Stand density
Stand density after thinning
[1.04.3]
[1.04.4]
[1.04.5]
2588.1 147 −×= T [1.04.6]
2434.1 167 −×= T [1.04.7]
0763.1 125 −×= T [1.04.8]
[1.04.9]
StN
4
210
=
2
654
32
21.3
4
1.3113.3051.3145.5541.3158.725
1.3136.2171.3111.72531.313.0174
0.49954
10
−×−
−×−
−×
−
−×+
−×−
−×
×××××= −
hhh
hhH
hdV π
2
654
32
21.3
4
1.31−21439.1.3133.47011.319041.44
1.314446.281.314335.91.312.722
0.436410
×−
−×+
−×
−
−×+
−×−
−×
×××××= −
hhh
hhh
hdV , π
barkK 0.41676 + -0.014471 VP ×=
[1.04.1]
[1.04.2]
0.49950.1 =f
0.436=
StCA
N =2
∧
∧
∧
Ph, I∧
Ph, II∧
Ph, III∧
[1.04.10]
f ’0.1

Working Papers of the Finnish Forest Research Institute 235 http://www.metla.fi/julkaisut/workingpapers/2012/mwp235.htm
32
Appendix 1: Model descriptions 1.01–1.11 for the parametric Vietnamese predictors.
Appendix 1Height/diameter -relationship
Percentage of dry bark with respect to quality classes 1, 2 and 3
Dry mass of bark before thinning
Forest stand volume
where
1128.13.1 7411.0 hd ×=
%(100%Pk1 +−=
43.1
33.1
23.11.3 006507.02678.0735.2141.6% dddd ×+×−×+×+−=
) 2258.0(1.3305.355% de ×−×=
104
2
14.90871899.07617.0hd
h×
×+×+−=
vNV ×=
= form factor with bark;= form factor without bark;
V = total stem volume over-bark, dm3;V ’ = total stem volume under-bark, dm3;PK = dry mass of bark, kg;Vbark = V–V’, dm3;Ph, I – Ph, III = height increment by productivity classes I (h = 10–12 m), II (h = 8–10 m)
and III ( h = 6–8 m), %;T = stand age, yrs;St = average crown area of trees with good growth ability which may be
maintained after thinning, m2;CA = crown area, m2 ha-1 (Note: when a value of 7850 is set for CA, the forest
canopy is predominantly closed, i.e. most crowns touch or overlap.);
d1.3 = diameter at breast height, cm;h = tree height, m;Pk1 % – Pk3 % = Percentage of dry bark with respect to the 1st (thickness of fresh bark
> 5.5 mm), 2nd (thickness of fresh bark from 3.5–5.5 mm), and 3rd (thickness of fresh bark < 3.5 mm) quality class, %;
Pk = dry mass of bark before thinning, kg;V = stand volume, m3 ha-1;N = number of stems, ha-1; andv = volume of the stand mean tree calculated as a function of stand mean
diameter and height by age and productivity classes, respectively, m3.
∧
∧
Pk2 Pk3 % )
Pk2∧
76.71
Pk3∧
Pk∧
∧ ∧
f0.1 f ’0.1
[1.04.11]
[1.04.12]
[1.04.13]
[1.04.14]
[1.04.15]
[1.04.16]
∧ ∧

Working Papers of the Finnish Forest Research Institute 235 http://www.metla.fi/julkaisut/workingpapers/2012/mwp235.htm
33
Appendix 1: Model descriptions 1.01–1.11 for the parametric Vietnamese predictors.
Appendix 1 Appendix 1Model description 1.05
Author: Hinh, V.T.
Name of model/set of models: Growth and yield tables for planted Acacia auriculiformis forests in Vietnam.
Complete reference: Hinh, V.T. 1999. Drawing up the increment and yield tables for Acacia auriculiformis planted in
the whole country. Vietnam Forestry Review 10: 31–33 and 41–43. (In Vietnamese.)
Purpose: Study aimed at: 1) identifying methods for the growth and yield estimation of Acacia auriculiformis in particular and for plantations in general; 2) specifying silvicultural parameters in order to en-hance the productivity of forests planted with the species; and 3) generating tables and supporting information for conducting forest inventory and trading activities.
Tree species:Acacia auriculiformis
Sample size by model(s) and species: Information not available.
Origin of data: Data were collected from the following Provinces: Dong Nai, Quang Nam, Da Nang, Thua Thien Hue, Quang Tri, Hoa Binh, Vinh Phu.
Physiographic applicability: A general growth and yield table applicable to the entire country.
Site, soil and climatic factors: Average air temperature ranges from 23 to 27 degree Celsius, whereas average annual rainfall varies from 1641 to 2867 mm. Inventory parameters were collected from 84 sample plots (area: 1000 m2).
Forest establishment: Planted.
Silvicultural constraints (thinnings, soil preparation, etc.): Information not available.
Short description of models: Only one set for the whole country.
Instructions for application:Table is applicable to the whole country.
Description compiled by:Prof. Vu Tien Hinh

Working Papers of the Finnish Forest Research Institute 235 http://www.metla.fi/julkaisut/workingpapers/2012/mwp235.htm
34
Appendix 1: Model descriptions 1.01–1.11 for the parametric Vietnamese predictors.
Appendix 1Parametric presentation:
Height increment by productivity classes I–IV
Relationship between dominant height and mean height
Volume with bark
Volume without bark
Optimum density of the population
Primary volume (before the 1st thinning)
Volume increment by productivity classes I–IV
7144.1I h, 90.003 −×= TP
7061.1II h, 75.043 −×= TP
6281.1III h, 60.265 −×= TP
7347.1IV h, 82.413 −×= TP
)ln(0144.10.0892)(ln gdom HH ×+=
4
23.1
100.1870.00511-0.03196 hdhV ××+×+=
VV ×+= 0.8993-0.00596'
))ln(4294.18632.10( dom
2HeN ×−=
)ln(5319.0)ln(6412.26.26021)(ln dom NHV ×+×+−=
3633.1I v, 449.273 −×= TP
3374.1II v, 345.653 −×= TP
2983.1III v, 443.731 −×= TP
3582.1IV v, 711.873 −×= TP
∧
∧
∧
∧
∧
∧
∧
∧
∧
∧
∧
∧
[1.05.1]
[1.05.2]
[1.05.3]
[1.05.4]
[1.05.5]
[1.05.6]
[1.05.7]
[1.05.8]
[1.05.9]
[1.05.10]
[1.05.11]
[1.05.12]
[1.05.13]
∧

Working Papers of the Finnish Forest Research Institute 235 http://www.metla.fi/julkaisut/workingpapers/2012/mwp235.htm
35
Appendix 1: Model descriptions 1.01–1.11 for the parametric Vietnamese predictors.
Appendix 1 Appendix 1For each thinning period, remaining volume (V2) is predicted based on volume of the population before thinning (V1) and volume of trees removed in thinning (Vc) as follows:
in which
where:
,c12 VVV −= [1.05.14]
v1cc KVNV ××= [1.05.15]
Ph, I – Ph, IV = height increment by productivity classes I–IV, %;V2 = stand volume after thinning, m3ha-1 ;V1 = stand volume before thinning, m3ha-1;Vc = volume of trees removed in thinning, m3ha-1;Nc = number of trees removed in thinning, ha-1;Kv = ratio of the volume removed in thinning to the total stand
volume before thinning; andPv, I – Pv, IV = volume increment by productivity classes I–IV, %.

Working Papers of the Finnish Forest Research Institute 235 http://www.metla.fi/julkaisut/workingpapers/2012/mwp235.htm
36
Appendix 1: Model descriptions 1.01–1.11 for the parametric Vietnamese predictors.
Appendix 1Model description 1.06
Author: Khoi, N.K.
Name of model/set of models: A model for the estimation of current annual increment of stand volume.
Complete reference: Khoi, N.K. 2002. A mathematical model for forecasting current annual increment of for-
est growing stock. Science and Technology Journal of Agriculture and Rural Development No. 4/2002: 324–325. (In Vietnamese with English summary.)
Purpose: To identify methods for the estimation of current annual increment of stand volume based on a mean-standard tree method without felling.
Tree species: Manglietia conifer
Sample size by model(s) and species: Information not available.
Origin of data: Data were collected from Huu Lung District in Lang Son Province in far northern Vietnam.
Physiographic applicability: Model can be applied to the estimation of current annual volume increment of planted Manglietia stands at ages 2 and 6 years. A stand age parameter must be added to the model for predicting values at each age.
Site, soil and climatic factors: Soil and climate factors were not specified.
Forest establishment: Plantation.
Silvicultural constraints (thinnings, soil preparation, etc.): Information not available.
Short description of models: Separate sets of models for predicting incremental characteristics at ages 2 and 6 years.
Instructions for application:The theory of random function was applied for predicting the current annual increment of a grow-ing stock (ZM) as a function of height (Zh) and diameter (
3.1dZ ) increment. An age factor for the plantations has not been included in the model, thus reducing its direct applicability.
Description compiled by:Dr. Ngo Kim Khoi

Working Papers of the Finnish Forest Research Institute 235 http://www.metla.fi/julkaisut/workingpapers/2012/mwp235.htm
37
Appendix 1: Model descriptions 1.01–1.11 for the parametric Vietnamese predictors.
Appendix 1 Appendix 1Parametric presentation:
Annual volume increment of mean tree (Zv) at age 2 years
Annual volume increment of mean tree (Zv) at age 6 years
Predictor for the mean annual volume increment of the growing stock
40370.1dv 1.3
36178.2 ZZ ×= [1.06.1]
[1.06.2]
vZ ×+= 6395.00001397.0v [1.06.3]
where 1.3dZ , hZ and v are the annual diameter and height increments and volume of the stand
mean tree, respectively.
36070.0dv 1.3
85148.2 ZZ ×= [1.06.4]
[1.06.5]
vZ ×+= 4427.00005800.0v [1.06.6]
vM ZNZ ×= [1.06.7]
where vZ is obtained as a function of hZ and 1.3dZ .
2dhv 1.3
02.5000693.0 ZZZ ××+=
2dhv 1.3
82.6004559.0 ZZZ ××+=
∧
∧
∧
∧
∧
∧
∧ ∧
∧

Working Papers of the Finnish Forest Research Institute 235 http://www.metla.fi/julkaisut/workingpapers/2012/mwp235.htm
38
Appendix 1: Model descriptions 1.01–1.11 for the parametric Vietnamese predictors.
Appendix 1Model description 1.07
Author: Lung, N.N. and Khanh, D.C.
Name of model/set of models: Growth and yield models for Pinus kesiya Royle ex. Gordon plantations in Vietnam.
Complete reference: Lung, N.N. and Khanh, D.C. 1999. Research on growth and yield of plantations – Applied for Pi-
nus kesiya Royle ex. Gordon in Viet Nam. Agricultural Publishing House, Ho Chi Minh City, Vietnam. 207 p. (In Vietnamese with English summary.)
Purpose: The book introduces a methodology for research on growth and yield of plantations of interest to plantation owners, forestry engineers and forestry students who may need to know the growth rules and yield structures, to set up tables in relation to the soil conditions and development status of the plantation, or to control the process of planting, tending, thinning and harvesting activities.
Tree species: Pinus kesiya Royle ex. Gordon.
Sample size by model(s) and species: Information not available.
Origin of data: Central Highlands of Vietnam.
Physiographic applicability: Whole country.
Site, soil and climatic factors: Information not available.
Forest establishment: Plantation.
Silvicultural constraints (thinnings, soil preparation, etc.): Information not available.
Short description of models: Models are available for predicting the relationship between tree height and diameter, tree form characteristics, bark volume and development of stand basal area and volume.
Instructions for application:The methodology is applicable throughout Vietnam.
Description compiled by:Nguyen Ngoc Lung, Dao Cong Khanh

Working Papers of the Finnish Forest Research Institute 235 http://www.metla.fi/julkaisut/workingpapers/2012/mwp235.htm
39
Appendix 1: Model descriptions 1.01–1.11 for the parametric Vietnamese predictors.
Appendix 1 Appendix 1Parametric presentation:
h/d relationship
Tree form with bark
Tree form without bark
Model of bark volume
Stand growth and yield
( )
509.1) 043.0( 3.1188.38 deh ×−−×=
1.0cvcv6
5432cv
/ whichin ,10.242031 + 29.125031 - 33.355881 + 18.004911 - 2.91748 + 1.813614 =
ddxxxxxxk
i
i
ii
iiii
=×××××
131211
10987
6543 0.1(cv)
8.069169 + 49.716578 - 139.230124
+ 231.179585 - 246.797045 + 166.744976 - 59.027878
+ 2.652433 + 11.358699 - 2.646016 +1.096399 =
xxx
xxxx
xxxxf
×××
××××
××××
6
5432ov
9.981109+ 29.893647 - 35.867739 + 20.426489 - 3.954548 + 1.548736 =
i
iiiii
xxxxxk
×××××
131211
10987
65430.1(ov)
7.663272 + 49.728625 - 146.329978 + 255.219308 - 287.408973 + 208.852434 - 86.904016
+ 8.409291 + 9.526406 - 0.062257 + 0.799528 =
xxx
xxxx
xxxxf
×××
××××
××××
OVtimberV/VV(OV) ) 0.0205 - (0.7859 = ) - (100 VTVPP ×××=
OVG/VG(OV) ) 0.001385 - (0.7677 = ) - (100 GTGPP ×××=
TG ×+= 0.0031850.7677
TV ×+= 0.002050.7859
∧[1.07.1]
[1.07.2]
[1.07.3]
[1.07.4]
[1.07.5]
[1.07.6]
[1.07.7]
[1.07.8]
[1.07.9]

Working Papers of the Finnish Forest Research Institute 235 http://www.metla.fi/julkaisut/workingpapers/2012/mwp235.htm
40
Appendix 1: Model descriptions 1.01–1.11 for the parametric Vietnamese predictors.
Appendix 1where:
d1.3 = diameter at breast height, cm; h = tree height, m;
ik cv = ratio between over -bark diameter at the relative height of 10, 20, 30,...,
90 or 100 % ( id cv , i = 0.1, 0.2,..., 0.9 or 1.0) and over-bark diameter at
the relative height of 10 % ( 1.0cvd ); xi = 1-hi/h , in which hi is the height of tree at the relative height of 10, 20,
30,..., 90 or 100 % (at the stump height hi = 0 and xi = 1, and at the tip of tree xi = 0);
f0.1(cv) = Hohen ald’s form factor with bark; kov = ratio between under -bark diameter at the relative height of 10, 20,
30,..., 90 or 100 % ( id cv , i = 0.1, 0.2,..., 0.9 or 1.0) and under-bark
diameter at the relative height of 10 % ( 1.0cvd );f0.1( ov) = Hohenadl’s form factor without bark ; PV(OV) = productivity growth in the volume, %; PV/V = productivity growth by volume, %; V timber = timber yield, m3 ha-1 T = stand age, years; VOV = volume (without bark), m3 ha-1 ;PG(OV) = growth rate of basal area (without bark), %; PG/V = growth rate of basal area by volume, %; G = stand basal area, m2 ha-1;POV = growth rate, %; and V = total stand volume, m3 ha-1.
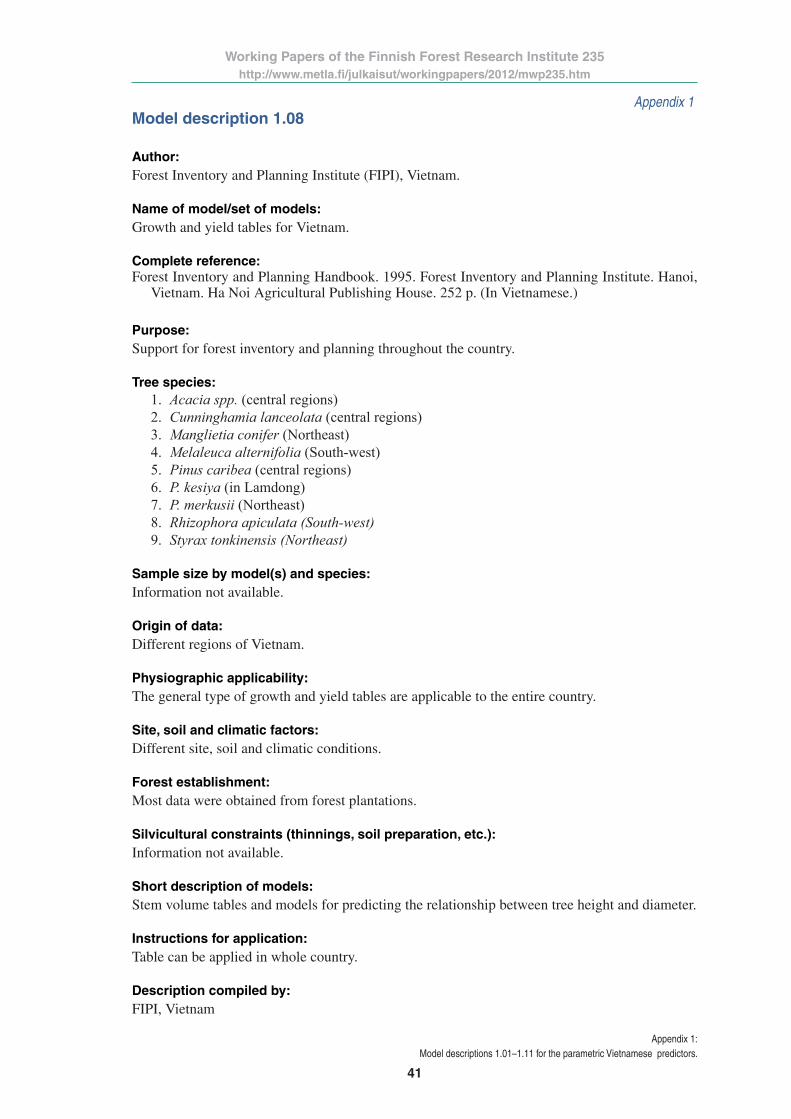
Working Papers of the Finnish Forest Research Institute 235 http://www.metla.fi/julkaisut/workingpapers/2012/mwp235.htm
41
Appendix 1: Model descriptions 1.01–1.11 for the parametric Vietnamese predictors.
Appendix 1 Appendix 1Model description 1.08
Author: Forest Inventory and Planning Institute (FIPI), Vietnam.
Name of model/set of models: Growth and yield tables for Vietnam.
Complete reference: Forest Inventory and Planning Handbook. 1995. Forest Inventory and Planning Institute. Hanoi,
Vietnam. Ha Noi Agricultural Publishing House. 252 p. (In Vietnamese.)
Purpose: Support for forest inventory and planning throughout the country.
Tree species: 1. Acacia spp. (central regions)2. Cunninghamia lanceolata (central regions)3. Manglietia conifer (Northeast)4. Melaleuca alternifolia (South-west)5. Pinus caribea (central regions)6. P. kesiya (in Lamdong)7. P. merkusii (Northeast)8. Rhizophora apiculata (South-west)9. Styrax tonkinensis (Northeast)
Sample size by model(s) and species: Information not available.
Origin of data: Different regions of Vietnam.
Physiographic applicability: The general type of growth and yield tables are applicable to the entire country.
Site, soil and climatic factors: Different site, soil and climatic conditions.
Forest establishment: Most data were obtained from forest plantations.
Silvicultural constraints (thinnings, soil preparation, etc.): Information not available.
Short description of models: Stem volume tables and models for predicting the relationship between tree height and diameter.
Instructions for application:Table can be applied in whole country.
Description compiled by:FIPI, Vietnam

Working Papers of the Finnish Forest Research Institute 235 http://www.metla.fi/julkaisut/workingpapers/2012/mwp235.htm
42
Appendix 1: Model descriptions 1.01–1.11 for the parametric Vietnamese predictors.
Appendix 1Parametric presentation:Stem volumes were tabulated as a function of diameter at breast height and total tree height.
Parameters specific to species or species groups are available for the general, linear height model of the form:
where:
h = tree height, m;d1.3 = diameter at breast height, cm; anda, b = estimated model parameters.
ln(×b +a = ) 1.3dhln(∧
), [1.09.3]

Working Papers of the Finnish Forest Research Institute 235 http://www.metla.fi/julkaisut/workingpapers/2012/mwp235.htm
43
Appendix 1: Model descriptions 1.01–1.11 for the parametric Vietnamese predictors.
Appendix 1 Appendix 1Model description 1.09
Author: Huy, B.
Name of model/set of models: Yield table for Canarium album Raeusch in the Provinces of Lang Son, Bac Giang and Quang Ninh.
Complete reference: Huy, B. 2008. Yield table of the Canarium album. Vietnamese-German cooperation project. Min-
istry of Agriculture and Rural Development (MARD) of Vietnam. 71 p. (In Vietnamese.)
Purpose: Support for plantation management.
Tree species: Canarium album Raeusch
Sample size by model(s) and species: See Table 1.09.1.
Table 1.09.1. Sample size by Provinces and Districts.
Province District Number of
Sample plots Trees
Lang Son Cao Loc 2 10
Loc Binh 1 5
Dinh Lap 6 30
Chi Lang 11 55
Subtotal 20 100
Bac Giang Luc Nam 10 50
Luc Ngan 17 85
Son Dong I 16 80
Son Dong II 10 50
Subtotal 53 265
Quang Ninh Dong Trieu – –
Tien Yen – –
Total 73 365
Origin of data: Data were collected from 10 districts in the Provinces of Lang Son, Bac Giang, and Quang Ninh.

Working Papers of the Finnish Forest Research Institute 235 http://www.metla.fi/julkaisut/workingpapers/2012/mwp235.htm
44
Appendix 1: Model descriptions 1.01–1.11 for the parametric Vietnamese predictors.
Appendix 1Physiographic applicability: Yield table was created particularly for farmers, officials and forest managers. In addition, a soft-ware program was developed for supporting the management and productivity monitoring proce-dures of forest plantations.
Site, soil and climatic factors: Factors indicated include: soil type, topography conditions, climate, slope, compartment position, aspect, vegetation condition, growth condition and maintaining techniques, etc.
Forest establishment: Plantation.
Silvicultural constraints (thinnings, soil preparation, etc.): Information not available.
Short description of models: Models are available for predicting the development of different stand growth and yield charac-teristics.
Instructions for application:Yield tables can be applied in all Districts in the Provinces of Lang Son, Bac Giang, and Quang Ninh.
Description compiled by:Prof. Bao Huy, Dr. Dao Cong Khanh, and SFMI
Parametric presentation:
Dominant height
Hdo is mean of dominant height (identified from 20% of highest trees in the population) (m)
Volume increment
The ages for optimum productivity and quantity mature obtained by three production levels (CNS) in Equation (1.09.2) are determined as specified in Table 1.09.2.
Table 1.09.2. Ages for optimum productivity and quantity mature obtained by three production levels (CNS) (see Equation 1.09.2).
Production level (CNS) Age of optimum productivity Age of quantity mature
1 6 13
2 10 22
3 14 29
-0.15dom × 7.72465 - 7.38861 = )(ln TH [1.09.1]
-0.7bq ××8.80581 - 1.97024- = )(log TCNSV [1.09.2]
∧
∧
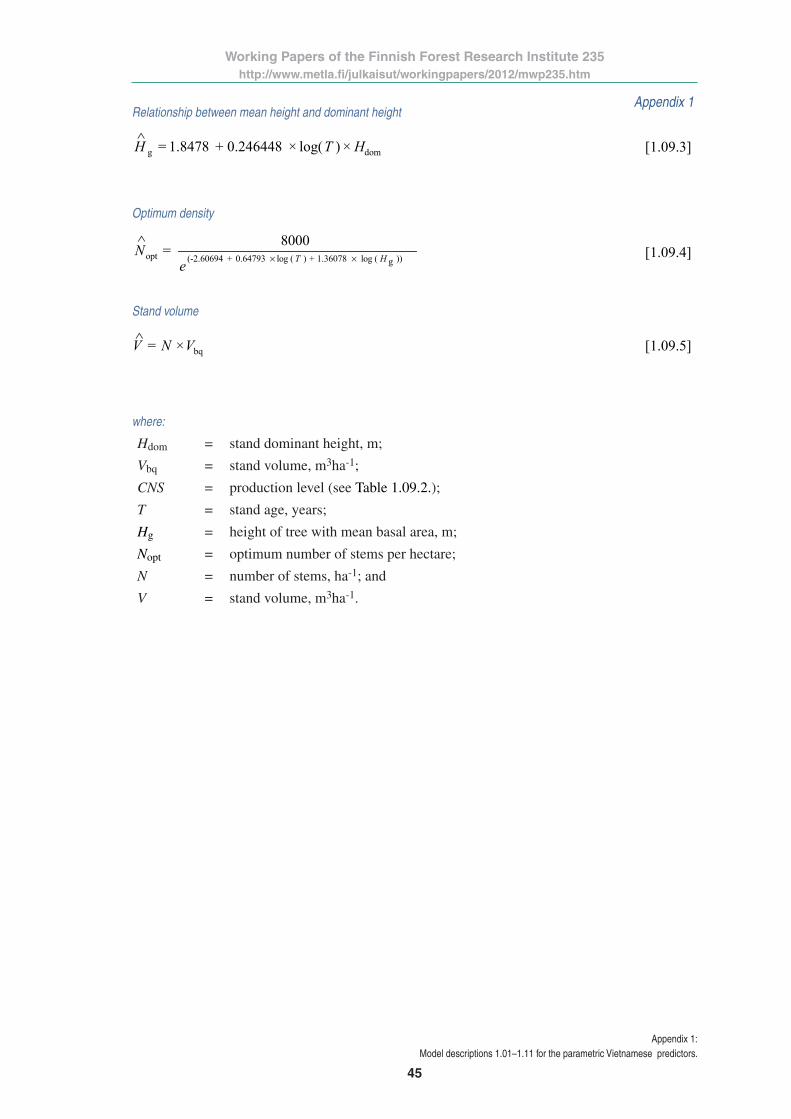
Working Papers of the Finnish Forest Research Institute 235 http://www.metla.fi/julkaisut/workingpapers/2012/mwp235.htm
45
Appendix 1: Model descriptions 1.01–1.11 for the parametric Vietnamese predictors.
Appendix 1 Appendix 1Relationship between mean height and dominant height
Optimum density
Stand volume
where:
Hdom = stand dominant height, m;
Vbq = stand volume, m3ha-1;
CNS = production level (see Table 1.09.2.);
T = stand age, years;
Hg = height of tree with mean basal area, m;
Nopt = optimum number of stems per hectare;
N = number of stems, ha-1; and
V = stand volume, m3ha-1.
domg × )log(×0.246448 + 1.8478 = HTH [1.09.3]
))log (1.36078 + )log (0.64793 + (-2.60694opt g
8000 =
HTeN
×× [1.09.4]
bq× = VNV [1.09.5]
∧
∧
∧

Working Papers of the Finnish Forest Research Institute 235 http://www.metla.fi/julkaisut/workingpapers/2012/mwp235.htm
46
Appendix 1: Model descriptions 1.01–1.11 for the parametric Vietnamese predictors.
Appendix 1Model description 1.10
Author: Phuong, V.T.
Name of model/set of models: Models for predicting carbon content in stem, branch, leaf, above-ground, root (below-ground), and total biomass.
Complete reference: Phuong, V.T. 2009. Forest valuation in Vietnam. Science and Technology Publishing House, Ha-
noi, Vietnam. 177 p.
Purpose: To provide a scientific basis for building drawing up forest valuation legislation and policies in order to determine price levels for forest biomass and to promote economic transactions and sus-tainable forest management in Vietnam.
Tree species:
• Acacia mangium × Acacia auriculiformis (local name: Keo lai), data set comprised 44 sam-ple trees measured at age 2 to 6 years;
• Acacia mangium Wild (Keo tai tuong), data set comprised 33 sample trees measured at age 3 to 10 years;
• Eucalyptus urophylla S.T.Blake (local name: Bach dan urophylla), data set comprised 34 sample trees measured at age 2 to 6 years;
• Pinus masoniana Lamb (local name: Thong ma vi), Data set comprised 26 sample trees measured at age 6, 9, 19 and 26 years; and
• Pinus merkusii Jungh.et.de Vries (local name: Thong nhua), Data set comprised 26 sample trees measured at age 5, 10, 14, 19, 24 and 29 years.
Sample size by model(s) and species: Sample size is given above.
Origin of data: Data were collected from the Provinces of Phu Tho, Bac Giang, Thanh Hoa, Thua Thien Hue, Quang Tri, Binh Dinh, Dong Nai, Gia Lai.
Physiographic applicability: Entire country.
Site, soil and climatic factors: Key factors specified include soil type, topography, climate and forest type.
Forest establishment: Plantation.
Silvicultural constraints (thinnings, soil preparation, etc.): Information not available.

Working Papers of the Finnish Forest Research Institute 235 http://www.metla.fi/julkaisut/workingpapers/2012/mwp235.htm
47
Appendix 1: Model descriptions 1.01–1.11 for the parametric Vietnamese predictors.
Appendix 1 Appendix 1Short description of models:
Models are available for predicting variables as follows:
• carbon stock in stem biomass (CSt);• carbon stock in branch biomass (CSc); • carbon stock in leaf biomass (CSl);• carbon stock in above-ground biomass (CStmd);• carbon stock in below-ground root biomass (CSr); and• carbon stock in total biomass (CS).
Instructions for application:Models are applicable throughout the country.
Description compiled by:Vu Tan Phuong
Parametric presentation:Dependent variables (y) modelled were carbon stocks in stem biomass (CSt), branch biomass (CSc), leaf biomass (CSl), above-ground biomass (CStmd), root biomass (below-ground biomass, CSr), and total biomass (CS). The model form was as follows:
where d1.3 is diameter at breast height (cm), and a and b are estimated parameters specific to the dependent variable and species, respectively (see Tables 1.10.1–1.10.6).
Table 1.10.1. Estimates of the model for carbon stock in stem biomass (CSt).
Species Region Estimates for parameters R2
a p-value b p-value
A. mangium × A. auriculiformis
North 0.057 <0.01 2.413 <0.01 0.949
Central 0.030 <0.01 2.467 <0.01 0.925
South 0.003 <0.01 3.489 <0.01 0.978
A. mangium – 0.018 <0.01 2.700 <0.01 0.972
E. urophylla – 0.014 <0.01 2.908 <0.01 0.962
P. masoniana – 0.006 <0.01 2.922 <0.01 0.986
P. merkusii – 0.007 <0.01 2.860 <0.01 0.972
y = a × d1 .3b ,
[1.10.1]
∧

Working Papers of the Finnish Forest Research Institute 235 http://www.metla.fi/julkaisut/workingpapers/2012/mwp235.htm
48
Appendix 1: Model descriptions 1.01–1.11 for the parametric Vietnamese predictors.
Appendix 1
Table 1.10.2. Estimates of the model for carbon stock in branch biomass (CSc).
Species Region Estimates for parameters R2
a p-value b p-value
A.mangium × A. auriculiformis
North 0.155 0.21 1.436 0.02 0.557
Central 0.018 <0.01 2.178 <0.01 0.903
South 0.073 0.18 1.606 0.054 0.625
A. mangium – 0.087 <0.01 1.523 <0.01 0.821
E. urophylla – 0.029 <0.01 2.068 <0.01 0.879
P. masoniana – 0.044 <0.01 1.841 <0.01 0.902
P. merkusii – 0.0016 <0.01 2.921 <0.01 0.922
Table 1.10.3. Estimates of the model for carbon stock in leaf biomass (CSl).
Species Region Estimates for parameters R2
a p-value b p-value
A.mangium ×A. auriculiformis(*
North 0.017 <0.01 1.995 <0.01 0.822
Central 0.039 <0.01 1.681 <0.01 0.869
South 4.325 0.29 -0.382 0.49 0.248
A. mangium – 0.126 <0.01 1.114 <0.01 0.737
E. urophylla – 0.093 <0.01 1.174 <0.01 0.812
P. masoniana – 0.146 <0.01 1.026 <0.01 0.673
P. merkusii – 0.017 <0.01 1.876 <0.01 0.786
(*Estimates of parameters a and b of Equation 1 specific to A.mangium × A. Auriculiformis and obtained for data comprising the three regions are 0.031 and 1.78, respectively (R2 = 0.850).
Table 1.10.4. Estimates of the model for carbon stock in above-ground biomass (CStmd).
Species Region Estimates for parameters R2
a p-value b p-value
A.mangium × A. auriculiformis(*
North 0.123 <0.01 2.229 <0.01 0.940
Central 0.070 <0.01 2.293 <0.01 0.934
South 0.045 <0.01 2.551 <0.01 0.954
A. mangium – 0.064 <0.01 2.336 <0.01 0.963
E. urophylla – 0.036 <0.01 2.601 <0.01 0.962
P. masoniana – 0.035 <0.01 2.473 <0.01 0.988
P. merkusii – 0.017 <0.01 2.799 <0.01 0.974
(* Estimates of parameters a and b of Equation 1 specific to A.mangium × A. Auriculiformis and obtained for data comprising the three regions are 0.078 and 2.32, respectively (R2 = 0.943).

Working Papers of the Finnish Forest Research Institute 235 http://www.metla.fi/julkaisut/workingpapers/2012/mwp235.htm
49
Appendix 1: Model descriptions 1.01–1.11 for the parametric Vietnamese predictors.
Appendix 1 Appendix 1
Table 1.10.5. Estimates of the model for carbon stock in root biomass (below-ground biomass, CSr).
Species Region Estimates for parameters R2
a p-value b p-value
A.mangium × A. auriculiformis(*
North 0.027 <0.01 2.170 <0.01 0.766
Central 0.015 <0.01 2.294 <0.01 0.935
South 0.027 <0.01 2.066 <0.01 0.941
A. mangium – 0.021 <0.01 2.391 <0.01 0.942
E. urophylla – 0.034 <0.01 1.968 <0.01 0.921
P. masoniana – 0.013 <0.01 2.188 <0.01 0.968
P. merkusii – 0.001 <0.01 3.196 <0.01 0.930
(* Estimates of parameters a and b of Equation 1 specific to A.mangium × A. Auriculiformis and obtained for data comprising the three regions are 0.0197 and 2.19, respectively (R2 = 0.880).
Table 1.10.6. Estimates of the model for carbon stock in total biomass (CS).
Species Region Estimates for parameters R2
a p-value b p-value
A.mangium × A. auriculiformis(*
North 0.150 <0.01 2.222 <0.01 0.930
Central 0.085 <0.01 2.296 <0.01 0.937
South 0.065 <0.01 2.472 <0.01 0.957
A. mangium – 0.338 <0.01 1.765 <0.01 0.916
E. urophylla – 0.059 <0.01 2.481 <0.01 0.963
P. masoniana – 0.046 <0.01 2.427 <0.01 0.988
P. merkusii – 0.017 <0.01 2.852 <0.01 0.971
(* Estimates of parameters a and b of Equation 1 specific to A.mangium × A. Auriculiformis and obtained for data comprising the three regions are 0.095 and 2.31, respectively (R2 = 0.941).

Working Papers of the Finnish Forest Research Institute 235 http://www.metla.fi/julkaisut/workingpapers/2012/mwp235.htm
50
Appendix 1: Model descriptions 1.01–1.11 for the parametric Vietnamese predictors.
Appendix 1Model description 1.11
Author: Huy, B.
Name of model/set of models: Predictor for CO2 sequestration in Litsea glutinosa in Litsea - Cassava agro-forestry system in Mang Yang District of Gia Lai Province in the Central Highlands of Vietnam.
Complete reference: Huy, B. 2009. CO2 sequestration estimation for the Litsea glutinosa in Litsea - Cassava agro-
forestry model in Mang Yang district, Gia Lai province in the Central Highlands of Vietnam. Research sponsored by the Swedish International Development Cooperation Agency (SIDA) through the World Agroforestry Center (ICRAF) and Southeast Asian Network for Agrofor-estry Education (SEANAFE). 44 p.
Purpose:To provide a database and information for predicting rates of carbon sequestration in the context of an agroforestry system.
Tree species: 1. Litsea glutinosa from age 1 to age 7 (from period 1 (seed) to periods 2 and 3 (shoots); Den-
sity: from 500 to 2000 trees/ha; Number of shoots/stump in periods 2 and 3 varies from 1 to 5 shoots).
2. Cassava (Manihot esculenta Crantx) was intercropped between every second row of Litsea trees. The cover rate of cassava was modified according to the density and age of Litsea trees. Where Litsea trees had been planted at low density and had a young age, the cover of cassava was denser. The cassava cover varied from 15 to 80% of the total area in the agro-forestry system.
Origin of data: Data were collected from 22 circular Haga plots the area of which was 300 m2 and established in different ratios based on the age of stand (1–7 years). Three cycles were implemented, involving seed or coppicing from shoots. When cassava is used for land cover, its coverage ranges from 15 to 80% depending on the age and density of Litsea trees.
Physiographic applicability: Results can be applied to a limited extent in the Central Highlands of Vietnam.
Site, soil and climatic factors: Factors reported were as follows: vegetation cover percentage, soil colour, depth of soil layer, soil pH, position, slope and aspect.
Forest establishment: Agro-forestry system with planted trees.
Silvicultural constraints (thinnings, soil preparation, etc.): Information not available.
Short description of models: Growth and yield models for different stand-level characteristics.

Working Papers of the Finnish Forest Research Institute 235 http://www.metla.fi/julkaisut/workingpapers/2012/mwp235.htm
51
Appendix 1: Model descriptions 1.01–1.11 for the parametric Vietnamese predictors.
Appendix 1 Appendix 1Instructions for application:Models can be applied to villages in the Yang Mang District of Gia Lai Province in the Central Highlands Region.
Description compiled by:Prof. Bao Huy
Parametric presentation:
See Tables 1.8–1.11 in Huy (2009).
Yield models for agroforestry system
Fresh biomass
-0.5g × 3.03621 - 3.0356 = )(ln TD [1.11.1]
-0.2g × 3.48973 - 3.88083 = )( TH [1.11.2]
-0.001 × 1646 - 1638.28 = )( TV [1.11.3]
ln( ×1.77111 + 8.0519- = )( Dg)V [1.11.4]
ln( ×0.852795+ln( × 1.48519 + 8.51825- = )( Dg)Hg)V [1.11.5]
ln( × 1.67159 + 1.34349- = )( fresh/stem Dg)W [1.11.6]
ln( × 1.80529 + 2.30494- = )( fresh/bark Dg)W [1.11.7]
ln( × 1.1055 + 0.944707- = )( fresh/leaf Dg)W [1.11.8]
ln( × 1.46917 + 1.69105- = )( fresh/branch Dg)W [1.11.9]
ln( × 1.47477 + 0.0600462 - = )( fresh/total Dg)W
ln
∧
ln
∧
∧
∧
∧
ln
ln
ln
ln
∧
ln
∧
∧
∧
∧
ln
ln [1.11.10]

Working Papers of the Finnish Forest Research Institute 235 http://www.metla.fi/julkaisut/workingpapers/2012/mwp235.htm
52
Appendix 1: Model descriptions 1.01–1.11 for the parametric Vietnamese predictors.
Appendix 1Dry biomass by tree components
Mean predictors for carbon content (%) in biomass (kg)
• stem: 47.7 %;
• bark: 45.4 %;
• leaves: 48.7 %; and
• branches 47.6 %.
Carbon content at stand-level by tree component
where:
ln( × 1.81765 + 2.31337- = )( dry/stemW
ln( × 1.94248 + 3.68511- = )( dry/barkW
ln( × 1.19235 + 2.02567- = )( dry/leafW
ln( × 1.59805 + 2.85803- = )( dry/branchW
ln( × 1.60676 + 1.16425- = )( dry/totalW
ln( × 1.8237 + 3.05514- = )( stem Dg)C
ln( × 1.93655 + 4.45754- = )( bark Dg)C
ln( × 1.19657 + 2.74975- = )( leaf Dg)C
ln( ×1.59554 + 3.59605- = )( branch Dg)C
ln( × 1.60612 + 1.90151- = )( total Dg)C
Dg = stand mean diameter, cm;Hg = mean height, m;V = stand volume, m3 ha-1;T = stand age, years;W = biomass, kg; andC = carbon content of the tree stem biomass, kg.
ln
ln
∧
ln
∧
∧
∧
∧
ln
ln
ln
ln
∧
ln
∧
∧
∧
∧
ln
ln
Dg)
Dg)
Dg)
Dg)
Dg)
[1.11.16]
[1.11.17]
[1.11.18]
[1.11.19]
[1.11.20]
[1.11.12]
[1.11.13]
[1.11.14]
[1.11.15]
[1.11.11]

Working Papers of the Finnish Forest Research Institute 235 http://www.metla.fi/julkaisut/workingpapers/2012/mwp235.htm
53
Appendix 2: Model descriptions 2.01–2.09 for the parametric Nepalese predictors.
Appendix 2Appendix 1Model description 2.01
Author: Sharma, E.R. and Pukkala, T.
Name of model/set of models: Volume equations and biomass prediction system for 21 tree species and 2 species groups com-mon to Nepal.
Complete reference: Sharma, E.R. and Pukkala, T. 1990. Volume equations and biomass prediction of forest trees of
Nepal. Forest Survey and Statistics Division, Ministry of Forests and Soil Conservation. Babar Mahal, Kathmandu, Nepal. Publication 47. 16 p.
Purpose: To present models for predicting total and merchantable stem volumes (volumes to the top diam-eters of 10 cm and 20 cm, respectively) with and without bark. Calculation formula to convert biomass of branches and foliage from the stem biomass obtained from the species-specific mean wood density estimates and ratio allocators for small (s), medium (m) and big (b) sized trees is also given (Master plan for... 1988). The volume and biomass tables obtained using models by Sharma and Pukkala (1991) were published in a separate report of the Forest Survey and Statistics Division, Nepal (Sharma and Pukkala 1990b).
Tree species: See Table 2.01.1.
Origin of data: Data collected from different parts of Nepal in the 1960s.
Sample size by model(s) and species:See Table 2.01.1.
Physiographic applicability: Terai and Hill areas mainly.
Site, soil and climatic factors: Data represents varying site, soil and climatic conditions. When collecting data, attempts were made to measure trees from a variety of stands, including poor and good sites.
Forest establishment: Not explicitly specified.
Silvicultural constraints (thinnings, soil preparation, etc.): Not specified.
Short description of models: Models for predicting total stem volume over bark, merchantable over-bark stem volumes to the top diameters of 10 cm and 20 cm, respectively, and bark proportions for total stem length and for the small- and large-sized timber portions of the stem.

Working Papers of the Finnish Forest Research Institute 235 http://www.metla.fi/julkaisut/workingpapers/2012/mwp235.htm
54
Appendix 2: Model descriptions 2.01–2.09 for the parametric Nepalese predictors.
Appendix 2
Table 2.01.1. Numbers of observations used for modelling volume equations and predicting biomass of ma-jor tree species in Nepal by Sharma and Pukkala (1990).
Species (Local name in parentheses) Number of observations per equation Wood density(*
2.01.1 2.01.2 2.01.3 2.01.4 2.01.5 kg/m3
Abies pindrow (Fir) 148 148 102 148 148 480
Acacia catechu (Khair) 270 270 157 194 270 960
Adina cordifolia (Karma) 229 227 196 153 227 670
Albizzia spp. (Sisris) 112 112 96 61 112 673
Alnus nepalensis (Utis) 163 163 107 163 163 390
Anogeissus latifolia (Banjhi) 123 123 81 123 123 880
Bombax malabaricum 221 214 192 122 214 368
Cedrela toona (Toon) 139 137 107 83 137 480
Dalbergia sissoo (Sissoo) 266 266 230 167 223 780
Eugenia jambolana (Jamun) 142 139 122 86 138 770
Hymanodictyon excelsum (Bhurkul) 125 122 102 76 122 513
Lagerstroemia parviflora (Botdhairo) 192 191 145 143 191 850
Michelia champaca (Champ) 113 111 103 78 111 497
Pinus roxburghii (Chir Pine) 612 610 529 612 610 650
Pinus wallichiana (Blue Pine) 340 340 279 265 340 400
Quercus spp. (Oak) 152 152 132 152 152 860
Schima wallichii (Chilaune) 47 47 47 47 47 689
Shorea robusta (Sal) 895 888 758 895 888 880
Terminalia tomentosa (Asna) 492 492 400 492 492 950
Trewia nudiflora (Gutel) 98 98 82 49 98 452
Tsuga spp. (Hemlock) 94 94 80 94 94 450
Miscellaneous groups of tree species in Terai 109 109 88 109 109 –
Miscellaneous groups of tree species in Hills 138 138 88 138 138 –
(* For the reference see Master plan for... (1988).
Instructions for application: General applicability regarding the whole country is not proven.
Description compiled by: Kalle Eerikäinen

Working Papers of the Finnish Forest Research Institute 235 http://www.metla.fi/julkaisut/workingpapers/2012/mwp235.htm
55
Appendix 2: Model descriptions 2.01–2.09 for the parametric Nepalese predictors.
Appendix 2 Appendix 2Parametric presentation:
where:
)ln(×c+)ln(×b+a=)ln( 1.3tot hdv [2.01.1]
)ln(×ba=)/ 1.3tottd10-td0 dvv + [2.01.2]
)ln(×ba=)/ 1.30timber/td1td20-td10 dvv +[2.01.3]
)ln(×b+a=) 1.3vtotb dp[2.01.4]
)ln(×b+a=) 1.3td10b dp[2.01.5]
)ln(×b+a=) 1.3td20b dp[2.01.6]
vtot = total stem volume over bark, dm3;d1.3 = diameter at breast height, cm; h = total tree height, m;vtd0-td10 = over-bark volume of section between the tip of tree and top diameter of 10 cm, dm3;vtd10-td20 = over-bark volume of section between the top diameters of 10 and 20 cm, dm3;vtimber/td10 = over-bark timber volume of stem up to the 10 cm top diameter, dm3, obtained with
equations 2.01.1 and 2.01.2;vtotbp = proportion of bark in the whole stem;td10bp = proportion of bark in the stem section from stump to 10 cm top diameter;
td20bp = proportion of bark in the stem section from stump to 20 cm top diameter; anda, b and c = estimated model parameters.
∧
ln(∧
ln(∧
ln(∧
ln(∧
ln(∧

Working Papers of the Finnish Forest Research Institute 235 http://www.metla.fi/julkaisut/workingpapers/2012/mwp235.htm
56
Appendix 2: Model descriptions 2.01–2.09 for the parametric Nepalese predictors.
Appendix 2Model description 2.02
Author(s): Acharya, K.P. and Acharya, B.
Name of model/set of models: Models for predicting green weights of different components of Natural Sal (Shorea robusta) trees in Central Nepal.
Complete reference: Acharya, K.P. and Acharya, B. 2004. Early growth performance of natural Sal (Shorea robusta)
forest in Central Nepal. Department of Forest Research and Survey, Ministry of Forests and Soil Conservation, Kathmandu, Nepal. 8 p.
Purpose: To study natural regeneration potential and growth of Sal forests.
Tree species: Shorea robusta (Sal)
Sample size by model(s) and species: Information not available.
Origin of data:Sunachari village, Manahari Makwan Pur, Central Region of Nepal.
Physiographic applicability: The data were recorded from inner Terai, Manahara district.
Site, soil and climatic factors:The soil is sandy loam with gravel and Ph ranging from 5.2 to 5.9. The climate is subtropical with regular monsoon during the period from June to August.
Forest establishment: Natural forest in climax succession.
Silvicultural constraints (thinnings, soil preparation, etc.): Four different regeneration felling treatments having each an area of one hectare. Treatment no. 1: Control plot Treatment no. 2: Retaining 25 mother trees/ha Treatment no. 3: Retaining 75 mother trees/ha Treatment no. 4: Retaining 0 mother trees/ha
Short description of models: Tree-level biomass models for Sal.
Instructions for application: Only local biomass tables based on the data from Manahari Makwan Pur are obtainable.
Description compiled by: Ram A. Mandal, Him L. Shrestha and Bechu Yadav
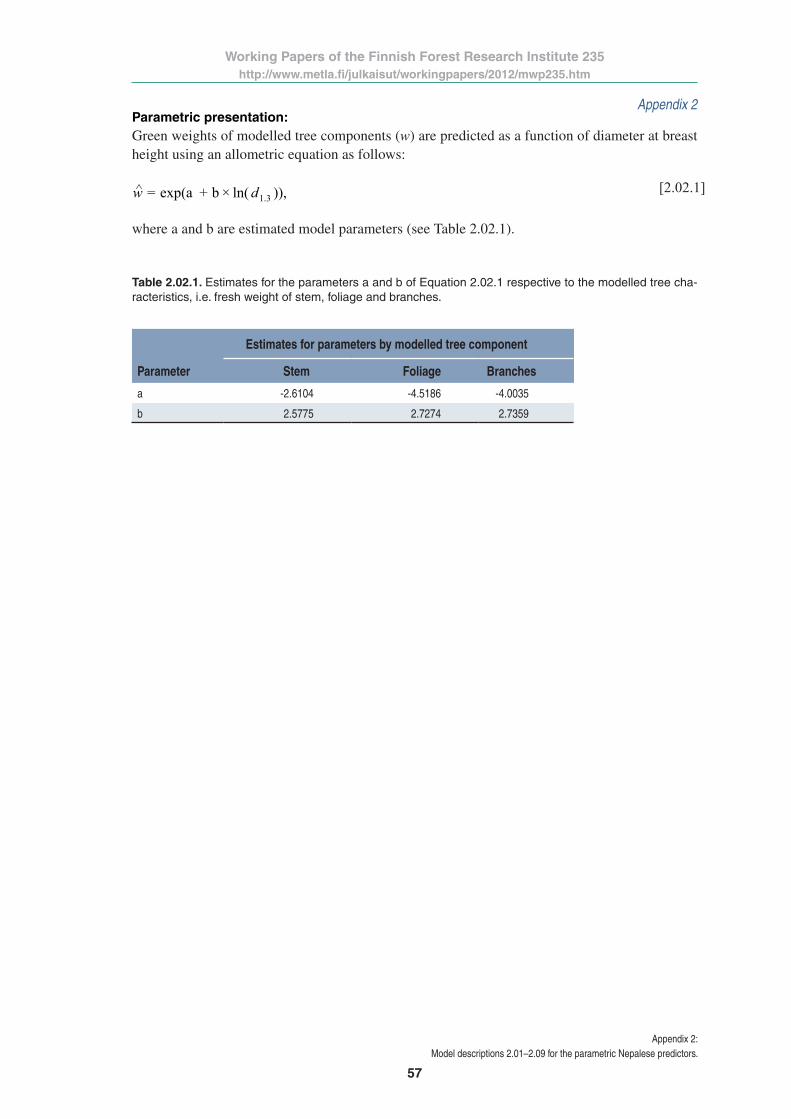
Working Papers of the Finnish Forest Research Institute 235 http://www.metla.fi/julkaisut/workingpapers/2012/mwp235.htm
57
Appendix 2: Model descriptions 2.01–2.09 for the parametric Nepalese predictors.
Appendix 2 Appendix 2Parametric presentation: Green weights of modelled tree components (w) are predicted as a function of diameter at breast height using an allometric equation as follows:
where a and b are estimated model parameters (see Table 2.02.1).
Table 2.02.1. Estimates for the parameters a and b of Equation 2.02.1 respective to the modelled tree cha-racteristics, i.e. fresh weight of stem, foliage and branches.
Estimates for parameters by modelled tree component
Parameter Stem Foliage Branches
a -2.6104 -4.5186 -4.0035
b 2.5775 2.7274 2.7359
)),ln(×b+exp(a= 1.3dw [2.02.1]∧

Working Papers of the Finnish Forest Research Institute 235 http://www.metla.fi/julkaisut/workingpapers/2012/mwp235.htm
58
Appendix 2: Model descriptions 2.01–2.09 for the parametric Nepalese predictors.
Appendix 2Model description 2.03
Author(s): Rautiainen, O.
Name of model/set of models: Models for predicting forest growth and yield for Sal (Shorea robusta) in Bhabar of Terai, Nepal.
Complete reference:Rautiainen, O. 1995. Growth and yield models for uniform sal (Shorea robusta Gaertn. f.) forests
in the Bhabar – Terai in Nepal. Forest Management and Utilization Development Project, HMGN/The Government of Finland. Kathmandu, Nepal. FMUDP Technical Report No. 17. 15 p. + Appendices.
Purpose: Aim was to obtain a prediction system for the forest growth and yield characteristics and to con-struct yield tables by site quality classes.
Tree species:Sal (Shorea robusta)
Sample size by model(s) and species: The cross-sectional data were collected from a total of 37 permanent relascope sample plots es-tablished between 1994 and 1995.
Origin of data: Makwanpur, Manahari; Makwanpur, Hetauda; Rupandehi, Butwal; Kaski, Sisuwa; Bara, Tama-gadhi; Nawalparasi; and Chitwan, Ramnagar.
Physiographic applicability: Bhabar, Terai in Central Nepal.
Site, soil and climatic factors: Tropical and subtropical climates.
Forest establishment: Natural regeneration.
Silvicultural constraints (thinnings, soil preparation, etc.):Models applicable to natural uniform forests developed in almost undisturbed conditions.
Short description of models: Models are available for the following stand characteristics: dominant height, mean stand height weighted by basal area, diameter of tree with mean basal area, diameter weighted by basal area, number of stems, stand basal area, and stand volume.
Instructions for application: Models can be used to predict the development of undisturbed, natural and fully stocked stands. Data used for modelling represents well the young age classes of Sal forests with a less than 20 percent of mix of other tree species. Application of the models is not recommended for stands over 45 years due to insufficient representativeness of the data regarding older age classes.

Working Papers of the Finnish Forest Research Institute 235 http://www.metla.fi/julkaisut/workingpapers/2012/mwp235.htm
59
Appendix 2: Model descriptions 2.01–2.09 for the parametric Nepalese predictors.
Appendix 2 Appendix 2Description compiled by: Kalle Eerikäinen
Parametric presentation:
where:
[2.03.1]
[2.03.2]
[2.03.3]
[2.03.4]
[2.03.5]
[2.03.6]
[2.03.7]
Hdom = stand dominant height, m;T = stand age, years;Hg = mean stand height weighted by basal area, m;DgM = diameter of tree with mean basal area, cm;Dg = diameter weighted by basal area, cm;N = number of stems, ha-1;G = stand basal area, m2 ha-1; andV = stand volume, m3 ha-1.
∧Hdom =
38
1 + 81.941 × T1 .48
Hg = -0.8596 + 0.8854 × Hdom
DgM = 1.34415 + 0.741859 × T - 0.0025 × T2
Dg = 0.7141 + 1.06195 × DgM
ln(N) = 11.17976 + 0.001335 × T + 1.281976 × ln (1/T)
G = π × (DgM/200 )2 ×N
ln(V) = 1.0009655 × ln (G) + 0.724949 × ln (Hg )
∧
∧
∧
∧
∧
∧

Working Papers of the Finnish Forest Research Institute 235 http://www.metla.fi/julkaisut/workingpapers/2012/mwp235.htm
60
Appendix 2: Model descriptions 2.01–2.09 for the parametric Nepalese predictors.
Appendix 2Model description 2.04
Author(s): Rautiainen, O.
Name of model/set of models: Models for predicting forest growth and yield for Sal (Shorea robusta) in Bhabar of Terai, Nepal.
Complete reference:Rautiainen, O. 1999. Spatial yield model for Shorea robusta in Nepal. Forest Ecology and Man-
agement 119: 151–162.
Purpose:To develop a simulation system for examining yield and stand development under selected man-agement programmes.
Tree species: Sal (Shorea robusta)
Sample size by model(s) and species:The data were collected from 29 sample plots of varying density, spatial tree pattern and stand age. The numbers of observations in the modelling data for diameter growth and height-diameter relationship were 580 and 1,336 trees respectively. The stand-level self-thinning model was de-veloped using data from 13 plots.
Origin of data: Bhabar–Terai zone of Nepal (27º–28º N, 83º–85º E, 200–300 m a.s.l.).
Physiographic applicability: Bhabar, Terai in central Nepal.
Site, soil and climatic factors: Tropical and subtropical climates.
Forest establishment: Natural regeneration.
Silvicultural constraints (thinnings, soil preparation, etc.):Models applicable to healthy forests not subject to uncontrolled felling.
Short description of models: Models presented for the following characteristics: individual-tree diameter growth (mixed-ef-fects spatial and non-spatial models), height-diameter relationship (mixed-effects model) and stand-level self-thinning.
Instructions for application: The main application of the spatial diameter increment model (Eqn 2.04.2) is in research on forest growth and yield and forest management planning, whereas the non-spatial model (Eqn 2.04.3) is more useful for practical applications. Due to the clustered, heterogeneous stand structure of Sal forests in the Bhabar-Terai of Nepal, it is expected that the spatial model offers clear advantages compared to the non-spatial model.

Working Papers of the Finnish Forest Research Institute 235 http://www.metla.fi/julkaisut/workingpapers/2012/mwp235.htm
61
Appendix 2: Model descriptions 2.01–2.09 for the parametric Nepalese predictors.
Appendix 2 Appendix 2Description compiled by: Kalle Eerikäinen
Parametric presentation(s):
where:
Nj = stand dominant height, m;Dg j = mean stand diameter weighted by basal area, cm;
dij = diameter at breast height, cm;Tj = stand age, years;hij = tree height, m;Gj = stand basal area, m2 ha-1 ; andCIij = spatial competition index (sum of vertical angles), radian;pj = parameter for random forest stand effects;ej or eij =i = subscript referring to the tree-level of the hierarchical data; andj = subscript referring to the forest stand-level of the hierarchical data.
ln(Nj) = a + b × ln ( D g )j + ej [2.04.1]
idij = a0 + a1 × dij + a2 × dij
Tj + a3 × hij + a4 × Gj + a5 × ln(CIij +1) + pj + eij [2.04.2]
= a0 + a1 × dij
Tj + a2 × ln(hij ) + a3 × Gj + pj + eij [2.04.3]
ln(hij − 1.3) = a0 + a1 × dij
Tj + a2 ×
1dij +3
+ a3 × dij
Tj
+ pj + eij [2.04.4]
√
√
√
random error term specific to model;
idij
ln( )
idij = annual increment in diameter at breast height over-bark, cm.

Working Papers of the Finnish Forest Research Institute 235 http://www.metla.fi/julkaisut/workingpapers/2012/mwp235.htm
62
Appendix 2: Model descriptions 2.01–2.09 for the parametric Nepalese predictors.
Appendix 2Model description 2.05
Author(s): Sarkeala, J. and Tokola, T.
Name of model/set of models: Models for predicting stand volumes for the three major forest types, namely Sal (S), Terai hard-woods (TH) and Sissoo-Khair (SK) in western Terai, Nepal.
Complete reference:Sarkeala, J. and Tokola, T. 1993. Stand volume equations and tables for western Terai. Forest
Survey and Statistics Division, Ministry of Forests and Soil Conservation. Babar Mahal, Kath-mandu. Publication 58. 12 p. + Appendices.
Purpose: To obtain predictors for stand volume for the three major forest types of western Terai, Nepal.
Tree species: Several major and associated tree species identified by each forest type.
Sample size by model(s) and species: The total number of plots per forest type (Sal (S), Terai hardwood (TH) and Sissoo-Khair (SK)) were: 147, 137 and 55, respectively.
Origin of data: Districts of Kapilbastu, Rupandehi and Nawalparasi.
Physiographic applicability: Central and eastern Terai, Nepal.
Site, soil and climatic factors: Tropical and subtropical climates.
Forest establishment: Naturally regenerated forests.
Silvicultural constraints (thinnings, soil preparation, etc.):Models applicable to natural forests.
Short description of models: Logarithmic models for stand volume with district-wise estimated parameters.
Instructions for application: Models can be used to predict the development of undisturbed, naturally fully stocked stands. Data used for modelling represents well the young age classes of Sal forests with a less than 20 percent mix of other tree species. Application of the models is not recommended for stands over 45 years due to insufficient representativeness of the data regarding older age classes.
Description compiled by: Kalle Eerikäinen

Working Papers of the Finnish Forest Research Institute 235 http://www.metla.fi/julkaisut/workingpapers/2012/mwp235.htm
63
Appendix 2: Model descriptions 2.01–2.09 for the parametric Nepalese predictors.
Appendix 2 Appendix 2Parametric presentation:
where:
V = stand volume, m3 ha -1 ;G = stand basal area, m2 ; andHg = mean stand height weighted by basal area, m; anda, b = parameters of the model estimated for the three forest types.
ln(V) = a × ln (G) + b × ln (Hg ) [2.05.1]
∧
ha -1

Working Papers of the Finnish Forest Research Institute 235 http://www.metla.fi/julkaisut/workingpapers/2012/mwp235.htm
64
Appendix 2: Model descriptions 2.01–2.09 for the parametric Nepalese predictors.
Appendix 2Model description 2.06
Author(s): Laamanen, R., Joshi, M.R. and Sharma, S.P.
Name of model/set of models: Biomass and volume models for Sal (Shorea robusta) in Central Terai of Nepal.
Complete reference:Laamanen, R., Joshi, M.R. and Sharma, S.P. 1995. Biomass and volume models for Sal (Shorea
robusta) in the central Terai of Nepal. Forest Resource Information System Project (FRISP), HMGN/FINNIDA, Finnish Forest and Park Service. Kathmandu, Nepal. FRIS Project Paper No. 7. 12 p. + Appendices.
Purpose: To obtain local models for predicting stem biomass and volume of Sal (Shorea robusta) trees grow-ing in Makwapur and Rautahat Districts of the Central Development Region (CDR) in Nepal.
Tree species: Shorea Robusta (Sal).
Sample size by model(s) and species: The data comprised a total of 98 analysis trees.
Origin of data: Data comprised 98 analysis trees of which a total of 54 trees were collected from Makwapur and 44 from Rautahat.
Physiographic applicability: Makwapur and Rautahat districts of the Central Development Region (CDR) in Nepal.
Site, soil and climatic factors: Information not available.
Forest establishment: Information not available.
Silvicultural constraints (thinnings, soil preparation, etc.):Not specified.
Short description of models: Logarithmic models for stem volume, ratio between top volume and total stem volume, small size timber volume and total volume, bark thickness, bark proportion, oven-dry mass of stem with bark, oven-dry mass of stem bark, and fresh mass of branches.
Instructions for application: As instructed by the authors, the models of the study can be used instead of the earlier models to improve the accuracy of volume and biomass calculations of Sal trees and forests in the Central Development Region (CDR) of Nepal.
Description compiled by: Kalle Eerikäinen

Working Papers of the Finnish Forest Research Institute 235 http://www.metla.fi/julkaisut/workingpapers/2012/mwp235.htm
65
Appendix 2: Model descriptions 2.01–2.09 for the parametric Nepalese predictors.
Appendix 2 Appendix 2Parametric presentation(s):
where:
vtot = total stem volume over bark, dm3:d1.3 = diameter at breast height, cm; h = total tree height, m;vtd0-td10 = over-bark volume of section between the tip of tree and top diameter
of 10 cm, dm3;vtd10-td20 = over-bark volume of section between the top diameters of 10 and 20 cm, dm3;vtimber/td10 = over-bark timber volume of stem up to the 10 cm top diameter, dm3, obtained
with equations 2.06.1 and 2.06.2;BT = single bark thickness at the relative stem height, %;hl = height from the ground level to the relative height l, m;
= bark proportion;M = oven-dry mass of stem with bark, kg;BKM = oven-dry mass of stem bark, kg;BM = fresh mass of branches, kg; anda, b and c = estimated parameters of the models.
ln(vtot )= a + b × ln (d1.3 ) + c × ln (h) [2.06.1]
ln(vtd 0 -td 10/vtot ) = a + b × ln (d1.3 ) [2.06.2]
ln(vtd 10 -td 20 / vtimber / td 10)= a + b × ln (d1 .3 ) [2.06.3]
ln(BT )= a + b × ln (d1 .3 ) + c × ln (hl /h × 100 ) [2.06.4]
ln(pb )= a + b × ln (d1 .3) [2.06.5]
ln(M)= a + b × ln (d1 .3) [2.06.6]
ln(M) = a + b × ln (d1 .3 ) + c × ln (h) [2.06.7]
ln(BKM )= a + b × ln (d1 .3 ) + c × ln (h) [2.06.8]
ln(BM ) = a + b × ln (d1 .3 ) [2.06.9]
∧
∧
∧
∧
∧
∧
∧
∧
∧
pb

Working Papers of the Finnish Forest Research Institute 235 http://www.metla.fi/julkaisut/workingpapers/2012/mwp235.htm
66
Appendix 2: Model descriptions 2.01–2.09 for the parametric Nepalese predictors.
Appendix 2Model description 2.07
Author(s): Tamrakar, P.R.
Name of model/set of models: Biomass and volume tables with species description for community forest management.
Complete reference: Tamrakar, P.R. (Ed.). 2000. Biomass and volume tables with species description for community
forest management. His Majesty’s Government of Nepal, Ministry of Forests and Soil Con-servation, Natural Resource Management Sector Assistance Programme (NARMSAP), Tree Improvement and Silviculture Component. 90 p.
Purpose: To improve the management of community forests with the aid of predictors for tree biomass characteristics and stem volume. The predictors were also needed for obtaining biomass and vol-ume tables. Note: the tables obtained do not provide the user with species-specific growth figures or management options.
Tree species: 1. Acacia auriculiformes2. A. catechu3. Alnus nepalensis4. Casearia graveolens5. Cassia siamea6. Dalbergia sissoo7. Eucalyptus spicata 8. E. camaldunensis9. Eugenia operculata 10. Eurya cumunata11. Ficus lacor12. F. neriifolia13. F. semicordata14. Fraxinus floribunda15. Litsea monopetala16. Lyonia ovalifolia17. Maesa macophylla 18. Malastoma melabathricum19. Myrica esculanta20. Myrsine capitellata21. Phyllanthus emblica22. Pinus patula23. P. roxburghii24. P. wallichiana25. Pyrus pashia26. Quercus floribunda27. Q. langeionosa28. Q. trichophora29. Rhododendron arboretum30. Rhus wallichii31. Shorea robusta

Working Papers of the Finnish Forest Research Institute 235 http://www.metla.fi/julkaisut/workingpapers/2012/mwp235.htm
67
Appendix 2: Model descriptions 2.01–2.09 for the parametric Nepalese predictors.
Appendix 2 Appendix 232. Viburnum coriaceum33. Wendlndia coriacea34. Daphne species
Sample size by model(s) and species: Not reported.
Origin of data: Different regions of Nepal.
Physiographic applicability: Physiographical applicability is not described in detail. Modelling data were collected from for-est sites where the Forest Research Division (FRD) of the Department of Forest Research and Survey (DFRS) carried out field surveys on natural forest silviculture and management over a 16-year period.
Site, soil and climatic factors: Not specified.
Forest establishment: Information not available.
Silvicultural constraints (thinnings, soil preparation, etc.): Information not available.
Short description of models: A total of 40 species-specific biomass and 6 volume models.
Instructions for application: It is stated by the author that the models can be applied to predicting stem volumes and fresh bio-masses of the above-ground components of individual trees. The models have not been validated using independent validation data.
Description compiled by: Ram A. Mandal, Him L. Shrestha, Bechu Yadav and Kalle Eerikäinen
Parametric presentation:
where:
w = fresh weight of stem biomass, branches or foliage, kg.v = over- or under-bark stem volume, m3 ; anda, b =
ln(w) = a + b × ln (d1 .3 ) [2.07.1]
ln(v)= a + b × ln (d1 .3 ) [2.07.2]
∧
model-specific parameters estimated by tree species.
∧

Working Papers of the Finnish Forest Research Institute 235 http://www.metla.fi/julkaisut/workingpapers/2012/mwp235.htm
68
Appendix 2: Model descriptions 2.01–2.09 for the parametric Nepalese predictors.
Appendix 2Model description 2.08
Author(s): Korhonen, K.T., Sharma, E.R. and Rajbhandari, R.D.
Name of model/set of models: Models for predicting diameter growth and the relationship between tree height and diameter.
Complete reference: Korhonen K.T., Sharma, E.R. and Rajbhandari, R.D. 1992. Diameter growth and height models
for forest trees in Kapilbastu District. HMGN Ministry of Forest and Environment, Forest Survey and Statistics Division, FSIPS/FRIS. Technical report. 17 p.
Purpose: To demonstrate how tree-level data collected from permanent and temporary inventory sample plots can be used to obtain models for predicting growth characteristics.
Tree species: See Table 2.08.1.
Sample size by model(s) and species: See Table 2.08.1.
Origin of data: Kapilbastu (height and basal area increment data) and Rupandehi (height data) districts in Terai.
Physiographic applicability: Models for basal area increment based on data collected from permanent sample plots established in Kapilbastu district, Terai, during the forest inventory conducted in the 1970s. Every fifth field-measured plot was planned to be re-measured. The measurement of 17 permanent clusters con-sisting of three sample plots in each was carried out in January 1992.
Modelling of species-specific height-diameter curves was based on data measured from national forest inventory plots in the Kapilbastu and Rupandehi districts in Terai. These inventory data were collected during the period from 1990 to 1991.
Site, soil and climatic factors: Not specified.
Forest establishment: Information not available.
Silvicultural constraints (thinnings, soil preparation, etc.): Information not available.
Short description of models: Species-specific models for basal area increment (two individual model parameterisations) and tree height (two individual model parameterisations).

Working Papers of the Finnish Forest Research Institute 235 http://www.metla.fi/julkaisut/workingpapers/2012/mwp235.htm
69
Appendix 2: Model descriptions 2.01–2.09 for the parametric Nepalese predictors.
Appendix 2 Appendix 2Instructions for application: The models for tree height can be used to predict stem volumes of tally trees without height re-cordings. The models for tree-level basal area increment together with models for total tree height are applicable to the estimation of volume growth. Modelling height increment directly was re-jected because the height measurements at the time of establishment of permanent sample plots were deemed to be unreliable.
Table 2.08.1. Number of observations by species in the diameter increment and height modelling data.
SpeciesModelled variable
ig(* hAcacia catechu 2 213
Adina cordifolia 17 129
Anogeissus latifolia 54 476
Bombax malabaricum 1 –
Dahlbergia sissoo 5 168
Eugenia jambolana 13 186
Lagerstroemia parviflora 5 396
Lannea grandis 3 58
Mitragyna parviflora 3 –
Ougenia dalbergoides 1 –
Schlichera trijuga 8 126
Shorea robusta 119 427
Terminalia belerica 3 83
Terminalia tomentosa 13 636
Miscellaneous 33 453
Total 280 3351
(* Models for predicting tree basal area increment were finally obtained for S. robusta, A. cordifolia, A. latifolia and the group of species called ‘others’.
Description compiled by: Kalle Eerikäinen

Working Papers of the Finnish Forest Research Institute 235 http://www.metla.fi/julkaisut/workingpapers/2012/mwp235.htm
70
Appendix 2: Model descriptions 2.01–2.09 for the parametric Nepalese predictors.
Appendix 2
Parametric presentation(s):
Increment of basal area
Total tree height
where:
ig = 5-year basal area increment of the tree, cm2;h = tree height, m; d1.3 = diameter at breast height, cm;Dg = basal area weighted stand mean diameter, cm;G = stand basal area, m2 ha-1 ;a, b =a0 , a1 ,…, a5 =
ig = a + b × d1 .3 [2.08.1]
ig = a + b × d1 .32
[2.08.2]
h = a0 + a1
× d1 .3 + a2 × d1 .3
2 + a3 × Dg
+ a4 × G [2.08.3]
h = a0 + a1 × 1
(d1.3 +3) + a2 ×
1
(d1 .3 +3)2 + a3 × 1
(d1 .3 +3)3 + a4 × Dg + a5 × G [2.08.4]
model-specific parameters estimated by tree species; andmodel-specific parameters estimated by tree species.
∧
∧
∧
∧

Working Papers of the Finnish Forest Research Institute 235 http://www.metla.fi/julkaisut/workingpapers/2012/mwp235.htm
71
Appendix 2: Model descriptions 2.01–2.09 for the parametric Nepalese predictors.
Appendix 2 Appendix 2Model description 2.09
Author(s): Khatry Chhetri, D.B. and Fowler, G.W.
Name of model/set of models: Models for predicting diameter at breast height and basal diameter from stump characteristics.
Complete reference: Khatry Chhetri, D.B., and Fowler, G.W. 1996. Estimating diameter at breast height and basal
diameter of trees from stump measurements in Nepal’s lower temperate broad-leaved forests. Forest Ecology and Management 81(1996): 75–84.
Purpose: To develop models for the prediction of: i) diameter at breast height (d1.3) and basal diameter (dbasal) from stump height and stump diameter (model type 1), and ii) diameter at breast height from basal diameter and vice versa (model type 2).
Tree species: The data comprised a total of 17 species. Final estimates of parameters for the type 1 models were obtained for the pooled data (general models), small-sized trees (d1.3 < 35 cm), large-sized trees (d1.3 ≥ 35 cm), and only for Schima wallichii and Castanopsis spp. Final estimates of parameters for the type 2 models were obtained only for the pooled data (general models).
Sample size by model(s) and species:The models were derived from a total of 1,304 diameter observations measured from 163 trees in two forests (see also Table 2.09.1).
Table 2.09.1. Number of observations in the modelling data.
Tree groupNumber of trees
d1.3 dbasal
small-sized trees (d1.3 < 35 cm) 108 108
large-sized trees (d1.3 ≥ 35 cm) 55 55
Schima wallichii 48 48
Castanopsis spp. 42 42
pooled data 163 163
Origin of data: The data were collected from two forests in Lalitpur District, located in the central hills of Nepal: 1) Bajrabarahi (a sacred forest, 1449 m a.s.l., 20.1 ha), and 2) Godavari Danda (a protected natural forest, 1691 m a.s.l., 38.6 ha). The two forests represent the subtype Schima–Castanopsis forest of the warm temperate forest type.
Physiographic applicability: The models are recommended for general use in the lower temperate broad-leaved forests of the central Himalayas, particularly in forests dominated by the Schima–Castanopsis association.

Working Papers of the Finnish Forest Research Institute 235 http://www.metla.fi/julkaisut/workingpapers/2012/mwp235.htm
72
Appendix 2: Model descriptions 2.01–2.09 for the parametric Nepalese predictors.
Appendix 2Site, soil and climatic factors: Not specified.
Forest establishment: Naturally regenerated and developed forests.
Silvicultural constraints (thinnings, soil preparation, etc.): Information not available.
Short description of models: Models specific to species- and size-class groups were developed for predicting diameter at breast height and basal diameter from stump characteristics.
Instructions for application: If stump diameters are measured outside the height range of 3 to 180 cm, which represents the variation of the modelling data, the reliability of the models obtained is not guaranteed. For the prediction of d1.3 and dbase of larger trees, it is recommended that the models developed for the group of large-size trees (d1.3 ≥ 35 cm) be used. For most purposes of d1.3 and dbasal estimation from stump measurements in the lower temperate broad-leaved forests of Nepal’s central hills, especially forests dominated by the Schima–Castanopsis association, the authors recommend us-ing the general model presented in the article.
Description compiled by: Kalle Eerikäinen
Parametric presentation(s):
Model type 1
where y is either diameter at breast height or basal diameter (cm), dstump is stump diameter (cm), hstump is stump height (cm), and β0, β1 and β2 are estimated model parameters.
Model type 2
where y is either diameter at breast height or basal diameter (cm), x is either diameter at breast height or basal diameter (cm), and β0 and β1 are estimated model parameters.
ln(y) = β0 + β1 × ln (dstump ) + β2 × ln (hstump ), [2.09.1]
ln(y) = β0 + β1 × ln (x), [2.09.2]
∧
∧