Embed Size (px)
Citation preview

71
International Journal of Fluid Machinery and Systems DOI: http://dx.doi.org/10.5293/IJFMS.2019.12.1.071
Vol. 12, No. 1, January-March 2019 ISSN (Online): 1882-9554
Review Paper
A Review of Experimental Detection Methods of Cavitation in
Centrifugal Pumps and Inducers
Georgios Mousmoulis, John Anagnostopoulos and Dimitrios Papantonis
Laboratory of Hydraulic Turbomachines, School of Mechanical Engineering
National Technical University of Athens
Iroon Polytechniou 9, Zografou, Athens, 15780, Greece
[email protected], [email protected], [email protected]
Abstract
An important flow mechanism that affects the performance and efficiency of centrifugal pumps is cavitation. In
recent years, many researchers have studied the physics of cavitation in order to create appropriate detection
methodologies. The aim of this paper is to review the various experimental tools that have been developed so far and
enlighten the area of future research on the field of cavitation monitoring. According to the results, cavitation detection
is possible, but a large number of sensors have to be used and permanent changes in the machine need to be made for
increasing the results reliability. Therefore, future research steps are proposed towards the development of reliable,
accurate but also easy to install and low cost experimental set ups.
Keywords: Cavitation; Experimental measurements; Flow visualization and imaging; Machine diagnostics; Noise and
vibration measurements
1. Introduction
Centrifugal pumps are hydrodynamic machines that use a rotating impeller to transfer the energy from the motor to the fluid. The
energy exchange takes place through the impeller blades that increase both the pressure and kinetic energy of the fluid at the impeller
exit. At the blades inlet region, however, a combination of low suction pressure head and high flow velocity may result in significant
local pressure drop, even below the vapour pressure of the liquid. In that case the liquid is vaporized and vapour cavities are formed
and begin growing. These cavities are then driven by the flow downstream or near the impeller walls, in areas with static pressure
that is above the vapour pressure of the fluid. This results in abrupt implosion of these cavities, where their volume is eliminated and
the empty space that is created is re-filled by the surrounding liquid that forms high velocity microjets. This mechanism causes local
pressure shock waves and very high instant temperatures which is the main mechanism of cavitation damage of the exposed impeller
and blades surfaces.
Significant wear and material removal from the impeller and blades can be caused after certain time of pump operation under
cavitation conditions. At the same time, the impeller loses its mass uniformity and rotating unbalance phenomenon can be observed.
This rotating unbalance is transferred to the shaft where high amplitude vibrations occur that may lead to bearing failure. Also, dynamic
unsteady problems may occur due to the increase of the cavities inside the flow path, similar to rotating stall in compressors, which
affects significantly the normal operation of the machine and can lead to its complete destruction. In addition, the formation of large
cavitating areas on the blades can change significantly their hydrodynamic shape and cause additional hydraulic losses that reduce the
pump efficiency.
Although the above unwanted effects of cavitation are of major importance for both production and maintenance sectors in the
industry, the detection of this phenomenon is very difficult in real conditions, where similar acoustic emissions or vibrations may be
caused by other components and machinery parts. For this reason, it is very significant for the industry the development and
application of reliable tools for the early detection of this mechanism. Using such tools, maintenance engineers would be able to
operate the pumps in appropriate conditions and maximize their life expectancy.
In order to avoid the implications of cavitation, pump manufacturers have proposed the use of an axial inducer upstream the
impeller of the pump. By this way, the static pressure of the flow is increased before entering the pump, and as a consequence, cavities
formation is significantly reduced. Although the use of inducer improves the cavitation behaviour of the pump, sometimes vapour
bubbles are developed close to the inducer inlet as a result of the flow conditions created especially in cases where pump is operated
Received October 6 2016; revised March 6 2018; accepted for publication May 24 2018: Review conducted by Shuhong Liu.
(Paper number O16034C)
Corresponding author: John Anagnostopoulos, Professor, [email protected]

72
in partial flow rates. Cavitation in such operating points creates instabilities that is possible to affect the proper function of the pump. As
a result, similar experimental studies were developed for the detection and elimination of cavitation formation in axial inducers.
This paper reviews the experimental set ups and methods that have been proposed for the detection of cavitation in centrifugal
pumps and inducers by various researchers. The various methods are described and classified into five main categories, and their
advantages and disadvantages are identified. Then the methods are comparatively evaluated and finally, based on their noted
inefficiencies and inaccuracies, a list of further steps for future research and development in this area is proposed.
2. Experimental methodologies for cavitation diagnosis
Until early 1970’s the most frequently used experimental methodology in order to detect fully developed cavitation in
centrifugal pumps was the determination of the net positive suction head (NPSH). ISO 3555 sets a 3% drop in the total delivery
head as the criterion that machine suffers from cavitation. However, this method cannot ensure the detection of the inception of
cavitation, and hence it cannot be used in a complete condition monitoring program. This is due to the inability of the NPSH
method to quantify the effect in the machine at the time span between the inception and the fully developed cavitation. As a
consequence, different experimental techniques are investigated for the purpose of detecting cavitation inception. Most of those
techniques, use flow visualization methods in order to validate the existence of cavitation. However, there are cases where
researches used only flow visualization methods to detect cavitation, so those are considered as cavitation detection techniques.
In this review, five different methods are investigated; static pressure, sound pressure and acceleration of vibration
measurements, visualization of the flow and combination of those methodologies. In order to understand the physical meaning of
the quantities presented in the graphs of the various authors, some dimensionless parameters will be used. Specifically, these are
the flow coefficient φ, the pressure rise coefficient ψ and the cavitation coefficient σ:
2/ ucm= (1)
2
2/2 ugH= (2)
2
1/2 ugNPSH= (3)
where cm is the meridional component of the absolute velocity, u is the circumferential speed, H is the total delivery head and
NPSH is the net positive suction head.
2.1 Static Pressure Measurements
Cavitation is a hydrodynamic phenomenon directly related with changes in pressure and flow velocity. Thus, monitoring pressure in
different positions inside the pump is possible to detect the location of bubble formation and also to calculate the frequencies excited
from pressure variations. Pressure transducers are reliable sensors that have been used in general purposes for several years. In addition,
pressure transducers cover a wide range of measuring frequencies and are easily placed in various locations in the hydrodynamic
installation. Wood et al. [1] investigated hydraulic performance changes due to cavitation in mixed flow centrifugal pumps. The
experimental set up is presented in Fig. 1, where static pressure results were obtained at 13 positions along the tip of the impeller. The
static pressure measurements were read by a Bourdon tube gauge that used as reference the pressure at the inlet plenum chamber at the
impeller’s centerline and was able to measure up to 2.5 MPa. The purpose of this experiment was to compare static pressure results in
non-cavitating conditions with those in cavitating conditions. According to their results, the exact location of the implosion of the
bubble is located inside the working section of the impeller in the middle streamline distance between the inlet and outlet of the
meridional view, which was the point with the highest static pressure value.
Fig. 1 Elevation view of the impeller test installation [1]
Friedrichs et al. [2] studied cavitation in centrifugal pumps by pressure measurements and used a high speed CCD camera for flow
observations inside the machine. As a result they used a Plexiglas window for having optical access inside the impeller that is presented
in Fig. 2. Pressure was measured in eight positions, at one blade of the impeller, along the camber line of the middle span between the
hub and the shroud with piezoresistive miniature pressure transducers. Those transducers were able to measure the static pressure on
either the pressure or the suction side of the blade. In order to overcome the difficulties of transmitting the signal from the rotating
impeller a telemetry system was implemented. In order to study the rotating effects of cavitation relatively to the impeller, four more
pressure transducers were located in the middle passage of the hub impeller. According to their results, for flow coefficients, φ that
have lower values from the design point, incipient cavitation was observed only in the suction side. However, for higher φ values,
cavitation initiated in the pressure side and for values equal to the design point cavitation was observed in both sides simultaneously.

73
Fig. 2 Plexiglas window in the case of the pump and pressure transducers positioning [2]
In addition, it was observed that as the flow rate decreased, the σ value that corresponds to the onset of cavitation increased. The Fast
Fourier Transformation (FFT) was used for the analysis of frequency spectrum, and the results are given in Fig. 3. The left spectrum
corresponds to measurements obtained in the suction side of the blade and the right spectrum to measurements obtained close to
impeller hub. In both areas, cavitation frequency of 3.6 Hz and its harmonics were observed in lower frequencies than impeller’s
rotational speed, n, which was set at 9 Hz.
Fig. 3 FFT of pressure signals with cavitation [2]
Kang et al. [3] studied the dynamic behavior of the static pressure at the inlet of three axial inducers, used in rocket engine industry
and designed to avoid bubble flow instabilities. Figure 4(a) presents the positioning of the sensors used to measure inlet and outlet head
(p1 and p2, respectively), as well as the static pressure transducers used to measure the pressure fluctuations.
(a) (b)
Fig. 4 (a) Experimental arrangement of the static pressure transducers; (b) Waterfall diagram that presents the different
cavitation instabilities in the second inducer tested [3]
Strain gauge sensors able to measure pressures up to 1 MPa and frequencies up to 40 kHz were installed with circumferential
interval of 90°. The casing of the pump was manufactured by clear acrylic resin in order to be able to visualize the flow inside the
machine. The results were presented in waterfall plots for all the geometries tested and, as it is shown in Fig. 4(b), the frequency
spectrum of the dynamic pressure measurements was able to identify not only the existence of cavity areas but also the exact type of
cavitation. Watanabe et al. [4] used the same test rig as in [3] for testing the cavitation performance of an axial flow pump. The impeller

74
of the pump had similar geometry with the inducers used in rocket engines, and is presented in Fig. 5(a). Detection of the type of
cavitation was done by using two static pressure sensors separated by an angle of 111 degrees that is also given in Fig. 5(a). The
transducers were small-sized pressure transducers with flush-diaphragm at the end, rated capacity up to 1 MPa and natural frequency of
40 kHz. A high speed camera able to take 4500 pictures per second was used for the cavities visualization inside the inducer. Similarly
to [3], the frequency spectrum analysis given in Fig.5(b), which was obtained by FFT transformation, was able to identify the mode of
oscillations due to cavitation.
(a) (b)
Fig. 5 (a) The geometry of the impeller of the axial pump and the positions of the static pressure fluctuations measurements;
(b) Frequency spectrum of static pressure amplitude as a function of σ coefficient [4]
Kobayashi et al. [5] studied the characteristics of cavitation flow in a mixed flow pump with a closed type impeller using both
computation and experimental tools. The experimental tests include the measurement of static pressure in two positions, close to the
leading edge (SI) and close to the trailing edge (SO), both of them presented in Fig. 6(a). It is worth noting that in order to transfer the
signal output from the sensor to their DAQ system, cables were passed from inside the impeller’s hollow shaft and the wires were
picked up with the use of a telemeter assembly. In their results shown in Fig. 6(b), at both locations the static pressure measurements
validated the numerical calculations, and also they managed to detect bubbles appearance effectively.
(a) (b)
Fig. 6 (a) Meridional view of the pump which depicts the locations of the two static pressure measurements; (b) The
comparison of numerical and experimental results for the pressure transducer located at the trailing edge [5]
The cavitation instabilities were studied also numerically and experimentally by Hatano et al. [6] in a double suction centrifugal
pump. Static pressure measurements were performed at the inlet (point No 5) and outlet (point No 7) of the impeller, as indicated in Fig.
7(a). The sensors used were of strain-gage type and the analog signals were digitized with sampling frequency of 10 kHz. Thus, static
pressure measurements were able to identify dynamic phenomena with frequencies up to 5 kHz. Three different types of instabilities
were measured: Type I, a surge-type instability without bubble formation, type II, rotating cavitation, and type III, cavitation surge.
According to their results, the pressure measurements were able to detect the existence of the above instabilities, as it is presented in
Fig. 7(b).
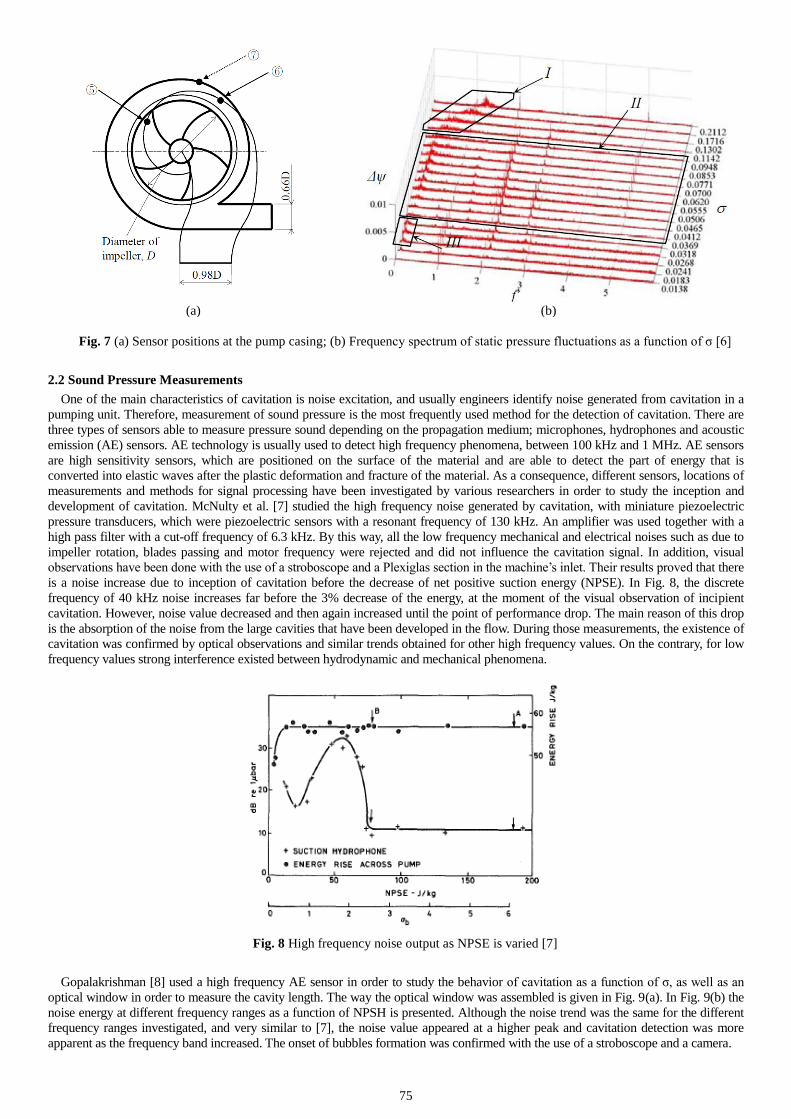
75
(a) (b)
Fig. 7 (a) Sensor positions at the pump casing; (b) Frequency spectrum of static pressure fluctuations as a function of σ [6]
2.2 Sound Pressure Measurements
One of the main characteristics of cavitation is noise excitation, and usually engineers identify noise generated from cavitation in a
pumping unit. Therefore, measurement of sound pressure is the most frequently used method for the detection of cavitation. There are
three types of sensors able to measure pressure sound depending on the propagation medium; microphones, hydrophones and acoustic
emission (AE) sensors. AE technology is usually used to detect high frequency phenomena, between 100 kHz and 1 MHz. AE sensors
are high sensitivity sensors, which are positioned on the surface of the material and are able to detect the part of energy that is
converted into elastic waves after the plastic deformation and fracture of the material. As a consequence, different sensors, locations of
measurements and methods for signal processing have been investigated by various researchers in order to study the inception and
development of cavitation. McNulty et al. [7] studied the high frequency noise generated by cavitation, with miniature piezoelectric
pressure transducers, which were piezoelectric sensors with a resonant frequency of 130 kHz. An amplifier was used together with a
high pass filter with a cut-off frequency of 6.3 kHz. By this way, all the low frequency mechanical and electrical noises such as due to
impeller rotation, blades passing and motor frequency were rejected and did not influence the cavitation signal. In addition, visual
observations have been done with the use of a stroboscope and a Plexiglas section in the machine’s inlet. Their results proved that there
is a noise increase due to inception of cavitation before the decrease of net positive suction energy (NPSE). In Fig. 8, the discrete
frequency of 40 kHz noise increases far before the 3% decrease of the energy, at the moment of the visual observation of incipient
cavitation. However, noise value decreased and then again increased until the point of performance drop. The main reason of this drop
is the absorption of the noise from the large cavities that have been developed in the flow. During those measurements, the existence of
cavitation was confirmed by optical observations and similar trends obtained for other high frequency values. On the contrary, for low
frequency values strong interference existed between hydrodynamic and mechanical phenomena.
Fig. 8 High frequency noise output as NPSE is varied [7]
Gopalakrishman [8] used a high frequency AE sensor in order to study the behavior of cavitation as a function of σ, as well as an
optical window in order to measure the cavity length. The way the optical window was assembled is given in Fig. 9(a). In Fig. 9(b) the
noise energy at different frequency ranges as a function of NPSH is presented. Although the noise trend was the same for the different
frequency ranges investigated, and very similar to [7], the noise value appeared at a higher peak and cavitation detection was more
apparent as the frequency band increased. The onset of bubbles formation was confirmed with the use of a stroboscope and a camera.
76
(a) (b)
Fig. 9 (a) Cross-Sectional view of pump assembly; (b) NPSH curve together with AE variation at different frequency ranges [8]
Neil et al. [9] used AE technology for the detection of the incipient cavitation. In their study, the root mean squared (RMS) value of
acoustic emission data were determined for different σ and in three different positions established after the pump, in the pipeline. The
AE signal was amplified and its digitization took place with a sampling frequency up to 2.5 MHz and a recording time at 13 ms.
According to their results, sensors in different positions have large differences, which manifested that the positioning of sensor affects
the results even for the same operating conditions. In addition, Fig. 10 gives the variation of high-frequency energy content [0.5-1
MHz] of raw AE on the inlet pipe with NPSH and shows a strong peak at 10 m NPSH. This result proved that AE sensors are able to
detect the incipient of cavitation far before the detection due to the total head drop of 3% that was in 5m NPSH. However, in this graph
AE results do not follow the same trend with [7] where noise appeared a second increase in its amplitude in very low NPSH values.
Here, the inception of cavitation is followed from a peak in the AE RMS but in lower NPSH values RMS value is decreasing. This is
the result of the absorption of turbulence noise from the gas cavities that McNulty also described.
Fig. 10 Variation of high-frequency energy content of raw AE on the inlet pipe with NPSH [9]
Chudina [10] focused on the determination of criteria in order to identify the onset of cavitation by using emitted noise. He proposed
the use of simple microphones with frequency range inside the audio frequency. The processing of the noise results consisted of the
transformation of data from time to frequency spectrum. In Fig. 11(a) noise spectra is presented in normal and off-design conditions. In
high frequencies, the amplitude of noise is increased at off-design conditions and the difference between normal and cavitation
operating point was clear. Also, in higher frequencies it is easier to observe differences between the two conditions, mainly due to the
low frequency mechanical noise effects. However, in Fig. 11(a) the blade passing frequency (BPF) of 294 Hz and its harmonics are
plotted before and after cavitation inception where a very interesting result is presented. The BPF/2 frequency at 147 Hz shows a great
difference before and after the onset of cavitation and Chudina suggested that it could be sufficiently used for the detection of the onset
of cavitation. According to the authors, the BPF/2 frequency is relevant with rotating stall phenomenon and could be a by-product of

77
the nonlinear interaction with the blade passing component. In such a condition, the cavitation area forms a cell that rotates faster than
the impeller and blocks the flow in the suction side of the blades.
(a) (b)
Fig. 11 (a) Noise spectra at design point (thick curve) and at off-design operations (thin curve); (b) Performance and noise
characteristics of the pumping set up [10]
Another criterion in order to detect cavitation is shown in Fig. 11(b), where the total noise levels for design (LP) and off-design
(LP(NPSHcrit)) operation are presented. On the one hand, the noise level value increases almost 3 dB due to cavitation for off-design
conditions. On the other hand as the operating point changes, the difference between the two curves LP and LP (NPSHcrit) changes.
This difference expresses the change in noise level and complicates the diagnosis of cavitation.
Alfayez et al. [11] investigated the best positioning of AE sensors and their ability to diagnose cavitation inception. The frequency
range of the sensors used was between 100 kHz and 1 MHz, their output signal was amplified and they were placed in five different
points close to the pump. According to their results shown in Fig. 12, the inception of cavitation is observed in AE RMS graph well
before the 3% decrease of head. For the impeller eye position the RMS values are decreasing due to the attenuation caused by bubble
clouds. However, in contrast with [9], before reaching the 3% drop in head, the RMS value increased again due to intense recirculation
inside the impeller. This increase shows similarities with the results presented in Fig. 8. Finally, the pump casing at the vicinity of the
impeller is proposed as the most appropriate position for the AE sensors.
Fig. 12 AE RMS activity during NPSH testing [11]
Cernetic et al. [12] investigated noise phenomena in audible frequency range that are related to cavitation in centrifugal pumps. For
their study, they used a dual channel signal analyser and two microphones with a frequency range of 100 Hz to 10 kHz. In Fig. 13,
noise with delivery head are compared. Noise increases before the 3% head drop but the peak of the noise is located quite close to the
critical NPSH. The increase of noise was the result of the inception and growth of cavitation bubbles that enhance the flow turbulence,
acting as an obstacle in the flow path. In addition, vibrations due to unsteady cavitation through the pump could further increase noise.
For low NPSH values both noise and head values decreased and had similar trends with [9].

78
Fig. 13 Noise signal of the pump when decreasing NPSH value [12]
Similarly to the previous writers, Farokhzad et al. [13] used microphones in audible frequency range to detect cavitation. The sensor
used was an omnidirectional microphone with frequency measuring range of 20-20000 Hz and it was located at the discharge tip close
to the impeller. The analysis of the signals contained transformation of the data in the frequency domain with the use of FFT that was
proved adequate to recognize the onset of cavitation, as it is presented in Fig. 14. After bubbles formation the noise amplitude level
increases and two discrete frequency components appear.
Fig. 14 Frequency spectrum of acoustic signals in cavitating and non-cavitating conditions [13]
Yan et al. [14] used two ultrasonic transducers 4 cm away from the impeller and a high speed camera to analyse cavitation in an axial
flow pump. The ultrasonic analog signal is digitized with a sampling rate of 15 MHz. The test rig is presented in Fig. 15(a). The signal
processing technique used was phase demodulation, while the positioning of the sensors away from the impeller made the experimental
set up easy to be established.
(a) (b)
Fig. 15 (a) Schematic diagram of the closed-loop system for the cavitation experiment; (b) Kurtosis of the phase-demodulated
signals [14]
The most important outcome was obtained from the study of the kurtosis of the phase-demodulated signal, and it is presented in Fig.
15(b). The sudden increase of kurtosis value coincided with the incipient cavitation and this was validated with the use of the high
speed camera.
2.3 Acceleration of Vibration Measurements
Measuring acceleration of vibration is one of the most common techniques in turbomachinery diagnostics. Accelerometers that are
usually based in the piezo-electric principle, are able to convert acceleration of vibration measurements in voltage differences. They

79
cover a wide frequency range, and they are very rugged sensors, not affected by temperature changes. In addition, their installation is
very simple and inexpensive. Therefore, several engineers and scientist used this technology to study the inception, the development
and the intense of cavitation. Wang and Chen [15] approached centrifugal pump diagnostics by using frequency spectrum parameters
such as wavelet transform (WT), rough sets (RS) and partially-linearized neural network (PNN). The method should reliably recognize
different malfunctions; one of the problems studied was cavitation. The WT converts acceleration signals from time to frequency
domain and extracts the adequate features, RS estimates the diagnosis knowledge for PNN and the PNN manages to relate symptoms
and faults and detected cavitation with 80% success. Data were obtained from six accelerometers that were mounted at the pump inlet,
outlet, housing and at pump’s motor and the frequency spectrum was separated in six different frequency ranges. The vibration signals
were digitized with a sampling frequency of 50 kHz and the recording time was 10s.
Fukaya et al. [16] managed to predict accurately the intense of cavitation with the use of multiple vibration sensors that where
located in the positions depicted in Fig. 16(a). Based on their assumptions that, i) bubble implosion wave is generated at the mid-point
of the impeller blade leading edge (see Fig. 16(a), ii) there are two one-dimensional (1D) paths for pressure propagation; the water and
the solid path (see Fig. 16(a)), iii) the generated 1D wave has initially the amplitude of bubble collapse pressure and 5 kHz frequency
and iv) the bubble collapse pressure has a constant value for different operating point of the pump, they managed not only to predict the
intensity of bubble collapse but also to draw a contour map with the cavitation intensity as a function of flowrate and NPSH (see Fig
16(b)).
(a) (b)
Fig. 16 (a) The locations of sensor positioning together with the flow and solid path; (b) Contour of cavitation intensity as a
function of NPSH and flow rate [16]
Sakthivel et al. [17] applied the decision tree method to evaluate the condition of a monoblock centrifugal pump. The accelerometers
that provided the vibration signal were located on the suction of the pump. The sampling rate for the digitization of the vibration signal
was selected to be 24 kHz and the number of samples used was 1024 for all the operating points tested. One of the faults studied was
cavitation, and the aim of the study was the evaluation of the function of the pump and the determination of the type of the fault in case
of malfunction. Similarly with [15], they measured acceleration of vibration with piezoelectric transducers, however sensors were
located only in the inlet of the machine and acrylic pipes were established in order to visualize cavitation. The analysis of the signals
was done in time domain by using very basic statistical parameters, such as standard deviation, kurtosis, skewness etc. The
effectiveness of the method is presented in “Confusion Matrices” (CM), as the one in Fig. 17. In this case, six different operating
conditions (a-f) have been tested and 100 signals obtained for every operating condition. In the end, the diagnostic result of all the
signals is shown in the CM, where it is concluded that the method detected correctly all fault types, so it could be used for the detection
of cavitation in centrifugal pumps.
Fig. 17 Confusion matrix [17]
Sato et al. [18] investigated the vortex cavitation created in a double suction centrifugal pump from the baffle plate that exists at the
end of the suction passage. Accelerometers were used for the vibration analysis of the phenomenon and an acrylic window was
established (see Fig. 18(a)) in order to visualize the flow with a high speed camera. From the frequency spectrum, presented in Fig.
18(b), the discrete frequency of 180 Hz appears to be excited at both high and low NPSH values. This frequency corresponds to the
blades passing rate, which is the product of the number of blades with the rotational frequency of the impeller. However, the observed
80
increase of the amplitude of this discrete frequency when the NPSH number decreases can be related with the appearance of the two
phase flow. These conclusions were validated by visual observations, as well as by numerical calculations.
(a) (b)
Fig. 18 (a) Experimental set up of double suction pump;
(b) Vibration amplitude in different frequencies at two NPSH values [18]
Likewise [15, 17], Muralidharan et al. [19] detected cavitation by measuring vibration levels with piezoelectric sensors and by
editing the data with discrete wavelet transforms. The sampling frequency of the vibration signals was 24 kHz and the number of
samples was 1024. In this study, 250 conditions for each fault are considered for the pump. For cavitation condition, in 249 from 250
cases the classifications were done correctly. This percentage was considered satisfactory and by using larger samples it could be
further improved.
In addition, Farokhzad [20] used vibration measurements and adaptive network fuzzy inference system (ANFIS) to detect and
classify different faults in centrifugal pumps. Vibration measurements were done by accelerometers with frequency range of 0.7 Hz to
15 kHz (±3 dB). The signals were analysed in the frequency spectrum by FFT and the classification of the faults was done by ANFIS.
According to their results, ANFIS classification method combined with vibration measurements is possible to increase the success rate
of the detection methodology. Finally, Zhang et al. [21] measured acceleration of vibration in seven different positions, most of them in
three directions.
Fig. 19 Vibration spectra at y-direction of sensor 3 at cavitation (thick line) and non-cavitation condition (thin line) [21]
In Fig. 19 the frequency spectrum of the seventh sensor is presented for a cavitating and a non-cavitating operating condition; It is
clear that cavitation increases frequency amplitude and especially at high frequencies; this is similar to the results presented in Fig.
11(a). The frequency spectrum is divided in four bands, and for each one the RMS value of acceleration is calculated. Two of the four
frequency bands (5-10 kHz & 10-25 kHz) showed important increase in their RMS values for σ<0.58, which correspond in head drop
of 1.6%. For similar σ values in the other two frequency bands, RMS acceleration values remained constant. The RMS value for the
three-axis sensors is calculated form the total energy of RMS in each direction and has similar trends with single-axis sensors. The
results for the 10-25 kHz band are presented in Fig. 20. Finally, similarly to [7] and [11], the RMS value of acceleration is reduced
when cavitation is fully developed at σ = 0.25 and increases again for σ = 0.2.

81
Fig. 20 RMS value trends in different frequency bands versus cavitation number at y-direction [21]
Mousmoulis et al. [22] studied noise signals with the use of an acoustic emission sensor in different operating conditions of a mini
centrifugal pump. The casing of the pump was made by plexi-glass in order to be able to visualize the flow with the use of high speed
stroboscope and to correlate the onset and development of cavitation with the noise characteristics and the NPSH value. The AE setup
has an integral preamp sensor and its signal is filtered in an analog band pass filter that allows the capture of frequencies in the range of
100-150 kHz with a sampling rate of 306 kHz. After signal digitization, each second of time is divided in p=90 segments, with q=3400
values at each segment, and the root mean squared (RMS) is calculated. In the end, the average RMS value of the segments at each
second was calculated.
According to their results, the obtained total head curves confirmed that intense cavitation at low NPSH values can block the flow
rate of the machine and reduce its ability to maintain the desired water head. In addition, the AE signal was found to increase exactly at
the point of the onset of cavitation, and this was validated by flow observations. Last but not least, it was shown that the emitted noise
RMS value decreases when cavitation area is increased, irrespectively of the flow rate.
2.4 Visualization of the Flow
The most traditional methodology for detecting cavitation is the visual observation of the flow inside the pump. This method has
been very popular, because it is the most direct way to study cavitation phenomenon. Although most of the researchers use this
technique to validate results from other experimental or numerical methods, there are some studies that could be used in order to
evaluate the machine operating conditions.
Wood [23] made high speed photographic studies to record cavitation formation in different impellers. A high speed camera of 16
mm was used in order to obtain high speed pictures of two phase flow. The camera was equipped with a lens of 50 mm and it was taken
7500 pictures per second. Furthermore, steady state photos were recorded with a camera of 135 mm and a stroboscope light was used
for both cases. Two different areas of cavitation development were studied; in the vane channels and in the leading edge of the blades.
Wood observed that the incipient cavitation takes place before the drop of the head, and suggested that NPSH criterion is not sufficient
to detect the beginning of cavitation bubbles formation. He also ascertained that in different impellers, similar cavitation flow patterns
may be observed in different operating points. Last but not least, the obtained results showed that leading edge cavitation was more
stable than the cavitation in the vane channels.
Baldassarre et al. [24] developed and compared three different image processing algorithms that could be used for real time detection
of incipient cavitation. The Plexiglas pipe used at the inlet of the pump together with the image acquisition section is presented in Fig.
21(a). A charge-coupled device (CCD) video camera was used, able to take pictures on the basis of an external synchronization. The
digitization of the pictures and the image processing was done by their DAQ system (Matrix Board, 768 3 512 pixels, endowed with
external sync) and a PC (i486 DX2 66 MHz), respectively. The main idea was based on the fact that cavitation areas in the flow path
are expected to be brighter due to light reflection. The first algorithm sets the limit of image brightness and scanned all the pixels of the
photo captured. If pixel’s brightness value is higher than the brightness limit then the pixel area is considered under cavitation such as
in Fig. 21(b).
The second algorithm takes as cavitation criterion the change of brightness in a pixel and not its specific value of brightness. Finally,
the third algorithm merges the two processing tools studied in the first two codes and sets as criterion the value of brightness that is
over the limit even once during image capturing. In this way the analysis took place in a number of images and it was possible to
efficiently study high frequency cavitation. In the end, all these algorithms detected cavitation and considered reliable, because a real
time response was obtained.

82
(a) (b)
Fig. 21 (a) Sketch of the mechanical system and image acquisition section; (b) cavitation development [24]
Hofmann et al. [25] investigated cavitation in two-scaled centrifugal pumps. In this study the research was focused on the analysis of
rotating stall by comparisons between the main pump characteristics and optical investigations. The experimental set up included the
use of a digital video camera and the construction of the shroud-side casing from Plexiglas and is presented in Fig. 2. Firstly, it was
proved that the minimum value of the incipient cavitation number σIC matches the design point flow rate φD. Furthermore, cavitation
was monitored with a stroboscope and the σ-ψ curves were created for different φ values. From the visualization of the flow it was
possible to observe that cavities occur for flow rates lower than 70% of the best efficiency point. Finally, it was possible to detect two
rotating cells in the opposite direction of the impeller at all operating conditions.
Medvitz et al. [26] investigated cavitation development in a centrifugal pump with casing made from Plexiglas window. In addition,
they applied their multiphase computational fluid dynamic (CFD) methodology in this centrifugal pump working at cavitating
conditions and validated their numerical calculation by visualizing the flow. Figure 22 shows the cavity shape at the trailing edge of the
blade as NPSH decreases. The cavity magnitude and the instability area increase as the σ value is diminished.
Fig. 22 Trailing edge cavity indicated as the NPSH value decreased [26]
Delgosha et al. [27] used stroboscopic light and high speed video analysis for the better understanding of centrifugal pump impellers
that work under cavitating conditions. The images were processed by the use of the statistical parameters of mean grey value
distribution and standard deviation grey value. According to the results presented in Fig. 23 it was clear that cavitation area enlarges as
the NPSH value decreases. Also, it was mentioned that attached and cloud cavitation observed in both mean vapour distribution and
standard deviation resulted for both operating conditions.
Fig. 23 Mean vapor distribution and standard deviation on pressure side, Qn, NPSH=6 m [27]
Liu et al. [28] visualized the flow with high speed camera and with illumination provided from a Light Emitting Diode (LED) and
two halogen lamps. The purpose of the visualization was the study of the unsteady attached sheet cavitation and the comparison of
visualization with computational results. In Fig. 24 cavitation for σ=0.451 is shown and acceptable agreement was obtain between

83
experimental and numerical results. In conclusion, it was experimentally observed that the length of the sheet cavity increases when σ
value decreases which was also confirmed from the numerical results.
Fig. 24 Qualitative comparison among the cavitation bubbles observed in the leading edge of the blades [28]
Zhang et al. [29] investigated the tip leakage vortex (TLV) cavitating flow in an axial pump with a transparent casing, which is
depicted in Fig. 25(a). For their experimental analysis they used a high speed imaging system that was composed from the high speed
camera, a macro lens, a fill light and an imaging acquisition software (see Fig. 25(b)). As it is presented in one of their results in Fig.
26(c), the high speed imaging system was able to identify the onset of the vortex cavity and its development.
(a) (b) (c)
Fig. 25 (a) Cross section of the axial pump assembly; (b) the imaging acquisition system; (c) the TLV cavitating flow [29]
2.4 Combination of Experimental Methods
The last part of this review concerns methodologies that combine some of the methods discussed above. Cernetic et al. [30] detected
cavitation by monitoring noise and vibrations in a range between 20 Hz and 20 kHz and presented the results in frequency spectrum.
According to their study, noise measurements should be taken as close as possible to the pump, otherwise important signal information
is lost due to environmental noise. Similarly to [10], they compared the frequency spectrum in cavitating and non-cavitating conditions
and concluded that in lower frequencies cavitation noise in mixed with rotating and blade passing frequency and their harmonics. As a
result, cavitation detection is more accurate in higher frequencies when measuring noise and vibration.
Chudina et al. [31] conducted a detailed study emphasizing in the monitoring of particular discrete frequency tones with three
different methods, setting as a target the determination of the discrete frequency that is mostly affected from cavitation. Their
experimental studies included sound pressure measurements with a microphone and two hydrophones, and vibration measurements
with accelerometers. The microphone was located perpendicular to the shaft direction at a distance 0.5 m from the pump and the two
hydrophones were installed at 340 and 745 mm from the hub of the radial impeller. The first hydrophone and the vibration sensor were
installed perpendicular to the shaft direction similarly to the microphone, and the second hydrophone at a horizontal direction. A two-
channel sound card was used for the analysis of the noise and vibration signals. According to Fig. 26, accelerometer and microphone
measurements exhibit similar trends, because mechanical vibrations were transferred from the machine to the air environment. The
values of both of them are decreased during cavitation development, mainly due to rotating stall. In addition, similar decrease is
observed in the results of ultrasound measurements with AE sensors in [9] due to the presence of large volume of bubbles inside the
flow, which absorb the noise of bubble implosion.

84
Fig. 26 Noise and vibration characteristics at Q = 5 l/s, SPL – sound pressure level, SPLtot – total SPL, SPL2176Hz – SPL at 2176
Hz, VL – vibration level, VL2176 Hz – VL at 2176 Hz, and H – total delivery head [31]
Gu et al. [32] measured vibrations with two accelerometers, airborne sound with microphones, fluidborne sound with hydrophones,
all of them in the audible frequency range in order to diagnose the onset of cavitation. Firstly they calculated the peak factor and
kurtosis for each set of data but the trends were oscillatory and it was impossible to extract any information. As a result, frequency
spectrums were calculated and shown in Fig. 27.
Fig. 27 Spectra of vibration, airborne acoustics and fluid borne acoustics [32]
The level of both vibration and airborne acoustics data were higher in operating points where cavitation occurred. On the other hand,
hydrophone results are not so clear mainly because of the reflections of wave propagation. A novel statistical parameter called spectral
entropy was used in order to have a more constant trend for the cavitation diagnosis and the results are given in Fig. 28. According to
the results presented, a smoother trend is obtained with the use of spectral entropy, but only in vibration and airborne sound
measurements. As a consequence, fluid acoustics cannot be used for monitoring cavitation with such a signal processing technique.
Fig. 28 Spectral entropy of vibration, airborne acoustic and fluid acoustic spectra [32]

85
3. Comparison and evaluation
This paper reviews the experimental methods proposed by various researchers for the detection of cavitation in centrifugal pumps
and inducers. The purpose of this review is the classification of the different techniques and the identification and discussion of their
main features, capabilities and limitations. The ultimate target of the various proposed detection methods is to become applicable for
condition monitoring and preventive maintenance in centrifugal pumps. Cavitation is a stochastic phenomenon and its experimental
study demands excellent control of the test rig and use of sophisticated sensors. The experimental studies discussed above consider
various types of cavitation and identify their main characteristics. A general rule in order to compare and validate results from different
researchers is that similar experimental conditions should exist. Unfortunately, this is not the case in most of the works that deal with
cavitation and reviewed here. As a consequence, the outcome of conclusions should be carefully extracted. A large number of
conclusions discussed here have been confirmed from more than one author. However, very often there were results in different
publications that are opposite to each other. For this reason, further research is usually proposed from the authors toward a better
understanding of those differences. In the present, various experimental methods are grouped in five categories; static pressure
measurements, sound pressure measurements, acceleration of vibration measurements, visualization of the flow, and combined
methodologies. Table 1 summarizes the above methods and their main advantages and disadvantages with the use of three criteria.
More specifically, the second column contains the main features and requirements of the experimental setup, the third column contains
the corresponding cost and the fourth column includes the capability of the method to detect and monitor cavitation. The accuracy of
the different methods proposed is mainly depended on the accuracy and the corresponding cost of the measuring equipment and
sensors rather than on the particular experimental methodology and set up.
Table 1 Overview of the experimental techniques for cavitation detection in centrifugal pumps
Experimental
Method Experimental Set Up Economic Cost Capability of Detection
Static Pressure
• Sensors located in stationary and rotating
parts of the pump, e.g. casing, blades etc.
• Diligent attention for the appropriate
establishment of the sensors
• Use of telemetry systems for locating the
sensor in rotating parts of the pump
• Impracticable for industrial cases
• Low cost of sensors and their
establishment
• High cost in case of telemetry
system or signal transmitting
through hollow shaft
• Uneconomic when multiple
sensors are needed
• No cost for filters and
amplifiers
• Possible to detect the location
of bubble implosion
• Low frequency band is not
affected from mechanical
noise
So
un
d P
ress
ure
Hydrophone
• Sensors located inside the flow and close
the suction of the impeller
• Diligent attention for the appropriate
establishment of the sensors
• Use of high pass filter
• Impracticable for industrial cases
• Low cost of sensors and their
establishment
• High pass filter cost
• Able to detect and monitor
high frequency phenomena
• Signals sensitive to wave
propagation
Microphone
• Flexibility to locate sensors in various
positions close to the machine
• Use of high pass filters
• Practical for industrial applications
• Low cost of sensors
• No establishment cost
• High pass filter cost
• Able to detect and monitor
high frequency phenomena
• Environmental noise affects
the signal and low frequency
analysis
AE sensor
• Easily established at the casing of the
machine
• The use of amplifier and high pass filter
is required
• Practical for industrial applications
• High cost of sensors,
amplifiers and high pass
filters
• No establishment cost
• Able to detect and monitor
high frequency phenomena
• Possible to detect the onset of
cavitation
Acceleration of
Vibration
• Easily established at the casing of the
machine
• The use of a high pass filter is required
• Practical for industrial applications
• High cost of sensors and high
pass filters
• No establishment cost
• Able to detect the onset of
cavitation
• Multidirectional monitoring
• Not applicable for ultrasonic
analysis
Flow Visualization
• Use of transparent window at the casing
and at the shroud of the impeller (in cases
of closed impeller pumps)
• High speed camera and stroboscope are
located close to the transparent window
• Impracticable to install transparent
parts in industrial pumps
• High cost of high speed
camera sensors, amplifiers
and high pass filters
• High cost for the design and
manufacturing of transparent
windows
• Implicit and reliable
detection
• Possible to detect the location
of bubble implosion
Static pressure measurements were used by a small number of researchers but they were able to extract significant conclusions.
Firstly, static pressure sensors detected the location inside the impeller that suffered the most from cavitation. In addition the FFT
analysis of the pressure signals pointed out a great advantage compared to the other experimental methods; the low frequency spectrum
was not affected from mechanical phenomena and it was possible to extract the low frequency characteristics of cavitation. Also, static
pressure measurements were used efficiently for the deeper understanding of cavitation phenomena with the use of computational tools.
With the use of static pressure transducers the pressure field inside the impeller was extracted and detailed comparisons with the results
of numerical models can be made. Consequently, the development of computational tools which are able to predict with high accuracy

86
cavitation behavior, could be critical in the field of the detection of cavitation. On the other hand, in order to determine the pressure
field, and the location of cavitation and its dominant frequencies, a large number of sensors should be used. Furthermore, the placement
of each sensor requires permanent changes in the case of the machine. All the above make static pressure measurements uneconomic
and impracticable to use for maintenance purposes in pump industry. Last but not least, it should be noticed that static pressure sensors
can be used easier in semi-open and open impellers, but for close impellers, which is the most frequent type, telemetry systems should
be used and as a result, the cost for the investigation increases.
Sound pressure measurements in water, air and solids were used in many experimental investigations. The main advantage of this
technique is the ability to detect high frequency phenomena. Especially AE sensors detect frequencies up to 1 MHz and are able to
detect the onset of cavitation. Together with microphones that measure airborne noise, AE sensors can be installed on the outer side of
the machine without requiring any permanent changes, such as in measurements with hydrophones. Despite this, however, detailed
studies are needed in order to select the appropriate position for the installation of an AE sensor. Microphones are very sensitive to
environmental noise, which is possible to affect the measurements. This is probably the only disadvantage of this technique, but,
unfortunately, it makes them unable to be used in the real industry. However, microphones could be an economic and useful tool for the
researches in their studies of cavitation inside hydraulic machines. Similarly to microphones, hydrophones are sensitive to wave
propagation but they do not require power source. AE sensors and microphones had significant contribution in the field of the inception
of cavitation. They can detect the noise increase far before the pump head reduction, and as some researches have declared, pump
operation is affected since the onset of cavitation.
A third technique studied from several authors is the measurement of the acceleration of vibration. Accelerometers are widely used
for vibration measurements in Condition Based Maintenance programs in the rotating machine industry. They are usually located close
to the bearings of the machine and they detect mechanical faults such as axis misalignment, rotor unbalance, impeller, bearing and gear
box faults. In addition, they are easily established on the case of the machine and they are able to detect vibrations induced from
hydraulic excitations such as cavitation. In the present review, the majority of the papers that used accelerometers for cavitation
detection focuses on the development of statistical signal processing. According to the experimental results, a combination of wavelet
transform, rough sets and partially linearized neural networks could diagnose cavitation with about 80% success. This percentage can
be increased by the use of decision tree method and of adaptive network fuzzy inference system. The frequency spectrum of the
accelerometers is similar with that of airborne sound measurements. Unlike to static pressure sensors, accelerometers are affected from
low mechanical frequencies, so they could not be used for the detection of low frequency cavitation, such as rotating stall. On the other
hand, accelerometers could be used for the detection of the onset of cavitation, since several researchers showed that exhibit similar
amplitude trends with airborne noise measurements.
Flow visualization techniques were introduced and applied by several researchers to detect cavitation. Visualizing the flow with the
use of stroboscope and high speed camera is the most implicit and reliable method to study cavitation and locate the areas of bubble
implosion. However, it is very significant to find a way to have optical access inside the impeller of the pump. In the present review,
two different methods have been discussed; in the majority of the papers, a Plexiglas window was established in the pump volute. A
second method is to establish a Plexiglas pipe in the inlet of the pump and locate the stroboscope with the camera in appropriate angle
so as to have optical access in the impeller inlet. Both of the methods are very useful for research purposes but very uneconomic and
impracticable for industrial application. On the other hand, the variety of the above methods applied for cavitation detection has caused
some contradictory results, like the ones discussed below: Friedrichs and Kosyna [2] studied cavitation using static pressure transducers
and found that cavitation frequency has lower values than the impeller rotation. On the contrary, Chudina [10] studied the same
phenomenon with microphones and observed that the frequency of BPF/2 can be the result of rotating stall. According to Kamijo et al.
[33], the propagation speed of cavitation is expected to be 1.1 to 1.4 of the impeller frequency. As a consequence, further experimental
measurement with different types of sensors and flow visualization should be contacted in order to identify the characteristics of this
cavitation type, such as its propagation speed and the location in the impeller where the cell is developed.
Τhe strongest disagreement can be observed between the sound pressure measurements obtained by various researchers who studied
the development of cavitation. On the one hand, experimental results show that noise decreases after the development of the
phenomenon due to noise absorption from the bubbles. On the other hand, sound pressure and acceleration results showed that the
decrease of noise is followed from a big increase. The latter could be the result of an extended development of cavitation in the impeller,
which is can block the flow and produce severe oscillations. It is possible that the first group of authors didn’t force the pump to work
under extreme operating conditions and this could be the reason for the different results.
4. Conclusion and further steps
To conclude this review, it is important to note the significant progress that has been achieved so far in the diagnosis of cavitation in
hydrodynamic machines, at least in the laboratory. Various methods have been proposed from different authors and corresponding
experimental results showed that it is possible to identify the onset of cavitation and the location of the bubble implosion. At the same
time, efficient methodologies were developed in order to categorize the different faults that are possible to occur in centrifugal pumps.
However, further studies are required in order to validate the previous mentioned techniques, as also to develop more reliable and
accurate diagnostic tools. More specifically, future research could be directed towards:
• The determination of the frequency range that is excited from each type of cavitation, with the use of sensors able to detect
low frequency phenomena, such as static pressure transducers, and high frequency phenomena such as AE sensors.
• Comparative studies of similar types of cavitation in the same test rig using different type of sensors.
• The determination of the minimum number of the static pressure transducers which are adequate to detect the location of
bubble implosion.
• The detection of the location of cavitation inception without the aid of flow visualizations methods and static pressure
measurements, which are difficult to apply in real conditions.
• The development of experimental set ups and sophisticated statistical tools that could be embedded in algorithms that detect
not only different types of faults but also different types of cavitation.

87
• The clarification of how sound pressure transducers, such as AE sensors and microphones are affected from fully developed
cavitation.
• The validation of rotating stall frequency and its correlation with impeller and/or blade passing frequencies.
• Detailed studies of how characteristic statistical values are affected from the onset and the development of cavitation.
• Comparative studies between computational and experimental results in order to develop numerical models that simulate
cavitation in centrifugal pumps reliably.
• Use of the above numerical tools for the development of experimental methodologies for cavitation diagnosis.
• Investigation of applicability of high energy electromagnetic radiation techniques for gas bubbles identification such as x-
rays and gamma rays.
In addition to the reliability and accuracy of detection capability, the ease of installation and the low cost will also constitute
significant desirable features of a cavitation detection method, especially for small and medium size pumps and pumping stations.
The experimental set up proposed for maintenance purposes should include small number of transducers and no permanent
changes in the machine. The on-going research in the development and improvement of cavitation detection methodologies, and
the obtained useful and promising results, indicate that in the coming future manufacturers will be able to install maintenance
systems for cavitation diagnosis in centrifugal pumps.
Nomenclature
cm
g
H
n
NPSH
Meridional component of absolute velocity [ms-1]
Acceleration of gravity [ms-2]
Total delivery head [m]
Impeller rotating speed [rads-1]
Net positive suction head [m]
u
σ
φ
ψ
Circumferential speed [ms-1]
Cavitation number [-]
Flow coefficient [-]
Pressure rise coefficient [-]
References
[1] Wood, G. M., Murphy, J.S., & Farquhar J., 1960, “An Experimental Study of Cavitation in a Mixed Flow Pump Impeller,”
Journal of Fluids Engineering, Vol. 82.4, pp. 929-940.
[2] Friedrichs, J., Kosyna G., 2002, “Rotating Cavitation in a Centrifugal Pump Impeller of Low Specific Speed,” J. Fluids Eng,
Vol. 124(2), pp. 356-362.
[3] Kang, D., Watanabe, T., Yonezawa, K., Horiguchi, H., Kawata, Y., & Tsujimoto, Y., 2009, “Inducer Design to Avoid Cavitation
Instabilities,” International Journal of Fluid Machinery and Systems, Vol. 2, No. 4, pp. 439-448.
[4] Watanabe, T., Sato, H., Henmi, Y., Horiguchi, H., Kawata, Y., & Tsujimoto, Y., 2009, “Rotating Choke and Choked Surge in an
Axial Pump Impeller,” International Journal of Fluid Machinery and Systems, Vol. 2, No. 3, pp. 232-238
[5] Kobayashi, K., & Chiba, Y., 2010, “Computational Fluid Dynamics of Cavitating Flow in Mixed Flow Pump with Closed Type
Impeller,” International Journal of Fluid Machinery and Systems, Vol. 3, No. 2, pp. 113-121.
[6] Hatano, S., Kang, D., Kagawa, S., Nohmi, M., & Yokota, K., 2014, “Study of Cavitation Instabilities in Double-Suction
Centrifugal Pump,” International Journal of Fluid Machinery and Systems, Vol. 7, No. 3, pp. 94-100.
[7] McNulty, P.J. and Pearsall I.S., 1982, “Cavitation Inception in Pumps,” J. Fluids Eng, Vol. 104(1), pp. 99-104.
[8] Gopalakrishman, S., 1985, “Modern cavitation criteria for centrifugal pumps,” Proc. of the Second Int. Pump Symp.,
Turbomachinery Laboratory, Texas A&M University, College station.
[9] Neill, G. D., Reuben, R. L., Sandford, P. M., Brown, E. R., & Steel, J. A., 1997, “Detection of incipient cavitation in pumps
using acoustic emission,” Proceedings of the Institution of Mechanical Engineers, Part E: Journal of process mechanical
engineering, Vol. 211.4, pp. 267-277.
[10] Chudina, M., 2003, “Noise as an indicator of cavitation in a centrifugal pump,” Acoustical Physics, Vol 49.4, pp. 463-474.
[11] Alfayez, L., Mba, D., & Dyson, G., 2004, “Detection of incipient cavitation and the best efficiency point of a 2.2 MW
centrifugal pump using Acoustic Emission,” Journal of Acoustic Emission, Vol. 22, pp. 77-82.
[12] Černetič, J., and Čudina, M., 2012, “Cavitation Noise Phenomena in Centrifugal Pumps,” 5th Congress of Alps-Adria
Acoustics Association, Vol. 1. 2012.
[13] Farokhzad, S. and Ahmadi, H., 2013, “Acoustic Based Cavitation Detection of Centrifugal Pump by Neural Network,”
Journal of Mechanical Engineering and Technology.
[14] Yan, Z., Liu, J., Chen, B., Cheng, X., & Yang J., 2015, “Fluid cavitation detection method with phase demodulation of
ultrasonic signal,” Applied Acoustics, Vol. 87, pp. 198-204.
[15] Wang, H. Q., &Chen, P., 2007, “Fault diagnosis of centrifugal pump using symptom parameters in frequency domain,”
Agricultural Engineering International, The CIGR EJournal.
[16] Fukaya, M., Οno, S. & Udo, R., 2009, “Prediction of Cavitation Intensity in Pumps Based on Propagation Analysis of Bubble
Collapse Pressure Using Multi-Point Vibration Acceleration Method,” International Journal of Fluid Machinery and Systems, Vol.
2, No. 2, 165-171.
[17] Sakthivel, N. R., Sugumaran, V., & Babudevasenapati, S., 2010, “Vibration based fault diagnosis of monoblock centrifugal
pump using decision tree,” Expert Systems with Applications, Vol. 37.6, pp. 4040-4049.
[18] Sato, T., Nagahara, T., Tanaka, K., Fuchiwaki, M., Shimizu, F., & Inoue, A., 2011, “Vortex Cavitation from Baffle Plate and
Pump Vibration in a Double-Suction Volute Pump,” International Journal of Fluid Machinery and Systems, Vol. 4, No. 1, pp. 76-
83.
[19] Muralidharan, V., Sugumaran, V., & Indira, V., 2014, “Fault diagnosis of monoblock centrifugal pump using SVM,”
Engineering Science and Technology, International Journal, Vol. 17.3, pp. 152-157.
[20] Farokhzad, S., 2013, “Vibration Based Fault Detection of Centrifugal Pump by Fast Fourier Transform and Adaptive Neuro-

88
Fuzzy Inference System,” Journal of Mechanical Engineering and Technology, Vol. 1(3), pp. 82-87.
[21] Zhang, N., Yang, M., Gao, B., & Li, Z., 2015, “Vibration characteristics induced by cavitation in a centrifugal pump with
slope volute,” Shock and Vibration, Article ID 294980, 10 pages.
[22] Mousmoulis, G., Karlsen Davies, N., Aggidis, G., Anagnostopoulos, J. & Papantonis, D., 2017, “Experimental analysis of the
onset and development of cavitation in a centrifugal pump,” Journal of Physics: Conference Series. Vol. 813. No. 1. IOP
Publishing.
[23] Wood, G. M., 1963, “Visual cavitation studies of mixed flow pump impellers,” Journal of Fluids Engineering, Vol. 85.1, pp.
17-28.
[24] Baldassarre, A., De Lucia, M., & Nesi P., 1998, “Real-time detection of cavitation for hydraulic turbomachines,” Real-Time
Imaging, Vol. 4.6, pp. 403-416.
[25] Hofmann, M., Stoffel, B., Friedrichs, J., & Kosyna, G., 2001, “Similarities and geometrical effects on rotating cavitation in
two scaled centrifugal pumps,” Fourth International Symposium on Cavitation, California Institute of Technology, Pasadena, CA
USA.
[26] Medvitz, R.B., Kunz, R.F., Boger, D.A., Lindau, J.W., Yocum, A.M. & Pauley, L.L., 2002, “Performance Analysis of
Cavitating Flow in Centrifugal Pumps Using Multiphase CFD,” Journal of Fluids Engineering, Vol. 124, pp. 377-383.
[27] Coutier-Delgosha, O., Fortes-Patella, R., Reboud, L., Hofmann, M., & Stoffel, B., 2004, “Experimental and numerical studies
in a centrifugal pump with two-dimensional curved blades in cavitating condition,” Journal of Fluids Engineering, Vol. 125.6, pp.
970-978.
[28] Liu, H., Liu, D., Wang, Y., Wu, X., Wamg, J., & Du, H., 2013, “Experimental investigation and numerical analysis of
unsteady attached sheet cavitating flows in a centrifugal pump,” Journal of Hydrodynamics, Vol. 25.3, pp. 370-378.
[29] Zhang, D., Shi, W., Pan, D. & Dubuisson, M., 2015, “Numerical and Experimental Investigation of Tip Leakage Vortex
Cavitation Patterns and Mechanisms in an Axial Flow Pump,” Journal of Fluids Engineering, Vol. 137, 121103.
[30] Cernetic J., Prezelj J., Cudina M., 2009, “Use of noise and vibration signal for detection and monitoring of cavitation in
kinetic pumps,” The Journal of the Acoustical Society of America, Vol. 123.5, pp. 3316-3316.
[31] Chudina, M., and Prezelj, J., 2009, “Detection of cavitation in situ operation of kinetic pumps: Effect of cavitation on the
characteristic discrete frequency component,” Applied Acoustics, Vol. 70.9, pp. 1175-1182.
[32] Gu, F., Thobiani, F., and Ball, A., 2010, “Monitoring of Cavitation in Centrifugal Pumps using Spectral Entropy of Vibro-
acoustic Measurements,” University of Huddersfield.
[33] Kamijo, K., Yoshida, M., & Tsujimoto, Y., 1992, “Hydraulic and mechanical performance of LE-7 LOX pump inducer,” Proc.
28th Joint Propulsion Conf., Paper AIAA 92-3133.
Georgios Mousmoulis received the Diploma in Mechanical Engineering from the University of Western
Macedonia, Kozani, Greece, in 2013, and the MSc of Design of Rotating Machines from Cranfield
University, UK, in 2014. In 2014, he joined the Laboratory of Hydraulic Turbomachines in the School of
Mechanical Engineering in National Technical University of Athens, as PhD candidate. His PhD thesis
focuses on the study of detection methodologies of cavitation in hydraulic machines. The study includes
the application of both experimental and numerical tools in centrifugal pumps as well as in reaction
turbines, such as Francis and S-type. He is a Member of the Technical Chamber of Greece in the Hellenic
Association of Mechanical and Electrical Engineers.
Ioannis Anagnostopoulos graduated in Mechanical Engineering from the National Technical University
of Athens, Greece, and received his Ph.D. in Computational Fluid Mechanics from the same University.
He worked for several years as post-doctoral researcher in the NTUA and as R&T consultant in the
private sector where he has been involved in feasibility studies for various industrial innovations. He has
participated in more than 40 research projects, and has more than 100 scientific publications in
international journals and conferences. Also, he has developed a number of advanced computer codes for
the simulation of various fluid mechanisms in industrial applications, as well as for modeling and
optimization of hydroelectric and RES-hydro energy systems with pumped storage. He is Professor in
Hydraulic Turbomachines at the School of Mechanical Engineering, NTUA, Greece and his current
research activities include flow simulation and hydrodynamic design in pumps and hydroturbines.
Dimitrios Papantonis in Mechanical and Electrical Engineering from the National Technical University
of Athens, Greece, and received his Docteur-Ingenieur in Fluid Mechanics from the Ecole d’
Hydraulique, Institut National Polytechnique de Toulouse. He is expert in design and operation of
hydraulic machinery and installations, including transient phenomena and water hammer. He has been
involved in feasibility studies for several small hydro projects in Greece, as well as in many research
projects for hydroelectric, hydraulic and pumping installations, funded by national and private entities
and by the EU, and has numerous scientific publications in international journals and conference
proceedings. He is Professor and Director of the Hydraulic Turbomachines Lab. at the School of
Mechanical Engineering, NTUA, Greece, and his current research activities include centrifugal pumps
and hydroturbines design, manufacture and experimental testing.