Embed Size (px)
Citation preview

A Review of developments in
The Global & Indian Steel Industry
Monthly Special edition
Issue No. 37
April 2019 (Covering March 2019)
Compiled on behalf of Indian Steel Association,
By Mr. Anup Kashyap,
Senior Executive-Technical
Strictly for Internal circulation

About the Report
❑ The Indian Steel Association introduced a monthly report titled ‘A REVIEW
OF DEVELOPMENTS IN GLOBAL & INDIAN STEEL INDUSTRY’, from August
2016.
❑ The report provides general background information reviewing the status
of the developments in the global and Indian steel industry, pertaining to
raw material, production & consumption, trade, shipping, pricing &
forecasts, country reportage, policy developments, economic parameters
etc.
❑ The consistent format of the report provides an insight into the relevant
aspects of steel scenario globally and domestically .
❑ The information has been sourced from independent third party databases,
knowledge sources and news reports, and the authenticity of the same has
not been independently verified by ISA.
❑ The report is issued in the last week of each month to the members of
Indian Steel Association , various ministries / departments / institutions.

Contents of the Report
SI.
No
Title Page
Number
1. Global Economic Development 4-7
2. Global Steel Development 8-14
3. Domestic Steel Development 15-21
4. Indian Economic Development 22-24
5. About ISA 25-31

GLOBAL ECONOMIC DEVELOPMENTS
4

Source: Global Forecasting Service
Country-wise Growth Forecasts
2019 - 2023
As of April 17th 2019.
The assumptions for forecasts are available on the website of the Economist Intelligence Unit
In % 2019 2020 2021 2022 2023
India
Real GDP Growth 7.4 7.2 7.5 7.4 7.1
Inflation 3.3 3.2 3.9 4.4 4.1
China
Real GDP Growth 6.3 6.1 5.6 5.3 5.0
Inflation 2.6 2.5 2.6 2.8 2.7
U.S.A
Real GDP Growth 2.2 1.7 1.7 2.0 1.8
Inflation 2.2 1.4 2.2 2.1 2.1
Japan
Real GDP Growth 1.0 0.4 1.1 1.1 1.0
Inflation 1.5 1.7 1.0 1.2 1.4
EU 28
Real GDP Growth 1.4 1.5 1.8 1.9 1.8
Inflation 1.6 1.6 1.9 2.0 1.9
5
Source: BNP Paribas Wealth Management Report Issued in April 2019 6
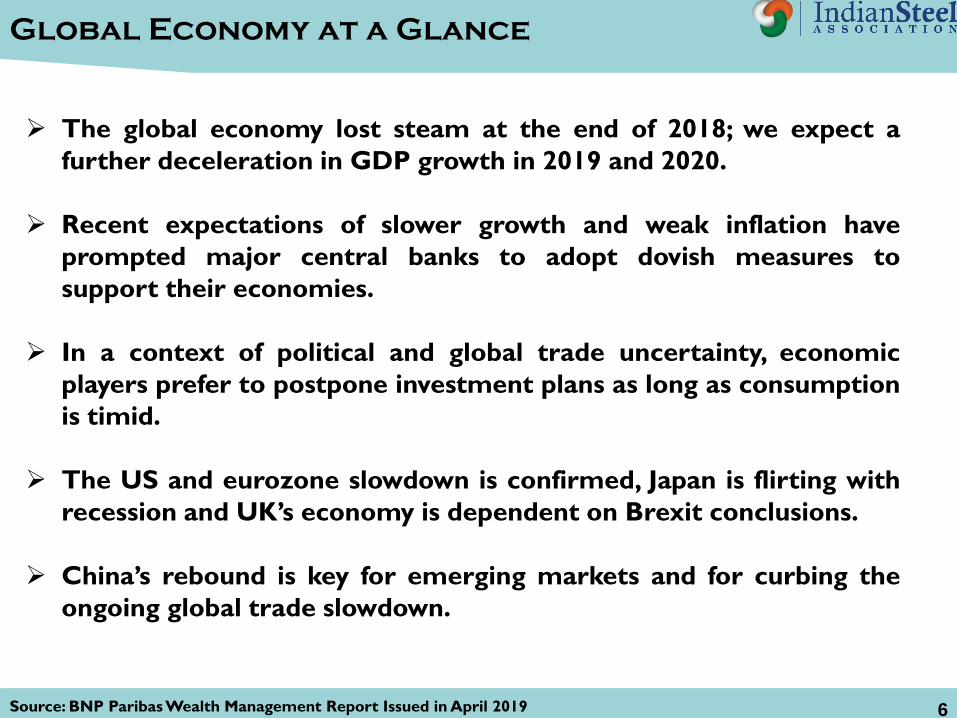
➢ The global economy lost steam at the end of 2018; we expect a
further deceleration in GDP growth in 2019 and 2020.
➢ Recent expectations of slower growth and weak inflation have
prompted major central banks to adopt dovish measures to
support their economies.
➢ In a context of political and global trade uncertainty, economic
players prefer to postpone investment plans as long as consumption
is timid.
➢ The US and eurozone slowdown is confirmed, Japan is flirting with
recession and UK’s economy is dependent on Brexit conclusions.
➢ China’s rebound is key for emerging markets and for curbing the
ongoing global trade slowdown.
Global Economy at a Glance

Source: World Fact on Industrial Production 7
❑ The United States is still the world’s largest economy with a nominal GDP of $18
trillion.
❑ The European Union ranks second with $16.8 trillion while China ranks third
with $11.2 trillion.
❑ Japan and Germany rank third and fourth respectively with $4.4 and $3.5 trillion
respectively.
❑ The UK, France, India, Italy, and Brazil complete the top ten in the order
4566
3602
13681050
672 572 505 478 442
0
1000
2000
3000
4000
5000
China USA Japan Germany India South
Korea
United
Kingdom
France Italy
Industrial Output in (USD Billion DOLLARS)
Countries With The Highest
Industrial Outputs In The World
❖ China leads the world in industrial output.
GLOBAL STEEL DEVELOPMENTS
8

Source: World Steel Association Short Range Outlook April 2019 9
Global Steel Demand
▪ The World Steel Association (worldsteel) forecasts global steel demand will
reach 1,735 Mt in 2019, an increase of 1.3% over 2018. In 2020, demand is
projected to grow by 1.0% to reach 1,752 Mt.
▪ In 2018, global steel demand increased by 2.1%, growing slightly slower than in
2017. In 2019 and 2020 growth is still expected, but in a less favourable economic
environment. China’s deceleration, a slowing global economy, and uncertainty
surrounding trade policies and the political situation in many regions suggest a
possible moderation in business confidence and investment.
▪ Chinese steel demand continues to decelerate as the combined effect of
economic rebalancing and trade tension is leading to slowing investment and
sluggish manufacturing performance. Mild government stimulus cushioned the
economic slowdown in 2018. In 2019, the government is likely to heighten the
level of stimulus, which is expected to boost steel demand.
▪ In 2020, a minor contraction in Chinese steel demand is forecasted as the
stimulus effects are expected to subside.
▪ Steel demand in the emerging economies excluding China is expected to grow by
2.9% and 4.6% in 2019 and 2020 respectively.

Source: World Steel Association,f-Forecast 10
0 500 1000 1500 2000
European Union (EU28)
Other European Countries
CIS
NAFTA
Central and South America
Africa
Middle East
Asia and Oceania
World
Region Wise Steel Demand in Million ton(MT)
2020(f) 2019(f) 2018
▪ Steel demand in the developed economies grew by 1.8% in 2018 following a resilient 3.1% growth in
2017. WSA expect demand to further decelerate to 0.3% in 2019 and 0.7% in 2020, reflecting a
deteriorating trade environment.
▪ The EU economies also face the deteriorating trade environment and uncertainty over Brexit.
▪ Steel demand in developing Asia excluding China is expected to grow by 6.5% and 6.4% in 2019 and
2020 respectively, making it the fastest growing region in the global steel industry. In the ASEAN
region, infrastructure development supports demand for steel.
Region Wise Steel Demand
Source: World Steel,f-Forecast 11
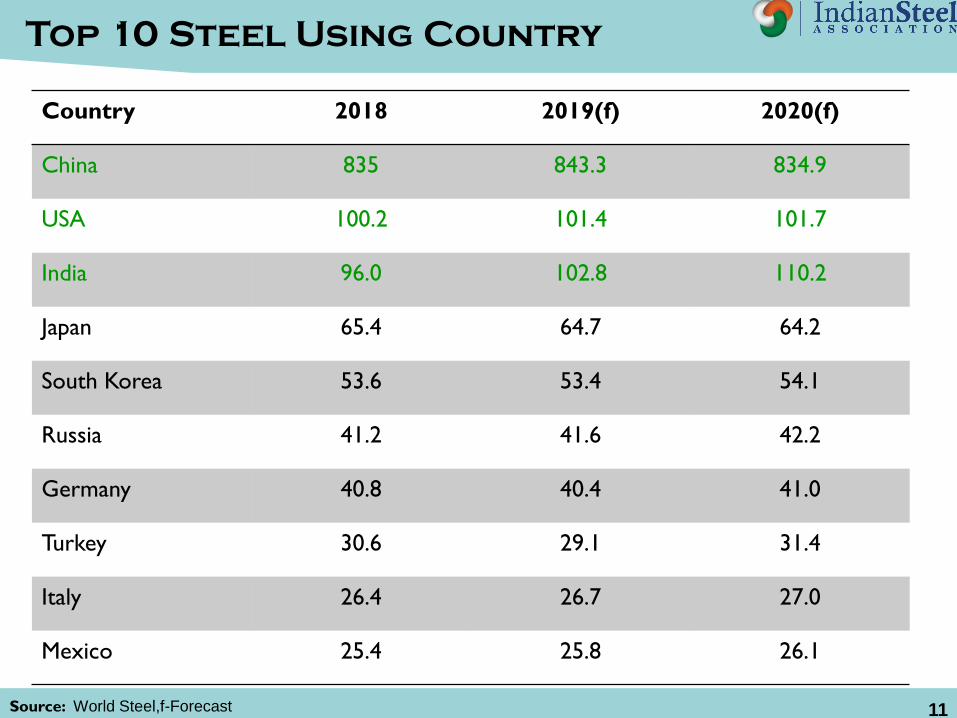
Country 2018 2019(f) 2020(f)
China 835 843.3 834.9
USA 100.2 101.4 101.7
India 96.0 102.8 110.2
Japan 65.4 64.7 64.2
South Korea 53.6 53.4 54.1
Russia 41.2 41.6 42.2
Germany 40.8 40.4 41.0
Turkey 30.6 29.1 31.4
Italy 26.4 26.7 27.0
Mexico 25.4 25.8 26.1
Top 10 Steel Using Country

Source: World Steel 12
Trend in Global Sectorial
Growth in Steel
▪ As pent-up demand and government stimulus measures subsided, the automotive
industry saw a sharp slowdown in growth in 2018 in many countries, in particular in
the EU, Turkey and China. The largest decline was observed in Turkey (-9.0%) and in
the UK (-5.5%). As a result, global auto production growth decelerated to 2.2% in
2018 from 4.9% in 2017.
▪ In 2019, global auto production will continue to decelerate to 1% growth with
stabilisation expected in 2020. However, in Latin America, especially in Brazil, auto
production will buck the trend and continue to show a steady rebound.
▪ The momentum of construction activities is also expected to moderate a bit in the
developed economies, but thanks to the rebound in the developing economies, global
growth will be maintained at a 3% level in 2019-20. However, in China, Turkey, South
Korea and Argentina, construction activities are expected to continue to contract in
2019.
▪ With weakening investment and a worsening trade environment, the global machinery
sector is expected to show a steady deceleration that will last till 2020, which will be
more pronounced in major production hubs such as Germany, Japan and China.

Source: US Custom data 13
Trend in USA Steel Export
▪ USA world’s largest ferrous scrap exporter and one of the leading steel exporter observed
rebound in ferrous scrap export in Feb 2019,whereas export of coal ,Iron Ore and finish
steel products dropped on monthly premises against volume registered in Jan 2019.
▪ Largest Importer Turkey with 25% share in total USA Scrap export observed rise of 90
%.Other scrap importer were South Korea with 18% share and Taiwan with 11% Share.
▪ Nation’s flat steel export move down by 7% in Feb 19 to 0.42 MT which was 0.45 Mt in Jan
2019.During the first two months nation’s flat steel exports registered fall by 14% to 0.87
MT as compared to 1.01 Mt in the same time period of previous year.
Particulars Quantity in tons M-o-M % Y-o-Y %
Coal 9,759,163 -18.8 -17
Finish Flat 419,407 -6.6 -15.3
Iron Ore 191,767 -65.5 -11.7
Finish Long 65,361 -7.2 -46.8
Graphite Electrode 1,112 -16 20.3
US Steel Export in Feb 2019

Source: Coal Mint Research 14
▪ Seaborne premium hard metallurgical coal prices have inched slightly lower this week on
muted trading activity in FOB market amidst thin buying interest for spot cargoes from
Northeast Asia Steel makers.
▪ Latest Offers fro Premium HCC grades was around $ 203.75 per ton FOB Australia, For
Indian Buyers the offer was amount $ 216.25 per ton on CNF India basis.
Trend in Coking Coal Price

DOMESTIC STEEL DEVELOPMENTS
15

Source: Joint Plant Committee, Ministry of Steel 16
April – March
2018-19
April-March
2017-18
% Change over April
– Mar. ,2017-18%
Quantity in Million tons
Crude Steel 106.56 103.13 3.3
Finished Steel
Production for Sale 131.57 126.86 3.7
Import 7.83 7.48 4.7
Export 6.36 9.62 -33.9
Real Consumption 97.54 90.71 7.5
Status of Indian Steel Industry
➢ Production of crude steel was at 106.56 million tonnes (mt), a growth of 3.3%.
➢ At 138 mt, crude steel capacity indicated an utilisation of 77% compared to 75% of last year.
➢ Total finished steel gross production was 131.57mt, an increase of 3.7%.
➢ Export of total finished steel reached 6.36mt, a decrease of 33.9%.
➢ Import of total finished steel was 7.83mt, an increase of 4.7%.
➢ India was a net importer of total finished steel.
➢ Consumption of total finished steel was 97.54mt, an increase of 7.5%.

Source: Ministry of Steel Report March 2019. 17
Trend in Indian Steel Export and Import(MT)
0
5
10
15
2014-15 2015-16 2016-17 2017-18 2018-19
TREND IN STEEL EXPORT AND IMPORT IN MILLION
TONS
Import (MT) Export (MT)
➢ Total finished steel exports stood at 6.36 mt in 2018-19 and declined by 33.9% over 2017-
18 while imports stood at 7.83mt and increased by 4.7% in 2018-19 over 2017-18.
➢ Such trends implied that India emerged as a net importer of total finished steel in 2018-19
in contrast to its net exporter status of 2017-18.
➢ Korean imports (2.94 mt) had the largest share (37%) in major flat items, making it the
largest import market for India during this period. China (imports down by 19%) was the
2nd largest import market, with its share in overall total falling from 26% in 2017-18 to 20%
in 2018-19.
➢ Import of total finished steel valued at Rs.
49317 crore in 2018-19.
➢ Nepal (13% share) was the largest export
market for India during this period.
➢ Exports of total finished steel valued at Rs.
33153 crore in 2018-19.

Source: Joint Plant Committee March 2019 18
47%
26%
27%
Route Wise Steel Production in %-2018-19
% Share of
Oxygen Furnace
% Share of EAF
Route
%Share of
Induction Furnace
Route
Crude
Steel-
106 MT
Route Wise Steel Production in India
➢ Total Steel Production in India in
2018-19 was 106 Million ton.
➢ Oxygen Furnace contributed 47 %
in Production in 2018-19 which was
46 % in 2017-18.
➢ Share of Electric Arc Furnace (EAF)
route was 26 % in 2018-19 which
was similar in 2017-18.
➢ Share of Induction Furnace was
27% in 2018-19 which was 28 % in
2017-18.
➢ Public Sector unit (SAIL and RINL)
produced around 21 MT in 2018-19
and shared around 20 % in total
Steel production of India.

Source: Steel Mint Research 19
Trend of Domestic Steel Price of India
➢ Current trade reference prices in trades for HRC (IS2062) 2.5-8 mm is around Rs 42000
per ton (ex- Mumbai).The Prices mentioned above are basic price excluding GST @18 %
on cash payment basis.
➢ Currently trade reference prices for CRC (IS513 ) 0.9 mm is in the range of INR 47000 per
ton (ex-Mumbai). The Prices mentioned above are basic price excluding GST @18 % on
cash payment basis.
Source: Steel Mint Research 20
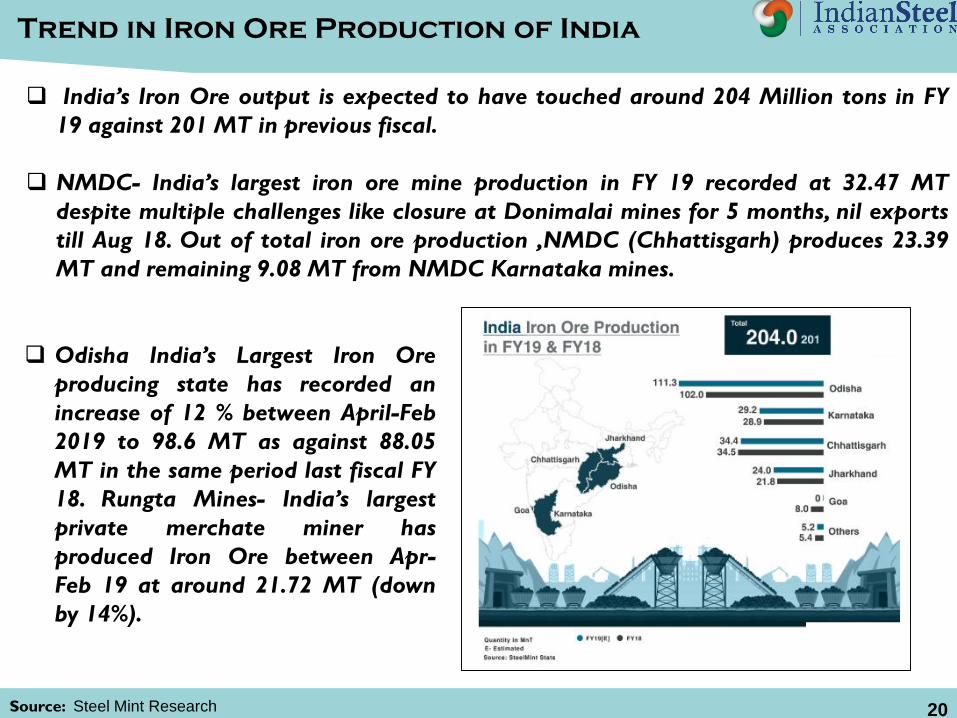
Trend in Iron Ore Production of India
❑ India’s Iron Ore output is expected to have touched around 204 Million tons in FY
19 against 201 MT in previous fiscal.
❑ NMDC- India’s largest iron ore mine production in FY 19 recorded at 32.47 MT
despite multiple challenges like closure at Donimalai mines for 5 months, nil exports
till Aug 18. Out of total iron ore production ,NMDC (Chhattisgarh) produces 23.39
MT and remaining 9.08 MT from NMDC Karnataka mines.
❑ Odisha India’s Largest Iron Ore
producing state has recorded an
increase of 12 % between April-Feb
2019 to 98.6 MT as against 88.05
MT in the same period last fiscal FY
18. Rungta Mines- India’s largest
private merchate miner has
produced Iron Ore between Apr-
Feb 19 at around 21.72 MT (down
by 14%).

Source: Steel mint Research 21
Trend in Coal Import in Million Tons
INDIAN ECONOMIC DEVELOPMENT
22

Source: Central Statistical Organisation 23
➢ The growth rate of the Index of Industrial
Production (IIP) was up by 4 % during April -
February 2018-19 (prov.), encouraged by stable
growth in Electricity (5.5 %), Manufacturing (3.8
%) and Mining (3 %).
➢ The Use-Based scenario of the Index of Industrial
Production (IIP) during April –February 2018-19
(prov.) show that excepting a minor decline in
Intermediate Goods, all the other sectors
recorded a growth with Infrastructure /
Construction Goods (7.7 %)reporting the highest
and Primary Goods, the lowest (3.6 %).
➢ The growth rate of the Eight Core Infrastructure
Industries was up by 4.3 % during April – February
2018-19 (prov.), encouraged by growth in most
sectors, specially Coal (7.1 %) and Cement (13 %),
Electricity (5.4 %) but pulled down by decline in
growth rates in case of Crude Oil (4 %) and
Fertilizers (0.02 %).
Indian Economic Highlights

Source: Reserve Bank of India
CurrencyDate
26th April 2019
I USD 70.14
1 EUR 78.12
1 GBP 90.53
100 YEN 62.80
Base Rate : 8.95-9.40 %
Savings Deposit Rate : 3.50-4.00 %
MCLR (Overnight) : 8.05-8.50 %
Term Deposit Rate > 1 year : 6.25-7.50%
Policy Repo Rate : 6.00 %
Reverse Repo Rate : 5.75 %
Marginal Standing Facility Rate : 6.25 %
Bank Rate : 6.25 %
CRR : 4 %
SLR : 19.00%
Reference Rates
Lending/ Deposit Rates
Reserve RatiosPolicy Rates
Rates at Reserve Bank of India
2019
24

ABOUT ISA
25

About ISA
➢ The Indian Steel Association (ISA) is the voice of the Indian Steel Industry,
in both domestic and global forums. It is at the forefront of all
deliberations pertaining to matters of public & regulatory policy, raw
materials, international trade, logistics, environmental concerns,
technology and other aspects of steel-making. The Indian Steel Industry
looks at ISA to further its critical agenda of sustained growth, both in
steel production and in generating domestic demand.
➢ ISA was formed in 2014 and has 15 members – eight full members and
seven affiliates. The list of full members includes –Steel Authority of India
(SAIL) and Rashtriya Ispat Nigam Ltd (RINL) – while heavyweights from
the private sector include JSW Steel Ltd, Tata Steel Ltd, Jindal Steel and
Power Ltd, Essar Steel India Ltd, Bhushan Power and Steel Ltd and Tata
Steel BSL Ltd. ISA, an affiliate member of World Steel Association (WSA),
regularly collaborates with WSA on the organisation of events, as well as
taking part in other key meetings with global partners.
26

Our eight Full Members are:
• Tata Steel Ltd
• Steel Authority of India Ltd.
• JSW Steel Ltd.
• Rashtriya Ispat Nigam Ltd.
• Essar Steel Ltd.
• Jindal Steel & Power Ltd.
• Tata Steel BSL Ltd.
• Bhushan Power & Steel Ltd.
Our Seven Affiliate Members are Monnet
Ispat & Energy Ltd., INSDAG (Institute
for Steel Development and Growth),
KISMA (Karnataka Iron and Steel
Manufacturer’s Association), Arjas Steel,
Visa Steel, Electrosteel Steels and Orissa
Metalliks Pvt. Ltd
Members of Indian Steel Association
27

Vision and Objectives of ISA
➢Vision of ISA-
To work towards transforming the Indian Steel Industry as a
global leader acclaimed for its Quality, Productivity and
Competitiveness, with a focus on health, safety and
environment, along with a growing thrust on innovation through
R&D, adopting an inclusive and collective approach.
➢ Objectives of ISA-
▪ Promoting steel by raising awareness about the numerous
advantages of good quality steel
▪ Collaborating with international steel organizations to
tackle issues of mutual interest.
▪Working with the government on matters affecting the
steel industry.
28

Important Ministries/Department/Organization
Ministry of Steel
Name of the person Designation Contact Details
Shri Binoy Kumar Secretary [email protected]
Shri Saraswati Prasad Special Secretary & Financial Adviser [email protected]
Smt. Rasika Chaube Additional Secretary [email protected]
Smt. Ruchika Chaudhry Govil Joint Secretary [email protected]
Shri Puneet kansal Joint Secretary [email protected]
Ministry of Mines
Name of the person Designation Contact Details
Shri Anil Gopishankar Mukim Secretary [email protected]
Dr. K. Rajeswara Rao Additional secretary [email protected]
Ministry of Commerce
Name of the person Designation Contact Details
Shri Anup Wadhawan Secretary [email protected]
Shri Shudhanshu Pandey Additional Secretary [email protected]
Shri Alok Vardhan Chaturvedi DGFT [email protected]
Dr. K.C.Rout Additional Secretary-DGFT [email protected]
Ministry of Environment, Forest and Climate Change
Name of the person Designation Contact Details
Shri C K Mishra Secretary [email protected]
Control Pollution Central Board
Name of the person Designation Contact Details
Shri S.P. Singh Parihar Chairman [email protected]
Dr. Prashant Gargava Member Secretary [email protected]
Ministry of FinanceName of the person Designation Contact Details
Shri Rajiv Kumar Joint Secretary [email protected]
29

Contact Us for data related issues
Address:207-208, 2nd Floor
Kailash Building
New Delhi -110-001
India
Tel: +011 4266 8811
Fax: +011 4266 8805
E-mail: [email protected]
Website: http://indsteel.org/30
THANK YOU
DISCLAIMER
The material in this presentation has been prepared by Indian Steel Association (ISA) and is a general background information reviewing the
status of the developments in the global and Indian steel industry as at the date of this presentation. This presentation is strictly for internal use
of all the member companies of ISA, whose names have been stated in the presentation.
Information is given in summary form and does not purport to be complete or all inclusive. The information has been sourced from independent
third party databases, knowledge sources and news reports, and the authenticity of the same has not been independently verified by ISA.
Additionally, any third party forecasts on financial or economic parameters, projections or estimates should not be construed as an investment
advice or a recommendation to any ISA member. Recipients of this presentation from member companies of the ISA should each make their own
evaluation of the contents and adequacy of the information contained in the presentation.
ISA does not undertake any obligation to publicly release any changes to any revisions, modifications or forward looking statements in the
subsequent editions of this bi-monthly presentation. Unless otherwise specified, all information is for the period April 2019 or prior.
31