Embed Size (px)
Citation preview

A Review of Artificial Reefs for Coastal Protection in NSW
WRL Technical Report 2012/08
June 2013
by M J Blacka, T D Shand, J T Carley and A Mariani

A Review of Artificial Reefs for Coastal Protection in NSW
WRL Technical Report 2012/08
June 2013
by
M J Blacka, T D Shand, J T Carley, and A Mariani

Project Details
Report Title A Review of Artificial Reefs for Coastal Protection in NSW
Report Author(s) M J Blacka, T D Shand, J T Carley, and A Mariani
Report No. 2012/08
Report Status Final
Date of Issue 11 June 2013
WRL Project No. 2012001
Project Manager Matt Blacka
Client Name Office of Environment and Heritage
Client Address Level 4, Honeysuckle Drive
Newcastle NSW 2300
Client Contact Jane Gibbs
Client Reference
Document Status
Version Reviewed By Approved By Date Issued
Draft V1.0 J T Carley, T D Shand G P Smith 28/03/2013
Final Draft V2.0 J T Carley G P Smith 17/05/2013
Final J T Carley G P Smith 11/06/2013
DISCLAIMER
This report was produced by the Water Research Laboratory, School of Civil and Environmental Engineering,
University of New South Wales for use by the Client in accordance with the terms of the contract.
The report was produced in good faith exercising all due care and attention, but no representation or
warranty, express or implied, is made as to the relevance, accuracy, completeness or fitness for purpose of
this document in respect of any particular user’s circumstances. Users of this document should satisfy
themselves concerning its application to, and where necessary seek expert advice in respect of, their
situation. The views expressed within are not necessarily the views of the Office of Environment and
Heritage (OEH) and may not represent OEH policy.
© Copyright State of NSW and the Office of Environment and Heritage

- i -
Executive Summary
ES.1 Overview
This report presents a comprehensive review of the use of submerged constructed reefs (SCRs)
for coastal protection in NSW. SCRs are often proposed as a ‘softer’ protection option due to
their simulation of natural processes and negligible visual intrusion. Conclusive information
regarding SCRs is less well documented within the literature compared with more conventional
coastal structures. While the review has primarily focused on the use of SCRs for providing
coastal protection, and in particular the applicability of SCRs for the NSW coast, a broader range
of aspects have also been considered. The study was based on an extensive review of
international literature that considered in excess of one hundred and fifty (150) references.
ES.2 Design and Analysis Methods
The stability of rock armouring on submerged breakwaters has been studied in numerous
detailed investigations and reasonable empirical design guidance is available. Most relevant
design methods for submerged rock structures have been summarised in the report, and the
state-of-the-art empirical design equations have been recommended. In contrast, the
understanding of the behaviour of large sand filled geotextile containers under wave attack is
not yet well developed. A small number of studies looking at the stability of geotextile
containers and tubes have been undertaken with varying approaches and results. However,
there is no single publication presenting stability design curves or equations for geotextile tube
submerged reef structures. While it is generally stated that the geotextile mega containers used
in reef construction are so large that they are inherently stable, experience from existing reefs
has shown that the tubes are able to be dislodged, re-worked, and damaged by wave attack.
There has been considerable improvement in the understanding of the mechanisms driving
shoreline response to submerged reef/breakwater structures over the past decade, nevertheless
all completed studies have significant limitations. No single study has comprehensively tested
the effects of primary structural and environmental variables on quantitative shoreline response
and the shoreline response equations published are based on either approximate field
measurements of a limited number of parameters, or un-calibrated and un-validated modelling
(both physical and numerical). This suggests that the available empirical techniques for
assessing shoreline response are suitable only for preliminary engineering calculation and not
detailed design. Structures that are designed using these methods should be considered as trial
or experimental only and shoreline response to these designs will inherently contain higher
uncertainty than many other beach control structures.
Numerical models are well suited to assessing wave, hydrodynamic, and morphological aspects
of reef structures, with the degree of certainty in model predictions proportional to the level of
model calibration. Physical models should be used preferentially for assessing reef armour
stability, wave and hydrodynamic processes, and can also be applied to gain valuable qualitative
and semi-quantitative insight into morphological response, but scaling limitations mean that they
do not provide a complete answer. It is recommended that detailed design of any SCR structure
adopt a hybrid modelling approach, whereby the individual strengths of both numerical and
physical models are utilised to arrive at the final reef design. Furthermore, it is recommended
that modelling of any structure with environmental, social, or economic significance be
underpinned by site specific data collection programs for wave transformation, water levels, and
sediment transport.

- ii -
ES.3 Existing Reef Projects
A review of existing SCR structures around the world was undertaken with key engineering,
environmental and cost information for each structure summarised in the report. Based on this
review, the key findings were:
Of the thirty-two (32) SCR structures reviewed, twenty-nine (29) were intended to
provide coastal protection as a primary or secondary objective;
Approximately half of the “protection” structures had no significant accretionary impact
on shoreline alignment compared to the predicted morphological response;
55% of submerged breakwaters were successful at providing increased coastal
protection, though not all to the degree initially predicted;
One of five multi-purpose reef (MPR) structures may be providing a reasonable level of
coastal protection but this structure has only been monitored for two to three years.
Three other MPRs provide only minor or negligible coastal protection compared to
design, and the performance of the newest MPR (Borth) is yet to be determined;
Eight artificial reefs were constructed with the objective of improving surfability and
approximately half of these were considered at least partially successful;
The resulting shoreline morphology behind reef structures often differed significantly
from the design predictions, even when the best available design methods were applied;
Most structures settled and/or suffered from localised scour which resulted in an actual
crest level which differed from that specified by design and subsequently led to further
maintenance and top up costs or under performance; and
Approximate construction costs per linear metre of coastline protected were in the order
of $1,500 to $5,500 for submerged breakwater structures and $7,000 to $10,000 for
MPR structures, compared with $5,000 to $10,000 for a high quality engineered rock
seawall on the open NSW coast. The relatively high wave climate of the NSW coast is
likely to further increase the construction costs of the offshore structures relative to the
precedent structures located in milder wave climates.
ES.4 Application of Submerged Constructed Reefs in NSW
In recent years SCRs and in particular MPRs have been proffered as a coastal protection option
for some NSW communities, due to the perception of the benefits outweighing the limitations.
However, within NSW the use of MPRs that combine surfing and protection objectives are likely
to be limited in success by a number of factors including:
NSW has a tidal range of approximately 1.5 m and a multi-directional wave climate with
a wide wave height and period distribution. To accommodate surfing as a design
objective the cross-shore dimension of a MPR has to be large enough to allow proper
wave pre-conditioning under a range of wave and tidal conditions. This makes the
structures relatively cost-inefficient at protecting any significant stretch of coast, unless
used in series (which is expensive compared to other protection options);
- iii -
Most sections of the NSW coast are relatively rich in high quality natural surf breaks,
resulting in high community expectations if surfing is a primary design objective; and
Safety concerns for the various reef users results in reef designs that are not optimum
for coastal protection or surfing.
As with all coastal protection structures being considered within the NSW coastal management
framework, it is important that feasibility assessments of SCR structures give consideration to
several key points:
The existing hazards need to be well defined before a reef can be assessed for feasibility,
if coastal protection is an objective;
A range of alternative solutions should be considered at the feasibility stage to allow
selection of the best option to achieve the management objectives;
The reduction in hazard that can be achieved by the reef needs to be predicted through
technical assessments and quantified in terms of present and future hazard/risk
reduction; and
The predicted reduction in hazard should be considered in terms of its environmental,
financial, and social costs and benefits.
ES.5 Future Applications of Submerged Constructed Reefs
On a relatively simple, straight coastline, it is likely that an emergent offshore breakwater
designed in accordance with published methods would form a locally widened beach, provided
there is sufficient available sand. The uncertainty in beach response increases as the crest
elevation is lowered and the structure becomes submerged. This appears to stem from the
complexity of processes leeward of the reef hampering understanding of the morphological
response to reef structures in a naturally variable environment. As a result there is inherently a
larger uncertainty associated with these structures. This uncertainty needs to be considered in
any feasibility analysis, as it presents a significantly higher risk in comparison with other forms
of coastal protection.
Consideration of SCRs built to date shows a relatively large number of structures underperforming in
coastal protection objectives, even for cases where significant effort was put into very technical
designs. This cannot be ignored when considering the current ability to be able to successfully
predict the processes surrounding a SCR with required accuracy. Furthermore, many failures have
been as a result of structural problems due to complexities of building a structure in an active surf
zone on loose unconsolidated materials. This highlights the considerable improvements that are still
needed in the design and construction of submerged reef structures.
Regardless of these current limitations, the potential benefits of SCRs mean that they should
continue to be considered as an option for hard coastal protection, so long as the design and
expectations take into consideration the lower level of certainty in performance. Future
construction and monitoring of SCRs will result in an improved understanding of the processes
and refined methods for predicting shoreline response to these structures. Throughout this
period of ongoing improvement, consideration should be given to trial and experimental
structures to reduce uncertainty and to create structures which meet the desired objectives.

- iv -
The difficulty in attempting to meet multiple objectives is that the success in meeting one
objective may be diluted by the attempts to meet the others. While some community groups
may continue to favour multi-purpose structures due to their perceived benefits, there is little
doubt that focussing the objective of coastal protection structures on coastal protection rather
than multiple objectives will achieve improved results with more reliability and increased
efficacy.
- i -
Contents
Executive Summary i ES.1 Overview i ES.2 Design and Analysis Methods i ES.3 Existing Reef Projects ii ES.4 Application of Submerged Constructed Reefs in NSW ii ES.5 Future Applications of Submerged Constructed Reefs iii
1. Introduction 1 1.1 Foreword 1 1.2 Terminology and Glossary 1 1.3 Study Objectives and Limitations 3
2. Design of Submerged Constructed Reefs 5 2.1 Background on Development of Submerged Constructed Reefs 5 2.2 General Design Considerations and Available Guidance 6 2.3 Design of Reef Stability 6
2.3.1 Overview 6 2.3.2 Rock Armour Stability: Ahrens (1987) Method 7 2.3.3 Rock Armour Stability: Ahrens and Cox (1990) Method 8 2.3.4 Rock Armour Stability: Vidal et al. (1992) Method 8 2.3.5 Rock Armour Stability: Van der Meer (1990) Method 10 2.3.6 Rock Armour Stability from DELOS Project 11 2.3.7 Geocontainer Armour Stability 12 2.3.8 Summary Box: Reef Armour Stability 13
2.4 Design of Hydrodynamic Processes 13 2.4.1 Overview 13 2.4.2 Wave Transmission after Ahrens (1987) 14 2.4.3 Wave Transmission after Van der Meer and Daemen (1994) 14 2.4.4 Wave Transmission after d’Angremond et al. (1996) 15 2.4.5 Wave Transmission after Seabrook and Hall (1998) 15 2.4.6 Wave Transmission from DELOS Project 15 2.4.7 Wave Transmission after Bleck (2006) 16 2.4.8 Summary Box: Reef Wave Transmission 16 2.4.9 Hydrodynamics and Forcing Mechanisms 17
2.5 Design of Morphological Response 20 2.5.1 Overview 20 2.5.2 Shoreline Response 20 2.5.3 Summary Box: Morphodynamic Beach Response 25
2.6 Surfing Amenity Considerations 26 2.7 Reef Construction Materials and Methods 30
2.7.1 Overview of Construction Materials 30 2.7.2 Rock Armour 30 2.7.3 Geotextile Tubes/Containers 32 2.7.4 Pre-Cast Concrete Reef Units 37 2.7.5 Other Reef Materials 39 2.7.6 Summary Box: Suitability of Reef Materials for Application in NSW 40
3. Modelling of Artificial Reefs 41 3.1 Physical Modelling 41
3.1.1 Overview 41 3.1.2 Wave and Hydrodynamic Modelling 41

- ii -
3.1.3 Structure Response Modelling 43 3.1.4 Morphological Response Modelling 44 3.1.5 Physical Modelling Limitations 45
3.2 Numerical Modelling 46 3.2.1 Overview 46 3.2.2 Processes in Morphological Modelling 46 3.2.3 Calibration and Validation of Models 47 3.2.4 Offshore Waves 48 3.2.5 Wave Transformation to Shore 48 3.2.6 Wave Transformation on the NSW Open Coast 49 3.2.7 Hydrodynamic/Surf Zone Circulation Models 51 3.2.8 Sediment Transport, Morphology and Shoreline Response 53 3.2.9 Beach Profile and Planform Models 54 3.2.10 Surfability Models 56 3.2.11 Commonly Used Models 56
3.3 Example Applications of Physical and Numerical Models for Artificial Reefs 58 3.4 Summary Box: Application of Physical and Numerical Models for SCR Structures 59
4. Performance and Review of Existing Reefs 60 4.1 Outline of Review of Existing Submerged Constructed Reefs 60 4.2 Summary of Existing Submerged Constructed Reefs 61 4.3 Discussion of Existing Submerged Constructed Reef Performance 69 4.4 Lessons Learnt from Existing Submerged Constructed Reef Projects 72 4.5 Summary Box: Analysis of Existing SCR Structures 73
5. SCRs and Coastal Protection in NSW 74 5.1 Overview of Submerged Constructed Reefs and their Application in NSW 74 5.2 Using Reefs for Coastal Protection Specifically in NSW 74 5.3 Guidelines for Assessing the Feasibility of Reefs for Coastal Protection in NSW 76 5.4 Social Considerations for Reefs in NSW 77 5.5 Summary Box: Recommendations for Assessment and Use of Reefs in NSW 79
6. Risk and Recovery from Failure 80 7. Conclusions 81
7.1 Overview 81 7.2 Design and Analysis Methods 81 7.3 Existing Reef Projects: 82 7.4 Future Applications of Submerged Constructed Reefs 82
8. References 84
Appendix A 92

- iii -
List of Tables
Table 1.1: Submerged Constructed Reef Terminology 2 Table 2.1: Summary of SCR Stability Design References 7 Table 2.2: Damage Parameter S for Different Damage Levels and Structure Sections 9 Table 2.3: Required Rock Armour Size for Various Reef Depths (with Crest Submerged 1 m) 31 Table 2.4: Suitability of Reef Materials for Application in NSW 40 Table 3.1: Summary of Commonly used Coastal Morphology Models 57 Table 4.1: Reef Summary: Structure Type, Intended Purpose and Successfulness 63 Table 4.2: Reef Summary: Engineering Aspects 65 Table 4.3: Reef Summary: Environmental Conditions 67 Table 4.4: Approximate Reef Cost Rates 69
List of Figures
Figure 2.1: Diagram of Terminology for Reef Breakwater Rock Stability After Ahrens (1987) 7 Figure 2.2: Stability Charts for Rock Armour After Vidal et al. (1992) 10 Figure 2.3: Variables for Investigation by Van der Meer and Daemen (1994) 14 Figure 2.4: Circulation Patterns Around Submerged Structures 18 Figure 2.5: Circulation Patterns Around a Submerged Structure 19 Figure 2.6: Current Patterns and Reef Configuration 20 Figure 2.7: (a) Geometry Definition for Offshore Features; (b) Shoreline Response for Emergent
Islands and(c) Shoreline Response for Submerged Reefs (Black and Andrews, 2001) 21 Figure 2.8: Analysis of Salient Features in NSW 22 Figure 2.9: Shoreline Response to Submerged Structures 23 Figure 2.10: Mode of Shoreline Response to Submerged Breakwaters 24 Figure 2.11: Parameters used to Quantitatively Describe Surfing Aspects of Breaking Waves 27 Figure 2.12: Breaking Wave Classification for Surfer Skill Level 28 Figure 2.13: Type of Wave Preferred by Different Reef Users 29 Figure 2.14: Placing Rock on the Cable Station Reef by Barge Mounted Excavator 31 Figure 2.15: Placement of a Geotextile Tube by dropping from a Split-Hull Vessel 33 Figure 2.16: RAD Reef Construction Method at Mount Maunganui 34 Figure 2.17: Construction of the Boscombe MPR 34 Figure 2.18: In-situ Filling of Emergent (Left) and Submerged (Right) Geotextile Tubes 35 Figure 2.19: Placement of Smaller Geotextile Bags by Sling at Pratte's Reef 36 Figure 2.20: Placement of Smaller Geotextile Bags by Special Excavator Bucket 36 Figure 2.21: PEP Reef Units 37 Figure 2.22: Beachsaver Reef Units 37 Figure 2.23: Double-T Sill Units 38 Figure 2.24: Precast Tecnoreef (Left) and Reef Ball (Right) Reef Units 38 Figure 3.1: Physical Modelling of Wave Breaking on the Mount Maunganui MPR 42 Figure 3.2: Physical Modelling of Wave Generated Currents around Submerged Breakwaters 42 Figure 3.3: Physical Modelling of Wave and Structure Interaction 43 Figure 3.4: Mobile Shoreline Response Physical Modelling for Narrowneck Reef 45 Figure 3.5: Illustration of Pessimistic Calibration Scenario 47 Figure 3.6: Refraction along a Straight Beach with Parallel Bottom Contours 50 Figure 3.7: Refraction along an Irregular Shoreline 50 Figure 3.8: Example of Velocity Fields for Simplified Engineering Options (2D-H Model) 52 Figure 3.9: Illustration of Undertow, 2D-H, Quasi 3D and 3D Flow 52

- iv -
Figure 3.10: Flow Diagram of Tide Averaged Morphodynamic Model 53 Figure 3.11: Example of Bathymetric Change for Coastal Engineering Options 54 Figure 3.12: Salient Cross Shore Profile 55 Figure 3.13: GENESIS Modelling of Semaphore Park Offshore Breakwater 55 Figure 4.1: Borth MPR June 2012, Wales 60 Figure 4.2: ReefballTM Submerged Breakwaters, Gran Dominicus, Dominican Republic 61 Figure 4.3: Location of SCRs Around the World 62 Figure 4.4: Successful Submerged Breakwater, Pellestrina Island in the Venice Lagoon, Italy 70 Figure 4.5: Kovalam MPR, Kerala India 71 Figure 5.1: Narrowneck Reef "Sucking Dry" During a Wave Trough 78

WRL Technical Report 2012/08 Final Report June 2013 1
1. Introduction
1.1 Foreword
The NSW coastline is a dynamic environment, frequently exposed to high energy wave events, which
have the potential to cause episodic erosion of the upper beach. Parts of the coastline are also heavily
developed with public infrastructure and private property occasionally threatened by such erosion
episodes. While periodic erosion caused by large storm events affects the entire open coastline of NSW,
the coastline generally recovers over subsequent months and years as sand returns onshore. Some
locations, however, suffer from ongoing or chronic recession, often due to negative sediment budgets. As
sea levels continue to rise, it is expected that the number of locations suffering chronic recession will
increase. These differences in coastal processes are an important consideration when determining
appropriate management and adaptation techniques. Globally, approaches to combat short-term erosion
or longer-term recession have included both ‘soft’ measures such as beach nourishment with additional or
relocated sand or ‘harder’ protection measures such as the construction of seawalls to restrict the erosion
of material from the backshore, groynes to trap sand and increase beach width, and offshore breakwaters
to reduce wave climate and longshore current in their lee.
This report reviews the use of Submerged Constructed Reefs (SCRs) to provide coastal protection.
SCRs are often proposed as a ‘softer’ protection option due to their simulation of natural processes
and negligible visual intrusion. While design guidance and case studies for more conventional
structures are well covered within the literature, conclusive information regarding SCRs is less well
documented.
The possibility of using submerged structures for shoreline protection has been recognised since at
least the early 1950s with Johnson et al. (1951) reporting on the wave damping action of submerged
breakwaters. Griggs (1969) proposed that similar submerged structures could be used to enhance
beach amenity by creating waves conducive to surfing. Studies by Walker (1971; 1974) defined
surfing parameters enabling more precise design of structures for such use, however, it was not until
the late 1990s when structures were built specifically for this purpose (Pattiaratchi, 1999; Skelly,
2002). Due to the high costs of construction, and diverse-stakeholder interest in SCRs, multi-
purpose structures suitable for surfing, enhancing marine life and providing beach protection, have
more recently been constructed (e.g. Narrowneck Reef at the Gold Coast, Jackson et al., 2007).
1.2 Terminology and Glossary
The terminology applied to submerged reefs and breakwaters can be somewhat inconsistent, and this
has led to misinterpretation of previous studies and their outcomes. A clear and uniform set of
definitions has been applied throughout this report to avoid this issue. These definitions have also
been applied to reviews of previous studies, where the original authors may have used differing
terminology.
The terminology applied throughout this report is summarised in Table 1.1 along with the range of
other terms widely used in literature to describe reef structures. The term Submerged Constructed
Reef (SCR) has been used within this report to include submerged breakwaters, artificial surfing reefs
(ASRs) and Multi-Purpose Reefs (MPRs). Submerged breakwaters are a variation of the classical
emergent offshore breakwater whereby wave energy is reduced by wave breaking and diffraction
around the breakwater ends. ASRs are submerged reef structures where the primary design
objective has been to provide increased surfing amenity, while MPRs have been designed to achieve

WRL Technical Report 2012/08 Final Report June 2013 2
multiple objectives such as coastal protection, ecological habitat, and improved surfing, fishing, or
diving amenity.
Table 1.1: Submerged Constructed Reef Terminology
Other technical coastal engineering terms used regularly throughout the report are described below:
Erosion: Short-term loss of sediment from the upper beach due to storm effects, and
generally large waves combined with elevated water levels;
Recession: Long-term landward shoreline movement associated with a negative sediment
budget or sea level rise;
Submerged Constructed Reef (SCR)
Definition:
Any submerged artificial structure. Includes ASRs, MPRs, and submerged breakwaters
Artificial Reef
Definition:
An artificial reef structure, typically submerged during most tides, with a single intended purpose. This may include enhancing surfing amenity, enhancing marine habitat and assosciated amenity or for coastal protection.
Other Common Names:
Artificial Surfing Reef (ASR), Artificial Fishing Reef, Offshore Artificial Reef (OAR)
Multi-Purpose Reef (MPR)
Definition:
An artificial reef structure, typically submerged during most tides, where the structure is intended to achieve multiple objectives. These may include erosion protection, marine habitat, recreational amenity including surfing, diving, fishing, etc.
Other Common Names:
Multi-Purpose Artificial Reef, Multi-Function Artificial Reef
Submerged Breakwater
Definition:
A submerged artificial structure, detached from the shoreline and intended primarily to reduce wave climate in the structure lee (typically for coastal protection) and accrete sand in its lee. A reef breakwater is a specific subcategory of submerged breakwater where the armouring is a homogeneous rubble grading which is designed to reshape under wave attack.
Other Common Names:
Low-crested breakwater, low-crested structure, submerged rubble mound, submerged detached breakwater

WRL Technical Report 2012/08 Final Report June 2013 3
Accretion: Accumulation of sediment at the upper beach due to either a positive sediment
budget, a change in environmental conditions or trapping of sediment;
Salient: Localised sediment accretion, typically in the lee of an offshore structure, whereby
the sediment build-up does not connect sub-aerially to the structure;
Tombolo: Localised sediment accretion, typically in the lee of an offshore structure, whereby
the sediment build-up connects sub-aerially to the structure. (The transition between Salient
and Tombolo is not precise – these features may transition from one state to the other);
Protection: A reduction in the effects of erosion or recession on a beach as a result of the
installation of a structure.
1.3 Study Objectives and Limitations
This review has primarily focused on the use of SCRs for providing coastal protection, and in
particular, the applicability of SCRs for the NSW coast. The review was based on an extensive review
of international literature and considered in excess of 150 references. The literature list reviewed for
this study includes document categories such as:
Conference papers;
Journal papers;
Site specific design reports;
Data collection reports;
Physical/numerical modelling study reports;
Technical notes;
Design manuals;
Research theses (honours, masters, PhD);
Scoping and proposal documents;
Presentation slides.
In general, the review has put more emphasis on recent documents that are considered to be based
on robust science/engineering research, as well as studies that present information for existing reef
structures. Nevertheless, other pieces of literature were considered for their contribution to the
review, even if only to highlight gaps in the current understanding or to identify other references
worthy of consideration.
This review has been divided into four main areas:
1. Summary of design information (Section 2);
2. Assessment of the use of numerical and physical models for SCR design (Section 3);

WRL Technical Report 2012/08 Final Report June 2013 4
3. Assessment of performance of existing SCRs (Section 4);
4. The application of SCRs within NSW coastal management (Section 5).
Based on this review, conclusions have been drawn regarding the design, construction and use of
SCRs for protection of the NSW coast.
While considered comprehensive and robust, this study was based on currently available literature
and has not analysed or reanalysed any data. Unpublished and/or confidential reports may exist
which were not available to the present study.

WRL Technical Report 2012/08 Final Report June 2013 5
2. Design of Submerged Constructed Reefs
2.1 Background on Development of Submerged Constructed Reefs
The historical applications for submerged constructed reefs have included shoreline protection,
recreational amenity, ecological improvement or increase to fishing potential. Bleck (2006) cites the
first reported utilisations of artificial reefs as being for this latter purpose with Japanese fishermen
submerging wooden frames after observing increased fish in the vicinity of shipwrecks. This
application has remained the major reason for construction of submerged reefs with significant
literature and design guidance available (i.e. Thierry, 1988; Lukins and Selberg, 2004; NOAA, 2007;
The Ecology Lab, 2008).
Offshore structures are used to provide protection of the shoreline by promoting deposition of
sediment in their lee (CIRIA, 2008). This is achieved in emergent structures by reducing or
preventing transmitted wave energy, thereby altering the wave crest patterns in their lee and locally
reducing the longshore sediment transport rate. Submerged or low-crested structures are a sub-
group of this type of coastal protection whereby the structure is submerged for all or a portion of the
tidal cycle. These structures are intended to break larger, less frequent waves but to allow
transmission of more typical waves. If correctly designed, this is intended to reduce hydraulic
loading to a required level to maintain dynamic equilibrium at the shore (CIRIA, 2008).
Low crest level breakwaters are often preferred for aesthetic reasons, however, the effectiveness of
narrow, low-crested structures reduces with less freeboard, particularly in tidal environments and
where storm surge frequently occurs (Pilarczyk, 2003). Effectiveness may be improved with wider
crest levels, i.e. designing artificial reef structures rather than submerged breakwaters. Such
structures have become popular in Japan (Pilarczyk, 2003), however, required reef volumes and
associated costs are significantly higher than for narrow crested structures.
While Johnson et al. (1951) presented findings on the wave damping action of submerged
breakwaters, one of the first examples of construction of a submerged breakwater for coastal
protection was reported by Abecasis (1964). Following damage to breakwaters protecting the port of
Leixoes, Portugal, and with rapid repair required due to the approaching storm season, design was
changed to that of a submerged structure (Bleck, 2006). Subsequent functionality and economy of
the structure were reported as positive. While emergent breakwaters have remained a popular, and
generally successful means of coastal protection (Ranasinghe and Turner, 2006), fewer examples of
submerged structures have been completed. Lamberti and Mancinelli, (1996) report of over 50
submerged breakwaters constructed in Italy. Ranasinghe and Turner, (2006) report on 10 such
structures constructed as of 2006. They report on their physical characteristics and their
effectiveness in terms of beach response and conclude that while beach response in the lee of
emergent structures is nearly always accretionary, submerged structures have resulted in both
accretionary and erosive beach response.
While the idea of using such artificial structures to enhance recreational surfing amenity was first
proposed by Griggs (1969) in Surfer Magazine, the concept was not implemented until the late 1990s
with a string of artificial reefs constructed in Australia and the United States for the sole or combined
intent of enhancing surfing amenity and providing shoreline protection (Pattiaratchi, 1999; Skelly,
2002; Jackson et al. 2007). Since then a number of additional reefs have been completed in New
Zealand, India and the United Kingdom.

WRL Technical Report 2012/08 Final Report June 2013 6
There are approximately 70 breakwaters/training walls on the open coast of NSW. Many of these
have associated surf breaks. Most of these were designed and constructed in the late 1800s and
early 1900s, so no surfing amenity was considered in their design. Nevertheless, recognised surf
breaks are now associated with many of these structures.
2.2 General Design Considerations and Available Guidance
The European Union DELOS project investigated engineering, socio-economic, and environmental
aspects specifically with regard to low-crested structures. This project had contributions from a wide
range of European investigation teams and is the most comprehensive and holistic design guidance
currently available. While numerous investigation reports were produced as a part of the study (not
all are publically available), Burcharth et al. (2007) is a published book entitled “Environmental
Design of Low-Crested Structures” and presents a compilation of the knowledge and methods
determined from the project. While it is comprehensive and best-practice with regard to submerged
breakwaters, Burcharth et al. (2007) does not present information specifically targeted at MPR
structures.
Yoshioka et al. (1993) present a “Design Manual for Artificial Reefs” based on several studies
undertaken in Japan. This manual focusses on the technical aspects of wave breaking, dissipation,
and hydrodynamics associated with submerged breakwater structures.
Pilarczyk (2003) presents design guidance for submerged structures in the publication “Design of
Low Crested (Submerged) Structures - an Overview”. This reference has a particular focus on wave
transmission, hydrodynamics, and morphological response.
CIRIA (2008) provides a detailed scoping investigation into the application of MPRs in the UK with
many aspects relevant and applicable to NSW. The scoping study presents useful case studies from
existing projects around the world. In particular, the report presents detailed descriptive information
regarding the planning and requirements for the various purposes for which MPRs can be designed.
Little technical design information is presented.
2.3 Design of Reef Stability
2.3.1 Overview
For emergent rock structures, the first published work on rock stability was published in Spanish in
1938 by the Spanish engineer Iribarren (1938), “A formula for the Calculation of Rock-Fill Dykes”.
This related the size of rock armour required to the incident wave height. It was translated into
English by the US Beach Erosion Board in 1949. The first original English language publication on
rock stability was the work of Hudson (1953), “Wave Forces on Breakwaters”, which remains in use
for initial approximations of rock size on emergent structures.
The stability of rock armouring on submerged breakwaters has been studied in numerous detailed
investigations (predominantly based on physical model studies), and reasonable empirical design
guidance is available. In contrast, the understanding of the behaviour of large sand-filled geotextile
containers under wave attack is not yet well developed. A small number of studies looking at the
stability of geotextile containers and tubes have been undertaken, with varying approaches and
results, however, there is no single publication presenting stability design curves or equations for
submerged reef structures constructed from either rock or geotextile containers.

WRL Technical Report 2012/08 Final Report June 2013 7
Table 2.1 presents a summary of the investigations relevant to the stability of reef armouring.
Table 2.1: Summary of SCR Stability Design References
Reference Relevance
Ahrens (1987) Response of Reef Breakwater Rock Armouring
Ahrens and Cox (1990) Response of Reef Breakwater Rock Armouring
Vidal et al. (1992) Reef Breakwater Rock Armour Stability
Van der Meer (1990) Submerged Breakwater Rock Armour Stability
DELOS Project Submerged Breakwater Rock Armour Stability
Hudson and Cox (2001) Geotextile Container Stability
Recio and Oumeraci (2009) Geotextile Container Stability
Borrero et al. (2010) Geotextile Container Stability
2.3.2 Rock Armour Stability: Ahrens (1987) Method
Early studies into the stability of rock rip-rap when used in submerged reef breakwaters were
presented in Ahrens (1987), with results based on a series of two-dimensional physical model
studies. This investigation looked at the stable crest elevation above the sea bed (hc) for given rock
mass and density, water depth, and wave conditions. Figure 2.1 summarises the terminology.
Figure 2.1: Diagram of Terminology for Reef Breakwater Rock Stability After Ahrens (1987)
This work characterised damage by the reef response slope which was observed to become flatter as
waves become more severe, and followed Equation 1.
(
) Equation 1
Where:
NS* = Spectral Stability Number as shown in Equation 2.
(
)
⁄
(
)
⁄(
)
Equation 2

WRL Technical Report 2012/08 Final Report June 2013 8
At = Cross sectional area of reef
hc’ = As built reef crest height above bed
hc = Stable reef crest height above bed
K = Regression coefficient = 0.0945
W50 = Armour stone median weight
Wr = Specific gravity of armour stone
Ww = Specific gravity of water
Hmo = Spectral zero moment wave height
Lp = Airy wave length
Equation 1 is valid for values of NS* greater than 6, as no reef reshaping occurs for lower stability
numbers.
2.3.3 Rock Armour Stability: Ahrens and Cox (1990) Method
The two-dimensional investigations of Ahrens (1987) were later modified in Ahrens and Cox (1990)
where the armour damage was determined as a more conventional damage parameter D’, evaluated
as shown in Equation 3.
Equation 3
A new equation estimating armour damage in proportion the the reef exposure was reported and is
shown in Equation 4.
Equation 4
Where:
M = Reef exposure parameter as shown in Equation 5
(
) ⁄
Equation 5
C0 = 19.4458
C1 = -7.4546
C2 = 0.760505
C3 = -0.010478
2.3.4 Rock Armour Stability: Vidal et al. (1992) Method
Vidal et al. (1992) presented a two-dimensional stability analysis for low-crested reef breakwater
structures, with stability charts presented for various parts of the structure:
Front/seaward slope (FS)
Crest (C)
Back/leeward slope (BS)
Total structure (TS)
The stability curves relate the Stability Number (Ns) to the structure freeboard for a range of
different damage levels, with definition of damage levels as follows:

WRL Technical Report 2012/08 Final Report June 2013 9
ID = Initiation of damage
IR = Iribarren’s damage
SD = Start of destruction
D = Destruction
Damage was quantified using a dimensionless parameter (S) that was calculated by looking at the
number of stones displaced from the structure per unit area, as well as by looking at the eroded area
of armour. The equation for calculating S is shown in Equation 6.
( ) Equation 6
Where:
N = number of stones displaced per section of trunk length X
n = Porosity of rock armour
Thresholds of the various damage levels occurred at different ‘S’ values for the different sections of
the structure, as shown in Table 2.2.
Table 2.2: Damage Parameter S for Different Damage Levels and Structure Sections
Damage Level Front Slope Crest Back Slope Total Structure
ID 1.5 1.0 0.5 1.0
IR 2.5 2.5 2.0 2.5
SD 6.5 5.0 3.5 4.0
D 12.0 10.0 - 9.0
The stability relationships are between the Stability Number (Ns) and the Adimensional Freeboard
(Fd), where:
NS = Stability Number as shown in Equation 7.
( ) Equation 7
Fd = Non-dimensional freeboard as shown in Equation 8, with F = actual freeboard
Equation 8
Stability charts for the various sections of the structure are reproduced in Figure 2.2.

WRL Technical Report 2012/08 Final Report June 2013 10
Figure 2.2: Stability Charts for Rock Armour After Vidal et al. (1992)
2.3.5 Rock Armour Stability: Van der Meer (1990) Method
Van der Meer (1990) presented two-dimensional stability formula and analysis for a range of low
crested breakwater structures including reef breakwaters, submerged breakwaters, and emergent
low-crested breakwaters. For reef type breakwaters, Van der Meer (1990) re-analysed the physical
model data set from Ahrens (1987) along with another data set from Van der Meer (1988) to develop
an updated armour stability equation as shown in Equation 9.
(
) Equation 9
Where:
The terms are as defined for Ahrens (1987) and shown in Section 2.3.2, with an updated regression
coefficient, a, as shown in Equation 10 and hc = hc’ if hc in Equation 10 is > hc’.
Equation 10
For statically stable rock armoured submerged breakwaters Van der Meer (1990) presents an
analysis for structures with relatively steep side slopes of 1:1.5 to 1:2.5. It was found that
structures with a submerged crest have more stable armour compared to emergent structures. The
stability of submerged structures can be estimated by Equation 11.

WRL Technical Report 2012/08 Final Report June 2013 11
( ) (
) Equation 11
2.3.6 Rock Armour Stability from DELOS Project
Kramer and Burcharth (2003a) undertook a series of three-dimensional physical model tests to
investigate rock armour stability for a wider range of structural and environmental parameters than
previous research, and in depth limited breaking wave conditions. Based on data from previous
investigations as well as the newer modelling, a more comprehensive equation for identifying the
threshold for initiation of damage was proposed in Kramer and Burcharth (2003b) as shown in
Equation 12. This equation was developed by fitting a curve under the envelope of all stability data
from the various modelling studies, and therefore represents a conservative threshold for initiation of
armour damage for various structural (slope, submergence, location, etc.), and environmental (water
depth, wave height, wave period, wave direction) parameters.
Equation 12
Equation 12, considered to be applicable for non-dimensional freeboard (Fd) values between -3 and
+2, is based on structures having a single armour grading over all parts and represents the initiation
of damage for any part of the structure.
Under depth limited breaking wave conditions, on the assumption that the depth limited significant
wave height was Hs = 0.6ds, it was established from Equation 12 that the rule of thumb in Equation
13 applies for the minimum required armour size.
Equation 13
Burcharth et al. (2006) presents the analysis for depth limited breaking wave conditions in slightly
more detail and establishes that the minimum required armour size is given by Equation 14.
⁄
( ⁄ ) ⁄ Equation 14
Burcharth et al. (2006) went on to validate the rule of thumb in Equation 13 by comparison against
constructed low-crested structures as a part of the DELOS project and also reported on validation
against further physical model tests with depth limited waves. It was confirmed that Equation 13
was valid and that Equation 12 was also valid for depth limited breaking wave conditions.
While no specific testing was undertaken, Burcharth et al. (2006) made the observation that the toe
armour stability equation proposed by Van der Meer (1995) was able to describe toe armour damage
from the DELOS project physical modelling reasonably well. This relationship is shown in Equation
15.
(
)
Equation 15
WRL Technical Report 2012/08 Final Report June 2013 12
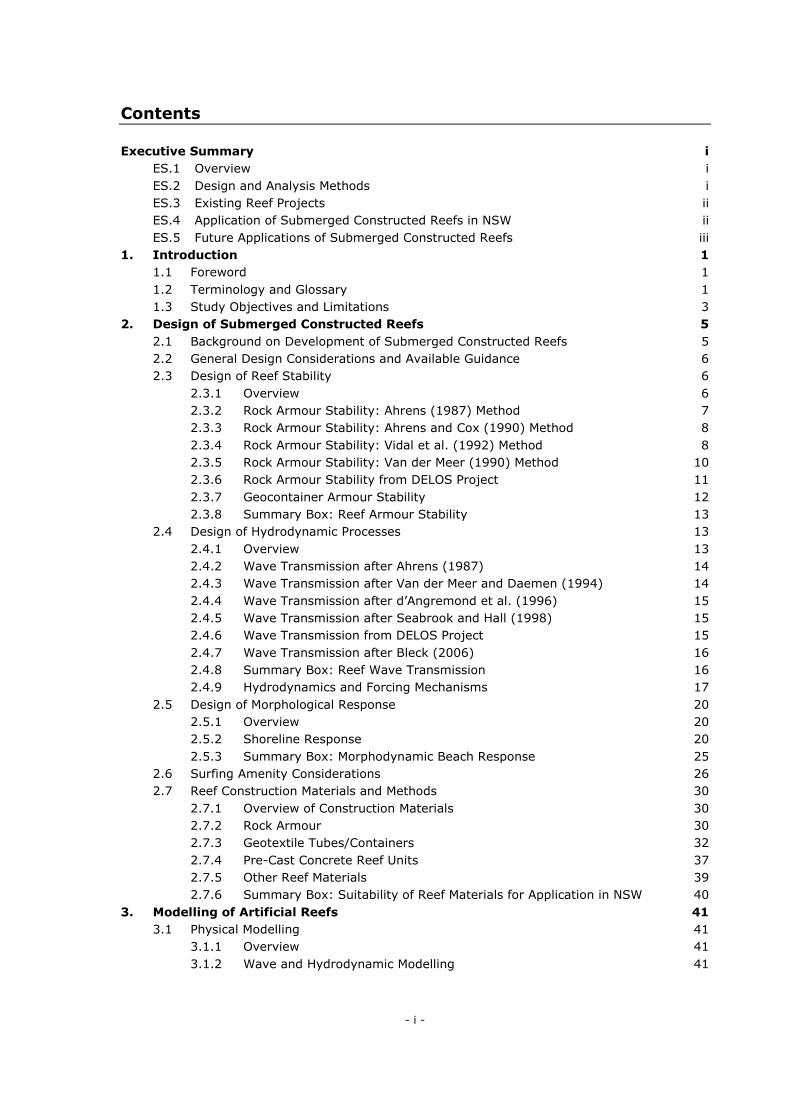
2.3.7 Geocontainer Armour Stability
To date there have been few detailed and conclusive investigations into the stability of geotextile
containers used in artificial reefs and indeed there are few empirical relationships for assessing the
stability of submerged geotextile containers placed in SCRs. As discussed in Borrero et al. (2010),
stability equations for rock or concrete armour units are not applicable to large sand filled geotextile
containers and the considerations for material strength, structure settlement, and overall behaviour
are also significantly different. Most sand filled geotextile containers used in SCRs are considerably
larger (100s of tonnes) compared to rock armour (5 to 20 tonnes), and it is often reported that this
makes them inherently stable under wave attack (Mead et al., 2010; Borrero et al., 2010).
However, it is worthwhile considering that the large volume of the geotextile tubes also means that
they each have a large surface area and therefore potentially large wave drag loading. Furthermore,
the relative submerged density of sand filled containers is significantly lower than rock armour, which
also has a significant impact on stability under wave attack.
Hudson and Cox (2001) examined the stability of submerged geotextile containers using 2D flume
physical model testing. Based on the results of the model testing, Equation 16 was developed which
relates the minimum stable size for a geocontainer to the primary environmental conditions.
( ⁄
⁄ ) ( )⁄ Equation 16
Where:
Ns’ = Modified spectral stability number
Hc = Deepwater wave height
Lp = Airy deepwater wave length
= Relative submerged density
Bh = Height of geocontainer
Recio and Oumeraci (2009) investigated the stability of sand-filled geocontainers by laboratory
testing and derived stability formula using force-balance approach. By this approach a container is
stable when the mobilising forces of wave-induced lift (FL), drag (FD) and inertial (FM) are exceeded
by the resisting forces of bag weight (WSFC) and friction (µ). This is expressed generally as:
µ(WSFC – FL) > FD + FM Equation 17
While design equations were derived for geocontainers of fixed geometry, containers of alternative
geometry require re-derivation (Borrero et al., 2010).
Borrero et al. (2010) assessed the stability of existing geotextile tube SCR structures, including
analysis of bag displacement, deterioration and failure. A numerical analysis of geotextile container
stability was also presented using the Narrowneck reef as a case study. This numerical model solved
the Navier-Stokes equation using a volume of fluid approach, to resolve the wave pressure field
acting on individual containers and subsequently the dynamic load placed on the containers. The
destabilising forces of the containers were compared to the resisting forces to estimate the stability
of the containers. Borrero et al. (2010) suggested that for first-order assessment, the stability
expressions of Recio and Oumeraci (2009) can be modified to a more generically applicable form
using the cross-sectional area and length of the geocontainer rather than fixed height, length and
width ratios.

WRL Technical Report 2012/08 Final Report June 2013 13
2.3.8 Summary Box: Reef Armour Stability
The most up to date empirical equation for assessing the stability of rock armouring on SCRs is from
Kramer and Burcharth (2003b) and Burcharth (2006), as previously shown in Equation 12, Equation
13, and Equation 14.
Equation 12 (repeated below) was developed using a combination of new data as well as data from
most other previously published studies, and provides an empirical armour size design equation for a
wide range of wave conditions and with structure non-dimensional freeboard (Fd) values between -3
and +2. This equation indicates the threshold of armour movement, and is therefore a useful first-
pass conservative approximation for stable armour size on a reef:
For most NSW conditions, reef structures are likely to be located in breaking or broken waves during
design wave events, and therefore Equation 14 as later presented in Burcharth (2006) is applicable
for conservatively estimating required armour size:
⁄
( ⁄ ) ⁄
Few well developed methods exist for estimating the stability of large sand-filled geotextile tubes. In
general, the empirical methods that do exist are based on containers that differ in shape and
proportion to the tubes typically used in SCR structures. Given the large size of the containers, a
first principle force-balance approach that considers the mobilising wave forces acting on the
containers and the restoring forces of container mass and friction, as discussed within Recio and
Oumeraci (2009) and Borrero et al. (2010), appears to be reasonable.
2.4 Design of Hydrodynamic Processes
2.4.1 Overview
Hydrodynamic considerations for SCR structures are typically focussed on wave transmission as well
as localised currents generated as a result of the structure. The two processes are intrinsically linked
and are the driving mechanism for sediment transport adjacent to and inshore of structures. The
wave height observed in the lee of a structure is a function of both two-dimensional transmission
over and through the structure, and wave propagation around the structure by refraction and
diffraction processes.
There have been many studies investigating two-dimensional wave transmission over low-crested
and submerged structures, ranging from the early studies of Dick (1968) through to the more recent
studies such as Buccino and Calabrese (2007). Indeed there has been more research into wave
transmission past (over, through and around) submerged structures than most other aspects. The
general understanding of the processes has improved through time and modern empirical equations
provide reasonable estimates of two-dimensional wave transmission if applied within their limits.
Due to the large amount of research published in this field, only the more recent and widely accepted
methods have been summarised in this review. These studies are considered to supersede the
earlier research and provide the state-of-the art for analysis.

WRL Technical Report 2012/08 Final Report June 2013 14
Current flow patterns generated as a result of SCR structures have been the focus of increasing
research attention, as it has become apparent in trial field studies that these currents are responsible
for localised scour at structure foundations (and resulting settlement), and also dictate the mode of
beach response in the lee of the structure (erosion or accretion).
2.4.2 Wave Transmission after Ahrens (1987)
Ahrens (1987) as discussed in Section 2.3.2 also studied two-dimensional wave transmission for reef
type submerged breakwaters. Based on a large physical model data set, an estimation of wave
transmission was presented and is shown in Equation 18.
( ) ( )
Equation 18
Where the bulk number (Bn) is given by Equation 19 and the reef response parameter ‘At’ is defined
in Equation 1.
Equation 19
2.4.3 Wave Transmission after Van der Meer and Daemen (1994)
Van der Meer and Daemen (1994) investigated the two-dimensional wave transmission coefficient for low
crested and submerged rubble mound breakwaters, using the data set for reef breakwaters from Ahrens
(1987) along with data sets from Van der Meer (1988), Daemen (1991), Daemrich and Kahle (1985) and
Seelig (1980).
Figure 2.3: Variables for Investigation by Van der Meer and Daemen (1994)
The equation for wave transmission presented (Equation 20) is based on a linear relationship where
wave transmission is proportional to crest freeboard and armour size. Two separate equations were
presented for the parameter ‘b’, one for conventional submerged rock breakwaters and the second
for reef submerged rock breakwaters (Equation 22 and Equation 23 respectively).
Equation 20
Equation 21

WRL Technical Report 2012/08 Final Report June 2013 15
(
)
Equation 22
Equation 23
Where the fictitious wave steepness, Sop is given by Equation 24
Equation 24
2.4.4 Wave Transmission after d’Angremond et al. (1996)
d’Angremond et al. (1996) further refined the understanding of wave transmission for submerged
structures by building on the previous work and data sets from Van der Meer and d’Angremond
(1991) and Van der Meer and Daemen (1994), as well as incorporating a series of new data into the
analysis. In particular, d’Angremond et al. (1996) established revised equations for wave
transmission by incorporating the effects of the armour/structure permeability into the analysis. Two
separate equations were presented for the cases of a permeable submerged breakwater (Equation
25) and an impermeable submerged breakwater (Equation 26).
(
)
( ) Equation 25
(
)
( ) Equation 26
Where 𝜉 is the Iribarren number given by Equation 27 with being the structure slope
𝜉 √( ) Equation 27
2.4.5 Wave Transmission after Seabrook and Hall (1998)
Seabrook and Hall (1998) completed a series of 2D and 3D physical model tests of wide crested
submerged breakwaters in order to refine the available empirical equations for estimating wave
transmission. The physical model tests were compared to predictions made using one of Van der
Meer’s equations, and it was shown that for the wider crested breakwaters the equation failed to
predict the physical model test results. A refined equation for wave transmission was presented, by
Seabrook and Hall (1998) and is shown in Equation 28.
( (
) (
) (
) (
)) Equation 28
2.4.6 Wave Transmission from DELOS Project
Burcharth et al. (2007) summarise the investigation undertaken by Briganti (2003) for wave
transmission over submerged breakwater structures, which included a compilation of data from a

WRL Technical Report 2012/08 Final Report June 2013 16
wide range of physical model studies. It was concluded that the d’Angremond et al. (1996) equation
for wave transmission of permeable structures (Equation 25) is applicable for structures with a
narrower crest (B/Hsi<10). For wider crested structures (B/Hsi>10), an alternative version of the
equation was suggested, as shown in Equation 29.
(
)
( ) Equation 29
2.4.7 Wave Transmission after Bleck (2006)
Bleck (2006) approaches wave transmission from an energy conservation perspective with an
analytical model developed for considering wave transformation with both breaking and non-breaking
waves. The model considers a wider range of parameters than most established empirical methods,
and therefore is able to be applied to a wider range of situations (as opposed to the empirical
equations that are limited to the range of test conditions upon which they were based).
The model considers the following energy sink terms:
Bottom friction;
Internal friction;
Vortex shredding;
Wave reflection; and
Flow resistance of reef and wave breaking.
The predictions of the analytical model when compared to physical model results indicate that it
resolves the physical processes reasonably well.
2.4.8 Summary Box: Reef Wave Transmission
The empirical relationships for two-dimensional wave transmission past SCRs presented in Burcharth
et al. (2007), as previously shown in Equation 25 and Equation 29, were developed from a wide
range of physical model test data that encompassed most of the data used by other researchers
around the world. These empirical relationships are the most evolved and therefore consider the
widest range of reef and environmental parameters. Importantly, these empirical equations
(repeated below) include the effect of cross-shore reef crest width, and are therefore able to predict
wave transmission for both narrow crested submerged breakwater structures, as well as wide crested
reef type structures. However, these equations still do not allow for wave refraction and diffraction
around submerged structures, which is an important limitation when applied to reef type structures
with a relatively small longshore crest length.
(
)
( ) Narrow Crested Structures with B/Hsi < 10
(
)
( ) Wide Crested Structures with B/Hsi >10

WRL Technical Report 2012/08 Final Report June 2013 17
2.4.9 Hydrodynamics and Forcing Mechanisms
Yoshioka et al. (1993), Ranasinghe and Turner (2006), and Ranasinghe et al. (2006) discuss the
importance of offshore structure location (and to a lesser extent wave orientation and structure
depth) on nearshore circulation patterns. In particular, the concept of circulation cells and the
resultant modes of morphological response is presented in Ranasinghe et al. (2006), along with the
possibility that submerged structures can result in erosion of the leeward beach.
Ranasinghe et al. (2006) examined the hydrodynamics and morphodynamics in the lee of a typical
triangular MPR using a two-dimensional depth averaged numerical model (MIKE 21). A matching
three-dimensional physical model was also developed and a reduced number of test conditions were
run in order to be able to validate the hydrodynamic predictions from the numerical model.
Qualitative assessment of current patterns in the lee of the reef were obtained using dye trace in the
physical model for the validation exercise.
The numerical modelling investigation looked at a range of values for:
Onshore/offshore position of structure from beach;
Crest submergence; and
Wave obliquity.
The study concluded that under shore-normal wave conditions either a two-cell or four-cell
circulation pattern is established depending on the proximity of the structure to the shoreline. The
influence of the reef distance from the shoreline and the resultant circulation patterns and modes of
beach response (erosion or accretion) were found as follows:
Structure located nearer to shore: two-cell circulation, divergent current, erosive; and
Structure located further from shore: four-cell circulation, convergent current, accretionary.
Circulation patterns in the lee of a submerged reef structure that were presented in Ranasinghe and
Turner (2006) are reproduced in Figure 2.4. Burcharth et al. (2007) discussed the difference in
circulation patterns in the lee of submerged and emergent detached structures and also identified the
two-cell/four-cell systems for submerged structures, governed by the structure proximity to the
shoreline ( Figure 2.5).

WRL Technical Report 2012/08 Final Report June 2013 18
Figure 2.4: Circulation Patterns Around Submerged Structures
(Ranasinghe and Turner, 2006)

WRL Technical Report 2012/08 Final Report June 2013 19
Figure 2.5: Circulation Patterns Around a Submerged Structure
(Burcharth et al.,2007)
Ranasinghe et al. (2006) concluded that as a result of the driving circulation mechanisms,
submerged structures can result in two contrasting modes of morphodynamic response, erosion or
accretion, which contrasts with emergent structures where only accretion is expected to occur.
These response modes are caused primarily by the cross-shore location of the structure, with
structures nearer to the shore (typically inside the surf zone) resulting in two-cell circulation patterns
where flows move over the reef to the shoreline before diverging alongshore and causing erosion.
Structures further offshore (generally seaward of the surf zone) caused four-cell circulation patterns
and promoted accretion. Salient growth was found to increase to some maximum value with
increasing structure distance offshore, before decreasing if the structure is located even further
offshore.
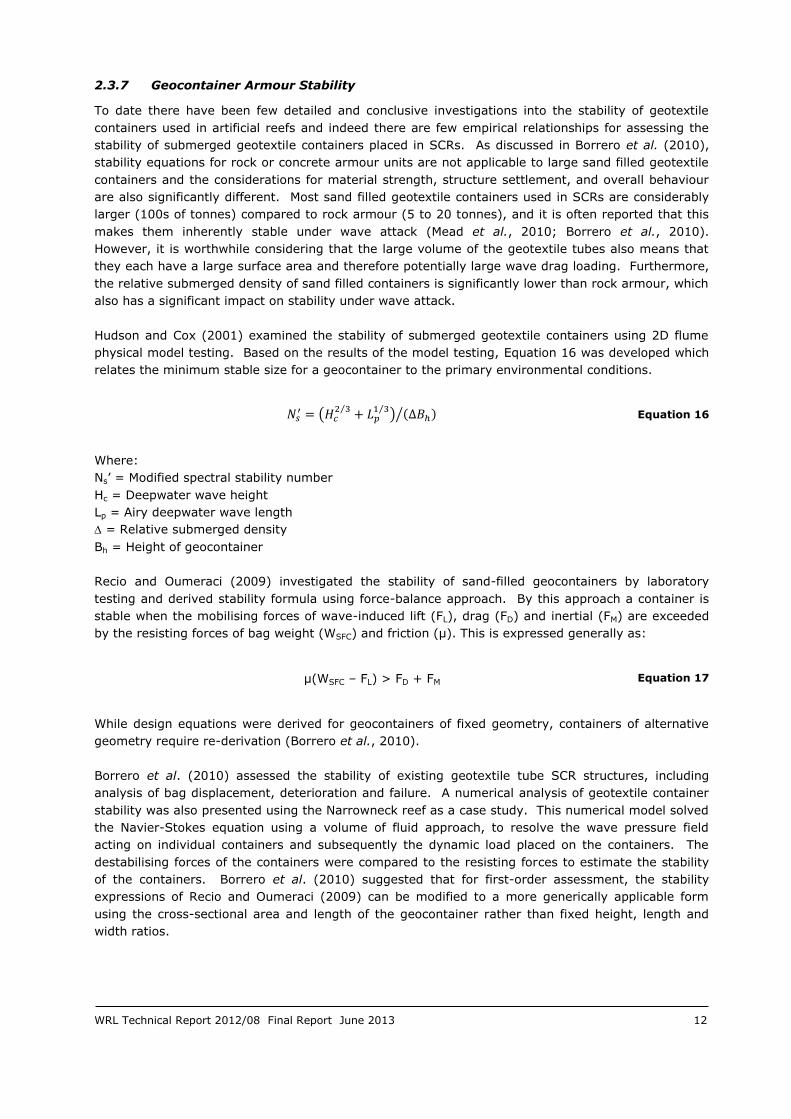
Yoshioka et al. (1993) also presented a summary of four different current pattern regimes that can
operate in the lee of submerged reef structures, and more importantly, the range of reef parameters
that result in each current pattern. Figure 2.6 shows the results of the Yoshioka et al. (1993)
analysis where it can be seen that the current patterns identified are more complex than those
presented in Ranasinghe et al. (2006) and extend to cover a wider range of cases (submerged long
crested breakwaters and structures with very small crest length). It is important to note that like the
conclusions of Ranasinghe et al. (2006), Yoshioka et al. (1993) also identified that there are some
reef configurations that will result in erosion in the lee of the reef, while others will tend toward
accretion.
WRL Technical Report 2012/08 Final Report June 2013 20
Figure 2.6: Current Patterns and Reef Configuration
(Yoshioka et al., 1993)
2.5 Design of Morphological Response
2.5.1 Overview
Hanson and Kraus (1989; 1990; 1991) report that shoreline response to an offshore breakwater is
controlled by at least 14 variables with 8 being primary controllers. While the principles behind
submerged and emergent detached structures are similar, there are slight differences in the
hydrodynamic mechanisms driving sediment transport and beach response, as was discussed in
Ranasinghe and Turner (2006) and Burcharth et al. (2007). Nevertheless, the work by Hanson and
Kraus highlights the complexity of morphological response to a detached (be it emergent or
submerged) offshore structure.
2.5.2 Shoreline Response
Empirical relationships for shoreline response to emergent structures have been widely published in
literature. Similar relationships for submerged structures have also been published but to a
significantly lesser degree. Andrews (1997) investigated the beach response to naturally occurring
islands and reefs, and used the data to develop relationships between structure location/geometry
and equilibrium shoreline response. The analysis was undertaken using aerial photographs of salient
and tombolo formations on the New Zealand and NSW coastline. A synthesis of the results are
reported in Black and Andrews (2001), with definition of the terms reproduced in Figure 2.7. The
formation of salients and tombolos in the lee of natural reefs were separated from the analysis of
islands, and were predicted to occur as follows:
Lr = Longshore Crest Length of Reef Segments
Wr = Longshore Opening Width between Segments
Y = Distance from Shoreline

WRL Technical Report 2012/08 Final Report June 2013 21
No change to shoreline when:
Salient formation when
Tombolo formation when
Where B is the structure longshore crest length and S is the offshore distance. The geometry of
salients in the lee of natural reefs was proposed to follow a power relationship, according to Equation
30 and Equation 31:
(
)
Equation 30
( ) Equation 31
(a) (b)
(c)
Figure 2.7: (a) Geometry Definition for Offshore Features; (b) Shoreline Response for Emergent
Islands and(c) Shoreline Response for Submerged Reefs (Black and Andrews, 2001)

WRL Technical Report 2012/08 Final Report June 2013 22
Evans and Ranasinghe (2001) used aerial photographs to estimate shoreline response comparing
results with Black and Andrews (2001) and theoretical values by Silvester and Hsu (1997), (Figure
2.8). Evans and Ranasinghe (2001) did not differentiate between submerged and emergent features
but did use visual examination to determine feature size. They suggested that it is likely that Black
and Andrews (2001) underestimated reef size by not fully quantifying submerged reef portions, and
therefore over-predicted relative shoreline response. No empirical relationship for shoreline response
was presented in Evans and Ranasinghe (2001).
Figure 2.8: Analysis of Salient Features in NSW
(Evans and Ranasinghe, 2001)
Pilarczyk (2003) summarises the work of Black and Andrews (2001), but also suggested that an
empirical formula for shoreline response to a submerged structure could be developed by including a
term for wave transmission/sheltering (1-Kt term) into the formula for emergent breakwaters.
Possible equations proposed by Pilarczyk (2003) for submerged breakwaters were:
Salient formation when:
Salient formation for multiple breakwaters when:
( )
Where G is the gap between the breakwaters.
Though the morphodynamic response predicted in the modelling by Ranasinghe et al. (2006) was not
calibrated or validated, relationships for morphological response were proposed for preliminary
engineering calculations. In this case the ratio of the distance offshore (structure apex to
undisturbed shoreline) to the natural surf zone width is plotted versus the ratio of salient width (Y)
and the structure longshore crest length (B). This plot is shown in Figure 2.9 where it can be seen
that if the structure is close to the shore (within the natural surf zone, Sa/SZW<1), then erosion is
likely to occur. Likewise, if the structure is outside the surf zone (Sa/SZW>1.5), then accretion is
likely to occur, though accretion is predicted to peak when the structure is located twice the distance
offshore of the natural surf zone width (Sa/SZW=2.0).

WRL Technical Report 2012/08 Final Report June 2013 23
Figure 2.9: Shoreline Response to Submerged Structures
(Ranasinghe et al., 2006)
Savioli et al. (2007) examined a technique to predict the mode of shoreline response
(erosion/accretion) to submerged shore parallel breakwater structures through the application of a
two-dimensional depth averaged numerical model. This work was extended in Ranasinghe et al.
(2010) who investigated the effect a wider range of structural and environmental parameters on
shoreline response. The analysis was undertaken using both theoretical (dimensional analysis) and
numerical modelling techniques to ascertain the relative importance of the governing variables on
shoreline response mode. Based on the numerical modelling, the plot shown in Figure 2.10 was
produced, which indicates a relationship between key structural/environmental parameters and the
resulting occurrence of shoreline erosion or accretion. The derived expressions indicate that
shallower structures, located further offshore tend to result in hydrodynamic response more
conducive to accretion. Increased crest width was found to promote an accretional response in reefs
at shallow submersion and tidal influence was not found to significantly affect response modes.
Overall the method has potential as a first-order design tool but is presently un-validated, with
further verification against field data and/or large-scale moveable-bed physical models
recommended.

WRL Technical Report 2012/08 Final Report June 2013 24
Figure 2.10: Mode of Shoreline Response to Submerged Breakwaters
(Ranasinghe et al., 2010)
As well as the empirical relationships presented above which make an attempt to predict the beach
response to specific reef configurations, general guidelines and advice regarding the morphodynamic
response of a beach in the lee of a submerged structure is available in several other literature
sources. Lamberti and Mancinelli (1996) suggest that to retain and build sand in the lee of a
submerged breakwater, the active toe of the inner beach should be landward of the submerged
breakwater structure, i.e. active sand from the beach should not reach the landward toe of the
breakwater. This can be achieved by ensuring the reduction in wave height caused by the
breakwater is adequate to allow development of the full protected beach profile to the closure depth
landward of the submerged breakwater. Yoshioka et al. (1993) suggested that to protect from beach

WRL Technical Report 2012/08 Final Report June 2013 25
recession due to an imbalance in littoral drift rate, then a target wave transmission coefficient can be
determined on the basis of the required ratio in background littoral drift rate (Qi) and the littoral drift
that will occur in the lee of the SCR (Q), as shown in Equation 32. Presumably this rule can also be
used to estimate the fraction of littoral drift sand that would be trapped by a SCR for a given wave
transmission coefficient.
(
)
Equation 32
2.5.3 Summary Box: Morphodynamic Beach Response
While several different empirical equations have been proposed for prediction of shoreline response
to submerged structures, all have fundamental limitations that restrict their use to preliminary design
guidance. Nevertheless, the underlying principles of the methods used are not unreasonable and the
equations do present valid preliminary methods for assessment. Understanding and predicting
morphological response in the lee of SCR structures is more uncertain than other design parameters
such as armour size and wave transmission.
Black and Andrews (2001) and Evans and Ranasinghe (2001) both base their analysis of measuring
salient/tombolo size in proportion to reef size for naturally occurring features. This technique has the
benefits of being based on real world experience and eliminates problems associated with numerical
or physical model analysis. However, the methods used to determine the size of the reef structures
in both cases are simplistic and approximate with no detailed bathymetric survey of the structures
taking place. The proposed equations do not relate the shoreline response to wave exposure or
wave transmission, which logic and other research suggests both have a significant impact on
shoreline response. These methods have also been criticised in literature as they inherently cannot
predict a shoreline erosion mode as a result of a submerged structure (which has been shown in
other studies to exist). The method of Black and Andrews (2001) has been applied during the design
phase of several existing SCR structures and has been shown to over-predict salient size (examples
include Narrowneck and Mount Maunganui reefs).
Ranasinghe et al. (2006) examined shoreline response using a numerical model that is partially
validated against a physical model (only qualitative validation of hydrodynamics, no validation of
morphodynamic response). While the driving mechanisms for beach erosion/accretion in the lee of
submerged structures are examined in detail and are expected to be qualitatively correct, the
prediction methods for magnitude of shoreline response and threshold of erosion/accretion modes
should be considered with caution due to the relatively un-validated nature of the morphodynamic
model used. Savioli et al. (2007) and Ranasinghe et al. (2010) both apply a similar numerical
model, however, neither the hydrodynamics or morphodynamics of the model were calibrated or
validated. The outcome of these studies indicates the dependence of shoreline response mode
(erosion/accretion) on circulation cell patterns determined by key structural and environmental
variables. However, it is clearly pointed out in the conclusion of the study that the dependency
cannot be comprehensively tested due to limited availability of good quality prototype data.
While there has been considerable improvement on the understanding of the mechanisms driving
shoreline response for submerged reef/breakwater structures over the past decade, all completed
studies have significant limitations. No single study has comprehensively tested the effects of
primary structural and environmental variables on quantitative shoreline response, and the shoreline
response equations presented are based on approximate observations or un-calibrated and

WRL Technical Report 2012/08 Final Report June 2013 26
un-validated modelling. None of the discussed empirical methods are able to capture the underlying
differences in processes between swash-aligned and littoral drift-aligned beaches, as are frequently
experienced on the NSW coast. The shoreline response to a reef structure on these different beach
types will also differ, with littoral drift beaches experiencing:
Asymmetry in resulting shoreline alignment;
Potential down-drift erosion as a result of the formation of a salient;
Potential up-drift ‘groyne’ effect.
This suggests that the available empirical techniques for assessing shoreline response are suitable
only for preliminary engineering calculation and not detailed design. Structures that are designed
using these methods should be considered as trial or experimental only, as it has been shown from
previous prototype experience that the available equations do not predict beach response with
accuracy or reliability. This results in designs that inherently contain higher uncertainty than many
other beach control structures and this should be considered during the options planning and
feasibility phase.
Regardless of these limitations, the benefits of SCR structures mean that they should still be
considered as an optional form of hard coastal protection, so long as the design and expectations
take into consideration the lower level of reliability in prediction of the morphological response.
Ongoing construction and monitoring of SCRs will result in a better understanding of the processes
and refined methods for predicting shoreline response.
2.6 Surfing Amenity Considerations
The concept of using artificial structures to enhance recreational surfing amenity was first proposed
by Griggs (1969) in Surfer Magazine. Significant work has since been undertaken both in the
laboratory and field to quantify wave breaking parameters relevant to surfing. Important parameters
have been found to include wave breaking height, peel angle and wave breaking speed (Walker
1971; 1974; Mead and Black, 2001), wave breaker type (Galvin, 1968; Battjes, 1974; Dally, 1990;
Smith and Kraus, 1991) and breaking intensity (Sayce, 1997; Black et al., 1997; Mead and Black,
2001). These wave breaking characteristics were related to surfers’ skill level (Walker, 1974;
Hutt et al., 2001) and to specific world-class surfing locations (Mead and Black, 2001).
Mead and Black (2001) analysed 34 world-class surf breaks and classified the various morphological
features into specific components based on their influence on wave processes. These components
include:
Ramp;
Platform;
Focus;
Wedge;
Ledge;
Ridge; and
Pinnacle.
Each of these components influence either the pre-conditioning, break point or break type of surfing
waves and should be considered if designing a reef with surfing amenity as an objective. Figure 2.11

WRL Technical Report 2012/08 Final Report June 2013 27
defines the typical parameters used to characterise breaking waves for analysis of surfability. Figure
2.12 relates these parameters to a level of surfer skill.
(a)
(b)
Figure 2.11: Parameters used to Quantitatively Describe Surfing Aspects of Breaking Waves
(a) Walker (1974) and (b) Black et al. (1997)

WRL Technical Report 2012/08 Final Report June 2013 28
Figure 2.12: Breaking Wave Classification for Surfer Skill Level
(Walker, 1974)
Using the relationships established between bathymetric components and resulting wave breaking
characteristics, several artificial structures were constructed from the late 1990’s for the sole or
combined intent of enhancing surfing amenity and providing increased shoreline protection
(Pattiaratchi, 1999; Skelly, 2002; Jackson et al., 2007). While many of these structures were not
completed to specification due to construction difficulties or material failure, the surfing amenity
produced by those that were completed has generally failed to live up to public expectation
(Shand, 2011). However, Shand (2011) points out that the success of physical models and
prototype structures during design (ideal) conditions indicates that the physical understanding of
wave breaking parameters and bathymetric components required to obtain such breaking is likely
sufficient to adequately design structures for surfing amenity. The major issue remains an
expectation by the general public of consistent, quality waves during a wide range of environmental
conditions.
In natural environments, consistency of surfing waves during a range of tidal conditions, wave
heights, directions and periods is achieved by wave pre-conditioning and/or large scale breaking
features (Mead and Black, 2000). The scale of ASRs constructed to date have generally been too
small to allow adequate preconditioning and wave breaking during a range of conditions (Borrero and
Nelson, 2003; Shand, 2011) but rather have been limited to specific environmental conditions.
However, general public and media expectations have been for structures that produce surfable
waves with high consistency. This disconnect between stakeholder expectation and realistic design
outcomes has been detrimental to the public’s confidence in such structures and to the future
prospects of ASRs.
Predicting the consistency and range of conditions during which a reef will produce surfable waves is
a crucial aspect of assessing the feasibility of MPRs, as the large required reef volume and limited
longshore extent required to produce surfable waves also makes these structures inefficient at
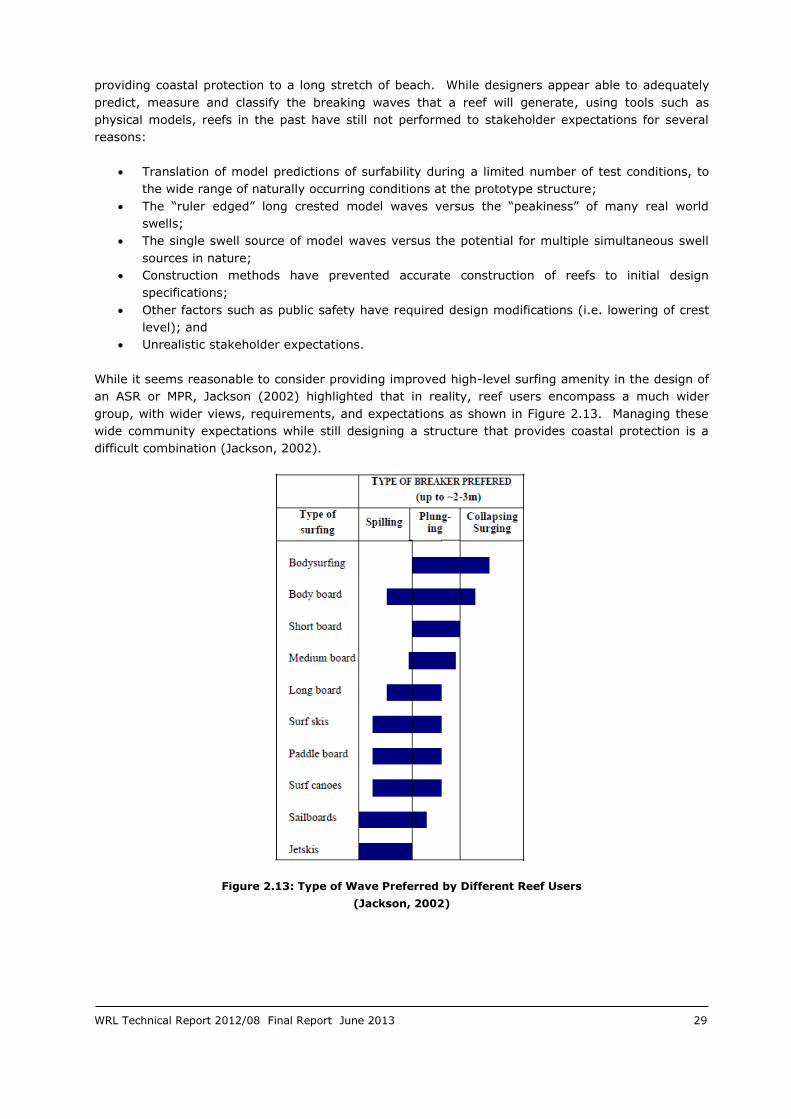
WRL Technical Report 2012/08 Final Report June 2013 29
providing coastal protection to a long stretch of beach. While designers appear able to adequately
predict, measure and classify the breaking waves that a reef will generate, using tools such as
physical models, reefs in the past have still not performed to stakeholder expectations for several
reasons:
Translation of model predictions of surfability during a limited number of test conditions, to
the wide range of naturally occurring conditions at the prototype structure;
The “ruler edged” long crested model waves versus the “peakiness” of many real world
swells;
The single swell source of model waves versus the potential for multiple simultaneous swell
sources in nature;
Construction methods have prevented accurate construction of reefs to initial design
specifications;
Other factors such as public safety have required design modifications (i.e. lowering of crest
level); and
Unrealistic stakeholder expectations.
While it seems reasonable to consider providing improved high-level surfing amenity in the design of
an ASR or MPR, Jackson (2002) highlighted that in reality, reef users encompass a much wider
group, with wider views, requirements, and expectations as shown in Figure 2.13. Managing these
wide community expectations while still designing a structure that provides coastal protection is a
difficult combination (Jackson, 2002).
Figure 2.13: Type of Wave Preferred by Different Reef Users
(Jackson, 2002)

WRL Technical Report 2012/08 Final Report June 2013 30
2.7 Reef Construction Materials and Methods
2.7.1 Overview of Construction Materials
Construction materials for coastal structures are discussed in detail in CIRIA (2007) and summarised
with respect to SCRs in CIRIA (2008). Lukens and Selberg (2004) also provided guidelines for reef
materials with a focus on marine habitat. SCRs are typically constructed using the following
materials:
Rock/rubble;
Geotextile containers and tubes;
Pre-cast concrete units; and
Other materials including sunken ships, car bodies, tyres, ‘material of opportunity’ (although
these have generally been used for ecology focussed reefs).
Each construction material has a range of advantages and disadvantages, as well as suitable
applications. Due to the site specific nature of reef installations, each material needs to be
considered for its suitability when designing a new reef. Key aspects of material selection that
should be considered include:
Ability to achieve desired outcomes (ASR, MPR, submerged breakwater, ecological
enhancement etc.);
Stability under design conditions;
Environmental impacts;
Durability throughout design life;
Constructability and placement methods for specific site;
Safety and risks; and
Ability to adjust and/or adapt design.
2.7.2 Rock Armour
Rock armour has long been used as a coastal protection material and is considered one of the most
durable and adaptable materials available. In NSW rock has been successfully used to armour
structures ranging from open coast emergent breakwaters through to revetments located within
sheltered water bodies and estuaries. Rock also has the appeal of being a natural material and can
be sourced to match the substrates that form natural reef systems within NSW. In Australia, rock
was successfully used to armour the Cable Station ASR and it has also been used widely throughout
Europe for construction of submerged breakwaters. The design guidance for assessing the stability
of rock armour on submerged structures is also considerably more advanced than other armouring
materials, making rock designs lower in uncertainty.

WRL Technical Report 2012/08 Final Report June 2013 31
The longstanding use of rock armour in NSW means that the most suitable types of rock have been
well defined, source quarries have been identified and costs for supply are well established.
However, there are limitations to the types of locations where rock is considered a suitable armour
material. Most SCRs to date have been constructed in water depths of 3 m to 5 m, with the
exception of the Gold Coast Reef at Narrowneck which extends to a depth of 10 m, and Cable Station
reef which extends to a depth of 6 m. Based on the empirical equation from Burcharth et al. (2006)
for stable reef armour size in depth-limited breaking wave conditions (Equation 14), required rock
armour sizes have been estimated for a reef with crest level 1 m below the water surface. The
results are shown in Table 2.3 for a range of water depths. Given that the upper limit of armour
stone mass that can be sourced in sufficient quantity from most NSW hard rock quarries is less than
10 tonnes, it is apparent that rock armoured reefs are only suitable on the open NSW coast when
located in water depths of the order of 6 m or shallower. It can also be seen that rock may be a very
efficient armour material for reefs in relatively sheltered areas where a reef would be located in
shallower water depths of the order of 2 m.
Table 2.3: Required Rock Armour Size for Various Reef Depths (with Crest Submerged 1 m)
Water Depth
at Structure
(ds)
Reef Crest
Height, hc
(1) Assumed
Significant Wave
Height at Reef, Hs
Required Armour
Stone Size, Dn50
Required Armour
Stone Mass, M50
(m) (m) (m) (m) (kg)
2 1 1.2 0.27 50
4 3 2.4 0.80 1,350
6 5 3.6 1.33 6,250
8 7 4.8 1.86 17,150
10 9 6.0 2.40 36,460
(1) Depth-limited wave conditions assumed with Hs = 0.6ds
Construction of detached rock armoured structures typically occurs by means of barge mounted crane
and/or excavator (Figure 2.14). Regular surveys of the reef during construction allow the structure to be
trimmed and topped up as needed to closely match the design profile. This method is typically restricted
to wave conditions of 0.5 to 1.0 m wave height (Abbot and Price, 1994) which on the NSW open coast
would be exceeded 80 to 99 % of the time. Clearly this has implications for possible productive
construction periods and flow-on effects for construction time and costs.
Figure 2.14: Placing Rock on the Cable Station Reef by Barge Mounted Excavator
(Jackson and Corbett, 2007)
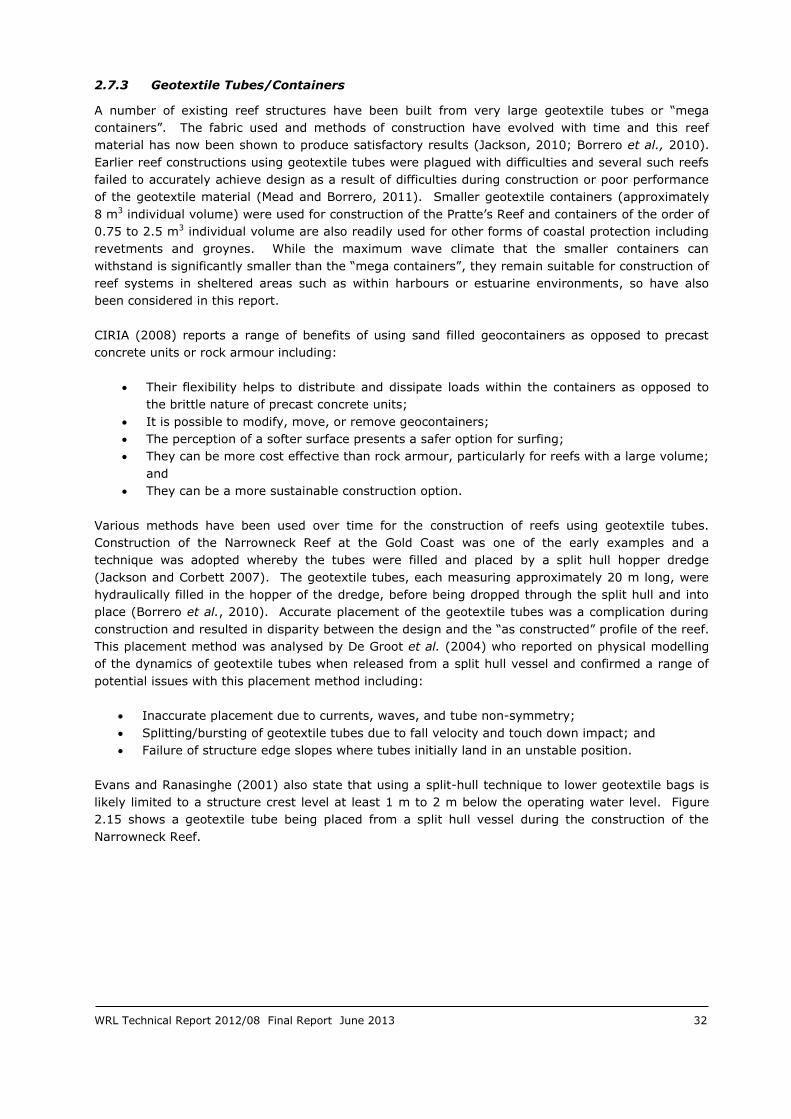
WRL Technical Report 2012/08 Final Report June 2013 32
2.7.3 Geotextile Tubes/Containers
A number of existing reef structures have been built from very large geotextile tubes or “mega
containers”. The fabric used and methods of construction have evolved with time and this reef
material has now been shown to produce satisfactory results (Jackson, 2010; Borrero et al., 2010).
Earlier reef constructions using geotextile tubes were plagued with difficulties and several such reefs
failed to accurately achieve design as a result of difficulties during construction or poor performance
of the geotextile material (Mead and Borrero, 2011). Smaller geotextile containers (approximately
8 m3 individual volume) were used for construction of the Pratte’s Reef and containers of the order of
0.75 to 2.5 m3 individual volume are also readily used for other forms of coastal protection including
revetments and groynes. While the maximum wave climate that the smaller containers can
withstand is significantly smaller than the “mega containers”, they remain suitable for construction of
reef systems in sheltered areas such as within harbours or estuarine environments, so have also
been considered in this report.
CIRIA (2008) reports a range of benefits of using sand filled geocontainers as opposed to precast
concrete units or rock armour including:
Their flexibility helps to distribute and dissipate loads within the containers as opposed to
the brittle nature of precast concrete units;
It is possible to modify, move, or remove geocontainers;
The perception of a softer surface presents a safer option for surfing;
They can be more cost effective than rock armour, particularly for reefs with a large volume;
and
They can be a more sustainable construction option.
Various methods have been used over time for the construction of reefs using geotextile tubes.
Construction of the Narrowneck Reef at the Gold Coast was one of the early examples and a
technique was adopted whereby the tubes were filled and placed by a split hull hopper dredge
(Jackson and Corbett 2007). The geotextile tubes, each measuring approximately 20 m long, were
hydraulically filled in the hopper of the dredge, before being dropped through the split hull and into
place (Borrero et al., 2010). Accurate placement of the geotextile tubes was a complication during
construction and resulted in disparity between the design and the “as constructed” profile of the reef.
This placement method was analysed by De Groot et al. (2004) who reported on physical modelling
of the dynamics of geotextile tubes when released from a split hull vessel and confirmed a range of
potential issues with this placement method including:
Inaccurate placement due to currents, waves, and tube non-symmetry;
Splitting/bursting of geotextile tubes due to fall velocity and touch down impact; and
Failure of structure edge slopes where tubes initially land in an unstable position.
Evans and Ranasinghe (2001) also state that using a split-hull technique to lower geotextile bags is
likely limited to a structure crest level at least 1 m to 2 m below the operating water level. Figure
2.15 shows a geotextile tube being placed from a split hull vessel during the construction of the
Narrowneck Reef.

WRL Technical Report 2012/08 Final Report June 2013 33
Figure 2.15: Placement of a Geotextile Tube by dropping from a Split-Hull Vessel
(Photos: ICM)
Placement of large geotextile tubes has been optimised over time and recent reefs have been
constructed using a technique whereby the empty tubes are initially fastened to the sea bed and
then hydraulically pumped full in-situ (Jackson, 2010; Mead et al., 2010). This technique (termed
‘Rapid Accurate Deployment’, RAD) was developed by ASR for the Mount Maunganui Reef in NZ and
consists of the following process (ASR, 2008a):
1. A geotextile tube layout is developed to replicate the design configuration of the reef.
2. An underlying webbing is assembled on a geomat to form a framework for holding panels of
reef bags together. This is undertaken on dry land.
3. The empty geotextile tubes are then secured to the webbing to form manageable sized
panels of tubes.
4. Prior to deployment of the webbing/bag assembly, anchors are positioned on the seabed at
precise locations.
5. The webbing/bag assembly is then folded and placed onto a barge and transported to the
reef site during calm weather.
6. Leader lines from the webbing are then fed through the seabed anchors and the entire
assembly of bags, webbing, and geomat is winched to the seabed.
7. The geotextile bags are then filled in place using a barge mounted submersible pump which
extracts sand from a seabed source close to the reef site.
Figure 2.16 illustrates the RAD reef construction process at Mount Maunganui Reef. Similar methods
have been used for newer reef locations including Boscombe (Figure 2.17) and Kovolam MPRs as well
as the geotextile tube detached breakwater at the undisclosed location in the UAE (Figure 2.18).
While this construction method has overcome many of the issues associated with the split-hull
technique, it also has its own limitations and risks. Relatively calm conditions are required for
transporting and fixing the unfilled containers in position, and the occurrence of moderate to larger
wave conditions before the containers are filled has the potential to move or damage the panels of
unfilled containers. As the containers are pump filled in-situ, there are limitations on the distance
between the filling sand stock pile and the reef location. The filling process requires vessels and
divers to work in the vicinity of the reef, which is also expected to be challenging in open coast NSW
conditions.

WRL Technical Report 2012/08 Final Report June 2013 34
Bag Layout
Webbing and Bag Assembly
Loading Reef Panel onto Barge
Deployment of Reef Panel
Securing Reef Panel to Seabed Anchor
Filling Geotextile Tubes
Figure 2.16: RAD Reef Construction Method at Mount Maunganui
(ASR, 2008a)
Figure 2.17: Construction of the Boscombe MPR
(Mead et al., 2010)
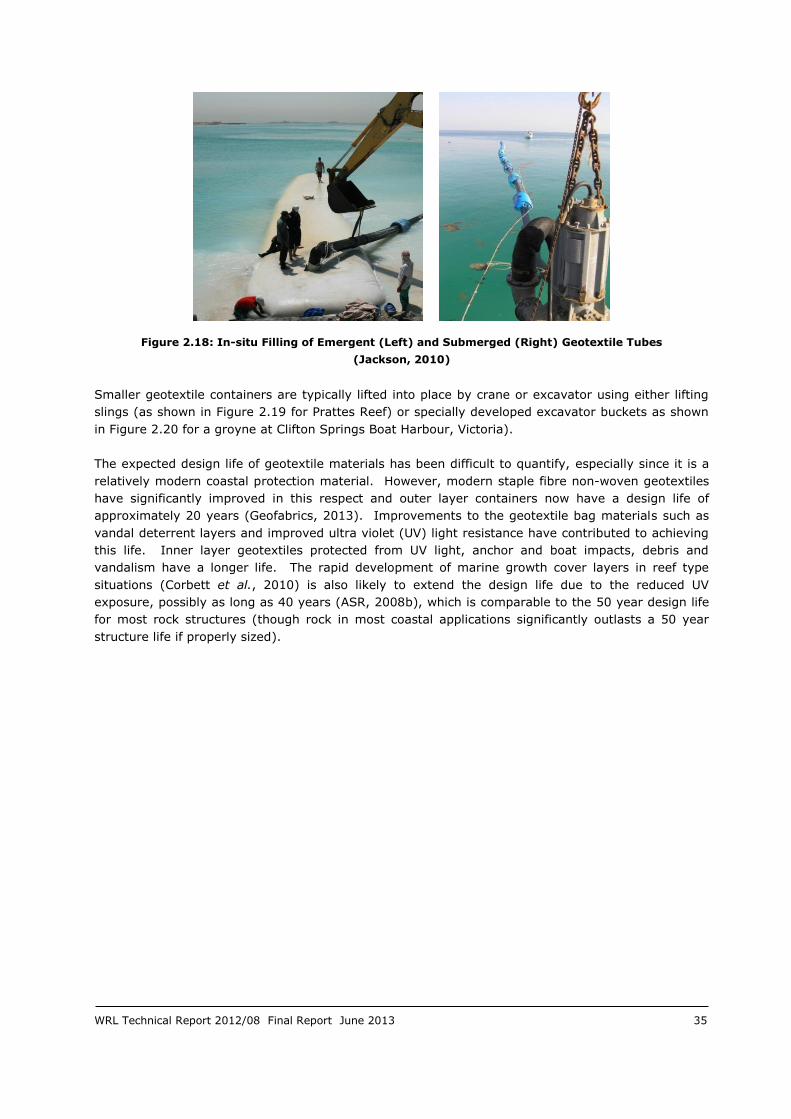
WRL Technical Report 2012/08 Final Report June 2013 35
Figure 2.18: In-situ Filling of Emergent (Left) and Submerged (Right) Geotextile Tubes
(Jackson, 2010)
Smaller geotextile containers are typically lifted into place by crane or excavator using either lifting
slings (as shown in Figure 2.19 for Prattes Reef) or specially developed excavator buckets as shown
in Figure 2.20 for a groyne at Clifton Springs Boat Harbour, Victoria).
The expected design life of geotextile materials has been difficult to quantify, especially since it is a
relatively modern coastal protection material. However, modern staple fibre non-woven geotextiles
have significantly improved in this respect and outer layer containers now have a design life of
approximately 20 years (Geofabrics, 2013). Improvements to the geotextile bag materials such as
vandal deterrent layers and improved ultra violet (UV) light resistance have contributed to achieving
this life. Inner layer geotextiles protected from UV light, anchor and boat impacts, debris and
vandalism have a longer life. The rapid development of marine growth cover layers in reef type
situations (Corbett et al., 2010) is also likely to extend the design life due to the reduced UV
exposure, possibly as long as 40 years (ASR, 2008b), which is comparable to the 50 year design life
for most rock structures (though rock in most coastal applications significantly outlasts a 50 year
structure life if properly sized).

WRL Technical Report 2012/08 Final Report June 2013 36
Figure 2.19: Placement of Smaller Geotextile Bags by Sling at Pratte's Reef
(Borrero and Nelson, 2003; Jackson and Corbett, 2007)
Figure 2.20: Placement of Smaller Geotextile Bags by Special Excavator Bucket
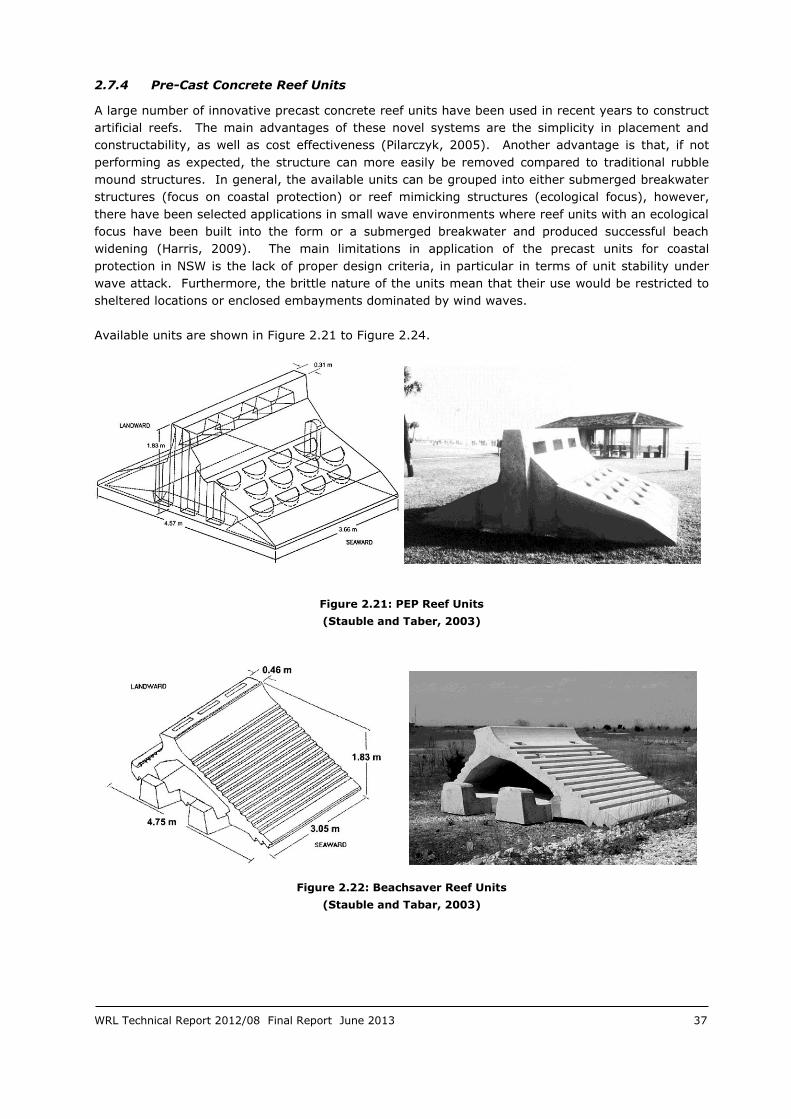
WRL Technical Report 2012/08 Final Report June 2013 37
2.7.4 Pre-Cast Concrete Reef Units
A large number of innovative precast concrete reef units have been used in recent years to construct
artificial reefs. The main advantages of these novel systems are the simplicity in placement and
constructability, as well as cost effectiveness (Pilarczyk, 2005). Another advantage is that, if not
performing as expected, the structure can more easily be removed compared to traditional rubble
mound structures. In general, the available units can be grouped into either submerged breakwater
structures (focus on coastal protection) or reef mimicking structures (ecological focus), however,
there have been selected applications in small wave environments where reef units with an ecological
focus have been built into the form or a submerged breakwater and produced successful beach
widening (Harris, 2009). The main limitations in application of the precast units for coastal
protection in NSW is the lack of proper design criteria, in particular in terms of unit stability under
wave attack. Furthermore, the brittle nature of the units mean that their use would be restricted to
sheltered locations or enclosed embayments dominated by wind waves.
Available units are shown in Figure 2.21 to Figure 2.24.
Figure 2.21: PEP Reef Units
(Stauble and Taber, 2003)
Figure 2.22: Beachsaver Reef Units
(Stauble and Tabar, 2003)

WRL Technical Report 2012/08 Final Report June 2013 38
Figure 2.23: Double-T Sill Units
(Stauble and Giovannozzi, 2003)
Figure 2.24: Precast Tecnoreef (Left) and Reef Ball (Right) Reef Units
(www.tecnoreef.com; Harris, 1995)
Beachsaver Reefs™ and Prefabricated Erosion Prevention (PEP) Reefs™ (Figure 2.21 and Figure 2.22)
were built and tested in Florida and New Jersey, USA. Both systems use modular precast concrete
units of triangular cross-section that are locked together in segments and in different configurations
to form shore parallel narrow-crested submerged breakwaters. Stauble and Tabar (2003) report that
these installations were subject to settlement and scour and were only appropriate in combination
with groynes to form a closed cell perched beach. The large breaking wave conditions experienced
during storms on the NSW coast would likely preclude the use of these units for open coast locations
based on structural strength and unit stability. The relatively detailed and interlocking placement of
these units would also be extremely challenging to construct at open coast locations. Nevertheless,
the units could be applied in sheltered locations or protected embayments where shorter period and
less energetic wind waves dominate.

WRL Technical Report 2012/08 Final Report June 2013 39
Aquareef™ and Tecnoreef™ units were deployed in Japan and Italy respectively. The Iburi reef in
Hokkaido Japan implemented concrete interlocking blocks as a primary armour layer above a rubble
mound core (Hirose et al., 2002). In Punta Marina Italy, a 350 m long pilot trial artificial reef was
built in 2010 using Tecnoreef™ modules, with each module consisting of reinforced porous octagonal
plates assembled to form pyramidal shapes. Extensive monitoring of the structure is ongoing.
Localised settlement and scour was observed within a few months from construction (Sordini, 2011).
Reef Ball™ units were used to construct several artificial reefs around the world. These concrete
units are hollow and characterised by high porosity and roughness. They are mainly used for
ecosystem restoration and in shallow water have been shown to help improve beach restoration and
stabilisation (Harris, 2009). In NSW Reef BallTM units have been installed for ecological enhancement
at Botany Bay, Lake Conjola, Lake Macquarie, St Georges Basin and Merimbula Lake. Wave climates
in these locations are typically restricted to locally generated wind seas and these units would likely
be unsuitable for application on the open NSW coast.
2.7.5 Other Reef Materials
The use of other materials for forming artificial reefs (such as scuttled vessels, cars, tyres, etc.) has
primarily been targeted at reefs where ecosystem enhancement and/or diving amenity are the
primary considerations. Examples of this application already exist in NSW and include the scuttled
Ex-HMAS Adelaide site on the Central Coast (WorleyParsons, 2009), scuttled ferries off Sydney and
scuttled tug vessels on the Far South Coast near Green Cape. The use of such materials for coastal
protection and in relatively shallow water depths (less than 10 m) would introduce additional
environmental and safety risks, particularly for structures considered as MPRs. Furthermore, location
of these reefs in the past has been targeted at avoiding occurrence of breaking wave conditions even
during storms (due to structure integrity), which further reduces the ability to provide coastal
protection.

WRL Technical Report 2012/08 Final Report June 2013 40
2.7.6 Summary Box: Suitability of Reef Materials for Application in NSW
Table 2.4 summarises the recommended applicability of reef materials for NSW sites based on a
review of other reefs constructed around the world as well as the specific characteristics of the NSW
coastal environment (mean and storm wave climates). While some materials are not suited to the
open coast, they would be highly suited to enclosed water bodies or sheltered sections of coast.
Table 2.4: Suitability of Reef Materials for Application in NSW
Material Potential Applications in NSW Limitations
Rock
Potentially open coast reefs,
sheltered coast reefs, protected
embayments, estuaries
Typical available upper rock
size limit in NSW limits
applicability for large design
wave environments
Geotextile Tubes and Mega-
Containers Open coast reefs
Difficult to place and/or fill in
exposed wave environments
Geotextile Containers Sheltered coast reefs, protected
embayments, estuaries
Unstable in large wave
conditions on open coast
Precast Concrete Units Sheltered coast reefs, protected
embayments, estuaries
Unstable and likely too brittle
in large wave conditions on
open coast. Site preparation
and placement would also not
be possible at open coast sites
Materials of Opportunity More suited to dive/ecology
reefs than coastal protection
Could be high environmental,
health and safety risk if used
in MPRs or ASRs
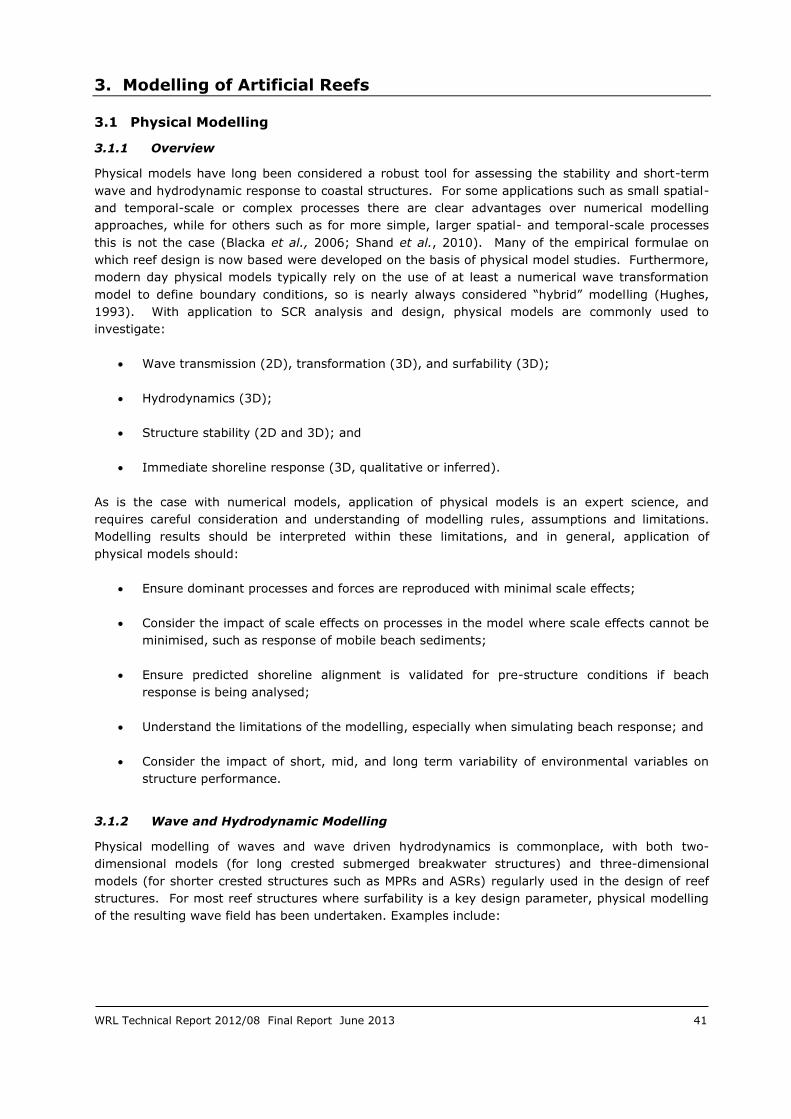
WRL Technical Report 2012/08 Final Report June 2013 41
3. Modelling of Artificial Reefs
3.1 Physical Modelling
3.1.1 Overview
Physical models have long been considered a robust tool for assessing the stability and short-term
wave and hydrodynamic response to coastal structures. For some applications such as small spatial-
and temporal-scale or complex processes there are clear advantages over numerical modelling
approaches, while for others such as for more simple, larger spatial- and temporal-scale processes
this is not the case (Blacka et al., 2006; Shand et al., 2010). Many of the empirical formulae on
which reef design is now based were developed on the basis of physical model studies. Furthermore,
modern day physical models typically rely on the use of at least a numerical wave transformation
model to define boundary conditions, so is nearly always considered “hybrid” modelling (Hughes,
1993). With application to SCR analysis and design, physical models are commonly used to
investigate:
Wave transmission (2D), transformation (3D), and surfability (3D);
Hydrodynamics (3D);
Structure stability (2D and 3D); and
Immediate shoreline response (3D, qualitative or inferred).
As is the case with numerical models, application of physical models is an expert science, and
requires careful consideration and understanding of modelling rules, assumptions and limitations.
Modelling results should be interpreted within these limitations, and in general, application of
physical models should:
Ensure dominant processes and forces are reproduced with minimal scale effects;
Consider the impact of scale effects on processes in the model where scale effects cannot be
minimised, such as response of mobile beach sediments;
Ensure predicted shoreline alignment is validated for pre-structure conditions if beach
response is being analysed;
Understand the limitations of the modelling, especially when simulating beach response; and
Consider the impact of short, mid, and long term variability of environmental variables on
structure performance.
3.1.2 Wave and Hydrodynamic Modelling
Physical modelling of waves and wave driven hydrodynamics is commonplace, with both two-
dimensional models (for long crested submerged breakwater structures) and three-dimensional
models (for shorter crested structures such as MPRs and ASRs) regularly used in the design of reef
structures. For most reef structures where surfability is a key design parameter, physical modelling
of the resulting wave field has been undertaken. Examples include:
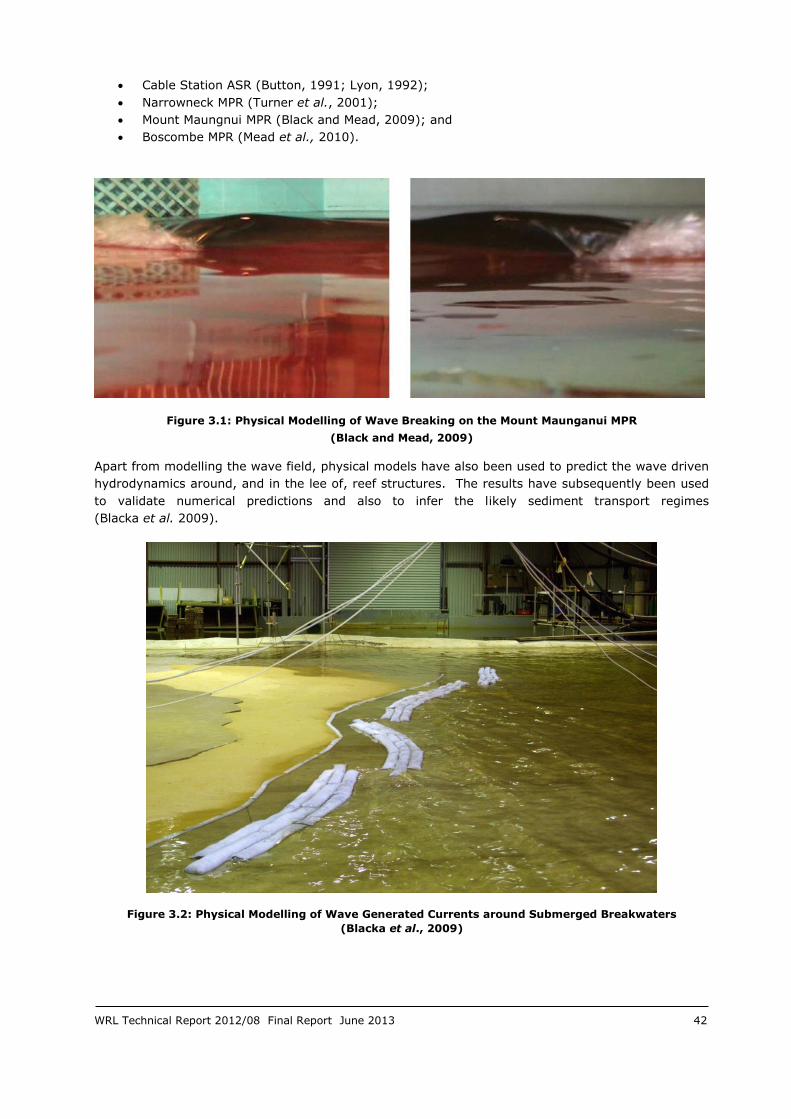
WRL Technical Report 2012/08 Final Report June 2013 42
Cable Station ASR (Button, 1991; Lyon, 1992);
Narrowneck MPR (Turner et al., 2001);
Mount Maungnui MPR (Black and Mead, 2009); and
Boscombe MPR (Mead et al., 2010).
Figure 3.1: Physical Modelling of Wave Breaking on the Mount Maunganui MPR
(Black and Mead, 2009)
Apart from modelling the wave field, physical models have also been used to predict the wave driven
hydrodynamics around, and in the lee of, reef structures. The results have subsequently been used
to validate numerical predictions and also to infer the likely sediment transport regimes
(Blacka et al. 2009).
Figure 3.2: Physical Modelling of Wave Generated Currents around Submerged Breakwaters
(Blacka et al., 2009)

WRL Technical Report 2012/08 Final Report June 2013 43
Scale effects in short wave physical models are typically associated with surface tension and viscosity
and most models are designed so that these parameters have minimal impact on results. This is
almost always achieved by following a few basic rules, such as (Frostick et al., 2011):
Model wave length greater than 0.3 m (period greater than 0.4 s);
Model water depth greater than 5 mm; and
Model wave height greater than 20 mm, with design wave height greater than 50 mm.
It is more likely for inaccuracies to be introduced into physical modelling of waves and
hydrodynamics through laboratory errors which are typically associated with model boundary
conditions, wave generation, or misrepresentation of real world wave conditions (Hughes, 1993).
3.1.3 Structure Response Modelling
Stability formulae for rock or concrete unit reef armouring have all been developed on the basis of
physical model testing. While these formulae are reasonable for initial/conceptual design, they have
been developed on the basis of physical model tests with specific test conditions and limitations. It is
therefore recommended that all significant SCR detailed design studies include at least 2D and
preferably 3D physical modelling to confirm the stability of reef armouring, particularly if the reefs
are relied upon to provide coastal protection and risk reduction. This modelling will provide
confidence in the robustness of a reef design, and may reduce the cost of the reef through
optimisation of armouring, which is not possible with empirical design equations. Structure response
physical modelling also has the advantage of visual association with the design, and can often be
undertaken in conjunction with modelling of other parameters.
Figure 3.3: Physical Modelling of Wave and Structure Interaction
As with modelling of waves and hydrodynamics, the impact of scale effects on model results for reef
armour stability is typically negligible, so long as basic guidelines are followed. For armour stability
modelling, scale effects should be negligible for both the wave and hydrodynamic processes

WRL Technical Report 2012/08 Final Report June 2013 44
(Section 3.1.2) as well as for the wave/structure interactions. This is typically achieved by
(Frostick et al., 2011):
Ensuring the dimensionless Reynolds Number for flow through the armour layer remains
larger than 3 x 10⁴; and
Using rock armour with diameter greater than 25 mm.
Though response of structures built using smaller sand filled geotextile containers (less than 5 m3)
have been examined in physical model studies, the stability of the very large geotextile tubes (tens
of metres long) is often not modelled. Scaling of such structures for physical modelling would be
complex and would require careful consideration of container fabric and fill material in the model, as
well as the behaviour of the model containers under wave attack.
3.1.4 Morphological Response Modelling
Hans Albert Einstein was one of the world’s leading researchers in the field of sediment transport and
was the son of the famous Albert Einstein. Albert was reported to have discouraged his son from
studying sediment transport: “… the older Einstein is said to have warned his son strongly of the
difficulties in dealing with sediment transport processes” (Vollmers, 1989 in Hughes, 1993). Hughes
(1993) also gave his own opinion that: “Understanding sediment transport in coastal regimes is a
perplexing challenge that in all likelihood will continue to frustrate coastal researchers and engineers
for generations to come”.
Physical modelling of morphological response to a structure is arguably one of the most complicated
and least reliable types of coastal physical modelling. Due to the physics inherent with scaling
coastal physical models according to Froude similitude and the required scales suitable for most
facilities, it is well known that model sediment typically cannot be scaled for size according to the
undistorted model length scale. The use of sediment that is not scaled in similitude subsequently
results in sediment transport processes not being truly reproduced within physical models.
Previous experience has led to a range of empirical scaling adjustments that allow some sediment
transport processes to be simulated with reasonable accuracy, when specific conditions dominate the
real world sediment transport processes. A range of considerations for compensating for the inability
to scale model sediment with true similitude have been presented over time:
A moveable bed scale model is restricted to representing either suspended-load transport or
bed-load transport, not both (Bijker, 1967);
Scaling laws must be applied consistently across the model (Bijker, 1967);
Wherever possible, sand should be used as the model material (Noda, 1972; Dean, 1985)
with the size adjusted to the model law (Noda, 1972) or scaled to achieve similitude with the
fall velocity (Dean, 1985);
If lightweight (low density) material must be used for the model sediment in suspended-load
models, its relative density should be greater than 1.3 (Noda, 1972);
Model and prototype densimetric Froude numbers should be equal for suspended-load
models (Kamphuis, 1975; Sager & Hales, 1979);
Lightweight sediment cannot be used to simulate littoral drift transport processes (Kamphuis,
1975; 1991);
Suspended-load dominated models must be undistorted (Dean, 1985);
Suspended-load dominated models must maintain fall velocity scaling criteria (Dean, 1985);
Models should be as large as possible (Noda, 1972; Dean, 1985); and

WRL Technical Report 2012/08 Final Report June 2013 45
Small-scale mobile-bed basin models should not be used for medium or long-term sediment
transport studies (Kamphuis, 2000).
It has been shown that the equilibrium shoreline alignment can be reproduced in a model with
reasonable accuracy when structures or significant coastal features dictate the nearshore wave
alignment (Nielsen et al., 2000). In these cases, the primary sediment transport mechanisms
(nearshore currents and longshore distribution of sediment by waves) still occur correctly in a model,
and so a mobile shoreline tends to evolve to an equilibrium alignment that resembles reality, even
though the sediment transport processes are not scaled correctly. These conditions apply to
shoreline change in the lee of submerged reef structures, and indeed this “mobile shoreline” physical
modelling technique has been used in the past to investigate shoreline response to reef structures.
Figure 3.4: Mobile Shoreline Response Physical Modelling for Narrowneck Reef
Due to the empirical adjustments that are required in order to undertake mobile bed or mobile
shoreline physical modelling, the results cannot be considered as truly quantitative. Instead the
modelling provides only qualitative and semi-quantitative insights into sediment transport processes.
This requires careful and limited interpretation of model results. Such models should only ever be
undertaken where the shoreline response of an existing or previously observed case can be initially
simulated (model validation), and the relative change in shoreline alignment induced by a structure
can then be qualitatively assessed.
3.1.5 Physical Modelling Limitations
While considered one of the most robust techniques for assessing wave/structure interactions and
insightful for investigating the effect of reef structures on beaches, physical modelling has definite
limitations. These include:
Limited spatial extent that can be considered in a model domain;
Model boundaries can interfere with hydrodynamic and morphological response if caution is
not taken;
Restriction to simulation of short time durations, resulting in discrete event-based modelling,
rather than evaluating long term processes;

WRL Technical Report 2012/08 Final Report June 2013 46
Sediment transport processes cannot be scaled with proper similitude, and empirical
“corrections” or “adjustments” are required to approximate morphological response;
Requires careful model design and interpretation of results, in order to properly transfer
model results to the real world application; and
Requires specialised large scale facilities.
3.2 Numerical Modelling
3.2.1 Overview
Roelvink and Reniers (2011) gave the following commentary on coastal morphological modelling:
“Models are formalized representations of reality. Computer models of coastal morphology contain
ideas about hydraulics, waves, sediment transport and sediment conservation that are captured in
formulations. They produce interesting pictures and flashy animations of coastal behaviour but they
cannot claim to represent reality in all its complexity. Rather, they quantify concepts we have in our
heads and combine processes that are too difficult for us to combine just by reasoning... The
problem arises when the people who put the concepts into the model are different from the people
who use the model. Then model concepts may be used out of context and results produced that are
clearly wrong.”
The use of numerical models in reef design and general coastal engineering applications has evolved
since the 1970s. Today, such models are used to consider the dynamics of wave/structure/beach
interaction with a higher level of complexity than is captured with the empirical solutions presented
in Section 2. With respect to applications for SCR analysis and design, numerical models are
commonly used to investigate:
Wave response to a reef, including wave shoaling, refraction, diffraction, and breaking, as
well as parameters used for classifying surfability such as peel angle, breaking intensity,
etc.;
Beach response during ambient and extreme conditions.
They may also be used to estimate structure loading under waves including prediction of the
pressure and velocity field around structure components.
Due to the complexity of natural processes, all numerical models involve approximations and
smoothing in both space and time. Models which are more theoretically correct and/or based on
more advanced physics inherently contain additional coefficients or parameters. This subsequently
introduces additional uncertainty, potential instability, may be much slower to run, and without
commensurate field data collection will give less realistic answers than well-developed simpler
empirical models.
3.2.2 Processes in Morphological Modelling
Generally, the primary objective of SCRs has been coastal protection, so the majority of modelling
effort has focussed on morphological change. For an initial bathymetry and assumed water level
(either averaged or varying with each time step), the logical steps/processes in modelling
morphological change are:
Waves;
Currents;
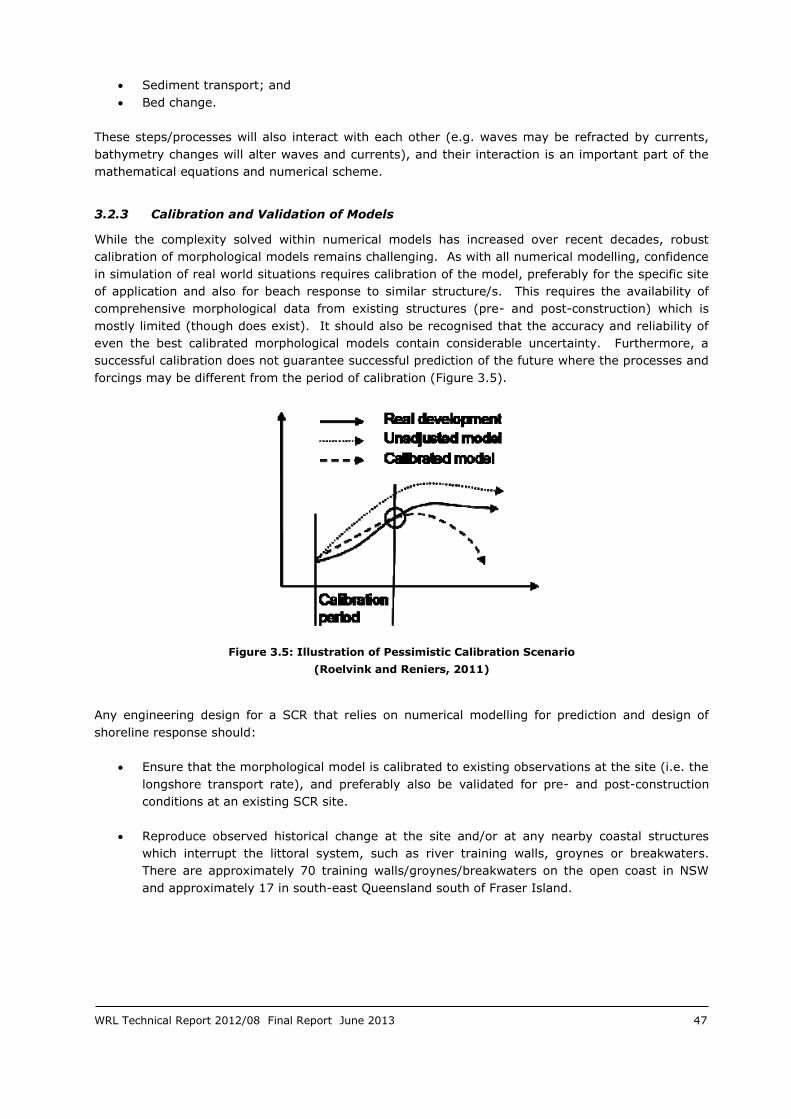
WRL Technical Report 2012/08 Final Report June 2013 47
Sediment transport; and
Bed change.
These steps/processes will also interact with each other (e.g. waves may be refracted by currents,
bathymetry changes will alter waves and currents), and their interaction is an important part of the
mathematical equations and numerical scheme.
3.2.3 Calibration and Validation of Models
While the complexity solved within numerical models has increased over recent decades, robust
calibration of morphological models remains challenging. As with all numerical modelling, confidence
in simulation of real world situations requires calibration of the model, preferably for the specific site
of application and also for beach response to similar structure/s. This requires the availability of
comprehensive morphological data from existing structures (pre- and post-construction) which is
mostly limited (though does exist). It should also be recognised that the accuracy and reliability of
even the best calibrated morphological models contain considerable uncertainty. Furthermore, a
successful calibration does not guarantee successful prediction of the future where the processes and
forcings may be different from the period of calibration (Figure 3.5).
Figure 3.5: Illustration of Pessimistic Calibration Scenario
(Roelvink and Reniers, 2011)
Any engineering design for a SCR that relies on numerical modelling for prediction and design of
shoreline response should:
Ensure that the morphological model is calibrated to existing observations at the site (i.e. the
longshore transport rate), and preferably also be validated for pre- and post-construction
conditions at an existing SCR site.
Reproduce observed historical change at the site and/or at any nearby coastal structures
which interrupt the littoral system, such as river training walls, groynes or breakwaters.
There are approximately 70 training walls/groynes/breakwaters on the open coast in NSW
and approximately 17 in south-east Queensland south of Fraser Island.

WRL Technical Report 2012/08 Final Report June 2013 48
Consider the impact of short, mid, and long term variability of environmental variables on
performance.
3.2.4 Offshore Waves
For many locations beyond NSW, much effort is often required to define an offshore wave climate
and time series. Measured data is considered superior to computer model output for defining the
ambient and extreme wave climate, but is not available for many locations beyond NSW.
For NSW, a network of wave buoys commenced with the first installation in 1971 and now
encompasses more than eight locations. Manly Hydraulics Laboratory (www.mhl.nsw.gov.au)
operates seven long term installations, while Sydney Ports Corporation (previously Maritime Services
Board) has operated a wave buoy off Botany Bay since 1971. The ports of Newcastle and Port
Kembla also have nearshore wave measuring instruments, and there have been numerous short
term deployments at other locations.
Time series of wave buoy data is available from the collecting institution, while the most recent
analysis of NSW wave data is contained in Shand et al. (2011).
For NSW, the measured wave climate can be supplemented with numerical model output from:
Wavewatch III which is available from 1997 to present (www.polar.ncep.noaa.gov);
ERA-40 which is available from 1957 to 2002 (www.knmi.nl).
These models provide additional wave directional predictions (prior to directional wave buoys). ERA-
40 provides a wave climate back to 1957, however, it is recommended that measured data be given
precedence over model output whenever the measured data is available.
Hindcast waves for documented ocean storms affecting the NSW coast from 1880 to 1980 are
provided in Blain Bremner Williams (1985), while Callaghan and Helman (2008) documented storms
affecting the eastern Australia coast between 1770 to 2008.
For enclosed water bodies protected from ocean swell, wind wave hindcasting techniques are well
documented in standard coastal engineering references such as SPM (1984) and CEM (2006).
3.2.5 Wave Transformation to Shore
In terms of wave processes, deep water is defined as half a deep water wavelength. For 10 and 12 s
period waves, the deep water wavelengths are 156 and 224 m respectively, meaning that the limit of
deep water is 78 and 112 m for these waves. The wave buoys operating off the NSW coast are
typically located in water depths of approximately 60 to 100 m which is an intermediate water depth
and close to deep water for wave periods of 10 s or less. Between deep water and the shore, waves
may be transformed through the processes of:
Refraction due to depth changes;
Refraction due to currents;
Diffraction;
Shoaling;
Bed friction;
Breaking;

WRL Technical Report 2012/08 Final Report June 2013 49
Reflection;
Growth through a following wind;
Decay through an opposing wind; and
Wave-wave interactions.
The earliest wave transformation models relied on Snell’s law (from optics), whereby waves slow in
shallow water – the shallow water wave equations. These early models applied wave transformation
processes to monochromatic waves – those with a single period. All contemporary models still rely
on this physical basis, but add varying levels of complexity and incorporate a range of the
transformation processes listed above. Simple Snell’s law refraction may be appropriate for simple
bathymetry and is easy to visualise (Figure 3.6 and Figure 3.7).
Contemporary models are generally governed by the “mild slope equation” and may be spectral (e.g.
SWAN, STWAVE) or use the “Boussinesq” approximation (e.g. FUNWAVE). Boussinesq models rely
on vertically averaged velocities and still generally require mild slopes. Most models transform
“spectral” waves, that is, waves having a range of periods as occurs in nature (frequency spectrum
or spreading) and a range of directions (directional spectrum or spreading).
Mild slope equation models can model wave transformation over complex bathymetry, but are
theoretically limited to “mild” (rather than steep) slopes.
The basic empirical observation that a wave will break in shallow water when its height is between
0.5 and 1.5 times the water depth is well accepted. However, the wave transformation process of
shallow water wave breaking is the poorly understood and most difficult to model. All contemporary
models use empirical approximations of wave breaking. The most common techniques used to
model this include setting a depth limited wave height, the surf zone model of Battjes and Jansen
(1978) or the breaker decay model of Dally, Dean and Dalrymple (1984).
The presence of an SCR will alter nearshore waves predominantly through alterations to wave
breaking, refraction and diffraction. This perturbation will then create or alter wave driven currents.
SCRs are of small scale, have complex interactions with waves and are possibly steeper than natural
slopes. This means that different models may be required to simulate important wave processes in
the vicinity of an SCR than the model used to transform waves from deep water to the vicinity of the
structure.
3.2.6 Wave Transformation on the NSW Open Coast
The NSW open coast has the following characteristics which influence nearshore wave modelling:
Nearshore waves are predominantly swell, with periods above 8 s (rather than sea);
The continental shelf gradient is relatively steep – steep enough to make frictional losses
negligible, but mild enough to be appropriate for “mild slope” models;
The extreme tidal range is about 2 m and extreme water level range (from negative tidal
anomalies to 100 year ARI storm surge level excluding wave setup) is less than 3 m;
Accurate wave climate information is available from wave buoys at typically 60 to 100 m
water depth.
These features mean that for the NSW open coast, the processes of bed friction, growth through a
following wind, decay through an opposing wind and wave-wave interactions can generally be
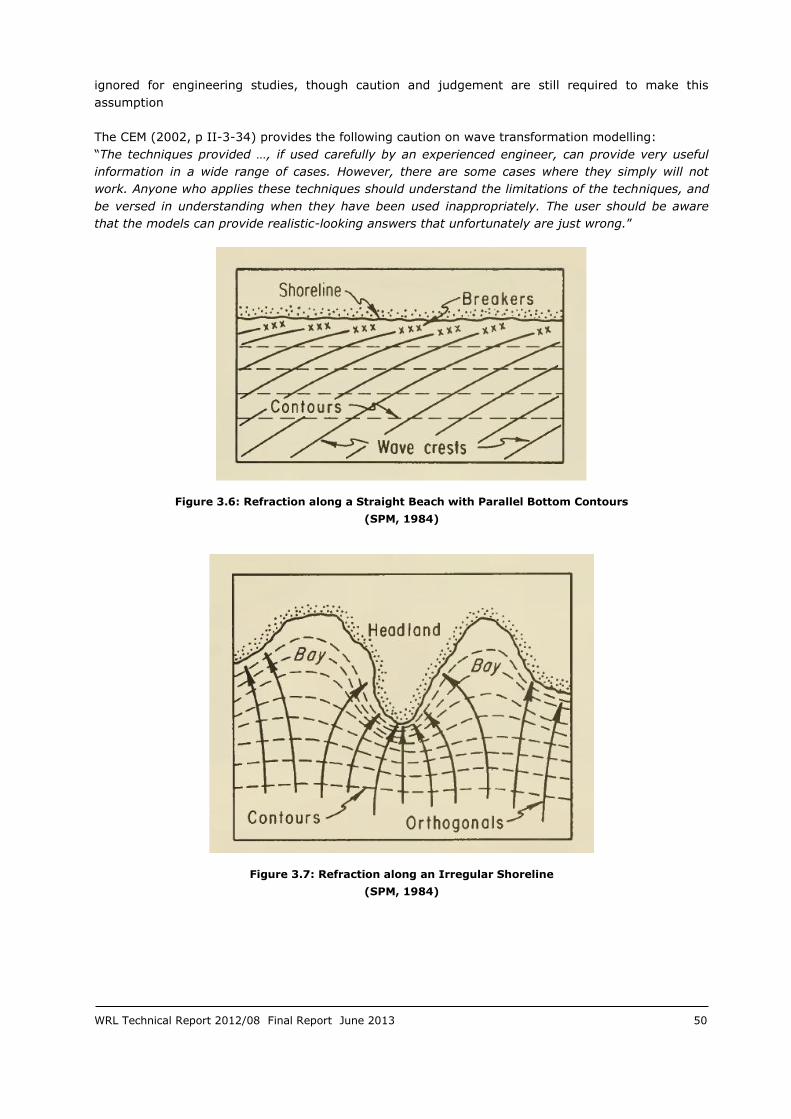
WRL Technical Report 2012/08 Final Report June 2013 50
ignored for engineering studies, though caution and judgement are still required to make this
assumption
The CEM (2002, p II-3-34) provides the following caution on wave transformation modelling:
“The techniques provided …, if used carefully by an experienced engineer, can provide very useful
information in a wide range of cases. However, there are some cases where they simply will not
work. Anyone who applies these techniques should understand the limitations of the techniques, and
be versed in understanding when they have been used inappropriately. The user should be aware
that the models can provide realistic-looking answers that unfortunately are just wrong.”
Figure 3.6: Refraction along a Straight Beach with Parallel Bottom Contours
(SPM, 1984)
Figure 3.7: Refraction along an Irregular Shoreline
(SPM, 1984)

WRL Technical Report 2012/08 Final Report June 2013 51
3.2.7 Hydrodynamic/Surf Zone Circulation Models
Nearshore currents can result from wave transformation, tides, local winds and larger scale ocean
currents. Tsunamis also have a rare but extreme impact on currents, but are not generally
considered for design of SCRs or other coastal structures within NSW.
On the open coast of NSW, currents near to and inside the surf zone are predominantly driven by
waves rather than tides or ocean currents. The predominant currents driven by waves are:
Longshore currents due to waves breaking at an angle to the coast and applying stress to the
surrounding water;
Wave setup which results in higher water levels near the shore – there may also be
alongshore gradients in wave setup;
The mass flux over the crest of a SCR due to wave breaking and subsequent surf zone
circulations and return currents.
These currents have a quasi-steady state component and episodic components or intensification,
which may manifest as “flash” rips on natural coasts. The episodic component may be caused by
groups of irregular waves, incoming long waves, and interactions of different swell sources. There is
also usually a vertical velocity profile within the water column, particularly in the cross shore
direction, where the surface current may be directed shoreward and a return “undertow” directed
seaward (Figure 3.9).
Hydrodynamic numerical modelling of currents always involves approximations and numerical
solutions of the Navier-Stokes equations. Simpler coastal profile and planform models may use
empirical approximations of physical processes relating to wave angle and height to generate
currents. Modelling of currents driven by waves may be undertaken three dimensionally (3D), quasi
3D using one or more layers, or by depth averaging 2D-H (Figure 3.8). For hydrodynamic modelling
of a single SCR or field of SCRs, 3D or quasi 3D modelling is needed to properly model seaward
return flows due to wave setup and mass flux over the reef crest (Figure 3.9). The use of a 2D-H
model in these circumstances will overestimate seaward velocities in rips or the gaps between SCRs
because the 2D-H model is unable to reproduce stratified flow. Conversely, for simple longshore
currents, the complexity of a 3D model may be unwarranted.

WRL Technical Report 2012/08 Final Report June 2013 52
Figure 3.8: Example of Velocity Fields for Simplified Engineering Options (2D-H Model)
(Roelvink and Reniers, 2011)
Figure 3.9: Illustration of Undertow, 2D-H, Quasi 3D and 3D Flow

WRL Technical Report 2012/08 Final Report June 2013 53
3.2.8 Sediment Transport, Morphology and Shoreline Response
Sediment transport is a complex interplay between the sediment characteristics, water velocities and
waves. Sediment may move as either bed load or suspended load.
Sediment is characterised by composition, density, grain size, size distribution and shape. A large
amount of research effort has been undertaken on sediment transport in rivers and engineered
structures such as pipes and channels, however, on beaches the process is further complicated by
waves which generate rapidly oscillating velocities, very high sediment concentrations at the
breakpoint and complex flow patterns. These factors mean that the gross sediment transport due to
waves may be one or more orders of magnitude higher than the net.
Suspended sediment concentration may be solved by:
3D Advection-diffusion;
2D-H Advection-diffusion.
Complex processes may be considered in wave driven sediment transport, however, almost all
models simplify this, and many use simple “bulk” formulas which combine bed load and suspended
load such as Soulsby-van Rijn (Soulsby, 1997).
Morphological (and shoreline) change result from gradients in sediment transport. While this results
directly from the sediment transport calculations, some degree of numerical smoothing is needed to
avoid instability. The updated morphology is then used as input for the next time step of model
calculations as shown in Figure 3.10.
Coupled
Uncoupled
Figure 3.10: Flow Diagram of Tide Averaged Morphodynamic Model
(Roelvink and Reniers, 2011)
Example output from the modelling of a range of coastal structure options is shown in Figure 3.11.
This example provides a valuable comparison of the options, but is limited to a single (modal) wave
condition, with no incorporation of tides and depth averaged (2D-H) velocities.

WRL Technical Report 2012/08 Final Report June 2013 54
Many models update morphology less frequently than waves and flow, on the assumption that the
model is relatively insensitive to small changes in the bed. For models which calculate morphology
at each time step, an alternative scheme is to estimate change over a single tidal cycle, then multiply
this by a “morphological factor (morfac)” to simulate a longer real world duration more efficiently,
but this may not simulate the full variability in the natural forcing conditions.
Figure 3.11: Example of Bathymetric Change for Coastal Engineering Options
(30 Days of Simulation, Roelvink and Reniers, 2011)
3.2.9 Beach Profile and Planform Models
Simple and robust beach profile and planform models should be applied as an alternative or adjunct to
more complex hydrodynamic models for the design of SCRs. These have a much longer track record and
have greater verification after prediction. The reduction in complexity can be their greatest advantage. A
principle behind these models is that cross shore and longshore processes can be separated because:
The long term average cross shore profile reaches an equilibrium relatively quickly – of the
order of 1 year if perturbed by a structure, nourishment or sea level rise, and is relatively
uniform alongshore;
Short term storm events drive most cross shore change (erosion and accretion), but the
profile oscillates around a long term average shape, which may shift landward or seaward
(recession and progradation);
Long term (years to decades to centuries) coastal change (under steady sea level) is
primarily driven by gradients in longshore littoral drift sediment transport.
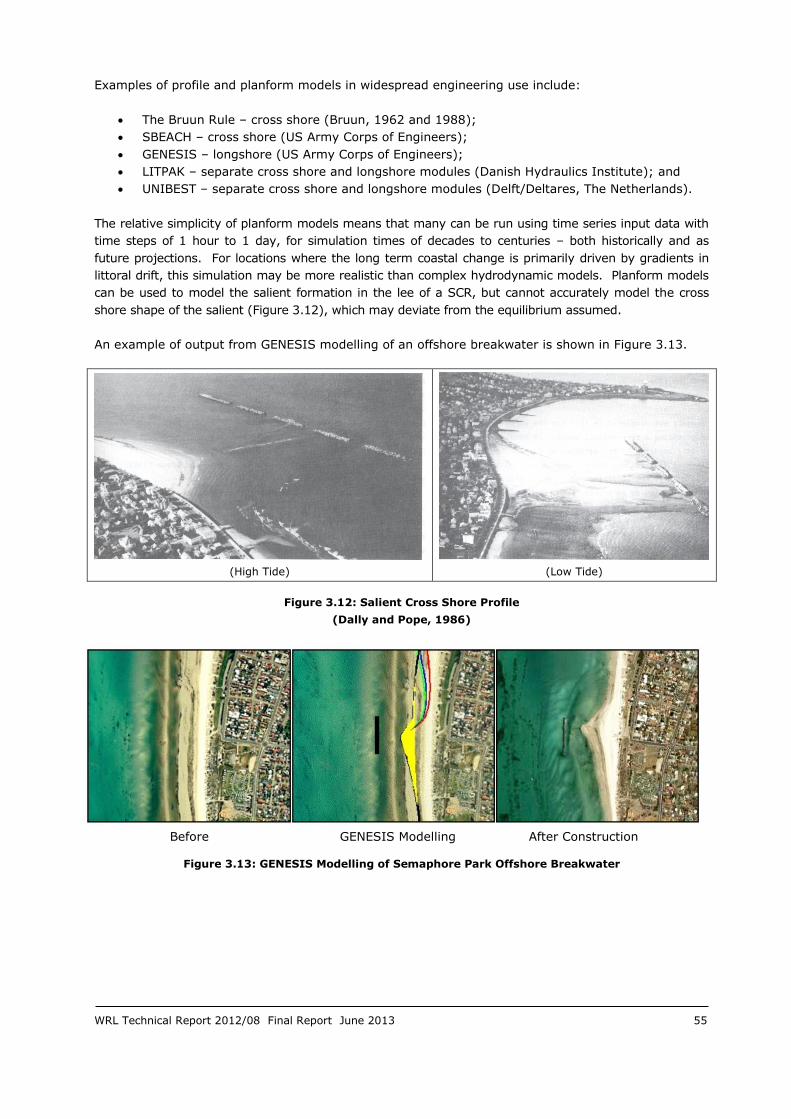
WRL Technical Report 2012/08 Final Report June 2013 55
Examples of profile and planform models in widespread engineering use include:
The Bruun Rule – cross shore (Bruun, 1962 and 1988);
SBEACH – cross shore (US Army Corps of Engineers);
GENESIS – longshore (US Army Corps of Engineers);
LITPAK – separate cross shore and longshore modules (Danish Hydraulics Institute); and
UNIBEST – separate cross shore and longshore modules (Delft/Deltares, The Netherlands).
The relative simplicity of planform models means that many can be run using time series input data with
time steps of 1 hour to 1 day, for simulation times of decades to centuries – both historically and as
future projections. For locations where the long term coastal change is primarily driven by gradients in
littoral drift, this simulation may be more realistic than complex hydrodynamic models. Planform models
can be used to model the salient formation in the lee of a SCR, but cannot accurately model the cross
shore shape of the salient (Figure 3.12), which may deviate from the equilibrium assumed.
An example of output from GENESIS modelling of an offshore breakwater is shown in Figure 3.13.
(High Tide)
(Low Tide)
Figure 3.12: Salient Cross Shore Profile
(Dally and Pope, 1986)
Before GENESIS Modelling After Construction
Figure 3.13: GENESIS Modelling of Semaphore Park Offshore Breakwater

WRL Technical Report 2012/08 Final Report June 2013 56
3.2.10 Surfability Models
As discussed in Section 2.6 the original concept of surfer speed as a function of wave height and peel
angle was published by Walker (1974). Black et al. (1997) extended surfability assessment to
include cross shore wave shape which is predominantly caused by offshore bathymetry and swell
characteristics.
At the most basic level, surfability on an ASR can be assessed by the presence (or absence) of wave
breaking on the crest of a structure – assuming the structure itself is to provide the surfing amenity
and is not intended to modify incoming waves to provide surfing inshore of it. Higher level
assessment involves extracting the breakpoint and wave height from a wave transformation model
and calculation of peel angles and length of ride.
Mortensen (2010) produced a model and animation based on a Boussinesq wave model coupled with
a volume of fluid wave model which appears to reproduce the wave breaking process from a surfing
perspective. Modelling of surfability should be considered to be in the early stages of research.
There are no models available off the shelf which directly assess surfability. All require substantial
post processing of model output, interpretation of results and interfacing of the model output with
the prevailing tides, wind and wave climate.
3.2.11 Commonly Used Models
The underlying source code and published work for many of the principles underlying numerical
models has existed since the 1970s. Much of the recent development has been in better data
interchange between various components, user friendliness, utilising advances in computing and
improved graphical output (including animations). Numerous consultants and institutions have “in-
house” models suitable for coastal morphodynamic modelling. These may incorporate improvements
on commercial or widely used (freeware) models, but such models may not be readily available for
those outside the institution which developed them.
A list of commonly used morphological models and their underlying schemes is shown in Table 3.1.

WRL Technical Report 2012/08 Final Report June 2013 57
Table 3.1: Summary of Commonly used Coastal Morphology Models
Model Wave
Driver
Flow
Model
Sediment
Transport
Morph
Updating
Bed
Comp Grid Availability
Simple Profile and Planform Models
BEACHPLAN
Snell’s law
and depth
lim
1D CERC
Longshore
Each time
step 1D Regular Licensed
Bruun Rule n/a n/a 1D 1 step n/a Simple
calculation
LITPAK
Snell’s
law,
Battjes
and
Jansen
1D
Separate
cross shore
and
longshore
Each time
step 1D Variable Licensed
GENESIS
Snell’s law
and depth
lim
1D CERC
Longshore
Each time
step 1D Regular Licensed
SBEACH
Snell’s law
and Dally
et al.
(1984)
n/a Cross
shore
Each time
step 1D Variable Licensed
UNIBEST
Snell’s
law,
Battjes
and
Jansen
1D
Separate
cross shore
and
longshore
Each time
step 1D Variable Licensed
Hydrodynamic Models
ADCIRC Spectral 2D-
H/3D 2D-H/3D Online 2D-H
Unstruc, finite
element/ volume Licensed
Delft3D
Spectral
wave av/
Short
wave av
2D-
H/3D
2D-H/3D
sand and
mud
Online with
morfac 3D Curve, finite diff Open source
FINEL Spectral 2D-H 2D-H Online with
morfac 2D
Unstruc, finite
element Not
Mike21
Spectral/
parabolic/
mild slope
2D-
H/Q3D
2D-H/Q3D
sand and
mud
Offline or
online with
morfac
3D
Rect, curve,
finite diff,
unstruc finite vol
Licensed
RMA External 2D-
H/3D
2D-H/Q3D
sand and
mud
Offline or
online with
morfac
2D-H Unstruc, finite
element/ volume Licensed
ROMS-SED Spectral 3D 3D Online with
morfac 3D Curve, finite diff Open source
SWAN Spectral n/a n/a n/a n/a Rect Open source
Telemac Spectral 2D-
H/3D 2D-H/3D
Offline or
online with
morfac
3D Unstruc, finite
element Licensed
X-Beach
Spectral
wave av/
Short
wave av
2D-H Q3D Online with
morfac 3D Rect, finite diff Open source

WRL Technical Report 2012/08 Final Report June 2013 58
3.3 Example Applications of Physical and Numerical Models for Artificial Reefs
Many of the existing submerged breakwater, ASR and MPR structures around the world have been
modelled during their design. In some cases this provides an opportunity to look back and consider
the level of reliability with which the model predictions eventuated, while in other cases changes to
structure design during or post construction as well as other influences on beach response (such as
nourishment) make direct comparisons more difficult. Appendix A provides a review of the existing
reef structures from around the world where information is available regarding the design,
construction, and performance. Where suitable information is available to compare the modelled reef
performance with the observed performance post construction, this comparison is made in detail in
Appendix A.

WRL Technical Report 2012/08 Final Report June 2013 59
3.4 Summary Box: Application of Physical and Numerical Models for SCR
Structures
It is strongly recommended that detailed design of any SCR structure adopt a hybrid modelling
approach, whereby the strengths of both numerical and physical models are utilised to arrive at the
final reef design. Furthermore, it is recommended that modelling of any structure with
environmental, social, or economic significance be underpinned by site specific data collection for
wave transformation, water levels, and sediment transport. Numerical models are well suited to
assessing simpler wave, hydrodynamic, and morphological processes over larger spatial and time
scales, with the degree of certainty in model predictions proportional to the level of model
calibration. Any engineering design for a SCR that relies on numerical modelling for prediction and
design of shoreline response should as a minimum:
Have validated hydrodynamic model predictions relating to wave induced currents around the
structure (likely through comparison with physical model or previous study data);
Ensure that the morphological model is calibrated to existing observations at the site, and
preferably also be validated for simulating pre and post construction conditions at an existing
SCR site; and
Consider the impact of short, mid, and long term variability of environmental variables on
structure performance.
Physical models should be used for assessing reef armour stability, wave, and hydrodynamic
processes, and can also be applied to gain valuable qualitative and semi-quantitative insight into
morphological response. Application of physical models should:
Ensure dominant processes and forces are reproduced with minimal scale effects;
Consider the impacts of scale effects on processes in the model where these effects cannot
be minimised, such as response of mobile beach sediments;
Ensure predicted shoreline alignment is validated for pre-structure conditions if beach
response is being analysed;
Understand the limitations of the modelling, especially when simulating beach response; and
Consider the impact of short, mid, and long term variability of environmental variables on
structure performance.
There are many example applications where numerical and physical models have been applied
beyond their limitations, and while the modelling has been able to consider many complexities of the
case and produce results, lack of calibration means that the results may not be any more reliable
than could have been predicted with simple empirical solutions or the judgement of an experienced
practitioner. Nevertheless, the analysis has been relied upon as what “will” happen and not what
“may” happen, which (in the opinion of the authors) has contributed to structures not living up to
expectations.

WRL Technical Report 2012/08 Final Report June 2013 60
4. Performance and Review of Existing Reefs
4.1 Outline of Review of Existing Submerged Constructed Reefs
The objectives of this review were to identify, summarise and evaluate submerged constructed reefs
both in Australia and internationally, with a focus on those reported in technical literature. In
particular, the review has been undertaken to provide an objective summary of the coastal protection
performance of SCR structures on the basis of information presented in technical publications. This
information provides a useful overview of the current state of application of SCR structures and
identifies trends in the types of structures that have performed more reliably. The review is
presented in four parts:
Detailed review of key existing reefs (Appendix A);
Summary of existing reef characteristics (Section 4.2);
Discussion of existing reef performance (Section 4.3); and
Lessons learnt from existing reef projects (Section 4.4).
Where suitable information has been available, which is not the case for all reef structures, the
detailed review in Appendix A and this evaluation have considered a range of aspects for the existing
SCR structures, including:
Summary of reef structural and environmental characteristics;
Evaluation of coastal protection performance, including identification and discussion of
primary variables influencing shoreline response;
Environmental variables such as wave climate, tides, and sediment transport characteristics;
Cost;
Capability and success of construction methods; and
Durability of construction materials.
Figure 4.1: Borth MPR June 2012, Wales
(Source: eCoast, 2012)

WRL Technical Report 2012/08 Final Report June 2013 61
4.2 Summary of Existing Submerged Constructed Reefs
Lamberti et al. (2005), within the European research program DELOS, reported that submerged
structures are more common in Europe with 20% to 30% of the breakwaters inventoried (total of
837) being fully submerged compared with less than 1% (over a total of 1548 inventoried) in Japan
and a negligible number in the USA (total of 200 breakwaters inventoried). However, more recent
statistics for Japan and USA may show an increase in use of submerged constructed reefs. While the
use of submerged constructed reefs has not been widely adopted in Australia to date, there has been
a trend for communities in Australia to consider submerged reef structures as a viable alternative
coastal protection method due to the low visual impact, possible multi-purpose benefits and their
active promotion by designers and builders. Australia is also home to the largest yet built MPR, the
Narrowneck artificial reef at the Gold Coast.
Figure 4.2: ReefballTM Submerged Breakwaters, Gran Dominicus, Dominican Republic
(Source: www.reefball.org)
A list of major artificial reef projects is presented in Figure 4.3 with information for each project
summarised in:
Table 4.1: Structure type, intended purpose, success/failure;
Table 4.2: Engineering features;
Table 4.3: Environmental variables;
Table 4.4: Estimated costs and cost rates.

WRL Technical Report 2012/08 Final Report June 2013 62
This summary has been based on cases that are documented in published scientific literature. More
information on the design and monitoring of these structures can be found either in the detailed
review of key reef projects in Appendix A, or by consulting the available references for each project.
Although not exhaustive, the list of field cases covers a wide range of hydrodynamic conditions with
a variety of wave climates and tidal ranges considered, as well as different geomorphological settings
such as longshore and cross-shore transport dominated coast, and exposed or sheltered beaches.
Figure 4.3: Location of SCRs Around the World
Readers are directed to Table 1.1 for clarification on the terminology used and definitions for the
different structure types in the summary (ASR, MPR, and Submerged Breakwater). It should also be
noted that a structure has been classified as a MPR if design studies indicated that it would provide
multiple outcomes. If a reef was constructed with a single objective, to provide enhanced surfing
amenity for example, but design studies indicated that it would also provide a second outcome,
coastal protection for example, then it has been classified as a MPR.

WRL Technical Report 2012/08 Final Report June 2013 63
Table 4.1: Reef Summary: Structure Type, Intended Purpose and Successfulness
Site Structure Type Primary Objective Primary
Successful (5) Secondary Objective
Secondary
Successful (5)
Australia
Cable Station, WA ASR Surfing Enhancement Partially na na
Narrowneck, QLD MPR Coastal Protection Minor Surfing Enhancement Minor
(1) Semaphore Park, SA SB Coastal Protection Yes na na
New
Zealand
Mount Maunganui, NZ MPR Surfing Enhancement No(2) Coastal Protection Negligible(2)
Opunake, NZ ASR Surfing Enhancement No(2) na na
USA
Midtown Palm Beach, Florida SB Coastal Protection No na na
Dupont Palm Beach, Florida SB Coastal Protection No na na
Vero Beach, Florida SB Coastal Protection No na na
Avalon, New Jersey SB Coastal Protection Partially na na
Cape May, New Jersey SB, Groynes Coastal Protection Yes na na
Belmar, New Jersey SB Coastal Protection Yes na na
Cape May #2, New Jersey SB, Groynes Coastal Protection Yes na na
SB, Groynes Coastal Protection No na na
Delaware Bay, Delaware SB Coastal Protection No na na
El Segundo, California ASR Surfing Enhancement No na na
Mexico Yucatan (5 sites) SB Coastal Protection Yes na na
Caribbean
Gran Dominicus, Dominican
Republic SB, Natural Reef Coastal Protection Yes
Ecological
Enhancement Yes
Grand Cayman, (4)Cayman
Islands SB Coastal Protection Yes
Ecological
Enhancement Yes

WRL Technical Report 2012/08 Final Report June 2013 64
Table 4.1 Cont’d: Reef Summary: Structure Type, Intended Purpose and Successfulness
Site Structure Type Primary Objective Primary
Successful (5) Secondary Objective
Secondary
Successful (5)
Italy
Lido di Ostia #1, Rome SB, Groynes Coastal Protection No na na
Lido di Ostia #2, Rome SB, Groynes Coastal Protection Yes na na
Lido di Dante, Ravenna SB, Groynes Coastal Protection Yes na na
Marche SB, Groynes Coastal Protection No na na
Pellestrina, Venice SB, Groynes Coastal Protection Yes na na
Punta Marina, Ravenna SB, Groynes Coastal Protection Yes(3) na na
UK
Boscombe, England MPR Surfing Enhancement Partially Coastal Protection Minor
Borth, Wales MPR, BW,
Groynes Coastal Protection Unknown(3) Surfing Enhancement Unknown(3)
Japan
Iburi Reef, Hokkaido SB Coastal Protection Yes na na
Keino-Matsubara Beach SB Coastal Protection No na na
Niigata SB Coastal Protection No na na
South
Korea Young-Jin Beach SB Coastal Protection Partially na na
India Kovalam, Kerala MPR Coastal Protection Yes(4) Surfing Enhancement Yes(4)
UAE Undisclosed SB Coastal Protection Yes na na
Notes: (1) Trial structure originally built as emergent (+1 m AHD), crest was lowered to -0.9 m AHD following the rolling off of top geocontainers
(2) Construction incomplete
(3) Insufficient monitoring period
(4) Performance results of this reef are considered preliminary and subject to further monitoring and publishing of results
(5) A reef was considered successful if it achieved its objective or the outcome predicted in design studies, partially successful if it provided some improvement
but not to the extent initially predicted, or not successful if it had no notable impact

WRL Technical Report 2012/08 Final Report June 2013 65
Table 4.2: Reef Summary: Engineering Aspects
Site Material
Longshore
Length (1)`
(m)
Cross Shore
Width (1)
(m)
Water
Depth
(m)
Offshore
Distance (2)
(m)
Submergence
(m)
Nourishment
(m)
Settlement
or Scour
Australia
Cable Station, WA V-shape, Rocks 140 70 3.0-6.0 275 1.0 to 2.5 N Not
Reported
Narrowneck, QLD V-shape, GCs 170 280 2.0-10.0 100-600 min. 1.0 Y Y
(3)Semaphore Park, SA GCs then rock 197 13 2.0 200 1.0 Y Y
New
Zealand
Mount Maunganui, NZ V-shape GCs 90 70 3.0-4.5 250 0.4 N Y
Opunake, NZ GCs 30 100 1.8-3.0 ~300 At LAT N Not
Reported
USA
Midtown Palm Beach, Florida PEP™ Units 1260 4.6 3.0 70 0.7 N Both
Dupont Palm Beach, Florida PEP™ Units 168 4.6 2.2 53 0.6 N Both
Vero Beach, Florida PEP™ Units 915 4.6 2.1-2.7 85 0.3 N Both
Avalon, New Jersey Beachsaver™ Units 305 4.8 2.2-3.8 100-150 min. 0.4 Y Both
Cape May, New Jersey Beachsaver™ Units 305 4.8 2.0-2.5 50-65 At MLW N N
Belmar, New Jersey Beachsaver™ Units 335 4.8 2.3-2.4 128 0.7 to 1.6 Y Both
Cape May #2, New Jersey Beachsaver™ Units 220 4.8 2.7 120 At MLW N Both
T-Sill Units 200 3.66 2.7 120 1.8 N Both
Delaware Bay, Delaware Rubble Mound 300 Not Rep. 1.0 75 0.0 Y Y
El Segundo, California V-shape GCs 64 29 3.0 50 0.9 N Y
Mexico Yucatan (5 sites) GCs 4,300 1.8 1.0 MLWM At MHW N Not
Reported
Caribbean
Gran Dominicus, Dominican
Republic Reef Ball™ Units ~370 6 1.6-2.0 15-30 0.3-0.8 N
Not
Reported
Grand Cayman, Cayman
Islands Reef Ball™ Units 80 9-11 1.4-2.0 37 min. 0.1 Y
Not
Reported

WRL Technical Report 2012/08 Final Report June 2013 66
Table 4.2 Cont’d: Reef Summary: Engineering Aspects
Site Material
Longshore
Length (1)
(m)
Cross Shore
Width (1)
(m)
Water
Depth
(m)
Offshore
Distance (2)
(m)
Submergence
(m)
Nourishment
(m)
Settlement
or Scour
Italy
Lido di Ostia #1, Rome Rubble Mound 3000 15 4.0 100 1.5 Y Y
Lido di Ostia #2, Rome Rubble Mound 700 15 3.0-4.0 50 0.5 N Y
Lido di Dante, Ravenna Rubble Mound 770 12 3.0 150 0.5 Y Y
Marche Rubble Mound Not Rep. 10-12 3.0 100-200 0.5 N Y
Pellestrina, Venice Rubble Mound 9000 14 4.5 300 1.5 Y Y
Punta Marina, Ravenna Tecnoreef™ &
Rocks 850 5 2.7 280 1.0 Y Y
UK
Boscombe, England GCs 80 90 3-5 225 0.5 Y Y
Borth, Wales Rubble Mound 72 (Nth Reef)
85 (Sth Reef)
170 (Nth Reef)
45 (Sth Reef) 4.0
110 (Nth Reef)
140 (Sth Reef) At MSL Y
Not
Reported
Japan
Iburi Reef, Hokkaido Aquareef™ Units 150 19 3.5 ? At MHW N N
Keino-Matsubara Beach Not Reported 80 20 4.0 85 2.7 Y Not
Reported
Niigata Not Reported 540 20 8.5 400 1.5 N Not
Reported
South Korea Young-Jin Beach GCs 240 8.4 3.0 90-100 1.2 N Scour
India Kovalam, Kerala GCs 65 85 1.3-3.7 90 0.2-3.4 N Not
Reported
UAE Undisclosed GCs 500 12 0.0-2.0 50-200 0.0 Y N
Notes: (1) For V-shape reefs refer to max. alongshore and cross shore dimension
(2) Distance to the undisturbed shoreline prior construction
(3) Trial structure originally built as emergent (+1 m AHD), crest was lowered to -0.9 m AHD following the rolling off of top geocontainers,
then reconstructed from rock with crest at +1 m AHD.

WRL Technical Report 2012/08 Final Report June 2013 67
Table 4.3: Reef Summary: Environmental Conditions
Site
Beach
Slope (1)
Typical Tide
Range Typical Wave Period and Height
Longshore
Transport Rate
(1V:XH) (m) (s,m) (103 m3/yr)
Australia
Cable Station, WA Not Rep. 0.8 H=1-2 (summer), H=1.5-2.5 (winter) Negligible?
Narrowneck, QLD 50 2.0 H~1 500
(3)Semaphore Park, SA 150 2.0 Not Rep. 80
New Zealand Mount Maunganui, NZ Not Rep. 2.0 T~11, H~1.5 60-80
Opunake, NZ Not Rep. >3.0 Not Rep. Not Rep.
USA
Midtown Palm Beach, Florida 25 Not Rep. Not Rep. 100
Dupont Palm Beach, Florida Not Rep. Not Rep. Not Rep. Yes
Vero Beach, Florida 30 Not Rep. Not Rep. 30
Avalon, New Jersey Not Rep. Not Rep. Not Rep. Yes
Cape May, New Jersey Not Rep. 1.5 H=0.6 (summer), H=1.2 (winter) 153
Belmar, New Jersey Not Rep. Not Rep. Not Rep. Yes
Cape May #2, New Jersey Not Rep. 1.5 H=0.6 (summer), H=1.2 (winter) 153
Not Rep. 1.5 H=0.6 (summer), H=1.2 (winter) 153
Delaware Bay, Delaware Not Rep. Not Rep. Not Rep. Negligible
El Segundo, California Not Rep. 1.6 T=6, H=0.9 (summer), H=1.5 (winter) Not Rep.
Mexico Yucatan (5 sites) 20 <1.0 T=4-8, H<1.0 50-100
Caribbean Gran Dominicus, Dominican Republic 19 0.4 Not Rep. 170
Grand Cayman, (4)Cayman Islands Not Rep. 0.3-0.5 Not Rep. Not Rep.

WRL Technical Report 2012/08 Final Report June 2013 68
Table 4.3 Cont’d: Reef Summary: Environmental Conditions
Site
Beach
Slope
Typical Tide
Range Typical Wave Period and Height (2)
Longshore
Transport Rate
(1V:XH) (m) (s,m) (103 m3/yr)
Italy
Lido di Ostia #1, Rome 20 0.4 Hs~2 (97th %ile) 20-50
Lido di Ostia #2, Rome 10 0.4 Hs~2 (97th %ile) 20-50
Lido di Dante, Ravenna 15 0.3 (neap)
0.8 (spring)
Hs~0.4 (average)
Tp~4 (average) Negligible
Marche 10 0.14 (neap)
0.47 (spring) Hs~0.5 (average) Negligible
Pellestrina, Venice 100 1.0 H~0.7
Tp~4 Not Reported
Punta Marina, Ravenna Not Rep. 0.3 (neap)
0.8 (spring)
Hs~0.4 (average)
Tp~4 (average) Negligible
UK Boscombe, England Not Rep. 1.8 T~4, H~0.5 Not Reported
Borth, Wales Not Rep. 6.0 Not Reported Not Reported
Japan
Iburi Reef, Hokkaido Not Rep. Not Rep. Not Reported Not Reported
Keino-Matsubara Beach 10 to 30 Not Rep. H=0.4 (summer), H=1 (winter) Not Reported
Niigata 50 Not Rep. Not Reported Not Reported
South Korea Young-Jin Beach Not Rep. Not Rep. H>4 m (storm, winter) Not Reported
India Kovalam, Kerala Not Rep. ~1.0 T=11-15s, H=1-2.5 Not Reported
UAE Undisclosed 12 1.0 T=5, H=1 Not Reported
Notes: (1) The beach slope is typically the natural gradient in the wave shoaling and breaking zone, though the definition is often not well reported in literature
(2) The wave height and period statistics that are reported in literature vary, with the numbers in this table only intended for relative comparison between the sites

WRL Technical Report 2012/08 Final Report June 2013 69
Table 4.4: Approximate Reef Cost Rates
Site Structure Type
Cost
($M)1
Cost
($ per m3 Reef
Volume)1
Cost
($ per m Beach
Protected)1,2
Australia
Cable Station, WA ASR 2.51 457 NA
Narrowneck, QLD MPR 3.91 56 9,800 min.
Semaphore Park, SA SB 1.10 NA 5,500
New Zealand Mount Maunganui, NZ MPR 1.53 545 10,200 min.
Opunake, NZ ASR 0.93 274 NA
USA Cape May #2, New Jersey
SB, Groynes ~0.88 NA 4000
SB, Groynes ~0.28 NA 1400
El Segundo, California ASR 0.68 504 NA
UK Boscombe, England MPR ~4.91 384 9,800 min.
India Kovalam, Kerala MPR 1.41 351 7,000 min.
UAE Undisclosed SB ~6 NA 10,100(3)
Notes: (1) Cost rates have been corrected to approximate equivalent 2013 AUD.
(2) This is a crude approximation only, as the estimated length of coastline actually protected and the
degree of protection provided by MPRs is difficult to quantify. It is only intended to provide a ball park
estimate of protection cost rates for comparison purposes, and for MPRs is an absolute minimum as it
is based on the absolute maximum salient length between the points where the coastal protection
asymptotes to zero.
(3) This project included design and construction of the submerged breakwaters, but also included
significant beach restoration and nourishment. The project was also undertaken to short timeframes,
during high temperatures, and with long distance freighting of geotextile containers to a remote island.
4.3 Discussion of Existing Submerged Constructed Reef Performance
Of the thirty-two (32) SCR structures reviewed, twenty-nine (29) were intended to provide coastal
protection as a primary or secondary objective. In considering well founded information available in
published literature, approximately half of these structures did not have any significant accretionary
impact on shoreline alignment, at least when compared to the predicted morphological response. A
small number of structures resulted in increased erosion/recession, but these cases were rare and
the design problems easily recognised. A slightly higher percentage of the submerged breakwaters
reviewed were successful in providing coastal protection, though in general the majority of structures
that have been associated with reasonable coastal protection were used in conjunction with other
coastal protection methods such as groynes and/or nourishment. In these cases it is not possible to
determine the extent of protection that can be directly attributed to the submerged breakwaters
alone.
Eight artificial reefs were constructed with the objective of improving surfability and approximately
half of these were considered at least partially successful, although the measure of success in this
case needs to be cautiously balanced between realistic design objectives and stakeholder
expectation. For the cases where ecological monitoring was performed, all the reefs were observed
to promote colonisation by marine algae and aquatic species.

WRL Technical Report 2012/08 Final Report June 2013 70
Figure 4.4: Successful Submerged Breakwater, Pellestrina Island in the Venice Lagoon, Italy
(in conjunction with groynes) (Source www.venicethefuture.com)
Of the five (5) MPRs predicted to provide both improved surfing amenity and coastal protection, only
one appears to have resulted in any significant positive effect on shoreline alignment to date
(Kovalam). This structure has had less than three years of beach monitoring so far, which is
insufficient to enable confident judgement of the long term impact on the shoreline position. An
independent assessment of the morphological response of this reef is currently being undertaken by
the Centre for Earth Science Studies, however, the results of the study were not complete at the
time of this report. Recent unpublished observations indicate that damage to this reef is now
hampering its effectiveness for providing coastal protection (E. Rendle, pers. comm., 2013).
While the Boscombe MPR was also initially reported to provide significant coastal protection
(Mead et al., 2010), further monitoring has shown that there has been no noticeable long-term
impact of the reef on the shoreline (0 m contour) alignment (Rendle and Davidson, 2012). It should
be noted, however, that the majority of accretion predicted to occur from this reef was
predominantly around the -1 m bathymetric contour (K. Black, pers. comm., 2013) which was not
reported by Rendle and Davidson (2012). The localised scour and bathymetric steepening that has
occurred inshore of the reef was well predicted during design (K. Black, pers. comm., 2013). While
the Boscombe reef appears to only provide minor coastal protection, aspects of the observed
morphological response appear to have been predicted by modelling during design. The Borth
project was only completed in 2012 so the performance of this MPR as a coastal protection structure
is not yet known.
The majority of these MPR structures had significant detailed design effort, including numerical and
physical modelling of sediment transport processes, however, most have not provided the degree of
beach widening predicted during the design phase. This has typically been attributed to the
constructed reef differing in profile from the design reef due to difficulties during construction or post
construction damage. Regardless of the reason, this outcome highlights the complexity of designing
and constructing successful MPR structures. The risk of these structures underperforming for coastal
protection compared with design remains reasonably high despite having over a decade of
experience, and this risk should be considered during the planning and feasibility assessment of any
coastal protection project that incorporates the use of an artificial submerged reef.
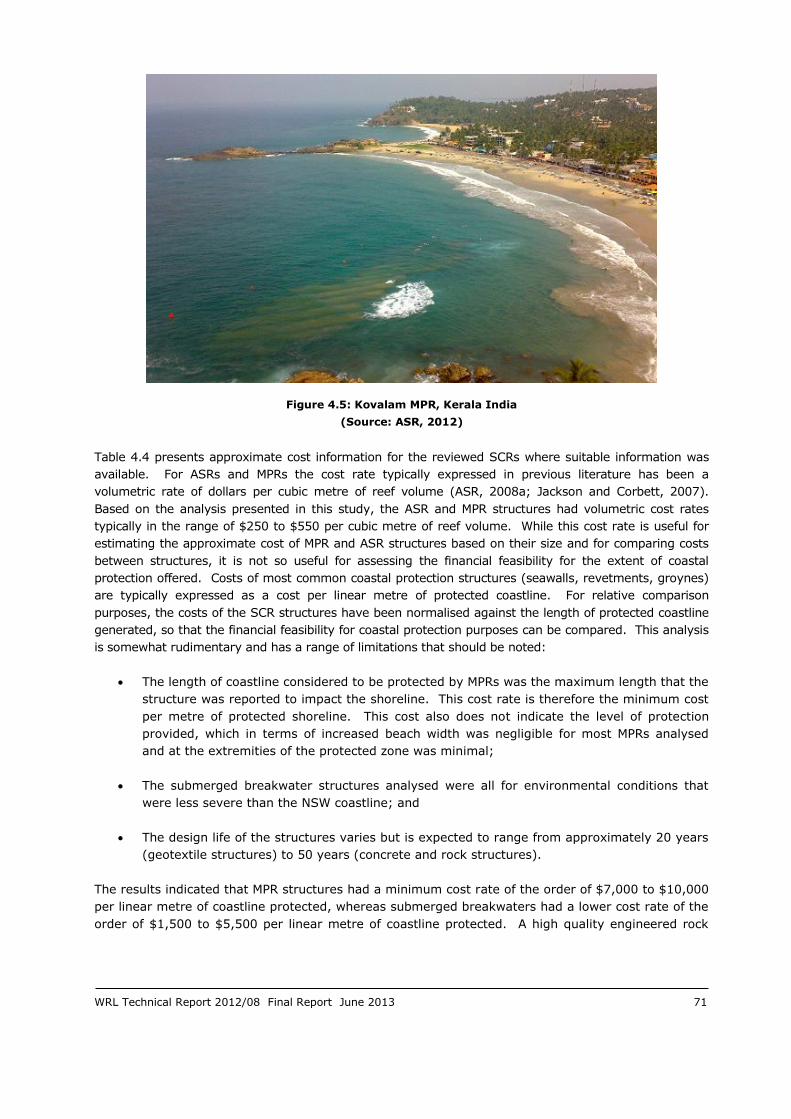
WRL Technical Report 2012/08 Final Report June 2013 71
Figure 4.5: Kovalam MPR, Kerala India
(Source: ASR, 2012)
Table 4.4 presents approximate cost information for the reviewed SCRs where suitable information was
available. For ASRs and MPRs the cost rate typically expressed in previous literature has been a
volumetric rate of dollars per cubic metre of reef volume (ASR, 2008a; Jackson and Corbett, 2007).
Based on the analysis presented in this study, the ASR and MPR structures had volumetric cost rates
typically in the range of $250 to $550 per cubic metre of reef volume. While this cost rate is useful for
estimating the approximate cost of MPR and ASR structures based on their size and for comparing costs
between structures, it is not so useful for assessing the financial feasibility for the extent of coastal
protection offered. Costs of most common coastal protection structures (seawalls, revetments, groynes)
are typically expressed as a cost per linear metre of protected coastline. For relative comparison
purposes, the costs of the SCR structures have been normalised against the length of protected coastline
generated, so that the financial feasibility for coastal protection purposes can be compared. This analysis
is somewhat rudimentary and has a range of limitations that should be noted:
The length of coastline considered to be protected by MPRs was the maximum length that the
structure was reported to impact the shoreline. This cost rate is therefore the minimum cost
per metre of protected shoreline. This cost also does not indicate the level of protection
provided, which in terms of increased beach width was negligible for most MPRs analysed
and at the extremities of the protected zone was minimal;
The submerged breakwater structures analysed were all for environmental conditions that
were less severe than the NSW coastline; and
The design life of the structures varies but is expected to range from approximately 20 years
(geotextile structures) to 50 years (concrete and rock structures).
The results indicated that MPR structures had a minimum cost rate of the order of $7,000 to $10,000
per linear metre of coastline protected, whereas submerged breakwaters had a lower cost rate of the
order of $1,500 to $5,500 per linear metre of coastline protected. A high quality engineered rock

WRL Technical Report 2012/08 Final Report June 2013 72
seawall on the open NSW coast has a cost rate of the order of $5,000 to $10,000 per linear metre
(including reinforced concrete crest footpath/wave return wall, excavated toe, landscaping, etc.),
however, provides a more defined level of erosion protection and hazard reduction, albeit with a
potential reduction in beach amenity.
4.4 Lessons Learnt from Existing Submerged Constructed Reef Projects
Vertical displacement of the structures of the order of 0.5 to 2 m as well as localised bed scouring
was observed for most of the structures considered. This displacement was typically a combination
of settlement into the seabed (particularly for hard/rigid structures), localised scour and large scale
surf zone morphodynamics, as well as stretching/settlement of bag fill material for geotextile tube
structures. Vertical displacement reduces the structure crest levels, which subsequently increases
the wave transmission properties of the structure, reduces the effectiveness of coastal protection and
also alters the expected performance in terms of surfing enhancement. Scour holes were regularly
reported to form at the toe of the structures on their leeward side, at roundheads and in the gaps
between reefs in the case of multi-segments reefs. This is an important consideration during design,
as scouring can have serious implications for structural integrity.
Both the Boscombe and Mount Maunganui MPRs have underperformed from both a surfing amenity
and coastal protection perspective in part, but not exclusively, due to differences between the design
and ‘as constructed’ profiles. Physical problems with reefs that have resulted in loss of reef volume
and profile include (Mead and Borrero, 2011; Rendle and Davidson, 2012):
Ruptured containers during construction;
Sediment inundation during filling;
Unsealed filling ports;
Hydraulic reshaping of fill material by waves;
Damage by vessel impact; and
Potential damage by wave impact.
While geotextile structures are promoted as having the ability to be used as a “trial” that can be
easily removed, such removal comes at considerable expense if not specifically considered during the
design phase. Removal can also provide an environmental risk if the geotextile is torn during the
reef removal process. However, there is little doubt that removal of geotextile structures is easier
than rock structures. Experience gained from the Pratte’s Reef trial ASR is presented in
Leidersdorf et al. (2011). Pratte’s Reef was an experimental geotextile container reef structure built
in 2000 and removed in 2008 after it failed to meet performance criteria. Notable aspects of the
project include:
Construction of the reef cost approximately $550,000 ($250,000 over the initial budget);
Removal of the reef cost approximately $551,000 ($266,000 over the initial budget and the
same cost as the reef construction); and
Some forty (40) geotextile containers were also never recovered from the reef (through loss
or tearing of the geotextile), posing potential environmental hazards.

WRL Technical Report 2012/08 Final Report June 2013 73
4.5 Summary Box: Analysis of Existing SCR Structures
Based on the worldwide review of existing reef structures, the following key conclusions can be
drawn:
Of the thirty-two (32) SCR structures reviewed, twenty-nine (29) were intended to provide
coastal protection as a primary or secondary objective;
Approximately half of the “protection” structures had no significant accretionary impact on
shoreline alignment compared to the predicted morphological response;
55% of submerged breakwaters were successful at providing increased coastal protection,
though not all to the degree initially predicted;
One of five MPR structures may be providing a reasonable level of coastal protection but this
structure has only been monitored for two to three years. Three other MPRs provide only
minor or negligible coastal protection compared to design, and the performance of the
newest MPR (Borth) is yet to be determined.
Eight artificial reefs were constructed with the objective of improving surfability and
approximately half of these were considered at least partially successful;
The resulting shoreline morphology often differed significantly from the design predictions,
even when the best available design methods were applied;
Most structures settled and/or suffered from localised scour which subsequently led to further
maintenance and top up costs;
Approximate construction costs per linear metre of coastline protected were in the order of
$1,500 to $5,500 for submerged breakwater structures and $7,000 to $10,000 for MPR
structures, compared with $5,000 to $10,000 for a high quality engineered rock seawall on
the open NSW coast. The relatively high wave climate of the NSW coast is likely to further
increase the construction costs of the offshore structures relative to the precedent structures
located in milder wave climates.

WRL Technical Report 2012/08 Final Report June 2013 74
5. SCRs and Coastal Protection in NSW
5.1 Overview of Submerged Constructed Reefs and their Application in NSW
The NSW coastline is managed through an established framework that consists of the Coastal
Protection Act (1979), the NSW Coastal Policy (1997), and the Coastal Protection Regulation (2011).
This framework requires development of Coastal Zone Management Plans (CZMPs) by Councils,
which are established on the basis of Coastal Processes and Hazard Definition Studies, as well as
Coastline Management Studies. The procedure for developing CZMPs and assessing coastline
hazards in NSW is outlined in the document “Guidelines for Preparing Coastal Zone Management
Plans” (DECCW, 2010) and accompanying technical guide notes (yet to be released at the time of
writing). These documents when finalised will supersede the Coastline Management Manual (NSW
Government, 1990). DECCW (2010) identifies a range of processes and hazards that could
potentially be managed through protective works such as submerged constructed reefs, namely:
Beach erosion;
Shoreline recession; and
Wave impacts (typically through reduction in runup and overtopping processes).
It is within these Coastal Hazard Definition and Coastal Management studies that vulnerable sections
of the coast are identified and potential management options, such as submerged constructed reefs
are canvassed.
Interest in SCRs and in particular MPRs has increased in recent years in terms of their desirability as
a coastal protection option in some NSW coastal communities. This has also been seen in other
states of Australia and around the world and is predominantly attributed to the perceived benefits of
reefs outweighing the negative impacts when compared to other hard coastal protection alternatives,
as well as active promotion of reef structures by designers and developers. In particular, the idea of
low visual intrusion and the possibility of achieving multiple objectives with a single structure has
made reefs popular with some community groups, though reefs are still frequently objected to on the
grounds of “interfering with nature”. Previous experience has shown that these structures have
higher uncertainty than other coastal protection options in terms of their level of success. Principle 4
of the Coastal Policy (precautionary principle) requires a risk averse approach to coastal
management decision making. In this context, the use of artificial reefs as a coastal protection
option requires careful consideration.
5.2 Using Reefs for Coastal Protection Specifically in NSW
Yoshioka et al. (1993) presented a range of situations where reefs can be used to manage sediment
transport processes, and when applied in the NSW context these include:
Altering the planform of the central section of a beach that is controlled at each end by
headlands. In particular if a beach has a deeply embayed or log-spiral planform that is
pinned by end headlands, then it may be possible to locally advance a shoreline using a
submerged detached structure;
On sections of coast where littoral drift is prevalent and an imbalance is resulting in shoreline
recession, a series of reefs can be used to locally reduce the littoral drift rate and
subsequently build a wider beach. This may be particularly relevant for North-Coast NSW
beaches that tend to have higher net littoral drift rates;

WRL Technical Report 2012/08 Final Report June 2013 75
In situations where a small group of properties are founded within a hazard zone (wave
impact zone or zone of reduced foundation capacity), a reef or group of reefs may be applied
to locally reduce the storm demand; and
For sections of beach that are nourished, reefs may be able to provide a more stable
nourished profile and reduce the volume of sand required to form a stable sub-aerial profile
between the shoreline and the active profile closure.
The NSW coastline has a diverse range of environmental conditions, which range from open coast
exposure to very large storm wave conditions, through to protected embayments where sediment
transport processes are dominated by locally generated wind seas. As shown in Table 4.3, artificial
reefs have been applied in various locations around the world that span the range of coastal
environmental conditions present in NSW. While artificial reefs have had limited success as a coastal
protection option to date and there are many technical obstacle to overcome, there is no reason why
they could not be successfully applied in NSW. The difficulty arises when secondary objectives are
required to be considered in the design of a structure. In NSW the use of MPRs that combine surfing
and protection objectives will be limited in success (as it has been elsewhere) by a number of
reasons including:
Most sections of the NSW coast are relatively rich in natural surf breaks, so it will be difficult
for MPRs to meet community expectations if a high quality surf break is the primary design
objective;
To accommodate surfing as a design objective the cross-shore dimension of a MPR has to be
large enough to allow proper wave conditioning (Shand, 2011). This makes the structures
relatively inefficient at protecting long stretches of coast, unless used in series (which may be
expensive compared with other protection options); and
Safety concerns for the various reef users results in reef designs that are not optimum for
coastal protection (Jackson et al., 2002).
These limitations are overcome by use of SCRs with only a coastal protection objective, such that the cross sectional profile of a reef can be optimised for coastal protection, allowing longer stretches of coast to be protected with higher efficiency. As with the approximately seventy (70) coastal breakwaters/training walls in NSW and several groynes in Queensland, the perturbation in bathymetry due to such structures may result in an enhanced surf break, although this may not have been a design objective.

WRL Technical Report 2012/08 Final Report June 2013 76
5.3 Guidelines for Assessing the Feasibility of Reefs for Coastal Protection in
NSW
The assessment of the feasibility of SCRs in NSW needs to be undertaken on a case-by-case basis
within the NSW coastal management framework. In the majority of cases it is expected that the
reefs will be targeted at reducing a hazard previously identified within a Hazard Definition Study and
that the reef will be one of several options considered in a CZMP. Under the State Environment
Planning Policy (Infrastructure), coastal protection structures such as SCRs are assessed by the NSW
Coastal Panel in cases where a CZMP does not exist or does not cover the area where the protection
works are proposed.
Installation of large scale coastal protection structures in NSW (such as SCRs) is typically a long
duration process that has numerous stages including (but not limited to):
Initial definition of hazards;
Scoping of possible hazard management options including stakeholder considerations;
Assessing the feasibility of selected management options and selecting the most appropriate
option;
Conceptual design of coastal protection option;
Analysis of environmental effects;
Detailed design of coastal protection option;
Construction of coastal protection option; and
Monitoring of beach/structure response and performance.
The outcomes of the feasibility assessment stage for coastal protection structures is typically a
critical juncture point in the future management of a coastal site, as it identifies the optimum
solution to a coastal management problem and sets the future direction that the coastal protection
will take. It is therefore important that a feasibility assessment give consideration to several key
points:
The existing hazards need to be well defined and coastal processes well understood before
the feasibility of structural options for coastal protection can be assessed;
A full range of alternative solutions should be considered at the feasibility stage rather than a
single option;
The reduction in hazard that can be achieved by a reef needs to be predicted through
technical assessments and quantified in terms of present and future hazard/risk reduction;
The predicted reduction in hazard should be considered in terms of its environmental,
financial, and social objectives; and
A benefit/cost analysis should be undertaken that recognises the uncertainty and risk
associated with the provision of protection.
The feasibility assessment of a reef should also take into consideration the impacts of ongoing sea
level rise on the reef performance, and the costs required to top up the structure in order to maintain
effective coastal protection into the future. Rising sea levels will reduce the effectiveness of reef
structures through increased levels of wave transmission (and therefore reduced salient build up), as
well as recession of the surrounding shoreline (effectively increasing the offshore distance of reefs).

WRL Technical Report 2012/08 Final Report June 2013 77
5.4 Social Considerations for Reefs in NSW
Community involvement has long been an important aspect in the development of coastal protection
structures in NSW, for example, intense opposition to the proposed Narrabeen/Collaroy seawall in
2002. Jackson et al. (2002) examined the social aspects associated with creating structures that
combine coastal protection and water sports amenity and identified two key social aspects with
respect to MPRs:
1. Involvement of the community as a stakeholder in establishing design criteria/conditions;
and
2. Safety of public users of the structures.
Public consultation during the design phase of reef projects is required to clearly identify community
requirements and expectations. Furthermore, contribution from the community as a key stakeholder
is required for the following aspects of reef design (Jackson et al., 2002):
The types of activities that stakeholders feel should be supported and enhanced by the
structure;
The types of activities that would be beneficial to the greater community;
Site selection and the implications of modifying existing conditions at a site;
Types of structure that are acceptable;
Level of coastal hazard reduction that is desired; and
Funding arrangements.
While the surfing amenity of most artificial reefs constructed to date has been largely considered by
community groups to have not met expectations (Shand, 2011), this has often been due to
over-inflated community expectations. Community involvement at the project design phase is
imperative for MPR structures to ensure that community groups have realistic expectations.
The safety aspects of MPR structures requires careful consideration during the design process and
becomes a major concern for reef designers in situations where the reef is expected to be heavily
utilised by a wide range of users (Jackson et al., 2002). Despite a reef being designed to improve
amenity for a particular water sport (typically surfing or diving), it will inevitably be used by a
significantly broader group of people. The impact of a number of MPR design parameters on user
safety was examined by Corbett et al, (2005), who also presented information to guide a risk
assessment process for reef user safety. In particular, key risks for reef users were identified as:
Impact with reef when coming off water craft;
Impact with reef due to turbulent wave action in shallow water;
Becoming trapped underwater due to gaps in structure;
Drowning due to rips and unnatural currents;
Dangerous marine organisms; and
Conflicts between users.
Figure 5.1 presents an image of the Narrowneck MPR “sucking dry” during a wave trough to fully
expose the geotextile container surface. To reduce this risk to a manageable level, the design of the
Narrowneck MPR was altered by constructing the reef to a lower structure crest level. This was
achieved by not topping up the crest to the original design level when it had settled. While a certain
level of user risk is clearly still present, this design modification is one reason thought to have
resulted in the structure underperforming for coastal protection compared to design.

WRL Technical Report 2012/08 Final Report June 2013 78
Figure 5.1: Narrowneck Reef "Sucking Dry" During a Wave Trough
(Source: International Coastal Management)

WRL Technical Report 2012/08 Final Report June 2013 79
5.5 Summary Box: Recommendations for Assessment and Use of Reefs in NSW
In recent years SCRs and in particular MPRs have been proffered as a coastal protection option for
some NSW communities, due to the perception of the benefits outweighing the limitations. Within
the NSW coastal management framework, SCRs can be used to manage a range of coastal hazards
including:
Beach erosion;
Shoreline recession;
Wave impacts (typically through reduction in runup and overtopping processes).
In NSW the use of MPRs that combine surfing and protection objectives will be limited in success by a
number of factors including:
NSW has a tidal range of approximately 1.5 m and a multi-directional wave climate with a
wide wave height and period distribution. To accommodate surfing as a design objective the
cross-shore dimension of a MPR has to be large enough to allow proper wave pre-
conditioning under a range of wave and tidal conditions. This makes the structures relatively
cost-inefficient at protecting long stretches of coast, unless used in series (which is expensive
compared to other protection options);
Most sections of the NSW coast are relatively rich in high quality natural surf breaks,
resulting in high community expectations if surfing is a primary design objective;
Safety concerns for the various reef users results in reef designs that are not optimum for
coastal protection.
These limitations are overcome by use of SCRs that have a single objective to provide coastal protection. This allows the cross sectional profile of a reef to be optimised for protection, allowing longer stretches of coast to be sheltered with higher efficiency. Such perturbations may still result in the formation of surf breaks.
It is important that a feasibility assessment of SCR structures give consideration to several key
points:
The existing hazards need to be well defined and coastal processes well understood before a
reef can be assessed for feasibility, if coastal protection is an objective;
A range of alternative solutions should be considered at the feasibility stage to allow selection
of the best option to achieve the management objectives;
The reduction in hazard that can be achieved by the reef needs to be predicted through
technical assessments and quantified in terms of present and future hazard/risk reduction;
The predicted reduction in hazard should be considered in terms of its environmental,
financial, and social objectives;
A benefit/cost analysis should be undertaken that recognises the uncertainty and risk
associated with the provision of protection.

WRL Technical Report 2012/08 Final Report June 2013 80
6. Risk and Recovery from Failure
On a relatively simple, straight coastline, it is likely that a sufficiently elevated (emergent) offshore
breakwater designed in accordance with published methods would form a locally widened beach
(salient), provided there is sufficient available sand. The uncertainty in beach response increases as
the crest elevation is lowered and the structure becomes submerged. Despite significant
improvements in knowledge over the last decade, this still appears to stem from the present lack of
understanding of the complex processes governing morphological response to reef structures in a
variable natural environment. Furthermore, conditions in the lee of a submerged structure are
subject to larger and more rapid temporal change due to changes in tides and waves compared to
emergent structures, primarily as a result of the higher amount of transmitted wave energy. As a
result there is inherently a larger uncertainty associated with reef structures and this uncertainty
needs to be considered in the design and feasibility assessments, as reefs present a significantly
higher risk alternative in comparison with other forms of coastal protection.
Regardless of this higher level of risk, the potential benefits of SCR structures mean that they should
still be considered as a potential form of hard coastal protection, so long as the design and
expectations take into consideration the lower level of reliability in prediction of the morphological
response. Ongoing construction and monitoring of SCRs will result in a better understanding of the
processes and refined methods for predicting shoreline response. In order to reduce the risk of poor
performance, alternative strategies for reef implementation should be considered, including:
Modelling reefs and shoreline response with methods and tools that have been demonstrated
to work reliably for existing similar installations;
Developing designs and construction methods that can be adapted to improve performance;
Installation and monitoring of trial structures in order to calibrate/improve modelling and
reduce uncertainty in beach response prediction;
Keeping design objectives simple, focussed, and clearly understood by stakeholders; and
Ensuring budget is available to modify or remove trial structures if required.
While design methods do not appear to have evolved to a degree that the morphological response to
a reef can be accurately predicted, it is generally accepted that by following basic empirical guidance,
a reef is unlikely to result in adverse shoreline impacts (such as increased erosion). Design problems
have been clearly identified in the small number of previously installed submerged breakwater
structures that resulted in erosion and this experience has led to improved empirical prediction
methods. By using methods such as Ranasinghe et al. (2006) and Ranasinghe et al. (2010) during
preliminary design, a reef should theoretically be able to be positioned so that it either creates
accretion or has no impact on the shoreline alignment (i.e. does not create erosion). On this basis, it
is unlikely that a reef would ever need to be completely removed, but more likely that it needed to
be modified to alter performance. Nevertheless, careful consideration should be given during the
project design stage, to the cost of modifying or removing reefs that have already been built. As
discussed in Section 4.4, Leidersdorf et al. (2011) present a range of useful experiences regarding
the removal of the Prattes Reef (geotextile bag) in California.
WRL Technical Report 2012/08 Final Report June 2013 81
7. Conclusions
7.1 Overview
This report has presented a comprehensive review of the use of submerged constructed reefs for
coastal protection in NSW. While the review has primarily focused on the use of SCRs for providing
coastal protection, and in particular the applicability of SCRs for the NSW coast, a broader range of
aspects have also been considered. The study was based on an extensive review of international
literature that considered in excess of one hundred and fifty (150) references.
7.2 Design and Analysis Methods
The stability of rock armouring on submerged breakwaters has been studied in numerous detailed
investigations and reasonable empirical design guidance is available. In contrast, the understanding
of the behaviour of large sand filled geotextile containers under wave attack is not yet well
developed. A small number of studies looking at the stability of geotextile containers and tubes have
been undertaken with varying approaches and results. However, there is no single publication
presenting stability design curves or equations for geotextile tube submerged reef structures. While
it is generally stated that the geotextile mega containers used in reef construction are so large that
they are inherently stable, experience from existing reefs has shown that the tubes are able to be
dislodged, re-worked and damaged by wave attack. The stability of these containers requires further
consideration in the future.
While there has been considerable improvement in the understanding of the mechanisms driving
shoreline response to submerged reef/breakwater structures over the past decade, all completed
studies have significant limitations. No single study has comprehensively tested the effects of
primary structural and environmental variables on quantitative shoreline response and the shoreline
response equations presented are based on either approximate field measurements of a limited
number of parameters, or un-calibrated and un-validated modelling. This suggests that the available
empirical techniques for assessing shoreline response are suitable only for preliminary engineering
calculation and not detailed design. Structures that are designed using these methods should be
considered as trial or experimental only, as it has been shown from previous real world experience
that the available equations do not predict beach response with accuracy or reliability. This results in
designs that inherently contain higher uncertainty than many other beach control structures.
Numerical models are well suited to assessing wave, hydrodynamic, and morphological aspects of
reef structures, with the degree of certainty in model predictions proportional to the level of model
calibration. Physical models should also be used for assessing reef armour stability, wave and
hydrodynamic processes, and can also be applied to gain valuable qualitative and semi-quantitative
insight into morphological response, but scaling limitations mean that they do not provide a complete
answer. It is recommended that detailed design of any SCR structure adopt a hybrid modelling
approach, whereby the individual strengths of both numerical and physical models are utilised to
arrive at the final reef design. Furthermore, it is recommended that modelling of any structure with
environmental, social, or economic significance be underpinned by site specific data collection
programs for wave transformation, water levels, and sediment transport.

WRL Technical Report 2012/08 Final Report June 2013 82
7.3 Existing Reef Projects:
Based on the worldwide review of existing reef structures, the following key conclusions can be
drawn:
Of the thirty-two (32) SCR structures reviewed, twenty-nine (29) were intended to provide
coastal protection as a primary or secondary objective;
Approximately half of the “protection” structures had no significant accretionary impact on
shoreline alignment compared to the predicted morphological response;
55% of submerged breakwaters were successful at providing increased coastal protection,
though not all to the degree initially predicted;
One of five MPR structures may be providing a reasonable level of coastal protection but this
structure has only been monitored for two to three years. Three other MPRs provide only
minor or negligible coastal protection compared to design, and the performance of the
newest MPR (Borth) is yet to be determined;
Eight artificial reefs were constructed with the objective of improving surfability and
approximately half of these were considered at least partially successful;
The resulting shoreline morphology behind reef structures often differed significantly from
the design predictions, even when the best available design methods were applied; and
Most structures settled and/or suffered from localised scour which resulted in an actual crest
level which differed from that specified by design and subsequently led to further
maintenance and top up costs.
7.4 Future Applications of Submerged Constructed Reefs
On a relatively simple, straight coastline, it is likely that an emergent offshore breakwater designed
in accordance with published methods would form a locally widened beach, provided there is
sufficient available sand. The uncertainty in beach response increases and the effectiveness for
coastal protection decreases for submerged structures. The present lack of understanding of the
morphological response to reef structures in a naturally variable environment results in higher
uncertainty in terms of coastal protection, and this uncertainty needs to be considered in any
feasibility analysis, as it presents a significantly higher risk in comparison with other forms of coastal
protection.
Consideration of SCRs built to date shows a relatively large number of failures, even for cases where
significant effort was put into very technical designs. This cannot be ignored when considering the
current ability to be able to successfully predict the processes surrounding a SCR with required
accuracy. Furthermore, many failures have been as a result of structural problems due to
complexities of building a structure in an active surf zone on loose unconsolidated materials. These
conclusions confirm that considerable improvements are still needed in the design and construction
of submerged reef structures.
Regardless of these current limitations, the benefits of SCRs mean that they should continue to be
considered as an option for hard coastal protection, so long as the design and expectations take into

WRL Technical Report 2012/08 Final Report June 2013 83
consideration the lower level of certainty in performance. Future construction and monitoring of
SCRs will result in an improved understanding of the processes and refined methods for predicting
shoreline response to these structures. Throughout this period of ongoing improvement,
consideration should be given to trial and experimental structures to reduce uncertainty and to
create structures which meet the desired objectives.
Even when the morphological response to submerged structures can be predicted with improved
accuracy, the coastal protection provided will not be as effective as a well-designed emergent
structure. The difficulty in attempting to meet multiple objectives is that the success in meeting one
objective may be diluted by the attempts to meet the others. While some community groups may
continue to favour multi-purpose structures due to their perceived benefits, there is little doubt that
focussing the objective of coastal protection structures on coastal protection rather than multiple
objectives will achieve improved results with more reliability and increased efficacy.
WRL Technical Report 2012/08 Final Report June 2013 84
8. References
Abbot, M.B., and Price, W.A. (1994) Coastal, Estuarial, and Harbour Engineers Reference Book, E&FN
Spon, London
Abecasis, D. (1964) “The Structural Behaviour and the Sheltering Efficiency of the Submerged
Breakwater at the Entrance to the Port of Leixões, Maintenance Charges and Effects”, in Proceedings
of the 9th International Conference on Coastal Engineering
Ahrens, J.P. (1987) “Reef Breakwater Response to Wave Attack”, Conference on Berm Breakwaters,
ASCE, Ottawa
Ahrens, J.P. and Cox, J. (1990) “Design and Performance of Reef Breakwaters”, Journal of Coastal
Research
Alvarez, E. and Espinosa, B. (2008) “The Role of Geotextile Tubes in Coastal Protection and Beach
Restoration. The experience in Yucatan, Mexico”, The First Pan American Geosynthetics Conference
& Exhibition, Cancun, Mexico
Alvarez, E., Rubio, R. and Ricalde, H. (2006) “Shoreline Restored with Geotextile Tubes as
Submerged Breakwaters”, Geosynthetics, 24, 20-27
Andrews, C.J. (1997) Sandy Shoreline Response to Submerged and Emerged Breakwaters, Reefs or
Islands, University of Waikato
ASR (2008a) A Review of Existing Multi-Purpose Artificial Surfing Reefs and the Physical Properties
Behind their Function
ASR (2008b) Conceptual Design Structure of a Multi-Purpose Artificial Surfing Reef for Brevard
County using Geotextile Sand Filled Containers
Bancroft, S. (1999) Performance Monitoring of the Cable Station Artificial Surfing Reef, University of
Western Australia
Battjes, J.A. (1974) “Surf Similarity”, Proceedings 14th Coastal Engineering Conference, Copenhagen,
Vol 1, pp 466-480
Bijker, E.W. (1967) “Some Considerations about Scales for Coastal Models with Moveable Bed”,
Publication No. 50, Delft Hydraulics Laboratory, The Netherlands
Black, K. P. (1999) “Designing the Shape of the Gold Coast Reef: Sediment Dynamics”, Proceedings
of the Australasian Coasts and Ports Conference, Institute of Engineers Australia, Perth, pp.58–63
Black, K.P. and Andrews, C.J. (2001) “Sandy Shoreline Response to Offshore Obstacles, Part 1:
Salient and Tombolo Geometry and Shape; Part 2: Discussion of Formative Mechanisms”, Journal of
Coastal Research
Black, K. and Mead, S. (2007) “Sand Bank Responses to a Multi-Purpose Reef on an Exposed Sandy
Coast”, Shore and Beach, Volume 75, No. 4, pp 55-66

WRL Technical Report 2012/08 Final Report June 2013 85
Black, K. and Mead, S. (2009) “Design of Surfing Reefs”, Reef Journal, Vol 1, pp 177-191
Black, K., Andrews, C., Green, M.O., Gorman, R.G., Healy, T.R., Hume, T.M., Hutt, J., Mead, S. and
Sayce, A. (1997) “Wave Dynamics and Shoreline Response on and around Surfing Reefs”, 1st
International Surfing Reef Symposium, Sydney, pp. 1-10
Blacka, M.J., Carley, J.T., Cox, R.J. and Miller, B.M. (2006) “The Current use of Physical and
Numerical Models for Coastal Applications”, NSW Coastal Conference, Coffs Harbour
Blacka, M.J., Anderson, D.J. and Mallen Lopez, L. (2008) Analysis of Shoreline Variability,
Seasonality, and Erosion/Accretion Trends: February – July 2008, WRL Technical Report 2008/27,
Manly Vale
Blacka, M.J., Mallen Lopez, L. and Carley, J.T. (2009) Three Dimensional Physical Modelling of
Geocontainer Breakwaters at (Location Confidential), WRL Technical Report, Manly Vale
Blain Bremner & Williams Pty Ltd (1985) Elevated Ocean Levels – Storms Affecting NSW Coast 1880
– 1980, Blain Bremner & Williams Report No 8504, NSW Public Works Department, Coastal Branch
Bleck, M. (2006) “Wave Attenuation by Artificial Reefs”, On Course, PIANC
Borrero, J.C. and Nelsen, C. (2003) “Results of a Comprehensive Monitoring Program at Pratte’s
Reef”, 3rd International Surfing Reef Symposium
Borrero, J.C., Mead, S.T. and Moores, A. (2010) “Stability Considerations and Case Studies for
Submerged Structures Constructed from Large Sand Filled Geotextile Containers”, Coastal
Engineering
Browder, A.E., Dean, R.G. and Chen, R. (2000) “Performance of a Submerged Breakwater for Shore
Protection”, International Conference on Coastal Engineering
Bruun, P (1962) “Sea-level Rise as a Cause of Shore Erosion” Journal of Waterways and Harbours
Division, 88:117-130
Bruun, P (1988), “The Bruun Rule of Erosion by Sea Level Rise: A Discussion on Large-scale Two- and Three-Dimensional Usages”, Journal of Coastal Research, 4, 627–648
Buccino, M. and Calabrese, M. (2007) “Conceptual Approach for Prediction of Wave Transmission at
Low-Crested Breakwaters”, Journal of Waterway, Port, Coastal, and Ocean Engineering, pp 213-224
Burcharth, H.F., Kramer, M., Lambert, A. and Zanuttigh, B. (2006) “Structural Stability of Detached
Low Crested Breakwaters”, Coastal Engineering 53, 381-394
Burcharth, H.F., Hawkins, S.J., Zanittigh, B. and Lamberti, A. (2007) Environmental Design
Guidelines for Low-Crested Structures, Elsevier
Button, M. (1991) Design Studies for an Artificial Surfing Reef, Unpublished Honours Thesis,
Department of Civil Engineering, University of Western Australia

WRL Technical Report 2012/08 Final Report June 2013 86
Callaghan, J. and Helman, P. (2008) Severe Storms On The East Coast Of Australia 1770–2008,
Griffith Centre for Coastal Management, Gold Coast, Australia
CIRIA (2007) The Rock Manual – The Use of Rock in Hydraulic Engineering, Report C683, London
CIRIA (2008) Multi-Functional Artificial Reefs: Scoping Study, Report C673, London
Curtis, W.R., Pope, J. and Turk, G. (2000) “National Shoreline Erosion Control Demonstration
Program Overview”, National Beach Preservation Conference, Kaanapali, Maui, Hawaii
Corbett, B., Jackson, L.A., Evans, T., and Restall, S. (2010) “Comparison of Geosynthetic Materials
as Substrates on Coastal Structures – Gold Coast (Australia) and Arabian Gulf”, Proceedings of the
International Conference on Coastal Engineering, China
d’Angremond, K., Van der Meer, J.W. and Jong, R.J.D. (1996) “Wave Transmission at Low Crested
Structures”, 25th International Conference on Coastal Engineering, Orlando, Florida
Dally, W.R. (1989) “Quantifying Beach Surfability”, Proceedings Beach Technology Conference,
Tampa, Florida
Dally W.R. and Pope J. (1986) Detached Breakwaters for Shoreline Protection, Technical Report CERC-86-1, Coastal Engineering Research Center (CERC), Waterways Experiment Station for Department of the Army, Corps of Engineers, Vicksburg, USA
De Groot, M.B. and Breteler, M.K. (2004) “Feasibility of Geocontainers at the Sea Shore”, Coastal
Engineering
Dean, R.G. (1985) “Physical Modelling of Littoral Processes”, In Dalrymple, R.A. (Ed.) Physical
Modelling in Coastal Engineering, Balkema, 119-139
Deguchi, I. and Sawaragi, T. (1986) “Beach Fill at Two Coasts of Different Configurations”, Coastal
Engineering, 1032-1046
DECCW (2010) Guidelines for Preparing Coastal Zone Management Plans, Department of
Environment, Climate Change, and Water NSW, Sydney
Dick, T.M. and Brebner, A. (1968) Solid and Permeable Submerged Breakwaters
Evans, P. And Ranasinghe, R. (2001) “Artificial Surfing Reefs: A New Paradigm in Coastal Protection”,
Australasian Coasts and Ports Conference
Frostick, L.E., McLelland, S.J., and Mercer, T.G. eds, (2011) Users Guide to Physical Modelling and
Experimentation: Experience of the HYDRALAB Network, CRC Press, The Netherlands
Galvin, C.J. (1968) “Breaker Type Classification on Three Laboratory Beaches”, Journal of
Geophysical Research, 73, pp 3651-3659
Geofabrics (2013) “Elcorock Out Muscles a Category 5 Cyclone”, Geofabrics Journal, August 2012
Grigg, R. (1969) “Artificial Reefs, a Plan for Multiple Use”, Surfer Magazine
WRL Technical Report 2012/08 Final Report June 2013 87
Hanson, H. and Kraus, N.C. (1989) GENESIS – Generalised Model for Simulating Shoreline Change,
Volume 1: Reference Manual and Users Guide, Technical Report CERC-89-19, US Army Engineer
Waterways Experiment Station, Vicksburg, MS
Hanson, H. and Krausn N.C. (1990) “Shoreline Response to a Single Transmissive Detached
Breakwater”, Coastal Engineering, ASCE, pp2034-2046
Hanson, H. and Kraus, N.C. (1991) “Comparison of Shoreline Change Obtained With Physical and
Numerical Models”, Coastal Sediments
Hirose, N., Watanuki, A., and Saito, M. (2002) “New Type Units for Artificial Reef Development of
Eco-Friendly Artificial Reefs and the Effectiveness”. PIANC 2002 International Navigation Congress
Hudson, R.Y. (1953) “Wave Forces on Breakwaters”, Transactions of the American Society of Civil
Engineers, ASCE Vol 118, p 653
Hudson, R. and Cox, R.J. (2001) “Stability of Sand-Filled Geocontainers in the Construction of
Artificial Reefs”, Proceedings of the Australasian Coasts and Ports Conference, pp 61 – 66
Hughes, S. (1993) Physical Models and Laboratory Techniques in Coastal Engineering, World
Scientific
In Oh, Y. and Chui Shin, E. (2006) “Using Submerged Geotextile Tubes in the Protection
of the East Korean Shore”, Coastal Engineering, 53, 879–895
Iribarren, R (1938) Una formula para el calculo de diques de escollera, Ed. Bermejilla y H Pasajes,
(In Spanish)
Iribarren, R (1949) “A Formula for the Calculation of Rock Fill Dikes”, Translation in The Bulletin of
the (USA) Beach Erosion Board, Vol 3, No 1
Jackson, L.A., Tomlinson, R.B. and D'Agata, M. (2002) “The Challenge of Combining Coastal
Protection and Improved Surfing Amenity”, Proceedings of Littoral, Eurocoast, Portugal
Jackson, L.A. and Corbett, B.B. (2007) “Review of Existing Multi-Functional Artificial Reefs”,
Australasian Coasts and Ports Conference
Jackson, L.A., Corbett, B.B., McGrath, J.E., Tomlinson, R.B. and Stuart, G. (2007) “Narrowneck Reef:
Review of Seven Years of Monitoring”, Shore & Beach
Jackson, L.A. (2010) “Design and Construction of Low Crested Reef Breakwaters using Sand Filled
Geotextile Containers”, IAHR Workshop: Geosynthetics and Modern Materials in Coastal Protection
and Related Applications
Johnson, J.W., Fuchs, R.A. and Morison, J.R. (1951) The Damping Action of Submerged Breakwaters,
University of California, Institute of Engineering Research, Fluid Mechanics Laboratory
Kamphuis, J.W. (1975) “Coastal Mobile Bed Model - Does it Work?”, Proceedings 2nd Symposium on
Modelling Techniques, A.S.C.E., Vol. 2, 993-1009

WRL Technical Report 2012/08 Final Report June 2013 88
Kamphuis, J.W. (2000) “Designing with Models”, Proceedings 27th International Conference on
Coastal Engineering, A.S.C.E, Sydney
Kramer, M. and Burcharth, H. (2003) D31 - Wave Basin Experiment Final Form
Kramer, M. and Burcharth, H. (2003) “Stability of Low-Crested Breakwaters in Shallow Water Short
Crested Waves”, Coastal Structures
Lamberti, A. and Mancinelli, A. (1996) “Italian Experience on Submerged Breakwaters as Beach
Defence Structures”, 25th International Conference on Coastal Engineering, Orlando, Florida
Lamberti, A., Archetti, R., Kramer, M., Paphitis, D., Mosso, C. and Risio, M.D. (2005) “European
Experience of Low Crested Structures for Coastal Management”, Coastal Engineering, 52, 841-866
Leidersdorf, C.B., Richmond, B. and Nelsen, C.E. (2011) “The Life and Death of North America’s First
Man-Made Surfing Reef”, Coastal Engineering Practice
Lukens, R.R. and Selberg, C. (2004) Guidelines for Marine Artificial Reef Materials
Lyons, M. (1992) Design Studies for an Artificial Surfing Reef, Unpublished Report, Department of
Environmental Engineering, University of Western Australia
Martin, T.R. and Smith, J.B. (1997) Analysis of the Performance of the Prefabricated Erosion
Protection (PEP) Reef System Town of Palm Beach, Florida, Coastal Engineering Technical Note II-36,
Coastal Engineering Research Centre, US Army Engineers Waterways Experiment Station
McGrath, J., Boak, L. and Jackson, A. (1999) “Infrastructure to Enhance the Natural Capacity of the
Environment to Support a Tourist Economy – A Coastal Case Study: The Northern Gold Coast Beach
Protection Strategy”, Proceedings of the Australasian Coasts and Ports Conference
Mead, S. and Black, K. (1999) “A Multi-Purpose Artificial Reef at Mount Maunganui Beach, New
Zealand”, Coastal Management, 27:4, pp 355-365
Mead, S. and Black, K. (2000) “Field Studies Leading to the Bathymetric Classification of World Class
Surfing Breaks”, Journal of Coastal Research, Special Issue 29, pp 5-20
Mead, S. and Black, K. (2001) “Predicting the Breaking Intensity of Surfing Waves”, Journal of
Coastal Research, Special Issue 29, 103-130
Mead, S. and Borrero, J. (2011) “Multi-Purpose Reefs – A Decade of Applications”, Australasian
Coasts and Ports Conference, Perth
Mortensen, S. B. (2010) “Detailed Investigation of Surfing Amenity using CFD”, Proceedings 10th
International Surfing Reef Symposium, Sydney
Nielsen, A.F., Turner, I.L., Miller, B.M., Leyden, V. and Gordon, A.D. (2000) “Experiences with
Physical Scale Basin Modelling using Mobile Sediments”, Coastal Engineering, ASCE
NOAA (2007) “National Artificial Reef Plan: Guidelines for Siting, Construction, Development, and
Assessment of Artificial Reefs”, United States Department of Commerce, N. O. A. A. A. (ed.)
WRL Technical Report 2012/08 Final Report June 2013 89
Noda, E.K. (1972) “Equilibrium Beach Profile Scale Model Relationship”, Journal of Waterways,
Harbours and Coastal Engineering Division, A.S.C.E., Vol 98, No. WW4, NY, 511-528
NSW Government (1990) Coastline Management Manual, Crown Copyright
Pattiaratchi, C. (1999) “Design Studies for an Artificial Surfing Reef: Cable Station, Western
Australia”, Proceedings of the Australasian Coasts and Ports Conference, Engineers Australia
Pattiaratchi, C. (2003) “Performance of an Artificial Surfing Reef: Cable Station, Western Australia”,
COPEDEC VI, Colombo, Sri Lanka
Pilarczyk, K.W. (2003) “Alternative Systems for Coastal Protection - An Overview”, International
Conference on Estuaries and Coasts, Hangzhou, China
Pilarczyk, K.W. (2003) “Design of Low-Crested (Submerged) Structures – An Overview”,
International Conference on Coastal and Port Engineering in Developing Countries
Pilarczyk, K.W. (2005) “Coastal Stabilisation and Alternative Solutions an International Perspective”,
Arabian Coast, Keynote Address, Rykswaterstaat, Hydraulic Engineering Institute
Ranasinghe, R. and Turner, I.L. (2006) “Shoreline Response to Submerged Structures: A Review”,
Coastal Engineering, 53, 65-79
Ranasinghe, R., Hacking, N. and Evans, P. (2001) Multi-Functional Artificial Surf Breaks: A Review,
Centre for Natural Resources, NSW Department of Land and Water Conservation, Parramatta
Ranasinghe, R., Turner, I.L. and Symonds, G. (2006) “Shoreline Response to Multi-Functional
Artificial Surfing Reefs: A Numerical and Physical Modelling Study”, Coastal Engineering, 53, 589-611
Ranasinghe, R., Larson, M. and Savioli, J. (2010) “Shoreline Response to a Single Shore-Parallel
Submerged Breakwater”, Coastal Engineering, 57, 1006-1017
Rendle, E., and Davidson, M. (2012) “An Evaluation of the Physical Impact and Structural Integrity of
a Geotextile Surf Reef”, Proceedings of the International Conference on Coastal Engineering, Spain
Roelvink, J.A. and Renniers, A. (2011) Guide to Modelling Coastal Morphology, World Scientific
Publishing Co., Great Britain
Sager, R.A. and Hales, L.Z. (1979) “VII Inlets”, Coastal Hydraulic Models, C.E.R.C. Special Report
No. 5, US Army Corps of Engineers
Savioli, J., Ranasinghe, R. and Larson, M. (2007) “A Design Criterion to Determine the Mode of
Shoreline Response to Submerged Breakwaters”, Australasian Coasts and Ports Conference
Sayce, A.J. (1997) Transformation of Surfing Waves Over Steep and Complex Reefs, Unpublished
Thesis, University of Waikato. 158 p
Seabrook, S.R. and Hall, K.R. (1998) “Wave Transmission at Submerged Rubble Mound
Breakwaters”, Coastal Engineering

WRL Technical Report 2012/08 Final Report June 2013 90
Shand, T.D. (2011) “Making Waves? A Rational Review of Artificial Surfing Reef Projects”, Shore &
Beach
Shand, T.D, Carley, J.T, Blacka, M.J, and Miller, B.M, (2010) “The Use of Physical and Numerical
Models for Coastal Applications”, New Zealand Coastal Society Conference, Whitianga, NZ
Shand, T.D., Goodwin, I.A., Mole, M.A., Carley, J.T., Browning, S., Coghlan, I.R., Harley, M.D. and
Peirson, W.L. (2011) NSW Coastal Inundation Hazard Study: Coastal Storms and Extreme Waves,
WRL Technical Report 2010/06, Manly Vale
Silvester, R. and Hsu, J.R.C. (1997) Coastal Stabilisation, World Scientific, Singapore
Skelly (2002) Surfrider Foundation El Segundo Surf Enhancement Project, Unpublished Report, Skelly
Engineering, Encinatas, California, USA
Smith, E.R. and Kraus, N.C. (1991) “Laboratory Study of Wave Breaking over Bars and Artificial
Reefs”, Journal of Waterway, Port, Coastal, and Ocean Engineering, 117(4): 307-325
Sordini, P. (2011). Confronto tra l'applicazione della GIZC nella difesa della costa in Italia e in
Spagna: evoluzione morfo-batometrica di un tratto di costa ravennate difeso da reef artificiali.
Universita` degli Studi di Ferrara
SPM (1984), Shore Protection Manual, US Army Coastal Engineering Research Center, Vicksburg,
Mississippi, USA
Stauble, D.K. and Giovannozzi, M.A. (2004) Evaluating a Prefabricated Submerged Breakwater and
Double-T Sill for Beach Erosion Prevention, Cape May Point, NJ, U.S. Army Corps of Engineers
Research and Development Center
Stauble, D.K. and Tabar, J.R. (2003) “The Use of Submerged Narrow-Crested Breakwaters for
Shoreline Erosion Control”, Journal of Coastal Research, 19, 684–722
Stauble, D.K., Wise, R.A. and Smith, B. (2005) Monitoring of Beachsaver Reef with Filter Blanket and
Double-T Sill at Cape May Point, New Jersey, Section 227 Demonstration Site, ERDC/CHL TR-05-4,
USACE (ed.)
The Ecology Lab (2008) “Offshore Artificial Reefs Preliminary Environmental Assessment”, Industries,
N. D. O. P. (ed.)
Thierry, J.M. (1988) “Artificial Reefs in Japan - A General Outline”, Agricultural Engineering, 321-348
Taranake Regional Council (2009) “Opunake Artificial Reef Monitoring Programme, 2005-2009”,
Technical Report 2009-33, Stratford, NZ
Turner, I.L., Leyden, V.M., Cox, R.J., Jackson, L.A. and McGrath, J.E. (2001) “Physical Model Study
of the Gold Coast Artificial Reef”, Journal of Coastal Research, Special Issue No. 29, pp 131-146
Turner, I.L. (2005) “Engineering Assessment of Shoreline Realignment in the Lee of Nearshore
Breakwaters and Reefs”, Australasian Coasts and Ports Conference

WRL Technical Report 2012/08 Final Report June 2013 91
Turner, I.L. and Leyden. V.M. (2000) “System Description and Analysis of Shoreline Change – August
1999 – February 2000”, Report 1, Gold Coast Coastal Imaging System
US Army Corps of Engineers (2006), Coastal Engineering Manual, Engineer Manual 1110-2-1100,
Washington D.C., Volumes 1-6
Van der Meer, J.W. (1988) Rock Slopes and Gravel Beaches Under Wave Attack, Doctoral Thesis,
Delft University of Technology, Also: Delft Hydraulics Communication No 396, the Netherlands
Van der Meer, J.W. (1990) Low-Crested and Reef Breakwaters, Delft Hydraulics Report H986, The
Netherlands
Van der Meer, J.W. and d’Angremond, K. (1991) “Wave Transmission at Low Crested Structures”,
Coastal Structures and Breakwaters, ICE, London, pp 25-42
Van der Meer, J.W. and Daemen, I.F.R. (1994) “Stability and Wave Transmission at Low-Crested
Rubble Mound Structures”, Journal of Waterway, Port, Coastal, and Ocean Engineering, Volume 120,
No. 1, ASCE
Vidal, C., Losada, M.A., Medina, R., Mansard, E.P.D. and Gomez-Pina, G. (1992) “A Universal
Analysis for the Stability of Both Low-Crested and Submerged Breakwaters”, Coastal Engineering
Walker, J.R. and Palmer, R.Q. (1971) A General Surf Site Concept, LOOK Laboratory TR-18,
Department of Ocean Engineering, University of Hawaii, Honolulu, Hawaii
Walker, J.R. (1974) Recreational Surf Parameters, LOOK Laboratory Report TR-30, Department of
Ocean Engineering, University of Hawaii, HI, 245 p
Weppe, S., Healy, T., Scarfe, B. and Immenga, D. (2007) “Shoreline Response to an Offshore
Submerged Multifunction Reef at Mount Maunganui, New Zealand”, Australasian Coasts and Ports
Conference
WorleyParsons (2009) Ex-HMAS Adelaide Artificial Reef: Coastal and Oceanographic Processes,
Report for NSW Land and Property Management Authority
www.borthcommunity.info accessed 4/03/2013
www.reefball.org accessed 4/03/2013
www.tecnoreef.com accessed 4/03/2013
www.venicethefuture.com accessed 4/03/2013
Yoshioka, K., Kawakami, T., Tanaka, S., Koarai, M. and Uda, T. (1993) “Design Manual for Artificial
Reefs”, Coastlines of Japan, ASCE

WRL Technical Report 2012/08 Final June 2013 92
Appendix A: Constructed SCR Projects
A.1 Cable Station ASR, Perth, Western Australia
A.1.1 Project Description
Cable Station ASR is discussed in detail in Bancroft (1999), Pattiaratchi (1999), and Pattiaratchi
(2003), and the information presented in these references has been used to compile this summary.
The project is also summarised in Jackson and Corbett (2007) and Ranasinghe et al. (2001). Though
not designed at all for coastal protection, this SCR has been included in this review as it provides
useful information regarding the use of design tools for assessing wave conditions generated by
SCRs.
The site, south of Cottesloe on the coast of Perth (Figure A.1), was selected for the development of
an ASR for numerous reasons including localised wave climate, bathymetry, foreshore
geomorphology and use, location, and environmental impacts. It was identified during the
investigation of possible locations that the shoreline position at the site was relatively stable due to
the rocky nature of the beach.
The final reef design was V shaped in planform, with a longshore length of approximately 140 m,
cross shore width of 70 m, and crest submergence of 1 - 2.5 m below MSL (Figure A.2). The
structure is located approximately 275 m offshore.
Figure A.1: Location of Cable Station ASR

WRL Technical Report 2012/08 Final June 2013 93
Figure A.2: Cable Station ASR Design (After Lyons, 1992)
A.1.2 Design Investigations
Detailed engineering design was coordinated by the Department of Marine and Harbours (WA).
Numerous design investigations were conducted for the reef which included 2D and 3D physical
modelling of the wave form aspects, as well as several numerical modelling studies of the wave form
and of the likely changes in surfing amenity (as summarised by Ranasinghe et al., 2001).
Environmental investigations were also undertaken which considered the impact of the reef on
existing ecology.
A.1.3 Construction Materials and Methods
The reef was constructed using 5,500 m3 of 1.5 t and 3.0 t grade granite boulders, placed by
excavator from a barge. The reef was constructed using the smaller 1.5 t stones as the body, keyed
in place by a perimeter of the larger 3.0 t stones. No information is available regarding the long
term stability and durability of the reef.
A.1.4 Performance
Post construction monitoring of the reef performance focused on the surfing amenity aspects (this
was the primary objective of the reef and the primary consideration of the design studies).
Monitoring of the reef ecology has also been undertaken. Pattiaratchi (2003) presented the results
of a video monitoring study of the post construction surfing conditions. In this investigation the reef
was classed as having “surfable” conditions if surfers were visibly present in the recorded images
(Ranasinghe et al. 2001). The general result of the investigation concluded that the reef is
performing as well, if not better than, the initial design investigations predicted (with respect to the
number of days of breaking and “surfable” waves). The success of the reef and the generated
surfing conditions have been disputed somewhat by some within the surfing community. Subjective
anecdotal reports from surfers who have regularly surfed the reef is that the wave quality is good
during big swells, but that the wave modelling overestimated the local wave height and that the
number of good surfable days per year is small.

WRL Technical Report 2012/08 Final June 2013 94
A.1.5 Cost
Documented total costs for the reef vary from $1.51 million (Ranasinghe et al., 2001) to $1.8 million
(Jackson and Corbett, 2007). The normalised cost (AUD, 2013) is estimated to be $2.5 million, with
an approximate cost breakdown of:
Feasibility Studies: $0.5 million;
Construction: $2.0 million.
A.2 Narrowneck MPR, Gold Coast, Queensland
A.2.1 Project Description
Narrowneck is the largest SCR project undertaken to date in the world, and is located at the Gold
Coast in Southern Queensland (Figure A.3). The stretch of coast at the reef location is relatively long
and straight, and prior to reef construction and nourishment, has suffered ongoing recession
combined with intermittent storm erosion. The beach at the site has a net littoral drift of
approximately 500,000 m3 per year to the north. The mean significant wave height is 1.0 m, and
the coast is subject to semi-diurnal tides with a range of approximately 2 m (Jackson et al., 2007).
The reef was developed as a part of the Gold Coast Beach Protection Strategy, and was broadly
designed to provide the following multi-purpose criteria:
Provide a control point for a nourished wider beach and dune;
Allow over 80% (420,000m3/year) of the net littoral drift (500,000 m3/year) to bypass;
Improve surfing amenity.
The final shape was a relatively complex split V formation, with an original design crest level
of -1.0 m AHD (approximately 1.0 m below MSL). With this reef shape and crest level, numerical
modelling undertaken by the University of Waikato predicted a salient extending seaward
approximately 80 m from the mean shoreline position. This was somewhat confirmed by a physical
modelling study undertaken by WRL, however, this was not the objective of the physical modelling
(as discussed in Section A.2.4). After review of the modelling, and with consideration of safety
aspects, it was decided by Gold Coast City Council (GCCC) and project managers International
Coastal Management (ICM) to adopt a lower reef crest level of -1.5 m AHD, with the possibility of
crest top up depending on how the structure performed. Construction of the reef commenced in
August 1999 with the major phase of reef construction completed in December 2000. Additional
work to raise the crest of the reef and trim the shape was undertaken in 2001, 2002, 2004, and
2006.
Due to the extensive design investigations as well as quantitative pre and post-construction
monitoring, Narrowneck MPR provides what is probably the best indicator of the ability of empirical,
numerical, and physical modelling to accurately predict the outcomes of a given reef design. As
such, this case study has been presented in detail.

WRL Technical Report 2012/08 Final June 2013 95
Figure A.3: Location of Narrowneck MPR
A.2.2 Design Investigations Summary
Jackson et al. (2007) noted that nine separate study briefs were undertaken by specialist consultants
for the reef design, with coordination of studies undertaken by ICM. Studies relevant to engineering
aspects of the reef included:
Physical modelling: wave breaking characteristics and forces at the reef (WRL);
Numerical modelling: wave breaking characteristics (University of Waikato);
Numerical modelling: sediment movement and budget (WRL/Griffith University);
Physical modelling: sediment movement (WRL);
Numerical modelling: nourishment profiles/quantities and storm erosion (WRL).
It is important to note that these studies were undertaken using a reef design that had the originally
proposed crest level of -1.0 m AHD, as opposed to the lower crest level (-1.5 m AHD) that was
actually constructed.
A.2.3 Summary of Numerical Modelling Investigations
GENESIS modelling was undertaken by WRL to gain an understanding of the existing sediment
processes, including the effect of the nearby Gold Coast Seaway (downdrift of Narrowneck). This
modelling was also used to help identify the location of the reef, assess the impacts of the coincident
beach nourishment, and to gain an understanding of the effect of wave transmission past the reef on
the resulting shoreline planform alignment. This modelling indicated that a wave height reduction of
30% across the reef would be required to move the shoreline 50 m seaward.

WRL Technical Report 2012/08 Final June 2013 96
The empirical methods of Black and Andrews (2001) were used to estimate the beach response in
the lee of the reef, and to estimate the equilibrium beach position. It was determined using this
method that the equilibrium beach planform would have a salient extending 80 m seaward of the
mean shoreline position. More detailed numerical modelling was also undertaken by University of
Waikato (GENIUS, 3DD and POL3DD) to analyse wave conditions and develop the shape of the reef. This
modelling is described in Black (1999) and summarised in Ranasinghe et al. (2001). The modelling was
also used to assess the potential impacts of the reef on shoreline evolution. The models were calibrated
using recorded field data and run using idealised monochromatic wave conditions (Jackson et al., 2007).
A potential oversight in the original numerical modelling was that the structure (in particular its
alongshore length) was parameterised by its base dimension rather than effective dimension.
A.2.4 Summary of Physical Modelling Investigations
Turner et al. (2001) presented information regarding the physical modelling study completed by
WRL. Two aspects of the reef design were investigated in the physical modelling study:
Quantitative wave breaking processes and surfing amenity aspects;
Semi-quantitative sediment transport.
For the wave and tide conditions tested, wave height transmission to the region immediately in the
lee of the reef crest was approximately 0.5 (50%), though there was wide scatter in the results.
Strong diffraction, particularly around the southern side of the reef, contributed to higher wave
height transmission at the shoreline of approximately 0.9 (90%). Based on the GENESIS modelling,
it was predicted that this level of wave transmission to the shoreline would generate significantly less
than a 50 m salient.
Due to scaling problems inherently associated with physical modelling of sediment transport processes,
this aspect of the physical modelling could be considered as semi-quantitative at best. The modelling was
undertaken using a hybrid fixed bed and tracer method, where light weight plastic particles were used to
track sediment movement in the vicinity of the shoreline. The model was validated in a two stage
process that considered existing conditions as well as an idealised detached breakwater case, and was
considered to be well validated when compared to empirical predictions.
The purpose of the physical modelling was to confirm the maximum likely salient extent, and that a
tombolo would not be created by the reef (which could have resulted in significant down drift
erosion). Conditions likely to result in maximum salient growth were tested in the modelling, with
the equilibrium beach profile indicating a 30 – 40 m increase in beach width in the reef shadow zone
during these idealised conditions (Turner et al., 2001).

WRL Technical Report 2012/08 Final June 2013 97
Figure A.4: Equilibrium Shoreline Physical Modelling for Narrowneck MPR at WRL
A.2.5 Construction Materials, Methods, and Maintenance
Construction details of the reef are summarised in the publications of Jackson et al. (2002), Jackson
et al. (2007) and Black (2001). The initial reef was constructed using just over 400 Terrafix
geotextile “mega-containers”, each measuring 20 m in length, 3 – 4.5 m in diameter (approximately
the dimensions of a bus), and weighing 160 – 300 tonnes. The containers were pre-manufactured
then filled and placed using a split-hull hopper dredge. Positioning of the individual bags was
monitored using GPS. Ongoing “maintenance” of the reef has seen an additional 50 bags placed on
the reef between 2001 and 2007, as shown in Figure A.5. It can also be seen in Figure A.6 that
during the peak of the construction, of the order of 90 – 100 containers were placed per month.
Figure A.5: Container Placement Schedule (Jackson et al., 2007)

WRL Technical Report 2012/08 Final June 2013 98
Figure A.6: Peak Container Placement Schedule (Turner et al., 2000)
The containers were reported to be stable in waves up to 8 - 10 m (Black, 2001), however, this
would be the maximum (rather than significant) wave height. Jackson et al. (2002) reported that at
that time, the reef had been subject to nine storm events with wave heights exceeding 5 m, as well
other impacts such as boat anchors, spears, knives, surfboards, etc. This experience led to the
incorporation of composite geotextiles in the later bags that were placed on the reef to help reduce
the impacts of these issues.
A.2.6 Performance and Comparison with Design
The reef has primarily been monitored for coastal protection and surfing amenity aspects, though
documentation of other aspects such as ecology and safety is also available in published literature.
Monitoring of the reef and beach extending several kilometres north and south was undertaken by
WRL for the period August 1999 to July 2008 (nine years). Monitoring was undertaken using an
automated ARGUS coastal imaging system which captured hourly snap, time exposure, and variance
images of the coast during daylight hours. The images were analysed routinely to extract
information regarding changes to the shoreline position and the extent of wave breaking on the reef,
with data presented in a series of six monthly reports.
The outcomes of the coastal protection monitoring are discussed in detail due to the relevance to the
current study. Monitoring was complicated by the fact that approximately 1.5 million cubic metres of
nourishment sand was placed south of the reef prior to construction of the reef. The final beach
monitoring report completed by WRL (Blacka et al., 2008), as well as previous six monthly
monitoring reports, have been largely used by industry to provide comment on the coastal protection
achieved by the reef. It appears that much of the published literature has inadvertently
misinterpreted beach width data published by WRL, reporting that the reef has created a salient
some 20 to 50 m in cross-shore dimension. In fact this is likely a misinterpretation of the monitoring
report data. The figures for beach width shown in the report are relative to an arbitrary dune
reference line, and it is clearly pointed out in the reports that this line dips away from the coastline
alignment in the vicinity of the reef, making the beach appear wider in this area, compared to beach
regions further north and south. This is simply an artefact of the somewhat arbitrary location of the
reference line.
Turner (2005) documented the shoreline evolution over a 1000 m study area centred at the reef
location, for the periods 2001-2002, then 2001-2003. The ARGUS shoreline data was analysed using

WRL Technical Report 2012/08 Final June 2013 99
an “odd-even function analysis” approach to quantitatively define underlying signals in the planform
shoreline alignment. The results of the analysis indicated that there was general beach accretion of
the order of 20 m in the vicinity of the reef, likely due to the combined salient and groyne effects.
Blacka et al. (2008) documented that on average over the eight year monitoring period since
construction, the shoreline was receding at approximately 2.8 m per year south and north of the
reef, while in the lee of the reef the recession was more like 4.3 m per year. The shoreline position
at the Gold Coast relative to August 2000 is shown in Figure A.7, where it can be seen that by mid-
2008 at Narrowneck the shoreline had receded some 15 m further than sections of beach further
north or south of the reef (relative to the August 2000 shoreline position). This implies that the
general widening observed by Turner (2005), was likely no longer present by 2008. The beach
position data also suggests that the extensive nourishment in the vicinity of the reef likely resulted in
a “groyne” effect which maintained a wider beach south of the reef for several years longer.
However, this was compensated by an increased rate of erosion in more recent years, with the beach
position now receded by some 20 m by August 2008, relative to the 2000 beach position.
Figure A.8 shows the monthly shoreline position for years 1999 to 2007, where only a minor
planform perturbation in the lee of the reef can be detected by the naked eye (likely of the order of
10 m). While no detailed analysis of the effect of the reef on planform beach alignment has been
undertaken since 2003 (Turner, 2005), WRL intend to publish this information in the near future so
as to reduce the ambiguity surrounding the coastal protection offered by the reef.
Figure A.7: Beach Position Relative to August 2000
-40
-30
-20
-10
0
10
20
30
Jan-04
Mar-04
May-04
Jul-04
Sep-04
Nov-04
Jan-05
Mar-05
May-05
Jul-05
Sep-05
Nov-05
Jan-06
Mar-06
May-06
Jul-06
Sep-06
Nov-06
Jan-07
Mar-07
May-07
Jul-07
Sep-07
Nov-07
Jan-08
Mar-08
May-08
Jul-08
Be
ach
Po
siti
on
Re
lati
ve t
o A
ugu
st 2
00
0 s
ho
relin
e (
m) Narrowneck
North
South

WRL Technical Report 2012/08 Final June 2013 100
Figure A.8: Monthly Shorelines at Narrowneck, 2000 – 2007 (Black Lines)
Jackson et al. (2007) provided a summary as to how the reef has compared with the initial modelling
that was undertaken, with the following conclusions drawn:
The reef needs long period clean swell to reproduce wave conditions shown in the physical
and numerical modelling (though modelling was undertaken with monochromatic waves of
this nature);
In reality, actual waves experienced at the Gold Coast are typically shorter period and
therefore somewhat unlike the conditions that were modelled;
Modelling is a useful tool, but only provides information for a limited number of scenarios,
and these scenarios need to be carefully selected;
Modelling results need to be interpreted carefully.
A.2.7 Cost
McGrath et al. (1999) summarised economic figures regarding the value of surfing and beach health
to the Gold Coast. In particular it was noted that a 25 year ARI erosion event would cost the Gold
Coast approximately $305 million (1996 AUD), and that a minor erosion event such as a 5 year ARI
could cost approximately $47 million (1996 AUD). The surfing industry on the Gold Coast was
valued at approximately $160 million per annum.

WRL Technical Report 2012/08 Final June 2013 101
Jackson and Corbett (2007) indicated that the total cost of the reef was $2.8 million (including top
up and maintenance) which equates to approximately $3.9 million in 2013. Ranasinghe (2001)
indicated that the cost was approximately split as two thirds for construction and one third for
studies and planning. Clearly the construction costs of the reef are an order of magnitude less than
the potential loss in tourism and surfing revenue caused by a series of erosion events.
A.3 Mount MPR, Mount Maunganui, NZ
A.3.1 Project Description
Numerous investigations have been published that detail the design, construction, and performance
of the Mount MPR located at Mount Maunganui, New Zealand. Information presented in Mead and
Black (1999), Mead et al. (2007), Weppe et al. (2007), Black and Mead (2007), Black and Mead
(2009) and Mead and Borrero (2011) has been used to compile this summary. The Mount MPR was
developed as a research project to investigate surfing amenity and beach protection aspects of MPRs.
Construction of the reef began in 2005 and was completed in June 2008.
The study site is at Mount Maunganui in the Bay of Plenty on the north-eastern coast of New Zealand
(Figure A.9). This section of coast is reported to have a net littoral drift of the order of 60,000 to
80,000 m3/year (Healy, 1980 in Weppe et al., 2007). However, it is expected that this rate is
relatively small in comparison to the gross littoral drift at the site which has variable direction.
Figure A.9: Location of Mount MPR
In terms of coastal protection assessment, the following data was collected for the project:
Pre-construction echosound bathymetry;
RTK-GPS foreshore survey data as shown in Table A.1.

WRL Technical Report 2012/08 Final June 2013 102
Table A.1: Beach Survey Data for Mount Reef Analysis
Survey Date Reef Stage
(% Complete)
19/08/2004 * 0
28/10/2004 0
26/04/2005 0
08/09/2005 0
17/11/2005* 10
20/04/2006 25
15/08/2006 * 70
23/01/2007 * 70
15/05/2007 * 70
14/03/2009 * 100
* Indicates complete shoreline contour along site
A.3.2 Modelling and Design
Design of the reef was undertaken in various stages, initially for consent approvals and subsequently
for detailed design. The final design and impact assessment was developed using numerical (WBEND
and 3DD) modelling and was subsequently physical modelled in order to achieve final design
adjustments. The physical model testing was used to assess the constructability of the reef design,
and also to consider the quality of the waves generated under a range of tide and wave conditions.
The final reef design was a symmetrical ‘delta’ shape with a wave focussing zone (shallower
gradient) and a wave breaking zone (steeper gradient), intended to produce a single peaking wave
break (Mead et al., 2007).
Black and Mead (2007) used the empirical methods of Black and Andrews (2001) and
Ranasinghe et al. (2006) to predict the presence and size of a salient for the Mount MPR. The model
2DBeach was subsequently used to simulate the sediment transport processes at the site. This
analysis was undertaken following construction and a period of monitoring of the reef, with the
intention of analysing the effectiveness of a calibrated numerical model to predict and understand
the key morphodynamic processes in the vicinity of reef structures.
A.3.3 Construction
The Mount MPR was constructed in two separate halves using the RAD (Rapid Accurate Deployment)
technique. The individual geotextile mega-containers ranged in filled dimensions from 30 m long x
1.5 m wide x 1.0 m high to 50 m long x 7.2 m wide x 3.2 m high, with each half of the reef
comprising 12 containers.
A.3.4 Performance
The coastal protection aspects of the Mount Reef have been examined by Weppe et al. (2007) using
an odd-even function analysis to interpret the available survey data, as was used by Turner (2005)
for the Narrowneck reef. The analysis of shoreline change was completed for three separate data
sets, firstly the preconstruction survey data (change from August 2004 to November 2005), secondly

WRL Technical Report 2012/08 Final June 2013 103
the pre to post construction data (change from November 2005 to March 2009), and thirdly an
alternative pre to post construction data set (change from January 2007 to March 2009).
The pre-construction even function analysis indicated a general trend of accretion south and north of
the reef with minor erosion in the proposed reef area during the period considered. The odd function
analysis showed an alongshore gradient in beach change, with accretion in the north-west and
erosion in the south east. This is complementary with the observed wider beach widths to the north-
west, possibly due to sheltering from the offshore islands or localised dredge spoil disposal. The
analysis indicated complex alongshore variations in shoreline alignment, with variations in beach
width of 20 m – 30 m evident.
Analysis of the shoreline change during the pre to post construction interval showed a total function
that indicated fluctuating shoreline change alongshore, varying from 30 m accretion at about 100 m
to 200 m north-west of the reef through to regions of slight erosion. There was little net accretion in
the region directly in the lee of the reef, indicating that there was very little salient type formation.
The odd function analysis indicated a potential secondary groyne effect being generated by the reef,
with a significantly steeper beach width gradient spanning the region from 200 m north-west to
200 m south-east of the reef. It is also possible that the structure resulted in other discrete changes
to the beach alignment, evidenced by an increasing number of beach width fluctuations alongshore
as a result of rhythmic bar/rip formations.
In summary, with regard to coastal protection:
Any effects of the reef on shoreline position are subtle and within the natural variation of
shoreline position;
No noticeable salient developed;
There was probably a slight localised groyne effect from the structure.
The numerical modelling of Black and Mead (2007) (calibrated to the post construction bathymetry
data), was shown to be able to broadly capture the processes and development of key sand bar
features that have been observed in the vicinity of the reef. While the modelling was able to
estimate quantitative details for the morphological response (sand bar crest levels and on/offshore
position etc.), the level of accuracy was shown to be very sensitive to the modelled environmental
conditions (wave conditions and initial bathymetry). The information presented in Black and Mead
(2007) provided some confidence that a calibrated morphological model is useful for understanding
the processes occurring around a reef; however, also confirms that the complexity of the processes
result in quantitative model predictions that remain only reasonable approximations, and that the
degree of uncertainty requires quantification if the modelling is to be used for assessment of the
coastal protection provided by a reef.
A.4 Dupont Submerged Breakwater, Palm Beach, Florida, USA
A.4.1 Project Description
Stauble and Tabar (2003) summarised the findings of a two year submerged reef/breakwater study
between 1988 and 1990 at the town of Dupont, in Palm Beach County, Florida (Figure A.10). The
section of coast studied had suffered storm erosion. Existing coastal protection structures including
groynes, a seawall, and a revetment were already present and created an irregular shoreline at the
site. Details of the submerged reef structure are as follows:

WRL Technical Report 2012/08 Final June 2013 104
Constructed from PEP precast modules;
Placed approximately 50 m offshore;
Water depth of 2.4 m;
Crest submergence of approximately 0.6 m below MSL; and
Alongshore crest length of 160 m.
Three monthly profile surveys were undertaken at the site over a two year period from
preconstruction in March 1988 through to March 1990. Seventeen (17) cross shore profiles were
monitored at the site, with a longshore spacing of 30 m in the vicinity of the reef and 61 m north and
south of the reef.
Figure A.10: Location of the Dupont Submerged Breakwater
A.4.2 Performance
In general, the shoreline position at the completion of monitoring was landward of the original
shoreline position. In the lee of the reef structure there was little change in shoreline position
between the start and end of the monitoring. The volumetric change in the sub-aerial beach was
variable and it was difficult to separate background changes in sand movement from the effect of the
reef. Furthermore, the existing coastal protection structures generated additional variability in the
beach response. It was concluded that there was little benefit for shoreline position generated by
the reef.
The reef units were observed to be displaced during a storm midway through the project, and had to
be realigned. No further movement of the units was observed during the project.

WRL Technical Report 2012/08 Final June 2013 105
A.5 Midtown Submerged Breakwater, Palm Beach, Florida, USA
A.5.1 Project and Reef Description
Dean (1996), Martin and Smith (1997), and Browder et al. (2000) presented the findings of a four
year submerged reef/breakwater trial at the Town of Palm Beach, Florida (Figure A.11). The section
of coast investigated was suffering ongoing erosion due to the installation of a trained harbour
entrance updrift of the reef location (100,000 m3/year net littoral drift). The reef was constructed
from “Prefabricated Erosion Protection” (PEP) precast modules, and placed approximately 70 m
offshore in 3 m water depth. The crest submergence was approximately 1.2 m below MSL, and the
reef stretched continuously alongshore for approximately 1260 m. In terms of artificial reef
structures, the PEP units have a narrow 0.3 m crest width and width at the base of only 4.6 m. The
section of coast was contained by a back beach seawall, and had a narrow 8 m sandy strip seaward
of the seawall before the breakwater was constructed (1992). The objectives of the reef were to
reduce wave height and to increase beach width.
Figure A.11: Location of the Midtown Submerged Breakwater
A.5.2 Performance
An extensive monitoring program, including both wave and morphological measurements, was
undertaken during and after construction of the reef. Wave transmission past the reef was measured
at 0.85 to 0.95. Following installation of the reef, the shoreline was observed to suffer ongoing
erosion, until the beach completely eroded back 8 m to the seawall two years after construction was
completed. It was identified that a strong current pattern generated by flow over the reef caused
longshore flow to then travel along the shore and return past the ends of the reef. These flow
patterns were a key in driving the sediment transport processes that resulted in ongoing erosion of
the beach. The transport of water over the reef was seen to cause “ponding” in the lee of the
structure which could not return seaward due to the presence of the reef, and a portion of the
current velocity was projected alongshore. These alongshore current velocities were identified as
being proportional to:

WRL Technical Report 2012/08 Final June 2013 106
Relative crest height;
Crest length;
Offshore Distance;
Wave Height.
Over the three year post construction monitoring period, the reef caused an estimated erosion rate
of 2.3 times the background erosion. The PEP units were also found to suffer moderate settlement of
0.6 – 0.9 m (varied with construction technique). As a result, the reef units were removed late in
1995, and some reconfigured to produce groynes. The beach was then nourished.
A.6 Vero Beach Submerged Breakwater, Indian River County, Florida, USA
A.6.1 Project and Reef Description
Stauble and Tabar (2003) summarised the findings of a four year submerged reef/breakwater study
between 1996 and 2000 at the town of Vero Beach, Florida (Figure A.12). The section of coast at
this site is reported as having suffered ongoing erosion, with 95% of the beach at the study site
backed by hard coastal protection structures. Ranasinghe and Turner (2006) reported that the
littoral drift at the site is approximately 30,000 m3 per year. The nearshore surfzone has underlying
natural reef that runs shore parallel and has a cross-shore width ranging from 300 m to 600 m.
The submerged breakwater at the site was constructed in 1996 in an effort to reduce the ongoing
erosion at the site. The structure had the following design details:
Constructed from PEP precast modules;
Placed in 11 short segments with crest length varying from 51 m to 96 m, gaps between
adjacent segments, and total crest length of 914 m; and
Breakwater segments alternated with 61 m/76 m offshore distance, 2.1 m/2.7 m water
depth, and 0.3 m/0.9 m crest submergence.
The staggered and segmented configuration of the breakwater was established from physical model
testing, as well as from the experience gained at the Midtown Palm Beach project, where a similar
structure was built with a continuous long crest and resulted in scour inshore of the structure
(Section A.5).
A.6.2 Performance
A range of monitoring was undertaken for the project during the four year study period including:
40 cross-shore profiles spaced at approximately 60 m and covering the breakwater length, as
well as control profiles with spacing of 150 m extending 1500 m each side of the breakwater;
Profiles were monitored approximately quarterly starting just prior to reef installation;
Aerial photography;
Settlement/crest level measurements;
Scour measurements; and
Wave measurements.

WRL Technical Report 2012/08 Final June 2013 107
Figure A.12: Location of the Vero Beach Submerged Breakwater
In terms of coastal protection, for the majority of the monitoring period the control area to the north
of the reef accreted with a seaward shift in shoreline position of approximately 10 m, while there was
varying landward and seaward shoreline migration over the southern control area. The section of
beach in the lee of the reef suffered erosion, with the shoreline migrating 3 m to 5 m landward in the
two years following installation of the breakwater. Throughout the last year of the monitoring
period, the beach at both the northern and southern control zones, as well as the breakwater zone all
accreted. At the completion of the four year monitoring period the cumulative shoreline accretion
was 9.7 m over the north control zone, 7.6 m over the southern control zone, and 5.3 m in the lee of
the breakwater. In terms of overall volumetric morphological response the following results were
obtained:
11.7 m3/m of accretion in the lee of the reef;
15.3 m3/m of accretion in the southern control zone; and
31.9 m3/m of accretion in the northern control zone.
Based on the analysis of historical aerial photographs as well as the existing beach processes, it was
difficult to separate the effects of the PEP breakwater from the underlying trends. It is thought that
the breakwater possibly exacerbated the underlying trend of erosion at that specific area of the
beach, however, the effects were minimal and localised.
Wave attenuation measurements were taken by five separate gauges over a two year period. The
initial wave reduction across the breakwater was measured at 12%, however, after settlement of the
units this dropped to approximately 8%. Measurements of wave attenuation over the southern
control area indicated that the natural reef at the site was reducing wave height by up to 8%, and
hence it was concluded that the breakwater was doing very little to reduce wave heights, particularly
following the settlement of the units. This was attributed to the very narrow crest width of the PEP
units.

WRL Technical Report 2012/08 Final June 2013 108
In general, scour was variable around the units. A scour trench developed on the leeward side of the
reef and persisted throughout the study. The scour trench varied from 3 m to 9 m in width and
ranged in depth from 1.2 m to 1.8 m. This scour was likely due to wave structure interaction and
localised wave driven currents around the units. Scour on the seaward side of the breakwater units
was observed post storm, however, this naturally filled in with time.
Initial settlement of approximately 1 m was observed for the breakwater units, except where the
units rested on hard bottom. Following this initial settlement the units remained essentially stable
for the remainder of the monitoring period.
A.7 Avalon Submerged Breakwater, New Jersey, USA
A.7.1 Project Description
Stauble and Tabar (2003) summarised the findings of a two year submerged reef/breakwater study
between 1993 and 1995 at the town of Avalon, New Jersey (Figure A.13). The project was a part of
the New Jersey Pilot Reef Project. The section of coast at this site is reported as being naturally
dynamic as it is a part of a barrier island system adjacent to Townsends Inlet, and therefore the
coastal processes such as entrance currents, sand shoals, and littoral drift play a significant role in
the local geomorphology. The area has been further complicate by human intervention including
historical sand mining, nourishment, entrance clearing and training, and coastal protection.
The submerged breakwater at the site was constructed in 1993 in an effort to retain significant
quantities of sand that had been placed on the beach during several nourishment campaigns
throughout the previous five years. The structure had the following design details:
Constructed from Beachsaver precast concrete modules;
Placed approximately 100 m - 150 m offshore;
Water depth of 2.2 m – 3.8 m;
Crest submergence of minimum 0.4 m below MSL; and
Alongshore crest length of 305 m.
The reef was located such that at one end it was attached to an existing rubble mound/groyne
structure, effectively forming a sand trap.

WRL Technical Report 2012/08 Final June 2013 109
Figure A.13: Location of the Avalon Submerged Breakwater
A.7.2 Construction
The Beachsaver units were placed from barges onto geotextile, and were fixed into place by steel
H-piles driven through holes in the units and into the subsurface soil. Midway through the
monitoring period additional scour protection in the form a stone filled geo-mattress was placed
along the landward side of half of the structure.
A.7.3 Performance
A range of monitoring was undertaken for the project during the two year monitoring period
including:
27 cross-shore profiles spaced at approximately 30 m and covering an 820 m length of
coast;
Profiles were monitored approximately every four months starting just prior to reef
installation;
Settlement/crest level measurements;
Scour measurements;
Wave measurements;
Hydrodynamics with a dye trace study.
In terms of coastal protection, the combined reef installation with beach nourishment makes it
somewhat difficult to draw definitive conclusions regarding the morphological response directly
attributable to the reef. In general, the results presented in Stauble and Tabar (2003) suggest that
the beach south of the reef eroded back to the pre-nourishment position within one year, while the
section of beach leeward of the reef eroded more slowly. Volumetric analysis of the profiles indicated
that in the first year following nourishment and reef installation:
Erosion to the south of the reef was approximately 180 m3/m;

WRL Technical Report 2012/08 Final June 2013 110
Erosion at the southern (open) end of the reef was 156 m3/m; and
Erosion at the northern (closed) end of the reef was 100 m3/m.
Wave attenuation measurements were taken as a part of two separate data collection exercises. The
maximum reduction in wave transmission over the reef was recorded as 20%, while it was noted that
once the submergence over the reef crest exceeded 80% of the water depth, there was no wave
height reduction generated by the reef.
In general, scour was measured in the nearshore area landward of the reef and even more so
immediately on the landward side of the reef (over 1 m scour depth). Accretion was observed
against the seaward face of the reef along the entire reef length. Settlement of the reef units was
measured over a 21 month period and was reported as highly variable. Settlement at the northern
end of the reef was of the order of 0.5 m, while at the southern end it was more significant at over
1.5 m.
A.8 Cape May Point Submerged Breakwater Study Number 1, New Jersey, USA
A.8.1 Project Description
Stauble and Tabar (2003) summarised the findings of a two year submerged reef/breakwater study
between 1994 and 1996 at Cape May, New Jersey (Figure A.14). The project was a part of the New
Jersey Pilot Reef Project. The section of coast at the site was reported as being highly dynamic, as it
is adjacent to the entrance of Delaware Bay and subject to strong tidal currents from the Cape May
channel. The coast had suffered ongoing erosion due to littoral drift processes, and as a result, a
groyne field with nine separate timber and rock groynes had been constructed. The groyne field
reduced the littoral drift erosion, however, cross shore erosion was still resulting in a receding coast.
The littoral drift at the site is approximately 153,000 m3/year, with mean wave heights of 0.6 m in
summer and 1.2 m in winter, and a mean tidal range of 1.2 m (Curtis et al., 2000).
The project investigated the use of Beachsaver reef units in conjunction with the existing groyne
field, in an effort to reduce the cross shore erosion processes. Two of the beach compartments were
“capped” with beachsaver reefs joining across the seaward end of the perimeter groynes, effectively
creating a 305 m long reef that spanned two of the compartments. The adjacent beach
compartment was considered as a “control” and monitored for comparison purposes. The structure
had the following design details:
Constructed from Beachsaver precast concrete modules;
Placed approximately 50 - 65 m offshore;
Water depth of 2.1 m – 2.4 m MLW;
Crest submergence of -0.15 to 0.61 m below MLW; and
Alongshore crest length of 275 m.

WRL Technical Report 2012/08 Final June 2013 111
Figure A.14: Cape May Point Research Site
A.8.2 Construction
The individual breakwater units were placed by jack up barge. The breakwater units were connected
to the existing groyne structures using a capstone, and steel H-piles were driven through the units
into the seabed to help hold the units in place. A double thickness (compared to the Avalon project)
geotextile filter was placed under the reef units to reduce scour and settlement. A stone filled geo-
mattress was placed along the seaward and leeward edges of the reef units to further reduce scour
effects.
A.8.3 Performance
A range of monitoring was undertaken for the project during the two year monitoring period
including:
12 cross-shore profiles (five in each compartment behind the reef and two in the control
compartment);
Settlement/crest level measurements;
Scour measurements;
Wave measurements; and
Hydrodynamics with a dye trace study and current meters.
In terms of coastal protection, the reef was considered to have stabilised the beach in its lee. During
the monitoring period the beach in the lee of the reef was observed to widen by 13 m in one cell and
5 m in the other cell, while the beach width in the control cell was observed to narrow by 5 m.
Volumetric analysis of the profiles indicated that during the monitoring period:
The two cells protected by the reef gained a volume of 2,111 m3 and 380 m3; and
The control cell lost a volume of 660 m3.

WRL Technical Report 2012/08 Final June 2013 112
Wave attenuation measurements were limited for this project, and data was only collected during a
single day with wave heights less than 0.5 m. Under these conditions the breakwater was observed
to reduce wave heights by approximately 10%.
The placement of the Beachsaver units on the filter cloth and geotextile mattress limited settlement
of the units to approximately 150 mm. A consistent scour trench formed along the length of the
breakwater units on the landward side. The scour trench measured up to 0.6 m in depth during the
course of the study, however, eight years after placement the scour trench measured up to 2 m in
depth.
A.9 Cape May Point Submerged Breakwater Study Number 2, New Jersey, USA
A.9.1 Project Description
Stauble and Giovannozzi (2004) and Stauble et al. (2005) summarised the establishment and
findings of a second submerged reef/breakwater study between 2002 and 2003 at Cape May Point,
New Jersey. The investigation was a part of the US Army Corps of Engineers Section 227 Project. In
this project a further two beach cells at Cape May Point were protected by submerged breakwater
structures, with the first being constructed from Beachsaver units and the second from Double-T sill
units. Both breakwaters were constructed to completely enclose the beach cells by connecting each
end of the reefs to cross-shore groyne structures, with the monitoring program including both of the
protected beach cells as well as an adjacent unprotected beach cell.
The Beachsaver reef structure had the following design details:
Constructed from Beachsaver precast concrete modules;
Placed approximately 50 - 65 m offshore;
Water depth of 2.7 m;
Crest submergence of 0.9 m below MSL, or at MLW; and
Alongshore crest length of 220 m.
The Double-T sill reef structure had the following design details:
Constructed from Double-T sill precast modules;
Placed approximately 50 - 65 m offshore;
Water depth of 2.7 m;
Crest submergence of 1.9 m below MSL; and
Alongshore crest length of 201 m.
A.9.2 Construction and Costs
Both the Beachsaver and Double-T sill breakwater units were connected to the existing groyne
structures were built using similar methods:
Placed by barge mounted crane;
Beachsaver units placed on geotextile mat while Double-T sill units placed directly on
seabed; and
Rock was used to infill between the ends of the breakwaters and the adjacent groynes.

WRL Technical Report 2012/08 Final June 2013 113
Placement of the 72 units in the Beachsaver reef was undertaken over 25 working days at a cost of
approximately $4,000 per linear metre (equivalent 2013 AUD), while placement of the 22 Double-T
sill units took only four working days at a cost of approximately $1,400 per linear metre (equivalent
2013 AUD).
A.9.3 Performance
A range of monitoring was undertaken for the project during the one year reported monitoring period
including:
Four cross-shore profiles in each cell;
Settlement/crest level measurements;
Scour measurements;
Wave measurements; and
Hydrodynamics with current meters.
In terms of coastal protection, the Beachsaver reef was observed to result in a general widening of
the beach and increase in beach volume compared to the adjacent control cell and the Double-T sill
reef. Wave height attenuation by the Beachsaver reef was measured to be approximately 12%,
while the Double-T sill reef surprisingly resulted in a slightly higher attenuation of approximately
18% though this was postulated to be due to other environmental variables at the site. Despite the
use of a geotextile underlayer under the Beachsaver reef units and not the Double-T sill units,
settlement in the range of 0.6 m to 1.2 m was observed for both reef structures during the initial 6
months after construction.
A.10 Belmar Submerged Breakwater, New Jersey, USA
A.10.1 Project Description
Stauble and Tabar (2003) summarised the findings of a 1.5 year submerged reef/breakwater study
between 1994 and 1995 at Belmar/Spring Lake, New Jersey (Figure A.15). The installation was a
part of the New Jersey Pilot Reef Project. The section of coast had suffered long term erosion
problems, and as a result was almost completely protected by seawalls as well as several groynes
trapping sand from the littoral drift system. The site is absent of tidal currents that were present at
the Cape May and Avalon sites, though has a larger wave climate and steeper offshore slope.
The submerged breakwater was constructed in conjunction with beach nourishment, and had the
following design details:
Constructed from Beachsaver precast concrete modules;
Placed approximately 128 m offshore;
Water depth of 2.3 m – 2.4 m MLW;
Crest submergence of 0.7 to 1.16 m below MLW; and
Alongshore crest length of 335 m.

WRL Technical Report 2012/08 Final June 2013 114
Figure A.15: Location of the Belmar Submerged Breakwater
A.10.2 Construction
The breakwater units were connected to the existing groyne structures using a capstone, and steel
H-piles were driven through the units into the seabed to help hold the units in place. A double
thickness (compared to the Avalon project) geotextile filter was placed under the reef units to reduce
scour and settlement. A stone filled geo-mattress was placed along the seaward and leeward edges
of the reef units to further reduce scour effects.
A.10.3 Performance
A range of monitoring was undertaken for the project during the study period including:
15 cross-shore profiles covering a longshore distance of 945 m (six profiles in the lee of the
reef, four profiles to the north, and five profiles to the south);
Settlement/crest level measurements; and
Scour measurements.
In terms of coastal protection, the nourished shoreline in the lee of the breakwater retreated a
distance of approximately 15 m during the study, while in the control area the shoreline moved
seaward approximately 6 m. The majority of the shoreline recession in the lee of the reef was
attributed to sand migrating from the beach face into a detached bar as a result of storm attack.
Volumetric analysis indicated that a loss of 3.3 m3/m occurred in the lee of the reef during the study
period.
Analysis of reef crest levels showed that the reef units settled by 0.1 m to 2.0 m during the study.
Settlement ceased once the base of the units migrated through the upper 1 m sand layer and
reached a subsurface clay layer.
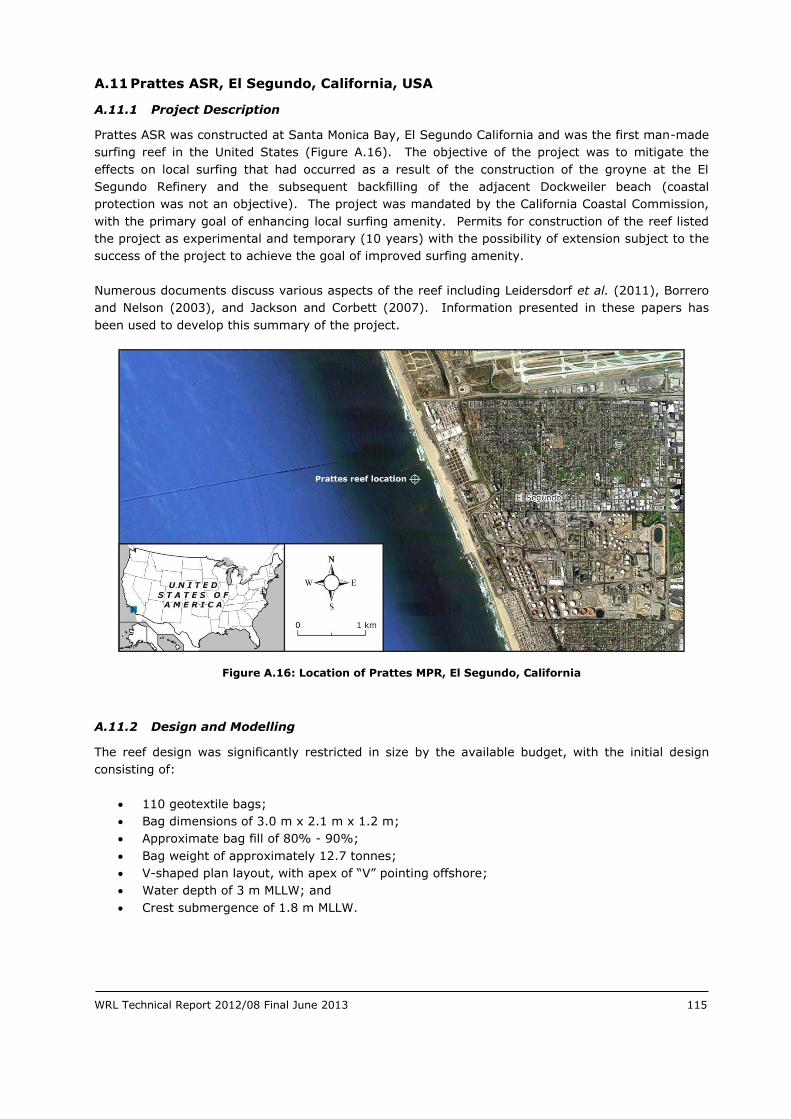
WRL Technical Report 2012/08 Final June 2013 115
A.11 Prattes ASR, El Segundo, California, USA
A.11.1 Project Description
Prattes ASR was constructed at Santa Monica Bay, El Segundo California and was the first man-made
surfing reef in the United States (Figure A.16). The objective of the project was to mitigate the
effects on local surfing that had occurred as a result of the construction of the groyne at the El
Segundo Refinery and the subsequent backfilling of the adjacent Dockweiler beach (coastal
protection was not an objective). The project was mandated by the California Coastal Commission,
with the primary goal of enhancing local surfing amenity. Permits for construction of the reef listed
the project as experimental and temporary (10 years) with the possibility of extension subject to the
success of the project to achieve the goal of improved surfing amenity.
Numerous documents discuss various aspects of the reef including Leidersdorf et al. (2011), Borrero
and Nelson (2003), and Jackson and Corbett (2007). Information presented in these papers has
been used to develop this summary of the project.
Figure A.16: Location of Prattes MPR, El Segundo, California
A.11.2 Design and Modelling
The reef design was significantly restricted in size by the available budget, with the initial design
consisting of:
110 geotextile bags;
Bag dimensions of 3.0 m x 2.1 m x 1.2 m;
Approximate bag fill of 80% - 90%;
Bag weight of approximately 12.7 tonnes;
V-shaped plan layout, with apex of “V” pointing offshore;
Water depth of 3 m MLLW; and
Crest submergence of 1.8 m MLLW.

WRL Technical Report 2012/08 Final June 2013 116
The initial reef design is shown in Figure A.17 and was intended to modify the wave breaking
characteristics at the site, such that the waves would be more suitable for surfing. This was to occur
through the reef forcing swell to break further offshore and have an increased peel angle.
Figure A.17: Design of the Prattes ASR (after Leidersdorf et al., 2011)
Shortly following the completion of the initial reef construction, dive inspections revealed that the
seafloor had scoured to a depth of approximately 4 m (at least 1 m of scour depth from initial bed
level).
Due to the inadequate size of the reef which was realised almost immediately, a second phase of
construction saw an additional 90 bags placed on the reef, increasing the reef volume by some 80%.
This increased the height of the structure such that the crest submergence of the apex was only
0.9 m below MLLW, and also increased the footprint of the reef.
A.11.3 Construction
The reef construction was undertaken as follows:
Woven polypropylene bags with nylon lifting handles used for initial construction;
Bags filled at Port of Los Angeles and transported to site by barge;
Bags lifted into place by barge mounted crane; and
Woven polyester bags used for second stage of construction.

WRL Technical Report 2012/08 Final June 2013 117
A.11.4 Cost
The budget for the project agreed by Chevron (the owner of the El Segundo Refinery), the California
Coastal Commission, and Surfrider Foundation was $300,000 (USD in 2000). This budget was used
for the design and construction of the initial reef in 2000. The reef was extensively increased (80%
additional geocontainers added) in 2000 with an additional budget of $250,000 (USD), giving a total
construction budget of $550,000 (USD).
A.11.5 Performance
An extensive monitoring program was undertaken for the project to identify the impact of the reef on
local surfing conditions, shoreline features, and nearshore bathymetry. Only limited monitoring was
undertaken prior to construction of the reef, with the majority of the monitoring program occurring
post-construction. The monitoring consisted of:
Monthly beach profile surveys updrift, adjacent, and downdrift of the reef;
Quarterly ADCP bathymetric surveys of the reef and surrounding seabed;
Quarterly dive inspections of the reef; and
Near daily observations of the surf conditions at the reef.
After several years of beach and bathymetry monitoring the reef was reported to have no discernible
impact on either the surrounding bathymetry or the beach. With regard to surfing amenity,
immediately following the stage 2 construction the reef was reported to have produced near rideable
waves that broke only briefly. With the subsequent settlement of the reef over the following months,
the reef lost all ability to improve surfing amenity at the site.
With regard to structural performance of the reef:
In the year following the stage 2 construction, the reef crest dropped by 1.5 m, likely due to
a combination of displaced bags, compaction of bag fill, and settlement from scour of the
seabed; and
Progressive deterioration of the bag material.
In general, the reef was considered unsuccessful at achieving any of the targets for the project, and
as such, in following through with the initial project permits the reef was removed commencing in
2008.
A.11.6 Removal
Planning for removal of the reef was initially facilitated through two wading and diving inspections of
the reef in the first half of 2008. It became apparent during these surveys that the reef and
geocontainers were in relatively bad condition, with Leidersdorf et al. (2011) reporting:
Many geocontainers were buried or partially buried;
Geocontainers were in clusters, with areas of bare seabed in between;
Torn geotextile fabric and nylon lifting straps indicated damaged geocontainers; and
Degraded state of the polypropylene bags, such that the material could be torn by hand.
There was no prior experience with removing geocontainers from a submerged reef, however, the
experience obtained from removing armouring (in the form of geotextile bags) from the subaerial

WRL Technical Report 2012/08 Final June 2013 118
beach face on man-made islands in the Alaskan Beaufort Sea was utilised. This experience indicated
that so long as the geocontainers are located within suitable reach, and that the containers were
exposed above the sea floor, removal could be undertaken rapidly using a conventional excavator.
The efficiency of this land based extraction technique was noted to decrease dramatically if the
geocontainers were beyond the reach of a conventional excavator. Based on this information, land
based dredging or extraction was ruled out as an option at the Prattes Reef site due to:
Likely tearing and spreading of geotextile;
Disturbance of the sea bottom; and
Generation of turbidity.
Similarly, the method of cutting the geocontainers and jetting the fill material out was eliminated due
to:
Generation of turbidity; and
Difficulty of operation in the surf zone.
As a result two alternative methods were proposed for removing the Prattes Reef geocontainers:
Vessel based removal using deck mounted winch; and
Shore based removal where a bulldozer and winch were used to drag the containers ashore.
Both methods required a commercial diver to attach the removal cable and slings/nets to the
geocontainers for extraction, and to also puncture the geocontainers so that the fill spread in a
controlled manner. These methods are illustrated in Figure A.18.
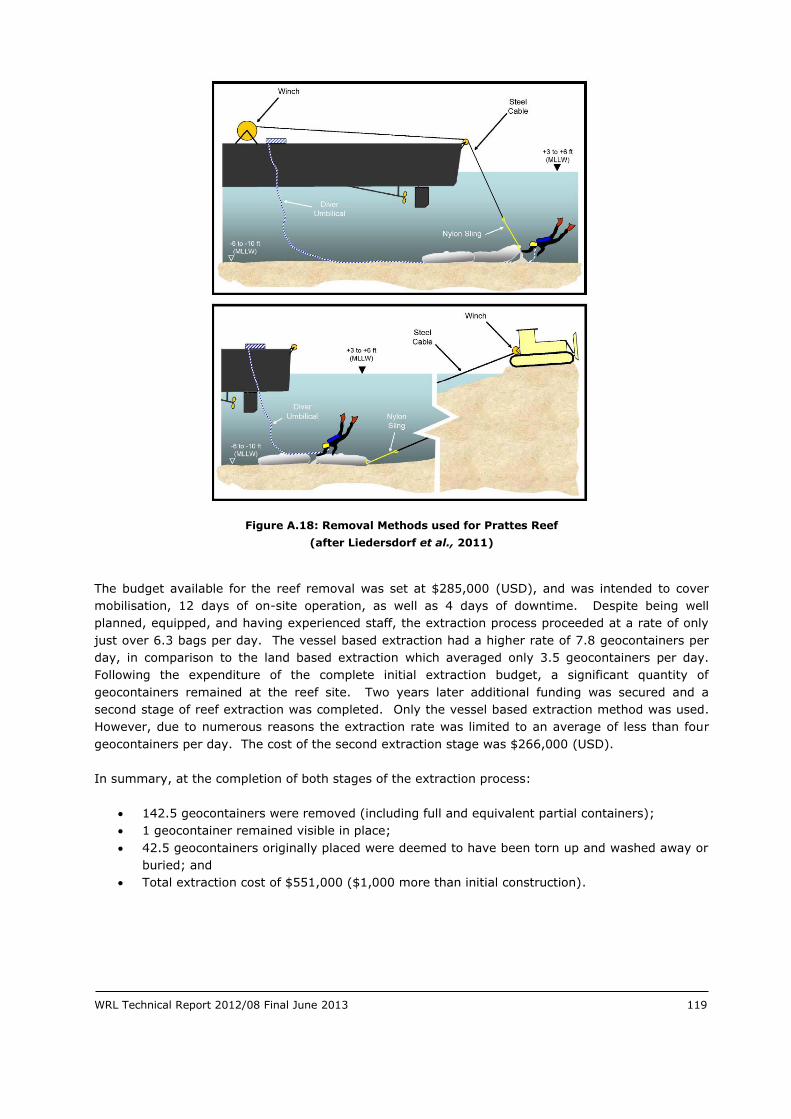
WRL Technical Report 2012/08 Final June 2013 119
Figure A.18: Removal Methods used for Prattes Reef
(after Liedersdorf et al., 2011)
The budget available for the reef removal was set at $285,000 (USD), and was intended to cover
mobilisation, 12 days of on-site operation, as well as 4 days of downtime. Despite being well
planned, equipped, and having experienced staff, the extraction process proceeded at a rate of only
just over 6.3 bags per day. The vessel based extraction had a higher rate of 7.8 geocontainers per
day, in comparison to the land based extraction which averaged only 3.5 geocontainers per day.
Following the expenditure of the complete initial extraction budget, a significant quantity of
geocontainers remained at the reef site. Two years later additional funding was secured and a
second stage of reef extraction was completed. Only the vessel based extraction method was used.
However, due to numerous reasons the extraction rate was limited to an average of less than four
geocontainers per day. The cost of the second extraction stage was $266,000 (USD).
In summary, at the completion of both stages of the extraction process:
142.5 geocontainers were removed (including full and equivalent partial containers);
1 geocontainer remained visible in place;
42.5 geocontainers originally placed were deemed to have been torn up and washed away or
buried; and
Total extraction cost of $551,000 ($1,000 more than initial construction).