Embed Size (px)
Citation preview

A Return on Investment Analysis of Bikes-on-Bus
Programs
Final Report
Christopher Hagelin Principal Investigator
Amy Datz
FDOT Project Manager
National Center for Transit Research Center for Urban Transportation Research
University of South Florida
June 2005
Contract # BD 549-4

State of Florida Department of Transportation
Public Transit Office 605 Suwannee Street
Tallahassee, FL 32399-0450 (850) 414-4500
Project Manager:
Amy Datz
National Center for Transit Research
Center for Urban Transportation Research University of South Florida 4202 E. Fowler Avenue, CUT 100 Tampa, FL 33620-5375 (813) 974-3120 Project Staff: Christopher A. Hagelin, Research Associate
The opinions, findings and conclusions expressed in this publication are those of the authors and not necessarily those of the U.S. Department of Transportation or the State of Florida Department of Transportation.
ii

Technical Report Documentation Page
1. Report No. NCTR 576-05 FDOT BD549-04
2. Government Accession No.
3. Recipient's Catalog No.
5. Report Date June 2005
4. Title and Subtitle A Return on Investment Analysis of Bikes-on-Bus Programs
6. Performing Organization Code
7. Author(s) Christopher A. Hagelin
8. Performing Organization Report No. 10. Work Unit No. (TRAIS)
9. Performing Organization Name and Address National Center for Transit Research University of South Florida 4202 E. Fowler Ave. CUT 100 Tampa, FL 33620-5375
11. Contract or Grant No. DTRS98-G-0032
13. Type of Report and Period Covered Final Report 10/22/2004 – 7/31/2005
12. Sponsoring Agency Name and Address Office of Research and Special Programs Administration U.S. Department of Transportation, Washington DC 20590 Florida Department of Transportation 605 Suwannee St. MS 30, Tallahassee, FL 32399
14. Sponsoring Agency Code
15. Supplementary Notes Prepared in cooperation with the USDOT and FDOT
16. Abstract As bikes-on-bus (BOB) programs become popular and demand increases, the typical rack capacity of only two bicycles per bus can limit the integration of bicycles and transit. The purpose of this project was to conduct a return on investment analysis of BOB programs, and to develop recommendations on how transit agencies can overcome rack capacity limitations. Fifteen transit agencies and over 200 BOB users were surveyed. Missing data, specifically the number of BOB boardings, made a rigorous return on investment analysis impracticable. However, the findings showed that transit agencies generally view the initial investment and operational costs of BOB programs to be minimal compared to the return on the investment. The BOB user survey results showed that BOB programs attract new patrons, encourage increased use of transit, and expand the transit service area. When faced with rack capacity limitations, the transit agencies have added three-bike capacity racks or have experimented with allowing bicycles in the bus. While added rack capacity and an effective bikes-in-bus (BIB) policy can improve the integration of bicycles and transit, it is recommended that transit agencies invest in a bike-to-transit strategy. The survey results showed that BOB users tend to bicycle a greater distance from their residence to the bus stop than between the bus stop and the work site. Therefore, this strategy is centered on the provision of bicycle parking at bus stops and transfer centers to accommodate BOB users that need their bicycle on only one side of their transit trip. Bicycle parking at bus stops, specifically in residential areas, can ease the impact of rack capacity limitations and maximize the potential of the bicycle as a means to access transit. 17. Key Word Bikes-on-bus, Transit Riders, Bicycles, Buses, Transit buses, Urban Transportation, Research Projects
18. Distribution Statement No Restriction This report is available to the public through the NTIS, Springfield, VA 22161 www.ntis.gov and the NCTR website: www.nctr.usf.edu
19. Security Classif. (of this report) Unclassified
20. Security Classif. (of this page) Unclassified
21. No. of Pages 96
22. Price
iii

ACKNOWLEDGMENTS
We would like to thank members of the advisory committee for their active participation in this project:
Amy Datz Florida Department of Transportation Dennis Scott Florida Department of Transportation Dwight Kingsbury Florida Department of Transportation Lorraine Smith Broward County Mass Transit (BCT) Doug Jamison Central Florida Regional Transit Authority (LYNX) Steve Githens Citrus Connection/Lakeland Area Mass Transit (Citrus) Robert Trout Hillsborough Area Regional Transit (HART) Amy Laubach Jacksonville Transportation Authority (JTA) Andrea Leyva Miami-Dade Transit (MDT) Lili Agee Palm Beach County Transportation Agency (PalmTran) Michael Siebel Pinellas Suncoast Transit Authority (PSTA) Theresa Harrison Regional Transit System (RTS) James Liesenfelt Space Coast Area Transit (Space Coast) DeWayne Carver Tallahassee Transit (TalTran) Louis Matamoros City of Phoenix Public Transit (Phoenix) Eileen Kadesh King County Metro (Metro) Ken Auguston Lane Transit District (Lane) Mike Aro Valley Transportation Authority (VTA) Phil Winters Center for Urban Transportation Research
iv

Executive Summary Since their development in the mid-1980s, bikes-on-bus (BOB) programs have become a valuable service of transit agencies. By integrating transit with bicycles, transit agencies can expand their service area, attract new patrons, and stimulate more frequent use of transit services with relatively small investment and minimal administration. However, with buses being able to transport only two or three bicycles at a time, the sustained growth of the programs is limited. This study is intended to help transit agencies by suggesting what kinds of additional actions can be implemented to maintain and improve the benefits of investments in BOB programs. Research Objectives While the initial goal of this return on investment study was to conduct a quantitative cost-benefit analysis, the lack of accurate cost data, the qualitative nature of many of the returns, and the needs and wants of the transit agencies dictated a shift in the research. Initial discussions with transit agencies revealed that BOB programs require minimal investment, most of which occurred in the past, and that a quantitative analysis would not be that useful to the transit agencies. There was a much greater interest in measuring the returns or benefits of BOB programs, learning about the policies on key BOB issues adopted by their peers, and identifying strategies to mitigate rack-capacity limitations. Therefore, the primary purpose of this research was to examine the return on transit agencies’ investments in BOB programs, and determine what additional investments could be made to increase returns and overcome rack capacity limitations. The key research questions of the study were:
1. What kind of investments have transit agencies made implementing and maintaining BOB programs?
2. What has been the impact of investments in terms of service area expansion, BOB boardings, new riders, and increased transit use?
3. What are current transit agency policies on key issues, such as bikes-in-bus (that is allowing patrons to bring their bicycles in to the bus when racks are full), permit requirements, and provision of bicycle parking?
4. Who are BOB users and how has the provision of access to transit via bicycles impacted their transportation choices and travel behavior?
5. What are some recommendations for how transit agencies can maintain and improve returns on their investments by overcoming rack capacity limitations and more effectively integrating bicycling and transit?
v

Research Methodology The methodology developed to answer the research questions included a review of the literature and previous research, and the surveying of both transit agencies and BOB users. The data collected from transit agencies and BOB users was used to quantify and qualify the investments and benefits of integrating bicycling and transit, and to develop a set of recommendations for how transit agencies can improve their return on investment. The research focuses on Florida transit agencies with four outside agencies also included, and on bus programs as opposed to bikes-on-rail programs. The review of the literature and previous research was used to identify the wide range of costs and benefits of BOB programs, highlight the key BOB issues for transit agencies and BOB users, and aid in the development of the transit agency and BOB user surveys. During survey development, transit agencies were also asked what kinds of information they would like to receive about other agencies and their BOB programs. The three most popular requests were Bikes-in-Bus (BIB) policies and experiences, use of three-bike rack systems, and BOB’s impact on insurance claims and incidences. Other information requested included data on boardings, and impacts on dwell time and route delay. BOB Costs and Benefits A wide range of possible BOB costs and benefits were identified. While some of the costs and benefits are quantifiable, many others are difficult to measure or qualitative in nature. The transit agency and BOB user surveys were designed to collect data on the possible BOB costs and benefits. Executive Summary Table1 (ES. 1) lists the BOB costs and benefits identified. Table ES.1: Possible BOB Costs and Benefits BOB Investments or Costs BOB Returns or Benefits Capital cost of purchasing racks BOB ridership/boardings Maintenance cost of repairing/replacing racks Expansion of transit service area Administrative cost of day-to-day operations Attraction of new transit riders Marketing costs of program More frequent use of transit Insurance claims and incidents Bicycle locker rental fees Permitting process and training Improved bicycle safety Funding of bicycle facilities to access transit Reduction in traffic congestion Provision of bicycle parking Improved air quality Bicycles abandoned on racks Promotion of healthy lifestyle Route delay and increased dwell time Improved transit agency image Impact of rack capacity limitations Increased mobility
vi

Ideally, the research would have entailed quantifying the actual monetary costs transit agencies have made and comparing them against returns in the form of ridership. The lack of data made quantifying actual monetary investments and comparing them to returns difficult. While some transit agencies can provide figures on capital funds spent purchasing bike racks for their vehicles or installing bicycle parking racks at transfer centers, other costs are not tracked and are difficult to estimate. Furthermore, many transit agencies do not track the most measurable of returns, BOB boardings, or have only recently started. Key BOB Issues The literature review and initial discussions with participating transit agencies also identified a set of key BOB issues. The key BOB issues included:
• The extent of expansion of service area • Quantification of the ability to attract new riders • Impact on route delay • Policies governing and experience with bicycles brought inside the bus • Permitting and training requirements • Provision of bicycle parking • Maintenance of rack system • Process to handle the abandonment of bicycles on the bus racks • Impact of BOB on insurance claims and incidents • The frequency and cost of racks being damaged and replaced
The initial discussions with transit agencies also identified two possible BOB performance measures that transit agencies can track to evaluate their BOB program. The two performance measures identified were total BOB passenger trips and percent of total unlinked passenger trips that are BOB boardings/trips. Transit Agency Survey A total of 14 Florida transit agencies and four outside agencies agreed to participate in the study. Table ES.2 lists the agencies that were surveyed.
vii

Table ES.2: Participating Transit Agencies FLORIDA AGENCIES LOCATION Broward County Mass Transit (BCT) Broward County Central Florida Regional Transit Authority (LYNX) Orlando, Orange, and Osceola Counties Citrus Connection/Lakeland Area Mass Transit (Citrus) Citrus County/Lakeland area Hillsborough Area Regional Transit (HART) Hillsborough County Jacksonville Transportation Authority (JTA) City of Jacksonville-Duval County Miami-Dade Transit (MDT) Miami-Dade County Palm Beach County Transportation Agency (PalmTran) Palm Beach County Pinellas Suncoast Transit Authority (PSTA) Pinellas County Regional Transit System (RTS) City of Gainesville Space Coast Area Transit (Space Coast) Brevard County Tallahassee Transit (TalTran) City of Tallahassee NON-FLORIDA AGENCIES LOCATION City of Phoenix Public Transit (Phoenix) Phoenix, AZ King County Metro (Metro) King County, WA Lane Transit District (Lane) Eugene, OR Valley Transportation Authority (VTA) Santa Clara, CA The transit agency survey was designed to collect data on the history and characteristics of each BOB program, BOB program costs, BOB policies and key issues, and BOB program benefits. The key findings from the transit agency survey are provided below.
Program History and Characteristics
Most of the agencies surveyed started their programs between 1994 and 1998 and have equipped 100 percent of their buses with bike racks, except MDT (75% equipped) and LYNX (96% equipped).
Three agencies surveyed, MDT, Metro, and PSTA, have begun to use three-bike capacity racks to alleviate rack capacity limitations and expand BOB boardings.
Of those surveyed, just two Florida agencies still require permits to use the service, PSTA and HART. In the past, MDT also required a permit but has recently abandoned the requirement to increase access. Since abandoning the permit, MDT has not encountered any problems due to the policy change.
Four agencies, Lane Transit, Space Coast, VTA, and Phoenix allow BOB patrons to bring their bicycles on board when racks are full based on bus operator discretion and availability of the wheelchair area. None of these agencies have modified the interior of their buses to accommodate bikes on board. None of the agencies reported any problems in regard to this policy.
viii

BOB Program Costs The 13 agencies that reported capital costs spent a combined total of
approximately $3 million purchasing bike racks for 4,799 buses. Of the nine Florida agencies that reported capital costs, approximately $967,000 was spent equipping 2,084 buses with bike racks at an average cost of $465 per rack.
The 12 agencies that reported data on having to replace damaged racks replaced a total of 665 racks, representing a replacement rate of 13%. The replacement rate for Florida agencies was lower at 9.6%.
Transit agencies, in general, perceive maintenance and administrative costs associated with operating their BOB programs as a minimal part of system-wide operations.
Total BOB investment could only be determined for three agencies, Phoenix, HART and PSTA, because of the availability of data. It is estimated that Phoenix has invested approximately $1.65 million over 15 years; HART has invested approximately $584,000 over 11 years; and PSTA has invested approximately $464,000 over 7 years.
Despite reports of several thousand BOB boardings per month by many of the agencies, investment in bicycle parking facilities is low. Investing in bicycle parking could be a key strategy for retaining current users by promoting a bikes-to-bus strategy in which patrons bicycle to transit stops and park their bicycles before boarding.
Key BOB Issues and Policies
Of the 15 agencies, 11 reported experiencing problems due to rack capacity limitations. In response to this problem, four agencies allow bicycles on board when racks are full and space is available in the wheelchair area. Four other agencies have begun to install three-bike capacity racks on their most popular routes with the goal of equipping their entire fleet with them. In addition, the BOB user survey showed that approximately 25 percent of BOB commuters reported racks often being full and six percent reported racks being full all the time.
Ten of the agencies reported having problems with bicycles abandoned on bus racks and many have had to develop special processes for collecting and eventually donating unclaimed bicycles.
ix

BOB Program Benefits Of the ten agencies that track BOB boardings, nine were able to provide
estimates on the number of monthly BOB boardings.
The number of monthly boardings ranged from 900 to over 65,000.
For the five Florida agencies that provided data, the average number of BOB boardings for 2004 was 11,200.
BOB User Survey Three Florida transit agencies, MDT, PSTA, and HART provided BOB permit holder databases that were used to draw a random sample of BOB users to receive a survey. A total of 220 completed surveys were received. The survey collected data on the use of BOB, travel behavior, and demographics. BOB Travel Behavior
Approximately 70 percent of BOB users surveyed have been combining bicycling and transit for over a year, and almost 33 percent have been doing so for over three years.
It is estimated that 65 percent of patrons surveyed use BOB services more than four days per week on average.
Over 40 percent of BOB users reported 11 or more boardings per week.
One in four BOB users is new to transit, and of those new transit riders, over 80 percent reported that the ability to access transit by bicycle was the reason for the switch.
The three-quarters of BOB patrons that were not new to transit reported increased transit use after they started using BOB services.
BOB and Work Trips
Approximately 72 percent of BOB patrons use the service to commute to work.
Of those that use BOB to access jobs over 83 percent use BOB four or more days per week.
Approximately 61 percent of BOB work commuters bicycle more than one mile to access transit but 80 percent travel less than one mile after getting off the bus and bicycling to their place of work.
x

Of those that commute to work using BOB, 60 percent reported also using BOB for non-work trips as well.
Rack Capacity Limitations
Approximately 26 percent of BOB users, especially those that commute to work by BOB, indicated that their bus arriving at their stops with the rack full was a problem.
While only eight percent indicated that bicycle parking racks were available at the bus stops they use, 22 percent reported that they would lock up their bicycle at the stop if parking racks were available, and the bus arrived with full racks. Additionally, 43 percent stated they would park their bicycles at a bus stop if they could not afford to wait for the next bus to arrive. The longer headway, or time between buses, the more important access to bicycle parking becomes.
Recommended Changes to BOB
In general, BOB users desire shorter headways, safer bicycling conditions, the ability to bring bikes on board, and more bicycle parking.
Research Findings BOB Costs The first research question asked what kind of investments transit agencies have made implementing and maintaining BOB programs. The primary investment that transit agencies make is the purchase of bicycle racks that are mounted on the front of buses. When transit agencies first implemented their BOB programs, capital funds, grant money, or operating funds were used to retrofit buses with racks. According to the survey, the nine Florida agencies that reported capital costs spent approximately $1 million dollars equipping over 2000 buses, at approximately $500 per rack. In comparison to the cost of purchasing new buses, this is a small investment. As the LYNX contact stated, the agency could retrofit every bus with racks for the price of one-third of a new bus. Transit agencies also invest in the maintenance of BOB programs due to the need to repair and replace damaged and worn racks. According to the survey results, almost ten percent of racks installed have been replaced. Transit agencies also make small investments in regard to the administering and marketing of the programs. According to the results, most agencies estimate that administering their program is about a quarter of the effort of one their staff members or 0.25 full time equivalence (FTE). RTS estimated that over the lifetime of their BOB program they have spent less than $2500 on marketing the service.
xi

Even though bicycle parking is one of the most important amenities for bicycle commuters, transit agencies that do not operate multi-modal rail and bus stations have invested very little in bicycle parking. HART and PSTA, the only Florida agencies to provide bicycle parking cost estimates, have spent only $10,000 combined on bicycle parking. The provision of bicycle parking is an important strategy in overcoming rack capacity limitations and encouraging bicycle-to-transit trips. A bicycle-to-transit trip entails bicycling to a bus stop or transfer station, leaving the bicycle parked, and boarding the bus, much like a park-and-ride concept but for bicycles. In all, transit agencies have invested very little into their BOB programs compared to the returns they receive and the costs of other transit agency initiatives. BOB Benefits The second research question asked about the return on investments in terms of service area expansion, BOB boardings, new riders, and increased transit use. Transit agencies have received good returns on their investments in integrating bicycling and transit. The survey results indicate that BOB programs provide a long-term and sustainable form of transportation for patrons, particularly patrons with low-income and limited access to automobiles. Approximately 70 percent of BOB users surveyed have been using the program for over a year, and a third of users have been combining bicycling and transit for over three years. BOB users are regular users of transit, with 65 percent using it four days or more and over 40 percent making over 10 trips per week on average. BOB programs have also attracted new transit riders. Approximately 24 percent of users surveyed reported that they were new to transit. BOB programs also provide a multi-modal commute option. Almost three-quarters of respondents use BOB to commute to work. Of those that commute to work, over 60 percent bicycle more than a mile to access transit, providing a clear validation of how BOB programs can expand the transit service area. According to the survey results, transit agencies can also claim that bicycle access to transit encourages increased use of transit. Of those users that commute to work via BOB, 60 percent stated they started to use the service for non-work trips as well. While BOB boardings remain a small portion of total unlinked passenger trips for even the largest providers of BOB trips, the total impact of BOB programs is far-reaching and over time has the potential for substantial societal benefits in terms of health, traffic congestion, and improving air quality.
xii

Key BOB Policies and Issues As BOB programs become more popular, the limits of the rack capacity begin to show. Buses begin arriving at a BOB patron’s stop with the racks already full. The transit agencies that are facing rack capacity limitations are responding in three ways. One set of agencies has started to purchase three-bike capacity racks, installing them on their most popular routes first. Eventually, these agencies plan to install them on all buses. However, it is important to mention that King County Metro’s evaluation of one manufacturer’s three-bike rack called for modifications due to excessive weight despite being very popular among their BOB patrons. The second set of agencies has adopted policies that allow patrons to bring their bicycles on board when the racks are full, and when the wheelchair area is vacant. While some agencies expressed concern with allowing bicycles in the bus due to safety and liability concerns, the agencies that have experimented with or adopted the policy did not report any problems or incidences. These agencies also did not report the need for restrictions on the time of day or day of week for bikes-in-bus (BIB). The third set has recognized the problem but has not taken any steps at the time they were surveyed. The question of whether or not to require a permit is another issue to which agencies are seeking guidance. Only two of the agencies surveyed, HART and PSTA, currently require permits, and MDT recently abandoned their requirement. Since abandoning the permit, MDT has not experienced any negative impacts of their decision. While permits can limit liability and provide a means to educate patrons, permit requirements also restrict access to transit service. Agencies without permits also believe that the rack system is so easy to use that requiring patrons to go through a training process is unnecessary. Nationally, the trend is moving toward abandoning permits and in general many of the claims that support the policy of requiring permits are undermined by the actual experiences of transit agencies without permit requirements. As previously stated, the lack of investment in secure bicycle parking through both racks and lockers is limiting the ability of transit agencies to improve bicycle access to their services. The transit agency surveys also shed light on two other issues of interest. In regard to the problem of bicycles abandoned on racks, most transit agencies are taking a reactive approach. While most have set up a process to collect, store, and eventually donate the unclaimed bicycles, few reported taking proactive steps. While it may not be possible for the transit agency to stop people from forgetting their bicycles, efforts related to bus operator training may be one potential avenue. If they have not done so already, transit agencies should meet with all local law enforcement agencies to inform them of any problem and set up a process to work together to reunite victims of the theft with their bicycles and redistribute unclaimed bicycles.
xiii

Transit agencies were also interested in whether or not insurance claims or incidents related to BOB had been reported. However, only one agency reported an impact on insurance. LYNX reported that “while there have been no significant or quantitative monetary impacts to our self insurance program, the use of bike racks has created a new list of potential claims and claimant interaction.” BOB Users Characteristics The BOB user survey shed light on who typically uses the service. The demographic data that was collected suggests that BOB users are usually males who earn under $30,000 or even under $20,000 a year. Hispanics and African-Americans exist in higher proportions in the BOB user population than compared to the general public. BOB users are also more likely to have limited access to a car with over 45 percent coming from households without cars. In addition, 35 percent of BOB users do not hold a valid driver’s license. This type of demographic information can be very useful in the design of social marketing campaigns desired to target special segments. For example, transit agencies could market the BOB program at traffic court, in which any person that has their driver’s license taken away or suspended is provided with information on the BOB program, bus schedules, a free one-month bus pass, and perhaps even a bicycle and helmet to provide them with a viable transportation option. Bicycles that are abandoned on racks and unclaimed could provide a good source of bicycles for such a program. Recommendations to Improve BOB Benefits The last research question called for recommendations on how transit agencies can improve the return on their investment. Discussions with transit agency contacts and the results of both surveys have provided a variety of recommendations that could potentially improve returns and mitigate rack capacity limitations. Collect BOB Boarding Data and Track Performance Measures First and foremost, all transit agencies should collect BOB boarding data. Agencies with electronic fare-boxes should program a key to record BOB trips. Data can show the value of a program and as a result, provide support for funding requests and service improvements. Table ES.3 below illustrates how easily BOB performance measures can be presented, while providing a powerful statement. Clearly both PSTA and HART have demonstrated increased number of BOB boardings and have increased the BOB share of unlinked passenger trips.
xiv

Table ES.3: BOB Performance Measures PSTA 2000 2001 2002 2003 Annual BOB Boardings
45,600 111,480 133,800 152,400
Annual Unlinked Passenger Trips
9,360,135 9,372,832 10,118,769 9,487,531
BOB Share of Annual Unlinked Passenger Trips 0.49% 1.19% 1.32% 1.61%HART 2000 2001 2002 2003 Annual BOB Boardings
54,000 55,200 57,600 68,400
Annual Unlinked Passenger Trips
9,219,738 9,761,011 9,390,575 9,185,410
BOB Share of Annual Unlinked Passenger Trips
0.59% 0.57% 0.61% 0.74%
TalTran 2000 2001 2002 2003 Annual BOB Boardings
15,708 12,636 11,568 10,860
Annual Unlinked Passenger Trips
3,922,150 3,934,447 4,140,250 4,372,762
BOB Share of Annual Unlinked Passenger Trips
0.40% 0.32% 0.28% 0.25%
Survey BOB Users Transit agencies should also periodically survey their BOB patrons. Often the best way to discover innovative ways of improving a service is by asking the users. If permits are required, agencies already have a database from which to survey. If no database is maintained, on-board surveys are an equally good method of gathering data. By combining electronically collected BOB boardings and periodic user surveys, transit agency planners can pinpoint where modifications are needed or perhaps on which routes three-bike capacity racks are needed. In terms of improving the programs, BOB users suggested more frequent bus service, safer access to transit via bike lanes and/or bike trails, allowing bicycles in the buses, and more bicycle parking. Increase Rack Capacity Transit agencies that are suffering from rack capacity limitations should consider trying out three-bike capacity racks. Before making a large investment, agencies may want to consider purchasing a small number of racks. This way the new racks can be installed on the most popular routes and after a specified time, an evaluation can be conducted that gathers information from drivers, maintenance staff, and patrons.
xv

Adoption of Bike-in-Bus Policy Some agencies may also want to consider experimenting with a bikes-in-bus policy. Despite efforts by researchers to find evidence of incidences related to bicycles being inside the bus, only a handful of minor claims have been found. Any changes to bikes-in-bus policies should only be made after a trial period and a thorough evaluation of the policy change. Prior to the trial period, specific policies should be explicitly outlined and bus operators should be trained to recognize the conditions when a patron is allowed to bring their bicycle on board. Patrons should also be alerted of the experiment and that the policy is temporary until completion of the evaluation. Transit agencies should also adopt a policy allowing folding bicycles on board at all times since they are typically no bigger than a stroller and can be easily secured by the owner. Bike-to-Bus Strategy One way to mitigate rack capacity limitations is to promote the bike-to-bus (BTB) strategy common in European nations that encourages patrons to bicycle to their bus stop, but leave their bicycle parked at the bus stop or transfer center. Perhaps the most important investment that transit agencies can make to implement this strategy is to provide more bicycle parking (bicycle parking racks and/or bicycle lockers) and incorporate bicycle racks into standard bus stop and transfer center designs. Transit agencies should also investigate the possibility of opening a Bikestation® or a valet bicycle parking center.1 In recent years, Bikestations® have opened up in many locations (primarily in the Western United States and by transit agencies that offer rail service) offering valet bicycle parking and a host of other amenities such as bicycle repair, showers, and changing facilities. By providing bicycle parking racks at bus stops, BOB users that encounter a full rack on the bus at least have the option of locking their bicycle and boarding the bus. The BOB users survey did indicate that 22 percent of users would park the bicycle at bus stops any time the racks were full, and an additional 43 percent stated that they would lock up their bike if they could not afford to miss the bus for whatever reason. While the average time required to lock up a bicycle on a parking rack is unknown, the process is not likely to cause any significant increase in dwell time. The BOB user survey results also indicated that approximately 61 percent of BOB work commuters bicycle more than one mile to access transit, but 80 percent travel less than one mile and almost half travel a quarter-mile or less after getting off the bus and bicycling to their place of work. This means that there are many BOB users that may only need their bicycle on one end of their commute, and therefore could switch from BOB to bike-to-bus if necessary. 1 Transit agencies should consult www.bikestation.org to begin their inquiry into valet bicycle parking centers.
xvi

Figure ES.1: Bicycling to access buses is a common practice through the Europe.
Courtesy of John Pucher, Rutgers University. Agencies should also install both bicycle parking racks and bicycle lockers at transfer centers, major bus stations, and park-n-ride lots. Transit agencies that invest in bicycle parking and provide a large supply of quality racks and lockers that are placed in the right locations will, it is predicted, see bikes-to-transit trips eclipse bikes-on-bus boardings.
xvii

Table of Contents Executive Summary
v
Chapter 1 Introduction and Purpose
1
Chapter 2 Research Methodology
3
Chapter 3 Literature Review and Identification of Key BOB Issues
19
Chapter 4 Transit Agency Results
30
Chapter 5 BOB User Survey Results
43
Chapter 6 Examination of BOB Costs and Returns and Recommendations
56
Appendix A References
64
Appendix B Transit Agency and Contact Letter and Informed Consent Form
65
Appendix C BOB Transit Survey
67
Appendix D BOB User Survey 75
List of Figures
Figure ES.1 Bicycling to access buses is a common practice through the
Europe xvii
Figure 1: Bicycle racks mounted on the front of buses have provided an innovative way to integrate bicycling and transit.
1
Figure 2 Comparison of Obesity and Bicycling/Walking/Transit Trips by Country
22
Figure 3. People typically become regular users of transit when they discover how to integrate bicycling and transit.
46
Figure 4: When racks are full, patrons who cannot wait for the next bus will park their bicycle at the stop
50
Figure 5: The Bikestation® of Downtown Berkeley, California provides valet bicycle parking for the local BART rail station
61
Figure 6: Bicycling to access buses is a common practice through the Europe
62
xviii
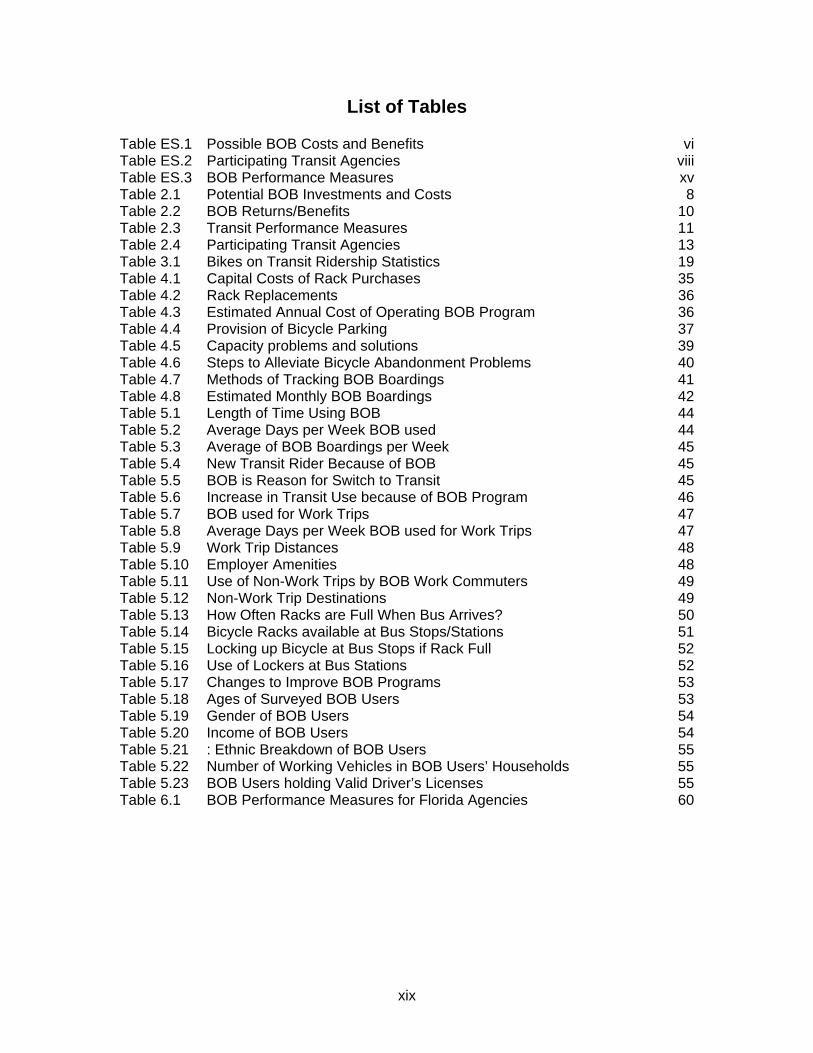
List of Tables
Table ES.1 Possible BOB Costs and Benefits viTable ES.2 Participating Transit Agencies viiiTable ES.3 BOB Performance Measures xvTable 2.1 Potential BOB Investments and Costs 8Table 2.2 BOB Returns/Benefits 10Table 2.3 Transit Performance Measures 11Table 2.4 Participating Transit Agencies 13Table 3.1 Bikes on Transit Ridership Statistics 19Table 4.1 Capital Costs of Rack Purchases 35Table 4.2 Rack Replacements 36Table 4.3 Estimated Annual Cost of Operating BOB Program 36Table 4.4 Provision of Bicycle Parking 37Table 4.5 Capacity problems and solutions 39Table 4.6 Steps to Alleviate Bicycle Abandonment Problems 40Table 4.7 Methods of Tracking BOB Boardings 41Table 4.8 Estimated Monthly BOB Boardings 42Table 5.1 Length of Time Using BOB 44Table 5.2 Average Days per Week BOB used 44Table 5.3 Average of BOB Boardings per Week 45Table 5.4 New Transit Rider Because of BOB 45Table 5.5 BOB is Reason for Switch to Transit 45Table 5.6 Increase in Transit Use because of BOB Program 46Table 5.7 BOB used for Work Trips 47Table 5.8 Average Days per Week BOB used for Work Trips 47Table 5.9 Work Trip Distances 48Table 5.10 Employer Amenities 48Table 5.11 Use of Non-Work Trips by BOB Work Commuters 49Table 5.12 Non-Work Trip Destinations 49Table 5.13 How Often Racks are Full When Bus Arrives? 50Table 5.14 Bicycle Racks available at Bus Stops/Stations 51Table 5.15 Locking up Bicycle at Bus Stops if Rack Full 52Table 5.16 Use of Lockers at Bus Stations 52Table 5.17 Changes to Improve BOB Programs 53Table 5.18 Ages of Surveyed BOB Users 53Table 5.19 Gender of BOB Users 54Table 5.20 Income of BOB Users 54Table 5.21 : Ethnic Breakdown of BOB Users 55Table 5.22 Number of Working Vehicles in BOB Users’ Households 55Table 5.23 BOB Users holding Valid Driver’s Licenses 55Table 6.1 BOB Performance Measures for Florida Agencies 60
xix

CHAPTER 1: Introduction and Purpose Across the United States, bikes-on-bus (BOB) programs have provided an innovative way of linking bicycling and transit and improving mobility. The central feature of BOB programs is a rack to carry bicycles mounted to the front of buses. According to BikeMap, over 40,000 buses (of the 75,000 active buses) of over 300 transit agencies in the United States are equipped with bike racks, and an estimated 670,000 bikes-on-transit (includes both bus and rail) trips are provided each month as of 2002.2 BOB programs were first implemented in the 1980s, thus, its penetration of the transit industry has been dramatic. Figure 1: Bicycle racks mounted on the front of buses have provided an innovative way to integrate bicycling and transit.
Source: Gena Torres, Hillsborough County MPO Bike/Ped Coordinator. However, these programs are limited by their own success since the vast majority of rack systems used by transit agencies can carry only two bicycles. As
2 BikeMap’s website (www.bikemap.com) contains a variety of data on programs that link bicycling and transit includes a database of transit agencies with bikes-on-bus and bikes-on-rail programs, links to BOB research, and bicycle maps.
1

the number of BOB users increase, so too does the problem of bicyclists not being able to use a system they have come to depend on because the racks are full when the bus arrives at their stop. Therefore, the purpose of this research was to examine the return on transit agencies’ investments in BOB programs, and determine what additional investments can be made to increase returns and overcome rack capacity limitations. This research is also, in part, a response to the Transit Cooperative Research Program’s (TCRP) call for further research on methods for program evaluation to quantify benefits, costs, and measures of use in their 1994 synthesis, Integrating Bicycles and Transit.3
As a result, the key research questions of the study were:
1. What kind of investments have transit agencies made implementing and maintaining BOB programs?
2. What has been the impact of investments in terms of service area expansion, BOB boardings, new riders, and increased transit use?
3. What are current transit agency policies on key issues, such as bikes-in-bus (that is allowing patrons to bring their bicycles in to the bus when racks are full), permit requirements, and provision of bicycle parking?
4. Who are BOB users and how has the provision of access to transit via bicycles impacted their transportation choices and travel behavior?
5. What are some recommendations for how transit agencies can maintain and improve returns on their investments by overcoming rack capacity limitations and more effectively integrating bicycling and transit?
To answer these questions, surveys were conducted to collect data from transit agencies and BOB users to investigate the investments and returns of BOB programs. This research is intended to help transit agencies by suggesting what kinds of additional actions can be implemented to maintain and improve the benefits of investments in BOB programs.
3 Doolittle J. T., J. and E.K. Porter (1994) Integration of Bicycles and Transit. Transportation Research Board National Research Council: Washington, D.C. (p.22)
2

CHAPTER 2: Research Methodology The methodology developed to answer the research questions included a review of the literature and previous research, and the surveying of both transit agencies and BOB users. The data collected from transit agencies and BOB users was used to quantify and qualify the investments and returns of integrating bicycling and transit, and to develop a set of recommendations for how transit agencies can improve their return on investment. The surveying of transit agencies and BOB users began in June of 2004 and was completed in December of 2004. The research focused on Florida transit agencies with four agencies from other states also included. The focus of this research is on bus programs as opposed to bikes-on-rail programs. Review of Literature and Identification of Key BOB Issues A literature review was conducted to outline the benefits of transit and bicycle integration, examine the results of previous BOB research, and identify key issues that should be investigated to analyze the benefits of investment. The literature review combined with preliminary discussions with participating agencies also guided the development of the transit agency and BOB user surveys. The primary documents examined in the literature review included:
• Doolittle, Jr., John T. and Ellen Kret Porter. (1994) Integration of Bicycles and Transit. Transit Cooperative Research Project. Synthesis of Transit Practice 4. National Academy Press: Washington D.C.
• Federal Transit Administration. (1998) Bicycle and Transit: A Partnership that Works. Federal Transit Administration: Washington D.C.
• National Bicycle and Walking Study. (1992) Case Study No. 9: Linking Bicycle/Pedestrian Facilities with Transit. Federal Highway Administration FHWA-PD-93012: Washington D.C.
• Replogle, M.A. (1992) Bicycle Access to Public Transportation: Learning from Aboard. Institute for Transportation Engineers Journal, December 1992.
• Replogle, M.A. (1983) Bicycles and Public Transportation: New Links to Suburban Transit Markets. Bicycle Federation. Washington D.C.
3

Based on research conducted during the development of the project scope, a list of key BOB issues was created. This list was later expanded based on the review of the literature, discussions with participating transit agency representatives, and FDOT staff. The initial key issues included:
• Extent of expansion of service area • Quantification of the ability to attract new riders • Impact on route delay • Policies governing allowing bikes in the bus • Permitting/training requirements • Provision of bicycle parking and concerns with bike theft • Maintenance of rack systems
Some of the additional issues added later in the project included:
• Handling the abandonment of bicycles on racks • The impact of BOB programs on insurance premiums • The frequency/cost of racks being damaged and replaced
The results of the literature review and discussion of key BOB issues are found in Chapter 3. Examining the Return on Investment of BOB Programs While the ideal research would entail quantifying the actual monetary investments transit agencies have made in implementing BOB programs and comparing it against returns in the form of ridership, the real conditions make such quantification a difficult, if not impossible task. The primary condition that makes quantifying actual monetary investments and comparing it to quantifiable returns difficult is the lack of data. While some transit agencies can provide figures on capital funds spent purchasing bike racks for their vehicles or installing bicycle parking racks at transfer centers, other costs are not tracked and are difficult to estimate. After preliminary discussions with transit agency contacts, it was discovered that they would not be able to provide reasonable estimates of maintenance or administrative costs per year or over the life of the program. Furthermore, many transit agencies do not track even the most measurable of returns, BOB boardings, or have only recently started. A second consideration is that many of the beneficial returns of BOB programs are not quantifiable. These include increased mobility and safety, and the long-term health benefits of bicycling. A third consideration governing the research design was the budget constraints that limited sample sizes, particularly of transit agencies. The sample is not large enough to enable a rigorous statistical analysis of costs and benefits. Despite these conditions, it was decided that the effort would still be to collect quantifiable data on costs and benefits, but recognize that the true value of the research would be in examining the transit agencies’ strategies and policies and
4

recommending ways in which transit agencies can improve on investments already made. The reason behind the shift in the research approach is that participating transit agencies were not interested in quantifying their investments for they did not see much value in the endeavor. For the participating transit agencies, the primary investment, purchasing bike racks to retrofit buses, was made years ago, and any new buses that are purchased come with racks as a optional feature. Currently, the investment made in terms of maintaining racks and administering or marketing the program is minimal and considered part of day-to-day operations. The participating agencies were more interested in identifying ways to increase the return on investments already made; i.e. to increase ridership. One way to increase BOB ridership is for transit agencies to overcome or sidestep the limitations of rack capacity. The transit agencies were also interested in learning from the experience of their peers and the impacts of alternative policies and strategies. However, it is important to note that transit agencies were interested in quantifying the benefits of integrating bicycles and transit. They were also interested in identifying a performance measure, or set of performance measures, to track their BOB programs over time. As a result, the examination of the agencies’ return on their investment in BOB programs and the development of recommendations required several steps:
1. Identify BOB investments and how they can be measured 2. Identify BOB returns and how they can be measured 3. Identify possible BOB performance measures that transit agencies
can use to track their programs 4. Develop transit agencies and BOB users survey instruments to
gather data on investments and returns 5. Investigate current policies and strategies used by transit agencies
so that recommendations can be developed to improve returns Identification of BOB Investments/Costs The first step was to compile a list of all BOB costs, both those that are measurable and those that are qualitative in nature. The capital costs associated with purchasing BOB racks are the primary investment transit agencies make. This cost can be measured by the amount of money spent on both initial and replacement racks per year and over the lifetime of the program. However, since new buses typically come with racks, capital costs may only reflect the funds spent on retrofitting older buses. Transit agencies used a variety of funding sources to retrofit buses with racks, including special bike rack grants from FDOT, Congestion Mitigation and Air Quality (CMAQ) grants, and Federal Transit Administration Section 5307 funds. Related to capital costs are the maintenance costs. For this analysis, maintenance costs are defined to include the labor cost of installing and repairing BOB racks. Since this cost would be difficult to estimate, transit agencies’ representatives suggested collecting maintenance costs in terms of labor FTE.
5

Like maintenance costs, transit agencies also stated it would be difficult to estimate annual labor costs associated with administering BOB programs. It was determined that at a minimum, transit agencies could estimate the level of effort in terms of FTE for staff in charge of the BOB programs. One of the more quantifiable costs of BOB programs is marketing expenses, such as the cost to design and print brochures, create posters, or film a commercial. Some transit agencies market their BOB programs more aggressively than others and, in turn, are making greater investments. In order to simplify the identification of BOB costs, transit agencies were given an option in the survey of providing an estimate of overall annual costs to run their BOB program with or without capital costs included. During scope development and preliminary research, transit agency planners and transit researchers were contacted for their opinions on BOB costs and benefits. One concern shared by many was whether the implementation of a BOB program increased insurance premiums or damage settlements due to any real or perceived increase in accidents/incidents. According to the Federal Highway Administration’s (FHWA) Integration of Bicycles and Transit online report, “little evidence can be found of any bicycle or bus damage or passenger injury related to front or rear racks or on-board access.”4
One way transit agencies have mitigated risk is by requiring permits, a process that trains, informs and educates BOB patrons. While the majority of transit agencies (approximately 75 percent according to BikeMap’s database5) have never required permits to use BOB, and some have abandoned the requirement, there are some that maintain the policy for various reasons, such as liability. While the cost may be small compared to capital costs, implementing and maintaining a permit process does incur costs; from producing videos on the proper way to use the rack to maintaining a database and issuing permit cards. Another cost that is more easily quantified is the transit agencies’ purchase of bicycle parking racks and/or bicycle lockers for bus stops and transfer centers. A lack of secure bicycle parking is often cited as a barrier to bicycle commuting. Some transit agencies recognize this and go to great lengths to provide adequate bicycle parking facilities. Bicycle parking racks and lockers are not the only facilities that transit agencies provide for bicyclists. Since transit agencies have a vested interest in making sure patrons arrive at the bus safely, they often fund or help fund the construction of bicycle and pedestrian facilities, such as bike paths and sidewalks. Like the cost of providing bicycle parking, this cost is also quantifiable and could be collected from transit agencies. 4 Source: Federal Highway Administration: http://safety.fhwa.dot.gov/ped_bike/docs/bike_bus.pdf 5 BikeMaps’s database is located at: http://www.bikemap.com/transit/rstats.htm
6

Two of the more intangible costs related to BOB programs are the costs of route delay from loading/unloading bicycles and handling bicycles abandoned on racks. The question of whether or not the loading and unloading of bicycles causes route delay was frequently cited during preliminary discussions with transit agencies. Sportworks®, the manufacturer of the majority of bus-bike racks used in the United States, has conducted many tests to determine how quickly bicycles can be loaded and unloaded and how easily the steps are learned. According to Sportworks®, individuals “can load or unload the bicycle from our rack in less than ten seconds” and “some tests have proven an average load/unload time to be approximately seven seconds.”6 Transit agencies contacted prior to and during the study wanted to know if other agencies have had to modify routes because of heavy BOB usage, and what the impact was on other patrons. Transit agency contacts were also interested to know if other agencies were facing the same problem of bicycles being left on the racks. Not only is this a problem because an abandoned bicycle left on the rack can deny a person waiting at the next stop an opportunity to use the rack, but also, some transit agencies are collecting dozens of bicycles at the end of the shift. These bicycles have to be moved, stored, and eventually donated or given away. Staff people also have to set up and maintain a process for returning bicycles to those that come to claim them. All of these issues cost time and money in the eyes of transit agencies. While some patrons may inadvertently forget their bicycle as they disembark, it is widely believed that many of them are stolen bicycles conveniently abandoned on the bus rack. The issue of abandoned bicycles filling up the racks on the bus also brings up a related, and perhaps more important issue, the issue of rack capacity limitations. The key question is how many people have given up using BOB, and perhaps transit all together, because the racks were always full when the bus arrived at their stop. This brings into question what BOB ridership would be without the rack capacity limitations. In other words, to what extent is bicycle-transit travel demand being limited by low capacity? This type of question is best answered by identifying the number of BOB permit holders that no longer use the program because of consistently full racks. Transit agencies can also identify peak BOB times when utilization is the highest, and then make efforts to encourage use during off peak times. Table 2.1 presents BOB costs, their definitions, and possible ways in which they could be measured.
6 Source: Sportworks: http://www.bicycleracks.com/sbfaq.asp
7

Table 2.1: Potential BOB Investments and Costs COSTS DEFINITION MEASURMENT Capital Cost of purchasing
bicycle racks Funds spent on initial and replacement purchase racks per year and over the lifetime of the program.
Maintenance Installation and repair of bicycle racks
Labor costs in FTE associated with replacing or repairing damaged racks
Administrative Labor and expenses for day to day operations
Labor and expenses as measured in FTE
Marketing Cost to market program to current and potential patrons
Costs related to the production of marketing materials, such as brochures or the maintenance of websites.
Insurance Changes to insurance premiums or cost of any settlements
Additional costs due to any increase to premiums or total cost of any settlements associated with BOB liability.
Permit/Training Cost of administering permit requirement
Labor, equipment, printing/distributing permits costs.
Funding for Bicycle Facilities
Funds for bicycle facilities to increase safe access
Total costs of all projects per year funded by transit agencies.
Bicycle Parking Cost to install bicycle parking facilities at transit stops/centers
Cost of racks/lockers plus labor costs to install and maintain.
Bikes left on racks Process to handle bikes abandoned on racks
Additional labor costs to handle abandoned bicycles at transit facilities.
Route Delay Increased dwell time at stops and lower on-time performance
Frequency of routes or schedules modifications due to route delay caused by BOB boardings, and cost to plan and design new schedules.
Identification of BOB Returns While transit agencies do spend money and time implementing and maintaining BOB programs, returns are manifested in a variety of forms. Preliminary research and contact with transit agencies have identified a number of quantitative and qualitative benefits from BOB programs. The primary return from the investment in BOB programs is ridership. As a result, both transit agency and BOB user surveys collected data on the number of BOB trips. However, it is not just ridership and the number of BOB boardings in which transit agencies are interested, but also the percent of BOB users that are new transit riders. The hypothesis related to new riders is that BOB programs provide access to transit for individuals who might otherwise not be able or willing to ride the bus due to the distance between their residence and the bus stop, or from the bus stop to their destination. By providing access to transit via the bicycle, the service area is expanded. When planning transit routes, a quarter mile buffer is typically used to delineate the service area. Therefore, it was important to collect data from BOB users on whether or not the ability to combine bicycling with the bus attracted new riders, and how far they are bicycling to and from transit stops. Access to transit by
8

bicycle can also enable patrons to avoid transfers and reduce overall trip time. Instead of walking to a transit stop that may be closer to their residence but requires making a transfer, BOB users can bicycle to a stop served by a different route which does not require a transfer. Even if the BOB user is not new to transit, BOB programs could potentially increase the use of transit. For example, the ability to use a bicycle on one end of a trip may allow a regular transit rider to make trips to new destinations. To examine this potential return, the BOB user survey asked respondents whether or not they take more transit trips since integrating the bicycle into their transit trips. A small source of revenue for some transit agencies are the fees collected from locker rentals. Some agencies provide lockers at major transit stations for an annual or monthly fee. While this may not be a large contribution to capital or operating costs, it does help offset the cost of providing secure bicycle parking. There are also several returns from investments in BOB programs that are more difficult to measure. For example, BOB programs can improve safety because instead of having to bicycle on high speed or high volume roads, a bicyclist can load their bike and take the bus thus avoiding a dangerous road segment.7 As a result, transit agencies can play a role in reducing the amount of bicycle injuries and fatalities by providing bicyclists a multi-modal option. Some other returns have societal benefits that are not readily apparent, such as the impact of BOB programs on reducing traffic congestion or improving air quality. It could also be argued that by switching from driving a car to using a bicycle and the bus, small but not meaningless reductions in emissions occur. The 1992 National Bicycling and Walking Study reported that switching to bicycling has important air quality benefits because emissions from short one or two mile trips are nearly as great as typical five to ten mile trips, and that approximately 90 percent of emissions occur in the first mile after a cold start.8 If such short trips could be made by bicycle rather than the automobile, emission reductions could be significant. Another difficult-to-measure return is related to health and the epidemics of childhood and adult obesity in the United States. Bicycling and walking are among the best ways in which a person can perform the daily exercise needed to stay reasonably fit. By providing a way to integrate buses and bicycles, transit agencies are helping to promote and encourage a healthier lifestyle. According to the Federal Transit Agency, “in many areas, increased investment in transit and bicycle facilities can help meet goals for cleaner, healthier air; less
7 National Bicycling and Walking Study (1992) Case Study No. 9: Linking Bicycle/Pedestrian Facilities with Transit. FHWA Publication No. FHWA-PD-93-012. Washington DC (p. 75-77) 8 National Bicycling and Walking Study (1992) ibid. (p. 84)
9

congested roadways; and more livable communities.”9 BOB programs can also, as a result, improve the image of the transit agency. Although this return is also difficult to quantify, transit agencies want to have a positive image in their community. Table 2.2 lists the potential BOB benefits along with definitions and possible ways to measure them. Table 2.2: BOB Returns/Benefits Benefits Definition How Measured? BOB Ridership Total number of BOB
boardings Percent of total unlinked passenger trips that are BOB users
Expansion of Service Area
Bicycle access to transit expands the service area buffer zone
Distance bicycled to and from transit stops to destinations
New Riders BOB users that were not using transit prior to program
Percent of BOB users new to transit and report switching to transit because of bicycle access
Frequency of Use
Increased frequency of transit use due to use of Bikes on Bus program
Percent of BOB users that have increased the number of transit trips since using program
Bicycle locker rental fees
Fees from lockers rented at transit stations
Money collected from the renting of bicycle lockers per year
Improved bicycle safety
BOB gives bicyclists the option of boarding the bus and avoiding dangerous corridors
Decrease in bicycle-car crashes on roads served by BOB transit, comparative crash rates
Reduced traffic congestion and improved air quality
Impact of switching to transit and bicycling from another mode
Number of vehicle trips reduced/eliminated by those BOB users that are new to transit
Health Bicycling provides the necessary daily exercise
Individual health improvements translated in societal level benefits
Transit agency image
Public perception of a transit agency’s multi-modal and environmental efforts
Changes in public perception of transit agency
Identifying BOB Performance Measures In order to develop a list of possible performance measures for BOB programs, it was important to examine what system-wide transit performance measures are currently used. System-wide transit measures are available from the National Transit Database as well as CUTR’s “Florida Transit Handbook”.10 Table 2.3 contains a full list of transit performance measures.
9 Federal Transit Administration, Bicycles and Transit, A Partnership that Works, 1999: www.fta.dot.gov/library/policy/bikes.pdf 10 Center for Urban Transportation Research (2003) Florida Transit Handbook. University of South Florida: Tampa, FL.
10

There are five primary transit performance measures identified in the handbook:
1. Passenger trips per revenue hour 2. Passenger trips per revenue mile 3. Operating expense per revenue hour 4. Operating expense per revenue mile 5. Operating expense per passenger trip
Table 2.3: Transit Performance Measures CATEGORY PERFORMANCE MEASURE General Information
Service area population Service area population density Operating expense Operating revenue
Service Supplied
Total annual revenue miles Total annual revenue hours Total revenue vehicles Peak vehicles Route miles
Service Usage
Annual passenger trips Annual passenger miles
Quality of Service
Average headway (minutes) Weekday span of Service (hours)
Cost Efficiency
Operating expense per revenue mile Operating expense per revenue hour Operating revenue per operating expense Passenger trip per employee FTE
Cost Effectiveness
Operating expense per passenger trip Operating expense per passenger mile Operating expense per capita Farebox recovery ratio Average fare
Service Effectiveness
Passenger trips per revenue mile Passenger trips per revenue hour Passenger trips per capita Revenue miles between safety incidents Revenue miles between failures
While TCRP Synthesis #4 entitled, Integration of Bicycling and Transit (1994) called for ways to measure costs and benefits, the key issue for this research is to identify a set of BOB performance measures that are useful to transit agencies. One set of possible performance measures can be created by translating the five primary transit performance measures listed above to take into account only BOB passenger trips and operating expenses, for example:
1. BOB passenger trips per revenue hour 2. BOB passenger trips per revenue mile 3. BOB operating expense per revenue hour 4. BOB operating expense per revenue mile 5. BOB operating expense per BOB passenger trip
11

However, data availability and the accuracy of annual BOB operation expenses may not make these measures feasible. Another possible set of performance measures could compare BOB capital costs to system-wide costs and BOB trips to system-wide passenger trips. These kinds of measures would indicate the proportional costs and benefits by comparing the BOB program to the system in general. The problem with comparing BOB capital costs to system-wide costs is that BOB capital costs took place in the past and therefore it would be difficult to measure against present-day annual capital costs. The latter measure, on the other hand, is a good candidate as transit agencies could track the proportion of BOB trips to total annual unlinked passenger trips. Discussions with both transit agency contacts identified that the expense of implementing and operating the BOB program was not a major concern. There was a general consensus that BOB programs have been extremely successful and the cost of operating them is minimal compared to other expenditures. The measures in which the transit agencies contacted for the survey were most interested were:
1. Total BOB passenger trips 2. Percent of total unlinked passenger trips that are BOB boardings
In addition to these two performance measures, transit agencies were interested in knowing what percent of their BOB users were new to transit, how far they bicycled before and after the transit portion of their trip, and whether or not BOB users increased their use of transit after they started combining bicycling with transit. Transit agencies’ contacts also reported that tracking BOB boardings by route and time would provide additional help in improving service. By knowing what routes and times are most popular with BOB users, agencies would be able to implement targeted improvements, such as adding three-capacity racks to specific routes or installing bicycle parking at bus stops or transfer stations with the most BOB activity. Of course, these kinds of data are most accurately collected by the agencies themselves and, as a result, were not collected for this study. Transit Agency Surveys After determining the return on investment goals and methodological process, and identifying BOB performance measures, the next step was to develop the transit agency and BOB user surveys that would collect the necessary data. As noted, the focus of the study was on Florida transit agencies and four outside agencies included in the sample population. Several steps were taken which ultimately led to the development of the transit agency survey instrument. First, researchers contacted transit agencies in Florida with bikes-on-bus programs by phone. After getting in contact with the
12

individual in charge of the BOB program, letters were sent to both that individual and the transit agency’s executive director. This letter explained the purpose of the project, the responsibilities of agencies that agree to participate, and included an informed consent document to be filled out and sent back to CUTR. The contact letter and informed consent documents are located in Appendix B. A total of 11 Florida agencies agreed to participate in the research project. Table 2.4 lists the agencies that agreed to participate. Using a database created by BikeMap (2002) which listed transit agencies and BOB statistics, the 12 non-Florida agencies with highest BOB boarding counts were selected to be contacted.11 Of the 12 non-Florida agencies, six initially agreed to participate, but only four completed the survey. Table 2.4 also lists the non-Florida agencies that agreed to participate and the abbreviations for the transit agencies used through out the report. Table 2.4: Participating Transit Agencies FLORIDA AGENCIES LOCATION Broward County Mass Transit (BCT) Broward County Central Florida Regional Transit Authority (LYNX) Orlando, Orange, and Osceola Counties Citrus Connection/Lakeland Area Mass Transit (Citrus) Citrus County/Lakeland area Hillsborough Area Regional Transit (HART) Hillsborough County Jacksonville Transportation Authority (JTA) City of Jacksonville-Duval County Miami-Dade Transit (MDT) Miami-Dade County Palm Beach County Transportation Agency (Palm Tran) Palm Beach County Pinellas Suncoast Transit Authority (PSTA) Pinellas County Regional Transit System (RTS) City of Gainesville Space Coast Area Transit (Space Coast) Brevard County Tallahassee Transit (TalTran) City of Tallahassee NON-FLORIDA AGENCIES LOCATION City of Phoenix Public Transit (Phoenix) Phoenix, AZ King County Metro (Metro) King County, WA Lane Transit District (Lane) Eugene, OR Valley Transportation Authority (VTA) Santa Clara, CA Based on the literature review and identification of key BOB issues and with input from FDOT staff and transit agency contacts, the transit agency survey instrument was developed. The survey instrument was divided into four main sections:
1. BOB Program History and Characteristics 2. BOB Program Costs 3. BOB Issues 4. BOB Program Benefits
The transit agency survey is located in Appendix C of the report, but the following section describes the questions in each part of the survey. 11 Source: Bike Map: http://www.bikemap.com/transit/rstats.htm
13

BOB Program History and Characteristics The first section was designed to gather information on the history of the BOB program for each particular transit agency and their current policies and practices. Specifically, the first section contained questions on:
• Start date of BOB program • Percent of bus fleet equipped with racks
o If 100% of the bus fleet was equipped with racks, agencies were asked in what year all buses were equipped with racks
• Total number of vehicles equipped with racks as of June 2004 • Manufacturer of racks used • Capacity and type of racks • Use of rear-mounted racks • Reasons for starting BOB program • Permit requirements and cost
o Description of permit process o If permit abandoned, reason why abandoned and impact
• Additional fee requirements (cost added to standard fare) o Fee costs o If fee abandoned, reason why abandoned and impact
• Bikes-in-Bus policies o If always allowed, any modifications made to accommodate
bicycles in the bus, and impact o If not allowed, reasons why bikes not allowed in bus
• Policy on folding bicycles BOB Program Costs The second section was designed to gather data on program costs. This included estimations on capital costs to buy racks, costs to replace damaged or worn racks, administrative costs and staff needs, marketing costs, and any additional costs related to providing bicycle parking and other facilities. Since it was assumed that there would be a variety of ways in which transit agencies define and track costs, the survey instrument provided respondents with several options for reporting categorical and overall program costs. The options ranged from very specific cost breakdowns by year and category to a simple estimate of total annual costs.
14

Specifically, the questions in the second section were: • Total cost of purchasing racks • Funding sources for rack purchases • Number of racks replaced due to damage or normal wear and tear • Estimate of full-time equivalents (FTE) labor needed to manage BOB
program • Number of staff persons involved in “day to day” operations • Program costs
o Option 1: For respondents that could provide program costs broken down into capital, maintenance, administrative, marketing, and other costs for each year of the program
o Option 2: For respondents that could provide annual estimates of program costs broken down into capital, maintenance, administrative, marketing, and other costs, but not year by year figures
o Option 3: For respondents that could only provide an estimate of total annual costs not broken down by category
o Option 4: For respondents that could provide a database file or set of reports published by the agency on BOB costs
• Marketing Costs o Agencies were asked if they created special brochures, websites or
training videos for using the racks o Agencies were also asked to describe any special events held to
promote their BOB program • Related BOB Costs
o Agencies were asked if they had funded or helped fund any bicycle facilities such as bike lanes or trails to increase safe access to transit and, if so, at what cost
o This also included questions on transit agency-purchased bicycle parking facilities, costs, and funding sources
o In terms of non-monetary costs, agencies were asked if route delay, caused by the loading and unloading of bicycles, was perceived as a problem, and whether routes had been modified as a result of route delay issues
o Lastly, agencies were asked to describe any impact of the BOB program on insurance and liability
15

BOB Issues In this section of the survey, agencies were asked about additional issues related to their BOB programs. The additional issues included problems with rack capacity and bicycles left on racks by patrons, the formation of any special committees to deal with BOB issues, and any special policies that have been developed that had not been covered in the survey. Specifically, this section of the survey asked:
• Is the agency facing a capacity problem? o If yes, describe steps taken to alleviate the problem
• Is the agency facing a problem with bicycles left on racks? o If yes, describe steps taken to alleviate the problem and what is
done with bicycles not claimed • Description of any other problems not mentioned on survey, and steps
taken to alleviate problem • Description of any internal oversight committees that have been
established related to BOB program • Description of any additional policies not covered in survey
BOB Program Benefits In the final section of the survey, transit agency respondents were asked about the benefits of their BOB program. This included the tracking of BOB boardings, the completion of any surveys of BOB users, and whether or not a BOB user database is maintained. Respondents were also asked what kinds of information they would like to know about their BOB users and what ideas they might have about improving their BOB programs. The last two questions were used in the development of the BOB user survey. Specifically, this section asked:
• Whether or not BOB boardings are tracked o If so, what method is used and if the agency could provide BOB
figures to CUTR for the last five years o If BOB boardings are not tracked, agencies were asked why not
• Whether the agency has surveyed BOB users and if so could the results and survey instrument be provided to CUTR
• If a database of BOB users is maintained and if CUTR can have access to it in order to survey BOB users
• What kind of information about BOB users would be useful to the agency? • What are some ideas on how to meet the needs of bicycling patrons or
mitigate problems with the BOB program? At the end of the survey, respondents were asked to provide a day of the week and time which they would be available for any follow-up questions. The surveys were distributed as write-protected Microsoft Word® documents via email.
16

BOB User Surveys In order to understand the benefits of the programs beyond the number of BOB boardings, it was important to gather information from transit patrons that use bikes-on-bus services. The project scope did not determine a specific number of required responses. However, a maximum of 400 responses was set based on time and budget limitations. Based on previous research, it was known that BOB users are a difficult population to reach. Most users report low incomes, a significant number lack valid driver’s licenses, and also may change residences frequently. The potential sample of BOB users was limited to patrons of transit systems that require permits and, as a result, maintain a BOB database. Therefore, only BOB users from HART, PSTA, and MDT were eligible for the survey. HART, PSTA, and MDT provided CUTR with database files that included phone numbers and/or addresses for BOB permit holders. HART and PSTA BOB users were surveyed by both mail and phone, while MDT users were mailed a survey. In the future, transit agencies could use periodic on-board surveys to collect data from BOB users. Due to low response rates and difficulty locating BOB users listed in the databases provided, the time allotted to surveying BOB users had to be significantly expanded from three months to six months. By the end of that period, surveying had stopped with 75 valid responses from each HART and PSTA BOB users, and 70 from MDT, for a total of 220 completed surveys. The response rates for HART and PSTA were approximately 11 percent, meaning that for every 100 calls made, 11 surveys were completed. The response rate for the mailed survey for MDT users was approximately 14 percent with 70 valid responses for 500 surveys distributed. The survey was divided into two main sections. The first section asked respondents about their use of BOB and their travel behavior. The second section was designed to gather information on basic demographic characteristics. The BOB user survey (telephone script form) is located in Appendix D in this report. Use of BOB and Travel Behavior In this section of the survey, respondents were asked how long they had been using BOB and how frequently, in terms of how many days per week and total boardings. They were also asked if they were transit users before they began using BOB. If they were using transit before becoming BOB users, then they were asked if they were using transit more because of the ability to integrate bicycling and transit. If they were not previously transit users, they were asked if the BOB program did, in fact, make it possible for them to use the bus.
17

The next set of questions were designed to learn about what types of trips were taken using BOB, specifically work versus non-work trips. If BOB was used for work trips, respondents were asked how many days per week were work trips made. They were also asked about the trip distance on both ends of their transit trip. The next several questions asked were about amenities provided by their employer, such as lockers, showers, and bicycle parking. Respondents that use BOB for work trips were then asked if they use BOB for other trips as well. If they did, the respondents continued on to the next question, which asked about the non-work trips they took. Respondents that did not use BOB for trips were also asked about their non-work BOB trips. To get an understanding of the impact of rack capacity limitations from the user’s point of view, respondents were asked how often the racks on the buses were full when they arrived, and whether or not it was a problem for them. Respondents were also asked if bicycle parking racks and/or lockers were available at either the bus stops or bus transfer stations they use. Respondents were also asked if they would lock their bike up on a parking rack at a bus stop if the racks on the bus were full or if they would use a free or rented bicycle locker. To solicit user ideas, respondents were asked what could be done by transit agencies to improve the BOB program. BOB User Demographics The second section of the BOB user survey collected demographic and other information on age, ethnicity, and income. They were also asked if they held a valid driver’s license and how many working vehicles were in the household. The BOB user survey results are located in Chapter 5. In the next chapter, results of the literature review will be highlighted and the key BOB issues presented.
18

CHAPTER 3: Literature Review and Identification of Key BOB Issues This chapter is divided into three sections. The first section highlights a set of significant research and sources examined during the literature review. The second section illustrates the benefits of integrating bicycling and transit, and the final section examines key BOB issues identified during the literature review and preliminary contact with transit agency survey participants. Previous Research and Sources of Significance BikeMap Database The most complete bicycles-on-transit database was created and is maintained by BikeMap. This company, which produces a variety of maps for cities and transit agencies, has a special interest in producing bicycle maps and collecting data on bicycle and transit surveys and research. On their website, the company has a special webpage devoted to the integration of bicycles and transit and on it there are links to an undated spreadsheet on transit agencies with either BOB or bikes-on-rail programs.12 They also feature a “transit agency of the month” with a bicycle program, a discussion list, and a listing of bicycle-on-transit benefits. The BikeMap data provided a sample population for the selection of non-Florida agencies, by targeting those with the highest boarding numbers. Table 3.1 lists the top-five agencies according to monthly BOB boardings as compiled by BikeMap. Table 3.1: Bikes on Transit Ridership Statistics, Top-Five in Boardings from BikeMap AGENCY STATE MODE MONTHLY
BOARDINGS BIKE SHARE OF PASSENGER TRIPS
Valley Metro AZ Bus 85,000 2.0%VTA San Jose CA Bus 77,800 1.9%Caltrain CA Commuter Rail 45,000 6.2%Tucson Sun Tran AZ Bus 26,000 2.0%Santa Cruz MTD CA Bus 22,000 4.1% Bicycle Parking Plan for Miami-Dade MPO In 2002, CUTR produced a bicycle parking plan for MDT’s Metrorail stations.13 In the process of planning the placement of parking racks and lockers, researchers surveyed and interviewed patrons that either parked their bicycles at Metrorail stations or brought their bicycles on board. Many of the findings were pertinent to this research. The survey results indicated a clear expansion of 12 Source: BikeMap: http://www.bikemap.com/trans.html. 13 The full report is available from the Center for Urban Transportation Research: http://www.cutr.usf.edu/pubs/MPO_bpp_report_2002.pdf.
19

transit service area in that approximately half of bicyclists parking their bicycles at Metrorail stations live over two miles from a station. It was also discovered that 79 percent of respondents combine bicycling and transit four or more days per week and that 18 percent of bikes-on-Metrorail users also use the Bikes-on-bus program at least one day/week.
By integrating bicycling, Metrorail was also attracting new riders. According to the study, 21 percent of survey respondents reported that their use of Metrorail is dependent on their ability to either bicycle to a station and park, or bicycle to a station and board trains with their bicycle. Furthermore, the results showed that choice riders were also attracted to transit because of the integration of bicycles. Approximately 21 percent of individuals combining bicycling and transit earn over $70,000/year. These individuals choose to combine bicycling and transit for exercise, to avoid traffic congestion, and for environmental reasons. PSTA Bikes on Bus Survey At the end of 1999, PSTA conducted a survey of their BOB users.14 A total of 116 surveys were completed. Most of the users found out about the program from either seeing bicycles on the bus or picking up pamphlets at transit centers or kiosks. Over a third of respondents reported that they use BOB five to seven days of the week, and over half use the program to commute to work. For those that commute to work, almost 60 percent traveled between four and ten miles combining the bus and bicycling. Almost half of BOB users also reported finding the rack full when the bus arrived. In terms of new riders, PSTA discovered that 43 percent had commuted in their own car and another 27 percent had carpooled. In total, 60 percent reported not having access to a car and half earned under $20,000 per year. Denver RTD User Survey RTD of Denver also conducted a survey of BOB users in 1999.15 They discovered that approximately 2300 boardings were provided on an average weekday, representing 1.4 percent all passenger trips (during summer months), and the most popular routes were linked to the City of Boulder, home to the University of Colorado. Approximately half of the respondents were new transit riders. Reasons for choosing to use the program included that greater distances could be covered; bicycling was necessary to get to the final destination; it was quicker than walking; and it was a way to avoid foul weather or breakdowns. The survey also discovered that almost 60 percent use the service three to five days per week and 27 percent would be forced to drive their cars if they were not able to integrate bicycling and transit.
14 Survey results are unpublished but provided to CUTR for this research. 15 Source: BikeMap: http://www.bikemap.com/transit/rtdsurvey.htm
20

Benefits of Bicycling and Transit Integration A review of the literature has revealed a variety of benefits associated with the integration of bicycling and transit. According to the TCRP Synthesis #4, entitled Integration of Bicycling and Transit (1994), “the benefits of bicycle-transit travel in comparison with automobile travel are readily recognized: lower air pollutant emissions, reduced highway congestion, lower capital costs for park-and-ride facilities, and improved neighborhood environments.”16 Furthermore, there are additional benefits that cannot be provided by each of the modes on their own. For example, the integration allows longer total trip distances, an increase of the transit service area, and the ability of bicycles to avoid obstacles such as high-volume, high-speed roads or hilly terrain. Expansion of Service Area By providing access to transit via bicycles, transit agencies can expand the service area of their routes. Studies, such as CUTR’s Bicycle Parking Plan for Miami-Dade MPO (2002) have shown that bicyclists often travel between one and two miles to access transit. According to the Federal Highway Administration’s (FHWA) National Bicycling and Walking Study (1992), a survey conducted in Phoenix, AZ revealed that BOB users were commuting an average of almost seven miles to access the bus.17 They also reported that bicycle locker renters at San Diego park-and-ride lots bike approximately 3.6 miles to the lockers before making transit trips averaging 11 miles. New and Choice Riders Due to the expansion of service area and the ability to make longer total trips by combining bicycling and transit, BOB programs can also attract new riders. As the PSTA survey discussed above discovered, approximately 70 percent of BOB users had either driven alone or carpooled prior to switching to transit and bicycling. Approximately half of Denver RTD BOB users were also new to transit as stated above. By providing an environmentally-friendly alternative to the automobile and a way to get daily exercise, bikes-on-transit programs can attract a choice rider segment.18 These patrons may well earn a good-living and have access to a well-maintained car, but choose to combine bicycles and transit as a way to stay healthy and reduce pollution. According to CUTR’s Bicycle Parking Plan for
16 Doolittle J. T., J. and E.K. Porter (1994) ibid. (p.1) 17 National Bicycling and Walking Study (1992) Case Study No. 9: Linking Bicycle/Pedestrian Facilities with Transit. FHWA Publication No. FHWA-PD-93-012. Washington DC 18 Replogle, M.A., Tapping New Transit Markets with Bicycle Access : The International Experience. Compendium of technical papers, 1984: p. p. 6-15
21
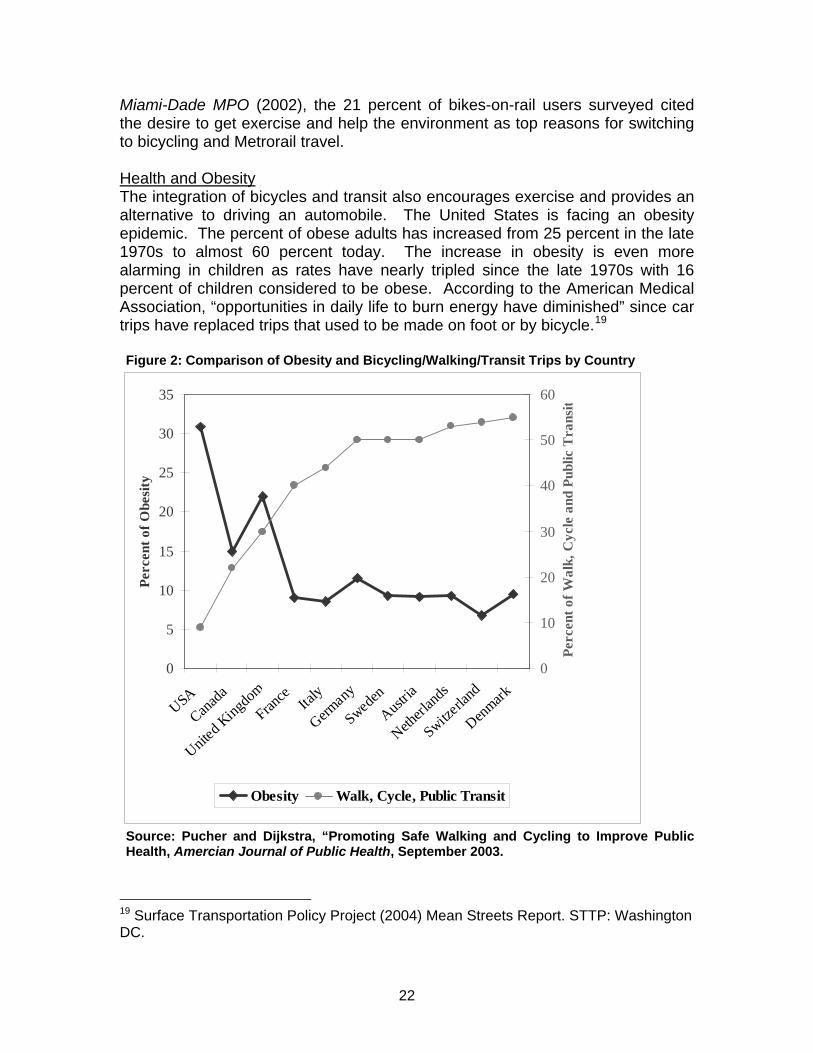
Miami-Dade MPO (2002), the 21 percent of bikes-on-rail users surveyed cited the desire to get exercise and help the environment as top reasons for switching to bicycling and Metrorail travel. Health and Obesity The integration of bicycles and transit also encourages exercise and provides an alternative to driving an automobile. The United States is facing an obesity epidemic. The percent of obese adults has increased from 25 percent in the late 1970s to almost 60 percent today. The increase in obesity is even more alarming in children as rates have nearly tripled since the late 1970s with 16 percent of children considered to be obese. According to the American Medical Association, “opportunities in daily life to burn energy have diminished” since car trips have replaced trips that used to be made on foot or by bicycle.19 Figure 2: Comparison of Obesity and Bicycling/Walking/Transit Trips by Country
0
5
10
15
20
25
30
35
USACana
da
United
Kingdo
mFran
ce Italy
German
y
Sweden
Austria
Netherl
ands
Switzerl
and
Denmark
Perc
ent o
f Obe
sity
0
10
20
30
40
50
60
Perc
ent o
f Wal
k, C
ycle
and
Pub
lic T
rans
it
Obesity Walk, Cycle, Public Transit
Source: Pucher and Dijkstra, “Promoting Safe Walking and Cycling to Improve Public Health, Amercian Journal of Public Health, September 2003.
19 Surface Transportation Policy Project (2004) Mean Streets Report. STTP: Washington DC.
22

Bicycling and walking are the best ways in which to get the minimum daily exercise needed to maintain health, and according to Pucher and Dijkstra (2003), there appears to be a relationship between the percent of obesity and the percent of trips taken by either bicycling, walking, and transit. Figure 2 above illustrates that as the amount of trips taken by bicycling, walking, and transit increase, the levels of obesity decrease. Although no direct causal link has been proven, it is difficult to argue that some kind of relationship does not exist. Multi-modal Transportation The integration of bicycling and transit also supports the goals of current federal legislation, TEA-21, that seeks to create a multi-modal system of transportation. Clearly, the data shows that given an opportunity, a significant portion of commuters will choose combining bicycling and transit over commuting by automobile alone. BOB programs also expand the service area making transit more accessible. Air Quality and Traffic Congestion Every trip that is made by bicycles and transit is a small, but not meaningless contribution to improving air quality and reducing traffic congestion. According to the Texas Transportation Institute’s 2004 Urban Mobility Study, American commuters spent more time stuck in traffic then in prior years, wasting both fuel and money.20 The key findings of the report are:
• Annual delay per peak period traveler has grown from 16 hours to 46 hours since 1982
• Annual financial cost of traffic congestion has ballooned from $14 billion to more than $63 billion since 1982 (as expressed in 2002 dollars)
• Wasted fuel totaling 5.6 billion gallons is lost to engines idling in traffic jams
Replogle adds that further development of bicycle-transit integration is a potentially important strategy for reducing suburban traffic congestion and boosting the performance and productivity of suburban transit services.21 In sprawling suburban areas, providing high quality transit with good coverage and small headways is difficult and costly. By providing safe bicycle facilities and adequate bicycle parking, suburban transit systems can achieve better access.
As automobile use and traffic congestion have both increased over time, air quality has suffered. According to the Union of Concerned Scientists, “at least 92 20 TTI (2004) Urban Mobility Report: Available at http://.mobility.tamu.edu/ums/report 21 Replogle, M.A., (1987) Bicycles on Transit: A review of international experience. Transportation Research Record No. 1141, Pedestrian and Bicycle Planning with Safety Considerations: Washington DC. (p.38)
23

million Americans live in areas with chronic smog problems” and asthma rates are skyrocketing among our children.22
Mitigating Dependence on the Automobile BOB programs are a form of sustainable transportation that mitigates the dependence on the automobile. The combination of bicycling and transit can help reduce household transportation costs. According to the Surface Transportation Policy Project’s American Dream Report, the average American household spends just under one-fifth of their household income on transportation. They argue that this high level of expenditure prevents some families from attaining home ownership. Key BOB Issues Over the course of the research, including both a literature review and surveys of agencies and users, a set of key BOB issues emerged. These included the issue of route delay, overcoming rack capacity limitations, provision of bicycle parking facilities, BOB permit requirements, insurance and liability issues, and dealing with bicycles abandoned on racks. The following section provides a discussion of each issue, and the surveys of transit agencies and BOB users were designed to gather information on them. Route Delay One concern of transit agencies has been the extent to which the loading and unloading of bicycles causes route delay and effects on time performance. Although agencies acknowledge that the loading and unloading of bicycles does not require a significant amount of time, and certainly less than accommodating patrons in wheelchairs, the time can add up over the course of a route. For this reason, the transit agency survey specifically asked whether or not route delay caused by BOB patrons is a problem and whether or not routes and schedules have been modified to accommodate the loading and unloading of bicycles. According to the TCRP Synthesis #4, entitled Integration of Bicycling and Transit (1994), “very few schedule delays have been reported” by the agencies that were surveyed and there was “no systematic impact on schedule adherence.”23 On the other hand, the synthesis also reported that 20 percent of Portland’s Tri-Met bus operators feel that the loading and unloading of bicycles affect their ability to maintain a schedule, but that these problems disappear as patrons become more familiar with using the racks. 22 Source: Union for Concerned Scientists: http://www.ucsusa.org/clean_vehicles/cars_and_suvs/page.cfm?pageID=231 23 Doolittle J. T., J. and E.K. Porter (1994) ibid. (p.22)
24

Overcoming Rack Capacity Limitations Until recently, the bicycle racks mounted on the front of buses could hold only two bicycles. Sportworks®, the provider of the vast majority of BOB racks, has introduced their Trilogy rack which can hold three bicycles, but at the time of the research only a limited number of transit agencies had tested these racks or begun to use them. Therefore, one of the main issues confronting transit agencies was limited rack capacity. Rack capacity limitations were seen as preventing further growth of BOB programs and a source of frustration for patrons who depend on integrating bicycling and transit. The primary responses to rack capacity limitations are to experiment with the three-bike capacity racks or allow patrons to bring their bicycles on board. Another response, as cited by the TCRP Synthesis #4, entitled Integration of Bicycling and Transit (1994), is to add bicycle parking racks/lockers to stops and stations to provide a patron with the option of locking up their bicycle at the stop and boarding instead of having to wait for the next bus with an empty rack.24 Bikes-in-Bus (BIB) Programs Besides replacing old racks with new three-bike capacity racks, some agencies have experimented with or formally allowed patrons to bring their bicycles in the bus. According to TCRP Synthesis #4, entitled Integration of Bicycling and Transit (1994), Pierce Transit of Tacoma, Washington and Sacramento Transit in California allowed full-sized bicycle in buses with two exceptions; if the bus is crowded and during peak hours.25 The study reported that Pierce Transit allows up to six bicycles on board, with three bicycles stored in each of the two wheelchair access areas, or bicycles in the wide aisle behind the rear door. Sacramento, on the other hand, reported allowing just one bicycle on board. In general, priority is given to patrons in wheelchairs, meaning that patrons with bicycles in the bus must exit the bus if the wheelchair area is needed by a patron boarding in a wheelchair. However, many agencies see bicycles in aisles or wheelchair areas as a potential hazard and liability, especially if bicycles are not tied down during a traffic crash. TCRP Synthesis #4, entitled Integration of Bicycling and Transit (1994) reported that Pierce Transit reported two claims related to bicycles being inside the bus.26 One claim involved a patron’s clothes being soiled by a falling bicycle, and the other claim was related to damage to a bicycle falling while the bus was moving. Anecdotal evidence also acknowledges that some bus operators violate agency policies and allow patrons to bring their bicycles on the bus if the racks are full and the bus is relatively empty. Agencies understand that
24 Ibid. 25 Ibid. 26 Doolittle J. T., J. and E.K. Porter (1994) ibid. (p.23)
25

bus operators not only drive the bus, but they are also friends with the patrons and that there can be pressure not to let a friend down and allow them to carry their bicycle on board. Transit agencies that operate light or commuter rail typically allow bicycles on trains. Sometimes bicycles are restricted to special cars or areas of the passenger cars. Occasionally transit agencies have installed devices to secure bicycles in the train cars. Transit agencies interested in experimenting with or allowing bicycles in bus should investigate how rail agencies secure their bicycles. According to the TCRP Synthesis #4, entitled Integration of Bicycling and Transit (1994), Golden Gate Transportation District allowed bicycles on board on one route that connected to the BART rail system. They required that bicycles can only be brought on board through the rear door and that rear wheel of the bicycle be placed in the wheelchair clamp. Bicyclists were responsible for providing their own straps or bungee cord to secure their bicycles on the wheelchair tie-downs. Bicycle Parking According to the TCRP Synthesis #4, entitled Integration of Bicycling and Transit (1994), transit agencies are best served by providing both lockers and bicycle parking racks at their facilities. While racks provide convenient, short-term parking, lockers provide secure, long-term parking options for bicycle-transit users.27
While most transit agencies provide bicycle parking at their larger transfer stations, a lesser number incorporate bicycle parking into their typical bus stop design, sheltered or unsheltered. Based on preliminary discussions with agency contacts, the widespread belief is that nobody is going to lock their bicycle on a rack at a bus stop along the side of the road because it will be stolen and vandalized. While this may be true to a certain extent, it is also possible that many BOB users would use the rack if necessary. For example, a patron that has come to rely on using the BOB program may need to lock up their bicycle at the stop if the bus arrives with full racks and they do not have time to wait for the next bus. As a result, BOB users were asked in the survey if they would park their bicycles at bus stops if racks were available to estimate latent demand for bicycle parking. According to Replogle (1984), only “a supply-push strategy of providing and marketing secure bike parking at transit stops and bike-on-transit programs can release the latent demand for bicycle access to public transportation.”28 The reasoning behind the supply-push strategy is that a plentiful supply of secure 27 Doolittle J. T., J. and E.K. Porter (1994) ibid. (p.29) 28 Replogle, M.A. (1984) Tapping New Transit Markets with Bicycle Access : The International Experience. Compendium of technical papers.
26

bicycle racks and lockers are located at bus stops and transit centers will encourage more people to access transit by bicycle as the fear of theft and vandalism is decreased. Additionally, the more people that see others bicycling to access transit, the more likely they are to try it themselves as it becomes an acceptable alternative. It is not uncommon for major cities in Europe to have thousands of bicycles parked in front of transit stations and stored in innovative bicycle parking valet complexes.29
BOB Permits According to the database maintained by BikeMap, approximately 25% of transit agencies require some kind of permit to use their BOB program. There are many good reasons for requiring a permit to use the program. Permits pre-qualify and educate users to ensure that they can operate the rack properly and are able to lift bicycles in and out of the rack. It is thought that a permit requirement can therefore limit liability. Furthermore, by granting access to only qualified users, transit agencies can minimize loading and unloading time to decrease route delay and operator intervention. Permits also lead to the creation of a BOB user database and a process that enables the collection of demographic and travel data by the transit agencies or outside researchers. On the other hand, approximately three-quarters of transit agencies have never required a permit or have abandoned the requirement. The main reason for never requiring or abandoning the permit is that agencies believe that permits limit access to the program. For agencies that require permits, there are typically a limited number of places where patrons can purchase their permit. This can be either a real or perceived barrier for some individuals. The requirement of permits also denies access to the program by tourists, non-residents, or individuals who, in an emergency, need to transport their bicycle on the bus.30 For example, a bicyclist who breaks a chain or suffers a puncture and does not have a permit would be unable to simply load their bike on the bus and travel safely home or to a repair shop if he does not have a permit. It can also be argued that a permit requirement costs money to implement and administer, thus, adding to BOB investment. Transit agencies without permits also report that it only takes one or two times for a patron to learn how to use the racks and that signage located on the front of the bus can clearly illustrate the steps taken to load and unload the bicycle. King County Metro of Seattle also provides on their website video clips demonstrating the loading and unloading procedures as another method for educating patrons.31 Other agencies, such as HART, have attached old racks to the
29 Pucher, John and L. Dijkstra (2000) Making Walking and Cycling Safer: Lessons from Europe. Transportation Quarterly, Vol. 54 No. 3. 30 Doolittle J. T., J. and E.K. Porter (1994) ibid (p.15) 31 Source: King County Metro http://transit.metrokc.gov/tops/bike/loadbike.html
27

outside walls at a transit station so that patrons can practice using the rack. In general, many of the claims that support the policy of requiring permits are undermined by the actual experiences of transit agencies without permit requirements. While there are clearly arguments for both sides of the permit issue, it is not in the purview of this research to recommend whether or not transit agencies should or should not require permits. However, the Federal Highway Administration cited that “the trend appears to be avoidance or abandonment of permit processes.”32 In summary, the TCRP Synthesis #4, entitled Integration of Bicycling and Transit (1994) concluded that whether or not a permit is required depends on:
“the program’s ridership goals, service area characteristics, and the number and types of modes operated. For example, if the target market is off-peak recreational and tourist-based, then permits may pose a serious barrier for the casual users. If the target market is peak period commuters, then permits and fees may provide a means of educating customers and determining whether they are qualified users.”
Insurance and Liability Although a concern of transit agencies, very little is known about the impact of BOB programs on insurance premiums and liability. According to the Federal Highway Administration’s Integration of Bicycles and Transit report, “little evidence can be found of any bicycle or bus damage or passenger injury related to front or rear racks or on-board access.”33 The report also stated that TRI-MET of Portland, Oregon had a total of four claims resulting in rewards totaling $25 related to bicycles falling off the racks, and as previously mentioned, Pierce Transit settled two claims related to bicycles in the bus. However, one scenario presented during preliminary discussions to provide an example, involved a patron failing to notify the bus operators that he was going to unload his bicycle and getting struck as he moved in front of the vehicle. As a result, it was suggested by more than one agency participating in the survey to add a question about increases in insurance premiums as a result of either implementing a BOB program or because of an incident related to the program. A question of this nature was incorporated into the survey.
32 Source: Federal Highway Administration: http://safety.fhwa.dot.gov/ped_bike/docs/bike_bus.pdf 33 Ibid.
28

Bikes Left on Racks Another question that transit agencies wanted to have their peers answer was if abandoned bicycles were a problem and if so, how is the problem handled. While not all agencies experience a major problem with bicycles being abandoned on the racks, others are collecting hundreds a year. There are two main problems with abandoned bicycles. First, they can keep racks full and deny another patron the opportunity to load their bicycle, thus, contributing to the rack capacity limitation issue. Secondly, these bicycles have to be unloaded, stored, and a system has to be in place for owners to claim them. Those that go unclaimed have to be dealt with as well. They are typically given to transit agency staff or donated to the police or charity organization. Damaged Racks The final issue of concern is the frequency in which the front-mounted racks are damaged and need to be replaced. While some damage is the result of normal wear and tear, other damage is caused by fact that the racks affect the bus’ turning radius and required stopping distance. Transit agencies were interested in knowing how many racks their peers have had to replace and the ratio between normal wear and tear and damage, since the replacement of damaged racks clearly adds to the investment in BOB programs.
29

CHAPTER 4: Transit Agency Results Despite the modest sample size, missing data, and the inability to apply rigorous statistical analysis to the transit agency surveys, several key findings can be identified in relation to costs, benefits and key BOB issues. Key Findings Program History and Characteristics
Most of the agencies surveyed started their programs between 1994 and 1998 and have equipped 100 percent of their buses with bike racks, except MDT (75% equipped) and LYNX (96% equipped).
Three agencies surveyed, MDT, Metro, and PSTA, have begun to use three-bike capacity racks to alleviate rack capacity limitations and expand BOB boardings.
Of those surveyed, just two Florida agencies still require permits to use the service, PSTA and HART. In the past, MDT also required a permit but has recently abandoned the requirement to increase access. Since abandoning the permit, MDT has not encountered any problems due to the policy change.
Four agencies, Lane Transit, Space Coast, VTA, and Phoenix, allow BOB patrons to bring their bicycles on board when racks are full based on bus operator discretion and availability of the wheelchair area. None of these agencies have modified the interior of their buses to accommodate bikes on board. None of the agencies reported any problems in regard to this policy.
BOB Program Costs
The primary investment made by transit agencies to implement a BOB program is the cost of purchasing the bike racks. However, front-mounted racks are an optional feature usually selected by transit agencies for any new buses.
The 13 agencies that reported capital costs spent a combined total of approximately $3 million purchasing bike racks for 4,799 buses. Of the nine Florida agencies that reported capital costs, approximately $967,000 was spent equipping 2,084 buses with bike racks at an average cost of $465 per rack.
The 12 agencies that reported data on having to replace damaged racks replaced a total of 665 racks, representing a replacement rate of 13%. The replacement rate for Florida agencies was lower at 9.6%.
Transit agencies, in general, perceive maintenance and administrative costs associated with operating their BOB programs as a minimal part of system-wide operations.
Total BOB investment could only be determined for three agencies, Phoenix, HART and PSTA, because of the availability of data. It is estimated that Phoenix has invested approximately $1.65 million over 15
30

years; HART has invested approximately $584,000 over 11 years; and PSTA has invested approximately $464,000 over seven years.
Despite reports of several thousand BOB boardings per month by many of the agencies, investment in bicycle parking facilities is low. Investing in bicycle parking could be a key strategy for retaining current users and attracting more in the face of rack capacity limitations by promoting a bikes-to-bus strategy in which patrons bicycle to transit stops and park their bicycles before boarding.
Key BOB Issues
Of the 15 agencies, 11 reported experiencing problems due to rack capacity limitations. In response to this problem, four agencies allow bicycles on board when racks are full and space is available in the wheelchair area. Four other agencies have begun to install three-bike capacity racks on their most popular routes with the goal of equipping their entire fleet with them. In addition, the BOB user survey showed that approximately 25 percent of users reported racks often being full and six percent reported racks being full all the time.
Ten of the agencies reported having problems with bicycles abandoned on bus racks, and many have had to develop special processes for collecting and eventually donating unclaimed bicycles.
BOB Program Benefits
Of the ten agencies that track BOB boardings, nine were able to provide estimates on the number of monthly BOB boardings.
The number of monthly boardings ranged from 900 to over 65,000. For the five Florida agencies that provided data, the average number of BOB boardings for 2004 was 11,200.
The following section contains the results of the transit agency survey in more detail. BOB Program History and Characteristics Year Started Of the 15 transit agencies surveyed, Lane Transit of Eugene, Oregon was the first to launch a BOB program starting in 1985. RTS, PalmTran, and PSTA were the last agencies to start a program, first adding racks to their buses in 1998. Most of the agencies surveyed began BOB programs between 1994 and 1998. BCT did not provide a year started date on the survey, but further investigation indicated that the program started around 1990.
31

Percent of Fleet Equipped with Racks A total of 13 of the 15 agencies have 100% of their motor bus fleets equipped with racks. As of 2004, Miami-Dade Transit had only 75 percent of its buses equipped with racks, and LYNX is on the verge of full coverage with 96 percent equipped with racks. For most agencies with 100 percent coverage, it took two to three years to fully equip their fleet. Four agencies managed to equip all of their buses in one year or less, while three agencies took over six years. Fleet size was not a determinant of the length of time needed to reach full coverage for those agencies surveyed. The number of fleet vehicles equipped with bike racks ranged from just 47 to over 1600. Rack Type and Capacity A total of 12 of the 15 agencies surveyed have relied solely on front-mounted racks manufactured by Sportworks®. None of the agencies had ever experimented with rear mounted racks. At the time of the survey only three agencies, Metro, PSTA, and BCT, have begun to incorporate Sportworks®’ Trilogy, a front mounted rack with a three-bicycle capacity. In 2003, King County Metro conducted an evaluation of the Trilogy rack system and concluded that some refinements are “desirable prior to ordering it for more coaches” and that the primary issues were the weight of the rack and the potential for damage to bicycles due to being secured so closely together on the rack.34 However, an “overwhelming majority of cyclists responded positively to the idea of Metro ordering more of the racks for the bus fleet.” The evaluation also concluded that bus schedules were not negatively impacted, but that bicycles on the rack obstructed turn signals on the New Flyer 60-foot coaches. The evaluation recommended that Metro work with Sportworks® to refine the Trilogy, and then conduct another evaluation. The report also advised Metro to investigate other three-bike capacity racks on the market, and explore opportunities for ordering more three-bike capacity racks. Reasons why BOB Program Started There were a number of reasons why agencies implemented BOB programs. The most common reason was that BOB programs were viewed as a cost effective way to expand transit agencies’ service areas. As LYNX reported,
“For one-third the cost of one new bus, LYNX could reach more customers with bike racks. It expands access to transit from ¼ mile walk buffer to a 1 mile bike buffer, allowing our service to reach more customers.”
The next most common reason cited was that by providing this multi-modal option, agencies would attract new riders, and increase ridership in general. 34 King County Metro (2003) Evaluation of Sportworks® Trilogy Bike Rack. Unpublished report provided to CUTR
32

Several agencies also stated that individual bicyclists and local bicycle advocacy groups played major roles in convincing them to offer the service, especially those with large student populations like RTS of Gainesville (home of the University of Florida). Safety was another issue reported by two agencies. Citrus/Lakeland Mass Transit cited a concern for safety related to patrons bicycling on dangerous roads, and PSTA stated that there was a need to provide a service that potentially could “reduce the high number of bike/motor vehicle accidents in the community.” Permits A total of 11 of the 15 agencies surveyed have never required a special permit to use the BOB program. HART, PSTA, and JTA required a permit at the time the survey was conducted. Both the HART and PSTA permits cost $2.50 and are good for life. JTA’s permit costs $3.00 and is good for five years. Miami-Dade County recently discontinued their permit requirement because “there were no benefits to the agency from requiring the permit” and it would increase access. They also stated that since abandoning the permit no problems had been reported. A discussion on the pros and cons of permitting is located in Chapter 3 in the section on Key BOB Issues. Bikes-in-Bus (BIB) Policies Eleven agencies stated that patrons are not allowed to bring bicycles on the bus if the front-mounted racks are full. There were essentially two reasons cited for not allowing bicycles in the bus by the agencies surveyed. The most frequently cited of the two was a concern for safety and liability because of the inability to secure bicycles. As Palm Tran stated:
“There are safety related issues. We are not able to secure the bikes properly. Our buses are not equipped with brackets, or any kind of tie downs to secure the bikes properly.”
The other reason was that bicycles require too much space and many routes are already overcrowded with patrons. As RTS explained “taking up possible rider space with bikes would be counterproductive.” The other four agencies, Lane Transit, Space Coast, VTA, and Phoenix, reported that their policy is to allow bicycles in the bus when the racks are full based on the bus operator’s discretion. For example, Lane Transit reported that if the wheelchair area is free, operators can grant permission for a patron to bring their bicycles on board. None of these agencies have modified their vehicles in any way to provide a means to secure a bicycle brought on board or reported any specific problems with their policy. Typically wheelchair tie-downs are used to secure bicycles while the bus is moving. It is important to note that some of the agencies that officially do not allow bicycles on board are aware that occasionally operators do violate the rule.
33

Anecdotal evidence claims that operators who get to know their customers find it hard not to bend the rules for regular patron who needs their bicycle on both ends of their trip. Although transit agencies understand the reason behind the bending of the rules, they also see a major liability and do not encourage it. In regard to folding bicycles, six of the agencies had no official policy because the issue had never come up or there had not been an incident related to folding bicycles. Of the remaining nine with specific policies, five agencies allow folding bicycles on board and four stated that no bicycles of any kind are allowed on board. The most common reason given for allowing folding bicycles on board is that they are no larger than a stroller and can be more easily secured by the patron. BOB Program Costs Capital Costs of Bike Racks Transit agencies have equipped their buses in essentially two ways. Initially, racks were purchased to retrofit buses. More recently, new buses are ordered with racks already installed. As a result, the amount of capital expenditures on bike racks reported for the survey do not always equate with actual number of buses equipped with racks. Instead, the capital cost figures provided by some agencies equate with the number of racks purchased only for buses that were retro-fitted with racks. For example, RTS only included in their estimate 25 racks that had been purchased to retrofit buses since all other racks have been standard on new buses order after 2001. They estimated a cost of $400 per rack and therefore reported a total capital cost of $10,000. It also appears that Palm Tran included capital costs for only racks purchased to retrofit older buses since their calculated cost per rack is less than half of market price. Barring damage, many transit agencies indicated that racks had a similar or longer lifespan than a bus that typically lasts approximately 12 years. See Table 4.1 for details on BOB capital costs.
34

Table 4.1: Capital Costs of Rack Purchases AGENCY VEHICLES
WITH RACKS
RACKS REPLACED
TOTAL RACKS PURCHASED
SELF-REPORTED CAPITAL COSTS
AVERAGE COST PER RACK
Phoenix 482 250 732 $750,000 $1,024.59 PSTA 176 50 226 $188,691 $834.92 Space Coast 55 8 63 $40,000 $634.92 HART 266 Not reported 266 $159,120 $598.20 Lane 100 43 143 $85,000 $594.41 VTA 523 Not reported 523 $300,000 $573.61 JTA 180 10 190 $105,000 $552.63 MDT 565 Not reported 565 $273,255 $483.64 Metro 1610 171 1781 $842,880 $473.26 LYNX 226 45 271 $127,464 $470.35 TalTran 61 8 69 $31,500 $456.52 RTS 105 10 20 $10,000 $400.00 Palm Tran 126 30 156 $31,879 $204.35 Broward 277 20 297 Not Reported NACitrus 47 20 67 Not Reported NATOTALS 4,799 665 5,369 $2,944,789 $561.95FL TOTALS 2,084 201 2,190 $966,909 $515.06 While most agencies now order all new buses with racks installed using capital funds, a variety of funding sources were used to purchase racks to retrofit buses in earlier years. Many of the Florida agencies used Bike Rack Grants provided by the Florida Department of Transportation. King County Metro relied on a CMAQ grant for $995,000 in 1994 to retrofit their existing bus fleet with racks at the start of their program. Two other agencies, Lane Transit and Space Coast used Federal Transit Administration (FTA) Section 5307 funds to initially purchase racks. Three agencies initially used operating funds to purchase racks and transportation enhancement funds were used by two agencies. Rack Replacement Costs All of the transit agencies have had to replace racks that were either damaged or rendered unusable due to normal wear and tear. Three agencies, VTA, HART, and MDT were unable to provide estimates of the number of racks that have been replaced by specific cause. For the other 12 agencies, most replacements have been needed due to damage. See Table 4.2 for details.
35

Table 4.2: Rack Replacements AGENCY RACKS REPLACED DUE TO DAMAGE DUE TO WEAR AND
TEAR Phoenix 250 125 125 Metro 171 NA NA PSTA 50 50 0 LYNX 45 NA NA Lane 43 43 0 Palm Tran 30 25 5 BCT 20 18 2 Citrus 20 10 10 RTS 10 3 7 JTA 10 5 5 TalTran 8 NA NA Space Coast 8 8 0 TOTALS 665 287 144 FL TOTALS 201 119 29 BOB Program Maintenance and Operation Costs In general, most of the labor costs related to BOB programs are attributed to the replacement and repair of racks. For example, King County Metro reported that:
“Vehicle maintenance staff reviews bike rack conditions at maintenance inspection intervals and repairs racks as needed. This is a regular part of their daily work.”
Excluding maintenance, transit agencies regard the day-to-day operation of BOB programs as minimal, and on average require about 0.2 FTE of staff effort, meaning that about a fifth of a single staff person’s time and effort is devoted to overseeing the BOB program. As a result, most of the transit agencies do not see BOB programs as burdensome and feel it is a minimal part of day-to-day operation and administration. Based on the data provided by agencies, quality estimations of total BOB investments could only be calculated for three agencies: Phoenix, HART, and PSTA. Based on years BOB has been in service, estimated annual operating costs, cost of installing bicycle parking, and total capital costs of purchasing racks, it is estimated that Phoenix has invested approximately $1.65 million in their BOB program. HART and PSTA have invested approximately $584,000 and $464,000 respectively (see Table 4.3 for details). Table 4.3: Estimated Annual Cost of Operating BOB Program
AGENCY YEARS BOB IN SERVICE
ESTIMATED ANNUAL O&M* COST OF BOB PROGRAM
ESTIMATED O&M* COST OF BOB OVER LIFE TIME OF PROGRAM
ESTIMATED COST OF PROVIDING BICYCLE PARKING
ESTIMATED CAPITAL COSTS
TOTAL INVESTMENT IN BOB OVER LIFE OF PROGRAM
Phoenix 15 $60,000 $900,000 Not Reported $750,000 $1,650,000HART 11 $38,160 $420,000 $5,000 $159,120 $584,000PSTA 7 $38,886 $270,000 $5,000 $188,691 $464,000
* Operations and Maintenance
36

Only one agency, RTS, provided an estimated breakdown of BOB program costs in terms of capital, maintenance, administrative, and marketing costs. RTS estimates that since 1998, they have spent approximately $10,000 purchasing racks to retrofit 25 buses. Based on the frequency of necessary repairs, RTS estimated spending $1,050 per year for maintenance. With almost no day-to-day administration needed, they estimated only a few hours of time a year is needed. In total, they estimate administration costs at just $50 per year. During the first year of service, they spent approximately $1,500 on marketing. Since then, they estimate spending about $100 per year marketing their BOB program. Therefore, since 1998, RTS reported that the implementation and maintenance of their BOB program has cost just under $20,000 total. This figure is significantly lower since it does not include the capital costs of bicycle racks that were installed on new buses purchased after 2001. Marketing Efforts Only Citrus/Lakeland Mass Transit has not made a special brochure for their BOB program. All others have made them to be available on buses, for special events, and kiosks that provide route and schedule information. Unlike all the other agencies, Citrus does not maintain a web page dedicated to their BOB program. All the other agencies have created special web pages or added sections on their website on their BOB program. These web pages provide information on how to use the racks, the benefits of the program, bicycle parking facilities, and where to get permits, if required. Eight of the transit agencies have also created instructional videos on their programs, specifically how to use the racks. These videos are played at special events promoting the program, or the transit agency in general, or are used as part of the permitting process. Provision of Bicycle Facilities Nine of the transit agencies surveyed reported purchasing and installing bicycle parking facilities to complement their BOB programs. Those agencies that also operate rail services and have combination bus and rail stations, like VTA and MDT, provided the largest amounts of bicycle parking with lockers, generally associated with multi-modal stations. See Table 4.4 for details. Table 4.4: Provision of Bicycle Parking AGENCY NUMBER
OF RACKS
NUMBER OF LOCKERS
ESTIMATED TOTAL COST
FUNDING SOURCE
VTA 200 468 $500,000 FTA and CMAQ grants MDT 22 256 NA Federal, state, and local grants Metro 30 94 $75,000.00 CMAQ and local capital funds HART 12 0 $5,000.00 Federal, state and local grants PSTA 12 0 $5,000.00 FTA capital funds LYNX 12 0 NA Not reported Phoenix 10 10 NA Not reported TalTran 3 0 NA Federal capital assistance JTA 0 3 NA FDOT grant
37

Issue of Route Delay Despite frequently being mentioned as potential “costs” of BOB programs, just two of the transit agencies, Space Coast and BCT, reported route delay problems associated with the loading and unloading of bicycles. Space Coast simply stated that route delay occurred but that no routes or schedules have had to be modified to account for it. BCT also acknowledged that route delay does occur, but they too have not built in any additional time into their schedules. RTS of Gainesville stated that route delay is not a problem, but time for the loading and unloading of bicycles is “included with timing RTS routes.” Several agencies pointed out that route delay was not a problem because the loading and loading times are minimal and insignificant compared to the use of wheelchair lifts and the loading and unloading of strollers. Only Metro stated that some routes had been modified to accommodate BOB users. They reported that at the “Montlake flyer stops, an operation change was made requiring all buses to pull in at the flyer stops to see if any cyclists were waiting to load bikes.” Insurance and Liability Since most agencies are self-insured, premiums are not typically affected by incidents related to BOB services. However, incidents and claims can occur from damages related to BOB programs. Only one agency, LYNX, reported that the provision of a BOB program has impacted insurance premiums. LYNX stated that:
While there have been no significant or quantitative monetary impacts to our self insurance program, the use of bike racks has created a new list of potential claims and claimant interaction. Examples would include: bikes stolen off of the vehicle with passengers present, bikes on buses involved in an accident - either referring them to adverse party insurance or paying out a Property Damage claim, minor bike rack contact with other vehicles or objects. The types of property damage are typically very minimal and are not at all significant; however, staff time with public interaction regarding bike rack issues has impacted our department.
Additional BOB Issues Rack Capacity Issues A total of 11 of the 15 agencies surveyed are experiencing rack capacity problems as their programs have attracted more demand than rack space supply. It is a problem based on programs being “too successful”. As a result of demand exceeding supply, transit agencies have basically responded in three ways; 1) begun purchasing three-bike capacity racks; 2) have started to allow bikes on board; or 3) acknowledged the problem, but have done nothing yet. The table below provides more detailed agency responses to the problem of rack capacity limitations.
38

Metro, PSTA, Palm Tran, and BCT have all begun to purchase three-bike capacity racks starting with their most popular routes. Transit agencies should note that while the three-bike capacity racks are very popular with BOB users, the Metro evaluation of the rack system advised that modifications are needed to improve performance, as discussed previously in this chapter. VTA, Lane, Phoenix, and Space Coast have adopted policies allowing bicycles in the bus based on driver discretion and the availability of space. It is important to note that these agencies did not report negative experiences with this policy. See Table 4.5 for details. Table 4.5: Capacity problems and solutions AGENCY STRATEGY CAPACITY PROBLEMS AND SOLUTIONS
VTA Bikes-in-Bus Yes, “at times, but not a big problem” since bikes are allowed in the bus based on driver’s discretion.
Lane
Bikes-in-Bus Yes, “we have allowed bikes inside the bus when wheelchair bays are not used. There are times when this is not feasible and bike riders complain” but “wheelchair riders get priority.”
Space Coast Bikes-in-Bus Yes, “Allowing the bikes on the buses” at driver’s discretion
Phoenix Bikes-in-Bus Not as much of a problem since agency started allowing bikes in the bus when racks full.
Metro Three-bike racks Yes, “applied for an STP Enhancement grant to retrofit 175 buses with Trilogy racks.”
PSTA Three-bike racks Yes, PSTA has “recently added 3 capacity racks to the six most popular routes, will upgrade all buses in near future.”
BCT Three-bike racks Yes, so agency has “begun to purchase 3 capacity racks”
Palm Tran
Three-bike racks Yes, “Palm Tran will be installing bus bike racks that hold three bikes because of BOB's popularity. Bike riders that use buses have had to wait for a later bus due to the bus racks being full.”
HART No steps taken Yes, and “this year the BOB ridership has been a lot higher,
but we have not had the additional funding to increase any services.”
Citrus No steps taken Yes, we have “more demand for the capacity than supply at times” but nothing has been done to alleviate problem.
LYNX No steps taken Yes, but did not report any attempts to alleviate problem
Bikes Abandoned on Racks During preliminary research, the transit agency representatives who were contacted were very interested to know if other agencies had a problem with bicycles abandoned on the racks and if so what they were doing with them. Ten of the fifteen agencies surveyed reported having problems with bicycles being left on the racks by patrons. The two agencies with permit requirements, HART and PSTA try to mitigate this problem by instructing patrons to always exit through the front door and inform the bus operator that they will be unloading a bicycle. Although this may do more to prevent injuries during unloading, it does remind
39

BOB users to unload their bicycles as well. Agencies, like Palm Tran, also have made an effort to provide BOB users with the necessary contact information if bicycles left on the rack need to be recovered. Unclaimed bikes are typically donated through law enforcement agencies, non-profit, or charity organizations. See Table 4.6 for details. Table 4.6: Steps to Alleviate Bicycle Abandonment Problems AGENCY HOW PROBLEM HANDLED FATE OF BICYCLES
VTA “Not a large problem, but it happens.” No special steps taken to alleviate this problem.
Bicycles are “turned over to the Sheriff for auction.”
Metro
Since 1995 Metro has contracted with BikeStation® Seattle, “a non-profit organization to administer a program that includes storing the bicycles, tagging them with dates and pertinent information, and processing claims by owners of lost bikes.”
Bikes are “stored overnight and delivered to Bikestation® Seattle the next morning. The owner has 30 days to claim the bike and the driver has another 30 days after that to claim the bike if not picked up by owner. If the bike is unclaimed after 60 days, it is given to charity.”
HART
Patrons are instructed “when they receive their BOB I.D. to exit the vehicle from the front and to inform the Operator that they will be unloading their bicycle.”
The bicycles “are placed in the Lost & Found until claimed.” Considering donating to charity those bikes that remain unclaimed.
Lane No specific steps reported After 30 days bicycles are donated to charity organizations.
LYNX
Abandoned bikes are off loaded to supervisor vehicles which are equipped with automobile bike racks and they are brought to lost and found.
Did not report
Phoenix
Bicycles are taken to the lost and found.
They are held for 14 days in lost and found. Any items left after the time period ends are given to operators, or are donated to charity.
Palm Tran
“Many times customers forget to remove their bikes. Therefore, Palm Tran advertises the lost and found telephone number for customers to reclaim their property.”
After 30 days, any unclaimed property goes to surplus / the County's Thrift store.
Citrus No specific steps taken
Work with the local police department
PSTA Riders are reminded to exit front door and to tell driver they are removing a bike.
Bikes are held at PSTA for 90 days, then donated or given away
BCT No specific steps taken Given to charity Internal Oversight Committees Three agencies, VTA, King Metro, and MDT, reported forming some kind of internal committee to deal with any issues that arise concerning their BOB programs. However, both VTA and MDT further explained that their bicycle/pedestrian advisory committees are external to the transit agencies. Only King County Metro formed an internal committee to review bicycle program
40

policy. They also formed a special committee to evaluate the new three-bike capacity rack. That evaluation was discussed earlier in this chapter. BOB Program Benefits BOB Boardings A total of 10 of the 15 agencies surveyed currently track BOB boardings. As Table 4.7 indicates, a variety of methods are used to track BOB boardings from electronic fare box collection and manual counts written by operators to annual on-board surveys. Four agencies have drivers manually record BOB boardings, two agencies conduct periodic surveys to estimate boardings, and two others collect boarding counts electronically through their fare boxes. PSTA combines both the electronic collection method with periodic surveys mailed out to BOB users. Table 4.7: Methods of Tracking BOB Boardings AGENCY Type METHOD USED FOR TRACKING BOARDINGS BCT Electronic Fare box key is dedicated to BOB usage. HART Electronic Fare box key is dedicated to BOB usage. Phoenix Electronic Fare box key is dedicated to BOB usage. PSTA Electronic
and Surveys Fare box key is dedicated to BOB usage. BOB boardings will be counted by surveys mailed to BOB users
Metro Survey System-wide count, but only conducted in 1995 and 2002 VTA Survey Annual ridership survey conducted TalTran Manual Driver notes on trip card. Lane Transit Manual Operator manual counts, previously used a survey and sampling Space Coast Manual Driver counts Citrus Manual Daily trip sheets that are kept by bus operators Of the ten agencies that collect BOB boarding data, only Citrus/Lakeland did not provide data. TalTran, HART, Lane Transit, VTA, and PSTA were all able to provide 5 years of monthly estimates of BOB boardings. VTA has consistently had the highest amount of BOB boardings with approximately 65,600 monthly BOB boardings. Over time, VTA boardings have fluctuated, reaching a peak in 2002. Lane Transit showed increases until 2002 before boarding began to drop. Both PSTA and HART have showed consistent increases over the last five years. On the other hand, TalTran has experienced a steady decline over the last five years. It is not known whether or not rack capacity limitations are reasons for declines after boardings peaked in previous years. Table 4.8 provides details on estimated monthly boardings.
41

Table 4.8: Estimated Monthly BOB Boardings AGENCY YEAR FULLY
EQUIPPED 2000 2001 2002 2003 2004
VTA 1997 72,800 77,800 78,800 58,900 65,600Phoenix 1991 NA NA NA NA 57,000 Metro 1994 NA NA 40,000 NA NABCT 2003 NA NA NA NA 30,000Lane 1996 17600 18800 22800 21500 17,000PSTA 1998 3,800 9,290 11,150 12,700 13,850HART 1995 4,500 4,600 4,800 5,700 7,300Space Coast 1998 NA NA NA NA 4,000TalTran 1997 1,309 1,053 964 905 900 Surveying of BOB Users and Maintenance of Databases Of this set of agencies, only PSTA had conducted a survey of BOB users. The results of the survey were previously discussed in Chapter 3. HART and PSTA currently maintain databases due to their permit requirement. Miami-Dade Transit also had a database, but had not maintained it since eliminating their permit requirement. Information about BOB Users that Transit Agencies Would Like to Know Transit agencies were asked what they would like to know about their BOB users. In general, transit agencies would like to know which specific routes are used by their BOB users and their primary origins and destinations. Additionally, some agencies are interested in knowing average trip distances, trip purposes, socioeconomic data, and what other amenities are desired by BOB users. Although no specific origin and destination data by specific routes was collected by the BOB user survey, the other information was collected and is reported in the following chapter. Information Desired from Other Transit Agencies During survey development, transit agencies were also asked what kinds of information they would like to receive about other agencies and their BOB programs. The requests were then added to the survey. The three most popular requests were Bikes-in-Bus policies and experiences, use of three-bike rack systems, and BOB’s impact on insurance claims and incidences. Other information requested included data on boardings, and impacts on dwell time and route delay.
42

CHAPTER 5: BOB User Survey Results A total of 220 surveys were completed with 75 coming from HART and PSTA BOB users and 70 from MDT users. The key findings of the survey are listed below followed by full details of the survey results. Key Findings BOB Travel Behavior
Approximately 70 percent of BOB users surveyed have been combining bicycling and transit for over a year, and almost 33 percent have been doing so for over three years.
It is estimated that 65 percent of patrons surveyed use BOB services more than four days per week on average.
Over 40 percent of BOB users reported 11 or more boardings per week One in four BOB users is new to transit, and of those new transit riders,
over 80 percent reported that the ability to access transit by bicycle was the reason for the switch.
Three-quarters of BOB patrons that were not new to transit reported increased transit use after they started using BOB services.
BOB and Work Trips
Approximately 72 percent of BOB patrons use the service to commute to work.
Of those that use BOB to access jobs, over 83 percent use BOB four or more days per week.
Approximately 61 percent of BOB work commuters bicycle more than one mile to access transit, but 80 percent travel less than one mile after getting off the bus and bicycling to their place of work.
Of those that commute to work using BOB, 60 percent reported also using BOB for non-work trips as well.
Rack Capacity Limitations
Approximately 26 percent of BOB users, especially those that commute to work by BOB, indicated that their bus arriving at their stops with the rack full was a problem.
While only eight percent indicated that bicycle parking racks were available at the bus stops they use, 22 percent reported that they would lock up their bicycle at the stop if parking racks were available, and the bus arrived with full racks. Additionally, 43 percent stated they would park their bicycles at a bus stop if they could not afford to wait for the next bus to arrive. The longer headway, or time between buses, the more important access to bicycle parking becomes.
43

Recommended Changes to BOB In general, BOB users desire shorter headways, safer bicycling conditions,
the ability to bring bikes on board, and more bicycle parking. BOB Travel Behavior Length of Time Using BOB According to the results, just fewer than 70 percent of all BOB users have been using the program for over a year. Additionally, approximately 33 percent of those surveyed have been combining bicycling and transit for over three years. Since MDT abandoned their permit and the database has not been added to in the last couple years, the longer lengths of use of MDT BOB users may be due to a selection bias in the sample. See Table 5.1 for details. Table 5.1: Length of Time Using BOB LENGTH OF USE
HART MDT PSTA TOTAL
Under 1 month 0.0% 0.0% 1.3% 0.5%1-6 months 13.3% 4.0% 10.7% 9.5%6 months to 1 yr. 21.3% 20.0% 21.3% 21.4%1-2 years 32.0% 40.0% 33.3% 35.9%3-4 years 24.0% 21.3% 25.3% 24.1%4-5 years 6.7% 6.7% 5.3% 6.4%Over 5 years 2.7% 1.3% 2.7% 2.3%Refused/NA 0.0% 0.0% 0.0% 0.0%Totals 0.0% 0.0% 1.3% 0.5% Frequency of BOB Use As Table 5.2 indicates, approximately 65 percent of those surveyed reported using BOB 4 or more days per week on average, and just under 15 percent use the service one day per week or less. The results also suggest that MDT bicyclists use the service more often than HART and PSTA users, with 70 percent using BOB more than four days per week on average. On the other hand, HART and PSTA users are more likely to use BOB one or two days per week, most likely to supplement other modes of transportation. Table 5.2: Average Days per Week BOB used AVERAGE # OF DAYS BOB USED
HART MDT PSTA TOTAL
Less than one 2.7% 2.9% 2.7% 2.7%1 13.3% 11.4% 14.7% 13.2%2 14.7% 7.1% 13.3% 11.8%3 4.0% 5.7% 8.0% 5.9%4 16.0% 28.6% 17.3% 20.5%5 41.3% 37.1% 34.7% 37.7%6 2.7% 2.9% 5.3% 3.6%7 4.0% 1.4% 2.7% 2.7%Refused/NA 0.0% 2.9% 1.3% 1.4%
44

Average of BOB Boardings per Week In regard to average BOB boardings per week, approximately 28 percent reported five or less boardings per week. On the other hand, over 40 percent reported 11 or more boardings per week. As with average days per week of BOB use, MDT patrons show slightly higher average boardings per week. See Table 5.3 for details. Table 5.3: Average of BOB Boardings per Week BOARDINGS PER WEEK
HART MDT PSTA TOTAL
Less than one 4.0% 1.4% 4.0% 3.2%1-5 26.7% 21.4% 26.7% 24.4%6-10 30.7% 28.6% 32.0% 29.8%11-15 25.3% 38.6% 28.0% 29.8%16-20 10.7% 5.7% 8.0% 8.0%Over 20 2.7% 1.4% 1.3% 1.8%Refused/NA 0.0% 2.9% 0.0% 0.9% New Riders and Increased Transit Use As Table 5.4 illustrates, about one in four BOB riders surveyed was a new transit rider when they started combining bicycling and transit. HART patrons were the most likely to be new to transit with approximately 31 percent while only 17 percent of MDT riders were new to transit. The percent of new PSTA riders was approximately 27 percent. Table 5.4: New Transit Rider Because of BOB NEW RIDER HART MDT PSTA TOTAL Yes 30.7% 17.1% 26.7% 24.4%No 69.3% 77.1% 73.3% 71.6%Refused/NA 0.0% 5.7% 0.0% 1.8% Those respondents that reported being new to transit were asked if the ability to combine bicycling with transit was the reason for their switch. In all, over 83 percent stated that BOB was indeed the reason for their switch to transit. MDT patrons were less likely than HART or PSTA patrons to be influenced by access to BOB. See Table 5.5 for details. Table 5.5: BOB is Reason for Switch to Transit REASON FOR SWITCH
HART N=23
MDT N=12
PSTA N=26
TOTAL N=61
Yes 87.0% 75.0% 84.6% 83.6%No 13.0% 16.6% 15.4% 14.7%Refused/NA 0.0% 8.3% 0.0% 1.7%
45

Figure 3: People typically become regular users of transit when they discover how to integrate bicycling and transit.
Source: Gena Torres, Hillsborough County MPO Bike/Ped Coordinator. Although 72 percent indicated that they were not new to transit, it is not known how frequently they rode the bus prior to using BOB services. However, those that were not new to transit were asked if access to transit via bicycles increased their use of transit. According to the results, over three-quarters indicated that the ability to access transit by bicycle increased their overall use of transit (see Table 5.6). Therefore, the survey results demonstrate that not only do BOB programs attract new riders, but they also enable and/or encourage more frequent use by regular transit patrons. Table 5.6: Increase in Transit Use because of BOB Program INCREASED USE
HART N=52
MDT N=54
PSTA N=55
TOTAL N=161
Yes 73.1% 81.5% 76.4% 77.0%No 26.9% 18.5% 23.6% 23.0%Refused/NA 0.0% 0.0% 0.0% 0.0% BOB and Work Trips Approximately 72 percent of BOB patrons use the service for their commute to work. MDT patrons were most likely to use BOB for work trips, while PSTA users
46

were least likely. Almost three-quarters of HART BOB patrons use the service for commuting. See Table 5.7 for details. Table 5.7: BOB used for Work Trips USE FOR WORK TRIPS
HART MDT PSTA TOTAL
Yes 73.3% 85.7% 62.7% 72.0%No 26.7% 12.9% 37.3% 25.3%Refused/NA 0.0% 1.4% 0.0% 0.4% In regard to work trips, the average number of days BOB is used increases compared to overall trip purposes. As Table 5.8 shows, 65 percent of respondents reported using BOB four or more days per week on average in general, over 83 percent of patrons that use BOB to get to work reported using it four or more days per week on average. Table 5.8: Average Days per Week BOB used for Work Trips AVERAGE # OF DAYS FOR WORK TRIPS
HART N=55
MDT N=60
PSTA N=47
TOTAL N=162
0 0.0% 0.0% 2.1% 0.6%1 3.6% 5.0% 6.4% 4.9%2 7.3% 6.7% 2.1% 5.6%3 5.5% 6.7% 2.1% 4.9%4 23.6% 31.7% 27.7% 27.8%5 54.5% 45.0% 55.3% 51.2%6 3.6% 1.7% 2.1% 2.5%7 1.8% 1.7% 2.1% 1.9%Refused/NA 0.0% 1.7% 0.0% 0.6% The survey also collected data on trip distances for both ends of the transit portion of the work trips. In general, 61 percent of BOB users reported having to bicycle over a mile to access the bus. On the other hand, approximately 80 percent of users bicycle less than a mile and almost half have to travel a quarter-mile or less after getting off the bus. A possible reason for this is that transit serves employment areas much better than residential areas, with more bicycling required on the front end of the trip than the back end. This data provides support for investing in a bike-to-transit strategy in which patrons use their bicycle on only one end of their trip and walk the other. The results also illustrate some clear differences between the three areas. While 71 percent of HART patrons have to bicycle a mile or more to access transit, fewer than 50 percent of MDT patrons and 56 percent of PSTA patrons ride the same distance. Furthermore, only 12 percent of MDT BOB users have to travel a mile or more to get to work, compared to 20 percent for both HART and PSTA riders. This is possibly due to a more extensive transit network located in Miami-Dade County. See Table 5.9 for details.
47

Table 5.9: Work Trip Distances HART N=55
MDT N=60
PSTA N=47
TOTAL N=162
TRIP DIST.
To stop To work To stop To work To stop To work To stop To work < ¼ mi. 5.5% 14.5% 6.7% 18.3% 3.6% 20.0% 5.6% 18.5%¼ mile 7.3% 30.9% 10.0% 30.0% 5.5% 27.3% 8.0% 30.9%½ mile 14.5% 32.7% 26.7% 31.7% 18.2% 18.2% 21.0% 29.0%¾ mile 1.8% 1.8% 1.7% 1.7% 1.8% 0.0% 1.9% 1.2%1 mile 38.2% 10.9% 16.7% 6.7% 41.8% 10.9% 33.3% 9.9%2 miles 23.6% 7.3% 18.3% 5.0% 12.7% 7.3% 19.1% 6.8%3 miles 5.5% 1.8% 5.0% 0.0% 1.8% 1.8% 4.3% 1.2%4 miles 1.8% 0.0% 3.3% 0.0% 0.0% 0.0% 1.9% 0.0%5 miles 1.8% 0.0% 1.7% 0.0% 0.0% 0.0% 1.2% 0.0%>5 mi. 0.0% 0.0% 3.3% 0.0% 0.0% 0.0% 1.2% 0.0%Refused/NA
0.0% 0.0% 6.7% 6.7% 0.0% 0.0% 2.5% 2.5%
The respondents that reported using BOB for work trips were also asked what kinds of facilities and amenities are provided by their employers. Overall, 6 percent had access to changing rooms, 14 percent to lockers, and five percent to showers (see Table 5.10 for details). Bicycle racks were available to over 16 percent, while only 2.5% could secure their bicycle in a locker. One respondent from MDT worked for an employer that had fenced in an area to secure bicycles. Bicycle parking facilities, in general, were more likely to be provided for bicycle commuters in the Miami area. By encouraging more employers to provide amenities and parking facilities, transit agencies could most likely increase the number of BOB program participants. However, it is important to note that many of the employers of BOB programs may not have the ability to provide such amenities as showers and changing facilities due to the nature of the business and the site conditions. Table 5.10: Employer Amenities AMENITIES AVAILABLE
HART N=55
MDT N=60
PSTA N=47
TOTAL N=162
Changing rooms 5.5% 8.3% 4.3% 6.2%Lockers 12.7% 16.7% 12.8% 14.2%Showers 5.5% 5.0% 4.3% 4.9%Bicycle Parking Racks 12.7% 20.0% 17.0% 16.7% Lockers 1.8% 5.0% 0.0% 2.5% Fenced area 0.0% 1.7% 0.0% 0.6%Refused/NA 5.0% 1.9% Patrons that use BOB for work purposes were also asked if they use BOB for non-work trips. Overall, approximately 60 percent of BOB commuters also use transit for other trips as well (see Table 5.11). There was little difference between the patrons of the three different agencies in regard to the use of BOB for non-work trips.
48

Table 5.11: Use of Non-Work Trips by BOB Work Commuters USE FOR NON-WORK TRIPS
HART N=55
MDT N=60
PSTA N=47
TOTAL N=162
Yes 61.8% 61.7% 55.3% 59.9%No 38.2% 35.0% 44.7% 38.9%Refused/NA 0.0% 3.3% 0.0% 1.2% Non-Work Trip Destinations Those patrons that do not use BOB for work commuting, together with BOB commuters that use transit for non-work trips, were asked to list their non-work trip destinations. In general, the most frequently named destinations were shopping centers and places that provide health services. HART patrons were most likely to use BOB for shopping, while MDT users were most likely to use BOB for health care. MDT users were also more likely to use BOB to attend social functions and for recreation purposes. See Table 5.12 for details. Table 5.12: Non-Work Trip Destinations NON-WORK DESTINATIONS
HART N=54
MDT N=49
PSTA N=54
TOTAL N=157
Health Services 48.1% 65.3% 51.9% 54.8%Shopping 63.0% 40.8% 55.6% 53.5%Social 25.9% 40.8% 33.3% 33.1%Recreation 3.7% 10.2% 5.6% 6.4%Other 9.3% 4.1% 5.6% 6.4%Refused/NA 0.0% 6.1% 0.0% 1.9% The Problem of Full Racks In order to examine the extent to which full racks on buses are a problem for BOB patrons, survey respondents were asked how often the racks on the bus were full when the bus arrived at their stop (see Table 5.13 for more information). Across all agencies, approximately 25 percent reported that racks were often full and over five percent stated the racks were always full. Just 13 percent indicated that racks were never full. In all, 26 percent of BOB users, and predominantly those that commute to work by BOB, felt that full racks were a problem.
49

Figure 4: When racks are full, patrons who cannot wait for the next bus will park their bicycle at the stop.
Source: Gena Torres, Hillsborough County MPO Bike/Ped Coordinator. The results indicate that PSTA most likely suffers the most from full racks with over 30 percent reporting that racks are often full or full all the time, compared to just 19 percent of HART users and 23 percent of MDT patrons. As expected, PSTA respondents were the least likely to state that racks were never full at 11 percent compared to 19 percent for HART patrons. Furthermore, one-third of PSTA respondents stated that full racks on buses constituted a problem, compared to just 20 percent of HART users. Table 5.13: How Often Racks are Full When Bus Arrives? HOW OFTEN ARE RACKS FULL?
HART MDT PSTA TOTAL
Never 18.7% 17.1% 10.7% 12.7%Rarely 62.7% 60.0% 58.7% 56.4%Often 13.3% 20.0% 22.7% 25.5%All the Time 5.3% 2.9% 8.0% 5.5%Refused/NA 0.0% 0.0% 0.0% 0.0%Are Full Racks A Problem? 20.0% 25.7% 33.3% 26.4%
50

One issue that exacerbates the problem of the bus arriving with full racks is the lack of bicycle parking at bus stops. While the survey results indicate that bicycle parking is widely available at large bus stations and transfer centers, most road-side bus stops do not have bicycle parking facilities. Just three percent of HART patrons and seven percent of PSTA users reported that bicycle racks are located at bus stops. MDT patrons appear to have greater access to bicycle parking at bus stops with 14 percent reporting availability, in part due to the fact that many stops serve both bus and rail lines. See Table 5.14 for details. Table 5.14: Bicycle Racks available at Bus Stops/Stations Parking Available
HART MDT PSTA TOTAL
At Bus Stops 2.7% 14.3% 6.7% 7.7%At Bus Stations 97.3% 92.9% 96.0% 95.5%Refused/NA 0.0% 4.0% 0.0% 1.4% One of the ways in which transit agencies can mitigate the problems associated with rack capacity limitations is to provide bicycle parking facilities at bus stops. While it is often assumed that many bicyclists will not lock up their bicycle on a bus stop on the side of the road for fear of theft or vandalism, the survey results indicate something different. In all, approximately 22 percent of respondents would lock their bicycle up to a parking rack at a bus stop without any conditions if the bus arrived with full racks. Furthermore, 43 percent indicated that they would use a bicycle parking rack when waiting for the next bus to arrive was not an option. One in three respondents did state that they would not use parking racks at bus stops. The willingness to use bicycle parking racks at bus stops was highest among PSTA users. This result does coincide with the finding that PSTA users were more likely to be experiencing problems with full racks. MDT users were least willing to state they would use parking racks at road-side bus stops. See Table 5.15 for details. This finding highlights the idea that transit agencies may be able to overcome the limitations of rack capacity by providing secure bicycle parking at bus stops to encourage more bikes-to-transit travel. By encouraging patrons to bicycle to bus stops and leave their bicycle securely parked, transit agencies can still take advantage of the benefits of integrating bicycling and transit, such as the expansion of service area, without increasing BOB demand. The encouragement of bikes-to-transit travel is also supported by the finding that patrons frequently have less distance to travel on the back end of their trip. Throughout Europe, bikes-to-transit travel eclipses bikes-on-transit travel with transit stations routinely supplying parking for thousands of bicycles, and bicycle parking racks included in standard bus stop designs.35
35 Pucher, John (2005) Promoting Safe Walking and Cycling to Improve Public Health: Lessons from the Netherlands and Germany. Presented at FDOT District 7: Tampa, FL: February 2005.
51

Table 5.15: Locking up Bicycle at Bus Stops if Rack Full WILLINGNESS TO USE RACK AT BUS STOPS
HART MDT PSTA TOTAL
Yes, anytime 24.0% 21.4% 21.3% 22.3%Only if could not miss bus
42.7% 35.7% 49.3% 42.7%
No 33.3% 37.1% 29.3% 33.2%Refused/NA 0.0% 5.7% 0.0% 1.8% In addition, survey respondents were also asked their likelihood of using lockers at larger stations and transfer centers (see Table 5.16 for details). In general, approximately 60 percent indicated that they would use lockers if they were free. Fewer than 30 percent would be likely to use lockers if there was a fee charged. There were not any substantial differences between the three areas except that MDT BOB users would be more likely to use free lockers. Table 5.16: Use of Lockers at Bus Stations USE OF LOCKERS
HART MDT PSTA TOTAL
Yes, if free 53.3% 70.0% 56.0% 59.5%No, even if free 46.7% 25.7% 44.0% 39.1%Refused/NA 0.0% 4.3% 0.0% 1.4%Yes, even w/ fee 26.7% 25.7% 29.3% 27.3%No, if fee 73.3% 70.0% 70.7% 71.4%Refused/NA 0.0% 4.3% 0.0% 1.4% Changes to Improve BOB When respondents to the survey were asked what changes could be made to improve BOB programs, a variety of responses were provided (see Table 5.17 for more information). In general, the most frequently mentioned improvement would be more frequent bus service. While this request may be related to the agency’s service in general, a possible reason for the request could be that BOB users do not want to have to wait a long time for the next bus to arrive if the racks on the first bus were full. The second most popular suggestion was providing safer access to transit through more bike lanes and bike trails. It is important to note that more HART patrons suggested safer access than shorter headways. Other frequently suggested changes included allowing bicycles in the bus, and providing more bicycle parking. While very few MDT or HART patrons suggested larger capacity racks, about one in four PSTA users mentioned it. The reason for this is that they have either seen or used the three-bike capacity racks that PSTA is already using on its most popular routes. A few respondents also thought that repair shops near transit centers and lower fares were good ideas as well.
52

Table 5.17: Changes to Improve BOB Programs Suggested Changes
HART MDT PSTA TOTAL
Shorter headways 58.7% 78.6% 65.3% 67.3%Safer access 61.3% 47.1% 56.0% 55.0%Bikes-in-bus 32.0% 48.6% 41.3% 40.5%Bicycle parking 24.0% 30.0% 20.0% 24.5%Bigger racks 2.7% 2.9% 25.3% 10.5%Repair shops 1.3% 5.7% 0.0% 2.3%Lower fares 1.3% 0.0% 1.3% 0.9%Refused/NA 2.7% 5.7% 4.0% 4.1% BOB Demographics One of the requests issued by transit agencies was access to more demographic data on BOB users. As a result, the survey was designed to collect data on age, gender, income, and ethnicity. Additional data was also collected on whether BOB users hold a valid driver’s license and the number of working vehicles in the household. It is important to note that BOB demographics are likely to vary between transit agencies due to differences in the populations they serve. For example, a transit agency that serves a small city with a high university student population would have different demographics than a larger urban city with major industries or a primarily service economy. Age Overall, 65 percent of BOB users surveyed are between 25 and 44 years of age. It is important to note that due to Institutional Review Board guidelines, individuals under the age of 18 could not be surveyed. In comparing the three agencies, the oldest BOB patrons are most likely to be found using PSTA and least likely to be using HART, which had the highest percent of BOB users 34 and under. See Table 5.18 for details. Table 5.18: Ages of Surveyed BOB Users AGE HART MDT PSTA TOTAL 18-24 years old 14.7% 12.0% 10.7% 12.7%25-34 years old 36.0% 29.3% 32.0% 33.2%35-44 years old 32.0% 29.3% 32.0% 31.8%45-54 years old 13.3% 10.7% 16.0% 13.6%55-64 years old 2.7% 4.0% 5.3% 4.1%65 and older 1.3% 2.7% 4.0% 2.7%Refused/NA 0.0% 5.3% 0.0% 1.8% Gender The survey results clearly indicate that BOB users are predominantly male (see Table 5.19 for details). PSTA had the highest ratio of women at almost 15 percent. In looking at age and gender together, female BOB users are predominantly under 25 years of age. While PSTA did have a handful of older female BOB users, they were virtually nonexistent in the other areas.
53

Table 5.19: Gender of BOB Users GENDER HART MDT PSTA TOTAL Male 93.3% 91.4% 85.3% 90.0%Female 6.7% 2.9% 14.7% 8.2%Refused/NA 0.0% 5.7% 0.0% 1.8% Income In general, the vast majority of BOB users earn under $30,000 per year (see Table 5.20). Across all systems, approximately 75 percent of BOB users earned less than $30,000 and just seven percent earned over $50,000 per year. In comparing the three systems, there are some significant differences. For example, approximately 81 percent of HART users reported earning less than $30,000 per year, compared to 76 percent of PSTA patrons, and just 67 percent of MDT patrons. It is important to note the difference between BOB users and bikes-on-rail users in Miami-Dade, where 21 percent of bikes-on-rail or bikes-to-rail users earned over $70,000 per year.36
Table 5.20: Income of BOB Users INCOME HART MDT PSTA TOTAL Under $10K 13.3% 11.4% 16.0% 13.6%$10,000-19,999 42.7% 41.4% 37.3% 40.5%$20,000-29,999 25.3% 14.3% 22.7% 20.9%$30,000-39,999 5.3% 14.3% 9.3% 9.5%$40,000-49,999 4.0% 5.7% 5.3% 5.0%$50,000-59,999 2.7% 2.9% 2.7% 2.7%$60,000-69,999 1.3% 1.4% 1.3% 1.4%$70,000 or more 2.7% 2.9% 2.7% 2.7%Refused/NA 2.7% 5.7% 2.7% 3.6% Ethnicity In comparison to the general population, a greater proportion of African-Americans and Hispanics are found among BOB users (see Table 5.21). For example, the 2000 Census reports that approximately 80 percent of Hillsborough County residents are White. However, just 45 percent of HART patrons reported being White. Furthermore, the 2000 Census reported that 87 percent of Pinellas County residents were White, but just 53 percent reported the same ethnicity on the survey. The same is true for Dade County, with 72 percent of residents reported as White in the 2000 Census, but just 39 percent of BOB users. When cross-tabulated against income, African-Americans and Hispanics, in general, were more likely to earn under $20,000, and far less likely to be the “choice” riders that earn over $50,000.
36 CUTR (2002) ibid.
54

Table 5.21: Ethnic Breakdown of BOB Users ETHNICITY HART MDT PSTA TOTAL White 45.3% 38.7% 53.3% 46.8%African-American 26.7% 22.7% 26.7% 25.9%Hispanic 25.3% 21.3% 13.3% 20.5%Asian 0.0% 0.0% 1.3% 0.5%Native American 0.0% 1.3% 0.0% 0.5%Other 1.3% 2.7% 4.0% 2.7%Refused/NA 1.3% 5.3% 1.3% 2.7% Number of Working Vehicles According to the National Household Transportation Survey (2001), the average Florida household has 1.72 vehicles. The BOB user survey results show a different picture with 46 percent reporting that there are no working vehicles in their household and just over 17 percent indicating two or more (see Table 5.22). PSTA patrons were most likely to be without a car with over half of the respondents reporting no working vehicle in the household. Access to automobiles was highest in Hillsborough County. Table 5.22: Number of Working Vehicles in BOB Users’ Households WORKING VEHICLES
HART MDT PSTA TOTAL
0 38.7% 42.7% 53.3% 45.9%1 44.0% 26.7% 32.0% 35.0%2 14.7% 16.0% 12.0% 14.5%3 2.7% 1.3% 2.7% 2.3%4 0.0% 1.3% 0.0% 0.5%Refused/NA 0.0% 5.3% 0.0% 1.8% Hold Valid Driver’s License According to the survey, 60 percent of BOB users reported not holding a valid driver’s license (see Table 5.23). HART patrons were most likely to be unable to legally drive. Knowing this, transit agencies should look to market their programs in conjunction with the Department of Highway Safety and Motor Vehicles and the court system to individuals having their driving privileges revoked. Table 5.23: BOB Users holding Valid Driver’s Licenses HOLD VALID LICENSE
HART MDT PSTA TOTAL
Yes 65.3% 57.1% 57.3% 60.0%No 28.0% 37.1% 40.0% 35.0%Refused/NA 6.7% 5.7% 2.7% 5.0%
55

Chapter 6: Examination of BOB Costs and Returns, and Recommendations While the lack of data and the difficulty of measuring the annual and long-term costs associated with BOB programs prevented a rigorous and quantitative return on investment analysis, the transit agency and BOB user survey results do provide a clear understanding of the many benefits of integrating bicycling and transit as well as guidance in developing a set of recommendations for transit agencies. The principal purpose of this research was to examine the return on transit agencies’ investments in BOB programs, and to determine what additional investments can be made to increase returns and overcome rack capacity limitations. The five key research questions were:
1. What kind of investments have transit agencies made implementing and maintaining BOB programs?
2. What has been the return on investments in terms of service area expansion, BOB boardings, new riders, and increased transit use?
3. What are current transit agency policies on key issues, such as bikes-in-bus (that is allowing patron to bring their bicycles on to the bus when racks are full), permit requirements, and provision of bicycle parking?
4. Who are BOB users and how has the provision of access to transit via bicycles impacted their transportation choices?
5. What are some recommendations for how transit agencies can maintain and improve returns on their investments by overcoming rack capacity limitations and more effectively integrating bicycling and transit?
In this final chapter, the return on investment will be presented by providing answers to these five questions. BOB Costs The first research question asked about the kind of investments transit agencies have made implementing and maintaining BOB programs. The primary investment that transit agencies make is the purchase of bicycle racks that are mounted on the front of buses. When transit agencies first implemented their BOB programs, capital funds, grant money, or operating funds were used to retrofit buses with racks. According to the survey, the nine Florida agencies that reported capital costs spent approximately $1 million equipping over 2000 buses, at approximately $500 per rack. In comparison to the cost of purchasing new
56

buses, this is a small investment. As the LYNX contact stated, for the price of one-third of a new bus, the agency could retrofit every bus with racks. Transit agencies also invest in the maintenance of BOB programs due to the need to repair and replace damaged and worn racks. According to the survey results, almost ten percent of racks installed have been replaced. Transit agencies also make small investments in regard to the administering and marketing of the programs. According to the results, most agencies estimate that administering their program is about a quarter of the effort or 0.25 FTE of one their staff members. RTS estimated that over the lifetime of their BOB program they have spent less than $2500 on marketing the service. Even though bicycle parking is one of the most important amenities for bicycle commuters, transit agencies that do not operate multi-modal rail and bus stations have invested very little in bicycle parking. HART and PSTA, the only Florida agencies to provide bicycle parking cost estimates, have spent only $10,000 combined on bicycle parking. The provision of bicycle parking is an important strategy in overcoming rack capacity limitations and encouraging bicycle-to-transit trips. Bicycle-to-transit trips entails bicycling to a bus stop or transfer station, leaving the bicycle parked, and boarding the bus, much like a park-and-ride concept but for bicycles. In all, transit agencies have invested very little into their BOB programs compared to the returns they receive and the costs of other transit agency initiatives. BOB Returns The second research question asked about the return on investments in terms of service area expansion, BOB boardings, new riders, and increased transit use. Transit agencies have received good returns on their investments in integrating bicycling and transit. The survey results indicate that BOB programs provide a long-term and sustainable form of transportation for patrons, particularly patrons with low-income and limited access to automobiles. Approximately 70 percent of BOB users surveyed have been using the program for over a year, and a third of users have been combining bicycling and transit for over three years. BOB users are regular users of transit, with 65 percent using it four days or more and over 40 percent making over 10 trips per week on average. BOB programs have also attracted new transit riders. Approximately 24 percent of users surveyed reported that they were new to transit. BOB programs also provide a multi-modal commute option. Almost three-quarters of respondents use BOB to commute to work. Of those that commute to work, over 60 percent bicycle more than a mile to access transit, providing a clear validation of how BOB programs can expand transit service area. According to the survey results, transit agencies
57

can also claim that bicycle access to transit encourages increased use of transit. Of those users that commute to work via BOB, 60 percent stated they started to use the service for non-work trips as well. While BOB boardings remain a small portion of total unlinked passenger trips for even the largest providers of BOB trips, the total impact of BOB programs is far-reaching and over time has the potential for substantial societal benefits in terms of health, traffic congestion, and improving air quality. Key BOB Policies and Issues As BOB programs become more popular, the limits of rack capacity begin to show. Buses begin arriving at a BOB patron’s stop with the racks already full. The transit agencies that are facing rack capacity limitations are responding in three ways. One set of agencies has started to purchase three-bike capacity racks, installing them on their most popular routes first. Eventually, these agencies plan to install them on all buses. However, it is important to mention that King County Metro’s evaluation of one manufacturer’s three-bike rack called for modifications due to excessive weight despite being very popular among their BOB patrons. The second set of agencies has adopted policies that allow patrons to bring their bicycles on board when the racks are full, and when the wheelchair area is vacant. While some agencies expressed concern with allowing bicycles in the bus due to safety and liability concerns, the agencies that have experimented with or adopted the policy did not report any problems or incidences. These agencies also did not report the need for restrictions on the time of day or day of week for BIB. The third set has recognized the problem, but has not taken any steps at the time they were surveyed. The question of whether or not to require a permit is another issue to which agencies are seeking guidance. Only two of the agencies surveyed, HART and PSTA, currently require permits, and MDT recently abandoned their requirement. Since abandoning the permit, MDT has not experienced any negative impacts of their decision. While permits can limit liability and provide a means to educate patrons, permit requirements also restrict access to transit service. Agencies without permits also believe that the rack system is so easy to use that requiring patrons to go through a training process is unnecessary. Nationally, the trend is moving toward abandoning permits, and in general, many of the claims that support the policy of requiring permits are undermined by the actual experiences of transit agencies without permit requirements. As previously stated, the lack of investment in secure bicycle parking through both racks and lockers is limiting the ability of transit agencies to improve bicycle access to their services. The transit agency surveys also shed light on two other issues of interest. In regard to the problem of bicycles abandoned on racks, most transit agencies are taking a reactive approach. While most have set up a
58

process to collect, store, and eventually donate the unclaimed bicycles, few reported taking proactive steps. While it may not be possible for the transit agency to stop people from forgetting their bicycles, efforts related to bus operator training may be one potential avenue. If they have not done so already, transit agencies should meet with all local law enforcement agencies to inform them of abandonment problems and set up a process to work together to reunite victims of the theft with their bicycles and redistribute unclaimed bicycles. Transit agencies were also interested in whether or not insurance premiums had been affected by BOB program liabilities. However, only one agency reported an impact on insurance. LYNX reported that “while there have been no significant or quantitative monetary impacts to our self insurance program, the use of bike racks has created a new list of potential claims and claimant interaction.” BOB Users Demographics The BOB user survey shed light on who typically uses the service. The demographic data that was collected suggests that BOB users are usually males who earn under $30,000 or even $20,000 a year. Hispanics and African-Americans exist in higher proportions in the BOB user population than compared to the general public. BOB users are also more likely to have limited access to a car with over 45 percent coming from households without cars. In addition, 35 percent of BOB users do not hold a valid driver’s license. This type of demographic information can be very useful in the design of social marketing campaigns desired to target special segments. For example, transit agencies could market the BOB program at traffic court, in which any person that has their driver’s license taken away or suspended is provided with information on the BOB program, bus schedules, a free one-month bus pass, and perhaps even a bicycle and helmet to provide them with a viable transportation option. Bicycles that are abandoned on racks and unclaimed could provide a good source of bicycles for such a program. Recommendations to Improve BOB Benefits The last research question called for recommendations on how transit agencies can improve the return on their investment. Discussions with transit agency contacts and the results of both surveys have provided a variety of recommendations that could potentially improve returns and mitigate rack capacity limitations. Collect BOB Boarding Data and Track Performance Measures First and foremost, all transit agencies should collect BOB boarding data. Agencies with electronic fare-boxes should program a key to record BOB trips.
59

Data can show the value of a program and, as a result, provide support for funding requests and service improvements. Table 6.1 below illustrates how easily BOB performance measures can be presented, while providing a power statement. Clearly both PSTA and HART have demonstrated increased number of BOB boardings and have increased the BOB share of unlinked passenger trips. Table 6.1: BOB Performance Measures for Florida Agencies PSTA 2000 2001 2002 2003 Annual BOB Boardings
45,600 111,480 133,800 152,400
Annual Unlinked Passenger Trips
9,360,135 9,372,832 10,118,769 9,487,531
BOB Share of Annual Unlinked Passenger Trips 0.49% 1.19% 1.32% 1.61%HART 2000 2001 2002 2003 Annual BOB Boardings
54,000 55,200 57,600 68,400
Annual Unlinked Passenger Trips
9,219,738 9,761,011 9,390,575 9,185,410
BOB Share of Annual Unlinked Passenger Trips
0.59% 0.57% 0.61% 0.74%
TalTran 2000 2001 2002 2003 Annual BOB Boardings
15,708 12,636 11,568 10,860
Annual Unlinked Passenger Trips
3,922,150 3,934,447 4,140,250 4,372,762
BOB Share of Annual Unlinked Passenger Trips
0.40% 0.32% 0.28% 0.25%
Survey BOB Users Transit agencies should also periodically survey its BOB patrons. Often the best way to discover innovative ways of improving a service is by asking the users. If permits are required, agencies already have a database from which to survey. If no database is maintained, on-board surveys are an equally good method of gathering data. By combining electronically collected BOB boardings and periodic user surveys, transit agency planners can pinpoint where modifications are needed or perhaps on which routes three-bike capacity racks are needed. Increase Rack Capacity Transit agencies that are suffering from rack capacity limitations should consider trying out three-bike capacity racks. Before making a large investment, agencies may want to consider purchasing a small number of racks. This way the new racks can be installed on the most popular routes and after a specified time, an evaluation can be conducted that gathers information from drivers, maintenance staff, and patrons.
60

Adoption of Bike-in-Bus Policy Some agencies may also want to consider experimenting with a Bikes-in-Bus policy. Despite efforts by researchers to find evidence of incidences related to bicycles being inside the bus, only a handful of minor claims have been found. Any changes to Bikes-in-Bus policies should only be made after a trial period and a thorough evaluation of the policy change. Prior to the trial period, specific policies should be explicitly outlined and bus operators should be trained to recognize the conditions when a patron is allowed to bring their bicycle on board. Patrons should also be alerted to the fact that the experiment is in progress and that the policy is temporary until completion of the evaluation. Transit agencies should also adopt a policy allowing folding bicycles on board at all times since they are typically no bigger than a stroller and can be easily secured by the owner. Bike-to-Bus Strategy One way to mitigate rack capacity limitations is to promote the Bike-to-Bus (BTB) strategy common in European nations that encourage patrons to bicycle to their bus stop, and leave their bicycle parked at the bus stop or transfer center. Perhaps the most important investment that transit agencies can make to implement this strategy is to provide more bicycle parking (bicycle parking racks and/or bicycle lockers) and incorporate bicycle racks into standard bus stop and transfer center designs. Figure 5: The Bikestation® of Downtown Berkeley, California provides valet bicycle parking for the local BART rail station.
Courtesy of www.bikestation.org.
61

Transit agencies should also investigate the possibility of opening a Bikestation®
y providing bicycling racks at bus stops, BOB users that encounter a full rack on
he BOB user survey results also indicated that approximately 61 percent of
igure 6: Bicycling to access buses is a common practice through the Europe
or a valet bicycle parking center.37 In recent years, Bikestations® have opened up in many locations (primarily in the Western United States and by transit agencies that offer rail service) offering valet bicycle parking and a host of other amenities such as bicycle repair, showers, and changing facilities. Transit agencies should also adopt a policy allowing folding bicycles on board at all times as another method for overcoming rack limitations. Bthe bus at least have the option of locking their bicycle and boarding the bus. The BOB users surveyed did indicate that 22 percent of users would park the bicycle at bus stops any time the bus racks were full, and an additional 43 percent stated that they would lock up their bike if they could not afford to miss the bus for whatever reason. TBOB work commuters bicycle more than one mile to access transit, but 80 percent travel less than one mile and almost half travel a quarter-mile or less after getting off the bus and bicycling to their place of work. This means that there are many BOB users that may only need their bicycle on one end of their commute, and therefore could switch from BOB to bike-to-bus if necessary. F
Courtesy of John Pucher, Rutgers University.
37 Transit agencies should consult www.bikestation.org to begin their inquiry into valet bicycle parking centers.
62

Agencies should also install both bicycle parking racks and bicycle lockers at transfer centers, major bus stations, and park-n-ride lots. By investing in a bike-to-transit strategy in which patrons bicycle to transit stops on the periphery of residential areas, transit agencies could potentially lessen the need to purchase and operate circulators that are designed to penetrate residential areas. Transit agencies that invest in bicycle parking and provide a large supply of quality racks and lockers that are placed in the right locations will someday see bikes-to-transit trips eclipse bikes-on-bus boardings.
63

Appendix A: References Doolittle J. T., J. and E.K. Porter (1994) Integration of Bicycles and Transit. Transportation Research Board National Research Council: Washington, D.C. Federal Highway Administration: Integrating Bicycles and Transit: http://safety.fhwa.dot.gov/ped_bike/docs/bike_bus.pdf Federal Transit Administration, Bicycles and Transit, A Partnership that Works, 1999: www.fta.dot.gov/library/policy/bikes.pdf Hagelin, Christopher (2002) Bicycle Parking Plan for Miami-Dade Transit: http://www.cutr.usf.edu/pubs/MPO_bpp_report_2002.pdf. National Bicycling and Walking Study (1992) Case Study No. 9: Linking Bicycle/Pedestrian Facilities with Transit. FHWA Publication No. FHWA-PD-93-012. Washington DC. Pucher, John (2005) Promoting Safe Walking and Cycling to Improve Public Health: Lessons from the Netherlands and Germany. Presented at FDOT District 7: Tampa, FL: February 2005. Replogle, M.A., (1984) Tapping New Transit Markets with Bicycle Access : The International Experience. Compendium of technical papers. Replogle, M.A., (1987) Bicycles on Transit: A review of international experience. Transportation Research Record No. 1141, Pedestrian and Bicycle Planning with Safety Considerations: Washington DC. Surface Transportation Policy Project (2004) Mean Streets Report. STTP: Washington DC. Available at: http://www.transact.org/library/reports_html/ ms2004/pdf/ Final_Mean_Streets_2004_4.pdf TTI (2004) Urban Mobility Report: Available at http://.mobility.tamu.edu/ums/report
64

Appendix B: Transit Agency Contact Letter and Informed Consent Form DATE INSERT ADDRESS HERE Dear _______, The Center for Urban Transportation Research (CUTR) has received a grant through the Florida Department of Transportation (FDOT) and from the National Center for Transit Research (NCTR) to conduct a Return on Investment Analysis of Bikes-on-Bus (BOB) Programs. The purpose of this project is to determine the return on investment of a BOB program from a transit agency perspective. The study will help agencies assess the benefits of integrating bicycling and transit, and what additional investments would be needed to mitigate problems hindering success. The purpose of this letter is to ask for INSERT TRANSIT AGENCY NAME HERE participation in this research project. Your agency’s participation would entail the completion of a survey focusing on the cost of implementing and maintaining your BOB program and any data the agency has collected on BOB boardings. There will also be a follow-up phone interview to clarify responses and allow for some open-ended questions regarding the BOB program. The project team would also like to survey a sample of your BOB users. For those agencies that require a permit, the project team will either mail a survey or conduct a telephone interview depending on the contact information available. If your transit agency does not require a permit, a different survey methodology would have to be considered. At this point, the project team would like to know if your agency is willing to participate in this project. If so, please fill out and sign the attached Informed Consent form (only one per agency required). This form may be return by fax or by mail per instructions on the form. If you have any questions concerning the project, please contact Christopher Hagelin, CUTR Principal Investigator at 813-974-2977 or [email protected]. Sincerely, Christopher A. Hagelin, Research Associate Center for Urban Transportation Research CC: __________, Executive Director
65

A Return on Investment Analysis of Bikes on Bus Programs: Informed Consent Form The focus of this research project will be an analysis of BOB programs in order to determine the return on investment of a BOB program from a transit agency perspective. The project will help agencies assess the benefits of integrating bicycling and transit, and what additional investments would be needed to mitigate problems hindering success. The project team is requesting participation from all major Florida transit agencies and at least four non-Florida agencies. The project is funded by the Florida Department of Transportation through the National Center for Transit Research which is housed at the Center for Urban Transportation Research. Participation in the research project is based on the following conditions:
• Your participation in this project is purely voluntary.
• Your participation will entail the completion of a survey and a follow-up phone interview. The survey and follow-up interview will focus on the costs of implementing and maintaining your BOB program and the benefits, such as BOB boardings.
• Your participation in the project may also entail aiding with the project team with the surveying of
BOB users.
• All data collected by the project team will be securely held at the Center for Urban Transportation Research. However, transit agency data is a part of the public record as the final report will be.
• The project is scheduled to last until March 2005. All agencies participating in this research will be
provided two copies of the final report. Having read and understood these conditions, is your agency willing to participate in this research project?
Yes No
Signature: ____________________________________ Date: ________________
Name: _____________________________________
Phone: _____________________________________
Email: _____________________________________
If you have any questions concerning this form or your rights as a research participant, please contact Christopher Hagelin, CUTR Principal Investigator at 813-974-2977 or [email protected]
Please mail or fax this form: Fax: 813-974-5168; Attention Christopher Hagelin Mail: Christopher Hagelin, Research Associate Center for Urban Transportation Research University of South Florida 4202 E. Fowler Ave. CUT 100 Tampa, FL 33620-5375
66

Appendix C: BOB Transit Survey Thank you for participating in this research. This project is funded by the National Center for Transit Research. The purpose of this project is to conduct a return on investment analysis of bikes on bus programs in Florida and across the United States. The data you provide will be part of final report that will be a public document. All participants will receive copies of final report. Directions:
• The survey is a protected Word document that makes use of check boxes and
text form fields . The lengths of the text form fields are set at unlimited so you may write as much or as little as you need. You can use the tab key to move from field to field. Answer should appear in blue text.
• Open document, enter your responses, save file, return via email to
[email protected] • The survey consists of 36 questions. Many questions, depending on your
response, have several sub-questions. Please be sure to answer all appropriate sub-questions.
• Throughout the survey, BOB refers to Bike on Bus program, and BOB users
refers to your patrons that use the BOB program • If you are unable to provide an answer, please enter a “?” as your response if
unknown, or “NA” if non-applicable. • For some of you, some questions may be best answered by sending CUTR a
database or perhaps links to your website, particularly for BOB operating costs or BOB boarding data. Please send any attachments to [email protected] or mail to:
Christopher Hagelin Center for Urban Transportation Research University of South Florida 4202 E. Fowler Ave. CUT 100 Tampa, FL 33620-5375
67

Bikes-on-Bus (BOB) Program History and Characteristics
1. What year did your BOB program start? 2. What percent of your bus fleet is equipped with bike racks? %
a. If 100% of fleet is equipped with racks, in what year did your agency reach 100%?
3. As of June 2004, how many total vehicles are equipped with racks?
a. If the breakdown by vehicle type is known, please complete table below: Vehicle Type Number Equipped with Racks Full-size buses (40ft) Cut-away buses Shuttle buses/Circulators Vans (vanpooling) Rubber wheeled trolleys Other (specify):
4. What company manufactured of the racks on your buses? If more than one manufacturer has been used, please describe ratio if possible.
Sportworks® Other: Mix:
5. What is the capacity of your racks?
Racks are front-mounted and have a capacity of two bicycles
Racks are front-mounted and have a capacity of three bicycles
Mixture of two and three capacity front-mounted racks
If mixture, a. Number or percentage of two-bike capacity racks: b. Number or percentage of three-bike capacity racks:
6. Does your agency use any rear-mounted racks? YES NO 7. What were the primary reasons for starting a BOB program?
68

8. Does your agency require a permit to use the BOB program?
Yes, a permit is required.
a. If yes, what is the current cost of the permit? $ b. If yes, how long is the permit valid?
Valid for one year Valid for life Other: c. If yes, does the permit process include:
Watching a video on the use of the rack? YES NO Demonstrating ability to use the rack? YES NO Receiving a picture ID card as proof of permit? YES NO
No, a permit is not required.
Used to require a permit, but policy was abandoned.
a. If your agency no longer requires a permit, what were the main reasons
for abandoning a permit? b. What, if any, has been the impact of abandoning the permit requirement?
9. Is there an additional fee (cost added to standard fare upon boarding) to use the
BOB Program?
Yes, an additional fee is required
a. If yes, what is the current fee? $
No, an additional fee is not required
Used to require an additional fee, but policy was abandoned.
a. If your agency no longer requires an additional fee to use the BOB, what were the main reasons for abandoning a permit?
b. What, if any, has been the impact of abandoning the fee requirement?
69

10. Does your agency allow patrons to bring bikes inside the bus if racks are full?
Yes, patrons are always allowed to bring bikes inside the bus if racks are full.
a. If yes, have the buses been modified to accommodate bicycles? YES NO
b. If buses have been modified, how have they been modified?
Sometimes, patrons are allowed to bring bikes inside the bus.
a. If sometimes, have the buses been modified to accommodate bicycles? YES NO b. If buses have been modified, how have they been modified? c. If sometimes, what are the policies for allowing bicycles in the bus, such
as driver discretion or only in buses modified to store bikes inside?
No, patrons are not allowed to bring bikes inside the bus.
a. If no, are there any specific reasons why this option has not been considered?
11. Are patrons allowed to bring “folding bicycles” in the bus at all times? YES NO
BOB Program Costs
12. Over the life of your program, how much has been spent purchasing racks?
13. What was the primary funding source for the purchase of your bike racks?
14. How many racks has your agency needed to replace since program started due
to damage or normal wear and tear?
If known, please provide a breakdown of why racks were replaced: a. Due to damage:
b. Due to normal wear and tear: 15. If possible please estimate in full-time equivalence (FTE), how much staff it takes
to manage your BOB program? 16. How many staff persons are involved in the “day to day” administering your BOB
program?
70

17. Please provide an estimate of BOB program costs and a breakdown of cost
categories?
There are four options depending on the level of detail you can provide. Option 1 is for those that can provide annual cost estimates the program over the last 10 years or less. Option 2 is for those who can only provide estimates of annual costs for operating the BOB program by cost category. Option 3 is for those that can only provide an estimate of overall annual operating costs associated with your BOB Program. Option 4 is for if you already have cost data in a database file, you may also just send that file to me.
OPTION 1: Cost breakdown by year of program
YEAR Capital Costs
Maintenance Costs
Administration Costs
Marketing Costs
Other Costs
TOTAL Costs
$ $ $ $ $ $ $ $ $ $ $ $ $ $ $ $ $ $ $ $ $ $ $ $ $ $ $ $ $ $ $ $ $ $ $ $ $ $ $ $ $ $ $ $ $ $ $ $ $ $ $ $ $ $ $ $ $ $ $ $
OPTION 2: Estimated annual costs Cost Definition Estimated Cost
Estimated cost of purchasing rack over lifetime of program, or $ Capital Costs Estimated annual cost of purchasing racks $
Maintenance Costs
Estimated annual cost of maintain BOB program (labor, parts together)
$
Administrative costs
Estimated annual cost of administering BOB $
Marketing costs
Estimated annual cost of marketing BOB program $
Other costs
Any additional cost categories and estimated annual costs $
TOTAL Estimate of total annual BOB budget $
OPTION 3: What is the estimated annual cost for operating your BOB program? $
OPTION 4: Send database file of BOB Costs to [email protected]
71

BOB Marketing
18. What is the title you have given your BOB program? 19. Has your agency created a special brochure for your BOB Program?
YES NO 20. Has your agency created a special web page on your BOB Program?
YES NO 21. Has your agency produced an instructional video for using the racks?
YES NO Related BOB Costs
22. Has your agency funded or help fund any bicycle facilities, such as bike lanes, to increase safe access to transit facilities?
YES
a. If yes, please describe and provide cost estimates if possible:
NO 23. Has your agency purchased and installed bicycle parking racks or lockers for
your transit stops and transfer stations?
YES a. If yes, can you estimate the number of parking racks installed? b. If yes, can you estimate the number of lockers installed? c. If yes, can you estimate the cost of purchasing the racks and/or lockers
either per year or over the lifetime of the program? $ per year or $ total
d. If yes, what funding sources were used to purchase parking racks and/or
lockers?
NO
24. Does your agency perceive route delay (from the loading and unloading of bicycles) as a problem in regard to on-time performance?
25. Has your agency needed to modify any routes due to the popularity of your BOB
program and the additional loading and unloading times?
YES a. If yes, please explain:
NO
72

26. Has implementing a BOB program impacted your agencies insurance premiums?
If yes, please describe impact.
YES a. If yes, please explain:
NO Additional BOB Issues
27. Is your agency facing a capacity problem due to the popularity of the program?
YES a. If yes, please describe any steps taken to alleviate this problem:
NO
28. Is your agency facing a problem with bicycle left on the racks?
YES a. If yes, please describe any steps taken to alleviate this problem: b. What does your agency do with bikes that are left on racks?
NO
29. Could you please describe any other problems you have experienced with your BOB program and any steps taken to alleviate the problems?
30. Have any internal oversight committees or commissions been established related
to your BOB program?
YES a. If yes, please explain:
NO 31. What other polices has your agency adopted in regard to your BOB program?
(Feel free to attach any related documents or links to webpage that contain pertinent information.)
73

BOB Program Benefits
32. Does your agency track BOB boardings?
YES a. If yes, what method is used to track BOB boardings? b. If yes, can you provide CUTR with your BOB boardings database?
YES NO
NO a. If no, is there any specific reason why BOB boardings are not
tracked?
33. If you track boarding, but can not provide a database, can you estimate how many monthly boardings has your agency averaged over the last 5 years?
YES NO
Year Average Monthly Boardings 2004 2003 2002 2001 2000
34. Have you conducted any surveys of BOB users?
YES
a. If yes, can you provide results of those surveys to CUTR? YES NO
NO
35. Does your agency maintain a database of BOB users (or permit holders, if applicable)?
YES
a. If yes, can you provide that database to CUTR? YES NO
NO
36. What information about your BOB users would be most useful to your agency?
37. What are your ideas on how BOB programs can be improved to meet the needs
of bicycling patrons? Thank you for your time. If I have any questions regarding your responses to the survey, what is the best time and day I could contact you.
Monday am Tuesday am Wednesday am Thursday am Friday am Monday pm Tuesday pm Wednesday pm Thursday pm Friday pm
74

Appendix D: BOB User Survey
Bikes on Bus User Telephone Survey Script: Good day, I am calling on behalf of the Florida Department of Transportation. We are conducting a survey of bikes-on-bus users, which are people that use the bike racks located on the front of buses. Are you a user of bikes-on-bus? IF YES CONTINUE, IF NO ASK IF SOMEONE ELSE IN THE HOUSEHOLD USES BIKES ON BUS The focus of this research project will be an analysis of BOB programs in order to determine the return on investment of a BOB program. The project will help agencies assess the benefits of integrating bicycling and transit, and what additional investments would be needed to mitigate problems hindering success. The project is funded by the Florida Department of Transportation through the National Center for Transit Research which is housed at the Center for Urban Transportation Research. Participation in the research project is based on the following conditions:
• Your participation in this project is purely voluntary. Your name will not appear in any published documents.
• Your participation will only entail the completion of this telephone survey. The survey and will focus on the way in which you use the BOB program
• The survey will take approximately five minutes of your time. • At any time you can refuse to answer a question or stop the survey. • All data collected by the project team will be securely held at the Center for Urban
Transportation Research. • The project is scheduled to last until March 2005.
Having heard and understood these conditions, are you willing to participate in this research project? IF YES CONTINUE, IF NO STOP SURVEY
1. How long have you been using BOB? 2. Did you have to pay for a permit? YES NO
a. If YES, how much?
3. How many days per week do you use BOB on average? [IF ZERO OR NEVER
ASK 3i] i. Why do you not use BOB?
4. How many total boardings per week do you average? (A round trip counts as two
boardings)
5. Did you ride the bus before you started using bikes on bus? YES NO
b. IF NO, Did BOB make it possible for you to use the bus? YES NO
75

c. If yes, do you use the bus more since starting to use BOB? YES NO i. Reasons:
6. Do you use BOB to go to work? YES NO [Skip to 7]
d. How many days per week do you typically use BOB to get to work? e. How far is your home from the bus stop/station you go to most often to go to
work? f. What is the distance between the bus stop/station and your place of work? g. Does your employer provide changing facilities? YES NO h. Lockers? YES NO i. Showers? YES NO j. Bicycle parking? YES NO
i. Racks? YES NO ii. Lockers? YES NO iii. Fenced in area? YES NO
k. Do you use BOB for other trips? YES NO [Skip to 8]
7. Where (else) do you use BOB to go?
8. How often are the racks full when the bus arrives at your stop?
Never Rarely Often All the time
l. Is this a problem? YES NO
9. Are bicycle parking racks available at bus stops/stations you use? YES NO
10. Would you lock your bike up at a stop if racks on the bus were full? YES NO
m. Comment:
11. Would you use a bicycle locker if one were available at any bus stations you use…
n. If free? YES NO o. If there was a cost? YES NO
12. In your own words, what can be done by transit agencies to improve BOB programs?
76

13. How many working vehicles do you have in your household? 14. Do you have a valid driver’s license? Yes No Suspended
15. What is your race or ethnicity? Are you . . .
White African-American Hispanic Asian American Indian Other, Specify:
16. What is your age? 18 - 24 years old 25 - 34 35 - 44 45 - 54 55 - 64 65 or older
17. What is your annual income?
Under $10,000 $10,000 - $19,999 $20,000 - $29,999 $30,000 - $39,999 $40,000 - $49,999 $50,000 - $59,999 $60,000 - $69,999 $70,000 or more
77