Embed Size (px)
Citation preview
A REPORT TO
THE HONORABLE MARK R. WARNER, GOVERNOR,
AND
THE GENERAL ASSEMBLY OF VIRGINIA
STATUS OF VIRGINIA’S WATER RESOURCES
A Report on Virginia’s Water Supply Planning Activities
Department of Environmental Quality
COMMONWEALTH OF VIRGINIA
2005

(This Page Left Intentionally Blank)
i
TABLE OF CONTENTS
EXECUTIVE SUMMARY
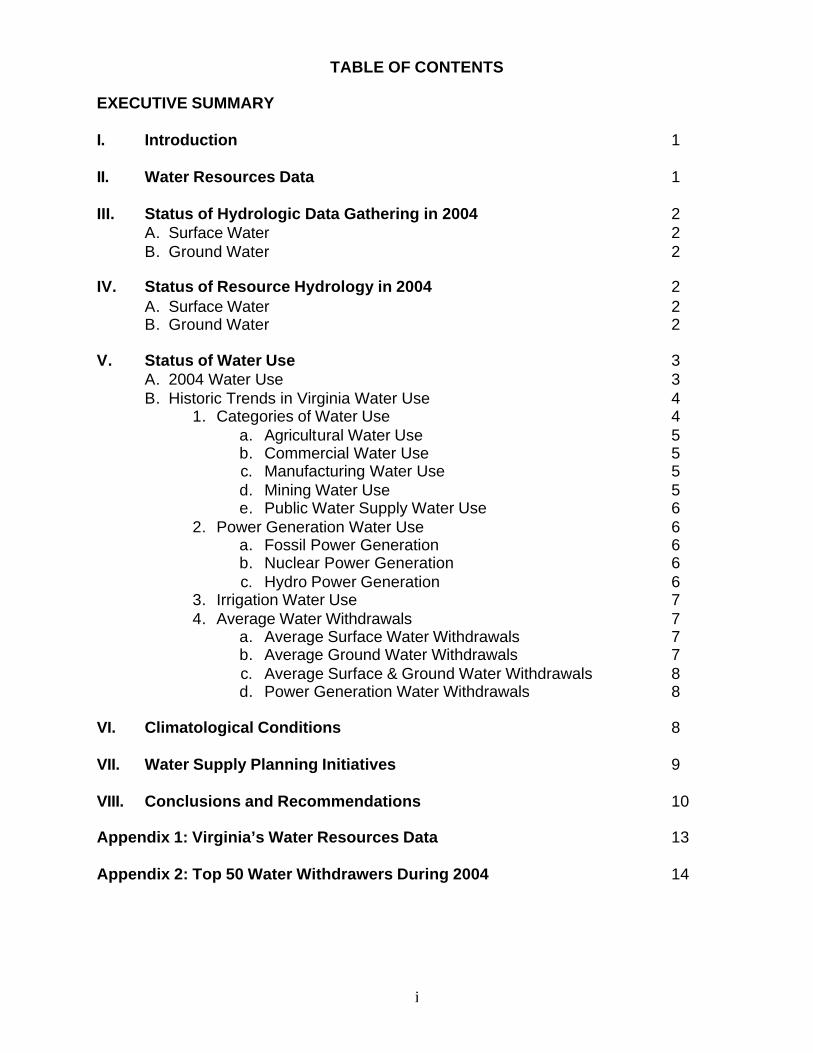
I. Introduction 1 II. Water Resources Data 1 III. Status of Hydrologic Data Gathering in 2004 2
A. Surface Water 2 B. Ground Water 2
IV. Status of Resource Hydrology in 2004 2 A. Surface Water 2 B. Ground Water 2
V. Status of Water Use 3 A. 2004 Water Use 3 B. Historic Trends in Virginia Water Use 4
1. Categories of Water Use 4 a. Agricultural Water Use 5 b. Commercial Water Use 5 c. Manufacturing Water Use 5 d. Mining Water Use 5 e. Public Water Supply Water Use 6
2. Power Generation Water Use 6 a. Fossil Power Generation 6 b. Nuclear Power Generation 6 c. Hydro Power Generation 6
3. Irrigation Water Use 7 4. Average Water Withdrawals 7
a. Average Surface Water Withdrawals 7 b. Average Ground Water Withdrawals 7 c. Average Surface & Ground Water Withdrawals 8 d. Power Generation Water Withdrawals 8
VI. Climatological Conditions 8 VII. Water Supply Planning Initiatives 9 VIII. Conclusions and Recommendations 10 Appendix 1: Virginia’s Water Resources Data 13 Appendix 2: Top 50 Water Withdrawers During 2004 14
ii
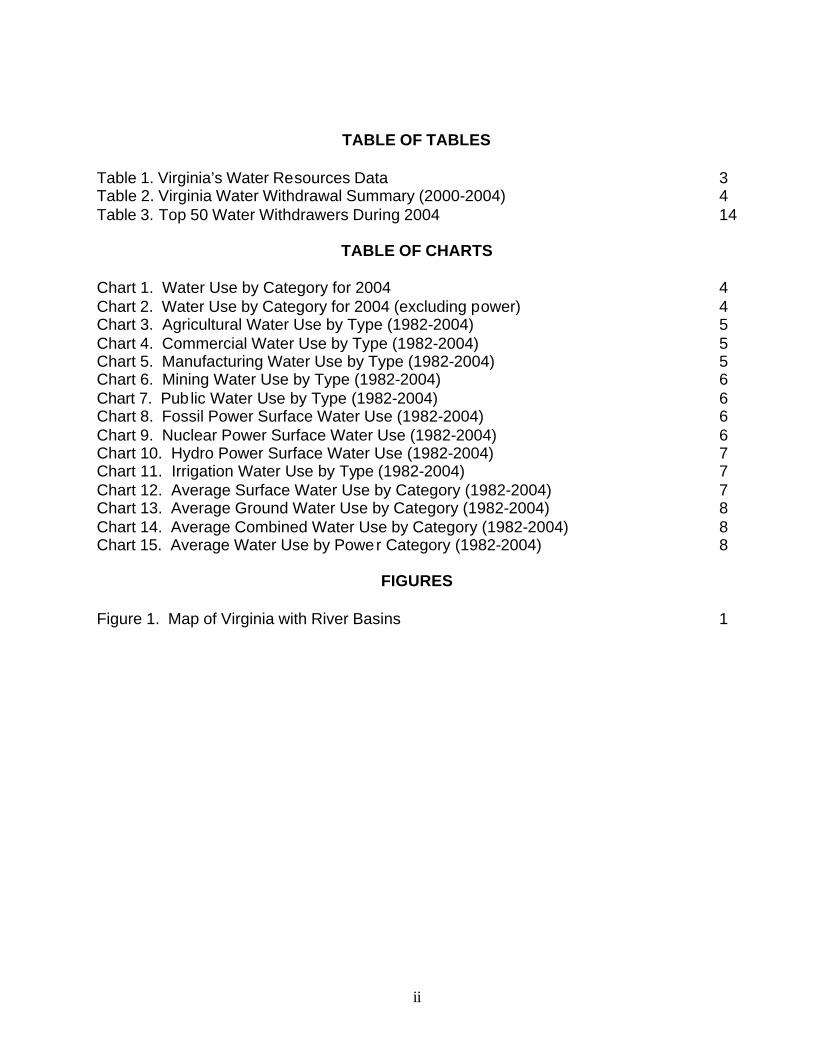
TABLE OF TABLES Table 1. Virginia’s Water Resources Data 3 Table 2. Virginia Water Withdrawal Summary (2000-2004) 4 Table 3. Top 50 Water Withdrawers During 2004 14
TABLE OF CHARTS Chart 1. Water Use by Category for 2004 4 Chart 2. Water Use by Category for 2004 (excluding power) 4 Chart 3. Agricultural Water Use by Type (1982-2004) 5 Chart 4. Commercial Water Use by Type (1982-2004) 5 Chart 5. Manufacturing Water Use by Type (1982-2004) 5 Chart 6. Mining Water Use by Type (1982-2004) 6 Chart 7. Public Water Use by Type (1982-2004) 6 Chart 8. Fossil Power Surface Water Use (1982-2004) 6 Chart 9. Nuclear Power Surface Water Use (1982-2004) 6 Chart 10. Hydro Power Surface Water Use (1982-2004) 7 Chart 11. Irrigation Water Use by Type (1982-2004) 7 Chart 12. Average Surface Water Use by Category (1982-2004) 7 Chart 13. Average Ground Water Use by Category (1982-2004) 8 Chart 14. Average Combined Water Use by Category (1982-2004) 8 Chart 15. Average Water Use by Power Category (1982-2004) 8
FIGURES
Figure 1. Map of Virginia with River Basins 1
1
STATUS OF VIRGINIA’S WATER RESOURCES A REPORT ON VIRGINIA’S WATER SUPPLY PLANNING ACTIVITIES – OCTOBER 2005 EXECUTIVE SUMMARY The ability to effectively manage Virginia's Water Resources requires an awareness of the current categories and volumes of water use as well as recognition of the historic trends in water use in the Commonwealth. This report describes the status of the Commonwealth’s surface and ground water resources and provides an overview of the Commonwealth’s Water Supply Program. I. Introduction Virginia’s current and future economic growth depends on the availability of quality water resources. We need to assure that water is available in the future for these purposes. We are fortunate that we have historically had abundant water resources in Virginia. To assure that water resources are available for future generations, we must manage them wisely. With proper planning, our water resources are capable of serving multiple uses in a balanced manner. In the 21st century, sufficient water to meet our needs will not just happen, our resources must be continuously planned for so that they remain available to us and are protected from pollution and over use. This report, submitted to the Governor and the Virginia General Assembly in accordance with Chapter 3.2 of Title 62.1 of the Code of Virginia, describes the status of the Commonwealth’s water sources, both surface and ground water. The report also provides an overview of climatological conditions and impacts on water supplies in the Commonwealth. Section VII entitled “Water Supply Planning Initiatives” summarizes Governor Warner’s comprehensive efforts to
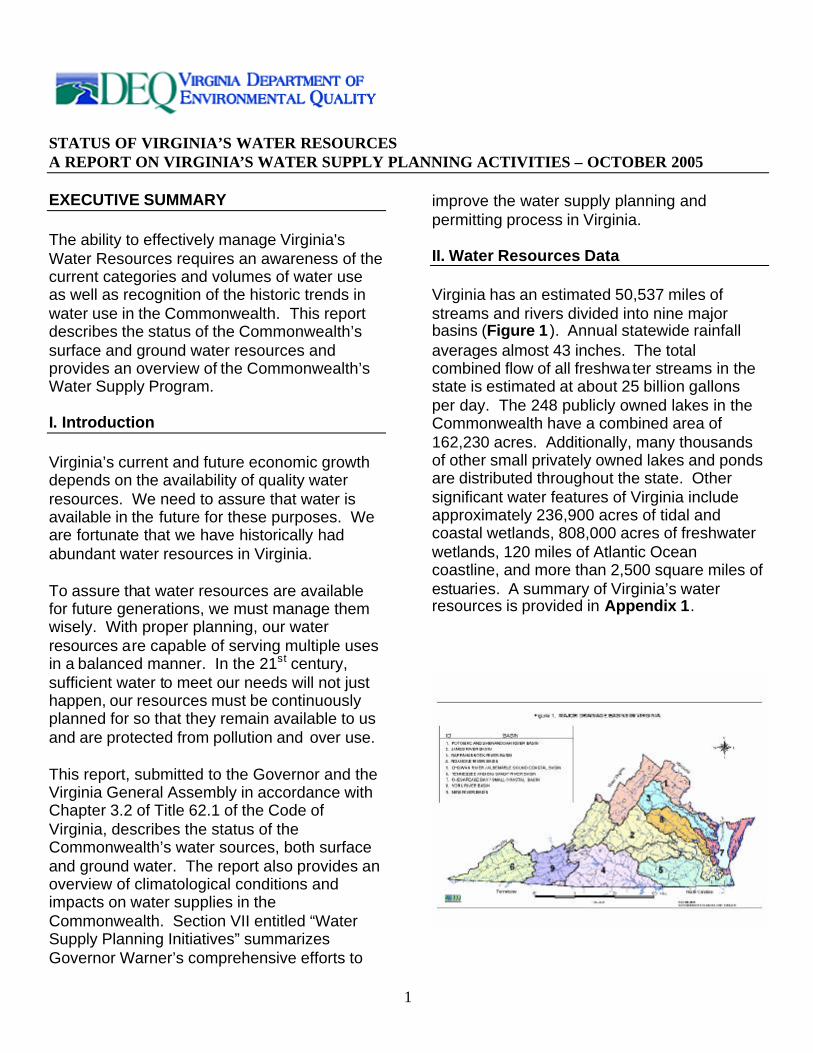
improve the water supply planning and permitting process in Virginia. II. Water Resources Data Virginia has an estimated 50,537 miles of streams and rivers divided into nine major basins (Figure 1 ). Annual statewide rainfall averages almost 43 inches. The total combined flow of all freshwater streams in the state is estimated at about 25 billion gallons per day. The 248 publicly owned lakes in the Commonwealth have a combined area of 162,230 acres. Additionally, many thousands of other small privately owned lakes and ponds are distributed throughout the state. Other significant water features of Virginia include approximately 236,900 acres of tidal and coastal wetlands, 808,000 acres of freshwater wetlands, 120 miles of Atlantic Ocean coastline, and more than 2,500 square miles of estuaries. A summary of Virginia’s water resources is provided in Appendix 1.
2
III. Status of Hydrologic Data Gathering in 2004
A. Surface Water
The Department of Environmental Quality (DEQ) and the U.S. Geological Survey (USGS) are the primary agencies responsible for collecting hydrologic data in Virginia. The two agencies have worked cooperatively since 1925, except for a period between 1957 and 1967 when they operated independently. Individually, the agencies carry out their own agendas in the collection of hydrologic data. Together, they provide a comprehensive picture of hydrologic affairs in the Commonwealth. To collect systematic hydrologic data on surface water levels, flow volumes, and other streamflow data, the DEQ operates 72 continuous-record stream gaging stations all of which are real time recording of flows using satellite technology and more than 100 other measurement sites. The continuous-record gages are located primarily on larger, free-flowing streams whereas the DEQ miscellaneous measurement sites are in support of the TMDL program. The USGS operates 94 continuous-record gages and more than 100 miscellaneous measurement sites in Virginia. The USGS collects water quality data at 11 continuous-record gaging stations. The USGS also operates 13 gages that provide stage (surface level height) data for lakes and reservoirs. The flow, lake level, water quality, and miscellaneous measurement data are published in Volume 1, Water Resources Data – Virginia, an annual report cooperatively prepared by the DEQ and the USGS. The gages farthest downstream in each major river basin are used to summarize or index the hydrologic condition of the Commonwealth for any given water year. Water years run from October 1 through September 30.
B. Ground Water
The DEQ collects data on ground water level at 185 wells. Ground water level in 25 of these
wells has been converted to 15 minute real time measurements using satellite technology. The USGS collects similar data at 161 wells, with water quality data being collected at 40 of those wells. These data are published in Volume 2 of the Annual Water Resources Data Report, which is cooperatively prepared by the DEQ and the USGS. The water level data collected by the DEQ contributes to a long-term ground water modeling project with the USGS. During 2004, DEQ continued working with the USGS on a multi-year effort to update and revise this ground water flow model (expected to be completed in late 2006) to better manage the ground water resources of the Virginia Coastal Plain. IV. Status of Resource Hydrology in 2004
A. Surface Water
Calendar year 2004 was one of the wettest on record with stream flow remaining above normal throughout the year. Water supply reservoirs were filled to capacity during the year. The remnants of four hurricanes brought varying amounts of significant precipitation to Virginia. Tropical storm Gaston struck parts of Virginia in August of 2004 dumping rain on to already saturated soils. Richmond and its surrounding counties received approximately 14 inches of rain in a six-hour period causing disastrous urban flooding and loss of life in the surrounding counties. Many of the roads and business damaged by the floods were closed for months while others are still closed one year later.
B. Ground water
During 2004, the water levels in water table wells were generally above average for most of the water year (U.S. Geological Survey, Water Resources Data-Virginia Water Year 2004, Volume 2, Water-Data Report VA-01-2, page 2). Water levels in the confined Middle Potomac and Upper Potomac aquifers, however, continued their steady decline due to recent increases in withdrawals. Slight fluctuations to the contrary are due to

3
variations in pumping schedules (U.S. Geological Survey, Water Resources Data-Virginia Water Year 2004, Volume 2, Water-Data Report VA-01-2, page 2). V. Status of Water Use The most recent water use report by the USGS, titled Estimated Use of Water in the United States in 2000 estimated that 75 percent of Virginia’s population is served by public water supply systems and 25 percent is supplied through private wells. Surface water sources supply 88 percent of the public water, and ground water sources supply the remaining 12 percent. The 2000 publication is the latest in print. The publication is updated and re-compiled every five years and new data will be published next year. The Virginia Water Withdrawal Reporting Regulation (9 VAC 25-200-10 et seq.) requires that individuals or facilities that withdraw water at volumes greater than 10,000 gallons per day (one million gallons per month for crop irrigators) must measure and report annually to DEQ the monthly volume of water withdrawn. The Virginia Water Use Data System (VWUDS) database contains withdrawal data collected since 1982 under this regulation. The information presented below represents reported water withdrawals by category covered by the water withdrawal reporting regulation. Withdrawals of less than 10,000 gallons per day (gpd) are exempt from the reporting requirements and are not included in this report.
A. 2004 Water Use
Table 1 lists the top 20 individual non-power generating water users, ranked by the amount of their 2004 reported withdrawals. Excluding electric power facilities, public water supply systems were the largest consumers of water in the Commonwealth, accounting for 57 percent of the remaining withdrawals. The second largest consumer of water in Virginia is manufacturing, which accounted for 37 percent of withdrawals . Appendix 2 includes a list of
the top 50 water users including use by power generating facilities.
Table 1 Top 20 Water Users in 2004 (Non-Power)
OWNER NAME SYSTEM TOTAL
(MGD) CATEGORY
HONEYWELL INTERNATIONAL INC
HOPEWELL PLANT
127.33 MAN
FAIRFAX COUNTY WATER
POTOMAC RIVER
84.49 PWS
RICHMOND, CITY OF
RICHMOND, CITY
74.30 PWS
CINERGY SOLUTIONS OF
CELCO PLANT 62.40 MAN
NORFOLK, CITY OF
NORFOLK 57.55 PWS
FAIRFAX COUNTY WATER
OCCOQUAN 55.14 PWS
GIANT YORKTOWN INC
YORKTOWN REFINERY
54.66 MAN
MEADWESTVACO CORPORATION
COVINGTON PLANT
39.60 MAN
INTERNATIONAL PAPER CORP
FRANKLIN PLANT
36.74 MAN
DUPONT E I DE NEMOURS & CO
SPRUANCE PLANT
29.34 MAN
APPOMATTOX R WATER
LAKE CHESDIN 26.99 PWS
NEWPORT NEWS, CITY OF
NEWPORT NEWS
26.31 PWS
NEWPORT NEWS, CITY OF
NEWPORT NEWS
25.21 PWS
HONEYWELL NYLON INC
CHESTERFIELD PLANT
23.03 MAN
VIRGINIA AMERICAN WATER
HOPEWELL DISTRICT
21.52 PWS
NEWPORT NEWS, CITY OF
NEWPORT NEWS
21.44 PWS
ST LAURENT PAPER PRODUCTS
WEST POINT PLANT
19.20 MAN
HENRICO COUNTY
HENRICO COUNTY WTP
16.89 PWS
PORTSMOUTH, CITY OF
PORTSMOUTH 16.80 PWS
VIRGINIA BEACH, CITY OF
VIRGINIA BEACH
15.46 PWS
TOTAL 834.40
Abbreviations Legend: MAN= MANUFACTURING, PWS= PUBLIC WATER SUPPLY
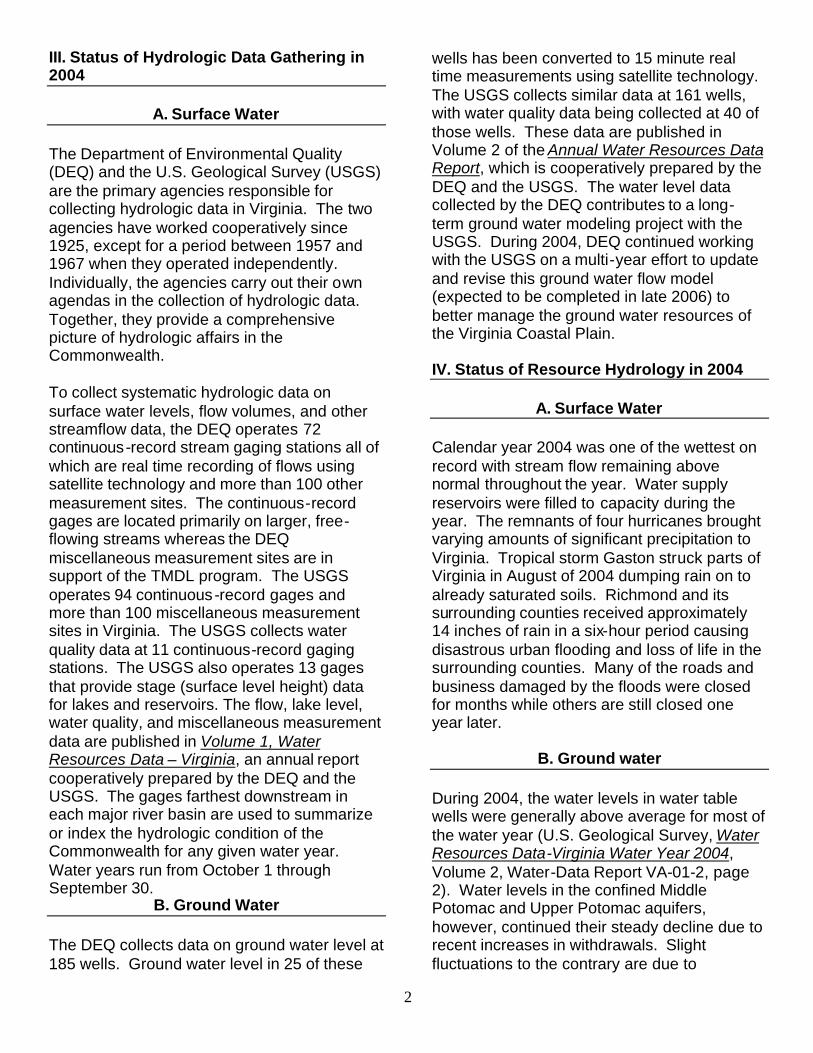
Excluding power, reported 2004 water use increased by nearly 500 million gallons per day (mgd) over that reported in 2003. Chart 1 on the following page shows the water usage in 2004 for categories excluding power generation. It shows that in 2004, public water supplies accounted for the greatest percentage (57%) of the total ground water and surface water use in Virginia. Manufacturing use in 2004 remained strong as well with 37% of the total ground water and surface water use.
4
Chart 1
WATER USE BY CATEGORY FOR 2004(EXCLUDING POWER)
(1348 MGD)
AGRICULTURE, 18.9, 1%
MANUFACTURING, 505.0, 37%
MINING, 39.1, 3%
PUBLIC WATER, 759.4, 57%
COMMERCIAL, 15.7, 1%
IRRIGATION, 10.0, 1%
The relative contribution of surface and ground water sources to 2004 non-power generation withdrawals is illustrated in Chart 2 . The chart shows that large water demands are primarily met by surface water sources. Users of ground water sources outnumber surface water users; however, the amount of ground water withdrawn from aquifers is less than is withdrawn from streams and reservoirs.
Chart 2WATER USE BY SOURCE IN 2004
(1348 MGD)
WELLS, 152, 11%
SPRINGS, 45, 3%
STREAMS, 761, 57%
RESERVOIRS, 390, 29%
B. Historic Trends in Virginia Water Use
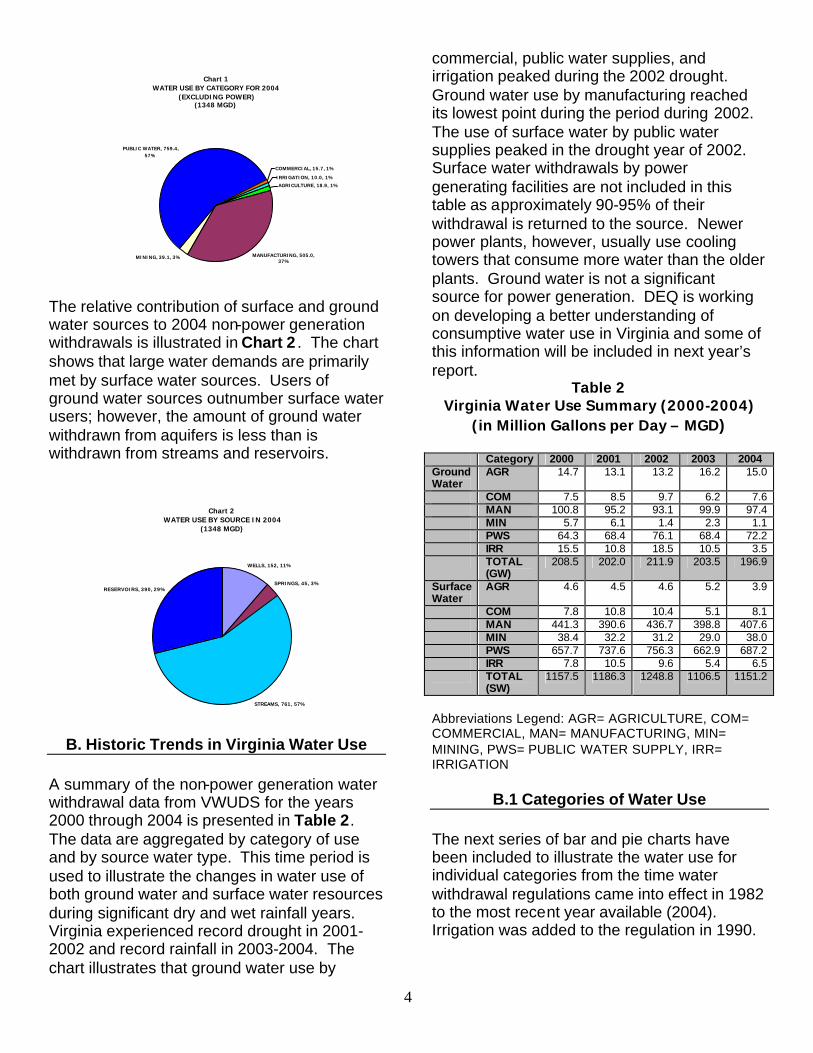
A summary of the non-power generation water withdrawal data from VWUDS for the years 2000 through 2004 is presented in Table 2. The data are aggregated by category of use and by source water type. This time period is used to illustrate the changes in water use of both ground water and surface water resources during significant dry and wet rainfall years. Virginia experienced record drought in 2001-2002 and record rainfall in 2003-2004. The chart illustrates that ground water use by
commercial, public water supplies, and irrigation peaked during the 2002 drought. Ground water use by manufacturing reached its lowest point during the period during 2002. The use of surface water by public water supplies peaked in the drought year of 2002. Surface water withdrawals by power generating facilities are not included in this table as approximately 90-95% of their withdrawal is returned to the source. Newer power plants, however, usually use cooling towers that consume more water than the older plants. Ground water is not a significant source for power generation. DEQ is working on developing a better understanding of consumptive water use in Virginia and some of this information will be included in next year’s report.
Table 2 Virginia Water Use Summary (2000-2004)
(in Million Gallons per Day – MGD)
Category 2000 2001 2002 2003 2004 Ground Water
AGR 14.7 13.1 13.2 16.2 15.0
COM 7.5 8.5 9.7 6.2 7.6 MAN 100.8 95.2 93.1 99.9 97.4 MIN 5.7 6.1 1.4 2.3 1.1 PWS 64.3 68.4 76.1 68.4 72.2 IRR 15.5 10.8 18.5 10.5 3.5 TOTAL
(GW) 208.5 202.0 211.9 203.5 196.9
Surface Water
AGR 4.6 4.5 4.6 5.2 3.9
COM 7.8 10.8 10.4 5.1 8.1 MAN 441.3 390.6 436.7 398.8 407.6 MIN 38.4 32.2 31.2 29.0 38.0 PWS 657.7 737.6 756.3 662.9 687.2 IRR 7.8 10.5 9.6 5.4 6.5 TOTAL
(SW) 1157.5 1186.3 1248.8 1106.5 1151.2
Abbreviations Legend: AGR= AGRICULTURE, COM= COMMERCIAL, MAN= MANUFACTURING, MIN= MINING, PWS= PUBLIC WATER SUPPLY, IRR= IRRIGATION
B.1 Categories of Water Use The next series of bar and pie charts have been included to illustrate the water use for individual categories from the time water withdrawal regulations came into effect in 1982 to the most recent year available (2004). Irrigation was added to the regulation in 1990.

5
B.1.a Agricultural Water Use Agricultural (Chart 3) withdrawals include operations such as commodity farms, fish farms and hatcheries. Ground water withdrawals accounted for the majority of agricultural water use over the period of 1982 through 2004. Ground water use averaged approximately 15 mgd while surface water use for agriculture averaged approximately 5 mgd. For 2004 agricultural use of ground water averaged approximately 15 mgd, while use of surface water averaged approximately 4 mgd.
Chart 3AGRICULTURAL WATER USE BY TYPE (1982-2004)
0.0
2.0
4.0
6.0
8.0
10.0
12.0
14.0
16.0
18.0
1982
1983
1984
1985
1986
1987
1988
1989
1990
1991
1992
1993
1994
1995
1996
1997
1998
1999
2000
2001
2002
2003
2004
YEAR
MIL
LIO
N G
ALL
ON
S P
ER D
AY
AG GROUNDWATER
AG SURFACE WATER
B.1.b Commercial Water Use Commercial (Chart 4 ) withdrawals include operations such as golf courses, local and federal installations, hotels and laundromats. Commercial use of surface water exceeded the commercial use of ground water for the majority of the period of record with the exception of 1983 when ground water accounted for a large majority of the use. In addition, since 2000 the commercial use of both sources has been relatively equal with surface water use only marginally greater for most of the period. Data for 2004 indicates a fairly equal use of both sources, with ground water approximately 7.5 mgd and surface water approximately 8.0 mgd.
Chart 4COMMERCIAL WATER USE BY TYPE (1982-2004)
0.0
2.0
4.0
6.0
8.0
10.0
12.0
14.0
16.0
1982
1983
1984
1985
1986
1987
1988
1989
1990
1991
1992
1993
1994
1995
1996
1997
1998
1999
2000
2001
2002
2003
2004
YEAR
MIL
LIO
N G
ALL
ON
S P
ER
DA
Y
COM GROUNDWATER
COM SURFACE WATER
B.1.c Manufacturing Water Use Manufacturing (Chart 5 ) withdrawals include operations such as paper mills, food processors, drug companies, furniture, and concrete companies. The major source of water for manufacturing has consistently been surface water. Ground water use for the period of record averaged approximately 100 mgd, while surface water use was 400 mgd or greater for each of the periods of record.
Chart 5MANUFACTURING WATER USE BY TYPE (1982-2004)
0.0
100.0
200.0
300.0
400.0
500.0
600.0
1982
1983
1984
1985
1986
1987
1988
1989
1990
1991
1992
1993
1994
1995
1996
1997
1998
1999
2000
2001
2002
2003
2004
YEAR
MIL
LIO
N G
ALL
ON
S P
ER
DA
Y
MAN GROUNDWATER
MAN SURFACE WATER
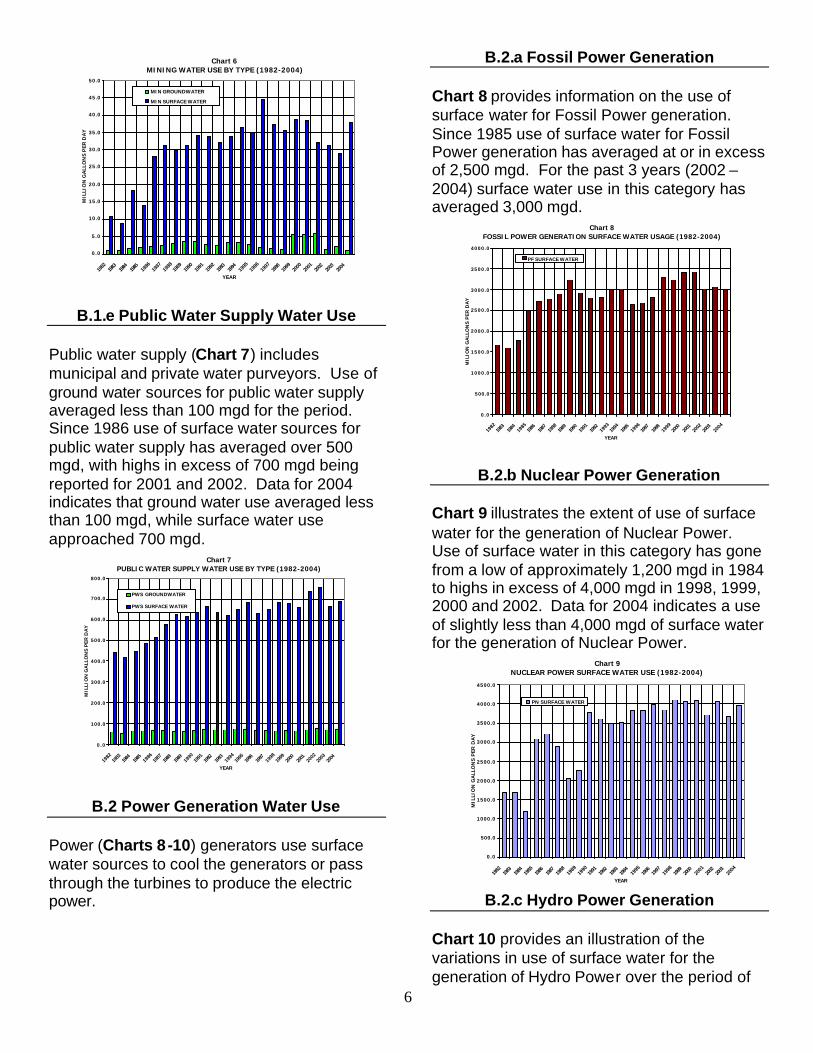
B.1.d Mining Water Use Mining (Chart 6) withdrawals include operations such as sand, rock and coal companies. Mining withdrawals of ground water normally fall below 5 mgd, while withdrawals of surface water have ranged well above 25 mgd since 1987. Data for 2004 indicates an average of approximately 1 mgd for mining use of ground water and in excess of 35 mgd for surface water use.
6
Chart 6MINING WATER USE BY TYPE (1982-2004)
0.0
5.0
10.0
15.0
20.0
25.0
30.0
35.0
40.0
45.0
50.0
1982
1983
1984
1985
1986
1987
1988
1989
1990
1991
1992
1993
1994
1995
1996
1997
1998
1999
2000
2001
2002
2003
2004
YEAR
MIL
LIO
N G
ALL
ON
S P
ER
DA
Y
MIN GROUNDWATER
MIN SURFACE WATER
B.1.e Public Water Supply Water Use Public water supply (Chart 7) includes municipal and private water purveyors. Use of ground water sources for public water supply averaged less than 100 mgd for the period. Since 1986 use of surface water sources for public water supply has averaged over 500 mgd, with highs in excess of 700 mgd being reported for 2001 and 2002. Data for 2004 indicates that ground water use averaged less than 100 mgd, while surface water use approached 700 mgd.
Chart 7PUBLIC WATER SUPPLY WATER USE BY TYPE (1982-2004)
0.0
100.0
200.0
300.0
400.0
500.0
600.0
700.0
800.0
1982
1983
1984
1985
1986
1987
1988
1989
1990
1991
1992
1993
1994
1995
1996
1997
1998
1999
2000
2001
2002
2003
2004
YEAR
MIL
LIO
N G
ALL
ON
S P
ER
DA
Y
PWS GROUNDWATER
PWS SURFACE WATER
B.2 Power Generation Water Use Power (Charts 8-10) generators use surface water sources to cool the generators or pass through the turbines to produce the electric power.
B.2.a Fossil Power Generation Chart 8 provides information on the use of surface water for Fossil Power generation. Since 1985 use of surface water for Fossil Power generation has averaged at or in excess of 2,500 mgd. For the past 3 years (2002 – 2004) surface water use in this category has averaged 3,000 mgd.
Chart 8FOSSIL POWER GENERATION SURFACE WATER USAGE (1982-2004)
0.0
500.0
1000.0
1500.0
2000.0
2500.0
3000.0
3500.0
4000.0
1982
1983
1984
1985
1986
1987
1988
1989
1990
1991
1992
1993
1994
1995
1996
1997
1998
1999
2000
2001
2002
2003
2004
YEAR
MIL
ION
GA
LLO
NS
PE
R D
AY
PF SURFACE WATER
B.2.b Nuclear Power Generation Chart 9 illustrates the extent of use of surface water for the generation of Nuclear Power. Use of surface water in this category has gone from a low of approximately 1,200 mgd in 1984 to highs in excess of 4,000 mgd in 1998, 1999, 2000 and 2002. Data for 2004 indicates a use of slightly less than 4,000 mgd of surface water for the generation of Nuclear Power.
Chart 9NUCLEAR POWER SURFACE WATER USE (1982-2004)
0.0
500.0
1000.0
1500.0
2000.0
2500.0
3000.0
3500.0
4000.0
4500.0
1982
1983
1984
1985
1986
1987
1988
1989
1990
1991
1992
1993
1994
1995
1996
1997
1998
1999
2000
2001
2002
2003
2004
YEAR
MIL
LIO
N G
ALL
ON
S P
ER
DA
Y
PN SURFACE WATER
B.2.c Hydro Power Generation
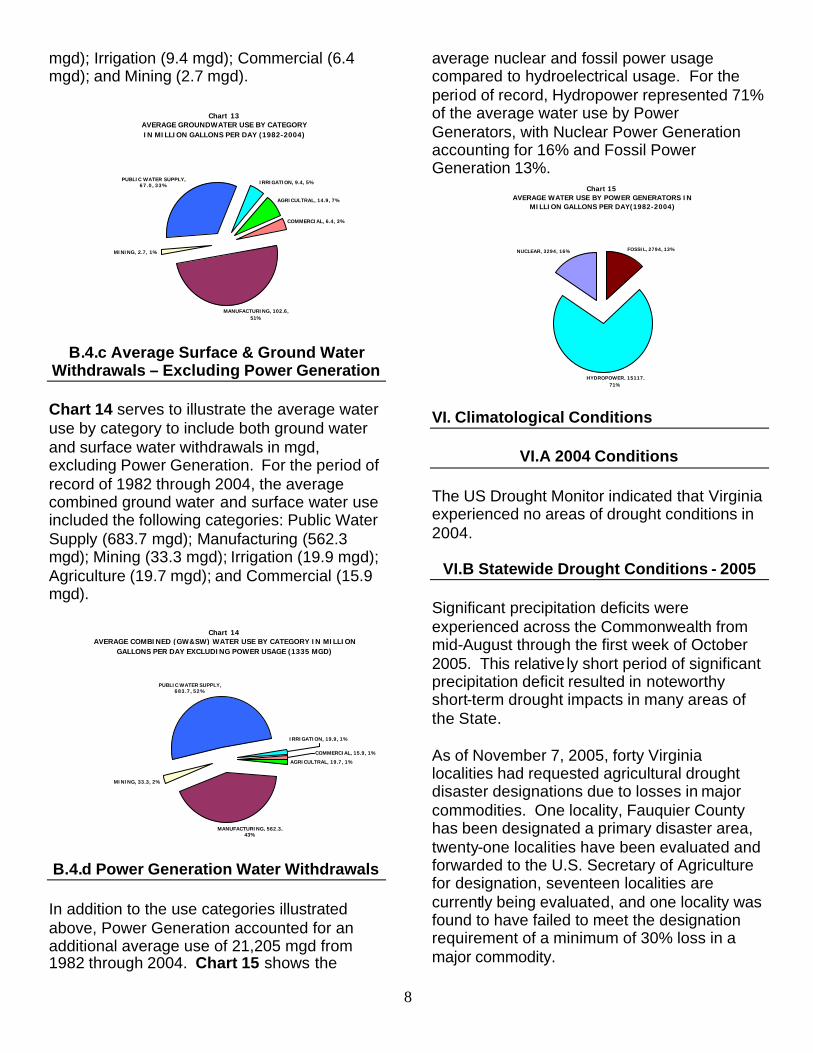
Chart 10 provides an illustration of the variations in use of surface water for the generation of Hydro Power over the period of
7
record. Use of surface water in this category has fluctuated greatly over the period with a high of approximately 24,000 mgd in 1984 to a low of approximately 6,000 mgd in 2002. Use in 2004 averaged approximately 12,000 mgd.
Chart 10HYDRO POWER SURFACE WATER USE (1982-2004)
0.0
5000.0
10000.0
15000.0
20000.0
25000.0
1982
1983
1984
1985
1986
1987
1988
1989
1990
1991
1992
1993
1994
1995
1996
1997
1998
1999
2000
2001
2002
2003
2004
YEAR
MIL
LIO
N G
ALL
ON
S P
ER
DA
Y
PH SURFACE WATER
B.3 Irrigation Water Use
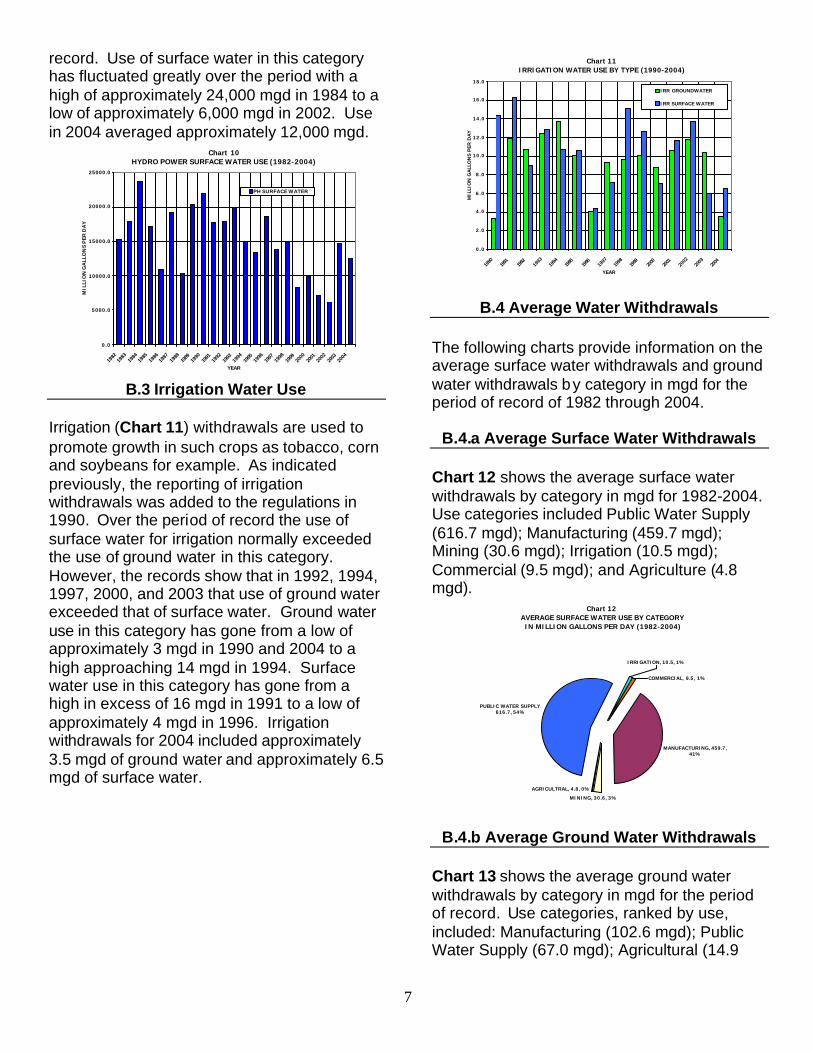
Irrigation (Chart 11) withdrawals are used to promote growth in such crops as tobacco, corn and soybeans for example. As indicated previously, the reporting of irrigation withdrawals was added to the regulations in 1990. Over the period of record the use of surface water for irrigation normally exceeded the use of ground water in this category. However, the records show that in 1992, 1994, 1997, 2000, and 2003 that use of ground water exceeded that of surface water. Ground water use in this category has gone from a low of approximately 3 mgd in 1990 and 2004 to a high approaching 14 mgd in 1994. Surface water use in this category has gone from a high in excess of 16 mgd in 1991 to a low of approximately 4 mgd in 1996. Irrigation withdrawals for 2004 included approximately 3.5 mgd of ground water and approximately 6.5 mgd of surface water.
Chart 11IRRIGATION WATER USE BY TYPE (1990-2004)
0.0
2.0
4.0
6.0
8.0
10.0
12.0
14.0
16.0
18.0
1990
1991
1992
1993
1994
1995
1996
1997
1998
1999
2000
2001
2002
2003
2004
YEAR
MIL
LIO
N G
ALL
ON
S P
ER D
AY
IRR GROUNDWATER
IRR SURFACE WATER
B.4 Average Water Withdrawals The following charts provide information on the average surface water withdrawals and ground water withdrawals by category in mgd for the period of record of 1982 through 2004.
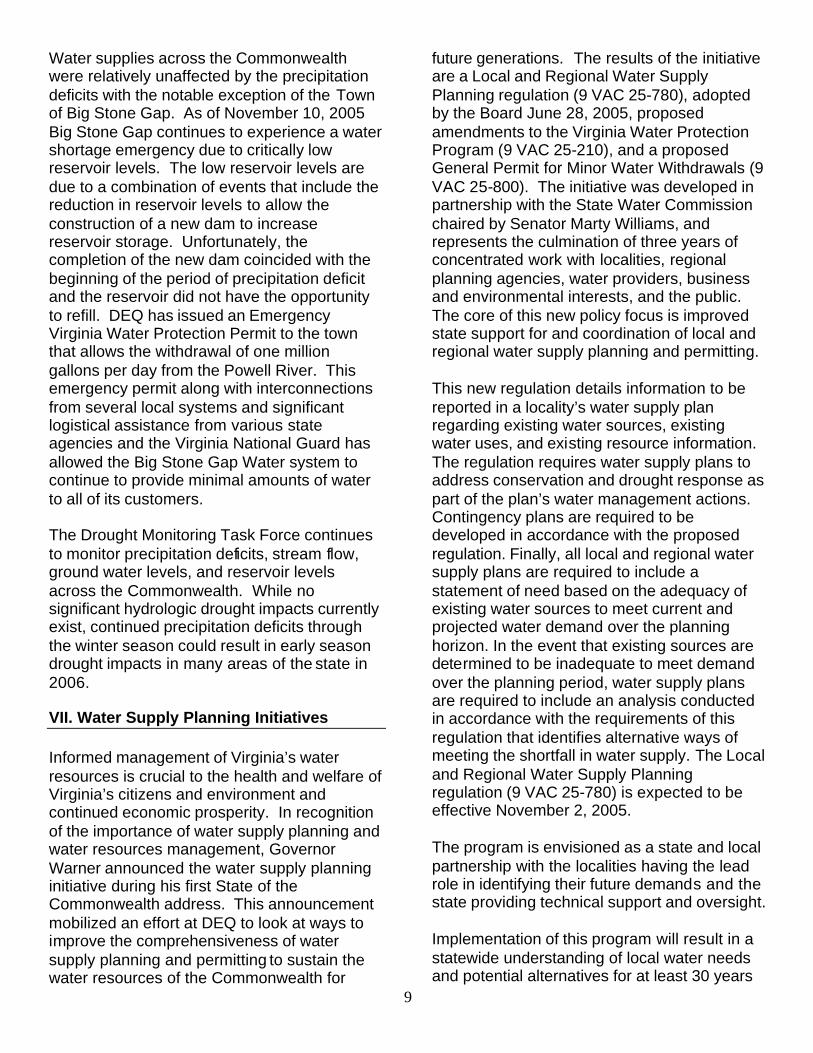
B.4.a Average Surface Water Withdrawals Chart 12 shows the average surface water withdrawals by category in mgd for 1982-2004. Use categories included Public Water Supply (616.7 mgd); Manufacturing (459.7 mgd); Mining (30.6 mgd); Irrigation (10.5 mgd); Commercial (9.5 mgd); and Agriculture (4.8 mgd).
Chart 12AVERAGE SURFACE WATER USE BY CATEGORY IN MILLION GALLONS PER DAY (1982-2004)
MANUFACTURING, 459.7, 41%
MINING, 30.6, 3%
PUBLIC WATER SUPPLY, 616.7, 54%
AGRICULTRAL, 4.8, 0%
IRRIGATION, 10.5, 1%
COMMERCIAL, 9.5, 1%
B.4.b Average Ground Water Withdrawals
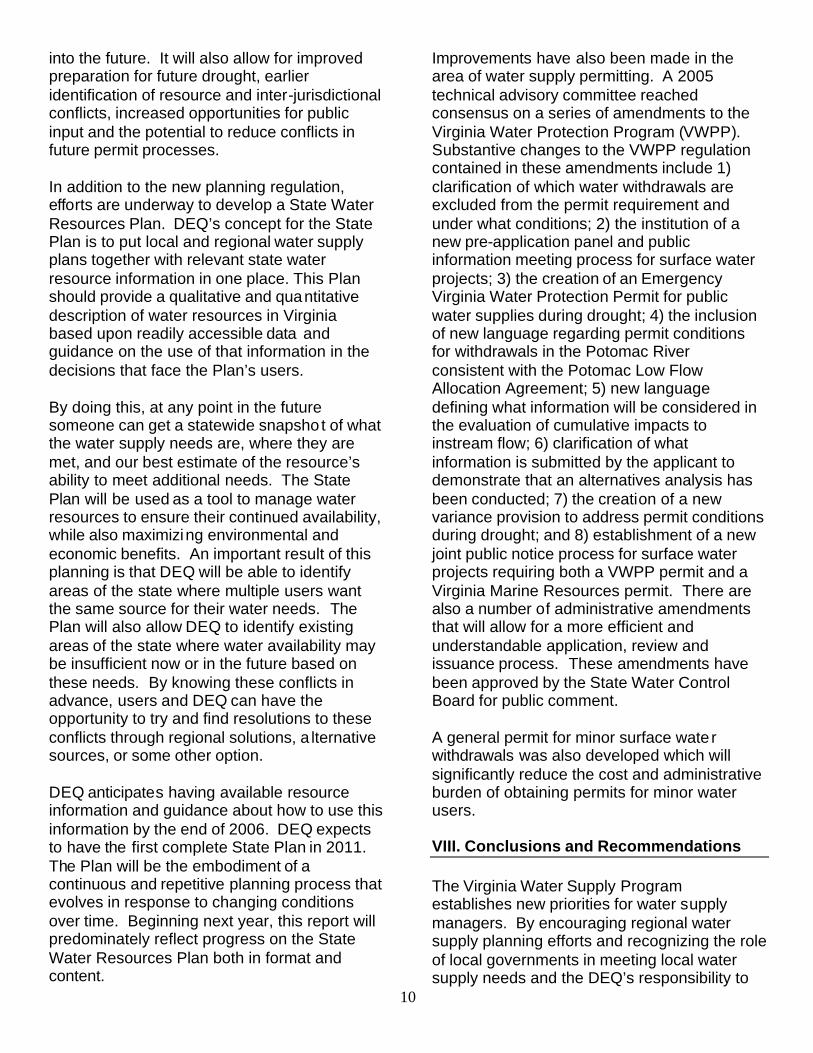
Chart 13 shows the average ground water withdrawals by category in mgd for the period of record. Use categories, ranked by use, included: Manufacturing (102.6 mgd); Public Water Supply (67.0 mgd); Agricultural (14.9
8
mgd); Irrigation (9.4 mgd); Commercial (6.4 mgd); and Mining (2.7 mgd).
Chart 13AVERAGE GROUNDWATER USE BY CATEGORY IN MILLION GALLONS PER DAY (1982-2004)
AGRICULTRAL, 14.9, 7%
COMMERCIAL, 6.4, 3%
MANUFACTURING, 102.6, 51%
MINING, 2.7, 1%
PUBLIC WATER SUPPLY, 67.0, 33% IRRIGATION, 9.4, 5%
B.4.c Average Surface & Ground Water
Withdrawals – Excluding Power Generation Chart 14 serves to illustrate the average water use by category to include both ground water and surface water withdrawals in mgd, excluding Power Generation. For the period of record of 1982 through 2004, the average combined ground water and surface water use included the following categories: Public Water Supply (683.7 mgd); Manufacturing (562.3 mgd); Mining (33.3 mgd); Irrigation (19.9 mgd); Agriculture (19.7 mgd); and Commercial (15.9 mgd).
Chart 14AVERAGE COMBINED (GW&SW) WATER USE BY CATEGORY IN MILLION
GALLONS PER DAY EXCLUDING POWER USAGE (1335 MGD)
AGRICULTRAL, 19.7, 1%
MANUFACTURING, 562.3, 43%
MINING, 33.3, 2%
PUBLIC WATER SUPPLY, 683.7, 52%
COMMERCIAL, 15.9, 1%
IRRIGATION, 19.9, 1%
B.4.d Power Generation Water Withdrawals In addition to the use categories illustrated above, Power Generation accounted for an additional average use of 21,205 mgd from 1982 through 2004. Chart 15 shows the
average nuclear and fossil power usage compared to hydroelectrical usage. For the period of record, Hydropower represented 71% of the average water use by Power Generators, with Nuclear Power Generation accounting for 16% and Fossil Power Generation 13%.
Chart 15AVERAGE WATER USE BY POWER GENERATORS IN
MILLION GALLONS PER DAY(1982-2004)
FOSSIL, 2794, 13%
HYDROPOWER, 15117, 71%
NUCLEAR, 3294, 16%
VI. Climatological Conditions
VI.A 2004 Conditions The US Drought Monitor indicated that Virginia experienced no areas of drought conditions in 2004.
VI.B Statewide Drought Conditions - 2005 Significant precipitation deficits were experienced across the Commonwealth from mid-August through the first week of October 2005. This relative ly short period of significant precipitation deficit resulted in noteworthy short-term drought impacts in many areas of the State. As of November 7, 2005, forty Virginia localities had requested agricultural drought disaster designations due to losses in major commodities. One locality, Fauquier County has been designated a primary disaster area, twenty-one localities have been evaluated and forwarded to the U.S. Secretary of Agriculture for designation, seventeen localities are currently being evaluated, and one locality was found to have failed to meet the designation requirement of a minimum of 30% loss in a major commodity.
9
Water supplies across the Commonwealth were relatively unaffected by the precipitation deficits with the notable exception of the Town of Big Stone Gap. As of November 10, 2005 Big Stone Gap continues to experience a water shortage emergency due to critically low reservoir levels. The low reservoir levels are due to a combination of events that include the reduction in reservoir levels to allow the construction of a new dam to increase reservoir storage. Unfortunately, the completion of the new dam coincided with the beginning of the period of precipitation deficit and the reservoir did not have the opportunity to refill. DEQ has issued an Emergency Virginia Water Protection Permit to the town that allows the withdrawal of one million gallons per day from the Powell River. This emergency permit along with interconnections from several local systems and significant logistical assistance from various state agencies and the Virginia National Guard has allowed the Big Stone Gap Water system to continue to provide minimal amounts of water to all of its customers. The Drought Monitoring Task Force continues to monitor precipitation deficits, stream flow, ground water levels, and reservoir levels across the Commonwealth. While no significant hydrologic drought impacts currently exist, continued precipitation deficits through the winter season could result in early season drought impacts in many areas of the state in 2006. VII. Water Supply Planning Initiatives Informed management of Virginia’s water resources is crucial to the health and welfare of Virginia’s citizens and environment and continued economic prosperity. In recognition of the importance of water supply planning and water resources management, Governor Warner announced the water supply planning initiative during his first State of the Commonwealth address. This announcement mobilized an effort at DEQ to look at ways to improve the comprehensiveness of water supply planning and permitting to sustain the water resources of the Commonwealth for
future generations. The results of the initiative are a Local and Regional Water Supply Planning regulation (9 VAC 25-780), adopted by the Board June 28, 2005, proposed amendments to the Virginia Water Protection Program (9 VAC 25-210), and a proposed General Permit for Minor Water Withdrawals (9 VAC 25-800). The initiative was developed in partnership with the State Water Commission chaired by Senator Marty Williams, and represents the culmination of three years of concentrated work with localities, regional planning agencies, water providers, business and environmental interests, and the public. The core of this new policy focus is improved state support for and coordination of local and regional water supply planning and permitting.
This new regulation details information to be reported in a locality’s water supply plan regarding existing water sources, existing water uses, and existing resource information. The regulation requires water supply plans to address conservation and drought response as part of the plan’s water management actions. Contingency plans are required to be developed in accordance with the proposed regulation. Finally, all local and regional water supply plans are required to include a statement of need based on the adequacy of existing water sources to meet current and projected water demand over the planning horizon. In the event that existing sources are determined to be inadequate to meet demand over the planning period, water supply plans are required to include an analysis conducted in accordance with the requirements of this regulation that identifies alternative ways of meeting the shortfall in water supply. The Local and Regional Water Supply Planning regulation (9 VAC 25-780) is expected to be effective November 2, 2005. The program is envisioned as a state and local partnership with the localities having the lead role in identifying their future demands and the state providing technical support and oversight.
Implementation of this program will result in a statewide understanding of local water needs and potential alternatives for at least 30 years
10
into the future. It will also allow for improved preparation for future drought, earlier identification of resource and inter-jurisdictional conflicts, increased opportunities for public input and the potential to reduce conflicts in future permit processes. In addition to the new planning regulation, efforts are underway to develop a State Water Resources Plan. DEQ’s concept for the State Plan is to put local and regional water supply plans together with relevant state water resource information in one place. This Plan should provide a qualitative and quantitative description of water resources in Virginia based upon readily accessible data and guidance on the use of that information in the decisions that face the Plan’s users. By doing this, at any point in the future someone can get a statewide snapsho t of what the water supply needs are, where they are met, and our best estimate of the resource’s ability to meet additional needs. The State Plan will be used as a tool to manage water resources to ensure their continued availability, while also maximizing environmental and economic benefits. An important result of this planning is that DEQ will be able to identify areas of the state where multiple users want the same source for their water needs. The Plan will also allow DEQ to identify existing areas of the state where water availability may be insufficient now or in the future based on these needs. By knowing these conflicts in advance, users and DEQ can have the opportunity to try and find resolutions to these conflicts through regional solutions, a lternative sources, or some other option. DEQ anticipates having available resource information and guidance about how to use this information by the end of 2006. DEQ expects to have the first complete State Plan in 2011. The Plan will be the embodiment of a continuous and repetitive planning process that evolves in response to changing conditions over time. Beginning next year, this report will predominately reflect progress on the State Water Resources Plan both in format and content.
Improvements have also been made in the area of water supply permitting. A 2005 technical advisory committee reached consensus on a series of amendments to the Virginia Water Protection Program (VWPP). Substantive changes to the VWPP regulation contained in these amendments include 1) clarification of which water withdrawals are excluded from the permit requirement and under what conditions; 2) the institution of a new pre-application panel and public information meeting process for surface water projects; 3) the creation of an Emergency Virginia Water Protection Permit for public water supplies during drought; 4) the inclusion of new language regarding permit conditions for withdrawals in the Potomac River consistent with the Potomac Low Flow Allocation Agreement; 5) new language defining what information will be considered in the evaluation of cumulative impacts to instream flow; 6) clarification of what information is submitted by the applicant to demonstrate that an alternatives analysis has been conducted; 7) the creation of a new variance provision to address permit conditions during drought; and 8) establishment of a new joint public notice process for surface water projects requiring both a VWPP permit and a Virginia Marine Resources permit. There are also a number of administrative amendments that will allow for a more efficient and understandable application, review and issuance process. These amendments have been approved by the State Water Control Board for public comment. A general permit for minor surface water withdrawals was also developed which will significantly reduce the cost and administrative burden of obtaining permits for minor water users. VIII. Conclusions and Recommendations The Virginia Water Supply Program establishes new priorities for water supply managers. By encouraging regional water supply planning efforts and recognizing the role of local governments in meeting local water supply needs and the DEQ’s responsibility to

11
protect and manage water supplies for human and environmental needs, the Program lays the groundwork for managing Virginia’s Water Resources for decades to come. The Virginia Water Protection Permit Work Group identified the following issues that they recommended needed to be addressed:
1. Timely receipt of comments on water supply permit submittals from other state agencies must be addressed, because while SB 1248, 2005 requires agencies to provide comments to DEQ within 45 days of project notification, the bill neither provides a penalty for failure to meet that deadline nor authorizes DEQ to require a response from other agencies.
2. DEQ should initiate cumulative impact modeling to better understand the affects of existing and proposed surface water withdrawals on beneficial uses in river systems.
3. DEQ should evaluate consumptive uses of water generally and whether flow augmentation for consumptive use is needed outside the Potomac basin to protect existing water supplies.
4. A revised and more accurate definition of “safe yield” should be developed to serve the needs of both the Department of Health and DEQ.
5. DEQ should establish a standing committee of individuals from the work group to address issues as they arise.
6. Sufficient staff and resources at resource agencies to review and process applications in a timely fashion should be funded.
DEQ has taken steps to begin addressing each of these recommendations. A work plan will be developed in early 2006 in coordination with the standing committee identified in recommendation #5.

12
(This Page Left Intentionally Blank)

13
Appendix 1: Virginia’s Water Resources Data
State Population (2004 Estimate) - 7,459,827 State Surface Area - 40,741 square miles Major River Basins:
Potomac/Shenandoah Rappahannock York James Chesapeake Bay/Small Coastal Chowan River/Albemarle Sound Roanoke New Tennessee/Big Sandy
Perennial River Miles (freshwater) - 50,537 miles Publicly Owned Lakes and Reservoirs
Larger than 5,000 acres 5 109,838 acres Smaller than 5,000 acres 243 52,392 acres Total 248 162,230 acres
Freshwater Wetlands - 808,000 acres Tidal and Coastal Wetlands - 236,900 acres Estuary - 2,557 Square Miles Atlantic Ocean Coastline - 120 Miles Statewide Average Annual Rainfall - 42.8 inches Average Freshwater Discharge of All Rivers - Approximately 25 billion gallons per day
14
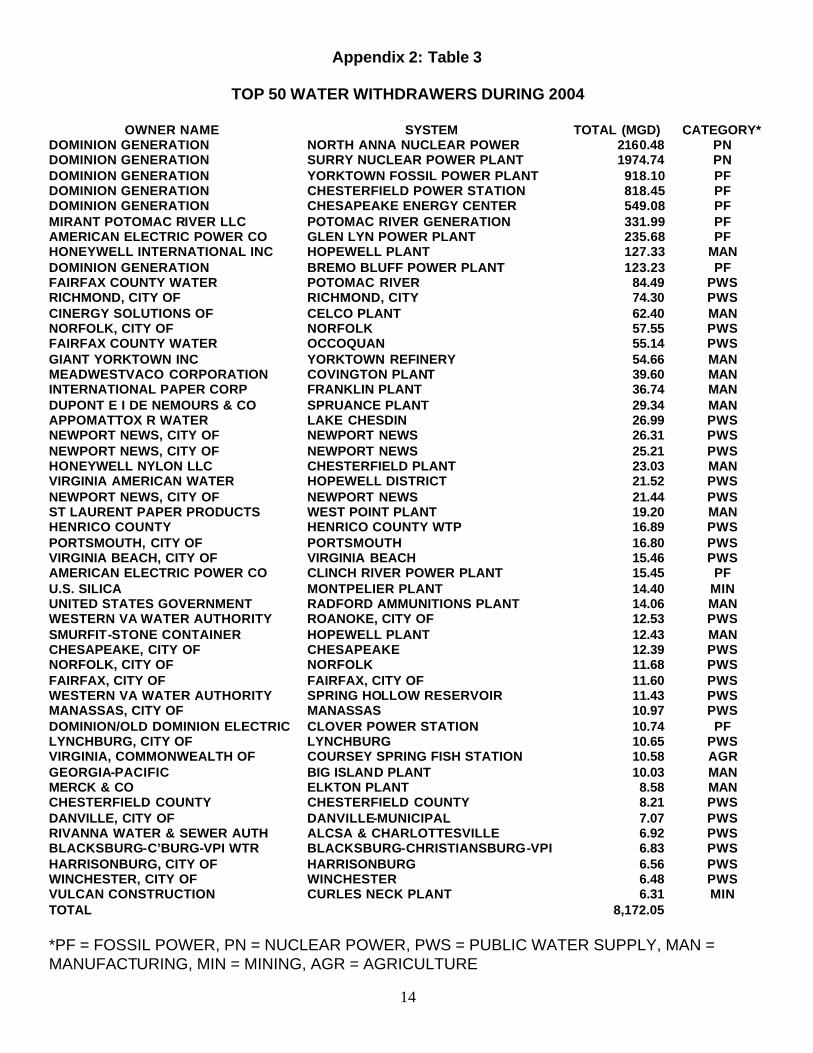
Appendix 2: Table 3
TOP 50 WATER WITHDRAWERS DURING 2004
OWNER NAME SYSTEM TOTAL (MGD) CATEGORY* DOMINION GENERATION NORTH ANNA NUCLEAR POWER 2160.48 PN DOMINION GENERATION SURRY NUCLEAR POWER PLANT 1974.74 PN DOMINION GENERATION YORKTOWN FOSSIL POWER PLANT 918.10 PF DOMINION GENERATION CHESTERFIELD POWER STATION 818.45 PF DOMINION GENERATION CHESAPEAKE ENERGY CENTER 549.08 PF MIRANT POTOMAC RIVER LLC POTOMAC RIVER GENERATION 331.99 PF AMERICAN ELECTRIC POWER CO GLEN LYN POWER PLANT 235.68 PF HONEYWELL INTERNATIONAL INC HOPEWELL PLANT 127.33 MAN DOMINION GENERATION BREMO BLUFF POWER PLANT 123.23 PF FAIRFAX COUNTY WATER POTOMAC RIVER 84.49 PWS RICHMOND, CITY OF RICHMOND, CITY 74.30 PWS CINERGY SOLUTIONS OF CELCO PLANT 62.40 MAN NORFOLK, CITY OF NORFOLK 57.55 PWS FAIRFAX COUNTY WATER OCCOQUAN 55.14 PWS GIANT YORKTOWN INC YORKTOWN REFINERY 54.66 MAN MEADWESTVACO CORPORATION COVINGTON PLANT 39.60 MAN INTERNATIONAL PAPER CORP FRANKLIN PLANT 36.74 MAN DUPONT E I DE NEMOURS & CO SPRUANCE PLANT 29.34 MAN APPOMATTOX R WATER LAKE CHESDIN 26.99 PWS NEWPORT NEWS, CITY OF NEWPORT NEWS 26.31 PWS NEWPORT NEWS, CITY OF NEWPORT NEWS 25.21 PWS HONEYWELL NYLON LLC CHESTERFIELD PLANT 23.03 MAN VIRGINIA AMERICAN WATER HOPEWELL DISTRICT 21.52 PWS NEWPORT NEWS, CITY OF NEWPORT NEWS 21.44 PWS ST LAURENT PAPER PRODUCTS WEST POINT PLANT 19.20 MAN HENRICO COUNTY HENRICO COUNTY WTP 16.89 PWS PORTSMOUTH, CITY OF PORTSMOUTH 16.80 PWS VIRGINIA BEACH, CITY OF VIRGINIA BEACH 15.46 PWS AMERICAN ELECTRIC POWER CO CLINCH RIVER POWER PLANT 15.45 PF U.S. SILICA MONTPELIER PLANT 14.40 MIN UNITED STATES GOVERNMENT RADFORD AMMUNITIONS PLANT 14.06 MAN WESTERN VA WATER AUTHORITY ROANOKE, CITY OF 12.53 PWS SMURFIT-STONE CONTAINER HOPEWELL PLANT 12.43 MAN CHESAPEAKE, CITY OF CHESAPEAKE 12.39 PWS NORFOLK, CITY OF NORFOLK 11.68 PWS FAIRFAX, CITY OF FAIRFAX, CITY OF 11.60 PWS WESTERN VA WATER AUTHORITY SPRING HOLLOW RESERVOIR 11.43 PWS MANASSAS, CITY OF MANASSAS 10.97 PWS DOMINION/OLD DOMINION ELECTRIC CLOVER POWER STATION 10.74 PF LYNCHBURG, CITY OF LYNCHBURG 10.65 PWS VIRGINIA, COMMONWEALTH OF COURSEY SPRING FISH STATION 10.58 AGR GEORGIA-PACIFIC BIG ISLAND PLANT 10.03 MAN MERCK & CO ELKTON PLANT 8.58 MAN CHESTERFIELD COUNTY CHESTERFIELD COUNTY 8.21 PWS DANVILLE, CITY OF DANVILLE-MUNICIPAL 7.07 PWS RIVANNA WATER & SEWER AUTH ALCSA & CHARLOTTESVILLE 6.92 PWS BLACKSBURG-C’BURG-VPI WTR BLACKSBURG-CHRISTIANSBURG-VPI 6.83 PWS HARRISONBURG, CITY OF HARRISONBURG 6.56 PWS WINCHESTER, CITY OF WINCHESTER 6.48 PWS VULCAN CONSTRUCTION CURLES NECK PLANT 6.31 MIN TOTAL 8,172.05
*PF = FOSSIL POWER, PN = NUCLEAR POWER, PWS = PUBLIC WATER SUPPLY, MAN = MANUFACTURING, MIN = MINING, AGR = AGRICULTURE