Embed Size (px)
Citation preview
A Re-examination of theEffectiveness of the Bankruptcy
Process
Harlan D. Platt and Marjorie B. Platt*
1. INTRODUCTION
Following a revision of the Bankruptcy Code in 1979, the numberof companies filing for protection in the courts from creditorssurged, prompting closer scrutiny of the bankruptcy process andanxieties about the outcomes of protracted legal cases. Criticsargue that bankruptcy cases end with the emergence of relativelyunhealthy companies, distribute funds to junior creditors at theexpense of more senior creditors, and linger excessively in court.The first complaint, an inefficiency hypothesis, poses a socialquestion about future resource allocation; the second issue, theequity hypothesis, worries that junior creditors have too muchpower in bankruptcy and extract value from more seniorcreditors by threatening to delay legal proceedings; the thirditem, another inefficiency hypothesis, wonders why bankruptcycases require several years or more to reach conclusion. Our workfocuses solely on the first topic. We examine whether the
Journal of Business Finance & Accounting, 29(9) & (10), Nov./Dec. 2002, 0306-686X
ß Blackwell Publishers Ltd. 2002, 108 Cowley Road, Oxford OX4 1JF, UKand 350 Main Street, Malden, MA 02148, USA. 1209
* The authors are respectively, Professor of Finance and Harold A. Mock Professor ofAccounting at the College of Business Administration, Northeastern University. They wishto thank Jean Bedard, Robert Mooradian, Diane Naples, Jay Ritter, and Emery Trahan fortheir helpful comments on earlier drafts. They are most grateful to the anonymousreferee who provided exceptionally insightful comments that led to the redesign andrefocus of the paper. Vineesh Kochhar provided skillful assistance with the data. Allremaining errors are the authors' own. (Paper received March 2000, revised and acceptedJune 2002)
Address for correspondence: Harlan D. Platt, Finance and Insurance Group, College ofBusiness Administration, Northeastern University, 360 Hungtington Avenue, Boston, MA02115, USA.e-mail: [email protected]

bankruptcy process is ineffective thereby creating weakcompanies that later return to bankruptcy.
A fundamental goal of the US Bankruptcy Code is the creationof new `feasible' companies with manageable debt levels,energized managements and plausible corporate strategies.Courts confirm plans of reorganization (PORs) that detailfinancial or product-market solutions to corporate distress onlyafter the plans pass a feasibility test affirming that the company isunlikely to revisit bankruptcy in the foreseeable future.Generally, PORs include a `Disclosure' document containinginformation describing the cause of the bankruptcy, pro formafinancial estimates, and a description of the mechanism wherebythe company will resolve prior debts and emerge as a viable,whole company. In pursuit of feasibility, the Code permitscompanies to discharge prior financial obligations and to replacethem with newly created securities. A greater emphasis on equityin revised capital structures is typical and some firms even resortto payment-in-kind obligations to reduce future bankruptcy risk.Common operating tactics to improve bankrupt companyperformance include terminating unprofitable or cash-hungrydivisions, appointing new managers, and shedding products ordivisions to refocus on core competencies. Successful reorgan-izations allow investors an opportunity to recover all or a portionof their original investment. By contrast, an unsuccessfulreorganization results in a subsequent bankruptcy filing.
There has been a spate of recent studies examining post-bankruptcy outcomes (Hotchkiss, 1995; Hotchkiss andMooradian, 1997; Michel et al., 1998; Alderson and Betker,1999; Eberhart et al., 1999; and Indro et al., 1999). Hotchkiss'(1995) primogenitor study finds that the bankruptcy processinadequately rehabilitates distressed firms. Her conclusion isbased on analysis of post-bankruptcy operating income, thevariance of actual versus predicted operating performance,future restructurings, and the effects of management turnoveron post-bankruptcy performance.
This study extends the investigation of whether the bankruptcyprocess produces viable or weak firms by examining bankruptcyoutcomes during a more recent sample period and by looking atboth accounting and market performance indicators. First, likeHotchkiss we examine the accuracy of pro forma estimates
1210 PLATT AND PLATT
ß Blackwell Publishers Ltd 2002

contained in disclosure documents. Second, we look at post-bankruptcy equity market performance by analyzing companyabnormal returns using expected returns from a company withinthe industry matched on size and net profitability. Finally, weexamine post-bankruptcy outcomes which led to the devel-opment of a predictive model to explain why some emergentChapter 11s return to bankruptcy.
In contrast to past research, our analyses find that relativelyhealthy companies emerge from bankruptcy. First, in contrast toHotchkiss who reports that 40% of her sample firms havenegative operating income post-bankruptcy, we observe that only20% of our companies report negative operating income afteremerging from court protection. Second, we find mixed evidenceregarding POR forecast accuracy. On the one hand, there is suchlarge variance in forecast errors in both operating income andnet income that it appears that firms are inconsistent in theirforecasting ability within their POR. On the other hand, medianforecast error for operating income, used by Hotchkiss to showsignificant negative forecast error, is not statistically significantlydifferent from zero in our study. Moreover, neither median normean forecast error for sales or net income are statisticallysignificantly different from zero. The latter evidence argues thaton average PORs contain forecasts that are not significantlydifferent from actual results. However, because of the largevariance in operating and net income forecasts, one mustproceed cautiously when assessing individual PORs. Third,consistent with Eberhart, Altman and Aggarwal (1999), we reportthat post-bankrupt average abnormal returns (18.3%) aresignificantly different from zero. While we find similar executivemanagement turnover rates as those reported earlier (Gilson,1990; Gilson and Vetsuypens, 1993; and Hotchkiss, 1995),companies retaining their CEOs through the development ofthe POR achieve significant positive abnormal returns, thoughthe premium is essentially reduced to zero if the CEO stays withthe firm post emergence from bankruptcy. Retaining the CEO asthe architect of the plan or after the firm completes thebankruptcy process may indicate the degree of company-specificknowledge brought to bear during POR construction as well asthe potential bias toward preserving status quo strategy andinvestment. These results contrast to some extent with Hotchkiss'
EFFECTIVENESS OF THE BANKRUPTCY PROCESS 1211
ß Blackwell Publishers Ltd 2002
(1995) findings that CEO retention (through the development ofthe POR) is related to lower post-bankruptcy performance.Finally, we successfully classify companies into future returnbankruptcies versus ongoing concerns. In sum, while we concedethat bankrupt company forecasts yield large absolute errors, thelack of statistical significance of the median values for forecasterror in sales, operating income or net income and the betterthan average equity market performance argues that thebankruptcy process is efficient in remediating distressedcompanies.
One explanation for the variance between our results and pastresearch is that the earlier negative conclusions are based onanalysis of events occurring during a weaker economic climate(1979±1988) than was the case for our sample period (1982±1993). Real GDP and real corporate profits after tax (PAT) datacollected for the two sample periods are shown in Table 1. Thesedata show that the overall economic activity and growth incorporate profits after tax are significantly different in the two
Table 1
Real GDP and Real Corporate Profits after Tax (PAT) for Hotchkiss andCurrent Study Sample Periods
Current Study HotchkissSample Period Sample Period(1982±1993) (1979±1988) Difference
Real GDP ($1992 billions)Mean level 5650.13 5085.61 564.52*Compound annual growth rate 2.74% 2.39% 0.35%#
Real PAT ($1992 billions)Mean level 2.16 2.11 0.05#Compound annual growth rate 5.04% (2.17%) 7.21%**
Notes:* Significant beyond the 0.01 level using a t-test for the difference between two means.# Not statistically significant.
** Significant beyond the 0.05 level using a t-test for the difference between two growthrates. To estimate the standard deviation for the difference in compound growth rates forthe two sample periods, we calculate compound growth rates for ten- and twelve-yearperiods with the appropriate overlap as found in the 1982±1993 period for the currentstudy and the 1979±1988 period used by Hotchkiss. To calculate the growth rates, we usedata from 1965 through 1999 available in Datadisk, a repository of US economic data.Differences in growth rates were calculated, from which the standard deviation wasestimated.
1212 PLATT AND PLATT
ß Blackwell Publishers Ltd 2002
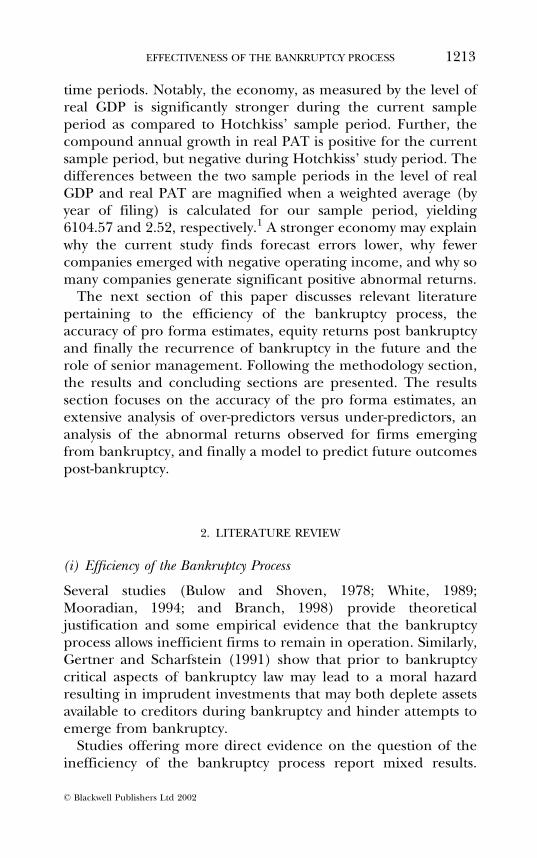
time periods. Notably, the economy, as measured by the level ofreal GDP is significantly stronger during the current sampleperiod as compared to Hotchkiss' sample period. Further, thecompound annual growth in real PAT is positive for the currentsample period, but negative during Hotchkiss' study period. Thedifferences between the two sample periods in the level of realGDP and real PAT are magnified when a weighted average (byyear of filing) is calculated for our sample period, yielding6104.57 and 2.52, respectively.1 A stronger economy may explainwhy the current study finds forecast errors lower, why fewercompanies emerged with negative operating income, and why somany companies generate significant positive abnormal returns.
The next section of this paper discusses relevant literaturepertaining to the efficiency of the bankruptcy process, theaccuracy of pro forma estimates, equity returns post bankruptcyand finally the recurrence of bankruptcy in the future and therole of senior management. Following the methodology section,the results and concluding sections are presented. The resultssection focuses on the accuracy of the pro forma estimates, anextensive analysis of over-predictors versus under-predictors, ananalysis of the abnormal returns observed for firms emergingfrom bankruptcy, and finally a model to predict future outcomespost-bankruptcy.
2. LITERATURE REVIEW
(i) Efficiency of the Bankruptcy Process
Several studies (Bulow and Shoven, 1978; White, 1989;Mooradian, 1994; and Branch, 1998) provide theoreticaljustification and some empirical evidence that the bankruptcyprocess allows inefficient firms to remain in operation. Similarly,Gertner and Scharfstein (1991) show that prior to bankruptcycritical aspects of bankruptcy law may lead to a moral hazardresulting in imprudent investments that may both deplete assetsavailable to creditors during bankruptcy and hinder attempts toemerge from bankruptcy.
Studies offering more direct evidence on the question of theinefficiency of the bankruptcy process report mixed results.
EFFECTIVENESS OF THE BANKRUPTCY PROCESS 1213
ß Blackwell Publishers Ltd 2002
Hotchkiss (1995) finds that 40% of her sample emerge frombankruptcy with negative operating income and that a largepercentage (32%) of post-bankrupt firms are not financiallysound and soon thereafter require additional restructuring(including restructuring of debt privately, second bankruptcyor out-of-court liquidations). She also reports that a highproportion (73%) of company pro forma income statementsoverstated expected operating income. Alderson and Betker(1996) focus instead on total cash flow. In contrast to Hotchkiss,they find higher cash flows for 52% of newly emerged companiesin comparison with estimated going concern values posted in proformas. Thus, it is not clear whether the bankruptcy processproduces efficient, viable firms for the most part or inefficientfirms with a high likelihood for future financial distress.
(ii) Pro Forma Estimates
Hotchkiss (1995) and Michel et al. (1998) study the accuracy ofin-bankruptcy pro forma estimates for the year following acompany's emergence from bankruptcy.2 Hotchkiss (1995)observes that 43 of 59 companies (73%) significantly overstatetheir expected operating income, resulting in a median forecasterror for all sample companies of ÿ80.6% in the year afterbankruptcy. Similarly, Michel et al. (1998) report that nearly two-thirds of 39 companies in their study have lower net income thananticipated in their PORs. Over-predicted earnings forecasts havealso been observed for non-bankrupt companies (Koch, 1999;Basi, Carey and Twark, 1976; and Copeland and Marioni, 1972)with error rates ranging from ÿ10.1% to ÿ20.1% for regularcompanies.3 On the other hand, McNichols (1989) finds noevidence of over-prediction. Thus, while most firms report overlyoptimistic forecasts of future financial performance (i.e., actualperformance is less than forecasted performance), Hotchkissfinds that bankrupt firms are far more optimistic than non-bankrupt firms.
Biased pro formas may result from two systematic causes.Under-estimations might occur if POR architects contrivepessimistic outlooks to exclude junior classes of claimants fromfair participation in the plan's payouts. Under-estimating acompany's future potential devalues its new securities and
1214 PLATT AND PLATT
ß Blackwell Publishers Ltd 2002
disproportionately pays those securities to senior classes ofclaims. It is unlikely that managers would produce pessimisticpro formas based on self-interest, since payouts would excludecurrent equity holders, including corporate managers anddirectors. In addition, pessimistic forecasts of future financialresults may raise questions about current management's ability toperform.
By contrast, POR architects may create overly optimisticscenarios of future performance and financial results in orderto protect their job security. Assuming that old equity holders aremore willing to retain current management the better are futureprospects, managers may seek to increase the likelihood thatjunior classes of claimants, such as equity, receive somecompensation. To accomplish this, managers would over-estimate the company's future potential. It is also conceivablethat managers are overly optimistic by nature and not by design.
Consequently, one should find a distribution of over- andunder-estimates. Simply aggregating forecast errors acrosspessimistic and optimistic firms may yield a small mean error ifthe two types of errors cancel each other out. Thus, it isimportant to examine the error structure of forecasts in theaggregate as well as by direction of forecast errors, over-predictors versus under-predictors.
(iii) Equity Prices
Eberhart, Altman and Aggarwal (1999) examine theperformance of 131 post-bankrupt companies over a 200-dayperiod after plan confirmation. Over the 200 days, they reportsignificant mean cumulative abnormal returns of between 24.6%and 138.8%, depending on the sample methodology used toestimate expected market returns. Other research focuses oneither the pre-bankruptcy or the within-bankruptcy periods.Clark and Weinstein (1983) and Aharony, Jones, and Swary(1980) examine the relative performance of bankrupt versusnon-bankrupt firms and not surprisingly find that before thebankruptcy petition was filed, the non-bankrupt groupoutperformed the bankrupt group. Ramaswami and Moeller(1990) note that equities of companies who were in bankruptcysubstantially outperformed the market as a whole. Using a
EFFECTIVENESS OF THE BANKRUPTCY PROCESS 1215
ß Blackwell Publishers Ltd 2002

sample of 50 companies they observe a 28% annual rate of returnfrom the bankruptcy filing date to the emergence date. For thesub-sample of companies successfully reorganizing, they report a49% annual rate of return.
As our purpose is to test the efficiency of the bankruptcyprocess, we examine equity returns post-bankruptcy. If theprocess creates weak (strong) companies, we would expect overa 12-month period following confirmation of the POR to havenegative (positive) annual abnormal returns.
(iv) Future Bankruptcy and the Role of Senior Management
Hotchkiss (1995) finds that 32% of her sample restructure afteremerging from bankruptcy, including 2.5% liquidations, 12%private workouts, and 17.5% second bankruptcies. Hotchkiss'sample spans the period 1979 to 1988, which included periods ofeconomic expansion as well as contraction.4 By contrast,Alderson and Betker (1999) find that during their study's sampleperiod, 1983±1993, 21 out of 89 (24%) of their samplecompanies went through a second restructuring. One possibleexplanation for these varying results is that the macro economyinfluences post-bankruptcy financial performance. Companiesemerging when the economy is relatively weak (as for Hotchkiss'sample period, see Table 1) may slip back into financial distress,despite the best intentions and future plans for success put forthduring the bankruptcy process. By contrast, companies emergingwhen the economy is relatively robust (as for Alderson andBetker's sample period which is very similar to that of this study,see Table 1), may succeed in spite of competitive weakness orother systemic problems.
Hotchkiss (1995) reports that half of firms experiencing arepeat bankruptcy cite continuing operating problems as theprimary reason, suggesting that they did not take sufficientcorrective action in operations or effect change in corporatepolicy to stave off a second bankruptcy. Thus, the role of seniormanagement in future outcomes becomes an empirical question.If continuing management does not enable the firm to changesufficiently to compete effectively, then retaining the CEOduring POR construction or post emergence could indicate aheightened probability of future failure. Alternatively, if the
1216 PLATT AND PLATT
ß Blackwell Publishers Ltd 2002
cause of bankruptcy does not rest primarily on poor managementdecisions, rather on exogenous shocks, then retaining the CEOmay provide valuable knowledge and guidance for the emergingfirm. CEO turnover rates are moderate (about 50%) as of thefiling date and high (70% to 90%) at the time the companyemerges from bankruptcy protection (LoPucki and Whitford,1993; Gilson, 1990, Gilson and Vetsuypens, 1993; Hotchkiss,1995). Hotchkiss (1995) reports that CEO retention (throughPOR construction) increases the probability of poor operatingperformance as well as the probability of a second bankruptcy orworkout. She concludes that new CEOs are more likely to changeexisting asset portfolios supported by old corporate strategy,thereby improving operating performance.
3. METHODOLOGY
(i) Sample Characteristics
With our interest in comparing pro forma forecasts (i.e., forward-looking financial statements) from bankruptcy PORs, we adopt atelescopic sample design criterion. Specifically, we limit oursample to firms emerging from bankruptcy as public companieswhose POR contained a pro forma statement. Moreover, werequire that less than one year pass between issuance of the PORand the company's emergence from Chapter 11 so that theforecast is current. In contrast, Hotchkiss (1995) uses an all-inclusive sample design. Theoretically, this approach begins withmore sample companies but actually it ends up with no extraoperative pro formas at the end.
We sent requests for copies of PORs filed in the bankruptcycourt to 119 companies that had completed the bankruptcyprocess and to prominent law firms. The list of emergentcompanies was compiled from the Wall Street Journal, Predicast'sIndex of Corporate Changes, and the Securities and ExchangeCommission's in-house bankruptcy list. PORs were obtainedfrom 78 companies; most of the remainder responded that theyno longer maintained copies.
Section 1125(a) of the Bankrupt Code requires PORs tocontain information that would permit a reasonable investor to
EFFECTIVENESS OF THE BANKRUPTCY PROCESS 1217
ß Blackwell Publishers Ltd 2002

make an informed decision about the plan. Despite the obviousinformational benefit of pro forma statements, many plans donot present forecasts. Pro formas were available for 52companies; eleven other PORs described how the company wasbeing acquired or was going private, nine contained no proforma information, and in six cases too much time hadtranspired between the issuance of the POR and emergencefrom bankruptcy for the pro forma to be relevant. By definition,these 52 companies represent bankrupt cases for which thereorganization or liquidation decision result in reorganization.
Our sample period spans 1982 to 1993, during which 90% ofthe sample firms filed for bankruptcy protection between 1989and 1993. Furthermore, all but four of the sample companiesemerged from bankruptcy during the period 1991±1995, aperiod of accelerating compound annual growth in real PAT(9.8% compared to 5.04% for the entire sample period).Seventeen of the sample companies trade on the NYSE, ten onAMEX and 25 on NASDQ.
The final sample size compares favorably to other studiesexamining post-bankruptcy outcomes based on pro formafinancial statement analysis. Hotchkiss (1995) notes that shehad 72 post-bankrupt firms with pro formas, although heranalysis never reports results for more then 59 companies. Michelet al. (1998) begins with 375 bankrupt companies (another all-inclusive design) but screens down to just 35 post-bankruptcompanies with available pro formas. A similarity in the numberof sample companies for the three studies suggests that thechoice of sample screening criteria does not bias the analysis bypre-selecting companies to examine.
(ii) Data
We obtain forecasted net sales, operating income (EBIT) and netincome from the pro forma income statement contained in thefirm's final POR. Our source for the actual figures for a firm's netsales, EBIT and net income for the period matching the forecastperiod in the POR is COMPUSTAT. In addition, we identifythree dates from the POR, including the date bankruptcy isdeclared, the date the POR is filed and the date the companyemerges from Chapter 11 protection. Also from the POR, we
1218 PLATT AND PLATT
ß Blackwell Publishers Ltd 2002

note the percentage of trade creditor claims repaid and theproportion of new stock awarded to old equity holders. Werecord the firm's unadjusted stock price on the day of emergencefrom bankruptcy, as well as twelve months later. Our sources forpost-bankruptcy equity prices include the Wall Street Journal, theEdgar database and Yahoo Finance. Finally, we determine thestatus of each original company's CEO at the time the POR issubmitted and when the plan is confirmed.5
Following Eberhart, Altman and Aggarwal (1999), we employ amatched sample design to calculate cumulative abnormal returnsof post-bankrupt companies. To obtain the estimated expectedreturns for a given company, we match each sample firm with acompany in the same SIC code based on size, measured by netsales, at the beginning of the year in which the firm emergedfrom bankruptcy protection. The expected return is the returnobserved for the match mate at the end of the year. The annualabnormal return (AR) is defined as ARi � ri ÿ E�ri� where ri isthe ith sample firm's annual total return and E�ri� is the ith'smatch mate annual total return.
In addition to the firm's AR, we calculate pro forma forecasterrors for sales, operating income and net income, based uponforecast and actual values one year post bankruptcy emergence.For each item, the percentage forecast error is defined as:
% Forecast Error � �Actual Valueÿ Predicted Value�Absolute Value (Predicted Value)
:
Finally, two indicator variables are created to indicate thecontinued employment of the firm's pre-bankruptcy CEO attwo key points in the bankruptcy process. The first indicatorvariable (CEOPOR), equals one when the original CEOremained with the firm through submission of the POR andzero otherwise. The second (CEOpost), is coded as one when theoriginal CEO was retained post confirmation of the plan and zerootherwise.
EFFECTIVENESS OF THE BANKRUPTCY PROCESS 1219
ß Blackwell Publishers Ltd 2002
4. RESULTS
(i) Company Characteristics
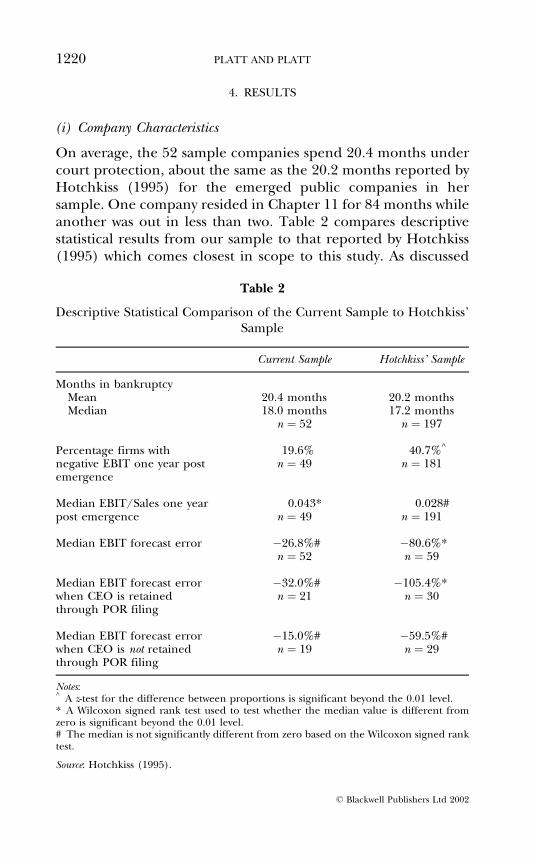
On average, the 52 sample companies spend 20.4 months undercourt protection, about the same as the 20.2 months reported byHotchkiss (1995) for the emerged public companies in hersample. One company resided in Chapter 11 for 84 months whileanother was out in less than two. Table 2 compares descriptivestatistical results from our sample to that reported by Hotchkiss(1995) which comes closest in scope to this study. As discussed
Table 2
Descriptive Statistical Comparison of the Current Sample to Hotchkiss'Sample
Current Sample Hotchkiss' Sample
Months in bankruptcyMean 20.4 months 20.2 monthsMedian 18.0 months 17.2 months
n � 52 n � 197
Percentage firms with 19.6% 40.7%^
negative EBIT one year post n � 49 n � 181emergence
Median EBIT/Sales one year 0.043* 0.028#post emergence n � 49 n � 191
Median EBIT forecast error ÿ26.8%# ÿ80.6%*n � 52 n � 59
Median EBIT forecast error ÿ32.0%# ÿ105.4%*when CEO is retained n � 21 n � 30through POR filing
Median EBIT forecast error ÿ15.0%# ÿ59.5%#when CEO is not retained n � 19 n � 29through POR filing
Notes:^ A z-test for the difference between proportions is significant beyond the 0.01 level.* A Wilcoxon signed rank test used to test whether the median value is different fromzero is significant beyond the 0.01 level.# The median is not significantly different from zero based on the Wilcoxon signed ranktest.
Source: Hotchkiss (1995).
1220 PLATT AND PLATT
ß Blackwell Publishers Ltd 2002
below, sample differences are crucially important. Most striking isthe greater accuracy of pro forma EBIT forecasts in our sample infirms retaining their CEO. This is partially explained by thesignificantly higher median EBIT levels for our sample firms oneyear after emergence from bankruptcy that may result from abetter economic climate.
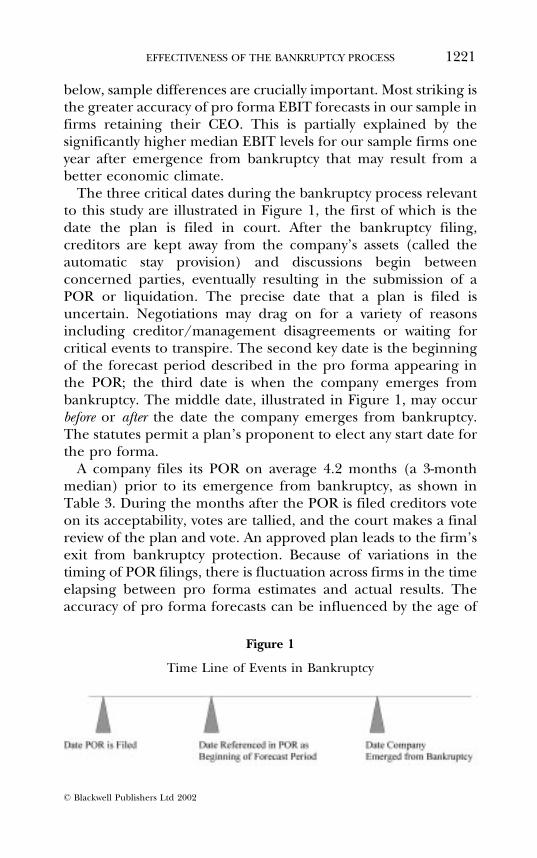
The three critical dates during the bankruptcy process relevantto this study are illustrated in Figure 1, the first of which is thedate the plan is filed in court. After the bankruptcy filing,creditors are kept away from the company's assets (called theautomatic stay provision) and discussions begin betweenconcerned parties, eventually resulting in the submission of aPOR or liquidation. The precise date that a plan is filed isuncertain. Negotiations may drag on for a variety of reasonsincluding creditor/management disagreements or waiting forcritical events to transpire. The second key date is the beginningof the forecast period described in the pro forma appearing inthe POR; the third date is when the company emerges frombankruptcy. The middle date, illustrated in Figure 1, may occurbefore or after the date the company emerges from bankruptcy.The statutes permit a plan's proponent to elect any start date forthe pro forma.
A company files its POR on average 4.2 months (a 3-monthmedian) prior to its emergence from bankruptcy, as shown inTable 3. During the months after the POR is filed creditors voteon its acceptability, votes are tallied, and the court makes a finalreview of the plan and vote. An approved plan leads to the firm'sexit from bankruptcy protection. Because of variations in thetiming of POR filings, there is fluctuation across firms in the timeelapsing between pro forma estimates and actual results. Theaccuracy of pro forma forecasts can be influenced by the age of
Figure 1
Time Line of Events in Bankruptcy
EFFECTIVENESS OF THE BANKRUPTCY PROCESS 1221
ß Blackwell Publishers Ltd 2002

the forecasts and thus we test whether age of the forecast affectsthe size of the error.
Some companies exit bankruptcy before (after) the start of theforecast period contained in the pro forma, as seen in Table 4.Fourteen pro forma periods began before (averaging about fourmonths) and 29 began after (averaging about 3.3 months) thecompany emerged from bankruptcy. Variation results fromunanticipated delays that impede a case's resolution and fromdecisions to maintain historic annual reporting periods. Whenthe pro forma commences before the company exits bankruptcy,a portion of the forecast year occurs under court supervision. Insuch cases, the forecast period is still a full year with some months
Table 3
Number of Months the POR is Filed Before the Company Emergesfrom Chapter 11
Months Before Emergence Frequency of Companies
0 31±3 244±6 177±9 4
10±12 313±15 1Total 52
Table 4
Number of Months the Pro Forma's Start Date Precedes or Follows theCompany's Emergence from Chapter 11
Months Before �ÿ� or After (+)Emergence Frequency of Companies
ÿ11 to ÿ7 2ÿ6 to ÿ4 6ÿ3 to ÿ1 6
0 91 to 3 154 to 6 67 to 9 8Total 52
1222 PLATT AND PLATT
ß Blackwell Publishers Ltd 2002
preceding and some following emergence from bankruptcy (seeTable 4). Again, we suspect that the timing of bankruptcyemergence may affect the accuracy of pro forma forecast. We testthis proposition as well.
(ii) Pro Forma Estimates
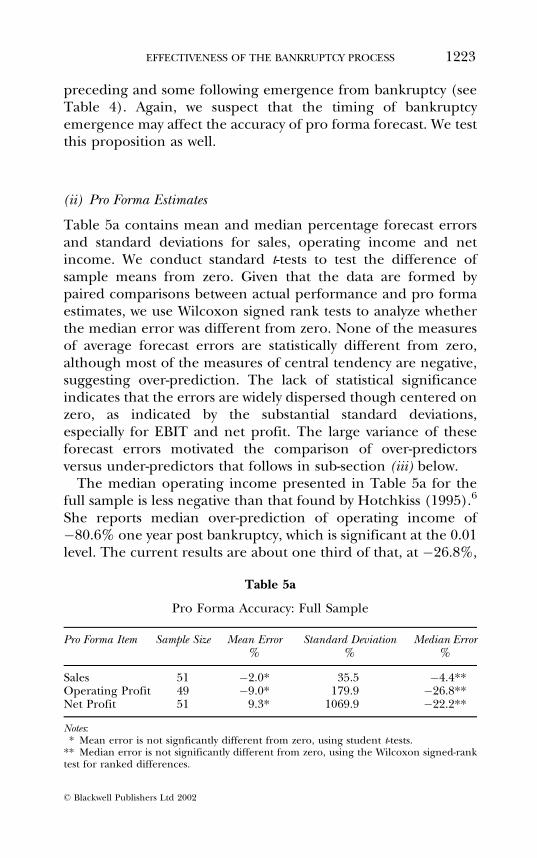
Table 5a contains mean and median percentage forecast errorsand standard deviations for sales, operating income and netincome. We conduct standard t-tests to test the difference ofsample means from zero. Given that the data are formed bypaired comparisons between actual performance and pro formaestimates, we use Wilcoxon signed rank tests to analyze whetherthe median error was different from zero. None of the measuresof average forecast errors are statistically different from zero,although most of the measures of central tendency are negative,suggesting over-prediction. The lack of statistical significanceindicates that the errors are widely dispersed though centered onzero, as indicated by the substantial standard deviations,especially for EBIT and net profit. The large variance of theseforecast errors motivated the comparison of over-predictorsversus under-predictors that follows in sub-section (iii) below.
The median operating income presented in Table 5a for thefull sample is less negative than that found by Hotchkiss (1995).6
She reports median over-prediction of operating income ofÿ80.6% one year post bankruptcy, which is significant at the 0.01level. The current results are about one third of that, at ÿ26.8%,
Table 5a
Pro Forma Accuracy: Full Sample
Pro Forma Item Sample Size Mean Error Standard Deviation Median Error% % %
Sales 51 ÿ2.0* 35.5 ÿ4.4**Operating Profit 49 ÿ9.0* 179.9 ÿ26.8**Net Profit 51 9.3* 1069.9 ÿ22.2**
Notes:* Mean error is not signficantly different from zero, using student t-tests.
** Median error is not significantly different from zero, using the Wilcoxon signed-ranktest for ranked differences.
EFFECTIVENESS OF THE BANKRUPTCY PROCESS 1223
ß Blackwell Publishers Ltd 2002
and are not significantly different from zero. Further, just under20% of our companies have negative EBIT the year after planconfirmation, while Hotchkiss reports that almost 41% of hersample did so (see Table 2).
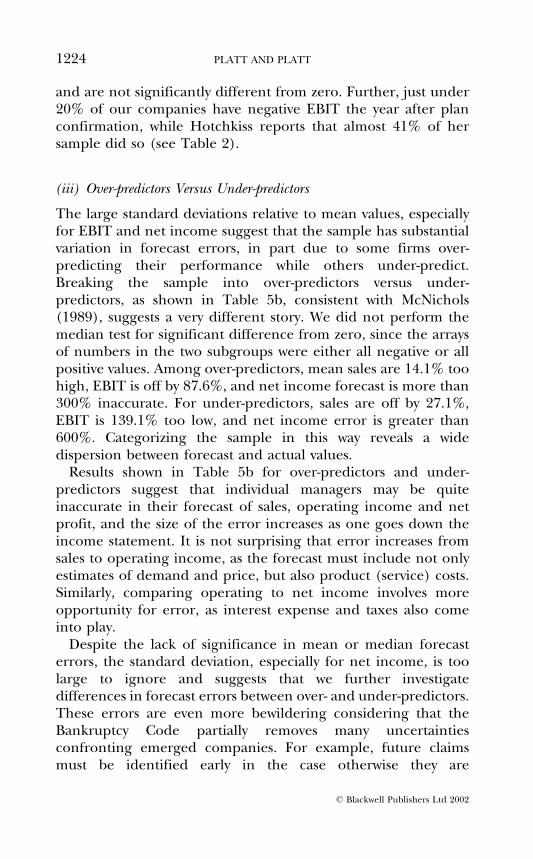
(iii) Over-predictors Versus Under-predictors
The large standard deviations relative to mean values, especiallyfor EBIT and net income suggest that the sample has substantialvariation in forecast errors, in part due to some firms over-predicting their performance while others under-predict.Breaking the sample into over-predictors versus under-predictors, as shown in Table 5b, consistent with McNichols(1989), suggests a very different story. We did not perform themedian test for significant difference from zero, since the arraysof numbers in the two subgroups were either all negative or allpositive values. Among over-predictors, mean sales are 14.1% toohigh, EBIT is off by 87.6%, and net income forecast is more than300% inaccurate. For under-predictors, sales are off by 27.1%,EBIT is 139.1% too low, and net income error is greater than600%. Categorizing the sample in this way reveals a widedispersion between forecast and actual values.
Results shown in Table 5b for over-predictors and under-predictors suggest that individual managers may be quiteinaccurate in their forecast of sales, operating income and netprofit, and the size of the error increases as one goes down theincome statement. It is not surprising that error increases fromsales to operating income, as the forecast must include not onlyestimates of demand and price, but also product (service) costs.Similarly, comparing operating to net income involves moreopportunity for error, as interest expense and taxes also comeinto play.
Despite the lack of significance in mean or median forecasterrors, the standard deviation, especially for net income, is toolarge to ignore and suggests that we further investigatedifferences in forecast errors between over- and under-predictors.These errors are even more bewildering considering that theBankruptcy Code partially removes many uncertaintiesconfronting emerged companies. For example, future claimsmust be identified early in the case otherwise they are
1224 PLATT AND PLATT
ß Blackwell Publishers Ltd 2002
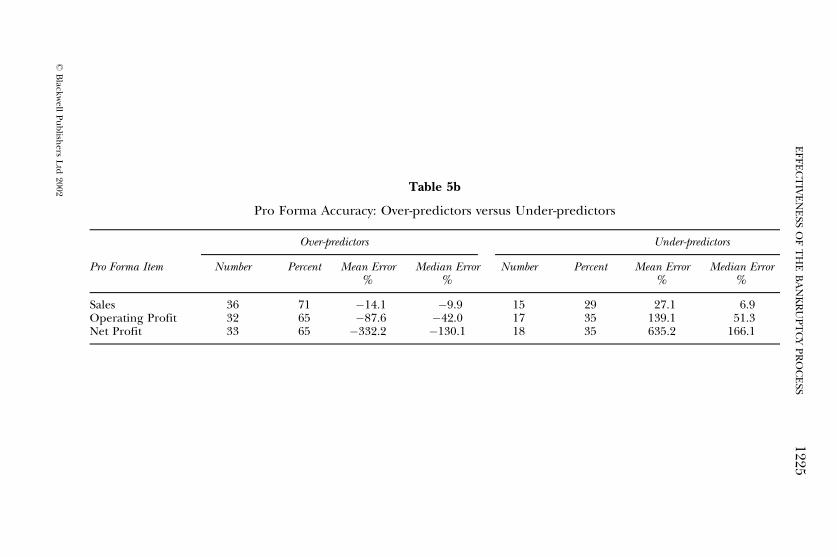
Table 5b
Pro Forma Accuracy: Over-predictors versus Under-predictors
Over-predictors Under-predictors
Pro Forma Item Number Percent Mean Error Median Error Number Percent Mean Error Median Error% % % %
Sales 36 71 ÿ14.1 ÿ9.9 15 29 27.1 6.9Operating Profit 32 65 ÿ87.6 ÿ42.0 17 35 139.1 51.3Net Profit 33 65 ÿ332.2 ÿ130.1 18 35 635.2 166.1
EF
FE
CT
IVE
NE
SSO
FT
HE
BA
NK
RU
PT
CY
PR
OC
ESS
1225
ßB
lackwell
Pu
blish
ersL
td2002

permanently excluded. In addition, the code allows companies toreject uneconomic contracts for future commitments (e.g.,property leases or employment agreements).
We explore two possible explanations for these extraordinarilylarge forecast errors. First, we test the relationship betweenforecast errors and the forecast age, that is the time elapsingbetween when the forecast was issued (or, when the companyemerged) and the start of the forecast period. A priori we expectto find larger forecast errors when the forecast was constructedwell in advance. However, these factors are unrelated.7 Timeelapsing before the forecast period begins has no effect on theforecast's accuracy. Bankruptcy produces many substantialchanges in company policies, strategies and resources. Presum-ably, forecasts are not made until such changes are sorted outwhich may be why several extra months elapsing before theforecast period begins has no effect on its accuracy.
Second, we test the relationship between the sales forecasterror (%SalesFErr) and the percentage of new stock allocated tothe equity class (%Equity) and the percentage trade creditorclaims repaid (%Trade). White (1989) describes how the oldequity class is eliminated when the pro forma presents anenterprise value that is too small, given the level of prior debts.Enterprise value is positively related to expected future sales.Thus, more optimistic PORs, which suggest that a larger `pie' willbe available for allocation, should result in greater distribution ofequity to old equity holders. White (1989) points out thatmanagement is in a strong position to influence the outcome ofthe bankruptcy proceedings operating under the `unanimousconsent procedure,' which represents most of the conditionsunder which PORs are developed.8 Because management has theexclusive right in most cases to present a POR, it is up tomanagement whether or not to present an optimistic orpessimistic plan. If existing management has greater loyalty toexisting equity holders or if existing management has greaterconfidence that existing equity holders will support their futureplans, it is likely that existing management would want todistribute new equity to old equity holders. On the other hand, ifcurrent management believes that current equity holders arelikely to withhold support of future management initiatives,existing management may structure a pessimistic POR, thus
1226 PLATT AND PLATT
ß Blackwell Publishers Ltd 2002
cutting existing equity holders off from receiving a fair orsubstantial portion of new equity upon emergence frombankruptcy. Thus, to the extent that current management has abias toward (against) distributing new equity to old equityholders, we expect their plan to be more optimistic (pessimistic)which in turn may produce negative (positive) errors suggestingover- (under-) prediction.
To test the impact of the allocation of new securities to the oldequity class, equation (1) includes both %Equity and %Trade asexplanatory variables. As argued above, depending upon theinclination of existing management, the typical architects of thePOR,9 the relationship between the percentage of new equitygoing to old equity holders, %Equity, and the forecast error signmay be either positive (pessimistic) or negative (optimistic). Wealso include the variable, %Trade, the percentage of tradecreditor claims repaid, as a second check on the relationshipbetween forecast error and bankruptcy outcomes. To testwhether over- and under-predictors had similar relationshipswith the allocation to the two different classes of claimants, wecreate an indicator variable (IsalErr), which has a value of one forover- and zero for under-predictors of sales. The structure of theestimated model is shown in equation (1):
%SalesFErr � �0 � �1�%Equity� � �2�%Trade� � �3�IsalErr� � "�1�
where �0 is the estimated constant, �i are the estimated co-efficients and " is random error.
Estimated coefficients and their significance levels arepresented in Table 6.10 The constant indicates that the expectedsales forecast error for the under-predictors is approximately25%, holding all else constant. By contrast, the expected forecasterror for over-predictors using the estimated coefficient onIsalErr, the indicator variable, is ÿ21% (25%ÿ46%). Absoluteforecast error for firms that over- and under-predict their salesperformance tend to be about equal. That is, regardless ofwhether POR forecasts are optimistic or pessimistic, their level ofaccuracy is about the same.
The results also show that there is a marginally significant,negative relationship between sales forecast error and the
EFFECTIVENESS OF THE BANKRUPTCY PROCESS 1227
ß Blackwell Publishers Ltd 2002
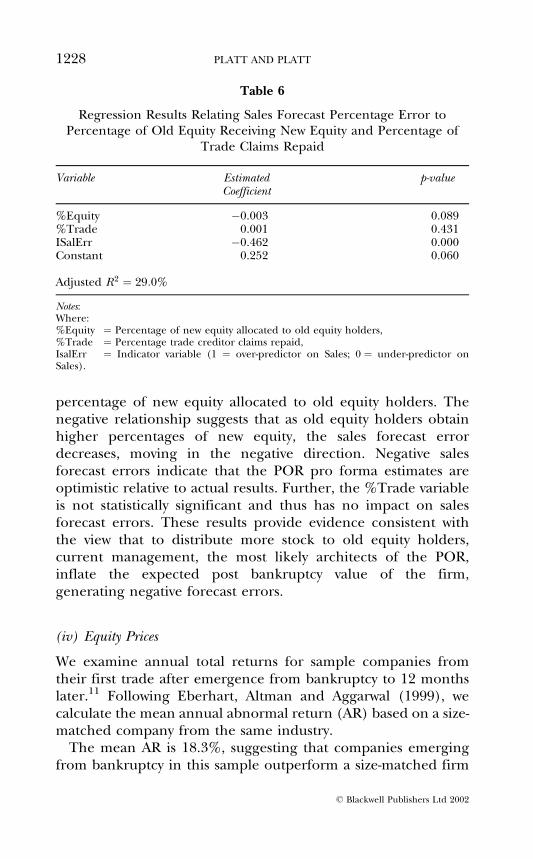
percentage of new equity allocated to old equity holders. Thenegative relationship suggests that as old equity holders obtainhigher percentages of new equity, the sales forecast errordecreases, moving in the negative direction. Negative salesforecast errors indicate that the POR pro forma estimates areoptimistic relative to actual results. Further, the %Trade variableis not statistically significant and thus has no impact on salesforecast errors. These results provide evidence consistent withthe view that to distribute more stock to old equity holders,current management, the most likely architects of the POR,inflate the expected post bankruptcy value of the firm,generating negative forecast errors.
(iv) Equity Prices
We examine annual total returns for sample companies fromtheir first trade after emergence from bankruptcy to 12 monthslater.11 Following Eberhart, Altman and Aggarwal (1999), wecalculate the mean annual abnormal return (AR) based on a size-matched company from the same industry.
The mean AR is 18.3%, suggesting that companies emergingfrom bankruptcy in this sample outperform a size-matched firm
Table 6
Regression Results Relating Sales Forecast Percentage Error toPercentage of Old Equity Receiving New Equity and Percentage of
Trade Claims Repaid
Variable Estimated p-valueCoefficient
%Equity ÿ0.003 0.089%Trade 0.001 0.431ISalErr ÿ0.462 0.000Constant 0.252 0.060
Adjusted R2 � 29:0%
Notes:Where:%Equity � Percentage of new equity allocated to old equity holders,%Trade � Percentage trade creditor claims repaid,IsalErr � Indicator variable (1 � over-predictor on Sales; 0 � under-predictor onSales).
1228 PLATT AND PLATT
ß Blackwell Publishers Ltd 2002

in their industry. We use a standard t-test to test the hypothesisthat the mean AR is zero, or no difference between the totalreturn for the sample firm and its match-mate. Test results,t�51� � 2:36, p < 0:025, show that the obtained mean AR issignificantly different from zero. Further, the median AR, 0.025,is significantly different from zero at the 0.0574 level based on aWilcoxon signed rank test. These results are consistent withEberhart, Altman and Aggarwal (1999), but inconsistent withHotchkiss' (1995) contention that the bankruptcy processproduces weak and ineffectual companies. If Hotchkiss'argument is correct, why do sample firms' equity prices notdecline after they emerge from bankruptcy? Perhaps they are likeSherlock Holmes' famous puzzle of the barking dog that wasn'tbarking; that is, the strong market returns of post-bankruptcompanies can be interpreted to mean that the market viewsthese new equities as being healthy. Of course, an alternative viewis that the market may justifiably view equities issued by a firmemerging from bankruptcy as risky securities, and the winners'above-market returns may simply be the market appropriatelypricing that risk.12
Several hypotheses help clarify the equity market performanceof post-bankrupt companies. First, one might expect the market torespond to operating results that deviate from pro formaestimates. Stock prices should rise (fall) when the companyoutperforms (does not meet) expectations. Second, managementis a key ingredient of corporate renewal (Platt, 1998). In fact, asdiscussed above, there is evidence of substantial turnover amongstCEOs in pre- and post-bankruptcy periods. Similar to past findings,we observe 48% of the sample companies replacing the CEO priorto filing the POR, and 79% doing so post emergence frombankruptcy protection. Presumably, these transitions reflect aneffort by corporate boards to ensure that top managementresources best meet the needs of the reorganized firm. Indeed,Hotchkiss (1995) finds that CEO retention up to the POR filingdate is negatively related to operating performance. Based on herfindings and believing that operating performance is related tomarket performance, we expect that CEO retention to benegatively related to market performance.
To test these explanations for post-bankruptcy equity perfor-mance we regress AR on EBIT error relative to actual sales
EFFECTIVENESS OF THE BANKRUPTCY PROCESS 1229
ß Blackwell Publishers Ltd 2002

(EBITerr.Sales) and two indicator variables denoting whether thepre-trouble CEO submits the POR (CEOPOR) or is retained postconfirmation (CEOpost).13 The structure of the estimated modelis shown in equation (2):
AR � �0 � �1(EBITerr.Sales)� �2(CEOPOR)� �3(CEOpost)
� " �2�where �0 is the estimated constant, �i are the estimatedcoefficients and " is random error.
Table 7 contains the estimated coefficients, significance levelsand goodness of fit for equation (2). All estimated coefficientsare statistically significant. Annual abnormal returns arepositively related to EBIT forecast errors relative to sales,EBITerr.Sales, and to retention of the existing CEO throughthe POR filing date, CEOPOR. However, annual abnormalreturns are negatively related to CEO retention through postbankruptcy emergence, CEOpost.
The positive relationship between EBITerr.Sales and theannual abnormal return suggests that companies beating theirpro formas were treated well by the market. For each percentagepoint by which actual sales exceed the sales forecast, the
Table 7
Regression Results Relating Annual Abnormal Returns to EBITForecast Error and CEO Retention
Variable Estimated p-valueCoefficient
EBITerr.Sales 0.600 0.032CEOPOR 0.661 0.000CEOpost ÿ0.691 0.003Constant 0.008 0.452
Adjusted R2 � 32:3%
Notes:Where:EBITerr.Sales � EBIT forecast error divided by Sales,CEOPOR � Indicator variable (1 � CEO retained through POR construction; 0
otherwise),CEOpost � Indicator variable (1 � CEO retained post emergence from bankruptcy;
0 � otherwise).
1230 PLATT AND PLATT
ß Blackwell Publishers Ltd 2002
company's annual abnormal return rises by more than six-tenthsof one percent. The significant positive coefficient for CEOPORsuggests that the market responds positively when the pre-troubleCEO puts forward the POR. However, that effect is neutralized ifthe pre-trouble CEO is retained after the firm emerges from thebankruptcy process, as evidenced by the negative coefficient forCEOpost.
The indicator variables together assume only three states: ifCEOPOR is 0, then CEOpost must be 0; if CEOPOR is 1, thenCEOpost can be either 1 or 0. The market rewards firms (0.661)that utilize an experienced senior manager to propose a POR,but reduces this reward to zero for firms that did not emerge witha new CEO �0:661ÿ 0:691 � ÿ0:03�.14 These results are notconsistent with Hotchkiss's (1995) results in which she reports anegative relationship between CEO retention through PORconstruction and operating profit. By contrast, our results suggestthat CEO retention through POR filing yields better annualabnormal returns, but that the premium is effectively depleted ifthe CEO is retained post emergence. Thus, the optimal time tobring in new management with respect to stock market returns isafter the POR is submitted, but before the process closes. Theseresults suggest that existing CEO expertise is valued whendeveloping the POR, but that new CEOs not tied to oldcorporate strategies are valued by the market.
(v) Predicting Future Outcomes Post-bankruptcy
Companies that emerge from bankruptcy either return tobankruptcy (a Chapter 22) or continue to operate asindependent entities. Similar to results reported by Hotchkiss(1995), 17% of our sample (nine companies) return tobankruptcy after 24 months, on average. We develop a logitregression predictive model that differentiates between bankruptfirms and all others using a methodology similar to Platt, Plattand Pedersen (1994).15 The data used to estimate the model arebased on performance twelve months after emergence frombankruptcy.
Three factors are used to differentiate between post-bankruptcompanies that return to bankruptcy and those that do not:annual abnormal returns (AR); the size of the firm, and duration
EFFECTIVENESS OF THE BANKRUPTCY PROCESS 1231
ß Blackwell Publishers Ltd 2002
of bankruptcy proceedings. Queen and Roll (1987) show thatequity performance predicts bankruptcy. Extending this to thequestion of Chapter 22 firms, we anticipate that firms with betterequity performance are less likely to file again for bankruptcy.Second, larger firms are less likely to enter bankruptcy (BusinessFailure Record, 1994). We capture the size effect using Sales.Larger firms, those with higher sales, should be less prone tobankruptcy. Finally, companies that spend more time inbankruptcy, measured by Duration, may have confronted morecontentious issues, may have more challenging assets to manage,or may face stronger competition. We expect firms that spendmore time in bankruptcy the first time are more likely to returnto bankruptcy. The structure of the estimated logit model isshown in equation (3):
Pi�B� � 1=�1� eÿ��0��1 AR��2 Sales��3 Duration�"�� �3�where: Pi � Probability
i � ith company in sampleB � 2nd bankruptcye � Exponential function�0 � Estimated constant�i � Estimated coefficient" � Random errorAR � Annual abnormal returnSales � Net salesDuration � Duration of 1st bankruptcy, in months.
Results for the logit model to discriminate between firms filinga second bankruptcy petition and ongoing firms, with scaledvalues, are contained in Table 8. Firms that filed a secondbankruptcy petition are coded as one, while all others are codedas zero. Thus, a positive estimated coefficient indicates that as anindependent variable rises firms are more likely to fail a secondtime. All estimated coefficients have the expected signs.Companies are less likely to return to bankruptcy the highertheir annual abnormal return, the higher their sales, and the lesstime they spend in bankruptcy originally.
Classification models are typically evaluated based on theirability to distinguish between the groups under investigation.The two groups in this study are Chapter 22 bankruptcy firms and
1232 PLATT AND PLATT
ß Blackwell Publishers Ltd 2002
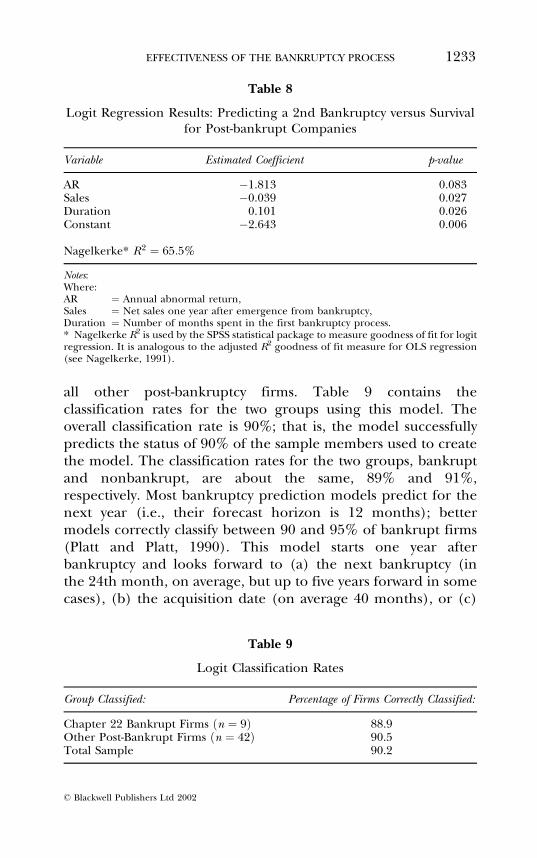
all other post-bankruptcy firms. Table 9 contains theclassification rates for the two groups using this model. Theoverall classification rate is 90%; that is, the model successfullypredicts the status of 90% of the sample members used to createthe model. The classification rates for the two groups, bankruptand nonbankrupt, are about the same, 89% and 91%,respectively. Most bankruptcy prediction models predict for thenext year (i.e., their forecast horizon is 12 months); bettermodels correctly classify between 90 and 95% of bankrupt firms(Platt and Platt, 1990). This model starts one year afterbankruptcy and looks forward to (a) the next bankruptcy (inthe 24th month, on average, but up to five years forward in somecases), (b) the acquisition date (on average 40 months), or (c)
Table 8
Logit Regression Results: Predicting a 2nd Bankruptcy versus Survivalfor Post-bankrupt Companies
Variable Estimated Coefficient p-value
AR ÿ1.813 0.083Sales ÿ0.039 0.027Duration 0.101 0.026Constant ÿ2.643 0.006
Nagelkerke* R2 � 65:5%
Notes:Where:AR � Annual abnormal return,Sales � Net sales one year after emergence from bankruptcy,Duration � Number of months spent in the first bankruptcy process.* Nagelkerke R2 is used by the SPSS statistical package to measure goodness of fit for logitregression. It is analogous to the adjusted R2 goodness of fit measure for OLS regression(see Nagelkerke, 1991).
Table 9
Logit Classification Rates
Group Classified: Percentage of Firms Correctly Classified:
Chapter 22 Bankrupt Firms �n � 9� 88.9Other Post-Bankrupt Firms �n � 42� 90.5Total Sample 90.2
EFFECTIVENESS OF THE BANKRUPTCY PROCESS 1233
ß Blackwell Publishers Ltd 2002
the date the study began (up to seven years after bankruptcyemergence). In other words, our task is more difficult, yet theresults are strong.
5. CONCLUSION
As an increasing number of companies resort to bankruptcy,society grows concerned with the process' efficacy. In contrast toprevious research, we find that relatively healthy companiesemerge from bankruptcy as evidenced by their strong equityperformance post bankruptcy. Unlike Hotchkiss (1995) whoreports that companies emerging from bankruptcy significantlyoverstate their eventual performance in their POR but ultimatelyshow median operating margins that do not differ from zero, wefind the opposite results. Companies in our sample do notoverstate (or understate) their pro forma Sales, EBIT or NetIncome, on average (as measured by either the mean or median)and obtain a median operating profit margin of 4.3% which issignificantly different from zero at the 0.01 level.
We believe that the stronger sample performance in this study,as compared to that reported by Hotchkiss (1995), is due to therelatively stronger macroeconomic climate into which the samplerestructured firms emerge. As shown in Table 1, real GDP issignificantly higher during our sample period as compared to thesample period for Hotchkiss' study. Also, the percentage changein real corporate profit after tax (PAT) is significantly higherduring our sample period. In fact, real PAT is growing at ahealthy rate during our sample period, but is declining duringHotchkiss's sample period. Thus, restructured companies have afar more hospitable economic environment in which to regaintheir footing and flourish during the current study period.
Several findings indicate that emerging companies postbankruptcy are in relatively strong financial positions. First, themedian (and mean) forecast errors for Sales, EBIT and NetIncome are not significantly different from zero, although wefind substantial dispersion among individual firms with respect toforecast errors, especially for EBIT and Net Income. These resultssuggest that on average, firms do not overstate or understatetheir future expected performance in their POR. In fact, the
1234 PLATT AND PLATT
ß Blackwell Publishers Ltd 2002

actual results are encouraging; 80% of emerging firms obtainpositive EBIT one-year post bankruptcy, generating an averageoperating profit margin of 4.3%. Second, the average abnormalreturn for emergent firms is 18.3%, using a same industry, size-matched methodology. Finally, using logit regression, wecorrectly classify 90% of post-bankrupt companies into thosethat fail again and those that do not. Factors that discriminatebetween companies entering a second bankruptcy and those whoproceed as ongoing concerns include the firm's annualabnormal return, sales as a measure of size and the duration ofthe first bankruptcy process. Firms are more likely to fail a secondtime the lower their abnormal return, the smaller their size andthe longer they spend in their first bankruptcy proceedings.
A better understanding of the efficacy of the bankruptcyprocess emerges by combining the results from this study withthose reported by Hotchkiss (1995). During periods of strongeconomic expansion, companies emerging from bankruptcystand a better chance of avoiding future financial distress andof obtaining positive earnings than similar companies emergingin periods of economic contraction. Thus, the future ofcompanies emerging from bankruptcy protection appears to bedependent on economic conditions.
NOTES
1 A weighted average for Hotchkiss' sample could not be calculated becausethe distribution of her sample firms over filing years was not given.
2 Multi-year forecasts have increasing forecast errors which diminishes theirpractical and theoretical usefulness (See Cragg and Malkiel, 1968).
3 Bankrupt companies are more like initial public offerings. However, USIPOs do not contain pro forma forecasts so that it is impossible to comparethat group with our bankrupt firms.
4 There were 24 months of recession during Hotchkiss' sample period. Bycontrast, there was only 8 months of recession during 1986 to 1993, theperiod in which 51 of the 52 companies in our sample filed for bankruptcyprotection.
5 We are grateful to Robert Mooradian who supplied this information.6 She did not report sales or net income figures.7 Regression analysis had a near zero R2 and insignificant t and F-statistics.8 The other procedure is the cram down procedure.9 Trade creditors are not generally well represented in bankruptcy
negotiations, tend not to be members of the board of directors of thedebtor and may or may not be suppliers to the post-bankruptcy firm. Thus,
EFFECTIVENESS OF THE BANKRUPTCY PROCESS 1235
ß Blackwell Publishers Ltd 2002
typically, PORs do not come from creditors who would be biased againstdistributing new equity to old equity holders, since old equity holders arebeneath them in the claimant hierarchy.
10 Models based on EBIT and Net Profit percentage errors were also run.Similar results were obtained.
11 In two cases, the companies did not last the entire 12 months before theirequity prices fell to zero.
12 Unlike junk bonds, which are all below investment grade, the securities ofcompanies emerging from bankruptcy are either strong new enterprises orweak competitors waiting to fail again.
13 Similar results were obtained when using Sales or Net Profit percentageerrors, but the relationship between the forecast error term and thedependent variable was not as strong.
14 The t-statistic �t � ÿ0:112� to test the hypothesis of no difference betweenthe beta for CEOPOR and that for CEOpost is not statistically significant.
15 Their study of a single industry, oil and gas, did not require the use ofindustry relative variables; former bankrupts are treated here as members ofa unique group that do not need to be corrected for industry differences.
REFERENCES
Aharony, J., C.P. Jones and I. Swary (1980), `An Analysis of Risk and ReturnCharacteristics of Corporate Bankruptcy Using Capital Market Data,'Journal of Finance, Vol. 35, No. 4, pp. 1001±16.
Alderson, M.J. and B.L. Betker (1999), `Assessing Post-Bankruptcy Perfor-mance: An Analysis of Reorganization Firms' Cash Flows,' FinancialManagement, Vol. 28, No. 2, pp. 68±82.
Basi, B.A., K.J. Carey and R.D. Twark (1976), `A Comparison of the Accuracy ofCorporate and Security Analysts' Forecast of Earnings,' The AccountingReview, Vol. 51, No. 2, pp. 244±54.
Branch, B. (1998), `Streamlining the Bankruptcy Process,' FinancialManagement, Vol. 27, No. 2, pp. 57±69.
Bulow, J.I. and J.B. Shoven (1978), `The Bankruptcy Decision,' The Bell Journal ofEconomics, Vol. 9, No. 2, pp. 437±56.
Business Failure Record (1994), Dun & Bradstreet.Clark, T.A. and M. Weinstein (1983), `The Behavior of the Common Stock of
Bankrupt Firms,' Journal of Finance, Vol. 38, No. 2, pp. 489±504.Copeland, R.M. and R.J. Marioni (1972), `Executive Forecasts of Earnings per
Share Versus Forecasts of Naive Models,' Journal of Business, Vol. 45, pp.497±512.
Cragg, J.G. and B. Malkiel (1968), `Consensus and Accuracy Some Predictionsof the Growth of Corporate Earnings,' Journal of Finance, Vol. 23, No. 1, pp.67±84.
Eberhart, A.C., E.I. Altman and R. Aggarwal (1999), `The Equity Performanceof Firms Emerging from Bankruptcy,' Journal of Finance, Vol. 54, No. 5, pp.1855±68.
Gertner, R. and D. Sharfstein (1991), `A Theory of Workouts and the Effects ofReoganization Law,' Journal of Finance, Vol. 46, No. 4, pp. 1189±222.
Gilson, S.C. (1989), `Management Turnover and Financial Distress,' Journal ofFinancial Economics, Vol. 25, pp. 241±62.
1236 PLATT AND PLATT
ß Blackwell Publishers Ltd 2002
Gilson, S.C. and M. Vetsuypens (1993), `CEO Compensation in FinanciallyDistressed Firms,' Journal of Finance, Vol. 48, pp. 425±58.
Hotchkiss, E.S. (19950, `Post-Bankruptcy Performance and ManagementTurnover,' Journal of Finance, Vol. 50, No. 1, pp. 67±84.
________ and R. Mooradian (1997), `Vulture Investors and the Market forControl of Distressed Firms,' Journal of Financial Economics, Vol. 33, pp. 401±32.
Indro, D.C., R.T. Leach and W.Y. Lee (1999), `Sources of Gains to Shareholdersfrom Bankruptcy Resolution,' Journal of Banking and Finance, Vol. 23, No. 1,pp. 21±47.
Koch, A.S. (1999), `Financial Distress and the Credibility of ManagementEarnings Forecasts,' presented at the American Accounting AssociationAnnual Meetings (August, New Orleans, LA).
LoPucki, L.M. and W.C. Whitford (1993), `Corporate Governance in theBankruptcy Reorganization of Large, Publicly Held Companies,' Universityof Pennsylvania Law Review, Vol. 141, pp. 669±800.
McDonald, C. (1973), `An Empirical Examination of the Reliability of PublishedPredictions of Future Earnings,' The Accounting Review, Vol. 48, No. 3, pp.502±10.
McNichols, M. (1989), `Evidence of Information Asymmetries fromManagement Earnings Forecasts and Stock Returns,' The Accounting Review,Vol. 64, No. 1, pp. 1±27.
Michel, A., I. Shaked and C. McHugh (1998), `After Bankruptcy: Can UglyDucklings Turn into Swans?' Financial Analysts Journal (May/June), pp. 31±40.
Mooradian, R. (1994), `The Effect of Bankruptcy Protection on Investment:Chapter 11 as a Screening Device,' Journal of Finance, Vol. 49, No. 4, pp.1403±30.
Nagelkerke, N.J.D. (1991), `A Note on a General Definition of the Coefficient ofDetermination,' Biometrika, Vol. 78, No. 3, pp. 691±92.
Platt, H.D. (1998), Principles of Corporate Renewal (University of Michigan Press).________ and M.B. Platt (1990), `Development of a Class of Stable Predictive
Variables: The Case of Bankruptcy Prediction,' Journal of Business Finance &Accounting, Vol. 17, No. 1, pp. 31±51.
________ ________ and J.G. Pedersen (1994), `Bankruptcy Prediction with RealVariables,' Journal of Business Finance & Accounting, Vol. 21, No. 4, pp. 491±510.
Queen, M. and R. Roll (1987), `Firm Mortality: Using Market Indicators toPredict Survival,' Financial Analyst Journal (May±June), pp. 9±26.
Ramaswami, M. and S. Moeller (1990), Investing in Financially Distressed Firms(Quorum Books).
White, M.J. (1989), `The Corporate Bankruptcy Decision,' Journal of EconomicPerspectives, Vol. 3 (Spring), pp. 129±52.
EFFECTIVENESS OF THE BANKRUPTCY PROCESS 1237
ß Blackwell Publishers Ltd 2002