Embed Size (px)
Citation preview

RESEARCH ARTICLES
A Quantitative Genetic Basis for Leaf Morphology in a Set ofPrecisely Defined Tomato Introgression LinesC W OPEN
Daniel H. Chitwood,a,1 Ravi Kumar,a,1 Lauren R. Headland,a Aashish Ranjan,a Michael F. Covington,a
Yasunori Ichihashi,a Daniel Fulop,a José M. Jiménez-Gómez,a,2 Jie Peng,b Julin N. Maloof,a
and Neelima R. Sinhaa,3
a Department of Plant Biology, University of California, Davis, California 95616bDepartment of Statistics, University of California, Davis, California 95616
Introgression lines (ILs), in which genetic material from wild tomato species is introgressed into a domesticated background,have been used extensively in tomato (Solanum lycopersicum) improvement. Here, we genotype an IL population derived fromthe wild desert tomato Solanum pennellii at ultrahigh density, providing the exact gene content harbored by each line. To takeadvantage of this information, we determine IL phenotypes for a suite of vegetative traits, ranging from leaf complexity,shape, and size to cellular traits, such as stomatal density and epidermal cell phenotypes. Elliptical Fourier descriptors onleaflet outlines provide a global analysis of highly heritable, intricate aspects of leaf morphology. We also demonstrateconstraints between leaflet size and leaf complexity, pavement cell size, and stomatal density and show independentsegregation of traits previously assumed to be genetically coregulated. Meta-analysis of previously measured traits in the ILsshows an unexpected relationship between leaf morphology and fruit sugar levels, which RNA-Seq data suggest may beattributable to genetically coregulated changes in fruit morphology or the impact of leaf shape on photosynthesis. Together,our results both improve upon the utility of an important genetic resource and attest to a complex, genetic basis fordifferences in leaf morphology between natural populations.
INTRODUCTION
The tomato clade (Solanum sect. Lycopersicon) provides uniqueopportunities to study natural variation. As one of the world’smost important crops, intense focus has been dedicated to thegenetic analysis of fruit size, shape, and sugar content betweendomesticated tomato (Solanum lycopersicum) and wild relatives(Frary et al., 2000; Fridman et al., 2004; Xiao et al., 2008). One ofthe most distant wild relatives of domesticated tomato, Solanumpennellii, originated in the deserts of Peru. When comparingtomato to a relative that inhabits such an extreme environment,other phenotypic differences undoubtedly underlie the successesof these two species (Moyle, 2008; Chitwood et al., 2013; Koeniget al., 2013). Changes in drought resistance, disease resistance,and water use efficiency, among many other traits, have enabledthese two species to thrive in their respective environments. Asmuch as the fruits of these two species differ (Figure 1A), so do
their vegetative organs, such as leaves, which exhibit pronounceddifferences in size, complexity, and morphology (Figure 1B).Surprisingly, few studies have explicitly studied quantitative
trait loci (QTL) regulating leaf traits, in any species. Such phe-notypes are associated with water use efficiency and thermo-regulation, traits important to yield (Nicotra et al., 2011; Chitwoodet al., 2012a). Studies examining leaf morphology are often limitedto analyses of size, dimensions of length and width, and com-plexity (Jiang et al., 2000; Pérez-Pérez et al., 2002; Holtan andHake, 2003; Frary et al., 2004). Recently, a genome-wide asso-ciation study using the maize (Zea mays) nested associationmapping population identified liguleless genes as regulators ofupright leaf angles. In addition to leaf angle, leaf length and widthare regulated by many loci of small effect with little epistasis (Tianet al., 2011). If the complement of genetic changes responsiblefor differences in leaf shape between species is to be fully un-derstood, similar quantitative genetics approaches will be re-quired in the future. Although length, width, and the dimensions ofleaves are important, natural variation in leaf morphology is im-mense, and methods to quantify the entirety of shape varianceare required to determine the full complement of genes regulatingdifferences in populations (Langlade et al., 2005; Chitwood et al.,2012b, 2012c, 2012d). Ultimately, the morphology of leaves isdetermined at the cellular level, and the genetics underlyingnatural variation in cellular traits are only now beginning to beexamined (Massonnet et al., 2011; Sterken et al., 2012).Despite the disparate phenotypic differences and ecological
habitats occupied by species in the tomato clade, most speciesare interfertile (Stevens and Rick, 1986), a property that has been
1 These authors contributed equally to this work.2 Current address: Max Planck Institute for Plant Breeding ResearchCarl-von-Linné-Weg 10 50829 Köln, Germany3 Address correspondence to [email protected] author responsible for distribution of materials integral to the findingspresented in this article in accordance with the policy described inthe Instructions for Authors (www.plantcell.org) is: Neelima R. Sinha([email protected]).C Some figures in this article are displayed in color online but in black andwhite in the print edition.W Online version contains Web-only data.OPENArticles can be viewed online without a subscription.www.plantcell.org/cgi/doi/10.1105/tpc.113.112391
The Plant Cell, Vol. 25: 2465–2481, July 2013, www.plantcell.org ã 2013 American Society of Plant Biologists. All rights reserved.

Figure 1. Phenotypic Differences between IL Parents and RNA-Seq and RESCAN Data for Chromosome 2 ILs.
Phenotypic differences in the fruit (A) and leaves (B) between domesticated tomato (S. lycopersicum) and a wild relative (S. pennellii ). Beyond obviousdifferences in the size, shape, and color of fruits are differences in metabolite content. Leaves between these species vary in size, complexity, andshape and non-cell-autonomously provide the majority of photosynthate to fruits. Shown are the S. pennellii introgression regions for ILs coveringchromosome 2 as determined by two methods: RNA-Seq (C) and RESCAN (D). The depth of coverage (distance from midpoint on y axis) and genotype(color and direction on y axis) of each SNP/indel is plotted against chromosomal position (x axis). Polymorphisms that match S. pennellii are coloredgreen and plotted on the top half of each IL panel, while polymorphisms matching cv M82 are plotted in magenta in the bottom halves. The coloring ison a continuum such that the color approaches black as a position’s genotype approaches heterozygosity. The y axis tick marks indicate depths ofcoverage ranging from 0 to 100 (C) or 0 to 20 (D). Subsequent to genotyping, introgression boundaries consistent between the RNA-Seq and RESCANanalyses were delineated. Using these breakpoints, S. pennellii and cv M82 regions are summarized by horizontal lines at the top and bottom of each ILpanel, respectively.
2466 The Plant Cell

exploited to create introgression lines (ILs) between wild tomatospecies and domesticated cultivars. A unique property of manysuch lines is that they contain a single, defined, introgressed ge-nomic region from a wild species donor in an otherwise domesti-cated background (Eshed and Zamir, 1995; Liu and Zamir, 1999;Monforte and Tanksley, 2000; Canady et al., 2005). A set of suchILs that tile genomic segments from desert-adapted S. pennelliiinto domesticated S. lycopersicum cv M82 (Eshed and Zamir,1995; Liu and Zamir, 1999) has been extensively phenotyped,amassing a plethora of QTL. The S. pennellii ILs have been used tomap QTL for metabolites, enzymatic activity, yield, and fitness traitsas well as the genetic basis of heterosis (Rousseaux et al., 2005;Schauer et al., 2006, 2008; Semel et al., 2006; Stevens et al., 2007;Steinhauser et al., 2011). Ultrahigh-density genotyping of the ILs isa first step toward understanding the whole plant relationships thatunderlie domesticated traits, but our knowledge will always belimited by phenotype (Chitwood and Sinha, 2013; Zamir, 2013).
Here, we precisely define the boundaries of the S. pennellii ILsat both the genomic and transcriptomic levels. Importantly, thecombination of ultrahigh-density genotyping with the recentlycompleted tomato genome allows the exact gene content of theseILs to be determined, aiding breeding efforts and the molecularcharacterization of QTL. Using precisely defined ILs, we undertakea comprehensive phenotyping of leaf traits, from the organ tocellular level. Measuring leaf shape, size, complexity, and serrationtraits, in addition to pavement cell morphology and stomataldensity and patterning, we detect 1035 QTL, 826 toward the di-rection of S. pennellii and 209 transgressive, beyond the pheno-type of the domesticated parent. We observe distinct, highlyheritable aspects of leaf shape and show that leaf shape, serra-tion, and complexity can be genetically separated, contrary toprevious findings from mutagenesis-based approaches. We ad-ditionally observe a relationship between pavement cell size andstomatal density, suggesting that modulation of cell size may bea mechanism to alter the spacing of stomata in natural pop-ulations. Finally, we analyze our phenotypes within the context ofpreviously reported metabolic, enzymatic, and whole-plant phe-notypes, finding an association between leaf complexity andshape with mono- and disaccharide levels in the fruit pericarp.RNA-Seq analysis of gene expression in the vegetative apices ofthe ILs demonstrates an association between the expression ofdevelopmental and photosynthetic pathways with this constella-tion of traits. The results suggest that leaf morphology can mod-ulate photosynthetic efficiencies and/or that natural variationregulating the shape of leaves affects fruit morphology, which inturn affects the accumulation of fruit sugar. Our results improveupon an important, stable genetic resource and offer insights intonot only the quantitative genetic basis of leaf shape, but also itsphenomic context at a whole plant level.
RESULTS
Fine-Scale Genotyping of ILs
For fine-scale genotyping of the 76 ILs, we generated a data-base of polymorphisms between the domesticated tomatospecies S. lycopersicum cv M82 and its wild relative, S. pennellii
(see Supplemental Data Set 1 online). Single nucleotide poly-morphisms (SNPs) and indels between species were identifiedusing RNA-Seq and reduced representation genomic sequenc-ing, hereafter referred to as restriction enzyme sequence com-parative analysis (RESCAN; Monson-Miller et al., 2012; Seymouret al., 2012). Taking both approaches together, we identified;750,000 polymorphisms between cv M82 and S. pennellii (seeSupplemental Table 1 online). Ninety-nine percent of the poly-morphisms identified have at most a single gene separating them,saturating coverage at the level of genetic loci.RNA-Seq and RESCAN data for the 76 ILs and detected SNPs
were used to genotype each IL across the entire genome (dataavailable at www-plb.ucdavis.edu/Labs/sinha/TomatoGenome/Resources.htm). A graphical summary of the S. pennellii in-trogressions for all the ILs shows that they tile over nearly the entiretomato genome (see Supplemental Figure 1 and SupplementalTable 2 online).For each IL, we plotted the genotype of polymorphisms for all
relevant chromosomes (ILs with introgressions on chromosome 2are shown in Figure 1; see Supplemental Figures 2 and 3 onlinefor all other chromosomes). The RNA-Seq and RESCAN-basedgenotyping results are consistent with and complement one an-other. Our RNA-Seq–based genotyping (Figure 1C) has a higherrelative depth of coverage, aiding polymorphism identification,although a smaller portion of the genome was sequenced. RESCAN-based genotyping (Figure 1D), which yields a more even distribu-tion of polymorphisms and includes nongenic regions.
Noncontiguous Introgressions and Bins
Ultrahigh-density genotyping revealed that seven ILs have multipleintrogressions. The majority of the additional introgressions are onthe same chromosome as the primary introgression (for example,IL2-1-1 and IL2-3; Figure 1; see Supplemental Figure 4 online);however, we found that IL9-3-1 has an ;100-kb introgressionfrom S. pennellii at the top of chromosome 12 (see SupplementalFigures 2L and 5 online).ILs harboring multiple introgressions have important im-
plications for genetic mapping. Unique overlapping regions be-tween introgressions define smaller intervals than the ILs, termed“bins.” The unique combinations of ILs that define a bin can dissecta QTL into considerably smaller intervals than the ILs themselves(Liu and Zamir, 1999; see Supplemental Data Set 2 online). Im-portantly, because of the additional introgressions, we changed thenomenclature of our bins compared with the original bins. As muchof the literature uses the old bin designations and cannot bechanged retroactively, we name our bins with a “d-” prefix (as ind-5E), denoting “Davis, CA.” The moniker is critical, as the bin namesbetween the old and new systems do not correspond. Whereaspreviously the 76 S. pennellii ILs defined 107 bins, precisely de-fined IL boundaries reveal 112 bins (see Supplemental Figures 4and 5 online). The majority of bins harbor <500 annotated genes(median = 177 genes, mean = 295.03 genes; see SupplementalFigure 6 and Supplemental Data Set 3 online). Increased binnumbers are caused by ILs with multiple introgressions wherepreviously only one had been detected and slightly differentboundaries between borders of ILs that were thought to be shared.In some instances, bins are noncontiguous, especially in the case
Quantitative Genetics of Leaf Shape 2467
of ILs harboring multiple introgressions (for example, d-2G followsthe IL2-3 split; see Supplemental Figure 4 online) and whena smaller introgression lies completely within a larger introgression(for example, d-10A is divided by IL10-1-1; see SupplementalFigure 5 online). Precise knowledge of IL boundaries allows thegene content of bins to be known with near certainty. A list ofannotated genes within the newly defined bins is provided (seeSupplemental Data Set 4 online).
Heritability and Detected QTL
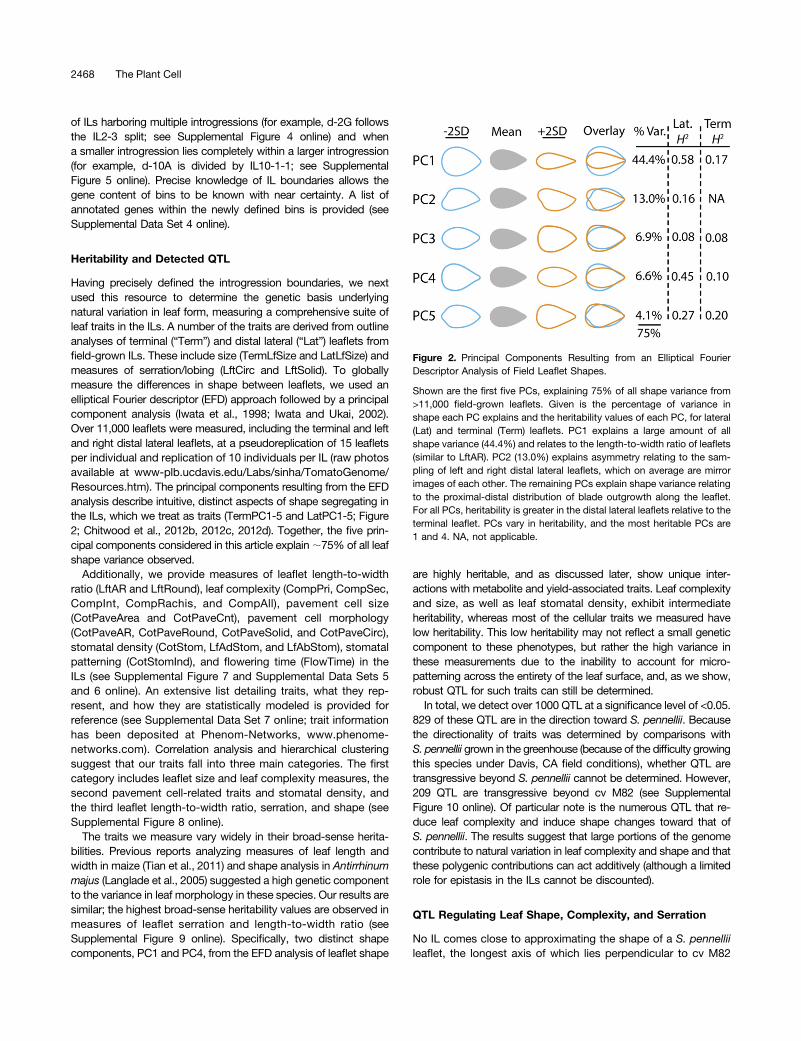
Having precisely defined the introgression boundaries, we nextused this resource to determine the genetic basis underlyingnatural variation in leaf form, measuring a comprehensive suite ofleaf traits in the ILs. A number of the traits are derived from outlineanalyses of terminal (“Term”) and distal lateral (“Lat”) leaflets fromfield-grown ILs. These include size (TermLfSize and LatLfSize) andmeasures of serration/lobing (LftCirc and LftSolid). To globallymeasure the differences in shape between leaflets, we used anelliptical Fourier descriptor (EFD) approach followed by a principalcomponent analysis (Iwata et al., 1998; Iwata and Ukai, 2002).Over 11,000 leaflets were measured, including the terminal and leftand right distal lateral leaflets, at a pseudoreplication of 15 leafletsper individual and replication of 10 individuals per IL (raw photosavailable at www-plb.ucdavis.edu/Labs/sinha/TomatoGenome/Resources.htm). The principal components resulting from the EFDanalysis describe intuitive, distinct aspects of shape segregating inthe ILs, which we treat as traits (TermPC1-5 and LatPC1-5; Figure2; Chitwood et al., 2012b, 2012c, 2012d). Together, the five prin-cipal components considered in this article explain;75% of all leafshape variance observed.
Additionally, we provide measures of leaflet length-to-widthratio (LftAR and LftRound), leaf complexity (CompPri, CompSec,CompInt, CompRachis, and CompAll), pavement cell size(CotPaveArea and CotPaveCnt), pavement cell morphology(CotPaveAR, CotPaveRound, CotPaveSolid, and CotPaveCirc),stomatal density (CotStom, LfAdStom, and LfAbStom), stomatalpatterning (CotStomInd), and flowering time (FlowTime) in theILs (see Supplemental Figure 7 and Supplemental Data Sets 5and 6 online). An extensive list detailing traits, what they rep-resent, and how they are statistically modeled is provided forreference (see Supplemental Data Set 7 online; trait informationhas been deposited at Phenom-Networks, www.phenome-networks.com). Correlation analysis and hierarchical clusteringsuggest that our traits fall into three main categories. The firstcategory includes leaflet size and leaf complexity measures, thesecond pavement cell-related traits and stomatal density, andthe third leaflet length-to-width ratio, serration, and shape (seeSupplemental Figure 8 online).
The traits we measure vary widely in their broad-sense herita-bilities. Previous reports analyzing measures of leaf length andwidth in maize (Tian et al., 2011) and shape analysis in Antirrhinummajus (Langlade et al., 2005) suggested a high genetic componentto the variance in leaf morphology in these species. Our results aresimilar; the highest broad-sense heritability values are observed inmeasures of leaflet serration and length-to-width ratio (seeSupplemental Figure 9 online). Specifically, two distinct shapecomponents, PC1 and PC4, from the EFD analysis of leaflet shape
are highly heritable, and as discussed later, show unique inter-actions with metabolite and yield-associated traits. Leaf complexityand size, as well as leaf stomatal density, exhibit intermediateheritability, whereas most of the cellular traits we measured havelow heritability. This low heritability may not reflect a small geneticcomponent to these phenotypes, but rather the high variance inthese measurements due to the inability to account for micro-patterning across the entirety of the leaf surface, and, as we show,robust QTL for such traits can still be determined.In total, we detect over 1000 QTL at a significance level of <0.05.
829 of these QTL are in the direction toward S. pennellii. Becausethe directionality of traits was determined by comparisons withS. pennellii grown in the greenhouse (because of the difficulty growingthis species under Davis, CA field conditions), whether QTL aretransgressive beyond S. pennellii cannot be determined. However,209 QTL are transgressive beyond cv M82 (see SupplementalFigure 10 online). Of particular note is the numerous QTL that re-duce leaf complexity and induce shape changes toward that ofS. pennellii. The results suggest that large portions of the genomecontribute to natural variation in leaf complexity and shape and thatthese polygenic contributions can act additively (although a limitedrole for epistasis in the ILs cannot be discounted).
QTL Regulating Leaf Shape, Complexity, and Serration
No IL comes close to approximating the shape of a S. pennelliileaflet, the longest axis of which lies perpendicular to cv M82
Figure 2. Principal Components Resulting from an Elliptical FourierDescriptor Analysis of Field Leaflet Shapes.
Shown are the first five PCs, explaining 75% of all shape variance from>11,000 field-grown leaflets. Given is the percentage of variance inshape each PC explains and the heritability values of each PC, for lateral(Lat) and terminal (Term) leaflets. PC1 explains a large amount of allshape variance (44.4%) and relates to the length-to-width ratio of leaflets(similar to LftAR). PC2 (13.0%) explains asymmetry relating to the sam-pling of left and right distal lateral leaflets, which on average are mirrorimages of each other. The remaining PCs explain shape variance relatingto the proximal-distal distribution of blade outgrowth along the leaflet.For all PCs, heritability is greater in the distal lateral leaflets relative to theterminal leaflet. PCs vary in heritability, and the most heritable PCs are1 and 4. NA, not applicable.
2468 The Plant Cell

(see Supplemental Figure 11 online). S. pennellii leaflets are alsomore orbicular and lack the distinct deltoid tip and lobing ofa domesticated tomato leaflet. Because the ILs tile the tomatogenome and a majority of ILs possess a significant shape QTL(see Supplemental Figure 10 online), this reinforces the idea thatleaflet shape is highly polygenic with an important additivecomponent.
The largest contributing loci to leaflet shape in the IL pop-ulation include ILs 4-3 and 5-4, which are much wider than cvM82, and ILs 2-1 and 9-1-2, which are transgressively narrowerthan cv M82 leaflets (see Supplemental Figure 11A online). Aclose comparison of the averaged leaflet outlines of the twowidest and two narrowest ILs against each other reveals thatthese ILs alter their shape in distinct ways (see SupplementalFigure 11B online). For example, the tip of IL5-4 remains muchmore distinct than that in IL4-3, while increasing its wideness atthe base of the leaflet. Similarly, IL2-1 and 9-1-2 vary distinctly inthe degree of constriction at their proximal ends. These four ILsrepresent four different extremes in PC1-PC4 space. Althougha simplification, PC1 explains shape variance relating to overalllength-to-width ratio changes, whereas PC4 tends to explainvariance relating more to the distinctness in shape between ILs,such as the distribution of laminar outgrowth along the proximal-distal axis and cordate bulges at the base of leaflets (Figure 2).
Extensive developmental and mutagenesis-based approachesin model systems suggest that a suite of leaf morphology fea-tures, including serration, complexity, and laminar outgrowth,are under similar genetic regulation, including the activities ofauxin and KNOX, CUC, and TCP family members (Barkoulaset al., 2007). How do these leaf features behave within thecontext of segregating natural variants? At least one IL, IL4-3,possesses significant QTL in the S. pennellii direction for alltraits measured, including significantly decreased length-to-width ratio (influenced by laminar outgrowth), decreased ser-ration and lobing (as measured by circularity and solidity), anddecreased leaf complexity counts. Nonetheless, serration andshape are genetically separable. For example, IL5-4 is signifi-cantly wider than cv M82 but is transgressively more serratedand has increased leaf complexity (Figure 3). Looking at repre-sentative leaflets, it becomes apparent that measurements ofserration and lobing versus shape impinge upon each other tosome degree; for example, the increased lobing in IL5-4 createsproximal lobes that likely contribute toward its increased width.The varying combinations of leaflet shape, serration, and com-plexity are also present in the transgressively thinner ILs 2-1 and9-1-2. That these leaf morphology traits segregate independentlyfrom each other suggests that either unique genes contribute tonatural variation in these features or that the spatiotemporal reg-ulation of known factors is modulated independently from eachother.
QTL Regulating Cellular Phenotypes
Natural variation in organ shape must arise during developmentfrom differences in the patterning, division, and expansion ofcells. Additionally, cellular features are important for adaptationsto abiotic conditions, such as the patterning and response ofstomata to the xerophytic conditions found in the native habitat
of S. pennellii (Heichel and Anagnostakis, 1978). To measurenatural variation at the cellular level in the ILs, we analyzed thesize of pavement cells, their shape characteristics, and stomataldensity and patterning on the adaxial side of cotyledons. Weadditionally measured the density of stomata on the adaxial andabaxial sides of mature, field-grown leaves.One IL in particular, IL10-3, consistently exhibits extreme
phenotypes for a number of cellular features (see SupplementalFigure 12 online). Like S. pennellii, IL10-3 has a significantlylower stomatal density on the adaxial side of cotyledons andtrue leaves, and it also possesses the largest pavement cell sizemeasured in the ILs. Beyond the developmental interest of ad-axial stomatal density, IL10-3 additionally possesses signifi-cantly reduced stomatal density on the abaxial side of trueleaves, an important adaptive trait considering the desert habitatof S. pennellii (see Supplemental Data Sets 5 and 6 online). In-terestingly, the stomatal index of IL10-3 is not significantly dif-ferent from cv M82 (“CotStomInd”; see Supplemental Data Sets5 and 6 online), suggesting that the number of stomata perpavement cell is not the major cause of these phenotypes andthat the larger pavement cell size pushes the stomata away fromeach other, reducing their density. The significant correlations be-tween pavement cell size and stomatal density (see SupplementalFigures 8 and 13 online) may represent an evolutionary mechanismto modulate stomatal spacing.
Bin Mapping and Gene Candidates
Bin mapping can be a qualitative endeavor. If one IL possessesa significant phenotypic difference from cv M82 and an over-lapping IL does not, then a QTL interval can be narrowed byexclusion. Similarly, a shared region between ILs with similarphenotypes can be used to delimit a QTL by parsimony. Ap-plying exclusion and parsimony can be difficult when dealingwith QTLs, though. For example, is an IL not significant enoughto use to exclude a region, or conversely is a QTL significantenough to apply parsimony? To help solve this predicament, foreach bin, we use a marginal regression approach, regressingbin genotypes of individuals against their trait values (seeSupplemental Figures 14A to 14D online). This allows a proba-bility value to be assigned to each bin based on its correlationwith a trait. This method is only to be used as an aid in additionto IL-based mapping approaches: Because each bin is definedby, at most, a handful of ILs, the P values assigned to bins in thismanner are influenced by the ILs that define them. Graphs si-multaneously showing IL and bin mapping results (to compareand integrate these two methods) are provided (see SupplementalFigures 15 to 47 online).Bin gene content, combined with IL and bin mapping, can
lead to candidate genes causal for the QTL of interest. Oneexample is SELF-PRUNING 5G (SP5G), which in our bin mapresides on bin d-5E. With respect to flowering time, a QTL canbe narrowed down to this bin, as IL5-4 (but not ILs 5-3 or 5-5)takes significantly more days to flower than cv M82 (seeSupplemental Figure 14A online). As this bin encompasses only36 genes and SP5G is a FLOWERING LOCUS T homolog(Carmel-Goren et al., 2003), it is a prime candidate for causingthe increased flowering time (see Supplemental Figure 14E
Quantitative Genetics of Leaf Shape 2469

online). Moreover, SP5G cosegregates for the pht5.4 QTLregulating plant height and is tightly linked to the OB-SCURAVENOSA locus, and it has been suggested that the tightlinkage of these two loci contributes to the coincident featuresof compact plant habit and chloroplast-obscured venation in
processing tomato varieties (Jones et al., 2007). Similarly, weobserve leaf phenotypes in IL5-4 as well, including wider leaves(see Supplemental Figure 11 online) with more serration andcomplexity (Figure 3). Given previously demonstrated con-nections between flowering time pathways and leaf morphology
Figure 3. Leaflet Shape, Serration, and Leaf Complexity Are Genetically Distinct Components.
(A) Representative leaflets from ILs with significant shape QTL. Given are the direction and significance of length-to-width ratio change relative to cvM82 (AR), serration/lobing (circularity), and leaf complexity. Note that despite considerable accumulated genetic evidence suggesting otherwise, thesefeatures do not follow each other, and different ILs exhibit different combinations of these traits.(B) Graphs demonstrating the breaking between AR, circularity (Circ.), and complexity (Comp.). In each graph, AR is on the x axis for comparisonshowing IL values for circularity and complexity on the y axis. Colors indicate significance of trait deviations for the y axis.[See online article for color version of this figure.]
2470 The Plant Cell

(Willmann and Poethig, 2011), it is not unreasonable to suspectSP5G as a modulator of leaf shape in addition to flowering time.
Not all bins are as small as the aforementioned, but knowingthe gene content of an interval can provide a list of potentialcandidates regulating traits. For example, bin d-9B is inferred topossess a QTL that increases leaflet aspect ratio (AR; seeSupplemental Figure 14B and LatPC1 in Supplemental Figure 31online). An ARF16 homolog, a modulator of leaflet width andhyponasty in Arabidopsis, lies in this interval (Liu et al., 2011).Similarly, d-8F is an interval regulating leaflet AR as well (seeSupplemental Figure 14C online). Within this bin lies a homologof FILAMENTOUS FLOWER/GRAMINIFOLIA, a regulator of lam-inar outgrowth, as well as an ATHB-2 homolog, which in additionto its role in the shade avoidance response, also modulates leafwidth (Siegfried et al., 1999; Steindler et al., 1999; Golz et al.,2004; Eshed et al., 2004). As adaxial-abaxial polarity determinantsmodulate leaf complexity in tomato (Kim et al., 2003a, 2003b), theinclusion of LEUNIG and KANADI2 homologs (Kerstetter et al.,2001; Cnops et al., 2004; Stahle et al., 2009) on the d-8A interval,which regulates leaf complexity, is interesting (see SupplementalFigure 14D online).
Identifying causal genes for QTL obviously requires fine-mapping,but the delimitation of the exact gene content in bins (seeSupplemental Data Set 4 online) provides a powerful startingplace to begin studies of natural variation in tomato.
Associations between Leaf Morphologyand Fruit Sugar Metabolism
One of the advantages of a true-breeding genetic resource, suchas the S. pennellii ILs, is the ability to meta-analyze phenotypicdata sets with a common genetic basis (Zamir, 2013). Perhapsthe most interesting relationship between phenotypes that hasbeen established by such studies (Schauer et al., 2006, 2008;Steinhauser et al., 2011; Toubiana et al., 2012) is a prominentnegative correlation between harvest index (the ratio of fruit yieldto overall biomass) and metabolite levels in the pericarp. Gener-ally, the more biomass of a plant dedicated to fruit production, thelower the metabolite concentrations in the fruit. The antagonismbetween metabolite levels and harvest index obviously bodesbadly for breeding efforts to increase both of these critical traitssimultaneously. However, the relationship is understandable,especially if viewed from the perspective of limited resources,nutrient allocation, and effects of metabolite dilution at the whole-plant level. Critical to the understanding of these whole plantrelationships is detailed knowledge of not only nutrient sinks (i.e.,fruits, seeds, and flowers) but the ultimate source (leaves).
To better understand the role that leaves play in these rela-tionships, we performed a correlation analysis of leaf traits withthe existing phenomics database (Phenom-Networks, www.phenome-networks.com; Figure 4; see Supplemental Figures 48and 49 online). We divide all traits analyzed into five majorgroups, defined by the studies from which they are reported andthe phenotype that they measure. Largely, traits belonging toa group describe related phenotypes, but for consistency theyare first defined by the study from which they originate, theauthors’ terminology in those studies, and most importantly theirclass designations in the Phenom-Networks database. “MET”
traits are derived from Schauer et al. (2006, 2008) and measuremetabolite levels in the fruit pericarp. “MOR” traits (for “mor-phology,” using the nomenclature of Schauer et al. [2006, 2008]and Phenom-Networks) include both yield-related traits and ex-plicit morphological measurements of fruits and flowers. The term“morphology” is used loosely and in contrast with the “metabo-lite” traits also measured by Schauer et al. (2006, 2008). For ex-ample, “MOR” traits include fruit Brix, earliness (the ratio of redfruit yield to total fruit yield), and plant weight, even though theseare not strictly morphological features. “ENZ” traits, derived fromSteinhauser et al. (2011), measure enzymatic activities in the fruitpericarp, and “SEED” traits, reported by Toubiana et al. (2012),measure metabolite levels in seeds. Traits described in this articlewere termed “DEV” traits because of their relevance to leaf de-velopment. MET, MOR, ENZ, and SEED traits (represented inblue, magenta, yellow, and orange in figures, respectively) aredescribed in Supplemental Data Set 8 online and their values andcorrelations with other traits provided in Supplemental Data Sets9 to 11 online. DEV values are provided in Supplemental Data Set5 online and described in Supplemental Data Set 7 online.Hierarchical clustering of the mean z-scores for traits reveals
a strong negative relationship of harvest index and yield-associated(MOR) traits with metabolite levels (MET; dotted box, upper right-hand corner of Figure 4A), demonstrating the robustness of thispreviously described relationship (Schauer et al., 2006, 2008;Toubiana et al., 2012). The metabolites exhibiting the strongestnegative correlation with harvest index and MOR traits are re-lated to nitrogen and amino acid metabolism in both the fruit andseed (for a close-up of the trait identities in Figure 4A, seeSupplemental Figure 50 online; amino acids indicated by asterisk).Leaf traits (DEV; black) cluster exclusively outside of the
aforementioned complex of phenotypes (i.e., the strong negativerelationship between harvest index and metabolites; Figure 4A).As DEV traits were not considered in previous analyses, thetraits from other classes that cluster with DEV traits are in-formative as to the importance of leaf traits as correlates ofmetabolism and yield. For example, a small group of highlyheritable DEV traits explaining the length-to-width ratio of leaf-lets (LftAR, LftRound, LatPC1, and TermPC1) cocluster and aresignificantly correlated with MOR traits related to length-to-width ratio in fruit and seeds (Figure 4B, red box in Figure 4A).Length-to-width ratio is the major source of shape variance(>40%) in field-grown leaflets (PC1; Figure 2). Such correlationsuggests that leaf shape is not independent from the geneticbasis of morphology in disparate organs, with implications forthe independent modulation of organ shapes during evolution.As we discuss below, changes in either leaf or fruit morphologycan explain correlations we observed with fruit sugar, demon-strating the difficulty of organ specific breeding efforts.Brix and pericarp levels of Suc, Glc, Fru, Gal, mannose, and
trehalose (small dotted box in lower right-hand corner in Figure4A; see Supplemental Figure 50 online) cluster away from thepreviously described constellation of harvest index and metab-olite antagonisms. Also included in this cluster are plant weightand earliness. This suggests a more prominent relationshipbetween carbon metabolism and leaves than the previouslyfound connection between nitrogen metabolism and harvestindex. A more detailed analysis confirms the special relationship
Quantitative Genetics of Leaf Shape 2471

Figure 4. Relationship between Leaf Morphology and Previously Measured IL Traits.
(A) Hierarchical clustering of leaf traits with previously studied traits. DEV (black), leaf development traits from this study; MOR (magenta), whole-plant,yield, and reproductive morphological traits as described by Schauer et al. (2006, 2008); MET (blue), metabolic traits described in the same studies; ENZ(yellow), enzymatic activities, as measured by Steinhauser et al. (2011); SEED (orange), seed metabolites, as described by Toubiana et al. (2012).Hierarchical clustering is based on absolute correlation values, with red denoting negative Pearson correlation coefficients and yellow positive. The tophalf of the plot shows significant correlations (<0.05) between traits after global multiple test adjustment, indicated in black. Trait identities are indicatedas a marginal rug plot along the sides of the graph. The large group of highly correlated traits (in the top right-hand corner, indicated by the dotted line) isconsistent with previous reports of negative correlation between MOR traits (including harvest index, [HI], indicated by an arrow) with fruit metabolitelevels. DEV traits cluster away from this previously described relationship and closely associate with Brix, plant weight, and mono- and disaccharidelevels, indicated by the dotted lined box toward the bottom of the graph. A more detailed view of the hierarchical clustering is found in SupplementalFigure 50 online.
2472 The Plant Cell

between leaf complexity and shape with sugar metabolism inthe fruit (see Supplemental Figure 48 online), and jackknifingsuggests that the correlations are robust and not artifacts re-sulting from undue influence of a few ILs (see SupplementalFigure 51 and Supplemental Data Set 12 online). Additionally, ifonly correlation between leaf development traits with traits fromother classes are considered, then not only do Brix and sugarlevels in the fruit exhibit the highest connectivity with leafcomplexity and shape, but they are among the most significantcorrelations (see Supplemental Figure 49 online).
Association between Photosynthetic GeneExpression and Leaf Morphology
Leaf morphology may correlate with sugar accumulation in thefruit due to a variety of factors, indirectly and directly involvingleaves. (1) The coregulation of fruit and leaf morphology throughsimilar gene regulatory networks (especially considering thatfruits are modified leaves) may lead to shape changes in the fruitthat affect the accumulation of sugars. (2) Natural variation inleaf morphology may affect photosynthetic efficiencies throughphysiological parameters (Nicotra et al., 2011; Chitwood et al.,2012a). The latter hypothesis is particularly intriguing consider-ing that >80% of sugars in the fruit are produced directly byphotosynthesis in leaves and subsequently translocated throughthe phloem (Heatherington et al., 1998; Lytovchenko et al., 2011).Nonetheless, fruit photosynthesis has been demonstrated tosignificantly affect the accumulation of fruit sugars (Powell et al.,2012), and the role of fruit morphology in this process remains tobe more fully explored.
To explore these hypotheses, we correlated the gene ex-pression levels in the 76 ILs, as measured in the vegetative apexusing RNA-Seq, against other IL trait values (Figure 5A; seeSupplemental Data Sets 13 to 15 online). After hierarchicallyclustering traits and the expression profiles of those genessignificantly correlated with at least one trait (after multiple testcorrection; see Supplemental Data Set 16 online), a distinctgroup (indicated by an asterisk in Figure 5A) contained geneswith numerous correlations to leaf development (DEV) traits. Inaddition to leaf complexity, LftCirc/LftSolid (measures of serra-tion), and PC1/LftAR (length-to-width ratio), fruit Glc is repre-sented among the traits significantly correlated with this groupof genes (see Supplemental Figure 52 online).
As might be predicted, potential regulators of leaf morphologyare present in this group of genes, including ARF3/ETTIN, ARF4,AGO1, SAW1, BELL1, PIN5, and GRF7 homologs (see SupplementalData Set 17 online), which regulate laminar outgrowth, patterning,indeterminacy, and cell expansion. Support for an intimateassociation between the genetic coregulation of leaf and fruitmorphology with fruit sugar is apparent in genes such as AUXIN-
RESPONSE FACTOR4 (ARF4), which modulate not only leafshape through auxin and adaxial-abaxial pathways, but also themorphology of the fruit (Jones et al., 2002; Yifhar et al., 2012;Sagar et al., 2013).A Gene Ontology enrichment analysis for genes within this
group reveals numerous significantly enriched categories re-lated to photosynthesis (Figures 5A and 5B; see SupplementalData Set 18 online). It is unlikely that leaf complexity and shapemodulate the levels of photosynthetic genes via changes inoverall blade area given the negative correlation between leafcomplexity and leaflet area (see Supplemental Figure 13 online).Rather, the correlation of photosynthetic gene expression withleaf development traits may reflect the influence of leaf mor-phology on photosynthetic efficiency physiologically. It is alsopossible that developmental gene regulatory networks impingeupon photosynthesis pathways more directly, independent ofleaf shape. ARF4 again provides a striking example: Not onlydoes this gene regulate both leaf and fruit morphology (Yifharet al., 2012), but it also regulates the accumulation of chloro-plasts and the greening of fruits (Jones et al., 2002), which wererecently shown to affect sugar levels (Sagar et al., 2013). Con-sidering the relationship between leaf and fruit shape, a fullerunderstanding of the causative factors underlying sugar accu-mulation will require a similar gene expression analysis in fruitsto that performed here in vegetative apices.
DISCUSSION
Although breeding traits from wild relatives into domesticatedlines is important in and of itself, the knowledge of the identitiesof genes regulating these traits can be incredibly powerful andexplanatory (Frary et al., 2000; Fridman et al., 2004; Xiao et al.,2008; Kimura et al., 2008; Li and Chetelat, 2010). In this study,the high-density genotyping we perform at the genetic andtranscriptomic levels elaborates upon previous genetic maps ofthe S. pennellii ILs and provides outstanding resolution of therecombination breakpoints that define their introgressions. Inmany instances, the increased resolution resulting from ourgenotyping yielded insights into the bin structure and thecomplement of genes harbored by the ILs. Precise knowledge ofthe genetic content of each IL is a prerequisite for positionalcloning of QTL, reverse genetics, and genetic genomics. To-gether with the recently completed tomato genome (TomatoGenome Consortium, 2012), the means to begin understandingthe genetic basis of natural variation in the tomato complex arecoming into place (Moyle, 2008; Ranjan et al., 2012).Despite the exhaustive study of harvest and fruit-related
phenotypes, little has been done to study leaves in the S. pennelliiILs. Indeed, approaches utilizing natural variation to study leaf
Figure 4. (continued).
(B) Detailed analysis of the clustering reveals unexpected whole-plant relationships between traits. For example, LftAR, LftRound, and PC1 (all highlyheritable traits describing leaflet length-to-width ratio) most closely cluster with traits relating to the dimensions of seeds and fruit, suggesting that themorphology of disparate organ types is regulated by common genetic elements. Relevant significant correlations, as multiple test–adjusted for the traitsshown, are shown with red asterisks. The traits represented in (B) are indicated in (A) by a red box.
Quantitative Genetics of Leaf Shape 2473

development are rare in any species (Jiang et al., 2000; Holtanand Hake, 2003; Kimura et al., 2008; Tian et al., 2011). Even rarerare studies of variation in leaf morphology by a quantitativemeans capable of describing total shape variance (Iwata et al.,1998; Iwata and Ukai, 2002; Langlade et al., 2005; Chitwoodet al., 2012b, 2012c, 2012d). Our analyses reveal that leaf mor-phology is highly heritable and that the S. pennellii ILs area valuable resource to study natural variation in leaves (Figure 2;see Supplemental Figure 9 online). Moreover, the drastic, butsuperficially simple shape differences in leaves between S. pen-nellii and S. lycopersicum cv M82 are regulated through a com-plex, polygenic genetic basis (see Supplemental Figure 10 online).For example, in addition to the simple regulation of length-to-width ratio, different QTL can impart distinct shapes by whichleaflets modulate their width (see Supplemental Figure 11 online).Additionally, we demonstrate that leaflet serration and leaf com-plexity segregate independently from shape characteristics andeven each other (Figure 3). This observation goes against theprevailing wisdom that leaf morphology is regulated by commongenetic elements (Barkoulas et al., 2007) and suggests that onlya small fraction of the genes regulating the tremendous variationof leaf morphology in natural populations has been discovered.What mechanisms could explain the disparate association
between leaf morphology and sugar levels in the fruit? A purelydevelopmental connection between leaves and fruit is likely partof the explanation. Among other correlations we detect is a re-lationship between traits describing the length-to-width ratio ofleaflets with traits explaining similar dimensions of fruit andseeds (Figure 4B). Considering the extensive analysis of fruitsize and morphology in tomato (Frary et al., 2000; Cong et al.,2008; Xiao et al., 2008), it will be interesting to analyze geneticperturbations modulating fruit phenotypes for their effect onvegetative development and vice versa (Wu et al., 2011). An-other possibility is that leaf development is altered by geneticchanges in overall metabolism (Hackel et al., 2006) or that ma-nipulation of carbon metabolism itself induces morphologicalchanges in leaves (Tsai et al., 1997; Geigenberger et al., 2004;Lawson et al., 2006; Raines and Paul, 2006).It is also possible that leaf morphology affects sugar metab-
olism in the fruit. Not only are leaves the ultimate source of mostphotoassimilates, but overwhelming evidence suggests thatsugars are apoplastically unloaded from the phloem into the fruit(Fridman et al., 2004; Baxter et al., 2005; Hackel et al., 2006;Zanor et al., 2009), suggesting a directionality to the correlationswe observe. The traits that correlate with fruit sugar levels arenot related to ratios of biomass to yield (Do et al., 2010) or thesize of leaves, but rather, sensu stricto, leaf shape and com-plexity. That the expression profiles of photosynthetic genescorrelate with leaf morphology traits (Figures 5A and 5B) onlybolsters the idea that leaf shape can modulate fruit sugar levelsvia a photosynthetic mechanism. Similar analyses to thosepresented here of photosynthetic gene expression in IL fruits arerequired to better resolve the roles of vegetative and reproductiveorgans in sugar accumulation.Regardless of the mechanism, our results highlight an often
overlooked fact: Leaves, as the major source of photoassimilatein the fruit (Heatherington et al., 1998; Lytovchenko et al., 2011;Powell et al., 2012) and as organs with a shared developmental
Figure 5. An Association between Photosynthetic Gene Expression andLeaf Morphology.
(A) Hierarchical clustering of traits and gene expression profiles in thevegetative apex measured across the 76 ILs. Gene expression profilesacross ILs were regressed against traits and only those genes with atleast one significant correlation with a trait were considered. Colors in-dicate significant correlation after multiple test adjustment with a geneexpression profile and the class to which the correlated trait belongs(DEV, black/white; MOR, magenta; MET, blue; ENZ, yellow; and SEED,orange). One cluster of genes (indicated by an asterisk) significantlycorrelate with numerous DEV traits related to leaf development.(B) Gene Ontology enrichment analysis of the gene group with an as-terisk reveals numerous significant categories related to photosynthesis.
2474 The Plant Cell

foundation with carpels, are an important consideration for anybreeding effort. Substantial theoretical and empirical evidencehas accumulated that leaf shape and size play major roles inwater use efficiency and thermoregulation (Parkhurst and Loucks,1972; Givnish and Vermeij, 1976; Poorter et al., 2010; Nicotraet al., 2011; Chitwood et al., 2012a). Additionally, the relationshipin the fossil record between temperature and precipitation withleaf serration and size further supports a functional significance ofleaf shape (Bailey and Sinnott, 1915; Wolfe, 1971; Greenwood,1992; Wilf et al., 1998). The environment imposed by agricultureupon domesticated species, including tomato, is radically dif-ferent from that encountered by their wild ancestors. If the mor-phology of leaves matters with respect to photosyntheticefficiency, then leaf size and shape may have been bred as muchas the crop, even when the crop is not the leaf, as in tomato. Justas leaf angle has been responsible for most yield increases inmaize over the past century (Duvick, 2005; Tian et al., 2011), wepropose that leaves may have affected the tomato fruit throughdevelopmental and photosynthetic mechanisms.
METHODS
Plant Materials, Growth Conditions, and Experimental Design
Second-generation Solanumpennellii ILs (Eshed and Zamir, 1995; Liu andZamir, 1999) and Solanum lycopersicum cv M82 seeds were obtainedfrom the Tomato Genetics Resource Center (University of California,Davis) and Dani Zamir (Hebrew University, Rehovot, Israel). For in-formation about the seed stocks used for different lines and experiments,please see Supplemental Data Set 19 online.
In mid April, seed were washed in 50% bleach for ;2 min, rinsed, andplaced onto water-soaked paper towels in Phytatrays (Sigma-Aldrich) inpreparation for field planting. Seeds were placed in darkness for 3 d beforemoving to a 16:8 light cycle in growth chambers for 4 d. Seedlings werethen transplanted into 53 10 subdivided trays (113 22 inches) in SunshineMix soil (Sun Gro) in a greenhouse. Importantly, seedlings were trans-planted in trays in the same randomized block design used in the field: Notonly did this assist field transplanting, but it allowed cellular trait meas-urements to be taken in the lath house. Twenty-one days after plating,seedlings were then transferred to a lath house (early May). In both thegreenhouse and lath house, seedlings were vigorously top watered andallowed to completely dry between waterings to harden for the field.
Thirty-five days after plating, seedlings were hand transplanted to thefield (late May). Transplanted seedlings were initially sprinkler wateredfollowed by ditch irrigated. Ditch irrigation was used as needed throughoutthe season. ILs and cv M82 were arranged in a block design with 10 rep-licates. Each block consisted of two rows. Arrangement within each blockwas randomized.
Anthesis began in early June, and field measures of leaf morphologywere taken in early July from mature leaves. Harvest of fruit began lateAugust and continued until mid September.
All traits (exceptflowering time), whether cellular traitsmeasured in the lathhouse or fieldmeasurements ofmature leaves, were studied in a 2010 field inDavis, CA. Additionally, leaf complexity traits weremeasured in a 2011 field inDavis, CA and the results incorporated together with 2010 data in statisticalmodels. Flowering time was measured exclusively from the 2011 fieldseason.
For the RNA-Seq–based genotyping and expression analysis ex-periments, seeds of the ILs and two parents were washed in 50% bleachfor ;2 min. Afterwards, seeds were placed in darkness for 3 d beforemoving to a 16:8 light cycle in growth chambers for 5 d. Seedlings were
then transplanted into 2 3 5 pots per tray in Sunshine Mix soil (Sun Gro).For each replicate, six seedlings of each parent or IL were planted per pot.The 76 ILs (and two replicates each of cv M82 and S. pennellii ) weredivided into four cohorts of 20 randomly assigned genotypes. Thesecohorts sampled different shelves and regions of shelves across fourtemporal replicates in a Latin square design to account for positionaleffects on growth. Within a cohort’s assigned space for each of fourtemporal replicates, pots were randomly distributed. The seedlings wereharvested 5 d after transplanting (13 d of growth in total). Cotyledons andmature leaves >1 cm in total length were excluded, and remaining tissues(including the shoot apical meristem) above the midpoint of the hypocotylwere pooled, for all individuals in a pot, into 2-mL microcentrifuge tubesand immediately frozen in liquid nitrogen.
RNA-Seq Library Preparation
mRNA isolation and RNA-Seq library preparation were performed from 80samples at a time using a high-throughput RNA-Seq protocol (Kumaret al., 2012). The prepared libraries were sequenced in pools of 12 forreplicates 1 and 2 (one lane each) and in pools of 80 for replicates 3 and 4(seven lanes) at the UC Davis Genome Centre Expression Analysis Coreusing the HiSequation 2000 platform (Illumina).
Preprocessing RNA-Seq and RESCAN Sequence Data
Preprocessing of reads involved removal of low quality reads (phredscore < 20), trimming of low-quality bases from the 39 ends of the reads,and removal of adapter contamination using custom Perl scripts. Thequality-filtered reads were sorted into individual libraries based onbarcodes and then barcodes were trimmed using the Fastx toolkit.
RNA-Seq Mapping
RNA-Seq reads were initially mapped to the Heinz reference genomeusing BWA (parameters: -e 15 -i 10 -k 1 -l 25 -n 0.05; Li and Durbin, 2009).Nonuniquely mapped reads and reads with a mapping quality <20 werediscarded. Unmapped reads were subsequently remapped using TopHat(parameters: -m 1 -g 1–segment-length 22 I = 5000–library-type fr-unstranded–solexa1.3-quals–butterfly-search; Trapnell et al., 2009).Mapping and intermediate processing (including sorting, filtering, andduplicate removal using samtools [Li et al., 2009] and Picard [http://picard.sourceforge.net/]) were automated using a Perl script available athttp://github.com/mfcovington/RNaseq_mapping.
To remove reads originating from repeat-rich genomic regions,RESCAN sequencing reads were initially mapped to the Sol GenomicNetwork’s tomato repeat database using BWA (BWA parameters: -e 15 -i10 -k 1 -l 25 -n 0.05) (we created the fasta file for this from the gff3 fileavailable at ftp://ftp.sgn.cornell.edu/genomes/Solanum_lycopersicum/annotation/ITAG2.3_release/ITAG2.3_repeats.gff3). Reads not mappedto the repeat database were extracted using bam2fastq program (http://www.hudsonalpha.org/gsl/software/bam2fastq.php). Subsequently,these repeat-filtered reads were mapped to the Heinz reference genomeusing the same BWA parameters. Samtools (with the’–bq 1’ option) wasused to retain the reads that mapped uniquely to the reference genome.
Polymorphism Identification for RNA-Seq
Polymorphisms between cv M82 and Heinz or S. pennellii and Heinz wereidentified using a set of Perl scripts (available at http://github.com/mfcovington/snp_identification). These scripts identify potential SNPs/indels based on pileup data extracted from the sequence alignments.RNA-Seq reads that encroach upon introns can lead to the identificationof false SNPs/indels if the portion of the read that protrudes into the intronis not long enough to be recognized by TopHat as containing an intron
Quantitative Genetics of Leaf Shape 2475

junction. To eliminate these false polymorphisms (and maintain actualpolymorphisms that exist within the exon near an exon-intron junction aswell as those at the beginning or end of a transcript), we developed a filterbased on the ratios of coverage at the putative polymorphism positionand flanking positions (offset by eight nucleotides). We used two types ofcoverage: one that only counts actual reads and another that includesgaps in reads that represent introns (CIGAR score of’N’). Both gap and no-gap depth of coverage was calculated with a samtools-based Perl module(available at http://github.com/mfcovington/coverage_calc).
A preliminary list of cv M82 versus S. pennellii polymorphisms wasgenerated by combining the filtered SNP/indel lists for the individualparents versus Heinz. Shared polymorphisms were discarded as well aspolymorphisms at chromosomal positions for which the opposite parenthad a depth of coverage less than four reads. Thesewere performed usinga set of Perl and R scripts (available at http://github.com/mfcovington/snp_identification).
Polymorphism Identification for RESCAN
VarScan (v2.2.7), a software for variant detection from next generationsequencing data, was used to call SNPs for generating parental refer-ences (Koboldt et al., 2012). To this end, the pileup2snp command wasused (parameters: –min-coverage 4–min-reads 2–min-avg-qual 20–min-var-frequation 0.9–p-value 0.05). Subsequently, the compare function ofVarScan (with the “unique” option) was used to discard common SNPsbetween cv M82 and S. pennellii, compared with the Heinz genome. TheS. pennellii SNP reference was further refined by removing SNPs rep-resented in more than five of the 76 ILs, since the reads contributing tothese SNPs are likely derived from unannotated repetitive regions. Thesesteps yielded preliminary RESCAN polymorphism list.
Polymorphism Noise Reduction
The preliminary RNA-Seq and RESCAN polymorphism lists were filteredto remove spurious SNPs/indels. This was done by genotyping the pa-rental lines that were used for initial polymorphism identification (cv M82and S. pennellii ) and removing any SNPs/indels that return an unexpectedgenotype (using a Perl script available at http://github.com/mfcovington/snp_identification). This noise reduction step results in final RNA-Seq andRESCAN versions of the database of polymorphisms between cv M82and S. pennellii (see Supplemental Data Set 1 online).
IL Genotyping and Plotting
IL sequence data was mapped to the Heinz reference genome. Mpileupinformation from each alignment was interrogated for every chromosomalposition in the relevant version of the SNP database (i.e., RNA-Seq versusRESCAN) to determine the number of reads matching cv M82 versusS. pennellii (using a set of Perl scripts available at http://github.com/mfcovington/genotyping). The genotype of every SNP/indel for all ILs canbe found at www-plb.ucdavis.edu/Labs/sinha/TomatoGenome/Resources.htm.
These data were plotted with a ggplot2-based (Wickham, 2009) ap-proach that conveys genotype and depth of coverage information foreach polymorphism across the genome (using an R script available athttp://github.com/mfcovington/geno_plot). The technique we developedto plot genotypes is also able to show heterozygous regions. Poly-morphism positions that are S. pennellii or cv M82 for every sequencingread are shown as bright green or magenta, respectively. As the ratio ofS. pennellii to cv M82 evens out, the color of the data point approachesblack. For example, our stock of IL1-2 is segregating and the introgressedregion is clearly heterozygous for thepoolwe sequenced (see SupplementalFigures 2A and 3A online).
Trait Measurement
Cellular traits were measured from the adaxial side of cotyledons fromplants in the lath house or from the adaxial and abaxial side of true leavesfrom the field. In all cases, dental impression (Provil Novo Light StandardFast; Pearson Dental Supplies) was applied using an application gun andallowed to dry before archiving. Fingernail polish (Sally Hanson DoubleDuty) was applied to impressions, allowed to dry completely, removedfrom the impression, and floated on microscope slides with water. Waterwas removed and the nail polish remained affixed to the slide. Micro-graphs of samples were taken using a standard compound microscope.For each individual impression, two micrographs were taken to ensurerepresentative measures. For each micrograph, four cotyledon pavementcells were traced using Bamboo Tablets (Wacom) in ImageJ (Abramoffet al., 2004) and the area and shape descriptors recorded. For stomataand epidermal cell counts, Bamboo Tablets were used to quickly placedots in ImageJ over the feature of interest, followed by custom macrosthat would count and record the number of features. Pseudoreplicationwas averaged.
Leaf complexity measurements were taken in the field. Pairs of mea-surers would measure two leaves per plant, including primary, secondary,and intercalary leaflet numbers. Leaf complexitywasmeasured in both 2010and 2011 field seasons. Pseudoreplication was averaged.
Leaf shape traits were derived from photographs. More than 11,000leaflets were measured for this study. For each individual, five leaves werecollected into plastic Ziploc bags and transported back to lab. For eachleaf, the terminal and two distal lateral leaflets were dissected andarranged under nonreflective glass (a total of 15 leaflets per individualwere measured). Olympus SP-500 UZ cameras were mounted on copystands (Adorama 36-inch Deluxe Copy Stand) and controlled remotely bycomputer using Cam2Com software (Sabsik). Using custom ImageJ(Abramoff et al., 2004) macros, individual leaflets were extracted andnamed appropriately to denote individual and leaflet type (terminal, distallateral left, and distal lateral right). Leaflet outlines were then batchprocessed in ImageJ to measure circularity, solidity, AR, and roundness.
Global analysis of leaflet shape was conducted using EFDs followed byprincipal component analysis using the program SHAPE (Iwata and Ukai,2002). Object contours were extracted as chain-code. Chain-code wassubsequently used to calculate normalized EFDs. Normalization wasbased upon manual orientation with respect to the proximal-distal axis ofthe leaflet. Principal component analysis was performed on the EFDsresulting from the first 20 harmonics of Fourier coefficients. Coefficients ofEFDs were calculated at22 and +2 standard deviations for each principalcomponent and the respective contour shapes reconstructed from aninverse Fourier transformation. Principal components resulting fromterminal and lateral leaflets were considered separately, and the remainingpseudoreplication was averaged.
Raw data of leaflet photos and micrographs of epidermal impressionscan be found at the following database: www-plb.ucdavis.edu/Labs/sinha/TomatoGenome/Resources.htm. Trait information has also beendeposited at Phenom-Networks (www.phenome-networks.com).
Statistical Modeling and QTL Analysis
Traits were modeled using mixed-effect linear models with the lme4package (http://CRAN.R-project.org/package=lme4) in R (R DevelopmentCore Team, 2011). Before modeling, the distribution of the trait waschecked to determine if it was normal, and if not, it was appropriatelytransformed. A thorough description of transformations applied to traits,whether model terms were treated as fixed or random, and the signifi-cance of terms is provided in Supplemental Data Set 7 online. Modelswere selected through a process of backward selection, in which twomodels differing by only the presence of a single term were compared todetermine the significance of the term in explaining variance in the data.
2476 The Plant Cell

The process was repeated for all terms (replacing the previously testedterm and testing another), and at the end of the process the most non-significant term (using a P value threshold of 0.05) was removed from themodel. This process was iterated until only significant terms remained inthe model. We then performed a forward selection check of the resultingminimal model, adding terms previously removed back to the model andcomparing to the minimal model to ensure that the nonsignificance ofremoved terms persists. That the distribution of residuals in the modelwas normal was verified. Model fitted values were used for subsequentanalysis. P values frommodels for significant differences between ILs andcv M82 were extracted using the pvals.fnc function from the languageR package (http://CRAN.R-project.org/package=languageR).
For bin analysis, each individual was factored as to whether it did or didnot possess a particular bin. This process was repeated for each bin.Marginal regression was performed by fitting a linear model between eachtrait as a function of the presence for each bin. Resulting significancevalues for each bin with respect to a given trait were then multiple testadjusted using the Holm method to control the family-wise error rate at0.05 level.
Meta-Analysis of Traits, Hierarchical Clustering,and Network Analysis
Traits from other studies used in meta-analysis were downloaded fromwww.phenome-networks.com. The studies from which traits are derivedand whether or not they are included in this study are detailed inSupplemental Data Set 8 online. Only those traits for which data werecollected for >60 ILs were considered, so as to not unduly bias results. Inreality, this means that 67 ILs were measured for the trait with the fewestrecorded values used in this study. For each trait in a data set, data werez-score normalized, and z-scores were averaged across replicates (seeSupplemental Data Set 9 online). A correlation matrix (Pearson) was thencreated between all traits, both those measured in this study and thosefrom others (see Supplemental Data Set 10 online). Significance values forcorrelations were determined and the false discovery rate controlled usingthe Benjamini and Hochberg method (see Supplemental Data Set 11online; Benjamini and Hochberg, 1995). Subsequently, subsets of thecorrelation matrix would be analyzed; for example, only those correlationsbetween a DEV trait with a trait of another class that are significant aftermultiple test adjustment.
Hierarchical clustering on data was performed using the hclustfunction from the stats package in R (R Development Core Team, 2011),clustering by the absolute value of the Pearson correlation coefficientusing Ward’s minimum variance method. Hive plots, as previouslyconceived (Krzywinski et al., 2011), were implemented using a Web in-terface developed by the Wodak Lab (wodaklab.org). Jackknifing wasperformed using custom scripts.
Unless otherwise noted, visualization of statistical results was per-formed with the ggplot2 package in R (Wickham, 2009).
Gene Expression Analysis
Mapping and normalization were done on the iPLANT Atmosphere cloudserver (Goff et al., 2011). S. lycopersicum reads were mapped to 34,727tomato cDNA sequences predicted from the gene models from theITAG2.4 genome build (downloadable from http://solgenomics.net/itag/release/2.3/list_files; Tomato Genome Consortium, 2012). A pseudoreference list was constructed for S. pennellii using the homologousregions between S. pennellii scaffolds v.1.9 and S. lycopersicum cDNAreferences above. Using the defined boundaries of ILs, custom R scriptswere used to prepare IL-specific references that had the S pennellii se-quences in the introgressed region andS. lycopersicum sequences outsidethe introgressed region. The readsweremapped using BWA (Li and Durbin,
2009) using default parameters except for the following that were changed:bwa aln: -k 1 -l 25 -e 15 -i 10 and bwa samse: -n 0. Nonuniquely mappedreadswere discarded. Raw counts for each genewere then tabulated usinga Perl script, and the counts table was then filtered in R using the Bio-conductor package EdgeR version 2.6.10 (Robinson and Oshlack, 2010)such that only genes that have more than two reads per million in at leastthree of the samples were kept. Normalization factors were then calculatedusing the trimmed mean of M-values method (Robinson and Oshlack,2010), and this wasmultiplied with the library size of each sample to get theeffective library size. The reads per million was then calculated for eachgene of a sample as (gene counts 3 1,000,000)/effective library size. Theaverage of all the normalized replicates of each IL or parent was thencalculated, and this average, in normalized reads per million, was used forthe gene expression analysis.
Averaged, normalized reads for each IL, representing 20,332 genes,were regressed against 222 trait profiles as a linear model. After multipletest adjustment using the Benjamini and Hochberg method, 12,501correlations were significant out of the 4,513,704 correlations tested. The12,501 significant correlations between gene expression profiles andtraits represented 3951 genes. These genes were hierarchically clusteredbased on their expression profile across ILs using the hclust function fromthe stats package in R, clustering by the absolute value of the Pearsoncorrelation coefficient using Ward’s minimum variance method. In-dependently clustered genes and traits were then plotted against eachother as a matrix shown in Figure 5A. Clusters of genes were then an-alyzed for enrichment of Gene Ontology terms at a 0.05 false discoveryrate cutoff (goseq Bioconductor package; Young et al., 2010).
Accession Numbers
Sequence data from this article are presented in the supplemental data.All supplemental materials from this article are deposited in the DRYADrepository: http://dx.doi.org/10.5061/dryad.rm5v5.
Supplemental Data
The following materials are available in the online version of this article.
Supplemental Figure 1. S. pennellii Introgression Summary for All 76 ILs.
Supplemental Figure 2. RNaseq-Based Genotyping of All Chromosomes.
Supplemental Figure 3. RESCAN-Based Genotyping of All Chromosomes.
Supplemental Figure 4. Map of S. pennellii Introgression Lines,Chromosomes 1-6.
Supplemental Figure 5. Map of S. pennellii Introgression Lines,Chromosomes 7-12.
Supplemental Figure 6. Distribution of Genes per Bin.
Supplemental Figure 7. Z-Score Values of ILs Relative to cv M82.
Supplemental Figure 8. Correlation between Leaf DevelopmentalTraits.
Supplemental Figure 9. Broad-Sense Heritability for Leaf Develop-mental Traits.
Supplemental Figure 10. Detected Leaf Development QTLs.
Supplemental Figure 11. Leaflet Shape QTL.
Supplemental Figure 12. IL10-3 Exhibits QTL Affecting PavementCell Size and Stomatal Density.
Supplemental Figure 13. Developmentally Insightful Correlationsbetween Leaf Development Traits.
Supplemental Figure 14. Bin Mapping and Gene Candidates.
Supplemental Figure 15. Bin Mapping Result Legend.
Quantitative Genetics of Leaf Shape 2477

Supplemental Figure 16. Bin Mapping Results for CompAll.
Supplemental Figure 17. Bin Mapping Results for CompInt.
Supplemental Figure 18. Bin Mapping Results for CompPri.
Supplemental Figure 19. Bin Mapping Results for CompRachis.
Supplemental Figure 20. Bin Mapping Results for CompSec.
Supplemental Figure 21. Bin Mapping Results for CotPaveAR.
Supplemental Figure 22. Bin Mapping Results for CotPaveArea.
Supplemental Figure 23. Bin Mapping Results for CotPaveCirc.
Supplemental Figure 24. Bin Mapping Results for CotPaveCnt.
Supplemental Figure 25. Bin Mapping Results for CotPaveRound.
Supplemental Figure 26. Bin Mapping Results for CotPaveSolid.
Supplemental Figure 27. Bin Mapping Results for CotStom.
Supplemental Figure 28. Bin Mapping Results for CotStomInd.
Supplemental Figure 29. Bin Mapping Results for FlowTime.
Supplemental Figure 30. Bin Mapping Results for LatLfSize.
Supplemental Figure 31. Bin Mapping Results for LatPC1.
Supplemental Figure 32. Bin Mapping Results for LatPC2.
Supplemental Figure 33. Bin Mapping Results for LatPC3.
Supplemental Figure 34. Bin Mapping Results for LatPC4.
Supplemental Figure 35. Bin Mapping Results for LatPC5.
Supplemental Figure 36. Bin Mapping Results for LfAbStom.
Supplemental Figure 37. Bin Mapping Results for LfAdStom.
Supplemental Figure 38. Bin Mapping Results for LfStomRatio.
Supplemental Figure 39. Bin Mapping Results for LftAR.
Supplemental Figure 40. Bin Mapping Results for LftCirc.
Supplemental Figure 41. Bin Mapping Results for LftRound.
Supplemental Figure 42. Bin Mapping Results for LftSolid.
Supplemental Figure 43. Bin Mapping Results for TermLfSize.
Supplemental Figure 44. Bin Mapping Results for TermPC1.
Supplemental Figure 45. Bin Mapping Results for TermPC3.
Supplemental Figure 46. Bin Mapping Results for TermPC4.
Supplemental Figure 47. Bin Mapping Results for TermPC5.
Supplemental Figure 48. Significant Correlations between LeafComplexity and Shape with Fruit Sugar Levels.
Supplemental Figure 49. Network Analysis Reveals a Relationshipbetween Leaf Complexity and Shape with Sugars, Brix, and Biomass.
Supplemental Figure 50. Hierarchical Clustering of Traits Analyzed inThis Study.
Supplemental Figure 51. Jackknifing Results Indicate Stable Corre-lations between Leaf Complexity and Shape with Sugar Metabolismand Yield Traits.
Supplemental Figure 52. Traits Significantly Correlated with a DistinctCluster of Genes.
Supplemental Table 1. Summary of cv M82 Versus S. pennellii SNP/Indel Distribution for RNaseq and RESCAN Analyses.
Supplemental Table 2. Chromosomal Positions of the S. pennelliiIntrogression Boundaries for All 76 ILs.
Supplemental Data Set 1. Polymorphism Database.
Supplemental Data Set 2. Unique IL Combinations Define Bins.
Supplemental Data Set 3. Genes per Bin.
Supplemental Data Set 4. Annotation of Genes Present in Each Bin.
Supplemental Data Set 5. Modeled Trait Values and SignificanceValues.
Supplemental Data Set 6. Graphs of Fitted Values for Each Trait,Their Distributions, and Significance Values.
Supplemental Data Set 7. Descriptions of Traits and Modeling.
Supplemental Data Set 8. Traits Used from Other Studies.
Supplemental Data Set 9. Matrix of Averaged z-Scores.
Supplemental Data Set 10. Pairwise Pearson Correlation CoefficientValues between Traits.
Supplemental Data Set 11. Significance Values for Pairwise Corre-lations between Traits.
Supplemental Data Set 12. Jackknifing Results for SignificantCorrelations between DEV and Traits of Other Classes.
Supplemental Data Set 13. IL Expression Values for Genes Residingon Chromosomes 1-3 and Unassembled Genes.
Supplemental Data Set 14. IL Expression Values for Genes Residingon Chromosomes 4-8.
Supplemental Data Set 15. IL Expression Values for Genes Residing onChromosomes 9-12.
Supplemental Data Set 16. Gene Expression Profiles SignificantlyCorrelated with Traits.
Supplemental Data Set 17. A Group of Genes with Similar ExpressionProfiles.
Supplemental Data Set 18. GO Categories Enriched for a Group ofGenes with Distinct Expression Profiles.
Supplemental Data Set 19. Seed Sources Used in This Study.
ACKNOWLEDGMENTS
We thank numerous undergraduate researchers (University of California,Davis) for their contributions, including Tandis Arani, Andy Buck, JessicaCruz, Michael Davis, Nora Downs, Tommy Hatcher, Max Mumbach, DanNaylor, Nataly Raymundo, Katy Rush, Paradee Thammapichai, ThinhThiem, Alaha Wahab, Jennifer Weil, Choua Yang, and Sharon Zimmer-man. We thank Jim Jackson (University of California, Davis) for field care,and Dani Zamir (Hebrew University, Rehovot, Israel) and the TomatoGenetics Resource Center (University of California, Davis) for gifts ofgermplasm. D.H.C. is a fellow of the Life Sciences Research Foundationfunded through the Gordon and Betty Moore Foundation. This work issupported through a National Science Foundation grant (IOS-0820854)awarded to N.R.S., J.N.M., and J.P.
AUTHOR CONTRIBUTIONS
D.H.C., R.K., L.R.H., A.R., M.F.C., Y.I., J.P., J.N.M., and N.R.S. designedthe research. D.H.C., R.K., L.R.H., A.R., M.F.C., Y.I., and D.F. performedthe research. A.R., M.F.C., and J.M.J.-G. contributed new analytic andcomputational tools. D.H.C., R.K., L.R.H., A.R., M.F.C., D.F., and J.M.J.-G.analyzed the data. D.H.C., R.K., A.R., M.F.C., J.P., J.N.M., and N.R.S.wrote the article.
2478 The Plant Cell
Received April 9, 2013; revised May 27, 2013; accepted July 5, 2013;published July 19, 2013.
REFERENCES
Abramoff, M.D., Magelhaes, P.J., and Ram, S.J. (2004). Imageprocessing with ImageJ. Biophotonics International 11: 36–42.
Bailey, I.W., and Sinnott, E.W. (1915). A botanical index ofCretaceous and Tertiary climates. Science 41: 831–834.
Barkoulas, M., Galinha, C., Grigg, S.P., and Tsiantis, M. (2007).From genes to shape: Regulatory interactions in leaf development.Curr. Opin. Plant Biol. 10: 660–666.
Baxter, C.J., Carrari, F., Bauke, A., Overy, S., Hill, S.A., Quick, P.W.,Fernie, A.R., and Sweetlove, L.J. (2005). Fruit carbohydratemetabolism in an introgression line of tomato with increased fruitsoluble solids. Plant Cell Physiol. 46: 425–437.
Benjamini, Y., and Hochberg, Y. (1995). Controlling the falsediscovery rate: A practical and powerful approach to multipletesting. J. R. Stat. Soc. B 57: 289–300.
Canady, M.A., Meglic, V., and Chetelat, R.T. (2005). A library ofSolanum lycopersicoides introgression lines in cultivated tomato.Genome 48: 685–697.
Carmel-Goren, L., Liu, Y.S., Lifschitz, E., and Zamir, D. (2003). TheSELF-PRUNING gene family in tomato. Plant Mol. Biol. 52: 1215–1222.
Chitwood, D.H., Headland, L.R., Filiault, D.L., Kumar, R., Jiménez-Gómez, J.M., Schrager, A.V., Park, D.S., Peng, J., Sinha, N.R.,and Maloof, J.N. (2012a). Native environment modulates leaf sizeand response to simulated foliar shade across wild tomato species.PLoS ONE 7: e29570.
Chitwood, D.H., Headland, L.R., Kumar, R., Peng, J., Maloof, J.N.,and Sinha, N.R. (2012b). The developmental trajectory of leafletmorphology in wild tomato species. Plant Physiol. 158: 1230–1240.
Chitwood, D.H., Headland, L.R., Ranjan, A., Martinez, C.C.,Braybrook, S.A., Koenig, D.P., Kuhlemeier, C., Smith, R.S., andSinha, N.R. (2012c). Leaf asymmetry as a developmental constraintimposed by auxin-dependent phyllotactic patterning. Plant Cell 24:2318–2327.
Chitwood, D.H., Maloof, J.N., and Sinha, N.R. (2013). Dynamictranscriptomic profiles between tomato and a wild relative reflectdistinct developmental architectures. Plant Physiol. 162: 537–552.
Chitwood, D.H., Naylor, D.T., Thammapichai, P., Weeger, A.C.S.,Headland, L.R., and Sinha, N.R. (2012d). Conflict between intrinsicleaf asymmetry and phyllotaxis in the resupinate leaves ofAlstroemeria psittacina. Front. Plant Sci. 3: 182.
Chitwood, D.H., and Sinha, N.R. (2013). A census of cells in time:Quantitative genetics meets developmental biology. Curr. Opin.Plant Biol. 16: 92–99.
Cnops, G., Jover-Gil, S., Peters, J.L., Neyt, P., De Block, S.,Robles, P., Ponce, M.R., Gerats, T., Micol, J.L., and VanLijsebettens, M. (2004). The rotunda2 mutants identify a role for theLEUNIG gene in vegetative leaf morphogenesis. J. Exp. Bot. 55:1529–1539.
Cong, B., Barrero, L.S., and Tanksley, S.D. (2008). Regulatorychange in YABBY-like transcription factor led to evolution ofextreme fruit size during tomato domestication. Nat. Genet. 40:800–804.
Do, P.T., Prudent, M., Sulpice, R., Causse, M., and Fernie, A.R.(2010). The influence of fruit load on the tomato pericarpmetabolome in a Solanum chmielewskii introgression line population.Plant Physiol. 154: 1128–1142.
Duvick, D.N. (2005). Genetic progress in yield of United States maize(Zea mays L.). Maydica 50: 193–202.
Eshed, Y., Izhaki, A., Baum, S.F., Floyd, S.K., and Bowman, J.L.(2004). Asymmetric leaf development and blade expansion in aremediated by KANADI and YABBY activities. Development 131:2997–3006.
Eshed, Y., and Zamir, D. (1995). An introgression line population ofLycopersicon pennellii in the cultivated tomato enables the identificationand fine mapping of yield-associated QTL. Genetics 141: 1147–1162.
Frary, A., Fritz, L.A., and Tanksley, S.D. (2004). A comparative studyof the genetic bases of natural variation in tomato leaf, sepal, andpetal morphology. Theor. Appl. Genet. 109: 523–533.
Frary, A., Nesbitt, T.C., Grandillo, S., Knaap, E., Cong, B., Liu, J.,Meller, J., Elber, R., Alpert, K.B., and Tanksley, S.D. (2000).fw2.2: A quantitative trait locus key to the evolution of tomato fruitsize. Science 289: 85–88.
Fridman, E., Carrari, F., Liu, Y.S., Fernie, A.R., and Zamir, D. (2004).Zooming in on a quantitative trait for tomato yield using interspecificintrogressions. Science 305: 1786–1789.
Geigenberger, P., Regierer, B., Lytovchenko, A., Leisse, A.,Schauer, N., Springer, F., Kossmann, J., and Fernie, A.R. (2004).Heterologous expression of a ketohexokinase in potato plants leadsto inhibited rates of photosynthesis, severe growth retardation andabnormal leaf development. Planta 218: 569–578.
Givnish, T.J., and Vermeij, G.J. (1976). Sizes and shapes of lianeleaves. Am. Nat. 110: 743–778.
Goff, S.A., et al. (2011). The iPlant Collaborative: Cyberinfrastructurefor plant biology. Front. Plant Sci. 2: 34.
Golz, J.F., Roccaro, M., Kuzoff, R., and Hudson, A. (2004). GRAMINIFOLIApromotes growth and polarity of Antirrhinum leaves. Development 131:3661–3670.
Greenwood, D.R. (1992). Taphonomic constraints on foliar physiognomicinterpretations of Late Cretaceous and Tertiary palaeoclimates. Rev.Palaeobot. Palynol. 71: 149–190.
Hackel, A., Schauer, N., Carrari, F., Fernie, A.R., Grimm, B., andKühn, C. (2006). Sucrose transporter LeSUT1 and LeSUT2 inhibitionaffects tomato fruit development in different ways. Plant J. 45: 180–192.
Heatherington, S.E., Smillie, R.M., and Davies, W.J. (1998).Photosynthetic activites of vegetative and fruiting tissues of tomato.J. Exp. Bot. 49: 1173–1181.
Heichel, G.H., and Anagnostakis, S.L. (1978). Stomatal response tolight of Solanum pennellii, Lycopersicon esculentum, and a graft-induced chimera. Plant Physiol. 62: 387–390.
Holtan, H.E.E., and Hake, S. (2003). Quantitative trait locus analysisof leaf dissection in tomato using Lycopersicon pennellii segmentalintrogression lines. Genetics 165: 1541–1550.
Iwata, H., Niikura, S., Matsuura, S., Takano, Y., and Ukai, Y. (1998).Evaluation of variation of root shape of Japanese radish (Raphanussativus L.) based on image analysis using elliptic Fourier descriptors. J.Hered. 93: 384–385.
Iwata, H., and Ukai, Y. (2002). SHAPE: A computer program packagefor quantitative evaluation of biological shapes based on ellipticFourier descriptors. J. Hered. 93: 384–385.
Jiang, C., Wright, R.J., Woo, S.S., DelMonte, T.A., and Paterson,A.H. (2000). QTL analysis of leaf morphology in tetraploid Gossypoium(cotton). Theor. Appl. Genet. 100: 409–418.
Jones, B., Frasse, P., Olmos, E., Zegzouti, H., Li, Z.G., Latché, A.,Pech, J.C., and Bouzayen, M. (2002). Down-regulation of DR12, anauxin-response-factor homolog, in the tomato results in a pleiotropicphenotype including dark green and blotchy ripening fruit. Plant J. 32:603–613.
Jones, C.M., Rick, C.M., Adams, D., Jernstedt, J., and Chetelat,R.T. (2007). Genealogy and fine mapping of obscuravenosa, a geneaffecting the distribution of chloroplasts in leaf veins, and evidence
Quantitative Genetics of Leaf Shape 2479

of selection during breeding of tomatoes (Lycopersicon esculentum;Solanaceae). Am. J. Bot. 94: 935–947.
Kerstetter, R.A., Bollman, K., Taylor, R.A., Bomblies, K., andPoethig, R.S. (2001). KANADI regulates organ polarity in Arabidopsis.Nature 411: 706–709.
Kim, M., McCormick, S., Timmermans, M., and Sinha, N. (2003a).The expression domain of PHANTASTICA determines leafletplacement in compound leaves. Nature 424: 438–443.
Kim, M., Pham, T., Hamidi, A., McCormick, S., Kuzoff, R.K., andSinha, N. (2003b). Reduced leaf complexity in tomato wiry mutantssuggests a role for PHAN and KNOX genes in generating compoundleaves. Development 130: 4405–4415.
Kimura, S., Koenig, D., Kang, J., Yoong, F.Y., and Sinha, N. (2008).Natural variation in leaf morphology results from mutation of a novelKNOX gene. Curr. Biol. 18: 672–677.
Koboldt, D.C., Zhang, Q., Larson, D.E., Shen, D., McLellan, M.D.,Lin, L., Miller, C.A., Mardis, E.R., Ding, L., and Wilson, R.K. (2012).VarScan 2: Somatic mutation and copy number alteration discovery incancer by exome sequencing. Genome Res. 22: 568–576.
Koenig, D., et al. (2013). Comparative transcriptomics revealspatterns of selection in domesticated and wild tomato. Proc. Natl.Acad. Sci. USA 110: E2655-E2662.
Krzywinski, M., Birol, I., Jones, S., and Marra, M. (2011). Hiveplots–Rational approach to visualizing networks. Brief. Bioinform.doi: 10.1093/bib/bbr069.
Kumar, R., Ichihashi, Y., Kimura, S., Chitwood, D.H., Headland,L.R., Peng, J., Maloof, J.N., and Sinha, N.R. (2012). A high-throughput method for Illumina RNA-Seq library preparation. Front.Plant Sci. 3: 202.
Langlade, N.B., Feng, X., Dransfield, T., Copsey, L., Hanna, A.I.,Thébaud, C., Bangham, A., Hudson, A., and Coen, E. (2005).Evolution through genetically controlled allometry space. Proc. Natl.Acad. Sci. USA 102: 10221–10226.
Lawson, T., Bryant, B., Lefebvre, S., Lloyd, J.C., and Raines, C.A.(2006). Decreased SBPase activity alters growth and developmentin transgenic tobacco plants. Plant Cell Environ. 29: 48–58.
Li, H., and Durbin, R. (2009). Fast and accurate short read alignmentwith Burrows-Wheeler transform. Bioinformatics 25: 1754–1760.
Li, H., Handsaker, B., Wysoker, A., Fennell, T., Ruan, J., Homer, N.,Marth, G., Abecasis, G., and Durbin, R.1000 Genome ProjectData Processing Subgroup (2009). The sequence alignment/mapformat and SAM tools. Bioinformatics 25: 2078–2079.
Li, W., and Chetelat, R.T. (2010). A pollen factor linking inter- andintraspecific pollen rejection in tomato. Science 330: 1827–1830.
Liu, Y.-S., and Zamir, D. (1999). Second generation L. pennelliiintrogression lines and the concept of bin mapping. Report of theTomato Genetics Cooperative 49: 26–30.
Liu, Z., Jia, L., Wang, H., and He, Y. (2011). HYL1 regulates thebalance between adaxial and abaxial identity for leaf flattening viamiRNA-mediated pathways. J. Exp. Bot. 62: 4367–4381.
Lytovchenko, A., et al. (2011). Tomato fruit photosynthesis isseemingly unimportant in primary metabolism and ripening butplays a considerable role in seed development. Plant Physiol. 157:1650–1663.
Massonnet, C., Tisné, S., Radziejwoski, A., Vile, D., De Veylder, L.,Dauzat, M., and Granier, C. (2011). New insights into the control ofendoreduplication: endoreduplication could be driven by organgrowth in Arabidopsis leaves. Plant Physiol. 157: 2044–2055.
Monforte, A.J., and Tanksley, S.D. (2000). Development of a set ofnear isogenic and backcross recombinant inbred lines containingmost of the Lycopersicon hirsutum genome in a L. esculentumgenetic background: a tool for gene mapping and gene discovery.Genome 43: 803–813.
Monson-Miller, J., Sanchez-Mendez, D.C., Fass, J., Henry, I.M.,Tai, T.H., and Comai, L. (2012). Reference genome-independentassessment of mutation density using restriction enzyme-phasedsequencing. BMC Genomics 13: 72.
Moyle, L.C. (2008). Ecological and evolutionary genomics in the wildtomatoes (Solanum sect. Lycopersicon). Evolution 62: 2995–3013.
Nicotra, A.B., Leigh, A., Boyce, C.K., Jones, C.S., Niklas, K.J.,Royer, D.L., and Tsukaya, H. (2011). The evolution and functionalsignificance of leaf shape in the angiosperms. Funct. Plant Biol. 38:535–552.
Parkhurst, D.F., and Loucks, O.L. (1972). Optimal leaf size in relationto environment. J. Ecol. 60: 505–537.
Pérez-Pérez, J.M., Serrano-Cartagena, J., and Micol, J.L. (2002).Genetic analysis of natural variations in the architecture ofArabidopsis thaliana vegetative leaves. Genetics 162: 893–915.
Poorter, H., Niinemets, U., Walter, A., Fiorani, F., and Schurr, U.(2010). A method to construct dose-response curves for a widerange of environmental factors and plant traits by means of a meta-analysis of phenotypic data. J. Exp. Bot. 61: 2043–2055.
Powell, A.L.T., et al. (2012). Uniform ripening encodes a Golden 2-liketranscription factor regulating tomato fruit chloroplast development.Science 336: 1711–1715.
R Development Core Team (2011). R: A Language and Environmentfor Statistical Computing. (Vienna, Austria: R Foundation for Sta-tistical Computing).
Raines, C.A., and Paul, M.J. (2006). Products of leaf primary carbonmetabolism modulate the developmental programme determiningplant morphology. J. Exp. Bot. 57: 1857–1862.
Ranjan, A., Ichihashi, Y., and Sinha, N.R. (2012). The tomatogenome: Implications for plant breeding, genomics and evolution.Genome Biol. 13: 167.
Robinson, M.D., and Oshlack, A. (2010). A scaling normalizationmethod for differential expression analysis of RNA-seq data.Genome Biol. 11: R25.
Rousseaux, M.C., Jones, C.M., Adams, D., Chetelat, R., Bennett,A., and Powell, A. (2005). QTL analysis of fruit antioxidants intomato using Lycopersicon pennellii introgression lines. Theor.Appl. Genet. 111: 1396–1408.
Sagar, M., et al. (2013). SlARF4, an auxin response factor involved inthe control of sugar metabolism during tomato fruit development.Plant Physiol. 161: 1362–1374.
Schauer, N., Semel, Y., Balbo, I., Steinfath, M., Repsilber, D., Selbig, J.,Pleban, T., Zamir, D., and Fernie, A.R. (2008). Mode of inheritance ofprimary metabolic traits in tomato. Plant Cell 20: 509–523.
Schauer, N., et al. (2006). Comprehensive metabolic profiling andphenotyping of interspecific introgression lines for tomato improvement.Nat. Biotechnol. 24: 447–454.
Semel, Y., Nissenbaum, J., Menda, N., Zinder, M., Krieger, U.,Issman, N., Pleban, T., Lippman, Z., Gur, A., and Zamir, D. (2006).Overdominant quantitative trait loci for yield and fitness in tomato.Proc. Natl. Acad. Sci. USA 103: 12981–12986.
Seymour, D.K., Filiault, D.L., Henry, I.M., Monson-Miller, J., Ravi,M., Pang, A., Comai, L., Chan, S.W., and Maloof, J.N. (2012).Rapid creation of Arabidopsis doubled haploid lines for quantitativetrait locus mapping. Proc. Natl. Acad. Sci. USA 109: 4227–4232.
Siegfried, K.R., Eshed, Y., Baum, S.F., Otsuga, D., Drews, G.N.,and Bowman, J.L. (1999). Members of the YABBY gene family specifyabaxial cell fate in Arabidopsis. Development 126: 4117–4128.
Stahle, M.I., Kuehlich, J., Staron, L., von Arnim, A.G., and Golz, J.F.(2009). YABBYs and the transcriptional corepressors LEUNIG andLEUNIG_HOMOLOG maintain leaf polarity and meristem activity inArabidopsis. Plant Cell 21: 3105–3118.
2480 The Plant Cell

Steindler, C., Matteucci, A., Sessa, G., Weimar, T., Ohgishi, M.,Aoyama, T., Morelli, G., and Ruberti, I. (1999). Shade avoidanceresponses are mediated by the ATHB-2 HD-zip protein, a negativeregulator of gene expression. Development 126: 4235–4245.
Steinhauser, M.C., Steinhauser, D., Gibon, Y., Bolger, M., Arrivault,S., Usadel, B., Zamir, D., Fernie, A.R., and Stitt, M. (2011).Identification of enzyme activity quantitative trait loci in a Solanumlycopersicum x Solanum pennellii introgression line population.Plant Physiol. 157: 998–1014.
Sterken, R., Kiekens, R., Boruc, J., Zhang, F., Vercauteren, A.,Vercauteren, I., De Smet, L., Dhondt, S., Inzé, D., De Veylder, L.,Russinova, E., and Vuylsteke, M. (2012). Combined linkage andassociation mapping reveals CYCD5;1 as a quantitative trait genefor endoreduplication in Arabidopsis. Proc. Natl. Acad. Sci. USA109: 4678–4683.
Stevens, M.A., and Rick, C.M. (1986). Genetics and breeding. In TheTomato Crop, J.G. Atherton and J. Rudich, eds (London, New York:Chapman and Hall), pp. 36–109.
Stevens, R., Buret, M., Duffé, P., Garchery, C., Baldet, P., Rothan,C., and Causse, M. (2007). Candidate genes and quantitative traitloci affecting fruit ascorbic acid content in three tomato populations.Plant Physiol. 143: 1943–1953.
Tian, F., Bradbury, P.J., Brown, P.J., Hung, H., Sun, Q., Flint-Garcia, S., Rocheford, T.R., McMullen, M.D., Holland, J.B., andBuckler, E.S. (2011). Genome-wide association study of leafarchitecture in the maize nested association mapping population.Nat. Genet. 43: 159–162.
Tomato Genome Consortium (2012). The tomato genome sequenceprovides insights into fleshy fruit evolution. Nature 485: 635–641.
Toubiana, D., Semel, Y., Tohge, T., Beleggia, R., Cattivelli, L.,Rosental, L., Nikoloski, Z., Zamir, D., Fernie, A.R., and Fait, A.(2012). Metabolic profiling of a mapping population exposes newinsights in the regulation of seed metabolism and seed, fruit, andplant relations. PLoS Genet. 8: e1002612.
Trapnell, C., Pachter, L., and Salzberg, S.L. (2009). TopHat: Discoveringsplice junctions with RNA-Seq. Bioinformatics 25: 1105–1111.
Tsai, C.H., Miller, A., Spalding, M., and Rodermel, S. (1997). Sourcestrength regulates an early phase transition of tobacco shootmorphogenesis. Plant Physiol. 115: 907–914.
Wickham, H. (2009). ggplot2: Elegant Graphics for Data Analysis.(New York: Springer).
Wilf, P., Wing, S.L., Greenwood, D.R., and Greenwood, C.L. (1998).Using fossil leaves as paleoprecipitation indicators: An Eoceneexample. Geology 26: 203–206.
Willmann, M.R., and Poethig, R.S. (2011). The effect of the floralrepressor FLC on the timing and progression of vegetative phasechange in Arabidopsis. Development 138: 677–685.
Wolfe, J.A. (1971). Tertiary climatic fluctuations and methods ofanalysis of tertiary floras. Palaeogeogr. Palaeoclimatol. Palaeoecol.9: 27–57.
Wu, S., Xiao, H., Cabrera, A., Meulia, T., and van der Knaap, E.(2011). SUN regulates vegetative and reproductive organ shape bychanging cell division patterns. Plant Physiol. 157: 1175–1186.
Xiao, H., Jiang, N., Schaffner, E., Stockinger, E.J., and van derKnaap, E. (2008). A retrotransposon-mediated gene duplicationunderlies morphological variation of tomato fruit. Science 319:1527–1530.
Yifhar, T., Pekker, I., Peled, D., Friedlander, G., Pistunov, A.,Sabban, M., Wachsman, G., Alvarez, J.P., Amsellem, Z., andEshed, Y. (2012). Failure of the tomato trans-acting short interferingRNA program to regulate AUXIN RESPONSE FACTOR3 and ARF4underlies the wiry leaf syndrome. Plant Cell 24: 3575–3589.
Young, M.D., Wakefield, M.J., Smyth, G.K., and Oshlack, A. (2010).Gene ontology analysis for RNA-seq: Accounting for selection bias.Genome Biol. 11: R14.
Zamir, D. (2013). Where have all the crop phenotypes gone? PLoSBiol. 11: e1001595.
Zanor, M.I., Rambla, J.L., Chaïb, J., Steppa, A., Medina, A., Granell,A., Fernie, A.R., and Causse, M. (2009). Metabolic characterizationof loci affecting sensory attributes in tomato allows an assessmentof the influence of the levels of primary metabolites and volatileorganic contents. J. Exp. Bot. 60: 2139–2154.
Quantitative Genetics of Leaf Shape 2481

DOI 10.1105/tpc.113.112391; originally published online July 19, 2013; 2013;25;2465-2481Plant Cell
SinhaYasunori Ichihashi, Daniel Fulop, José M. Jiménez-Gómez, Jie Peng, Julin N. Maloof and Neelima R.
Daniel H. Chitwood, Ravi Kumar, Lauren R. Headland, Aashish Ranjan, Michael F. Covington,Introgression Lines
A Quantitative Genetic Basis for Leaf Morphology in a Set of Precisely Defined Tomato
This information is current as of July 1, 2018
Supplemental Data /content/suppl/2013/07/19/tpc.113.112391.DC1.html /content/suppl/2016/03/01/tpc.113.112391.DC2.html
References /content/25/7/2465.full.html#ref-list-1
This article cites 88 articles, 37 of which can be accessed free at:
Permissions https://www.copyright.com/ccc/openurl.do?sid=pd_hw1532298X&issn=1532298X&WT.mc_id=pd_hw1532298X
eTOCs http://www.plantcell.org/cgi/alerts/ctmain
Sign up for eTOCs at:
CiteTrack Alerts http://www.plantcell.org/cgi/alerts/ctmain
Sign up for CiteTrack Alerts at:
Subscription Information http://www.aspb.org/publications/subscriptions.cfm
is available at:Plant Physiology and The Plant CellSubscription Information for
ADVANCING THE SCIENCE OF PLANT BIOLOGY © American Society of Plant Biologists