Embed Size (px)
Citation preview

IEICE TRANS. COMMUN., VOL.E90–B, NO.7 JULY 20071651
PAPER
A Proximity-Based Self-Organizing Hierarchical OverlayFramework for Distributed Hash Tables
Kwangwook SHIN†a), Student Member, Seunghak LEE†, Geunhwi LIM††, and Hyunsoo YOON†, Nonmembers
SUMMARY Several structured peer-to-peer networks have been cre-ated to solve the scalability problem of previous peer-to-peer systems suchas Gnutella and Napster. These peer-to-peer networks which support dis-tributed hash table functionality construct a sort of structured overlay net-work, which can cause a topology mismatch between the overlay and theunderlying physical network. To solve this mismatch problem, we proposea topology-aware hierarchical overlay framework for DHTs. The hierar-chical approach for the overlay is based on the concept that the underlyingglobal Internet is also a hierarchical architecture, that is, a network of net-works. This hierarchical approach for the overlay puts forth two benefits:finding data in a physically near place with a high probability, and smallerlookup time. Our hierarchical overlay framework is different from otherhierarchical architecture systems in a sense that it provides a specific self-organizing grouping algorithm. Our additional optimization schemes com-plete the basic algorithm which constructs a hierarchical structure withoutany central control.key words: peer-to-peer, DHT, physical topology, hierarchical architec-ture, overlay network, efficient replication
1. Introduction
Peer-to-peer networks can be characterized as self-organized dynamic server set (which also plays the role ofthe client). In the peer-to-peer networks, the node can join orleave the networks at any time and there is no control of thecentral coordinator. Several peer-to-peer lookup networkswhich support distributed hash table functionality have beencreated to solve the scalability problems of previous peer-to-peer systems such as Gnutella and Napster [1]–[3]. Inthe DHT (Distributed Hash Table) systems, one stores datain the node determined by the hash function and the otherlooks up the node storing data with the same hash function.Each node in the overlay network has the partial location in-formation for logical routing. The partial location informa-tion is well distributed, so that one can be closer and closerto the destination on every logical hop. These peer-to-peernetworks which support distributed hash table functionalityconstruct a sort of structured overlay network, which cancause a topology mismatch between the overlay and the un-derlying physical network. The physical distance betweenthe node looking for some data and the node storing this datamay be long. In addition, the lookup time can also be largebecause the system does not consider the physical topologywhen it stores or replicates data.
Manuscript received September 7, 2006.Manuscript revised January 5, 2007.†The authors are with EECS, KAIST, Korea.††The author is with Samsung Electronics Co., Korea.a) E-mail: [email protected]
DOI: 10.1093/ietcom/e90–b.7.1651
Fig. 1 The hierarchical structure of Grapes.
We propose a hierarchical overlay framework, whichis named Grapes [4], for DHTs. Grapes constructs thehierarchical structure using physical topology information.Grapes has a two-layer hierarchical structure, sub-network,and super-network as shown in Fig. 1. In Grapes, nodesphysically near each other construct the sub-network, andthe leaders of each sub-network form the super-network.This hierarchical approach puts forth two benefits. First, anode can find data in its sub-network with a high probabilitydue to the replicated data publication (data replication) in itssub-network. Grapes supports the efficient data replicationconsidering the physical topology. Second, the hierarchicalstructure with the physical information makes the lookuptime smaller. There are some other schemes to provide hi-erarchical concepts for peer-to-peer networks. Our hierar-chical overlay framework is different from other hierarchi-cal architecture systems in a sense that it provides a spe-cific self-organizing grouping algorithm. To the best of ourknowledge, Grapes is the only unique topology-aware hier-archical overlay network which supports the original peer-to-peer concept of self-organization.
The rest of this paper is structured as follows. We dis-cuss the related work in Sect. 2. Sections 3 and 4 describethe basic design of Grapes and the optimization methods forthe Grapes. Section 5 demonstrates the performance evalua-tion by simulation. Finally, we conclude the paper in Sect. 6.
2. Related Work
2.1 DHT (Distributed Hash Tables) Systems
CAN [5], Chord [6], Pastry [7] and Tapestry [8] are repre-
Copyright c© 2007 The Institute of Electronics, Information and Communication Engineers

1652IEICE TRANS. COMMUN., VOL.E90–B, NO.7 JULY 2007
sentative DHT-based peer-to-peer lookup services. In CAN[5], the problem due to lack of physical distance informa-tion is compensated by two heuristic methods. First, eachnode measures its network delay to a set of landmarks andorders the landmarks in order of increasing RTT. Nodes withthe same orderings are inserted into the same portion of thecoordinate space, which makes logical neighbor physicallyclose to each other [5], [9]. This heuristic is categorizedinto the Proximity Identifier Selection (PIS) by [10]. Sec-ond, the CAN node can forward a message to its neighborwith the maximum ratio of progress to RTT. This heuristicis categorized into the Proximity Route Selection (PRS) by[10]. Original Chord does not consider physical distance in-formation, but enhanced scheme [11], [12] uses PRS. Thereare potentially several possible next hop neighbors that arecloser to the message’s key in the id space. PRS is to se-lect, among the possible next hops, the one that is closestin the physical network or one that represents a good com-promise between progress in the id space and proximity. InTapestry [8] and Pastry [7], when a new node is inserted tothe overlay network, it finds the bootstrap node close to it inphysical distance by expanded ring search or out of bandcommunication. Also, they can choose physically closerneighbors among the neighbor candidates when they con-struct the routing tables. This is categorized into ProximityNeighbor Selection (PNS) by [10].
However, the objective of all the above optimizationmethods (except Tapestry) considering physical topology isonly to make the immediate neighbors in the overlay net-work close on the Internet. The physical distance betweenthe node looking for some data and the node storing thisdata may still be long. It is because the above methodsdo not provide the framework for the efficient data replica-tion with the physical information. Tapestry provides somekind of data replication scheme considering physical topol-ogy. When the Tapestry node publishes an object, the nodestores its pointer in the root node of this object. The pointeris also stored in the nodes on the path from the publishingnode to the root. When a node finds the object, it locatesthe object by routing a message to the root. Each node onthe path checks whether it has a pointer for the object. Ifso, it redirects the message to the node of the pointer. Ifthere are replicas of an object on various publishing node,the node locates the object in the logically closer node. InTapestry, since the overlay is structured with PNS, the logi-cal neighbor is somewhat physically close. This makes thepossibility that the node finds the object in the physicallycloser node among the replicas higher. However, Tapestrydoes not consider hierarchical architecture overlay. To har-monize the virtual overlay with Internet physical topology,we think, the hierarchical approach is one of the best so-lution because global scale Internet is composed of variouslocalized networks, which forms a hierarchical architecture.
2.2 Hierarchical Architecture Systems
Brocade [13] proposed a similar hierarchical architecture
based on physical topology. Brocade constructs a secondaryoverlay to be layered on top of peer-to-peer lookup sys-tems. The secondary overlay builds a location layer betweenthe super-nodes. The nodes looking for some data whichis stored in the long distant node, find a local super-nodeat first. Then the super-node determines the network do-main of the destination and routes directly to that domain,which brings the shorter lookup time. A super-node is de-termined by the election algorithm between nodes or by thesystem administrator. Gateway routers or machines close tothe routers are attractive candidates for super-nodes. Bro-cade does not provide any specific algorithm to determinewhether the joining node is the super-node or the normalnode. [13] mentioned that Brocade uses a kind of electionalgorithm to decide the super-node in an ISP, but no specificalgorithm has been proposed. Neither does Brocade suggestany process to organize super-node’s cover set with normalnodes in an ISP. Grapes suggests a specific self-organizingalgorithm which constructs the hierarchical structure. InGrapes, any node can be a leader or sub-node dependingupon the order of node insertion, and the nodes constructthe hierarchical overlay network in an autonomous mannerwithout any support of central coordinator. This kind of self-organization makes Grapes more suitable for pure peer-to-peer concepts.
L. Garces-Erce et al. [14] provides a general frameworkfor a hierarchical DHT. The peers are organized into groups.A group may consist of the peers topologically close to eachother. Each group is required to have one or more superpeerswhich play the role of gateways between the groups. Thepeer looking for some data sends a query message to one ofits superpeers. Then the message is delivered to the groupthat stores the data by top-level lookup service. The super-peer of the group that stores the data, routes the query mes-sage to the peer that is responsible for the data with intra-group routing. In this system, the peer joining the networkmust know the identifier of the group that the peer belongsto. The identifier may be the name of the peer’s ISP or uni-versity campus. The peer looks up the group id in the peer-to-peer network, and the destination gives the IP address ofthe superpeer which the peer will join. In order to get well-constructed hierarchy, we think, this system needs the helpof a central coordinator. Without the help of a central coor-dinator, the peers having the same ISP name but physicallynot close enough to each other may join the same group (e.g.tier-1 ISP). Also, the group of the peers in a university cam-pus can be too small. Too small groups may downgradethe system performance like data lookup time. Grapes triesto make well-constructed hierarchy without any centralizedcontrol.
3. Design of Grapes
3.1 Node Insertion
Any new node joining Grapes must know the contact pointof at least one Grapes node, called the bootstrap node. When

SHIN et al.: A HIERARCHICAL OVERLAY FRAMEWORK FOR DHTS1653
Fig. 2 Node insertion example in Grapes.
a new node is inserted into Grapes, the new node checks itsphysical distance† to the bootstrap node. If the physical dis-tance is shorter than the given threshold, the new node isinserted into the sub-network of the bootstrap node. If thebootstrap node is the leader of the sub-network, the boot-strap node will be the leader of the new node. Otherwise,the bootstrap node notifies the new node of its leader. If thephysical distance between the new node and the bootstrapnode is longer than the threshold, the new node is insertedinto the super-network. The new node checks its physicaldistance to the leaders on the route†† in the super-network.If it finds the leader to which the physical distance is shorterthan the threshold, it is inserted into the sub-network of theleader. If there is no leader into which the new node isinserted on the route, the new node is inserted as a node(leader) into the super-network. In each layer of the over-lay network, any peer-to-peer lookup routing algorithm suchas CAN [5], Chord [6], Pastry [7], and Tapestry [8] can beused.
In Fig. 2, the new node A joins Grapes with the helpof the bootstrap node B. If the distance between A and B isshorter than the threshold, A is located in B’s sub-network(A1). Otherwise, A is not inserted into B’s sub-network, butto B’s super-network. A checks the physical distance to theleaders on the route in the super-network. In the figure, Ais not inserted into C (and D, E, F)’s sub-network becausethe distance between A and C (and D, E, F) is longer thanthe threshold. If the distance between A and G is shorterthan the threshold, A is inserted into G’s sub-network (A2).If there is no appropriate leader on the route, A is inserted asa leader into the super-network (A3).
3.2 Data Publication
When a node publishes data, it looks for the node managingthe hashed key of the data in its sub-network first. The nodeinserts the index of data into the node which manages thekey of the data, and then the node inserts the index into thesuper-network. The node, with the help of its leader, looksfor the leader managing the key in the super-network. If thedestination leader does not have its own sub-network, theindex is inserted into the destination leader. If the destina-tion leader has its sub-network, the node looks for the nodemanaging the key in the sub-network. In this case, finally,
Fig. 3 Data publication example in Grapes.
the index is inserted into the destination node in the sub-network. The index of the data is a kind of metadata, onecan get the list of the addresses of the data publication nodesfrom the index (The index can point to more than one datalocation when several nodes publish the same data). Datapublication node periodically re-publishes the data, whichrefreshes the index timer of the data or inserts the index ifthe new destination node does not have the index. Every in-dex has its own timer and when the timer expires the indexis invalidated and removed. This periodic data publicationmakes Grapes fault-tolerant in a dynamic peer-to-peer envi-ronment.
In Fig. 3, the node p is publishing the data into the net-work. Firstly, the node p looks for the node managing thekey of the data in its sub-network. In this example, the noded1 is managing the key of the data. The node p inserts the in-dex of data to the node d1 (the index points to the publishingnode p). And then the node p looks for the node managingthe key of the data in the super-network through its leader B.The lookup request is routed from B to G, and G forwardsthe request to its sub-network. Finally the node p becomesaware of the node d2, which is managing the key of the datain the super-network. The node p inserts the index to thenode d2 (this index also points to the publishing node p).
3.3 Data Retrieval
When a node retrieves data, it looks for the node managingthe hashed key of the data in its sub-network first. If thesub-network does not have the index of data, the node looksup its super-network with the help of the leader. After thenode retrieves the data from the target node to which theindex points, it publishes the retrieved data. That is, the newindex of data is inserted into both its sub-network and super-network. This data publication after the retrieval results in
†King [15], IDMaps [16], GNP [17] etc. suggested the latencyestimation method between the arbitrary Internet end hosts. Weassume that the physical distance can be obtained by any of thelatency estimation methods.††The route is determined by a peer-to-peer lookup routing al-
gorithm e.g. CAN [5], Chord [6], Pastry [7], and Tapestry [8].
1654IEICE TRANS. COMMUN., VOL.E90–B, NO.7 JULY 2007
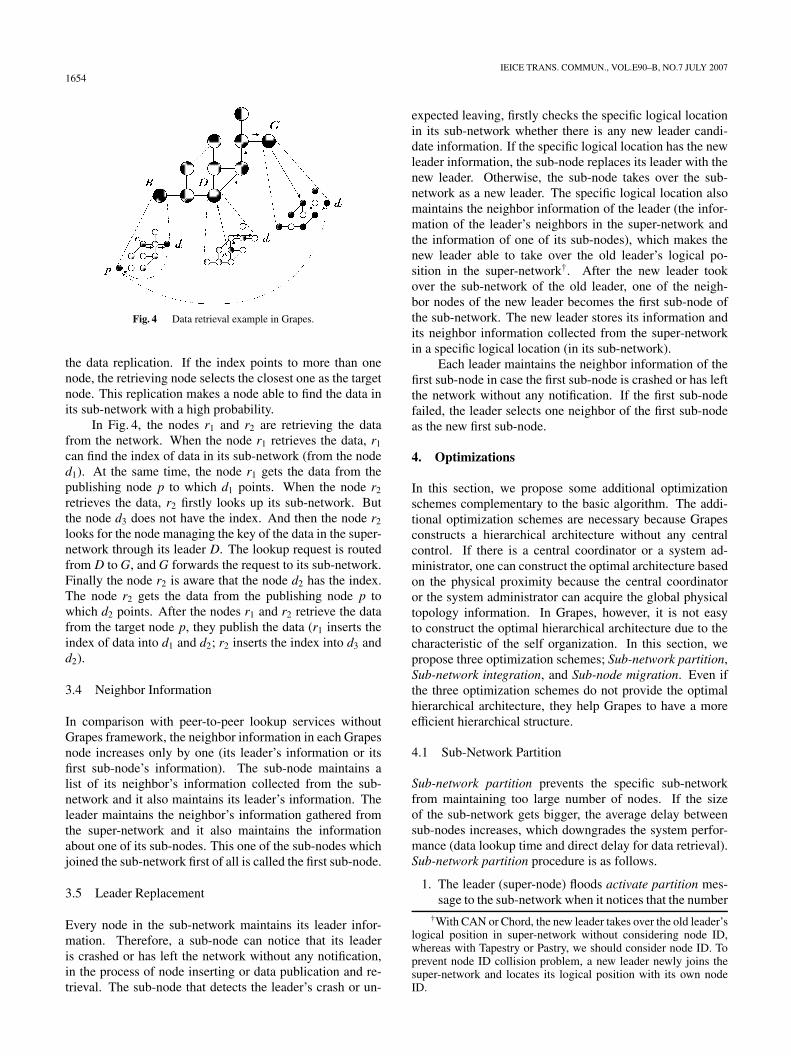
Fig. 4 Data retrieval example in Grapes.
the data replication. If the index points to more than onenode, the retrieving node selects the closest one as the targetnode. This replication makes a node able to find the data inits sub-network with a high probability.
In Fig. 4, the nodes r1 and r2 are retrieving the datafrom the network. When the node r1 retrieves the data, r1
can find the index of data in its sub-network (from the noded1). At the same time, the node r1 gets the data from thepublishing node p to which d1 points. When the node r2
retrieves the data, r2 firstly looks up its sub-network. Butthe node d3 does not have the index. And then the node r2
looks for the node managing the key of the data in the super-network through its leader D. The lookup request is routedfrom D to G, and G forwards the request to its sub-network.Finally the node r2 is aware that the node d2 has the index.The node r2 gets the data from the publishing node p towhich d2 points. After the nodes r1 and r2 retrieve the datafrom the target node p, they publish the data (r1 inserts theindex of data into d1 and d2; r2 inserts the index into d3 andd2).
3.4 Neighbor Information
In comparison with peer-to-peer lookup services withoutGrapes framework, the neighbor information in each Grapesnode increases only by one (its leader’s information or itsfirst sub-node’s information). The sub-node maintains alist of its neighbor’s information collected from the sub-network and it also maintains its leader’s information. Theleader maintains the neighbor’s information gathered fromthe super-network and it also maintains the informationabout one of its sub-nodes. This one of the sub-nodes whichjoined the sub-network first of all is called the first sub-node.
3.5 Leader Replacement
Every node in the sub-network maintains its leader infor-mation. Therefore, a sub-node can notice that its leaderis crashed or has left the network without any notification,in the process of node inserting or data publication and re-trieval. The sub-node that detects the leader’s crash or un-
expected leaving, firstly checks the specific logical locationin its sub-network whether there is any new leader candi-date information. If the specific logical location has the newleader information, the sub-node replaces its leader with thenew leader. Otherwise, the sub-node takes over the sub-network as a new leader. The specific logical location alsomaintains the neighbor information of the leader (the infor-mation of the leader’s neighbors in the super-network andthe information of one of its sub-nodes), which makes thenew leader able to take over the old leader’s logical po-sition in the super-network†. After the new leader tookover the sub-network of the old leader, one of the neigh-bor nodes of the new leader becomes the first sub-node ofthe sub-network. The new leader stores its information andits neighbor information collected from the super-networkin a specific logical location (in its sub-network).
Each leader maintains the neighbor information of thefirst sub-node in case the first sub-node is crashed or has leftthe network without any notification. If the first sub-nodefailed, the leader selects one neighbor of the first sub-nodeas the new first sub-node.
4. Optimizations
In this section, we propose some additional optimizationschemes complementary to the basic algorithm. The addi-tional optimization schemes are necessary because Grapesconstructs a hierarchical architecture without any centralcontrol. If there is a central coordinator or a system ad-ministrator, one can construct the optimal architecture basedon the physical proximity because the central coordinatoror the system administrator can acquire the global physicaltopology information. In Grapes, however, it is not easyto construct the optimal hierarchical architecture due to thecharacteristic of the self organization. In this section, wepropose three optimization schemes; Sub-network partition,Sub-network integration, and Sub-node migration. Even ifthe three optimization schemes do not provide the optimalhierarchical architecture, they help Grapes to have a moreefficient hierarchical structure.
4.1 Sub-Network Partition
Sub-network partition prevents the specific sub-networkfrom maintaining too large number of nodes. If the sizeof the sub-network gets bigger, the average delay betweensub-nodes increases, which downgrades the system perfor-mance (data lookup time and direct delay for data retrieval).Sub-network partition procedure is as follows.
1. The leader (super-node) floods activate partition mes-sage to the sub-network when it notices that the number†With CAN or Chord, the new leader takes over the old leader’s
logical position in super-network without considering node ID,whereas with Tapestry or Pastry, we should consider node ID. Toprevent node ID collision problem, a new leader newly joins thesuper-network and locates its logical position with its own nodeID.
SHIN et al.: A HIERARCHICAL OVERLAY FRAMEWORK FOR DHTS1655
of its sub-nodes is above the maximum limit†. The ac-tivate partition message has the address of the leaderand the new leader candidate node.
2. Receiving the activate partition message, each sub-node determines which node is its leader, the old leaderor the new leader candidate, depending upon its phys-ical distance between them. The sub-node chooses thecloser node between the old leader and the new leadercandidate as the leader.
4.2 Sub-Network Integration
Sub-network integration plans to organize better architec-ture by way of unifying two small sub-networks. Sub-network integration procedure is as follows.
1. If a node chances on the super-node to which the phys-ical distance is below the threshold in the process ofdata publication or retrieval, the node sends initiate in-tegration message to its leader††. Initiate integrationmessage has the address of the new near super-nodediscovered.
2. If the number of sub-nodes is below the minimumlimit†††, and also if the distance between the leader andthe new near super-node is below half the threshold, theleader checks whether the new near super-node can ac-cept integration by sending check integration message.
3. The new near super-node checks how many sub-nodesexist in its sub-network. If the summation of the num-ber of sub-nodes in two sub-networks is above the max-imum limit, sub-network integration process halts withreject integration message from the new near super-node.
4. If the new near super-node can accept integration, theleader which has smaller number of sub-nodes betweentwo sub-networks floods activate integration messageto its own sub-network. Activate integration messagehas the address of the corresponding super-node.
5. All the nodes (including the leader and the sub-nodes)in the smaller sub-network are inserted to the largersub-network with the help of the leader of the largersub-network as the bootstrap node.
4.3 Sub-Node Migration
Sub-node migration is the optimization scheme to makethe average delay between sub-nodes in the sub-networkshorter. Sub-node migration procedure is as follows.
1. If a node chances on the super-node to which the phys-ical distance is below half the distance to its leader inthe process of data publication or retrieval, the nodesends initiate migration message to its leader.
2. If the number of sub-nodes is not below the minimumlimit, the leader sends activate migration message tothe sub-node. If the number of sub-nodes is below theminimum limit, Sub-network integration step 2 begins.
3. The node is inserted to the new sub-network with thehelp of the new near super-node as the bootstrap node.
Algorithm 1–7 present the pseudo code of the abovethree optimization schemes. Algorithm 1–3 and Algorithm4–7 respectively describe the action of the sub-node and thesuper-node when the optimization process begins.
Algorithm 1Action of the sub-node on discovering the new near super-node to which distance is below the threshold T
dS ← the distance to the new near super-nodedL ← the distance to its leader
if dS >12 dL then
sends initiate integration message to its leader and waits the replyfrom the leaderif receiving activate integration message then
bootstrap node← the new near super-nodere-inserts itself to the network
end ifif receiving no action message then
RETURNend if
else{dS ≤ 1
2 dL}sends initiate migration message to its leader and waits the reply fromthe leaderif receiving activate migration or activate integration message then
bootstrap node← the new near super-nodere-inserts itself to the network
end ifif receiving no action message then
RETURNend if
end if
Algorithm 2Action of the sub-node on receiving activate integrationmessage from its leader
{its leader receives check integration message from another super-nodeS and its leader’s sub-network size is smaller than S’s}
bootstrap node← Sre-inserts itself to the network
†The maximum limit can be represented by f1(N). N is thenumber of the nodes in the entire system and f1 is the functionwhich the system can select. On the assumption that all the nodesare linked by predecessor and successor on the identifiers’ space, Ncan be estimated by 1/d(s, succ(s)) [18]. 1/d(s, succ(s)) is logicaldistance between the node s and the successor of s.††If a node chances on the super-node to which the distance
is also below half the distance to its leader, Sub-node migrationprocess is initiated.†††The minimum limit can be represented by f2(N). N is the
number of the nodes in the entire system and f2 is the functionwhich the system can select.

1656IEICE TRANS. COMMUN., VOL.E90–B, NO.7 JULY 2007
Algorithm 3Action of the sub-node on receiving activate partition mes-sage from its leader
{activate partition message has the address of its leader and the newleader candidate node}
dL ← the distance to its leaderdC ← the distance to the new leader candidate node
if dC < dL thenbootstrap node← the new leader candidate nodere-inserts itself to the network
else{dC ≥ dL}bootstrap node← its leaderre-inserts itself to the network
end if
Algorithm 4Action of the super-node on receiving check integrationmessage from another super-node S
{check integration message has the number of nodes in another super-node S’s sub-network}
nL ← the number of the nodes in its sub-networknA ← the number of nodes in S’s sub-network
if (nL + nA) > maximum limit thenreplies reject integration message to S
elsereplies accept integration message to Sif nL < nA then
floods activate integration message to its sub-networkend if
end if
Algorithm 5Action of the super-node on noticing the number of thenodes in its sub-network is above the maximum limit
floods activate partition message to its sub-network
5. Simulation
5.1 Methodology
We used Inet [16] topologies of 3,500 autonomous systems(AS) in our experiments. Among the 3,500 autonomous sys-tems, we randomly chose 500 ASs. We assumed the numberof nodes in each AS is 10,000, and the maximum percentageof nodes joining the system is 2% of the number of nodesin each AS, which makes the maximum number of join-ing nodes 100,000. We also assumed the delay between thenodes in the same AS to be 0. We selected the 2-dimensionalCAN algorithm as the peer-to-peer lookup algorithm in boththe sub-network and super-network (when we use Grapes).
Algorithm 6Action of the super-node on receiving initiate integrationmessage from one of its sub-nodes
{initiate integration message has the address of the new near super-node}
nL ← the number of the nodes in its sub-networkdLS ← the distance to the new near super-nodeT ← threshold
TO INTEGRATION:if nL ≥ minimum limit or dLS ≥ 1
2 T thenreplies no action message to its sub-node
else{nL < minimum limit and dLS <
12 T }
sends check integration message to the new near super-node and waitsthe reply from itif receiving accept integration message then{accept integration message has the number of the nodes in thenew near super-node’s sub-network}nS ← the number of the nodes in the new near super-node’s sub-networkif nL ≤ nS then
floods activate integration message to its sub-networkbootstrap node← the new near super-nodere-inserts itself to the network
else{nL > nS }replies no action message to its sub-node
end ifelse{receiving reject integration message}replies no action message to its sub-node
end ifend if
Algorithm 7Action of the super-node on receiving initiate migrationmessage from one of its sub-nodes
{initiate migration message has the address of the new near super-node}
nL ← the number of the nodes in its sub-networkif nL ≥ minimum limit then
replies active migration message to its sub-nodeelse
goto TO INTEGRATIONend if
5.2 Effects of Optimizations
To show the effects of optimization schemes, we use thesimulation parameters as presented in Table 1. In the sim-ulation, Sub-network integration or Sub-node migration isinitiated when each node chances on the super-node towhich the physical distance is below the threshold in theprocess of 10 data lookup per a node. We decided the max-imum limit to be the square root of the number of nodesjoining the system and the minimum limit to be the halfof the maximum limit. If 2-dimensional CAN is used asa lookup algorithm in both the super-network and the sub-network like our simulation environment, the summation of

SHIN et al.: A HIERARCHICAL OVERLAY FRAMEWORK FOR DHTS1657
Table 1 Simulation parameters (effects of optimizations).
Number of nodes 10,000
Maximum limit 100
Minimum limit 50
Threshold25,50,75,100,
125,150(ms)
Data lookup for optimizations 10 per 1 node
the average number of hops in the super-network and thesub-network is minimal when the number of sub-networksis√
N and the size of each sub-network is√
N (where Nis the number of nodes in the whole network). The simpleanalysis is as follows.
• y: the summation of the average number of hops in thesuper-network and the sub-network†
• x: the number of sub-networks• N: the number of nodes in the whole network
y =12
√N +
12
√Nx
(1)
y′ =14
x−12 − 1
4
√Nx−
32 (2)
When y′ = 0, x =√
N. Therefore, if x =√
N, y hasthe minimum value.
Based on the simple analysis above, we choose√
N asa heuristic basis to decide the maximum limit and the min-imum limit. We set the maximum limit and the minimumlimit to
√N and 1
2
√N respectively in the simulation.
Figure 5 and Fig. 6 show the effects of three optimiza-tion schemes; Sub-network partition, Sub-network integra-tion and Sub-node migration. Figure 5 presents the numberof leaders in the network over a range of thresholds. Theheuristic basis number of leaders in our simulation environ-ment is 100, the square root of the number of nodes thatjoined the system. The number of leaders in the optimizedGrapes is closer to the basis number than that in the basicGrapes. Figure 6 shows the average delay of each sub-nodeto its leader over a range of thresholds. The average delayin the optimized Grapes is about 30–70% of that in the basicGrapes over a range of thresholds. Figure 5 and Fig. 6 alsoshow the performance difference over the various thresh-olds. If the threshold is smaller, the average delay betweenthe sub-nodes and the leader is shorter but the number ofleaders is much larger than the basis number. If the thresh-old is larger, the number of leaders is closer to the basisnumber but the diameter of the sub-network is longer. Theoptimal threshold is determined by considering the trade-off between the number of leaders and the diameter of thesub-network. Also, the optimal threshold is concerned withthe physical internet topology below and how many nodesjoined the system in each AS among the total number ofnodes in the system. Therefore, it is almost impossible tofind the optimal value of the threshold. We are researchingon some heuristic, distributed and dynamic methods of set-ting the reasonable value of the threshold. In the following
Fig. 5 The effects of optimizations (1).
Fig. 6 The effects of optimizations (2).
Table 2 Simulation parameters (performance comparison).
Threshold 75(ms)
Kinds of data 1,000
Number of nodes10,000;40,000;
70,000;100,000
Number of data access per node 5
Data access patternUniform
Exponential
simulations, the threshold is set to the specific value, 75 ms.
5.3 Performance Comparison
To compare the performance, we use the simulation param-eters as presented in Table 2. We assumed that there were1,000 kinds of data and each node looked up the data 5times. The uniform data access pattern means the data ac-cess pattern follows the uniform distribution. The proba-bilities of accessing each piece of data are identical. Andthe exponential data access means the data access patternfollows the exponential distribution. The probability of ac-cessing a few popular data is high and the probability of
†The average routing path length in CAN is d4 n
1d [5]. d means
d-dimensional CAN and n equals the number of joining nodes.

1658IEICE TRANS. COMMUN., VOL.E90–B, NO.7 JULY 2007
Fig. 7 Data publication time.
accessing most of the unpopular data is low. Figure 7 showsdata publication time when an arbitrary node inserts dataindex into bare bones CAN†, CAN with PIS, Grapes, andoptimized Grapes. Grapes and optimized Grapes use barebones CAN as the peer-to-peer lookup algorithm in both thesub-network and super-network. In Grapes, the data indexis inserted into both the sub-network and the super-network.During the index insertion into the super-network, if the des-tination leader has its own sub-network, the index is insertedinto the sub-network of the leader. In the maximum case, thedata publication needs two sub-network path routings andone super-network path routing. Because the sub-networkis composed of the nodes near each other, the routing de-lay for each hop in the sub-network is very small. In thesuper-network, the average routing delay for each hop isthe same as the original CAN. However, the less number ofhops (in proportion to the number of leaders) makes the to-tal routing delay smaller. The data publication time dependson the index insertion path routing delay in the overlay net-work. The hierarchical structure with the physical informa-tion (the physically near sub-network and the super-networkwith the small number of routing hops) makes Grapes havethe smaller path routing delay than that of the original CAN.The figure presents the data publication time while the num-ber of nodes is increasing. In spite of inserting data in-dex twice, into the sub-network and super-network, the datapublication time in Grapes is shorter than that of the originalCAN and even that of CAN with PIS. The data publicationtime in optimized Grapes is the shortest of all.
Figure 8 shows the data lookup time when an arbitrarynode retrieves data from bare bones CAN, CAN with PIS,CAN with PRS, CAN with PIS and PRS, Grapes with barebones CAN and optimized Grapes with bare bones CAN.The data lookup time depends on the path routing delay andthe effects of data replication. Even if the node storing datais located in another sub-network, the total routing delay inGrapes is smaller than that of CAN without Grapes frame-work. Also, if the data is located in the same sub-network,the path routing delay is much shorter. The figure presentsthe data lookup time while the number of nodes is increas-ing. It shows that optimized Grapes with exponential dataaccess (OG-E) is the most scalable scheme with regard tothe network size. The data lookup time in optimized Grapes
Fig. 8 Data lookup time.
Fig. 9 Direct delay for data retrieval.
with exponential data access is one thirtieth of that of barebones CAN when the number of nodes is 100,000. Alsowe can find that Grapes with uniform data access (it has thelongest data lookup time among Grapes schemes) is morescalable than CAN with PIS and PRS.
Figure 9 shows the delay between the data retrievingnode and the data storing node in the physical network. Werefer this delay as direct delay. The direct delay depends onthe location of the data. Data replication in Grapes makesthe node enable to find the data in its own sub-network witha high probability. Therefore, the direct delay for data re-trieval in Grapes is smaller than that in CAN. The figurepresents the direct delay between two ends while the num-ber of nodes is increasing. The direct delay in both Grapesand optimized Grapes is decreasing as the number of nodesis increasing. The reason is as follows. While the numberof nodes is increasing in Grapes, the number of nodes inthe sub-network is also increasing, which makes the prob-ability of retrieval from the sub-network high (The numberof autonomous systems is fixed to 3,500 in the simulation).Also, we can find that the delay in CAN with PIS is longerthan that in bare bones CAN. CAN with PIS makes logicalneighbor physically closer. While the nodes that are physi-cally close to each other are clustered in a logical space, thedata is distributed in a random way. It makes the data stor-
†Bare bones CAN is CAN with no optimization scheme [5].

SHIN et al.: A HIERARCHICAL OVERLAY FRAMEWORK FOR DHTS1659
Fig. 10 Data lookup time with replication.
Fig. 11 Direct delay for data retrieval with replication.
ing node physically farther from the data lookup node. Sothe average delay between the two ends in CAN with PIS isa little bit longer than that in bare bones CAN.
Figure 10 and Fig. 11 present the data lookup time andthe direct delay for data retrieval with regard to the size ofdata replication. To show the effects of the data replication,we modified CAN. Modified CAN stores R replica at ran-dom nodes in the overlay network. When a node retrievesdata, the lookup process checks for each node on the route,whether or not the node has the replica of the data. If thereis a replica on the route, the node retrieves the data from thefirst midway node storing the replica. We configured CANwith PIS and used PRS routing in this simulation. PRS isto select, among the possible next hops, the one that is clos-est in the physical network. PRS routing makes data lookuptime shorter than the routing in selecting the random oneamong the possible next hops. CAN with PIS makes logi-cal neighbor physically close to each other. If we retrievedata from the first midway node which stores a replica onthe DHT route, we can expect the data lookup time and thedirect delay for data retrieval be shorter as the number ofreplicas increases. R replica in Grapes is to replicate the datain R sub-network which is randomly selected. The maxi-mum number of replicas in Grapes is the number of leaders(or sub-networks). When the Grapes node retrieves data, itlooks for the node managing the hashed key of the data inits sub-network first. If the sub-network does not have thedata, the node looks up its super-network with the help of
Table 3 Simulation parameters (communication overhead).
Threshold 75(ms)
Number of nodes(N)10,000;40,000;
70,000;100,000
Maximum limit√
NMinimum limit 1
2
√N
Data lookup for optimizations 10 per 1 node
the leader. After the node retrieves the data from the tar-get node, it replicates the data in its own sub-network. Inthis simulation, we turned off this replication operation inorder to prevent the total number of replicas from exceed-ing the simulation parameter value. In this simulation, thenumber of hosts is set to 10,000. Both optimized Grapesand CAN use uniform data access pattern which accessesall the data with the same frequency. The number of leadersin optimized Grapes is about 420, in this simulation. Themaximum number of replicas is limited by the number ofleaders in Grapes. Therefore, when the number of replicasis above 400 (450 and 500), the effects of the replication arerestricted by the number of leaders.
Figure 10 shows the data lookup time while the num-ber of replicas increases. The data lookup time in Grapes isabout one third of that in CAN when the number of replicasis 50 and about one ninth of that in CAN when the num-ber of replicas is 450. Figure 11 shows the direct delay fordata retrieval between the request node and the data stor-ing node while the number of replicas increases. When thenumber of replicas is 50, the average direct delay in bothGrapes and CAN is about 90 ms. However, the differencein the delay between Grapes and CAN increases with regardto the size of data replication. The maximum difference iswhen the number of replicas is 450. In Grapes, both thedata lookup time and the direct delay with the larger datareplication above 450 mean nothing. (We limited the max-imum number of replicas to the number of sub-networks.)However, those in CAN decrease as the number of replicasincreases over 450. Although the figures show the resultsbelow 500 data replicas, but we found a fact, through simu-lation, that for Grapes data lookup time and direct delay isvisible for around 450 replicas whereas for CAN a similardata lookup time and direct delay is visible for around 3,000and 3,500 replicas respectively. The 3,000 and 3,500 datareplicas are about one third of the number of total hosts inthe network, which is considerably a huge data replication.
5.4 Communication Overhead
While the performance of Grapes is superior to that ofthe original CAN, Grapes need additional communicationoverhead cost. To analyze the communication overhead ofGrapes, we use the simulation parameters as presented inTable 3. The threshold used for structuring the hierarchy ofGrapes is set to 75 ms. We took a look at the changes inthe communication overhead while the number of nodes isincreasing. The maximum limit used for the optimizationschemes is set to the square root of the number of nodes

1660IEICE TRANS. COMMUN., VOL.E90–B, NO.7 JULY 2007
Table 4 Communication overhead per a node.
Node RTT ActPart PartRoute InitInteg ChkInteg ActInteg IntRoute InitMig ActMig MigRoute
10,000 16.428 0.079 0.554 23.475 0.268 0.479 3.167 0.307 0.067 0.332
40,000 25.383 0.044 0.435 30.428 0.242 0.866 7.690 0.312 0.132 1.143
70,000 29.692 0.040 0.450 32.458 0.225 1.017 10.256 0.267 0.123 1.227
100,000 32.652 0.035 0.424 33.571 0.210 1.066 11.550 0.249 0.111 1.245
and the minimum limit is set to the half of the maximumlimit. Optimization process, especially Sub-network inte-gration and Sub-node migration, is initiated when each nodehappens to come in contact with a super-node where physi-cal distance is below the threshold in the process of 10 datalookup per node. In this part of simulation, we did not con-sider the node’s leave or failure. Additional communicationoverhead of the optimized Grapes is as follows. Table 4shows how many messages each node transmits while thenumber of nodes is increasing.
The new node inserted to Grapes checks its physicaldistance to the leaders on the route in the super-network.This needs the RTT check message, which the new nodesends to the leaders and the response message that the leadersends back. The frequency of the RTT check message isequal to that of the response message. RTT column in Ta-ble 4 shows the frequency of the RTT check message andthe response message per node while the number of nodesis increasing. When the number of the sub-nodes is abovethe maximum limit, the leader floods activate partition mes-sage to its sub-network. Each sub-node receiving the acti-vate partition message checks its physical distance to theleader candidate. The address of the new leader candidateis included in the activate partition message. The sub-nodechooses the closer node (between the old leader and the newleader candidate) as the leader, which partitions the sub-network. When all the sub-nodes check the physical dis-tance, the RTT check message and the response message istransmitted. The frequency of the activate partition messageis equal to that of the RTT check message and the responsemessage. ActPart column in Table 4 shows the frequency ofthe activate partition message, the RTT check message andthe response message. When the sub-network is partitioned,its sub-nodes are inserted either to old leader’s sub-networkor to new leader candidate’s sub-network. This additionalinsertion of sub-nodes produces a routing message overheadon the sub-network. PartRoute column in Table 4 shows thefrequency of the additional sub-network routing message.
If a sub-node happens to come in contact with a super-node to which the physical distance is below the threshold inthe process of data publication or retrieval, the node sendsan initiate integration message to its leader. If a sub-nodehappens to come in contact with a super-node to which thephysical distance is below half the distance to its leader, thenode sends an initiate migration message to its leader in-stead of initiate integration message. InitInteg and InitMigcolumn in Table 4 show the frequency of initiate integra-tion message and initiate migration message respectively.If the number of sub-nodes is small enough for an efficientintegration (below the minimum limit), and also if the dis-
Table 5 Total communication overhead.
Number of nodes Total message frequency per a node
10,000 62.010
40,000 92.388
70,000 105.752
100,000 114.045
tance between the leader and the new near super-node isconsiderably near (below half the threshold), the leader re-ceiving initiate integration message checks whether the newnear super-node can accept integration by sending check in-tegration message. The new near super-node checks howmany sub-nodes exist in its sub-network. If the summationof the number of sub-nodes in two sub-networks is belowthe maximum limit, the new near super-node sends acceptintegration message. Otherwise, the new near super-nodesends reject integration message. The frequency of checkintegration message is equal to that of the response mes-sage (accept/reject integration message). ChkInteg columnin Table 4 shows the frequency of check integration mes-sage and the response message. If the new near super-nodecan accept integration, the leader which has smaller num-ber of sub-nodes between two sub-networks floods activateintegration message to its own sub-network (ActInteg col-umn in Table 4). The sub-nodes receiving activate integra-tion message are inserted to the correspondent leader’s sub-network. This additional insertion of sub-nodes producesrouting message overhead on the sub-network (IntRoute col-umn in Table 4). If the number of sub-nodes is small enough(below the minimum limit), the leader receiving initiate mi-gration message tries to do Sub-network integration process.Otherwise, the leader sends activate migration message tothe sub-node (ActMig column in Table 4). The sub-nodereceiving activate migration message is inserted to the cor-respondent leader’s sub-network. This additional insertionof the sub-node produces routing message overhead on thesub-network (MigRoute column in Table 4).
Table 4 shows top three messages (RTT, InitInteg, andIntRoute) produce most of communication overhead (about96–97% of total communication overhead in Table 5). Thefrequency of these three messages per node is increasing asthe number of nodes is increasing. The degree of the in-crement, however, is decreasing. Table 5 presents the to-tal message frequency per node while the number of nodesis increasing. The total message frequency includes allkinds of overhead messages in Table 4 (especially the fre-quency of RTT which is added twice, ActPart three times,and ChkIteg twice). The frequency of the total messagesper node is increasing while the number of nodes is increas-ing. The degree of the increment, however, is decreasing.
SHIN et al.: A HIERARCHICAL OVERLAY FRAMEWORK FOR DHTS1661
If we assume the size of all the messages to be 50 bytes (IPheader −20 bytes, TCP header −20 bytes, and additional in-formation such as message identification tag and node ad-dress −10 bytes), total communication overhead is about5,700 bytes per node even when the number of nodes is100,000. The simulation time where each node executes 10data lookups is 1,000 seconds. The communication over-head each node produces is about 5.7 bytes per second (thatis 45.6 bps) when the number of nodes is 100,000.
6. Conclusion
In this paper, we proposed a proximity-based self-organizing hierarchical overlay framework for DHTs, calledGrapes. In Grapes, a node can find data in its sub-networkwith a high probability due to the data replication in itssub-network. In DHT systems, the replication is impor-tant to make up for the reliability problem due to the dy-namic characteristic of peer-to-peer network. Grapes sup-ports an efficient data replication considering the physicaltopology. Grapes also makes the lookup time smaller thanthat of the flat one due to the hierarchical structure usingthe physical information. There are some other schemesto provide hierarchical concepts for peer-to-peer networks.Grapes is different from those in a sense that it provides thespecific grouping algorithm without any centralized control.Grapes is the only unique topology-aware hierarchical over-lay network supporting the original peer-to-peer concept ofself-organization. Due to its self-organization characteristic,Grapes is not easy to make an optimal hierarchical struc-ture. To solve this problem, we proposed three optimiza-tion schemes; Sub-network partition, Sub-network integra-tion, and Sub-node migration. The optimization schemes donot provide an optimal architecture, but they help Grapes tohave a more efficient hierarchical structure.
Acknowledgments
This work was supported by the Korea Science and Engi-neering Foundation (KOSEF) through the Advanced Infor-mation Technology Research Center (AITrc) and UniversityIT Research Center Project.
References
[1] Gnutella, http://www.gnutella.com[2] Napster, http://www.napster.com/[3] S. Ratnasamy, S. Shenker, and I. Stoica, “Routing algorithms for
DHTs: Some open questions,” Proc. 1st International Workshop onPeer-to-Peer Systems (IPTPS’02), Cambridge, MA, March 2002.http://www.cs.rice.edu/Conferences/IPTPS02
[4] K. Shin, S. Lee, G. Lim, J. Ma, and H. Yoon, “Grapes: Topology-based hierarchical virtual network for peer-to-peer lookup services,”Proc. International Workshop on Ad Hoc Network, pp.159–166,Vancouver, B.C., Canada, Aug. 2002.
[5] S. Ratnasamy, P. Francis, M. Handley, R. Karp, and S. Shenker,“A scalable content-addressable network,” Proc. ACM SIGCOMM,pp.161–172, San Diego, CA, Aug. 2001.
[6] I. Stoica, R. Morris, D. Karger, M.F. Kaashoek, and H.
Balakrkshnan, “Chord: A scalable peer-to-peer lookup service forInternet applications,” Proc. ACM SIGCOMM, pp.149–160, SanDiego, CA, Aug. 2001.
[7] A. Rowstron and P. Druschel, “Pastry: Scalable, distributed objectlocation and routing for large-scale peer-to-peer systems,” Proc. 18thIFIP/ACM Int. Conf. Distributed Systems Platforms (Middleware2001), pp.329–350, Nov. 2001.
[8] B.Y. Zhao, J. Kubiatowicz, and A. Joseph, “Tapestry: An infrastruc-ture for fault-tolerant wide-area location and routing,” Comput. Sci.Div., Univ. California, Berkeley, Tech. Rep., UCB/CSD-01-1141,2001.
[9] S. Ratnasamy, M. Handley, R. Karp, and S. Shenker, “Topologicallyaware overlay construction and server selection,” Proc. IEEE INFO-COM Conference, pp.1190–1199, New York, NY, June 2002.
[10] K. Gummadi, R. Gummadi, S. Gribble, S. Ratnasamy, S. Shenker,and I. Stoica, “The impact of DHT routing geometry on resilienceand proximity,” Proc. ACM SIGCOMM, pp.381–394, Karlsruhe,Germany, Aug. 2003.
[11] F. Dabek, A cooperative file system, Master’s Thesis, MassachusettsInst. Technol., Cambridge, 2001.
[12] I. Stoica, R. Morris, D. Liben-Nowell, D.R. Karger, M.F. Kaashoek,F. Dabek, and H. Balakrishnan, “Chord: A scalable peer-to-peerlookup protocol for Internet applications,” IEEE/ACM Trans. Netw.,vol.11, no.1, pp.17–32, Feb. 2003.
[13] B.Y. Zhao, Y. Duan, L. Huang, A.D. Joseph, and J.D.Kubiatowicz, “Brocade: Landmark routing on overlay net-works,” Proc. 1st International Workshop on Peer-to-Peer Systems(IPTPS’02), Cambridge, MA, March 2002. http://www.cs.rice.edu/Conferences/IPTPS02
[14] L. Garces-Erce, E. Biersack, P. Felber, K.W. Ross, and G. Urvoy-Keller, “Hierarchical peer-to-peer systems,” Proc. ACM/IFIP Inter-national Conference on Parallel and Distributed Computing (Euro-Par), LNCS 2790, pp.1230–1239, Klagenfurt, Austria, 2003.
[15] K.P. Gummadi, S. Saroiu, and S.D. Gribble, “King: Estimating la-tency between arbitrary Internet end hosts,” Proc. SIGCOMM IMW2002, pp.5–18, Nov. 2002.
[16] P. Francis, S. Jamin, C. Jin, Y. Jin, D. Raz, Y. Shavitt, and L.Zhang, “IDMAPS: A global Internet host distance estimation ser-vice,” IEEE/ACM Trans. Netw., vol.9, no.5, pp.525–540, Oct. 2001.
[17] E. Ng and H. Zhang, “Predicting Internet network distance withcoordinates-based approaches,” Proc. IEEE INFOCOM Conference,pp.170–179, New York, NY, June 2002.
[18] D. Malkhi, M. Naor, and D. Ratajczak, “Viceroy: A scalable anddynamic emulation of the butterfly,” Proc. ACM Conf. on Principlesof Distributed Computing (PODC), pp.183–192, Monterey, CA, July2002.
[19] J. Winick and S. Jamin, “Inet-3.0: Internet topology generator,”Technical Report CSE-TR-456-02, University of Michigan, EECSDept., 2002.
[20] Z. Xu, M. Mahalingam, and M. Karlsson, “Turning heterogeneityinto an advantage in overlay routing,” Proc. IEEE INFOCOM Con-ference, pp.1499–1509, San Francisco, CA, April 2003.
[21] M. Castro, P. Druschel, Y.C. Hu, and A. Rowstron, “Exploitingnetwork proximity in distributed hash tables,” Proc. InternationalWorkshop on Future Directions in Distributed Computing (FuDiCo),pp.52–55, June 2002.
[22] M. Castro, P. Druschel, Y.C. Hu, and A. Rowstron, “Topology-awarerouting in structured peer-to-peer overlay networks,” Technical Re-port MSR-TR-2002-82, Microsoft Research, 2002.
[23] S. Ratnasamy, A scalable content-addressable network, Doctor’sDissertation, University of California at Berkeley, 2002.

1662IEICE TRANS. COMMUN., VOL.E90–B, NO.7 JULY 2007
Kwangwook Shin received the B.S. degreein computer science from the Sogang Univer-sity, Korea, in 1997, the M.S. degree in com-puter science from the Korea Advanced Instituteof Science and Technology (KAIST), in 1999.He is currently working toward the Ph.D. degreeat the Division of Computer Science, Depart-ment of Electrical Engineering and ComputerScience, KAIST. His research interests includemobile and wireless communications, mobile adhoc networks, and peer-to-peer networks.
Seunghak Lee received the B.S. degree andthe M.S. degree in computer science from theKAIST in 2000 and 2003 respectively. He iscurrently working toward the Ph.D. degree at theDivision of Computer Science, Department ofElectrical Engineering and Computer Science,KAIST. His research interests include wirelesssensor networks, mobile ad hoc networks, andpeer-to-peer networks.
Geunhwi Lim received the B.S. degree,the M.S. degree, and the Ph.D. degree in com-puter science from the KAIST in 1996, 1998,and 2003 respectively. He has been workingfor the Global Standard and Research team inSamsung Electronics since 2003. His researchinterests include wireless communications, mo-bile ad hoc networks, and peer-to-peer net-works.
Hyunsoo Yoon received the B.S. degree inelectronics engineering from the Seoul NationalUniversity, Korea, in 1979, the M.S. degree incomputer science from the KAIST, in 1981, andthe Ph.D. degree in computer and informationscience from the Ohio State University, Colum-bus, Ohio, in 1988. From 1988 to 1989, withthe AT&T Bell Labs. as a Member of TechnicalStaff. Since 1989 he has been a Faculty Mem-ber of the Division of Computer Science at theKAIST. His research interests include parallel
computer architecture, mobile communication, ad hoc networks, and in-formation security.


![RESEARCH DATA MANAGEMENT FILE ORGANIZATION · •Specific techniques for organizing your research data, ... Tips for managing a hierarchical system ... &-amp; * % $ £ ]](https://img.dokumen.tips/doc/110x75/5adce7fe7f8b9a1a088c9f05/research-data-management-file-organization-specific-techniques-for-organizing.jpg)