Embed Size (px)
Citation preview

A protocol for the delimitation of areas of endemism and thehistorical regionalization of the Brazilian Atlantic Rain Forest
using harvestmen distribution data
Marcio Bernardino DaSilvaa,*, Ricardo Pinto-da-Rochab andAdriano Medeiros DeSouzaa
aDepartamento de Sistem�atica e Ecologia, Centro de Ciencias Exatas e da Natureza – UFPB, Cidade Universit�aria, Jo~ao Pessoa, PB, Brazil;bDepartamento de Zoologia, Instituto de Biociencias – USP, Rua do Mat~ao, travessa 14, 321, S~ao Paulo, SP, Brazil
Accepted 27 March 2015
Abstract
The concept of areas of endemism (AoEs) has rarely been discussed in the literature, even though the use of methods to ascer-tain them has recently increased. We introduce a grid-based protocol for delimiting AoEs using alternative criteria for the recog-nition of AoEs that are empirically tested with harvestmen species distributions in the Atlantic Rain Forest. Our data,comprising 778 records of 123 species, were analysed using parsimony analysis of endemicity and endemicity analysis on fourdifferent grids (two cell sizes and two cell placements). Additionally, we employed six qualitative combined criteria for the delim-itation of AoEs and applied them to the results of the numerical analyses in a new protocol to objectively delimit AoEs. TwelveAoEs (the most detailed delimitation of the Atlantic Rain Forest so far) were delimited, partially corroborating the main divi-sions previously established in the literature. The results obtained with the grid-based methods were contradictory and were pla-gued by artefacts, probably due to the existence of different endemism patterns in one cell or to a biogeographical barrier setobliquely to latitudinal and longitudinal axes, for example. Consequently, the congruence patterns found by them should not beconsidered alone; qualitative characteristics of species and clade distributions and abiotic factors should be evaluated together.Mountain slopes are the main regions of endemism, and large river valleys are the main divisions. Refuges, marine transgres-sions and tectonic activity seem to have played an important role in the evolution of the Atlantic Rain Forest.© The Willi Hennig Society 2015.
Introduction
The search for distributional patterns, areas ofendemism (AoEs), and biogeographical classificationsinto regions or provinces are important aims that areintegral to biogeography. AoEs represent hypothesesabout the geographical units comprising (and definedby) endemic taxa (Crother and Murray, 2011) thathave originated after the establishment of barriersthat caused the isolation of the biota (Cracraft, 1985;Harold and Mooi, 1994; Linder, 2001; Morrone,2001a). They are hypotheses based on spatial congru-
ence among restricted species ranges (Cracraft, 1985;Platnick, 1991; Morrone, 1994; Linder, 2001; Carineet al., 2009) and are the basic units of any historicalbiogeographical study (Cracraft, 1985; Morrone andCrisci, 1995; Crother and Murray, 2011). As hypothe-ses, AoEs can be refuted by new distributional data,by additional taxa or by historical reconstructions ofthe processes that determined the disjunctions thatcreated them (Harold and Mooi, 1994; Morrone,2001a).Platnick (1991) and Morrone (1994) used the con-
gruent distributional limits of two or more species asthe main criterion for delimiting AoEs. However, realspecies ranges make it difficult to apply this criterion,as there is always incongruence in more detailed scales
*Corresponding author:E-mail address: [email protected]
CladisticsCladistics (2015) 1–14
10.1111/cla.12121
© The Willi Hennig Society 2015

of observation (Cracraft, 1985). Delimiting AoEs is acomplex task that involves the interpretation of par-tially overlapping species ranges and/or other kinds ofevidence (e.g. Axelius, 1991; Harold and Mooi, 1994;Crother and Murray, 2011). Among the latter are sis-ter-group relationships between species in adjacentAoEs or the geological/physiographical/ecologicalunity or limits of an area (Cracraft, 1985; Harold andMooi, 1994; Riddle, 1998).Many methods have been proposed and programs
have been written to delimit AoEs, but they have beenpoorly used with real data, except for parsimonyanalysis of endemicity – PAE (e.g. Hausdorf and Hen-nig, 2003; Szumik and Goloboff, 2004; dos Santoset al., 2008). Some authors have criticized the use ofareas and analyses of endemicity in historical biogeog-raphy and have proposed alternative approaches asmethods to search for barriers (e.g. Arias et al., 2011).Indeed, despite the great importance of AoEs in his-torical biogeography, their definition and the criteriato delimit them have not been sufficiently discussed inthe literature (Crother and Murray, 2011).The Atlantic Rain Forest of Brazil, even when com-
pared with the Amazon Forest, is a mega-diversebiome. Furthermore, more than 50% of the plant andanimal species in the former (Mittermeier et al., 2005),including 97.5% of the harvestmen species (Pinto-da-Rocha et al., 2005), are endemic. The Atlantic Forest,recognized as one of 34 hotspots for conservation, isalso one of the most endangered biomes in the world(Mittermeier et al., 2005). Despite the importance ofthis biome, few studies have focused on its biogeo-graphical history. Exceptions include some phylogeo-graphical accounts (e.g. Grazziotin et al., 2006;Martins et al., 2009; Thom�e et al., 2010) and studiesaiming to ascertain provinces and AoEs, some ofwhich do not discriminate them from purely ecologicaldivisions (e.g. Silva and Casteleti, 2005).The Atlantic Forest is currently divided into two to
six AoEs, depending on the taxa used to delimit them(M€uller, 1973; Prance, 1982; Cracraft, 1985; Soder-strom et al., 1988; Amorim and Pires, 1996; Costaet al., 2000; BirdLife International, 2003; Silva et al.,2004; see Supporting Information Table S1). Thosestudies suffer from a few problems; for instance, theyare insufficiently explained and sometimes use an inap-propriate methodology (e.g. using only one size ofgrid-cells or manual delimitation). However, they haveall employed the basic concept of congruence ofrestricted species ranges to delimit their AoEs.Most studies in the Atlantic Forest have delimited
three AoEs: one with its core in the state of Pernam-buco, a second with its core in the southern portion ofthe state of Bahia and a third associated with the Serrado Mar mountain range (Table S1). However, evenwhen the biogeographical divisions of the biome in
AoEs are congruent, the boundaries of AoEs may bequite different.The endemism patterns of the Atlantic Forest har-
vestmen species are more restricted than those of otherorganisms (Pinto-da-Rocha, 2002; Pinto-da-Rochaet al., 2005; DaSilva and Pinto-da-Rocha, 2011). Thishigh level of endemism is a function of some biologicalcharacteristics of the group, such as low vagility andhigh hygrophily (Pinto-da-Rocha et al., 2005). Pinto-da-Rocha et al. (2005) delimited 11 AoEs based onlyon the congruence of at least three endemic species.However, their study lacks a detailed description ofthe methodology they used.In this contribution, we propose a protocol for the
delimitation of AoEs using the distributions of har-vestmen species in the Atlantic Forest as a model. Ourprotocol employs qualitative combined criteria to ana-lyse data obtained by grid-based methods; therefore, itcontributes to the discussion of AoE concepts.
Material and methods
Species and records
We analysed 773 records of 123 harvestman species ofthe suborder Laniatores, which are endemic to theAtlantic Rain Forest and belong to the following recentlyreviewed taxonomic groups: gonyleptids in the subfamiliesCaelopyginae (Pinto-da-Rocha, 2002), Goniosomatinae(DaSilva and Gnaspini, 2009), Heteropachylinae(Mendes, 2011), Bourguyiinae (Yamaguti and Pinto-da-Rocha, 2009), Hernandariinae (DaSilva and Pinto-da-Rocha, 2010), Progonyleptoidellinae (Kury, 2003) andSodreaninae (Pinto-da-Rocha and Bragagnolo, 2011);Stygnidae genus Pickeliana (Hara and Pinto-da-Rocha,2008); Escadabiidae; Zalmoxidae; and Kimulidae (seespecies list in Supporting Information, Table S2). A. P.Gonz�alez and A. B. Kury (pers. commun.) studied theharvestmen of the last three named families. Taxarepresented by a single record (19 spp.) were not includedin the analysis. Two species were excluded because theydo not overlap with any other species (Fig. 1).Localities were compiled and reviewed from three
sources: literature data; labels from specimens depos-ited at the Museu de Zoologia (Universidade de S~aoPaulo), Museu Nacional (Universidade Federal do Riode Janeiro) and Instituto Butantan; and collecting dataobtained by the authors in 41 localities.
Numerical methods
Two numerical methods were employed using a mapdivided into cells. In PAE, the cells on the map weretreated as terminals (Morrone, 1994), and Nona 2.0 wasused to analyse the data (Goloboff, 1999). To perform
2 M. Bernardino DaSilva et al. / Cladistics (2015) 1–14

the endemicity analysis, a method described by Szumikand Goloboff (2004), we used NDM/VNDM (Golob-off, 2005). Cell sizes were set to 0.5° and 0.25° (bothmethods), and each was specified with two different ori-gins to form grids ranging from 6° to 30°300S and from34°300 to 55°300W (both methods), and from 6°120 to30°420S and from 34°420 to 55°420W (only NDM;Fig. 1). These grids will subsequently be referred to as00-origin and 120-origin grids, respectively.In NDM, we used the default factor F = 0.5, which
means that an occurrence outside the area, or a lackof records inside that, is worth half of an occurrencein the cell in the area; preliminary runs with other val-ues of F gave us similar results (data not shown). Touse only the raw data and to make as few assumptionsas possible about the distributions of species, weturned off ‘assumed presences’ or ‘edge proportion’(Goloboff, 2005). Furthermore, records obtained onthe borders of cells were used in only one cell permatrix to avoid duplication of records. In such cases,we employed the following criteria to assign a recordto a given cell: first, we gave preference to the cell thathad records of other species, or to the cell that wasclosest to the next nearest record of the species; if nei-
ther one of those two criteria was met, we chose thecell with more records of other species.
Qualitative analyses
We also employed six qualitative criteria to evaluatepatterns of endemism for harvestmen (Box 1; Fig. 2).They were compiled from the literature or are pro-posed herein based on our data.
Protocol for delimitation of AoEs (four steps)—relatingnumerical methods to the qualitative combined criteria:
Step 1: For delimitations using grid-based numericalmethods, different grid sizes and placements (originsin NDM) should be tested (Morrone and Escalante,2002; Deo and DeSalle, 2006).Step 2: In the NDM analysis, use consensusoptions. We used a strict consensus or tight consen-sus rule (Szumik et al., 2006; Aagesen et al., 2013)with a minimum number of shared species, i.e. dif-ferent sets of cells containing at least one species incommon were clustered (we used at least 5% ofsimilarity in species). This is conceptually based on
Fig. 1. All records and four grids used in the analyses: above left, 0.5°-cell grids; below right, 0.25°-cell grids, up and down 00-origin and 120-ori-gin grids, respectively, with cell numbers. Dark shading indicates moist coastal forest; light shading indicates interior forest.
M. Bernardino DaSilva et al. / Cladistics (2015) 1–14 3

criterion C5 cited in Box 1, which states that AoEsmust be mutually exclusive.Step 3: Begin area delimitation using the results ofthe grid with smaller cells that represent the CCs ofareas. Then, we delimited from more detailed to lessdetailed grids. The grid with larger cells results inthe following: (1) areas not found when using smal-ler cells, (2) sums of or contradictions with the setsof smaller cells (see criterion C3) or (3) artefactscaused by one cell covering different AoEs (see Dis-cussion). Next, delimit new areas with larger cells inthe first case (1) and consider the results of smallercells in two latter cases (2 and 3).Step 4: Once the results of the numerical analysesdelimit the CCs of AoEs (Box 1), the next step is toclassify all species analysed into one of the followinglevels of endemicity (criterion C2): (1) speciesrestricted to CCs, indicated by numerical methods;(2) species that occur only in one CC but whose dis-tributions are not sufficiently congruent (and there-fore not detected by numerical methods), forming anMRE; and (3) species distributed in more than one
CC (i.e. widespread). Species that do not occur inany CC should be removed from the analyses if notoverlapping with any other, or a new AoE can bedelimited if there are two or more range-restrictedspecies living in the same geographical unity (criteriaC5 and C6).
Results
Results of the numerical analyses
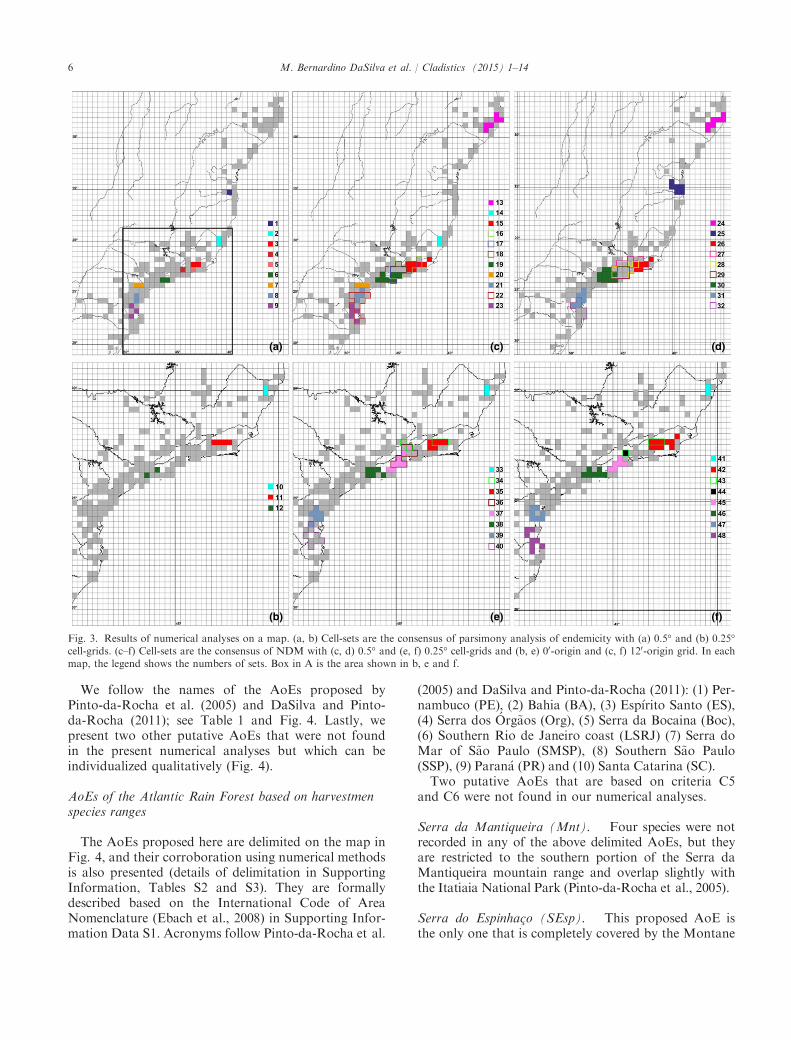
The consensus trees obtained with PAE resulted inthe following: (1) with the 0.5°-sized cells, nine sets ofcells with two or more unique species (Fig. 3a; Table S3,Fig. S1); (2) with the 0.25°-sized cells, only three setswith more than one exclusive species (Fig. 3b; Fig. S1).Both analyses resulted in one set nested within anotherlarger set: ((a23–33, a24–33)a21–34) (Fig. 3a; sets 3–4)and (a50–67, a49–67(a48–67, a47–67)) (Fig. 3b; set 11).NDM/VNDM resulted in 11 and nine consensus-sets
(from 23 and 17 original sets) using 0.5°-sized cells
Box 1
Qualitative combined criteria for delimitation of AoEs, with their corresponding literature references (Fig. 2).
(C1) Congruence of at least two species ranges (Platnick, 1991; Morrone, 1994; Linder, 2001; Carine et al.,2009). Referred to as ‘Congruence Core’ (CC, proposed here), this criterion is based on a considerable overlapof two species ranges. Complete overlap is not necessary as it is uncommon in distributional data. This sympatryis found by numerical methods such as PAE or NDM.(C2) ‘Maximum Region of Endemism’ (MREs, proposed here). Species ranges often overlap only partially
with the CCs. Partially overlapping species ranges may be due to the following: (1) widespread species (recordedin two or more cores), and (2) species that occur in only one core and outside of it but never inside the limits ofanother AoE core. In the latter case, species tend to have broader ranges than species restricted to a single core.Thus, the MRE is delimited around the CC with the extra range of every species that occurs only in this AoE.(C3) General congruence of widespread species ranges is not a criterion for the delimitation of AoEs; only
congruence of small ranges is evidence of an AoE (Deo and DeSalle, 2006). Deo and DeSalle (2006) proposedindices to distinguish endemism patterns from broader congruence patterns. Qualitatively, we can find wide-spread species, as defined above, when they occur in more than one CC. Thus, in a given scale of analysis, thecongruence of widespread species (i.e. including two or more smaller AoEs) should not be defined as an AoE.(C4) AoEs must be mutually exclusive (Linder, 2001; Crother and Murray, 2011). Because they are hypotheses
concerning the isolated evolution of a biota, AoEs cannot be delimited in a contradictory way. That is, twoAoEs cannot overlap or be identifiable by the same endemic species (Moline and Linder, 2006; Carine et al.,2009).(C5) AoEs can be recognized even when there is not enough congruence among species ranges, but endemic
species (outside any CC) are distributed near one another. Consequently, some species might not occur in anyCC but present some degree of overlap among themselves. If those species have their sister species in adjacentAoEs, they can be used as another piece of evidence for the delimitation of AoEs.(C6) Independent geographical evidence (Harold and Mooi, 1994; Riddle, 1998; Crother and Murray, 2011).
As a hypothesis of historical unity, we can use evidence other than species distributions such as topographic orphysiognomic data. For example, species endemic to the same topographical feature can delimit an AoE even ifthey do not overlap.
4 M. Bernardino DaSilva et al. / Cladistics (2015) 1–14

(Fig. 3c,d) and eight and seven consensus-sets using0.25°-sized cells (from 11 and 12 original sets; Fig. 3e,f)for both grid origins. Some consensus-sets overlappedwith each other; they more often overlapped with theanalyses of 0.5°-sized cells (Fig. 3c, sets 15–19 and 22overlap 21 and 23 in the 00-origin grid; and Fig. 3d, sets26–30 and 31–32 in the 120-origin grid). Analyses using0.25°-sized cells resulted in one pair of overlapping con-sensus sets (Fig. 3e; sets 34 and 35) and an overlappingof three sets (Fig. 3e; sets 34, 36 and 37), both with a00-origin grid. With the 120-origin grid, we recovered oneoverlapping set (Fig. 3f; set 43 with 42 and 44). All otherconsensus sets were disjunct and thus can be consideredputative AoEs.
Combining and interpreting the results
Following the protocol described above, we checkedthe results observing more detailed grid analyses(0.25°). We then delimited six putative CCs based onthe analysis of the 0.25°-sized cell grids with a 120-ori-gin grid, the results of the consensus from the NDManalysis (Fig. 3f; sets 41–42 and 45–48). We alsodelimited the set 44 with a single cell, which was foundmanually, as NDM only finds sets with two or morecells. Sets from the 00-origin grid are similar but over-lap more (i.e. more cells are included in different sets).Based on criterion C5, we considered only scenarioswith disjunct sets, as presented in the former analysis.For disputed sets, we considered the smaller set, as
indicated by criterion C3 (e.g. set 44 and 45 is pre-ferred to set 36, Fig. 3e,f). Three sets found with PAEwere congruent with three sets found with NDM(Fig. 3b; sets 10–12).We then searched the less detailed grid (0.5°) for sets
that were different from those already indicated above. Inthe 00-origin grid analysis, we delimited two new CCs inNDM (Fig. 3c; 13 and 20); one of them was also found byPAE (Fig. 3a; set 7). In the 120-origin grid analysis, wefound an additional set (Fig. 3d; set 25), and PAE foundthe same set (Fig. 3a; set 1). The other set found in the120-origin grid analysis is similar to one of the 00-origingrid analysis (Fig. 3c,d; set 24 = 13). PAE found one setwith a single cell that was not found by NDM (Fig. 3a; set4) because NDM only finds sets with two or more cells.Thus, all the numerical analyses combined recover
ten AoEs for harvestmen in the Atlantic Rain Forest(Fig. 4; Table 1) based on the CCs delimited by rangecongruence.Following step 4 of the protocol above, we classified
all species as restricted to ten CCs, discriminatingMREs based on species occurring in only one core butnot restricted to it (Table 1), and species not includedin cases above.In summary, ten AoEs are based on the following sets
(Fig. 3; north–south): (area 1) 13 = 24; (2) 1 = 25;(3) 2 = 10 = 14 = 33 = 41; (4) 3 + 5 = 11 = 15 = 26 =35 = 42; (5) 4 = 44; (6) 37 = 45; (7) 6 = 12 = 19 = 30 =38 = 46; (8) 7 = 20; (9) 8 = 21 = 31 = 39 = 47; (10)9 = 23 = 32 = 40 = 48.
(a) (b) (c)
(d) (e) (f)
Fig. 2. Hypothethical examples of the use of qualitative combined criteria. (a) Criterion C1 allows the delimitation of a Congruence Core (CC,solid line) based on three species (white circle, white star and black square). (b) Criterion C2 allows the delimitation of a Maximum Region ofEndemism (dashed line) based on a species occurring in a CC but not occurring in any other (black circle). (c) Criterion C3 would avoid a delim-itation of an AoE by congruence range of widespread species (white sun and white pentagon). (d) Criterion C4 would avoid overlapping CCs, asthey must be mutually exclusive (one of them could be delimited by white sun and white pentagon species). (e) Criterion C5 indicates that twoendemic species (white sun and white pentagon) may be evidence of another AoE, even with poor range congruence. (f) Criterion C6 corroboratesthis new AoE shown in (e), because it is on the other side of a large river and a mountain range (grey lines) of the same topographical unit.
M. Bernardino DaSilva et al. / Cladistics (2015) 1–14 5
We follow the names of the AoEs proposed byPinto-da-Rocha et al. (2005) and DaSilva and Pinto-da-Rocha (2011); see Table 1 and Fig. 4. Lastly, wepresent two other putative AoEs that were not foundin the present numerical analyses but which can beindividualized qualitatively (Fig. 4).
AoEs of the Atlantic Rain Forest based on harvestmenspecies ranges
The AoEs proposed here are delimited on the map inFig. 4, and their corroboration using numerical methodsis also presented (details of delimitation in SupportingInformation, Tables S2 and S3). They are formallydescribed based on the International Code of AreaNomenclature (Ebach et al., 2008) in Supporting Infor-mation Data S1. Acronyms follow Pinto-da-Rocha et al.
(2005) and DaSilva and Pinto-da-Rocha (2011): (1) Per-nambuco (PE), (2) Bahia (BA), (3) Esp�ırito Santo (ES),(4) Serra dos �Org~aos (Org), (5) Serra da Bocaina (Boc),(6) Southern Rio de Janeiro coast (LSRJ) (7) Serra doMar of S~ao Paulo (SMSP), (8) Southern S~ao Paulo(SSP), (9) Paran�a (PR) and (10) Santa Catarina (SC).Two putative AoEs that are based on criteria C5
and C6 were not found in our numerical analyses.
Serra da Mantiqueira (Mnt). Four species were notrecorded in any of the above delimited AoEs, but theyare restricted to the southern portion of the Serra daMantiqueira mountain range and overlap slightly withthe Itatiaia National Park (Pinto-da-Rocha et al., 2005).
Serra do Espinhac�o (SEsp). This proposed AoE isthe only one that is completely covered by the Montane
(a) (c) (d)
(b) (e) (f)
Fig. 3. Results of numerical analyses on a map. (a, b) Cell-sets are the consensus of parsimony analysis of endemicity with (a) 0.5° and (b) 0.25°cell-grids. (c–f) Cell-sets are the consensus of NDM with (c, d) 0.5° and (e, f) 0.25° cell-grids and (b, e) 00-origin and (c, f) 120-origin grid. In eachmap, the legend shows the numbers of sets. Box in A is the area shown in b, e and f.
6 M. Bernardino DaSilva et al. / Cladistics (2015) 1–14
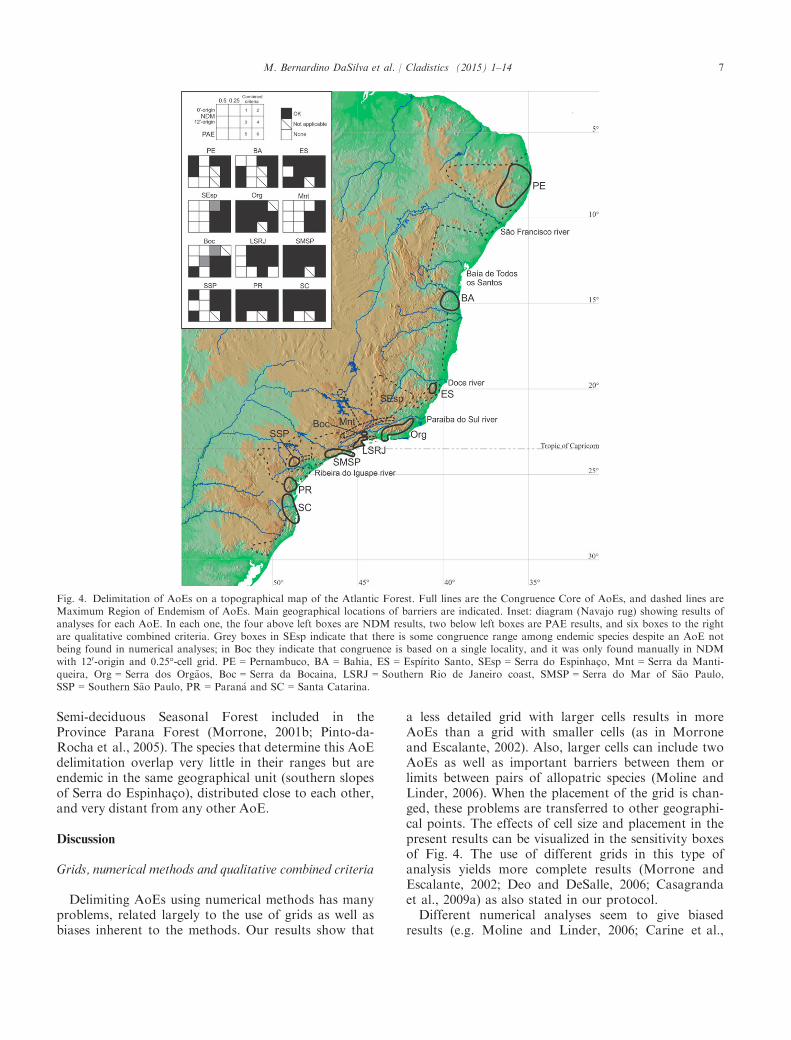
Semi-deciduous Seasonal Forest included in theProvince Parana Forest (Morrone, 2001b; Pinto-da-Rocha et al., 2005). The species that determine this AoEdelimitation overlap very little in their ranges but areendemic in the same geographical unit (southern slopesof Serra do Espinhac�o), distributed close to each other,and very distant from any other AoE.
Discussion
Grids, numerical methods and qualitative combined criteria
Delimiting AoEs using numerical methods has manyproblems, related largely to the use of grids as well asbiases inherent to the methods. Our results show that
a less detailed grid with larger cells results in moreAoEs than a grid with smaller cells (as in Morroneand Escalante, 2002). Also, larger cells can include twoAoEs as well as important barriers between them orlimits between pairs of allopatric species (Moline andLinder, 2006). When the placement of the grid is chan-ged, these problems are transferred to other geographi-cal points. The effects of cell size and placement in thepresent results can be visualized in the sensitivity boxesof Fig. 4. The use of different grids in this type ofanalysis yields more complete results (Morrone andEscalante, 2002; Deo and DeSalle, 2006; Casagrandaet al., 2009a) as also stated in our protocol.Different numerical analyses seem to give biased
results (e.g. Moline and Linder, 2006; Carine et al.,
Fig. 4. Delimitation of AoEs on a topographical map of the Atlantic Forest. Full lines are the Congruence Core of AoEs, and dashed lines areMaximum Region of Endemism of AoEs. Main geographical locations of barriers are indicated. Inset: diagram (Navajo rug) showing results ofanalyses for each AoE. In each one, the four above left boxes are NDM results, two below left boxes are PAE results, and six boxes to the rightare qualitative combined criteria. Grey boxes in SEsp indicate that there is some congruence range among endemic species despite an AoE notbeing found in numerical analyses; in Boc they indicate that congruence is based on a single locality, and it was only found manually in NDMwith 120-origin and 0.25°-cell grid. PE = Pernambuco, BA = Bahia, ES = Esp�ırito Santo, SEsp = Serra do Espinhac�o, Mnt = Serra da Manti-queira, Org = Serra dos Org~aos, Boc = Serra da Bocaina, LSRJ = Southern Rio de Janeiro coast, SMSP = Serra do Mar of S~ao Paulo,SSP = Southern S~ao Paulo, PR = Paran�a and SC = Santa Catarina.
M. Bernardino DaSilva et al. / Cladistics (2015) 1–14 7

2009) and neglect certain characteristics of a givenAoE (e.g. Harold and Mooi, 1994; Crother and Mur-ray, 2011). Thus, we listed six criteria to obtain themost likely AoEs as the smallest natural, spatial–his-torical hypotheses of biotic isolation. Delimiting CCsand MREs as well as classifying species ranges intothree levels of endemicity (criterion C2) allows the cor-rect definition of the limits of AoEs and the resolutionof partial sympatry patterns; this raises questionsabout the identity and limits of AoEs defined only bycongruence (Hausdorf, 2002; Carine et al., 2009).Thus, by using criterion C2, the delimitation hypothe-sis gives explanatory power for all species analysed(not just the endemic and congruent species), some-thing a numerical method cannot do.MREs can be interpreted as hypotheses of events,
such as dispersal or biological expansions after isola-tion (ontological interpretation) or as an indicationthat AoE delimitations can be falsified (methodologicalinterpretation), mainly, when MREs resulted frominsufficient data. Such regions have an importantimplication to do with the gradient of environmentalchanges between AoEs or transition zones (e.g. Per-nambuco–Bahia or from some AoEs to the interior ofthe continent). A criticism of the AoE framework ofcommon range patterns is that congruence in speciesranges can be a result of collecting biases (e.g. moreheavily sampled locations would tend to correspond tothe core of AoEs). Comparing our data with those ofPinto-da-Rocha et al. (2005), we found that of the 26well-sampled locations of the Atlantic Rain Forest,eight are very species-rich and are delimited as MREsin the present study. They probably comprise speciesfrom different historical origins (or a transitionbetween AoEs).
Regional differences in the sampling effort, easilyillustrated based on the density of points on the map,could influence the results of AoEs (Casagranda et al.,2009b). A well-sampled region would tend to result inmore AoEs, as very sparse species records would notbe sensitive to numerical analyses (Casagranda et al.,2009b). Ferrari et al. (2010), for example, showed thatno area was delimited in poorly sampled regions oftheir data, which was different from our findings. Onthe other hand, critics might argue that a well-sampledregion with uniformly distributed points could com-plete a pattern of gradual substitution, for example,resulting in fewer areas. It could further demonstratethat AoEs are artefacts of well-sampled regions sepa-rated by poorly sampled ones, as discussed in the par-agraph above. This problem was minimized here byusing grids of different cell size that resulted in differ-ent areas in each treatment: larger cells found areas inthe poorly sampled north-east (Pernambuco and Bahi-a), and small cells were more sensitive to the well-sam-pled south-east region (other areas). We are confidentabout the likelihood of these patterns, as most harvest-men species have wider ranges in the north-east. Morespecific empirical studies are needed to address thisimportant issue.It is a common result of NDM to find sets that
include two or more AoEs encompassing one largearea, as in our results (Moline and Linder, 2006; Car-ine et al., 2009; Casagranda et al., 2012; Aagesenet al., 2013). In such cases, it is important to use theconsensus option (step 2 of the protocol) in NDM(Aagesen et al., 2013). Furthermore, criterion C4 statesthat two AoEs cannot overlap or be nested within atop hierarchy at a given scale of the analysis, as AoEsare the result of geographical isolation. Thus, steps 3
Table 1The number of harvestman species restricted to Congruence Core (CC), Maximum Region of Endemism (MRE) and widespread, cell-sets result-ing from numerical analyses as shown in Fig. 3, and number of published studies mentioning each AoE
AoE CC MRE Endemic Widespread Literature citations Sets of numerical analyses (Fig. 4)
PE 7 4 11 0 7 13, 24BA 3 7 10 0 4 1, 25ES 2 2 4 1 1 2, 10, 14, 33, 41SEsp 0 6 6 3 0 –Mnt 0 4 4 11 0 –Org 14 0 14 11 * 3, 5, 11, 15, 26, 34, 42Boc 3 0 3 11 * 4, 44LSRJ 2 2 4 12 4 37,45SMSP 11 4 15 12 * 6, 12, 19, 30, 38, 46SSP 2 1 3 8 * 7, 20PR 4 5 9 11 * 8, 21, 31, 39, 47SC 4 5 9 5 * 9, 23, 32, 40, 48Total 52 40 92 31
PE = Pernambuco, BA = Bahia, ES = Esp�ırito Santo, SEsp = Serra do Espinhac�o, Mnt = Serra da Mantiqueira, Org = Serra dos Org~aos,Boc = Serra da Bocaina, LSRJ = Southern Rio de Janeiro coast, SMSP = Serra do Mar of S~ao Paulo, SSP = Southern S~ao Paulo, PR = Paran�aand SC = Santa Catarina.
*These AoEs are cited in four studies as a single AE.
8 M. Bernardino DaSilva et al. / Cladistics (2015) 1–14
and 4 of our protocol indicate how AoEs can beobjectively chosen among results with a large numberof overlapping and nested cell-sets. A hierarchy of lev-els of endemism has to be treated as a hypothesis ofrelationships of AoEs (Porzecanski and Cracraft,2005) and can be used in the regionalization of prov-inces, regions and realms (e.g. Morrone, 2001b). Thus,such ‘wide congruence’ can result from many biogeo-graphical phenomena such as dispersal after isolationor lack of response to isolating events.The criteria of exclusivity of patterns (C4 and C5)
and independent geographical evidence (C6) wereapplied to delimit the putative AoEs Serra da Man-tiqueira and Serra do Espinhac�o (and, to some degree,Serra da Bocaina), which had not been found by anynumerical analyses.In conclusion, results obtained with numerical meth-
ods should not be directly interpreted as AoEs.Because they are simply a guide for further analysisusing objective criteria such as qualitative combinedcriteria based on the various concepts of AoEs, theunits found with numerical methods such as NDMshould be fine-tuned by eliminating overlapping andunstable sets as well as noise.
Areas of endemism in the Atlantic Rain Forest
Of the 12 AoEs delimited here, only two held forother groups of organisms with similar boundaries:Pernambuco and Bahia (Table 1). Esp�ırito Santo wasfound in only one other publication (NRJ of Amorimand Pires, 1996). The other nine were ‘subdivisions’ ofthe large south-eastern area of the Atlantic Rain For-est that were considered to be a single AoE by severalprevious studies (e.g. Serra do Mar; Table 1) (seebelow).Some characteristics of harvestmen biology in the
Atlantic Rain Forest may have contributed to themreaching their present degree of isolation and diversifi-cation, such as hygrophily (due to a propensity forrapid dehydration) and low vagility (Santos, 2007).These characteristics restrict most harvestmen to veryhumid habitats, which are generally found in moremature and less anthropically disturbed forests (Bra-gagnolo et al., 2007). Some researchers have shownthat harvestmen in the Atlantic Rain Forest are highlyphilopatric (Machado et al., 2000; Mestre and Pinto-da-Rocha, 2004; Willemart and Gnaspini, 2004). Thus,anything separating forested areas such as tectonicevents, rivers, glaciation or open vegetation can splitharvestmen populations.
Main events that created AoEs
We identified three kinds of possible barriersbetween AoEs (Fig. 4): large rivers reaching the Atlan-
tic Ocean such as the S~ao Francisco (Pernambuco–Bahia), Doce (Bahia–Esp�ırito Santo), Para�ıba do Sul(Esp�ırito Santo–Serra dos �Org~aos; Serra da Bocaina–Serra da Mantiqueira, Serra dos �Org~aos–Serra do Esp-inhac�o) and Ribeira do Iguape (Paran�a–Southern S~aoPaulo); the tops of mountain ranges (Southern Rio deJaneiro coast–Serra da Bocaina); and disruptions in thephysiognomy of the forest as found around the Para-�ıba do Sul River where there is xeromorphic vegeta-tion (Joly et al., 1999; Espirito Santo–Serra dos�Org~aos) and around the S~ao Francisco River wherethe Cerrado reaches the coast (IBGE, 1983; Pernam-buco–Bahia).In the remaining AoE boundaries, there are no
longer clear barriers (Paran�a–Santa Catarina; SouthernS~ao Paulo–Serra do Mar of S~ao Paulo; Serra do Marof S~ao Paulo–Southern Rio de Janeiro coast; SouthernRio de Janeiro coast–Serra dos �Org~aos; Serra daMantiqueira–Serra do Espinhac�o); this suggests that weshould look for past separation events.The Doce River was identified as a barrier by many
previous studies, based on historical biogeographical(Amorim and Pires, 1996; Silva et al., 2012) andphylogeographical research (Pellegrino et al., 2005;Cabanne et al., 2007; Thom�e et al., 2010; D’Hortaet al., 2011), and was interpreted as the cause of sepa-ration among AoEs (M€uller, 1973; Prance, 1982; Silvaet al., 2004; Goldani et al., 2006). The Para�ıba do SulRiver was recognized as a barrier by Amorim andPires (1996) and Pellegrino et al. (2005). Large riversare obvious barriers, but two other types of pastevents may also be possible causes of separations: mar-ine transgressions and tectonic activity. Marine trans-gressions resulted from Neogene climatic fluctuationsduring interglacial periods, and records of transgres-sions can reach 20 m above present sea level in Brazilsince at least the early Pleistocene (Suguio et al.,2005). As rivers drained into wide valleys with lacus-trine systems and marine sedimentation is noted hun-dreds of kilometres from the coast, transgressions havethe potential to greatly affect forest biota. It is possiblethat transgressions influenced the colonization of thePara�ıba do Sul and S~ao Francisco valleys by open veg-etation, replacing previously forested areas. Tectonicactivity has occurred in these rifts since the Oligocenein the case of the Para�ıba do Sul River and has beenrecorded since the early Quaternary for at least theDoce River (Almeida and Carneiro, 1998; Saadi et al.,2005).The wide valley of the S~ao Francisco River near the
coast is covered by Cerrado vegetation that extendssouth into the Todos os Santos Bay (IBGE, 1983).Based on our results, the MRE of Pernambuco alsoreaches this bay; we thus hypothesize that the transi-tion in physiognomy is a more important barrier thanthe river. Todos os Santos Bay and the Paraguac��u
M. Bernardino DaSilva et al. / Cladistics (2015) 1–14 9

River that flows into it were considered as a bioticdivision by previous authors (M€uller, 1973; Amorimand Pires, 1996; Pellegrino et al., 2005; Silva et al.,2012).Between the Southern Rio de Janeiro coast and Serra
da Bocaina, the top of the front scarp of the Serra daBocaina plateau has open vegetation known as ‘rockyfields’ that separates the slope forest from the plateauforest. Here the topography is directly responsible forthe isolation. In the limits of other AoEs, however, therole of mountainous terrain in the disjunction of theforest biota is indirect.The origins of mountain ranges east of the Brazilian
Platform are connected with tectonic activity thatstarted in the Palaeocene and uplifted the previouslysubmerged continental platform adjacent to the Santosbasin (Almeida and Carneiro, 1998). Similar move-ments occurred through the Cenozoic and formed the‘Continental Rift System of the Serra do Mar’, whichcaused the parallel faults of the mountain ranges andopened the Rio Para�ıba do Sul Valley and the presentrough terrain (Almeida and Carneiro, 1998; Saadiet al., 2005). The Para�ıba do Sul Valley separated theSerra da Mantiqueira from the Serra do Mar, Serrada Bocaina and Serra dos �Org~aos mountain ranges.Other evidence for tectonism comes from taphrogenicbasins such as the Guanabara Bay, Angra dos ReisBay, Curitiba basin, S~ao Paulo basin (Almeida andCarneiro, 1998; Saadi et al., 2005) or even Todos osSantos Bay.These tectonic events could have affected the forest
biota during catastrophic uplift events by separatingsome AoEs. Or they could have affected forest biotawith the rough terrain causing a reduction in forestcoverage on the top of mountain ranges and on widevalleys where less orographic rain occurs, as in thePara�ıba do Sul and S~ao Francisco rivers.Given the available evidence that the present terrain is
responsible for different physiognomies and the inter-ruption of present-day forests, climatic fluctuations dur-ing the Neogene probably affected species ranges.Geological, geomorphological, palaeoclimatological,palaeopalynological and biogeographical evidencepoints to climatic fluctuations affecting tropical SouthAmerica, with moist and warm periods alternating withdry and cold periods (e.g. Haffer, 1987; Saia et al.,2008), a reduction of forested areas and an expansion ofsavannahs more recently (e.g. Ledru et al., 2005).Despite several criticisms of the ‘Refuge Model’ as anexplanation for the high diversity of the Amazon (e.g.Collinvaux et al., 2000), the hypothesis that forest phys-iognomies were greatly reduced during drier periods hasfound strong support. Carnaval and Moritz (2008)inferred the locations of refuges during the Last GlacialMaximum (LGM, 21 000 years ago) based on distribu-
tion modelling of the Atlantic Rain Forest biome andfound at least two large refuges that are congruent withthe following AoEs: Pernambuco and Bahia. Thom�eet al. (2010) modelled the distribution of Rhinella spp.(Anura) in an LGM biome and found the ‘Pernambucorefuge’ and other refuges in the south-eastern region(larger than the AoEs found in the present). Somephylogeographical studies have also revealed demo-graphic expansions in the Late Pleistocene that are con-gruent with a refuge model for the Atlantic Rain Forest(Martins et al., 2009; Thom�e et al., 2010; D’Hortaet al., 2011). These recent expansions resulted in MREsin our data (see discussion above). Another importantissue is that climatic fluctuations should have generatedmore complex physiognomic scenarios in South Amer-ica with asymmetry and asynchrony among differentareas as evidence of moist and cold periods in the north-east (Oliveira et al., 1999).Atlantic Rain Forest refuges are most likely to be
located on mountain range slopes where forests weremaintained by orographic rainfall (Haffer, 1987). Widevalleys, regions with marine sediments, tops of moun-tains and rain shadow regions are most likely to haveexperienced a reduction in forest coverage. Thus, mostboundaries of our AoEs (Paran�a–Santa Catarina;Southern S~ao Paulo–Serra do Mar de S~ao Paulo; Serrado Mar de S~ao Paulo –Southern Rio de Janeiro coast;Southern Rio de Janeiro coast–Serra dos �Org~aos; Serrada Mantiqueira–Serra do Espinhac�o) correlate with areduction in forest coverage, as the CCs of these AoEsare on slopes of mountain ranges.We have used harvestmen phylogenetic hypotheses
to historically relate these AoEs (DaSilva and Pinto-da-Rocha, 2011). These hypotheses suggest that thosemain divisions (oldest at the subfamily level) are theDoce River and near the southern portion of the stateof S~ao Paulo. Secondary divisions are the Para�ıba doSul River and Todos os Santos Bay. The divisions ofsouthern S~ao Paulo were also found by phylogeo-graphical (Grazziotin et al., 2006; Batalha-Filho et al.,2010) and panbiogeographical (Silva et al., 2012) stud-ies. There is evidence of tectonic events in this regionsince the Tertiary, with opening of the Ribeira do Igu-ape valley, which changed the structure of the Serrado Mar range (Suguio et al., 2005).The divergence times of different harvestmen taxa of
the Atlantic Rain Forest have not yet been provided.However, the divergence time of harvestmen sister spe-cies of the genus Promitobates (Gonyleptidae) hasrecently been estimated as 5–11 Myr based on a strictmolecular clock model (Bragagnolo, Clouse & Pinto-da-Rocha, unpublished data). This estimate wouldminimize the role of Pleistocene refuges in causing spe-ciation, but older and deeper climatic cooling duringthe Tertiary (e.g. Holbourn et al., 2013) could have
10 M. Bernardino DaSilva et al. / Cladistics (2015) 1–14

influenced it. Thus, our data are limited in pinpointingputative causal variables and the relative roles ofclimatic and geological events as drivers of biotic isola-tion. On the other hand, our inferences are veryimportant as spatial indicators of main regions of bothconvergent disjunctions and stability for evolution ofendemic species. Another limitation of our inferencesis that congruence could be overestimated by an ‘areasof endemism/vicariance biogeography view’, whichcould alternatively be attributable to independent spe-ciation cycles occurring at different time scales andcould subsequently be interpreted as false congruencies(Donoghue & Moore, 2003), or even as ecologicalcommunity assemblages or spatial turnovers of speciesin latitudinal, physiognomic and altitudinal gradients(e.g. Riddle, 1998; Di Virgilio et al., 2013).However, the last speciation events may be too
recent to be directly related to the tectonic events thatuplifted the mountains. The oldest speciation eventsare probably associated with tectonic events or marinetransgressions in valleys and the more recent divisionswith Neogene refuges. An integrated explanation isneeded to address the forms of diversification of theAtlantic Rain Forest biota or any continental biota.The role played by Tertiary tectonics in the separationof species can be felt millions of years later in therough geomorphology of the Atlantic Rain Forest.Tectonics opened valleys that subsequently were trans-gressed by the sea and where forests may have beenreduced during drier periods. Mountain uplift main-tains large rivers and keep slopes moist, allowing oro-graphic rainfall to maintain a well-developed forest,even during glacial periods. An important result of thephylogenetic relationships among areas (DaSilva andPinto-da-Rocha, 2011) is the hypothesis of reiterativebarriers (D. S. Amorim pers. comm.), i.e. barriersworking in the same place but at different times andthat connect or disconnect biotas and populations,such as refuges, marine transgressions and the inte-grated consequences of above-cited processes in shap-ing present harvestmen diversification. This iscongruent with the possible high spatial frequency ofdivergence that is represented by AoEs, even with spe-ciations in different times (as in the pseudo-congruenceview; Donoghue & Moore, 2003).
Conclusion
If there were a difference in the levels of endemismof harvestmen and most other organisms of the Atlan-tic Rain Forest, can the AoEs proposed here beextrapolated to other taxonomic groups? Because it ispossible that harvestmen have diversified much morethan many other organisms and have maintained theirdistributions for longer periods due to their limited
capacity to disperse, one could argue that our conclu-sions cannot be generalized. The present AoEs markvicariance events, or at least areas of historical isola-tion, in the Atlantic Rain Forest, which might haveaffected other taxa in different ways. While theseevents may have caused speciation in harvestmen, theymay have caused less severe separations in othergroups, for instance population isolation or unequalspeciation (e.g. in the phylogeographic studies of Pel-legrino et al., 2005; Grazziotin et al., 2006; Cabanneet al., 2007). Therefore, we hypothesize that other taxawith biological requirements similar to harvestmensuch as a dependency on moist forests and low vagilitymay have similar endemism patterns or populationstructure, for example crickets (Mello, 1994) and somefrogs (Heyer and Maxson, 1983).The CCs of our AoEs are good representations of
regions of species origins in the Atlantic Rain Forest.MREs or regions between areas can represent transi-tion zones with unique communities and high speciesrichness in some cases because they include a mix oftaxa from different origins. Some of these regions arecharacterized by geographical and vegetation differ-ences compared with core areas of the Atlantic RainForest that allow exclusive communities to develop,such as in the Rio Doce Valley where there is a transi-tion from the southern slope-forest and the northernwide-plain-forest. Thus, the AoEs proposed here arealso important as markers of historical complexity ofdiversification in the Atlantic Rain Forest.The AoEs proposed here represent the spatial parti-
tioning of the Atlantic Rain Forest biodiversity at thespecies or population level over a historically wide scale.We propose this delimitation as a hypothesis to betested with other forest taxa and using other methods(e.g. phylogeography). They can also play an importantrole in choosing priority areas for conservation.
Acknowledgements
We thank S�ılvio Nihei, Claudia Szumik, RonaldClouse, Dalton Amorim, Antonio Marques andAdriano Kury for comments on previous versions ofthe manuscript, Ronald Clouse, Cristina Rheims andMarcelo Carvalho for language review, and Andr�eNogueira, Cibele Bragagnolo, Everton Lorenzo,Fabiana Pioker, Gustavo Kaneto, Humberto Yamaguti,Lia Bezerra, Luiz Ara�ujo-da-Silva, Marco Silveira,Marcos Hara, Tha�ıs Martins and the PPBio Semi�aridoProject (CNPq 457471/2012-3) for their help duringdata collection trips. M.B.D. was supported byFAPESP (PhD 03-02673-0) and CNPq (477383/2013-0).R.P.R. was supported by FAPESP (08-06604-7) andCNPq (472960/2008-3). A.M.D. was supported byReuni/CAPES (PPGCB UFPB). This study is cofunded
M. Bernardino DaSilva et al. / Cladistics (2015) 1–14 11

by FAPESP (BIOTA, 2013/50297-0), NSF (DOB1343578), and NASA.
References
Aagesen, L., Szumik, C., Goloboff, P., 2013. Consensus in thesearch for areas of endemism. J. Biogeogr. 40, 2011–2016.
Almeida, F.F.M., Carneiro, C.D.R., 1998. Origem e evoluc�~ao daSerra do Mar. Rev. Bras. Geoc. 28, 135–150.
Amorim, D.S., Pires, M.R.S., 1996. Neotropical biogeography and amethod for a maximum biodiversity estimation. In: Bicudo,C.E.M., Menezes, N.A. (Eds.), Biodiversity in Brazil. A FirstApproach. Conselho Nacional de Desenvolvimento Cient�ıfico eTecnol�ogico, S~ao Paulo. pp. 183–219.
Arias, J.S., Szumik, C.A., Goloboff, P.A., 2011. Spatial analysis ofvicariance: a method for using direct geographical information inhistorical biogeography. Cladistics 27, 617–628.
Axelius, B., 1991. Areas of distribution and areas of endemism.Cladistics 7, 197–199.
Batalha-Filho, H., Waldschmidt, A.M., Campos, L.A.O., Tavares,M.G., Fernandes-Salom~ao, T.M., 2010. Phylogeography andhistorical demography of the Neotropical stingless bee Meliponaquadrifasciata (Hymenoptera, Apidae): incongruence betweenmorphology and mitochondrial DNA. Apidologie 41, 534–547.
BirdLife International 2003. BirdLife’s online World Bird Database:the site for bird conservation, version 2.0. Avaliable at: http://www.birdlife.org (accessed 8 December 2012).
Bragagnolo, C., Nogueira, A.A., Pinto-da-Rocha, R., Pardini, R.,2007. Harvestmen in an Atlantic forest fragmented landscape:evaluating assemblage response to habitat quality and quantity.Biol. Conserv. 139, 389–400.
Cabanne, G.S., Santos, F.R., Miyaki, C.Y., 2007. Phylogeographyof Xiphorhynchus fuscus (Passeriformes, Dendrocolaptidae):vicariance and recent demographic expansion in southernAtlantic forest. Biol. J. Linn. Soc. 91, 73–84.
Carine, M.A., Humphries, C.J., Guma, I.R., Reyes-Betancort, J.A.,Guerra, A.S., 2009. Areas and algorithms: evaluating numericalapproaches for the delimitation of areas of endemism in theCanary Islands archipelago. J. Biogeogr. 36, 593–611.
Carnaval, A.C., Moritz, C., 2008. Historical climate modellingpredicts patterns of current biodiversity in the Brazilian Atlanticforest. J. Biogeogr. 35, 1187–1201.
Casagranda, M.D., Arias, J.S., Goloboff, P.A., Szumik, C.A., Taher,L.M., Escalante, T., Morrone, J.J., 2009a. Proximity,interpenetration, and sympatry networks: a reply to Dos Santoset al.. Syst. Biol. 58, 271–276.
Casagranda, M.D., Roig-Ju~nent, S., Szumik, C.A., 2009b.Endemismo a diferentes escalas espaciales: un ejemplo conCarabidae (Coleoptera: Insecta) de Am�erica del Sur austral. Rev.Chil. Hist. Nat. 82, 17–42.
Casagranda, M.D., Taher, L., Szumik, C.A., 2012. Endemicityanalysis, parsimony and biotic elements: a formal comparisonusing hypothetical distributions. Cladistics 1, 1–10.
Collinvaux, P.A., Oliveira, P.E., Bush, M.B., 2000. Amazonianand Neotropical communities on glacial time-scales: the failureof the aridity and refuge hypotheses. Quatern. Sci. Rev. 19,141–169.
Costa, L.P., Fonseca, G.A.B., Fonseca, M.T., 2000. Biogeographyof South America forest mammals: endemism and diversity in theAtlantic Forest. Biotropica 32, 872–881.
Cracraft, J., 1985. Historical biogeography and patterns ofdifferentiation within the South American avifauna: areas ofendemism. Ornithol. Monogr. 36, 49–84.
Crother, B.I., Murray, C.M., 2011. Ontology of areas of endemism.J. Biogeogr. 38, 1009–1015.
DaSilva, M.B., Gnaspini, P., 2009. A systematic revision ofGoniosomatinae (Arachnida: Opiliones: Gonyleptidae), with acladistic analysis and biogeographical notes. Invertebr. Syst. 23,530–624.
DaSilva, M.B., Pinto-da-Rocha, R., 2010. Systematic review andcladistic analysis of the Hernandariinae (Opiliones:Gonyleptidae). Zoologia 27, 577–642.
DaSilva, M.B., Pinto-da-Rocha, R. 2011. A hist�oria da MataAtlantica atrav�es da distribuic�~ao dos opili~oes (Arachnida). In:Carvalho, C.J.B., Almeida, E.A.B. (Eds.), Biogeografia daAm�erica do Sul: Padr~oes e Processos. Editora Roca, S~ao Paulo.pp. 221–238.
Deo, A.J., DeSalle, R., 2006. Nested areas of endemism analysis. J.Biogeogr. 33, 1511–1526.
D’Horta, F.M., Cabanne, G.S., Meyer, D., Miyaki, C.Y., 2011. Thegenetic effects of Late Quaternary climatic changes over atropical latitudinal gradient: diversification of an Atlantic Forestpasserine. Mol. Ecol. 20, 1923–1935.
Di Virgilio, G., Laffan, S.W., Ebach, M.C., 2013. Quantifying highresolution transitional breaks in plant and mammal distributionsat regional extent and their association with climate, topographyand geology. PLoS ONE 8, e59227.
Donoghue, M.J., Moore, B.R., 2003. Toward an integrativehistorical biogeography. Integr. Comp. Biol. 43, 261–270.
Ebach, M.C., Morrone, J.J., Parenti, L.R., Viloria, A.L., 2008.International code of area nomenclature. J. Biogeogr. 35, 1153–1157.
Ferrari, A., Paladini, A., Schwertner, C.F., Grazia, J., 2010.Endemism analysis of Neotropical Pentatomidae (Hemiptera,Heteroptera). Iheringia 100, 449–462.
Goldani, A., Carvalho, G.S., Bicca-Marques, J.C., 2006.Distribution patterns of Neotropical primates (Platyrrhini) basedon parsimony analysis of endemicity. Braz. J. Biol. 66, 61–74.
Goloboff, P. 1999. Nona, version 2.0. Avaliable at: http://www.cladistics.com/about_nona.htm.
Goloboff, P. 2005. NDM/VNDM: programs for the identification ofareas of endemism, version 2.5. Available at: www.zmuc.dk/public/phylogeny/endemism/.
Grazziotin, F.G., Monzel, M., Echeverrigaray, S., Bonatto, S.L.,2006. Phylogeography of the Bothrops jararaca complex(Serpentes: Viperidae): past fragmentation and islandcolonization in the Brazilian Atlantic Forest. Mol. Ecol. 15,3969–3982.
Haffer, J. 1987. Biogeography of Neotropical birds. In: Whitmore,T.C., Prance, G.T. (Eds.), Biogeography and Quaternary History inTropical America. Clarendon Press, Oxford. pp. 105–150.
Hara, M.R., Pinto-da-Rocha, R., 2008. A new species and newdistribution records of Pickeliana (Opiliones: Laniatores:Stygnidae). Rev. Bras. Zool. 25, 515–522.
Harold, A.S., Mooi, R.D., 1994. Areas of endemism: definition andrecognition criteria. Syst. Biol. 43, 261–266.
Hausdorf, B., 2002. Units in biogeography. Syst. Biol. 51, 648–652.Hausdorf, B., Hennig, C., 2003. Biotic elements analysis in
biogeography. Syst. Biol. 52, 717–723.Heyer, W.R., Maxson, L.R., 1983. Relationships, zoogeography, and
speciation mechanisms of frogs of the genus Cycloramphus(Amphibia, Leptodactylidae). Arquiv. Zool. 30, 341–373.
Holbourn, A., Kuhnt, W., Lyle, M., Schneider, L., Romero, O.,Andersen, N., 2013. Middle Miocene climate cooling linked tointensification of eastern equatorial Pacific upwelling. Geology42, 19–22.
IBGE 1983. Folha SC.24/25 Aracaju/Recife. Levantamento derecursos naturais. v. 30. Fundac�~ao Instituto de Geografia eEstat�ıstica (IBGE), Rio de Janeiro, Brazil.
Joly, C.A., Aidar, M.P.M., Klink, C.A., McGrath, D.G., Moreira,A.G., Moutinho, P., Nepstad, D.C., Oliveira, A.A., Pott, A.,Rodal, M.J.N., Sampaio, E.V.S.B., 1999. Evolution of theBrazilian phytogeography classification systems: implications forbiodiversity conservation. Ci. Cult. J. Braz. Assoc. Adv. Sci. 51,331–348.
Kury, A.B., 2003. Annotated catalogue of the Laniatores of the NewWorld (Arachnida, Opiliones). Rev. Ib�er. Aracnol. (vol. especialmonogr�afico) 1, 5–337.
Ledru, M.P., Rousseau, D.D., Cruz., F.W. Jr, Riccomini, C.,Karmann, I., Martin, L., 2005. Paleoclimate changes during the
12 M. Bernardino DaSilva et al. / Cladistics (2015) 1–14

last 100,000 yr from a record in the Brazilian Atlantic rainforestregion and interhemispheric comparison. Quatern. Res. 64, 444–450.
Linder, H.P., 2001. On areas of endemism, with an example fromthe African Restionaceae. Syst. Biol. 50, 892–912.
Machado, G., Raimundo, R.L.G., Oliveira, P.S., 2000. Daily activityschedule, gregariousness, and defensive behaviour in theNeotropical harvestmen Goniosoma longipes (Opiliones:Gonyleptidae). J. Nat. Hist. 34, 587–596.
Martins, F.M., Templeton, A.R., Pavan, A.C.O., Kohlbach, B.C.,Morgante, J.S., 2009. Phylogeography of the common vampirebat (Desmodus rotundus): marked population structure,Neotropical Pleistocene vicariance and incongruence betweennuclear and mtDNA markers. BMC Evol. Biol. 9, 294.
Mello, F.A.G. 1994. Sistem�atica, distribuic�~ao e diferenciac�~ao degrilos do genero Aracamby Mello, 1992 nas matas costeiras dosudeste do Brasil e sistema insular adjacente: aspectosmorfol�ogicos, cromossomicos e comportamentais (Orthoptera:Grylloidea: Phalangopsidae). PhD thesis, Instituto de Biociencias,Universidade de S~ao Paulo, S~ao Paulo, Brazil.
Mendes, A.C., 2011. Phylogeny and taxonomic revision ofHeteropachylinae (Opiliones: Laniatores: Gonyleptidae). Zool. J.Linn. Soc. 163, 437–483.
Mestre, L.A.M., Pinto-da-Rocha, R., 2004. Populational biology ofthe harvestmen Ilhaia cuspidata (Opiliones; Gonyleptidae) in anAraucaria Forest fragment (Curitiba - Paran�a, Brazil). J.Arachnol. 32, 208–220.
Mittermeier, R.A., Gil, P.R., Hoffman, M., Pilgrim, J., Brooks, T.,Mittermeier, C.G., Lamoureux, J., Fonseca, G.A.B., 2005.Hotspots Revisited: Earth’s Biologically Richest and MostEndangered Terrestrial Ecoregions. Conservation International,Washington, DC.
Moline, P.M., Linder, H.P., 2006. Input data, analytical methodsand biogeography of Elegia (Restionaceae). J. Biogeogr. 33, 47–62.
Morrone, J.J., 1994. On the identification of Areas of Endemism.Syst. Biol. 43, 438–441.
Morrone, J.J., 2001a. Homology, biogeography and areas ofendemism. Divers. Distrib. 7, 297–300.
Morrone, J.J., 2001b. Biogeograf�ıa de Am�erica Latina y el Caribe.M&T S.E.A, Zaragoza, 3, 1–148.
Morrone, J.J., Crisci, J.V., 1995. Historical biogeography:introduction to methods. Annu. Rev. Ecol. Syst. 26, 373–401.
Morrone, J.J., Escalante, T., 2002. Parsimony analysis of endemicity(PAE) of Mexican terrestrial mammals at different area units:when size matters. J. Biogeogr. 29, 1095–1104.
M€uller, P., 1973. The dispersal centres of terrestrial vertebrates inthe Neotropical realm: a study in the evolution of theNeotropical biota and its native landscape. Biogeographica 2, 1–250.
Oliveira, P.E., Barreto, A.M.F., Suguio, K., 1999. Late Pleistocene/Holocene climatic and vegetational history of the Braziliancaatinga: the fossil dunes of the middle S~ao Francisco River.Palaeogeogr. Palaeoclimat. Palaeoecol. 152, 319–337.
Pellegrino, K.C.M., Rodrigues, M.T., Waite, A.N., Morando, M.,Yassuda, Y.Y., Sites, J.W. Jr, 2005. Phylogeography andspecies limits in the Gymnodactylus darwinii complex(Gekkonidae, Squamata): genetic structure coincides with riversystems in the Brazilian Atlantic Forest. Biol. J. Linn. Soc. 85,13–26.
Pinto-da-Rocha, R., 2002. Systematic review and cladistic analysis ofthe Brazilian subfamily Caelopyginae (Opiliones: Gonyleptidae).Arq. Zool. 36, 357–464.
Pinto-da-Rocha, R., Bragagnolo, C., 2011. Systematic revision andcladistic analysis of the Brazilian subfamily Sodreaninae(Opiliones: Gonyleptidae). Invert. Syst. 24, 509–538.
Pinto-da-Rocha, R., DaSilva, M.B., Bragagnolo, C., 2005. Faunisticsimilarity and historical biogeography of the harvestmen ofsouthern and southeastern Atlantic Rain Forest of Brazil.J. Arachnol. 33, 290–299.
Platnick, N.I., 1991. On areas of endemism. Aust. Syst. Bot. 4, 11–12.Porzecanski, A.L., Cracraft, J., 2005. Cladistic analysis of
distributions and endemism (CADE): using raw distributions ofbirds to unravel the biogeography of the South Americanaridlands. J. Biogeogr. 32, 261–275.
Prance, G.T. 1982. Forest refuges: evidence from woodyangiosperms. In: Prance, G.T. (Ed.), Biological Diversification inthe Tropics. Columbia University Press, New York, NY. pp.137–158.
Riddle, B.R., 1998. The historic assembly of continental biotas: latequaternary range-shifting, areas of endemism, and biogeographicstructure in the North American mammal fauna. Ecography 21,437–446.
Saadi, A., Bezerra, F.H.R., Costa, R.D., Igreja, H.L.S., Franzinelli,E. 2005. Neotectonica da plataforma brasileira. In: Souza,C.R.G., Suguio, K., Oliveira, A.M.S., Oliveira, P.E. (Eds.),Quatern�ario do Brasil. Associac�~ao Brasileira de Estudos doQuatern�ario/Holos Editora, Ribeir~ao Preto. pp. 211–234.
Saia, S.E.M.G., Pessenda, L.C.R., Gouveia, S.E.M., Aravena, R.,Bendassolli, J.A., 2008. Last glacial maximum (LGM) vegetationchanges in the Atlantic Forest, southeastern Brazil. Quatern. Int.184, 195–201.
Santos, F.H. 2007. Ecophysiology. In: Pinto-da-Rocha, R.,Machado, G., Giribet, G.. (Eds.), Harvestmen: The Biology ofOpiliones. Harvard University Press, Cambridge, MA, pp. 473–488.
dos Santos, D.A., Fern�andez, H.R., Cuezzo, M.G., Dom�ınguez, E.,2008. Sympatry inference and network analysis in biogeography.Syst. Biol. 57, 432–448.
Silva, J.M.C., Casteleti, C.H.M. 2005. Estado da biodiversidade daMata Atlantica brasileira. In: Galindo–Leal, C., Camara, I.G.(Eds.), Mata Atlantica: Biodiversidade, Ameac�as e Perspectivas.Fundac�~ao SOS Mata Atlantica, S~ao Paulo. pp. 43–59.
Silva, J.M.C., Sousa, M.C., Castelletti, C.H.M., 2004. Areas ofendemism for passerine birds in the Atlantic forest, SouthAmerica. Global Ecol. Biogeogr. 13, 85–92.
Silva, S.M., Moraes-Barros, N., Ribas, C.C., Ferrand, N.,Morgante, J.S., 2012. Divide to conquer: a complex pattern ofbiodiversity depicted by vertebrate components in the BrazilianAtlantic Forest. Biol. J. Linn. Soc. 107, 39–55.
Soderstrom, T.R., Judziewicz, E.J., Clark, L.G. 1988. Distributionpatterns of Neotropical bamboos. In: Vanzolini, P.E., Heyer,W.R. (Eds.), Proceedings of a Workshop on NeotropicalDistribution Patterns. Academia Brasileira de Ciencias, Rio deJaneiro, pp. 121–157.
Suguio, K., Angulo, R.J., Carvalho, A.M., Correa, I.C.S.,Tomazelli, L.J., Willwock, J.A., Vital, H. 2005. Paleon�ıveis domar e paleolinhas de costa. In: Souza, C.R.G., Suguio, K.,Oliveira, A.M.S., Oliveira, P.E. (Eds.), Quatern�ario do Brasil.Associac�~ao Brasileira de Estudos do Quatern�ario/Holos Editora,Ribeir~ao Preto. pp. 114–129.
Szumik, C.A., Goloboff, P., 2004. Areas of endemism: improvedoptimality criteria. Syst. Biol. 53, 968–977.
Szumik, C., Casagranda, D., Roig-Ju~nent, S., 2006. Manual deNDM/VNDM: programas para la identificaci�on de �areas deendemismo. Inst. Arg. Est. Filogenet. A~no V, 3, 1–26.
Thom�e, M.T.C., Zamudio, K.R., Giovanelli, J.G.R., Haddad,C.F.B., Baldissera, F.A. Jr, Alexandrino, J., 2010.Phylogeography of endemic toads and post-Pliocene persistenceof the Brazilian Atlantic Forest. Mol. Phylogenet. Evol. 55,1018–1031.
Willemart, R.H., Gnaspini, P., 2004. Spatial distribution, mobility,gregariousness and defensive behaviour in a Brazilian caveharvestman Goniosoma albiscriptum (Arachnida, Opiliones,Gonyleptidae). Anim. Biol. 54, 221–235.
Yamaguti, H.Y., Pinto-da-Rocha, R., 2009. Taxonomic review ofBourguyiinae, cladistic analysis, and a new hypothesis ofbiogeographic relationships of the Brazilian Atlantic Rainforest(Arachnida: Opiliones, Gonyleptidae). Zool. J. Linn. Soc. 156,319–362.
M. Bernardino DaSilva et al. / Cladistics (2015) 1–14 13

Supporting Information
Additional Supporting Information may be found inthe online version of this article:Table S1. AoEs cited in the literature for the Atlan-
tic Forest and their congruence with present delimita-tion.
Table S2. List of species used in the analysis.Table S3. Detailed results of numerical analyses.Fig. S1. Depiction of the cladogram resulting from
parsimony analysis of endemicity.Data S1. Formal description of Areas of Endemism
following International Code of Area Nomenclature(Ebach et al., 2008).
14 M. Bernardino DaSilva et al. / Cladistics (2015) 1–14