Embed Size (px)
Citation preview

A Proposed “Percent of Flow” Approach for Water Storage Projects in Oregon Page 1
A Proposed “Percent of Flow” Approach for Water Storage Projects in Oregon
Senate Bill 839 Science Subgroup Report February 1, 2014
Page 2 A Proposed “Percent of Flow” Approach for Water Storage Projects in Oregon
Table of Contents
Executive Summary .................................................................................................................................................... 3
Introduction. Framing the Discussion ........................................................................................................................ 5
Chapter 1. When Water Is Available for Storage: A Percent of Flow Approach ...................................................... 7
Chapter 2. More than a Percent of Flow Approach: In-Depth Methods to Request Additional Water ................. 13
Chapter 3. Comparing Approaches ......................................................................................................................... 19
Conclusion. Observations and Recommendations .................................................................................................. 21
Appendix A. Acknowledgements ............................................................................................................................. 23
Appendix B. Acronyms ............................................................................................................................................. 24
Appendix C. Definitions ........................................................................................................................................... 25
Appendix D. Sample “Percent of Flow” Hydrographs ............................................................................................. 30
Appendix E. Two Examples of the “Percent of Flow” Approach: Alberta and British Columbia ............................ 37
Appendix F. Additional Resources to Conduct In-Depth Studies ............................................................................ 39
Appendix G. References .......................................................................................................................................... 41

A Proposed “Percent of Flow” Approach for Water Storage Projects in Oregon Page 3
Executive Summary
Senate Bill 839 calls for the protection of Seasonally Varying Flows (SVF) to maintain the biological, ecological,
and physical functions of the watershed during periods outside of the irrigation season when public funds from
the Water Supply Development Account are used for certain water storage projects. In this document, the
science subgroup reviews studies and methods for the protection of seasonally varying flows and makes
recommendations to the Seasonally Varying Flows Task Force.
The science subgroup conducted a literature review and consulted with other experts, finding a broad consensus
that protection of a variable flow regime is critical to ecosystem function. Many states and Canadian provinces
have adopted a percent of flow (POF) method to allow some allocation of water, while protecting natural flow
variability. Following their lead, the science subgroup recommends a percent of flow approach for those water
storage projects that receive funding from Oregon’s Water Supply Development Account. Using this approach,
funding recipients could potentially store up to 15 percent of daily flow, minus prior allocations, without
extensive study or review. The amount of water remaining instream would follow the shape of, but be less than,
the natural hydrograph. Examples are given for several different basins.
For publicly funded projects needing more water—or different timing—than the POF allocation, applicants may
develop an in-depth assessment, in consultation with the Water Resources Department and a technical review
committee. The in-depth assessment will identify elements to be addressed within the major categories of
hydrology, biology, geomorphology, connectivity, and water quality. The funding applicant will develop
hypotheses relating proposed changes in the flow regime to key elements in the above categories, and will then
conduct quantitative analyses based on the hypotheses. A report on these studies will describe the results,
including the magnitude, frequency and duration of seasonally varying flows to be protected. The State will
review the report and respond to the findings.

Page 4 A Proposed “Percent of Flow” Approach for Water Storage Projects in Oregon
This page intentionally left blank
A Proposed “Percent of Flow” Approach for Water Storage Projects in Oregon Page 5
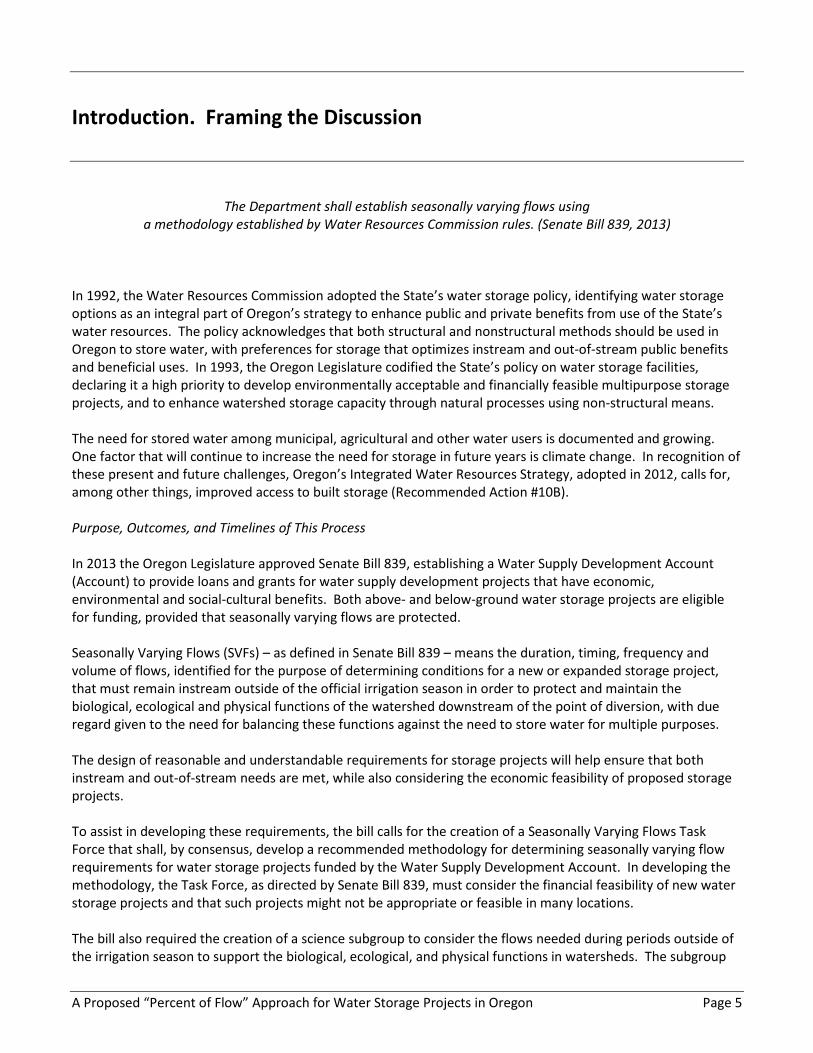
Introduction. Framing the Discussion
The Department shall establish seasonally varying flows using
a methodology established by Water Resources Commission rules. (Senate Bill 839, 2013)
In 1992, the Water Resources Commission adopted the State’s water storage policy, identifying water storage
options as an integral part of Oregon’s strategy to enhance public and private benefits from use of the State’s
water resources. The policy acknowledges that both structural and nonstructural methods should be used in
Oregon to store water, with preferences for storage that optimizes instream and out-of-stream public benefits
and beneficial uses. In 1993, the Oregon Legislature codified the State’s policy on water storage facilities,
declaring it a high priority to develop environmentally acceptable and financially feasible multipurpose storage
projects, and to enhance watershed storage capacity through natural processes using non-structural means.
The need for stored water among municipal, agricultural and other water users is documented and growing.
One factor that will continue to increase the need for storage in future years is climate change. In recognition of
these present and future challenges, Oregon’s Integrated Water Resources Strategy, adopted in 2012, calls for,
among other things, improved access to built storage (Recommended Action #10B).
Purpose, Outcomes, and Timelines of This Process
In 2013 the Oregon Legislature approved Senate Bill 839, establishing a Water Supply Development Account
(Account) to provide loans and grants for water supply development projects that have economic,
environmental and social-cultural benefits. Both above- and below-ground water storage projects are eligible
for funding, provided that seasonally varying flows are protected.
Seasonally Varying Flows (SVFs) – as defined in Senate Bill 839 – means the duration, timing, frequency and
volume of flows, identified for the purpose of determining conditions for a new or expanded storage project,
that must remain instream outside of the official irrigation season in order to protect and maintain the
biological, ecological and physical functions of the watershed downstream of the point of diversion, with due
regard given to the need for balancing these functions against the need to store water for multiple purposes.
The design of reasonable and understandable requirements for storage projects will help ensure that both
instream and out-of-stream needs are met, while also considering the economic feasibility of proposed storage
projects.
To assist in developing these requirements, the bill calls for the creation of a Seasonally Varying Flows Task
Force that shall, by consensus, develop a recommended methodology for determining seasonally varying flow
requirements for water storage projects funded by the Water Supply Development Account. In developing the
methodology, the Task Force, as directed by Senate Bill 839, must consider the financial feasibility of new water
storage projects and that such projects might not be appropriate or feasible in many locations.
The bill also required the creation of a science subgroup to consider the flows needed during periods outside of
the irrigation season to support the biological, ecological, and physical functions in watersheds. The subgroup
Page 6 A Proposed “Percent of Flow” Approach for Water Storage Projects in Oregon
must provide a report to the Task Force by February 1, 2014. The report must describe flows necessary to
support instream needs including, but not limited to: (a) stream channel development and maintenance; (b)
connectivity to floodplains; (c) sediment transport and deposition; (d) migration triggers for upstream
movement of adult fish and downstream movement of fry and juvenile fish; (e) fish spawning and incubation; (f)
juvenile fish rearing; and (g) adult fish passage. These terms are defined in Appendix C Definitions.
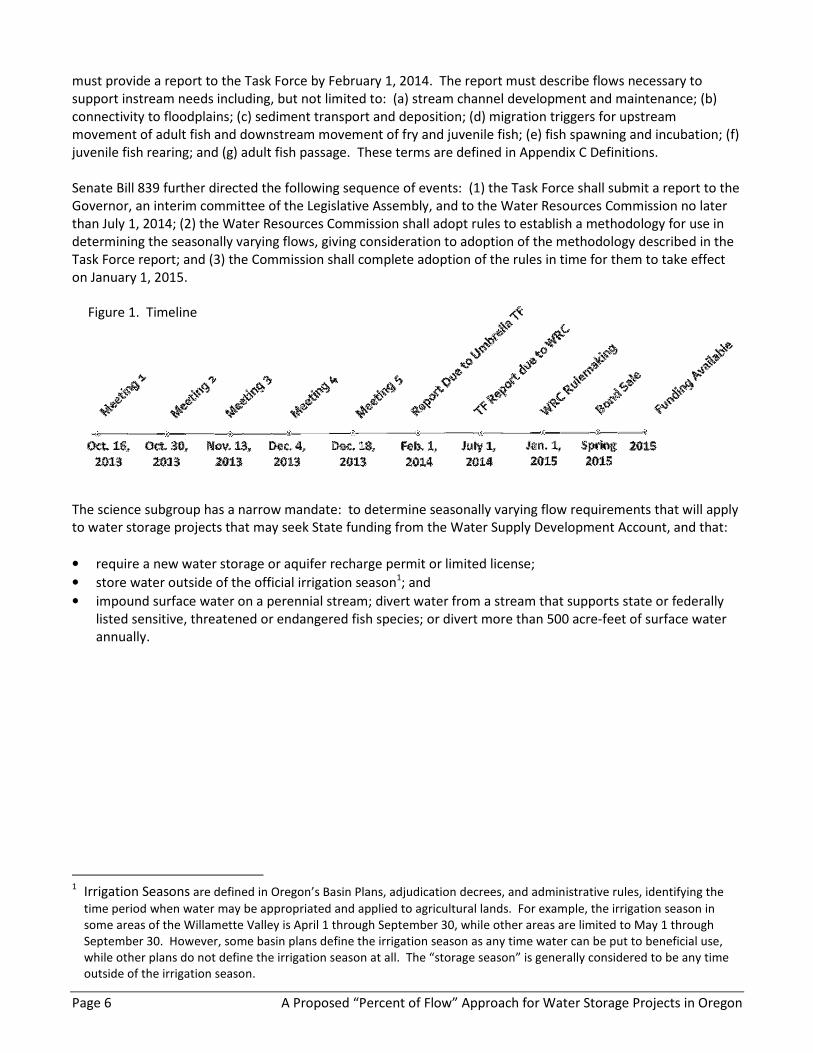
Senate Bill 839 further directed the following sequence of events: (1) the Task Force shall submit a report to the
Governor, an interim committee of the Legislative Assembly, and to the Water Resources Commission no later
than July 1, 2014; (2) the Water Resources Commission shall adopt rules to establish a methodology for use in
determining the seasonally varying flows, giving consideration to adoption of the methodology described in the
Task Force report; and (3) the Commission shall complete adoption of the rules in time for them to take effect
on January 1, 2015.
The science subgroup has a narrow mandate: to determine seasonally varying flow requirements that will apply
to water storage projects that may seek State funding from the Water Supply Development Account, and that:
• require a new water storage or aquifer recharge permit or limited license;
• store water outside of the official irrigation season1; and
• impound surface water on a perennial stream; divert water from a stream that supports state or federally
listed sensitive, threatened or endangered fish species; or divert more than 500 acre-feet of surface water
annually.
1 Irrigation Seasons are defined in Oregon’s Basin Plans, adjudication decrees, and administrative rules, identifying the
time period when water may be appropriated and applied to agricultural lands. For example, the irrigation season in
some areas of the Willamette Valley is April 1 through September 30, while other areas are limited to May 1 through
September 30. However, some basin plans define the irrigation season as any time water can be put to beneficial use,
while other plans do not define the irrigation season at all. The “storage season” is generally considered to be any time
outside of the irrigation season.
Figure 1. Timeline
A Proposed “Percent of Flow” Approach for Water Storage Projects in Oregon Page 7
Chapter 1. When Water Is Available for Storage:
Diverting a Percent of Flow
All streams and rivers should have instream flows that maintain or restore, to the greatest extent possible,
ecological functions and processes similar to those exhibited in their natural or unaltered state.
(Instream Flow Council 2008)
A strong consensus now exists within the scientific community around the need to maintain
some semblance of natural flow variability to sustain the ecological health of river ecosystems
and the array of goods and services they provide to society. (Richter 2009)
The seasonality and variability in streamflow provides spawning and rearing habitat, cues fish behavior, and
drives physical habitat functions such as stream channel development, sediment transport and river-floodplain
connectivity. While scientists know that significant diversion of streamflow—even during annual periods of high
flow—will eventually affect ecological or geomorphological functions, it is difficult to identify the precise
thresholds at which these impacts occur (Richter et al. 2011; Arthington et al. 2006).
Numerous authors (e.g. Acreman and Ferguson 2010; Arthington et al. 2006; King et al. 2008; Poff et al. 2010;
Richter et al. 2011) note that in the midst of increased economic development, it is in society’s best interest to
protect natural freshwater systems that are being tapped for water supplies. However, they also observe that
these calls for protection are often stymied by data collection and modeling protocols that require considerable
time, expertise, and money to implement. Analyses can range from hundreds of thousands to millions of
dollars, depending on the data set, modeling technique, complexity and size of the project. As noted by Richter
et al. (2011), the end result is often a paralysis of decision-making, which results in a lack of necessary water
development and/or a lack of protective flow regimes.
In recent years, some jurisdictions around the world have used a “percent of flow” (POF) approach to overcome
that paralysis, and to advance both economic development and instream flow protection. The approach is
practical and science-based, limiting water withdrawals to protect natural flow variability, particularly when site-
specific data and analyses are limited or do not exist.
Why are other states and countries using the “percent of flow” approach?
It is now widely accepted that a naturally variable flow regime is critical to sustaining freshwater ecosystems
(Poff et al. 1997; Bunn and Arthington 2002; others as cited above). The National Research Council (2005)
advises using natural-flow characteristics as a reference for determining instream flow needs. This general
scientific understanding of the importance of the natural flow regime provides a basis for establishing an
approach that protects instream flows and allows for water development, without significant up-front
investment or detailed studies. A growing number of states and countries are using withdrawal limits as a tool
to protect instream flows. These withdrawal limits are defined as a “percent of flow” (POF), meaning that a
certain percent of daily natural streamflow may be diverted for storage and use. An important facet of this
approach is the maintenance of the shape of the natural hydrograph, allowing for all types of flows to pass
through the system, albeit at a slightly lower volume, and thereby preserving the natural flow variability. This
approach also means the hydrograph is never “flat-lined” by the removal of all flows above the base flow. The
general approach is based on a recognition of the relationship between flow alteration and ecological or

Page 8 A Proposed “Percent of Flow” Approach for Water Storage Projects in Oregon
functional response. It involves an effort to define an acceptable degree (limit) of flow alteration that still
provides ecological protections.
A number of jurisdictions are using this approach, such as the states of Florida, Maine, and Virginia, as well as
Canadian Provinces, and members of the European Union. These jurisdictions allow water users to divert a
certain percent of daily flow. In most of these cases, allowable diversions hover between 10 and 20 percent of
natural flows, and they include a base flow that is also protected during periods of low flows. They have
selected these percentages based on their examination of flow-ecology relationships, risk thresholds, or
empirical models. For example, Florida used data on habitat availability for fish and macroinvertebrate diversity,
changes in the number of days of inundation of floodplain features, and inundation of instream woody habitats
to determine percent of flow reductions on several streams (Kelly et al. 2010; 2010a; and 2010b). Maine has
established percent of flow standards to protect aquatic life resources and water quality standards based on
different condition goal classes for streams, and thus different levels of acceptable risk (Maine Department of
Environmental Protection 2010). In the United Kingdom, maximum levels of abstraction were established as a
percent of natural flow depending on river type and flow rate using information on flow needs for macrophytes,
macroinvertebrates and fish.
The Province of Alberta based its percent of flow approach on evaluations of fish habitat reductions, reduction
in recruitment for riparian vegetation, and changes to magnitude, frequency and duration of channel-forming
flows (Locke and Paul 2011). Alberta officials were looking specifically to identify those flow alterations that
would trigger a reduction in average habitat of less than 10 percent; a weekly loss in average habitat of less than
15 percent; and an instantaneous habitat loss of less than 25 percent. Factoring in uncertainty and a desire to
protect the aquatic ecosystem, Alberta chose a 15 percent flow reduction to avoid triggering these losses.
Many of the entities named above limit withdrawals of water to certain months or seasons. For each identified
time period, some jurisdictions also vary the percent of streamflow that may be withdrawn.
The Percent of Flow Approach Proposed for Oregon
The science subgroup sought an approach that allows an acceptable degree of flow alteration, while still
demonstrating full protection of the aquatic ecosystem. The science subgroup used the studies noted above, as
well as correspondence and discussion with colleagues in these jurisdictions to better understand the rationale,
details, and results associated with a percent of flow approach.
As a result of its deliberations, the science subgroup recommends using a simple “percent of flow” approach,
paired with current water availability methods, to shape the timing and quantity of diversions. For project
proponents and stakeholders who wish to pursue other methods, the State would consider results from more
in-depth analyses as described in Chapter 2.
A simple “percent of flow” approach involves three steps: (1) determining water availability; (2) establishing a
base flow requirement; and (3) using a percent of flow approach to shape diversions.
(1) First determine whether and, if so, when water is available for storage, using the “50 percent
exceedance criteria,” evaluated based on natural streamflow. The State does this already for any new
storage requests. The subgroup recommends continued use of the “50 percent exceedance criteria” to
determine whether water is available for storage, and, if so, during which months of the year.
Natural streamflow refers to the flow in rivers and streams that would have occurred in the absence of
any man-made effects on, or regulation of, flow. In systems with human impacts, natural flow is a
calculated value based on the recorded flows of contributing rivers, physical factors concerning the

A Proposed “Percent of Flow” Approach for Water Storage Projects in Oregon Page 9
Recommendation #2. Recommendation #2. Recommendation #2. Recommendation #2.
Establish base flows Establish base flows Establish base flows Establish base flows as aas aas aas a lower lower lower lower protective threshold, below protective threshold, below protective threshold, below protective threshold, below which no withdrawals can which no withdrawals can which no withdrawals can which no withdrawals can
occuroccuroccuroccur....
Recommendation #3. Recommendation #3. Recommendation #3. Recommendation #3. Use a Use a Use a Use a
“percent of flow” approach as a “percent of flow” approach as a “percent of flow” approach as a “percent of flow” approach as a simple toolsimple toolsimple toolsimple tool to shape the timing to shape the timing to shape the timing to shape the timing and quantity of diversionsand quantity of diversionsand quantity of diversionsand quantity of diversions....
Recommendation #1. Use the Recommendation #1. Use the Recommendation #1. Use the Recommendation #1. Use the
Department’s waterDepartment’s waterDepartment’s waterDepartment’s water availability model and 50 availability model and 50 availability model and 50 availability model and 50
percent exceedance criteria to percent exceedance criteria to percent exceedance criteria to percent exceedance criteria to determine whether water is determine whether water is determine whether water is determine whether water is available for storage, and available for storage, and available for storage, and available for storage, and
during which months.during which months.during which months.during which months.
reach (for example, evaporation, channel losses), water diversions, consumptive use, and return flow.
In pristine environments, natural flows equal recorded
flows.
To provide consistency with Oregon Administrative Rules
690-410-0070 (2)(c), the Water Resources Department
generally evaluates water availability for storage using
the median flow for any given month as a cap for
allocation. All of the natural streamflow measurements
for the month over a 30-year period are ranked in order
of magnitude and the median daily flow for the month is
identified (i.e., 50 percent of the measured flows lie
above this value, and 50 percent lie below). This is a
statistical calculation, based on historic data. Then already-existing water rights, including instream
rights, are subtracted from that median flow to determine whether there is still water available for
storage during that month. The Water Resources Department repeats this process, called the “50
percent exceedance criteria,” to evaluate the availability of water for each month.
(2) Next, for streams without base flow protections in place, establish a base flow as a lower protective
threshold, below which no withdrawals can occur during the storage season. Again, the state currently
does this.
Base flows are defined in order to be sufficient in volume
for rearing and spawning for key species over long
periods of time, as well as sufficient to overcome the
potential for threats to aquatic life from harmful
pollutants or stream heating. Base flows, as a
component of seasonally varying flows, must be
protected throughout this process. Before allocating
water storage, the state will establish base flows within
the prescribed reach.
(3) Finally, use a “percent of flow” approach to shape how much water may be diverted during the time
period when water is available. The science subgroup
recommends a “15 percent of natural flow” approach,
meaning that up to 15 percent of the natural flow
could be allocated for water storage projects. This
refers cumulatively to all water storage projects
operating on a stream, not each individual project. In
practice, “natural flow” would be a measured daily
flow adjusted for existing allocations2. A program that
uses such an approach would leave 85 percent of the
natural flow instream.
The following pages provide a number of examples describing how the “percent of flow” approach would work
in Oregon.
2 Assume that existing allocations can be reliably estimated on a daily basis.

Page 10 A Proposed “Percent of Flow” Approach for Water Storage Projects in Oregon
RecommendationRecommendationRecommendationRecommendation #4. Install #4. Install #4. Install #4. Install
stream gages or other stream gages or other stream gages or other stream gages or other measuring equipment, measuring equipment, measuring equipment, measuring equipment,
according to Department according to Department according to Department according to Department specifications, to monitor and specifications, to monitor and specifications, to monitor and specifications, to monitor and
manage the system.manage the system.manage the system.manage the system.
Figure 2. Example of the Percent of Flow Approach in Oregon In a simple example, the stream
depicted in Figure 2 by its
hydrograph (topmost, blue line),
experiences high flows of about
170 cubic feet per second (cfs) and
low flows of about 50 cfs during
the time period of interest. In this
example, there is no other water
use activity on this stream, and the
Water Resources Department has
determined that water is available
for storage during this time period.
The Department of Fish and
Wildlife has established base flow
requirements of 100 cfs, in order
to support biological activity.
A new water storage project,
receiving funding from the Water
Supply Development Account,
could request permission to divert up to 15 percent of this flow for storage. The gray shaded area on this graph
represents the allowable diversion. This scenario begins with the diversion of 15 percent of flows, or 85 percent
of flows left instream. On day two, when flows are 140 cfs, the water storage project could divert up to 21 cfs,
and on day three, when flows have increased to 170 cfs, the water storage project could divert up to 26 cfs.
On day six, flows have dropped to approximately 118 cfs, still allowing diversion of 15 percent of the natural
flow (18 cfs). On day seven, as natural flows continue to drop, the allowable diversions decrease to avoid
violating the base flow (black line), and on day eight, the natural flow declines to approximately 100 cfs and
diversions must stop.
Now assume in a new example that another water storage project
already existed on this stream. The Water Resources Department
would have to take into account the already-existing diversion to
determine whether a new water user could access additional water
for storage.
As demonstrated in these examples, near real-time stream gaging
will be important to accurately manage diversions in the system. The
examples also show that the rate of withdrawals would fluctuate in
response to actual conditions in the stream; when streamflows are high, higher rates of withdrawal would be
allowed.
A Proposed “Percent of Flow” Approach for Water Storage Projects in Oregon Page 11
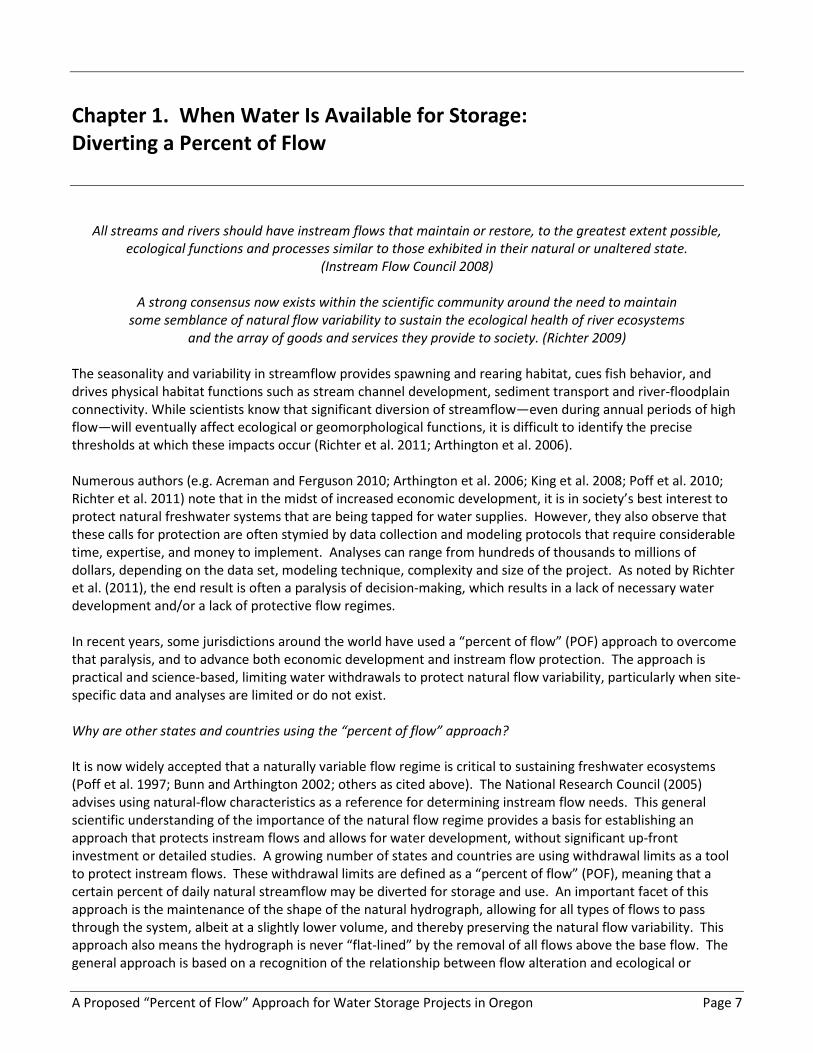
The following hydrographs help to
demonstrate in more detail how the
percent of flow approach could work in
Oregon. The set of hydrographs
displayed in Figure 3 use a stream gage in
the South Yamhill River to demonstrate
the application of this method. Three
additional examples in the Grande
Ronde, the Powder, and the Rogue Basins
can be found in Appendix D of this report.
� When is water available in a basin?
Figure 3.1 displays the average daily
flows from 1995-2012 for the Yamhill
River at McMinnville (dark green line).
The light green, stair-stepped line shows
water available for storage between
November and June, after prior
allocations have been accounted for. The
two light blue lines further bracket the
period between November and April
when storage is allowed, according to the
basin plan. These light blue lines persist
throughout Figures 3.2 and 3.3, marking
the time frame when funding applicants
could divert water for storage under the
POF approach.
� How would the State implement a
percent of flow approach? Figure 3.2
shows the average daily flows during
2011 in the Yamhill River at the
McMinnville gage (dark blue line). 2011
was a high water year, with stream gages
measuring a total of 1.5M acre feet of
water passing through this system.
Major rain events occurred during
December and January, and additional
runoff occurred in March, April, and May.
The purple line indicates what
streamflow levels would have measured
if a new water user had been allowed to
divert 15 percent of these flows for
storage. Put another way, the purple line
shows the stream retaining 85 percent of
its flow. Diverting water according to this
method helps retain the shape of the
natural hydrograph and continues to
protect the biological and physical
functions of the stream. It prevents “flat-
Figure 3. Example Percent of Flow Approach on the South Yamhill River
Page 12 A Proposed “Percent of Flow” Approach for Water Storage Projects in Oregon
lining” of the hydrograph. Finally, the black line near the bottom of the figure marks already existing base flow
protections. If the natural streamflow (dark blue line) declined to or below this level, no storage would be
allowed until the flow again rose above the base flow level. The orange line indicates current allocations for
storage.
� What does the hydrograph look like for a low water year? Figure 3.3 shows 2001 natural flows (dark blue
line), the lowest water year on record for this gage. Readings recorded between November and May 2001
showed very low flows. During late November, natural flows (dark blue line) dip below the already existing base
flow protections, eliminating new diversion and storage opportunities during that time period. Because the
diversion is calculated as a percent of flow, years such as 2001 would result in less water instream, and
therefore less or no water available for “percent of flow” projects. Without establishing and protecting a base
flow, water diversions could have an adverse impact on biological and physical habitat conditions instream.
See Appendix D for further scenarios that demonstrate the variability that can occur between natural flows and
the allowable 15 percent of flow diversions.

A Proposed “Percent of Flow” Approach for Water Storage Projects in Oregon Page 13
Recommendation #5. Use the Recommendation #5. Use the Recommendation #5. Use the Recommendation #5. Use the
SSSState approved intate approved intate approved intate approved in----depth depth depth depth assessment framework for assessment framework for assessment framework for assessment framework for
projectprojectprojectprojectssss proposing a departure proposing a departure proposing a departure proposing a departure from the percent of flow from the percent of flow from the percent of flow from the percent of flow
approach.approach.approach.approach.
Chapter 2. More than a Percent of Flow Approach:
In-Depth Methods to Request Additional Water
Instream flow studies must evaluate flow needs and opportunities in terms of hydrology, biology,
geomorphology, water quality, and connectivity. (Instream Flow Council 2008)
The approach described in the previous chapter would allow water users to divert water for storage with very
little time or investment in detailed biological or physical habitat studies. However, water users may want to
access more water than the volumes resulting from the 15 Percent of Flow approach, or they may feel that more
water is available outside of the time periods determined by the 50 percent exceedance criteria.
In such cases, water users may present more in-depth analysis to the Water Resources Department, along with a
well-researched request for water diversions that exceed those allowed with the Percent of Flow approach and
the 50 percent exceedance criteria. This chapter lays out a Seasonally Varying Flows In-Depth Assessment
Framework that would be accepted for consideration but does not provide detailed guidance on the specific
methods of analysis. The level of detail and extent of the proposed analysis will depend upon the specific
request, and each proposal should be reviewed and approved by a technical review committee under the
auspices of the Water Resources Department.
The Seasonally Varying Flows In-Depth Assessment Framework approach is summarized in the following flow
chart, with more detail provided in the text outline that follows. The basis of the In-Depth Assessment
Framework is grounded in the current scientific understanding of relationships between flow regimes and
biological functions and physical processes, specifically those identified in Senate Bill 839. The approach is
based on assessment methods and frameworks that have been developed, promoted, and used by a variety of
researchers and management entities3.
All of these approaches require collection and analysis of hydrological, hydraulic, physical, and biological data
and an understanding of the linkages between flow alteration and these hydrological, hydraulic, physical, and
biological functions. The hydrologic evaluation will describe
differences between natural and altered hydrographs through
an examination of flow regime characteristics (e.g., magnitude,
duration, timing, rate of change, frequency, and inter- and
intra-annual variation). Hydraulic analysis will provide
information on water depths and velocities in the channel and
floodplain, important for habitat conditions and biological
processes. Physical processes include those that form and
maintain stream channels and key elements of habitat for
selected species, transport sediment, and create channel-
3 Examples include Arthington et al. 2006; Poff et al. 2010; King et al. 2008; Texas Instream Flow Program
(http://www.twdb.texas.gov/surfacewater/flows/instream/); Florida Minimum Flows and Levels Program
(http://www.dep.state.fl.us/water/waterpolicy/mfl.htm); Colorado Non-Consumptive Needs Program (Sanderson et al.
2012); https://www.google.com/#q=water+flow+evaluation+tool).
Page 14 A Proposed “Percent of Flow” Approach for Water Storage Projects in Oregon
floodplain connectivity. The biological component includes development of an understanding of relationships
between aquatic communities, life histories, habitat and the hydrology and hydraulics of the system. The
analysis to develop Seasonally Varying Flow components that will protect the biological and physical functions in
watersheds as directed by Senate Bill 839, requires an interdisciplinary, integrated approach. The in-depth
analysis required here follows the direction of Senate Bill 839, but leaves out some of the typical parameters of
such studies. If desired, the full Seasonally Varying Flows Task Force could consider incorporating other
parameters.

A Proposed “Percent of Flow” Approach for Water Storage Projects in Oregon Page 15
Figure 4. Seasonally Varying Flows In-Depth Assessment Framework (for Site-Specific Assessments)
Step 3. Quantitative Analysis, Step 3. Quantitative Analysis, Step 3. Quantitative Analysis, Step 3. Quantitative Analysis, IIIInterpretation, and Integrationnterpretation, and Integrationnterpretation, and Integrationnterpretation, and Integration
Analyze and evaluate Flow-Function response relationships based on site-specific data and modeling, literature, and/or
expert knowledge using accepted methods
Quantify potential impacts of flow alteration on stream functions listed in Step 1.
Test original hypotheses; confirm approach with the State.
Step 2. Step 2. Step 2. Step 2. Compile Data andCompile Data andCompile Data andCompile Data and Conduct EvaluationsConduct EvaluationsConduct EvaluationsConduct Evaluations
Hydrology, e.g.:
- natural and altered hydrographs
- recurrence intervals
- exceedance probabilities
Biology, e.g.:
-migration triggers
-spawning, incubation
-juvenile rearing
-adult fish passage
Physical Processes, e.g.:
- channel flushing, maintenance, forming flows
- floodplain/habitat connectivity flows
- sediment transport flows
Hydraulics, e.g.:
- modeled depths, velocities
- wetted area
- modeled water surface elevations
Step 4. Draft ReportStep 4. Draft ReportStep 4. Draft ReportStep 4. Draft Report
Recommend flows that allow flow alteration while demonstrating full protection of the aquatic ecosystem.
Identify factors addressed, including relevant time blocks.
Include monitoring and evaluation plan.
Draft copy of report to State for review and comment.
Step 5. Step 5. Step 5. Step 5. State State State State Will Review the Report and Respond to the FindingsWill Review the Report and Respond to the FindingsWill Review the Report and Respond to the FindingsWill Review the Report and Respond to the Findings
Step 1. Describe Ecological Context Step 1. Describe Ecological Context Step 1. Describe Ecological Context Step 1. Describe Ecological Context and Identify Analysis Elementsand Identify Analysis Elementsand Identify Analysis Elementsand Identify Analysis Elements
Identify geographic scope, reach location, geomorphic context, target species and other background information
including existing water use and allocation.
Develop hypotheses for Flow-Function or Flow Alteration-Function Relationships for the functions identified in SB 839,
which include but are not limited to: (a) stream channel development and maintenance; (b) connectivity to floodplains;
(c) sediment transport and deposition; (d) migration triggers for upstream movement of adult fish and downstream
movement of fry and juvenile fish; (e) fish spawning and incubation; (f) juvenile fish rearing; and (g) adult fish passage.
Review the hypotheses and proposed assessment methods with the State.
Page 16 A Proposed “Percent of Flow” Approach for Water Storage Projects in Oregon
Recommendation #6. Recommendation #6. Recommendation #6. Recommendation #6.
Establish a Technical Review Establish a Technical Review Establish a Technical Review Establish a Technical Review Team that can help Team that can help Team that can help Team that can help funding funding funding funding
applicants applicants applicants applicants with the review and with the review and with the review and with the review and design of indesign of indesign of indesign of in----depth depth depth depth
assessments.assessments.assessments.assessments.
Recommendation #7. Recommendation #7. Recommendation #7. Recommendation #7. Use Use Use Use
prepreprepre----application meetings that application meetings that application meetings that application meetings that are available to applicants to are available to applicants to are available to applicants to are available to applicants to review and adjust hypotheses review and adjust hypotheses review and adjust hypotheses review and adjust hypotheses
and proposed assessment and proposed assessment and proposed assessment and proposed assessment methods.methods.methods.methods.
The Seasonally Varying Flows In-Depth Assessment Framework includes the following steps, which need to be
further discussed with the Technical Review Team to determine level of detail and extent of analysis. Note that
acronyms and other terms are further defined in the Appendices.
1. Describe Ecological Context and Identify Analysis Elements
a. Compile and evaluate existing information, including:
- stream channel condition (e.g. channel alteration,
erosion/cut banks, sedimentation);
- riparian zone/floodplain condition;
- resident, anadromous fish populations; ESA- or State-
listed species;
- identify related wildlife issues.
b. Determine geographic scope of the study and overall
objectives, such as:
- subject watershed, general information;
- subject stream, general information;
- identify stream segment affected by proposed development;
- describe existing water uses and allocations in the basin, using available information.
c. Identify key species and functions:
- the specific target species to be evaluated including, life stages and periodicity;
- biological functions to be protected (i.e. migration, spawning, rearing, passage);
- physical functions to be protected (i.e. channel development and maintenance, floodplain
connectivity, sediment transport).
d. Develop hypotheses for Flow-Functions or Flow Alteration-
Functions response relationships that will determine the
specific analysis. See Appendix F for example hypotheses
regarding Flow Alteration - Function relationships.
e. Identify data collection and analysis methods to be used.
f. Review proposed approach with State’s Technical Review
Team before proceeding.
2. Compile Data and Conduct Evaluations
a. Hydrology. Hydrologic analysis may be a combination of
streamflow gage analysis and hydrologic modeling, depending on data availability. The approach will
generally involve determining natural and current flow conditions, considering existing allocations, and
understanding how proposed diversions would alter the flow regime. The following hydrologic data
types may be used to complete the final quantitative analysis (taken from Locke and Paul 2011):
1) Recorded daily streamflow data;
2) Precipitation data;
3) Evaporation data;
4) Water use data (diversions and return flows);
5) Reservoir data;
6) Routed daily streamflow data.
Many of these data may be publically available (See Appendix F, “Additional Resources to Conduct In-
Depth Studies”), although the quality of the data must be assessed before use.
Preparation of hydrologic data for use in flow-function quantitative analysis may involve a variety of
analytical methods, for example:
A Proposed “Percent of Flow” Approach for Water Storage Projects in Oregon Page 17
1) Flood frequency analysis (2-, 5-, 10-, 100- year return periods);
2) Flow duration analysis;
3) Evaluation of flow components (magnitude, frequency, duration, timing, rate of change, etc.);
4) Flow naturalization;
5) Hydrologic and statistical modeling including record extension, synthetic hydrograph creation, basin-
wide routing and other input data needed for previously mentioned analyses.
The USGS and WRD have established standards for these analyses. Guidance and documentation can be
found on the agencies’ websites.
b. Hydraulics. Hydraulic analysis is used to determine the relationship between streamflows and water
surface elevations, channel depths, velocities, and wetted area. Approaches and models currently
available for completing this analysis include 1-dimensional models such as HEC-RAS, PHABSIM, DHI
Mike 11; and 2-dimensional models such as River2D, and DHI Mike21. The appropriate model and
analysis will depend on the specific functions to be assessed, as well as data availability. The basic
assessment method includes:
1) Determine approach to be used;
2) Collect data required to build and calibrate the model(s)—channel cross sections or spatial
bathymetry, channel roughness, calibration depths, velocities, water surface elevations, as well as
data from 2a;
3) Develop, calibrate, run and analyze output from models to determine water surface elevations, flow
depths and velocities, wetted area, etc.;
4) Link with field data from 2c and 2d to determine relationships between flow and SVF functions.
c. Physical Processes. A number of physical process functions occur as part of the natural hydrograph, and
these functions must be preserved under a SVF hydrograph. Streamflows that accomplish these
functions can be determined from hydrograph analysis or more in-depth analysis based on empirical
data and hydraulic modeling. Stream channel and floodplain geomorphology reflect the effects of
geomorphic flows that have occurred under the hydrograph for many years. The categories of
geomorphic flows are mentioned below, and are described more fully in Appendix C Definitions.
1) Analyze the natural hydrograph to determine key geomorphic flows, including magnitude, duration,
frequency, and timing for specific functions, e.g,:
a) Flushing flows, often a 1-year recurrence interval peak flow;
b) Channel maintenance flows, often within the 1.5 to 2 year recurrence interval peak flow range;
c) Channel forming flows, 10 to 25 year recurrence interval peak flows;
d) Floodplain connectivity flows - For many systems, this can be approximated by the 10-year
recurrence interval peak flow, but verification that this will accomplish floodplain connectivity is
required;
e) Habitat connectivity flows - Moderately high, generally between mean annual and 1-year
recurrence interval flows.
2) Analyze sediment, using empirical data and hydraulic modeling, e.g.:
a) Collect empirical sediment/substrate distribution data;
b) Use hydraulic modeling methods described in previous section (2b. Hydraulics) to develop the
required metrics for sediment transport analysis;
Page 18 A Proposed “Percent of Flow” Approach for Water Storage Projects in Oregon
c) Relate results of sediment transport analysis to goals for physical processes described above
that form and maintain habitat;
d) Determine flows required to transport relevant sediment classes in terms of magnitude,
duration, frequency, and timing to accomplish geomorphic functions described above.
3) Collect and analyze relevant water quality data, e.g. stream temperature, dissolved oxygen.
d. Biology. Based on the species information identified in 1c, collect data on fish assemblages and
invertebrates within the affected stream segment and evaluate habitat as a function of streamflow. The
basic assessment method includes:
1) Determine approach to be used;
2) Identify study sites;
3) Evaluate habitat requirements, habitat utilization, life history, passage criteria, and other ecological
factors at the reach scale;
4) Identify habitat suitability functions for species/lifestages to be modeled; these would include
depth, velocity, substrate, cover, and temperature suitabilities. Link with hydraulic models from 2b.
5) Identify periodicity for target species/lifestages for time series analysis under 3 below;
6) Identify flows needed to maintain spawning, incubation and rearing, upstream and downstream
migration, passage and connectivity; include species-specific passage criteria (under 2d3 above); use
data from 2a to describe conditions associated with current, historic, and proposed flow regimes.
3. Quantitative Analysis, Interpretation, and Integration
a. Analyze and evaluate flow-function or flow alteration-function response relationships for the entire
range of flows observed from the hydrograph, including base flows and elevated flows based on the
hypotheses identified in 1d.
b. Complete statistical analyses to develop relationships.
c. Identify specific time blocks, describing base flows and elevated flows. Integrate flow/habitat output,
migration and passage flows, channel maintenance flows, floodplain connectivity flows, sediment
transport flows with relevant time periods for time series output.
d. Describe specific SVFs to be protected by time period, magnitude, duration, etc. Include target values
for each flow element.
e. Characterize and quantify potential impacts of development strategies. Propose a flow prescription that
is sufficiently protective of key components of SVF.
f. Review results and interpretation with State.
4. Draft Report
a. Develop a comprehensive document including executive summary, site description, summary of
methods, results, and proposed flow prescription with justification.
b. Include a monitoring and evaluation plan. During the life of the project, on-going monitoring and
reporting will be required to ensure that the project is fulfilling its objectives in protecting key elements
of the hydrograph. Streamflow data collected upstream and downstream of the diversion will allow for
smooth implementation of the flow prescription. Upstream gages will help determine the amount of
water for diversion on a daily basis, and downstream gages will monitor critical elements of the flow
regime identified in the flow prescription. A report of this analysis should be submitted to the Water
Resources Department on some regular basis, to be determined in collaboration with WRD, but at a
minimum of every two years. This monitoring and reporting should be conducted for the life of the
project.
c. Provide a draft copy of the report to the State for review and comment.
5. The State’s Technical Review Team will review the report and respond to the findings.

A Proposed “Percent of Flow” Approach for Water Storage Projects in Oregon Page 19
Chapter 3. Comparing Approaches
Currently in Oregon, applications for a water storage permit are reviewed by the Water Resources Department
to determine whether water is available, using the “50 percent exceedance criteria.” If water is available, the
Department may issue a storage permit for an amount up to the median monthly flow. Any already-existing
water allocations and base flow conditions are subtracted and protected as part of this process. The Oregon
Department of Fish and Wildlife has the option to protect high flows, or peak flows, for channel maintenance
purposes, relying on guidance developed in 2007. Permit conditions written by the Water Resources
Department describe time periods when water cannot be diverted or any other conditions that the State has
placed on the permit.
The approaches proposed in Chapters 1 and 2 were developed for water storage projects seeking funding from
Oregon’s Water Supply Development Account. The approaches build upon the 50 percent exceedance criteria
already used in Oregon, and then—to determine the amount and timing of the diversion—provide a choice
between a simple percent of flow approach, as described in Chapter 1, and a more in-depth approach, as
described in Chapter 2. Figure 5 shows a comparison between the current approach for determining water
availability and the proposed Percent of Flow approach.
Figure 5. Comparison of the Current Approach and the Percent of Flow Approach
Step 1:
Water Availability
Step 2:
Shaping the Diversion
Option
to Request More
Current Approach
Determine whether and,
if so, in which months
water is available using
50 percent exceedance
criteria
Allocate up to median monthly flow,
accounting for existing allocations,
base flow requirements,4 and peak
flow guidance from the Oregon
Department of Fish and Wildlife.
Submit additional data to the Water
Resources Department for consideration.
“Percent of Flow” Approach
Determine whether and,
if so, in which months
water is available using
50 percent exceedance
criteria
Allocate up to 15 percent of daily flow
as described in Chapter 1, accounting
for existing allocations and base flow
requirements4.
Apply Seasonally Varying Flows In-Depth
Assessment Framework from Chapter 2.
4Note that in either case, base flows must be protected when new allocations are requested.

Page 20 A Proposed “Percent of Flow” Approach for Water Storage Projects in Oregon
Recommendation #8. Recommendation #8. Recommendation #8. Recommendation #8.
Conduct a pilot program, Conduct a pilot program, Conduct a pilot program, Conduct a pilot program, monitoring conditions in monitoring conditions in monitoring conditions in monitoring conditions in
projects that are early projects that are early projects that are early projects that are early adopters, in order to evaluate adopters, in order to evaluate adopters, in order to evaluate adopters, in order to evaluate
the effectiveness of this the effectiveness of this the effectiveness of this the effectiveness of this approach.approach.approach.approach.
Ongoing Need for Monitoring
While the percent of flow approach to allocating water has been utilized in other jurisdictions, it remains a
relatively new method for preserving critical elements of seasonally varying flows and associated ecological
functions. It is a precautionary approach that provides a pathway for decision-makers, allowing the diversion of
water for storage without jeopardizing critical physical and biological processes.
While it is expected that this approach will protect the natural
variability within the hydrograph, much uncertainty still exists about
how that variability may be related to key ecological functions. For
example, are relationships basically linear or are there key
thresholds beyond which we see a significant loss in physical and
biological function? In order to ensure that this approach provides
the expected ecological protection, it will be essential to establish
on-going monitoring of both hydrological and ecological conditions.
While pursing economic development opportunities that come with
water storage, the State must continue to monitor, evaluate, and
protect the streamflows that support critical ecological functions.
The Oregon Legislature has recognized the importance of protecting
key elements of the natural flow regime, while developing additional
water storage projects for its communities.
The science subgroup therefore recommends that the State conduct a pilot program early in the
implementation process to monitor the results of this approach.

A Proposed “Percent of Flow” Approach for Water Storage Projects in Oregon Page 21
Conclusion. Observations and Recommendations
Instream flow prescriptions must maintain spatially complex and diverse habitats,
which are available through all seasons.
(Instream Flow Council 2008)
The link between natural flow variability and the integrity of freshwater ecosystems is well established. Many
ecosystem services provided by healthy rivers and streams depend on the natural flow regime. Human use of
this water can disrupt key elements of natural flows by altering the magnitude, frequency, timing, duration, and
rate of change of flow in streams. These changes in flow regime are contributing to the degradation of natural
physical and biological processes in streams that support habitat and species persistence. However, the exact
relationships between flow and ecological processes are not well understood. Despite the widespread
acceptance of the importance of the natural flow regime, the determination of specific flow levels needed for
target physical and biological processes remains a daunting task. Great uncertainties are associated with the
question, "How much can we change the flow regime before we see a detrimental impact to stream
ecosystems?"
This report represents the science subgroup’s recommended solution to the present state of uncertainty in
managing environmental flows. The percent of flow method for allocating water withdrawals essentially
provides a precautionary approach that is protective of the natural variability within the hydrograph, and is
presumed to be protective of the ecology. It should be stressed that ongoing monitoring of the effects of this
approach is a critical component of this program.
The State should be prepared to conduct a pilot monitoring program to evaluate the effectiveness of this
approach, with details to be determined based on the specific storage project.
Summary of Recommendations
• Recommendation #1. Use the Department’s water availability model and 50 percent exceedance criteria to
determine whether water is available for storage, and during which months.
• Recommendation #2. Establish base flows as a lower protective threshold, below which no withdrawals can
occur.
• Recommendation #3. Use a “percent of flow” approach as a simple tool to shape the timing and quantity of
diversions.
• Recommendation #4. Install stream gages or other measuring equipment, according to Department
specifications, to monitor and manage the system.
• Recommendation #5. Use the State approved in-depth assessment framework for projects proposing a
departure from the percent of flow approach.
Page 22 A Proposed “Percent of Flow” Approach for Water Storage Projects in Oregon
• Recommendation #6. Establish a Technical Review Team that can help funding applicants with the review
and design of in-depth assessments.
• Recommendation #7. Use pre-application meetings that are available to applicants to review and adjust
hypotheses and proposed assessment methods.
• Recommendation #8. Conduct a pilot program, monitoring conditions in projects that are early adopters, in
order to evaluate the effectiveness of this approach.

A Proposed “Percent of Flow” Approach for Water Storage Projects in Oregon Page 23
Appendix A. Acknowledgements
Convenor:
Mr. Brett Brownscombe, Natural Resources Policy Advisor, Office of Governor John Kitzhaber
Special thanks to the Science Subgroup members who provided their time and expertise to develop this report.
Members included:
Mr. Don Anglin, U.S. Fish and Wildlife Service
Dr. Leslie Bach, The Nature Conservancy
Dr. Tim Hardin, Oregon Department of Fish and Wildlife
Dr. Valerie Kelly, U.S. Geological Survey
Mr. Ken Stahr, Oregon Water Resources Department
Staff:
Dr. Brenda Bateman, Technical Services Administrator, Oregon Water Resources Department
Ms. Racquel Rancier, Senior Policy Coordinator, Oregon Water Resources Department
Ms. Rachel LovellFord, Hydrologist, Oregon Water Resources Department
Ms. Erin Oost, Hydrologist, Oregon Water Resources Department
Ms. Alyssa Mucken, Integrated Water Resources Strategy Coordinator, Oregon Water Resources Department
Ms. Arla Heard, Administrative Specialist, Oregon Water Resources Department
Ms. Sheila Buchholz, Office Specialist, Oregon Water Resources Department

Page 24 A Proposed “Percent of Flow” Approach for Water Storage Projects in Oregon
Appendix B. Acronyms
af acre-feet
BC British Columbia
cfs cubic feet per second
DLCD Department of Land Conservation and Development
ESA Endangered Species Act
HEC-RAS Hydrologic Engineering Centers’ River Analysis System
HEC-RPT Hydrologic Engineering Centers’ Regime Prescription Tool
IFIM Instream Flow Incremental Methodology
NWS National Weather Service
OAR Oregon Administrative Rule
ODFW Oregon Department of Fish and Wildlife
ORS Oregon Revised Statute
PHABSIM Physical Habitat Simulation
POF Percent of Flow
SB Senate Bill
SEFA System for Environmental Flow Analysis
SVF Seasonally Varying Flows
TF Task Force
TNC The Nature Conservancy
USACE U.S. Army Corps of Engineers
USBR U.S. Bureau of Reclamation
USFWS U.S. Fish and Wildlife Service
USGS U.S. Geological Survey
WRC Water Resources Commission
WRD Water Resources Department
WUA Weighted Usable Area

A Proposed “Percent of Flow” Approach for Water Storage Projects in Oregon Page 25
Appendix C. Definitions
50% Exceedance Criteria The Water Resources Department generally evaluates water availability for
storage at the estimated natural median (50 percent exceedance) flow for any
given month. Staff then subtracts already-existing water rights, including
instream rights, from that median flow to determine whether there is still water
available for storage, and how much.
Adult Fish Passage Adult fish passage is required for both local and long distance migrations and
movements. Migrations or local movements are typically associated with
spawning, overwintering, feeding, and/or location of seasonal suitable habitats.
There are numerous sources of information describing species-specific passage
requirements, particularly, depths and velocities. In addition to depth and
velocity criteria, both total and continuous percentages of cross section width
that meet the criteria are usually specified (Thompson 1972, Bovee 1974, White
1975). Streamflows that provide target passage conditions are a function of the
stream channel morphology, slope, and hydraulic characteristics.
Assemblage All of the various species that exist in a particular habitat.
Aquatic Life All organisms living in or on the water. This includes plants from the smallest
phytoplankton through algae, periphyton, and emergent vegetation as well as
animal life from zooplankton through benthic invertebrates, fishes, and
amphibians, reptiles, birds, and mammals.
Base Flows These flows are defined in order to be sufficient in volume for rearing and
spawning for key species over long periods of time, as well as sufficient to
overcome the potential for threats to aquatic life from harmful pollutants or
stream heating. Base flows, as a component of seasonally varying flows, must
be protected throughout this process.
Connectivity Maintenance of lateral, longitudinal, and vertical pathways for biological,
hydrological, and physical processes.
Fish Spawning and Incubation The physical and hydraulic conditions required or preferred for spawning vary
by species. Relevant components include depth, velocity, substrate, and water
temperature. Depths, velocities, and the corresponding streamflows required
for spawning are species or guild-specific. The incubation period spans the time
from egg fertilization to hatching of the fry and is variable among species.
Floodplain Connectivity Flows These fall within the upper range of channel forming flows. Verification that the
10-year recurrence interval peak flow will accomplish floodplain connectivity is
required, and may be possible using existing data. If existing data are not
available, topographic surveys and stage-discharge relationships would be
needed to determine streamflows required to establish floodplain connectivity.
Page 26 A Proposed “Percent of Flow” Approach for Water Storage Projects in Oregon
Habitat Connectivity Flows These flows, for side channels and other important off-channel habitats, are a
key part of seasonally varying flows. Recent studies in major tributaries of the
Willamette River have shown that ESA and State-listed species such as Chinook
salmon and Oregon chub thrive in side channels and ponds that maintain a
hydraulic connection with the main channel over relatively long periods each
year. These habitats have been topographically mapped, and their connectivity
monitored in relation to fish populations (Bangs 2014). Flows needed to
connect these habitats in the Willamette Basin are variable, and appear to fall
between mean annual flow and one-year recurrence. The timing and duration
of connectivity flows should follow the shape of the naturally occurring
hydrograph, and may require the input of fishery experts to determine
requirements for local conditions.
Hydrologic Engineering Centers’ U.S. Army Corps of Engineers’ 1-D hydraulic modeling software, often used to
River Analysis System determine water levels needed for overbank flow and other water level related
(HEC-RAS) analysis.
Hydrologic Engineering Centers’ Software designed to facilitate entry, viewing, and documentation of flow
Regime Prescription Tool recommendations in real-time, public settings. Not intended to perform
(HEC-RPT) detailed quantitative analysis, but to complement other HEC software (including
reservoir system simulation, river hydraulics, and ecosystem functions) by
making it easier to create flow time series that can then be imported and used
in analysis.
Instream Flow Incremental A problem-solving approach for quantifying the benefits and impacts to aquatic
Methodology (IFIM) resources as a function of incremental flow changes. IFIM analyses may include
geomorphology, temperature, riparian vegetation, and many other factors. The
PHABSIM model, a subset of IFIM used for quantifying fish habitat, is defined
below.
Irrigation Season The “irrigation season” is defined in Oregon’s Basin Plans, in adjudication
decrees, and by administrative rules, spelling out an exact time period when
water may be appropriated and directly applied to agricultural lands. For
example, some areas of the Willamette Valley have their irrigation seasons
defined as April 1 through September 30, while other areas are limited to May 1
through September 30. Some basin plans define the irrigation season as any
time water can be put to beneficial use, while other plans do not define the
irrigation season at all. The “storage season” is generally considered to be any
time outside of the irrigation season.
Juvenile Fish Rearing The juvenile lifestage begins with external feeding and continues until the
subadult lifestage begins and/or until sexual maturity has occurred. Food
consumption, growth, and survival are the primary factors for rearing juvenile
fish. During this time period, rearing fish use a wide variety of habitats, which
may be different for feeding, growing, resting, or avoiding predators. The
physical and hydraulic conditions required or preferred by rearing juvenile fish
vary by species. Relevant components include depth, velocity, substrate, cover,
and water temperature. Depths, velocities, and the corresponding streamflows
required for rearing are species or guild specific.
A Proposed “Percent of Flow” Approach for Water Storage Projects in Oregon Page 27
Measured Flow Discharge that is measured instantaneously and not averaged over longer time
periods such as days, weeks, or months. Instream flow values are generally
designated in cubic feet per second (cfs), but regardless of the unit of measure,
they are typically not reported as an average discharge rate over time.
Migration Trigger Initiates upstream movement of adult fish and downstream movement of fry
and juvenile fish. Life histories of most resident and anadromous fish include
local and/or long distance migrations to satisfy rearing, growth, and spawning
functions. In some cases, these migrations have been associated with changes
in streamflow. When this is the case, the timing, or predictability of flow events
can be critical, ecologically, because the life cycles of many aquatic and riparian
species are timed to either avoid or exploit flows of variable magnitudes (Poff et
al. 1997). Increasing flows have been observed to initiate upstream and
downstream migrations, elevated flows have been observed to initiate
spawning activity, and elevated flows allow access to floodplain and side
channel habitats (Robison et al. 2010). Downstream juvenile migration of
salmon and steelhead has been positively correlated with streamflows in the
Columbia and Willamette basins (Friesen and Buckman 2003). The natural
timing of high or low streamflows provides environmental cues for initiating life
cycle transitions in fish, such as spawning (Montgomery et al. 1983, Nesler et al.
1988), egg hatching (Naesje et al. 1995), rearing (Seegrist and Gard 1972),
movement onto the floodplain for feeding or reproduction (Junk et al. 1989,
Sparks 1995, Welcomme 1992), or migration upstream or downstream
(Trepanier et al. 1996, Poff et al. 1997). In some cases, these biological
“triggering” flows have been estimated based on correlations between fish
movement and changes in streamflow.
Natural Flow Flow in rivers and streams that would have occurred prior to man-made
impacts, or regulation. In affected systems, natural flow is a calculated value
based on the recorded flows of contributing rivers; physical factors concerning
the reach (for example, evaporation, and channel losses); water diversions;
consumptive use; and return flow. In pristine environments, natural flows equal
recorded flows.
Percent of Flow Method An approach that determines the appropriate levels of allowable flow depletion
expressed as a percent reduction from natural flow according to a stated
objective for the river, for example, full protection of the aquatic ecosystem.
Physical Habitat Simulation Set of programs to predict the microhabitat conditions in rivers as a function of
(PHABSIM) streamflow, and the relative suitability of those conditions to aquatic life.
PHABSIM is a subset of IFIM, defined above.
River2D Two-dimensional depth averaged finite element hydrodynamic model. River2D
has been customized for fish habitat evaluation studies, and similar to PHABSIM,
it predicts suitable microhabitat conditions as a function of streamflow, but uses
detailed, reach-based bed topography rather than cross-sections.
Page 28 A Proposed “Percent of Flow” Approach for Water Storage Projects in Oregon
Seasonally Varying Flows As defined in Senate Bill 839 – means the duration, timing, frequency and
volume of flows, identified for the purpose of determining conditions for a new
or expanded storage project, that must remain instream outside of the official
irrigation season in order to protect and maintain the biological, ecological and
physical functions of the watershed downstream of the point of diversion, with
due regard given to the need for balancing the functions against the need to
store water for multiple purposes.
Sediment Transport Sediment transport is a geomorphic process that roughly maintains a dynamic
and Deposition equilibrium between the sediment supplied to a stream or watershed and the
sediment transported out of the system. This equilibrium is required to
maintain the channel morphology (with variation) and physical habitat of the
stream channel. Fine sediments that enter the system are typically transported
downstream during high flows as suspended sediment and deposited on
floodplains, in estuaries, or in backwater/off-channel areas. Fine sediment
transport is important for maintaining the function of spawning gravels and for
providing a productive habitat for invertebrate production. Coarser sediments
and bedload are also transported downstream during high flow events, but are
typically deposited within the stream system because of their larger sizes. The
redistribution of coarse sediments removes accumulations from tributaries in
mainstem channels, replenishes spawning substrates, and maintains the
physical complexity of the substrate and associated physical habitat for fish and
invertebrates. Streamflows that facilitate sediment transport and deposition
are a function of sediment size, stream channel morphology, slope, and water
column hydraulics.
Stream Channel Development These flows are elevated streamflows that create or maintain stream
and Maintenance Flows morphology, channel form, and physical habitat. These flows provide the
necessary scour of the stream channel to reshape alluvial features and maintain
healthy streamside vegetation. They are important for bank
erosion/deposition, gravel bar formation, wood recruitment, prevention of
vegetation encroachment in the channel, and maintenance of general channel
form (IFC 2008). At this flow level, bedload movement of gravels and cobbles
occurs and fines at deeper levels in the streambed are scoured away. These
flows are higher flows and less frequent than flushing flows. Occurring naturally
in an unaltered watershed, they can be observed in the natural hydrograph.
Channel development and maintenance flows typically include flushing flows for
in-channel functions, channel maintenance flows for in-channel and riparian
functions, and channel forming flows for side-channel and floodplain functions.
Schmidt and Potyondy (2004) estimated the channel maintenance flow as 0.8-
1.0 of bankfull discharge, or the discharge that has a recurrence interval
between one and two years. The ODFW guidance (Robison 2007) gives basic
requirements for calculating flows for channel maintenance.
Stream Channel Flushing Flows Regularly recurring streamflows with sufficient power to “flush” finer sediments
(silt, sand) and organic matter from the interstitial spaces between larger
gravel/cobble substrates, and from pools and other slower-velocity rearing
areas. These flows help to renew the spawning and incubation functions of the
substrate and maintain the complexity of rearing areas. Flushing flows have
A Proposed “Percent of Flow” Approach for Water Storage Projects in Oregon Page 29
been approximated by a number of methods, but they are most commonly
described as a function of mean annual discharge or bankfull discharge. Wald
(2009) recommends mean annual discharge as a flushing flow level, and Schmidt
and Potyondy (2004) cite about 40 percent of bankfull flow, which roughly
translates to the one-year recurrence interval peak flow. The recommended
duration for flushing flows ranges from 6-12 hours (Wald 2009) to a duration
that reflects the pattern of the natural hydrograph, and several times per year.
Stream Channel Forming Flows These flows form and maintain side channels, scour floodplain surfaces,
redistribute sediment, refill off-channel wetlands and oxbow lakes, and
recharge groundwater storage in hyporheic and floodplain aquifers (Trush et al.
2000). Wald (2009) recommends the 10-year recurrence interval peak flow,
and Schmidt and Potyondy (2004) set the 25-year recurrence interval peak flow
as a “cap” to accomplish channel forming and riparian functions, while limiting
the consequences of flood damage. The timing and duration of channel forming
flow events should follow the shape of the naturally occurring hydrograph; they
are higher flows that are less frequent than channel maintenance flows. These
flows are generally applicable only to stable, alluvial streams that have the
ability to change their shape and are neither aggrading nor degrading. They are
often referred to as the bankfull flow, dominant flow, or effective flow.
System for Environmental Software that supports the Instream Flow Incremental Methodology (IFIM).
Flow Analysis (SEFA) SEFA includes PHABSIM, and also has components for hydrologic analysis, water
temperature modeling, habitat selectivity criteria development, sediment scour,
transport and deposition analysis, riparian habitat evaluation, and habitat time
series analysis.
Water Year A time period of 12 months for which runoff totals are measured. The
beginning and end of the water year differs from the calendar year because part
of the precipitation that falls in late autumn and winter accumulates as snow
and does not run off until the following spring or summer's snowmelt. In
Oregon, the water year runs from October 1 to September 30, and is designated
by the calendar year in which it ends.

Page 30 A Proposed “Percent of Flow” Approach for Water Storage Projects in Oregon
Appendix D. Sample Percent of Flow Hydrographs
The following hydrographs from the Grande Ronde, Powder, and Rogue rivers, together with the Yamhill
example in Chapter 1, highlight the geographic and hydrologic variability found within Oregon. Additionally, the
selected sites show different levels of water availability and use. The combination of irrigation season, current
allocation, base flow, and measured flow determines how much water is available for storage under the percent
of flow approach in any given water year and at what time. Each selected river system is represented by three
hydrographs: 1) mean daily flow over the period of record (see graph legend), 2) mean daily flow for the 2011
high flow water year and 3) mean daily flow for the 2001 low flow water year.

A Proposed “Percent of Flow” Approach for Water Storage Projects in Oregon Page 31
Figure 6. Example Percent of Flow Approach in the Grande Ronde River Basin
The Grande Ronde River
� Average Basin Conditions. In the
Grande Ronde River near Perry,
Oregon, spring rain and a snowmelt
peak occur frequently from March
through June as shown by the long-
term average streamflow (Figure 6.1,
dark green line). The 50 percent
exceedance criteria (light green line)
signals that historically, water has
been available for storage from
December through July, with the
greatest volume of water expected
during the month of May. This water
availability line, along with the light
blue lines marking the non-irrigation
season, demarcates the time of year
when water users may divert and
store water using the percent of flow
approach. The irrigation season is
determined within the Grande
Ronde by administrative order to be
the time period, “…when [irrigation
is] necessary for beneficial use in
connection with irrigation of their
respective lands.”
� Example High Flow Year. 2011 was
a high flow year, with high
precipitation events in January, April,
and May, and runoff from snowmelt
coming in June (Figure 6.2, dark blue
line). The accompanying purple
hydrograph delineates the 85
percent of streamflow that stays in
the stream under the “percent of
flow” approach. Base flow
protection (black line) within the
Grande Ronde at this site is generally
far below the 2011 flow levels and
there are opportunities for current
storage allocations (orange line) to
be met. In 2011, 15 percent of the
natural flow (difference between
dark blue and purple lines), minus
the small existing allocations, could
likely be diverted during the entire
December 1 to June 30 period.
Page 32 A Proposed “Percent of Flow” Approach for Water Storage Projects in Oregon
� Example Low Flow Year. Figure 6.3 features 2001 streamflows (dark blue line), which were among the lowest
on record. Toward the end of May, the “85 percent” (purple line) drops below the base flow protection (black
line), effectively ending storage opportunities through the end of the non-irrigation season. Despite the low
flow conditions in 2001, current allocations within the basin likely would not restrict storage opportunities until
the end of May, when flows drop below the base flow protection level. Current allocations represent a very low
percentage of the total flow.

A Proposed “Percent of Flow” Approach for Water Storage Projects in Oregon Page 33
Figure 7. Example Percent of Flow Approach in the Powder River Basin
The Powder River
� Average Basin Conditions. The
Powder River near Sumpter, Oregon
shows a similar snowmelt peak in May
and June but lacks early spring rain,
giving the Powder’s long-term average
hydrograph a relatively narrow spring
peak (Figure 7.1, dark green line). The
non-irrigation season is again defined
based on “beneficial use” instead of
specific dates. The 50 percent
exceedance criteria (light green line),
identifies April as the only month
available to new water users for stored
water. This greatly limits the time of
year when water for storage is available
within the basin (bracketed by light blue
lines).
� Example High Flow Year. The Powder
River experienced high flows in 2011,
with the greatest flows occurring in May
and June (Figure 7.2, dark blue line).
Gages measured a total of 81,000 acre
feet of water in the system during 2011.
Again, the hydrograph shows the 85
percent of streamflow that would stay
instream (purple line) under the
“percent of flow” approach during April.
The measured values do not drop below
the base flow protection levels (black
line) during the month of April, so water
would be available for storage during
the entire non-irrigation season. Note
that previous allocations (orange line)
during April are relatively high, and may
affect the ability of subsequent water
users to withdraw water under the
proposed “percent of flow” approach.
Figure 7.2 is a prime example of a
scenario in which water users may feel
there is additional water available
outside of the storage time period the
state has identified (see dark blue
hydrograph during May, June, and July).
In this case, the science subgroup
recommends using an “In-Depth
Page 34 A Proposed “Percent of Flow” Approach for Water Storage Projects in Oregon
Assessment Framework,” by which water users can present data requesting more diversion of water, while still
demonstrating full protection of the aquatic ecosystem.
� Example Low Flow Year. Finally, Figure 7.3 features substantially lower 2001 streamflows (dark blue line).
Recall that April is the only month identified as having water available. Because the 85 percent flow values
(purple line) fall below the base flow protection level (black line) during most of the month of April, storage
could only occur at the start and end of the month. It is again notable that prior allocation levels (orange line)
would likely preclude new water storage from using the “percent of flow” method in this year.

A Proposed “Percent of Flow” Approach for Water Storage Projects in Oregon Page 35
Figure 8. Example Percent of Flow Approach in the Rogue River Basin
The Rogue River
� Average Basin Conditions. The dark
green line in Figure 8.1 represents the
long-term average daily flow for the
Rogue River near Prospect, Oregon.
The 50 percent exceedance criteria
(light green line) shows available
water between December and June.
However, the light blue lines further
restrict when storage is allowed
because of how administrative rules
for the Rogue River Basin define the
irrigation season; adhering to Senate
Bill 839 would limit funding applicants
using the “percent of flow” approach
to water diversions between
December 1 and March 31.
Applicants could use the “In-Depth
Assessment Framework” to apply for
storage rights for additional water.
� Example High Flow Year. Gages
measured 1,250,000 acre feet of
water in the Rogue River during 2011
(Figure 8.2, dark blue line). The
highest flows were recorded during
the months of December and January.
The hydrograph shows 85 percent of
flow staying instream (purple line)
under a 15 “percent of flow”
approach.
Also displayed is an orange line,
depicting water already allocated in
the system, approximately 203,000
acre feet. These existing allocations
would affect the ability of new water
users to withdraw water under the
proposed “percent of flow” approach.
Finally, the black line displays the base
flow protection levels for this reach of
the Rogue.
� Example Low Flow Year. Figure 8.3
features the 2001 flow (dark blue
line), which was low, staying below
4,000 acre feet per day. Under the
percent of flow approach, water users
would be limited to withdrawals

Page 36 A Proposed “Percent of Flow” Approach for Water Storage Projects in Oregon
during the periods when the 85 percent line did not drop below the base flow requirements (black line). In
2001, storage opportunities would have been limited between the start of December and mid-March with the
greatest opportunities for storage at the end of March. There would also be restrictions triggered by the fact
that significant allocations (orange line) already exist in this system.

A Proposed “Percent of Flow” Approach for Water Storage Projects in Oregon Page 37
Appendix E. Two Examples of the “Percent of Flow” Approach:
Alberta and British Columbia
Province of Alberta. The Canadian Province of Alberta recognized the need to protect its aquatic resources in
light of increasing demands on water resources by other users. Alberta also recognized that an important
aspect of aquatic resource protection included maintaining the characteristics of the natural hydrograph
reflected by seasonally varying flows. Since site-specific, detailed studies were not available in most areas,
Alberta developed a science-based method to establish flow recommendations to provide full protection to
rivers and streams (Locke and Paul 2011). The method is based on current scientific understanding of aquatic
ecosystems, the current scientific literature on the science of instream flow needs, and a review of numerous
site-specific studies carried out in Alberta and other jurisdictions around the world. The rationale behind the
method is that by maintaining water quantity within the stream and also the natural streamflow fluctuations
that occur including peak events, there is a very low probability of ecological effects to the aquatic environment.
Alberta used fish habitat reduction thresholds based on a review of a number of metrics and studies (Clipperton
et al. 2002) to evaluate the effects of a range of flow reduction scenarios in 24 stream reaches in Alberta. The
percent reduction from natural flows that did not violate habitat reduction thresholds was identified for each
stream, and the most common reductions fell in the 15 – 30 percent range. Alberta’s conclusion was that “given
the uncertainty of the science, plus a desire to protect the aquatic ecosystem, the most conservative percent of
flow reduction from all studies carried out in Alberta to date is recommended” (Locke and Paul 2011).
In Alberta, the percent of natural flow for allocation was set at 15 percent instantaneous reduction from natural
flow. In addition to the recommended allowable flow reduction of 15 percent of the natural, unaltered flow,
Alberta’s method also establishes an ecosystem base flow. The allowable flow reduction (15 percent of the
natural, unaltered streamflow), along with the ecosystem base flow, was developed based on limiting fish
habitat reductions, limiting riparian vegetation recruitment reductions, and limiting changes to the magnitude,
frequency, and duration of channel-forming flows.
Province of British Columbia. The Canadian Province of British Columbia (BC) identified a need to determine
how much water could be extracted from any particular stream in light of an array of proposed water uses
(Hatfield 2004). They adopted the “natural flow regime” approach that consists of quantitatively describing and
preserving key aspects of the natural hydrograph (Poff et al. 1997; Richter et al. 1996, 1997; Trush et al. 2000).
The presumption is that preserving key aspects of the natural hydrograph is the most likely approach to
maintain the physical aspects of streams on which fish and other ecosystem components depend. They
developed a two-tier process that included a low-risk, coarse screening tier, and a more detailed, in-depth
assessment tier. BC proposed that the coarse screening tier would be used in the absence of detailed physical
and biological information. For proposals that include a higher level of water diversion and use than
recommended by the coarse screening tier method, the in-depth assessment tier methods would be required.
BC developed a process for the coarse screening tier to calculate seasonally adjusted thresholds for alterations
to natural streamflows that were expected to result in low risk to fish, fish habitat, and productive capacity. The
process for determining streamflow thresholds was developed with the input of biologists, hydrologists, and
water managers from provincial, federal, and private sector groups, and makes use of the best available
technical and scientific information in order to be as rigorous and defensible as possible. They used basic
information on biology and hydrology to predict a schedule of instream flow requirements that protect available

Page 38 A Proposed “Percent of Flow” Approach for Water Storage Projects in Oregon
habitat for fish, and provide for necessary ecological functions. In addition, their process for determining
streamflows relates to the natural availability and variability of water in the stream, and by design, results in low
risk thresholds. BC concluded that effective risk management required the setting of conservative criteria,
coupled with a commitment to a strong monitoring program to ensure that conservation goals were being met.
BC’s process focuses on preserving key features of the natural hydrograph, since it is these features that are
responsible for maintaining fish habitat in alluvial streams (Trush et al. 2000). Streamflows that are calculated
using the BC process are intended to maintain connectivity, protect low flow periods, and provide high flow
events to maintain gross stream morphology and instream and riparian habitat. BC quantified the effect of
application of their coarse screening method in terms of percent of flow for 19 test streams in the province.
Results indicated that the coarse screening method allows for reductions of 12 to 32 percent of flow.

A Proposed “Percent of Flow” Approach for Water Storage Projects in Oregon Page 39
Appendix F. Additional Resources to Conduct In-Depth Studies
Figure 9. Example Flow Alteration – Function Relationships
Primary Flow
Alteration Predicted Functional Response
Decreased duration
of floodplain
inundation
• Decreased abundance of young fish
• Change in juvenile fish assemblage (all the various species that exist in a habitat)
• Loss of floodplain specialists in mollusk assemblage
• Reduced growth rate or mortality
• Altered assemblages
• Desertification of species populations
• Reduced area of riparian plan or forest cover
• Increase in abundance of non-natives
Shifts in seasonality
of peak flows
• Disruption of spawning cues
• Decreased reproduction and recruitment
• Change in assemblage structure
Loss of seasonal flow
peaks
• Reduced riparian plant recruitment
• Invasion of exotic riparian plant species
• Vegetation encroachment into channels
• Reduced plant growth and increased mortality
• Reduction in species richness and plant cover
Reduced variability • Increase in crayfish abundance
• Increase in schistosomiasis
Increased variability • Decreased germination survival and growth of plants
• Decreased abundance and change in species assemblage of waterbirds
Loss of extreme high
and / or low flows
• Loss of sensitive species
• Reduced diversity
• Altered assemblages and dominant taxa
• Reduced abundance
• Increase in non-natives
Greater magnitude of
extreme high and / or
low flows
• Life-cycle disruption
• Reduced species richness
• Altered assemblages and abundance of taxa
• Loss of sensitive species
Decreased frequency
of peak flows
• Reduced reproduction
• Decreased abundance or extirpation of native fish
• Decreased richness of endemic and sensitive species
• Reduced habitat for young fish
• Shift in community composition
• Reduction in species richness
• Increase in wood production
Adapted from Poff et al. 2010
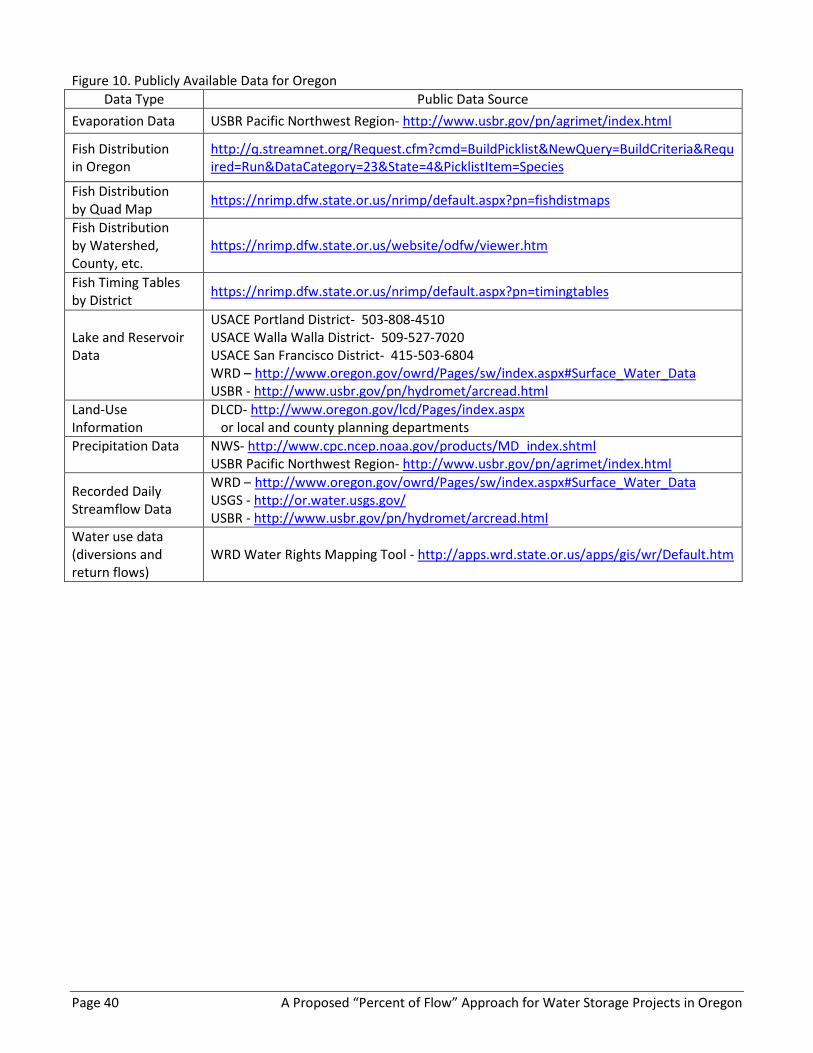
Page 40 A Proposed “Percent of Flow” Approach for Water Storage Projects in Oregon
Figure 10. Publicly Available Data for Oregon
Data Type Public Data Source
Evaporation Data USBR Pacific Northwest Region- http://www.usbr.gov/pn/agrimet/index.html
Fish Distribution
in Oregon
http://q.streamnet.org/Request.cfm?cmd=BuildPicklist&NewQuery=BuildCriteria&Requ
ired=Run&DataCategory=23&State=4&PicklistItem=Species
Fish Distribution
by Quad Map https://nrimp.dfw.state.or.us/nrimp/default.aspx?pn=fishdistmaps
Fish Distribution
by Watershed,
County, etc.
https://nrimp.dfw.state.or.us/website/odfw/viewer.htm
Fish Timing Tables
by District https://nrimp.dfw.state.or.us/nrimp/default.aspx?pn=timingtables
Lake and Reservoir
Data
USACE Portland District- 503-808-4510
USACE Walla Walla District- 509-527-7020
USACE San Francisco District- 415-503-6804
WRD – http://www.oregon.gov/owrd/Pages/sw/index.aspx#Surface_Water_Data
USBR - http://www.usbr.gov/pn/hydromet/arcread.html
Land-Use
Information
DLCD- http://www.oregon.gov/lcd/Pages/index.aspx
or local and county planning departments
Precipitation Data
NWS- http://www.cpc.ncep.noaa.gov/products/MD_index.shtml
USBR Pacific Northwest Region- http://www.usbr.gov/pn/agrimet/index.html
Recorded Daily
Streamflow Data
WRD – http://www.oregon.gov/owrd/Pages/sw/index.aspx#Surface_Water_Data
USGS - http://or.water.usgs.gov/
USBR - http://www.usbr.gov/pn/hydromet/arcread.html
Water use data
(diversions and
return flows)
WRD Water Rights Mapping Tool - http://apps.wrd.state.or.us/apps/gis/wr/Default.htm
A Proposed “Percent of Flow” Approach for Water Storage Projects in Oregon Page 41
Appendix G. References
Acreman, M. C., and Ferguson, A. J. D. 2010. Environmental Flows and the European Water Framework Directive.
Freshwater Biology, 55(1), pp.32–48.
Annear, T. C., Chisholm, I., Beecher, H., Locke, A., Aarrestad, P., Coomer, C., Estes, C., Hunt, J., Jacobson, R., Jobsis,
G., Kauffman, J., Marshall, J., Mayes, K., Smith, G.,Wentworth,R, and Stalnaker, C. 2004. Instream Flows for
Riverine Resource Stewardship. Cheyenne, Wyo.: Instream Flow Council.
Arthington, A. H., Bunn, S. E., Poff, N. L., and Naiman, R. J. 2006. The Challenge of Providing Environmental Flow
Rules to Sustain River Ecosystems. Ecological Applications, 16(4), pp.1311–1318.
Bangs, B. L., Scheerer, P.D., and Clements, S. 2014. . Effects of U.S. Army Corps of Engineers Willamette Project
Operations on Oregon Chub and Other Floodplain Fishes. Corvallis, OR: Oregon Department of Fish and
Wildlife.
Bovee, K. D. 1974. The Determination, Assessment, and Design of in-Stream Value Studies for the Northern Great
Plains Region; Final Report. University of Montana, p.204.
Bunn, S. E., and Arthington, A. H. 2002. Basic Principles and Ecological Consequences of Altered Flow Regimes for
Aquatic Biodiversity. Environmental Management, 30(4), pp.492–507.
Clipperton, G. K., Courtney, R. F., Hardin, T. S., Locke, A. G. H., and Walder, G. L. 2002. Highwood River Instream
Flow Needs Technical Working Group Final Report. Alberta Transportation, p.157.
Friesen, T. A. and M. Buckman. 2003. Summary of Flow and Temperature Analysis for Willamette River Wild
Winter Steelhead.
Hatfield, T., Lewis, A., Ohlson, D., and Bradford, M. 2004. Development of Instream Flow Thresholds as Guidelines
for Reviewing Proposed Water Uses. Victoria, B.C.: British Columbia Ministry of Sustainable Resource
Management and British Columbia Ministry of Water, Land, and Air Protection, p.88.
Junk, W. J., Bayley, P. B., and Sparks, R. E. 1989. The Flood Pulse Concept in River-Floodplain Systems. Canadian
Special Publication of Fisheries and Aquatic Sciences, (106), pp.110–127.
Kelly, M., Munson, A., Morales, J., and Leeper, D. 2010. Proposed Minimum Flows and Levels for the Middle
Segment of the Peace River, from Zolfo Springs to Arcadia. Ecologic Evaluation Section, Resource
Conservation and Development, Southwest Florida Water Management District, p.91.
Kelly, M., Munson, A., Morales, J., and Leeper, D. 2010a. Alafia River Minimum Flows and Levels; Freshwater
Segment. Ecologic Evaluation Section, Resource Conservation and Development, Southwest Florida Water
Management District, p.235.
Kelly, M., Munson, A., Morales, J., and Leeper, D. 2010b. Proposed Minimum Flows and Levels for the Upper
Segment of the Myakka River, from Myakka City to SR 72. Ecologic Evaluation Section, Resource
Conservation and Development, Southwest Florida Water Management District, p.164.
King, A. J., Tonkin, Z., and Mahoney, J. 2008. Environmental Flow Enhances Native Fish Spawning and Recruitment
in the Murray River, Australia. River Research and Applications, 25(10), pp.1205–1218.

Page 42 A Proposed “Percent of Flow” Approach for Water Storage Projects in Oregon
Locke, A., and Paul, A. J. 2011. A Desk-Top Method for Establishing Environmental Flows in Alberta Rivers and
Streams. Edmonton, AB: Alberta Environment ; Alberta Sustainable Resource Development, p.94.
Locke, A., C. Stalnaker, S. Zellmer, K. Williams, H. Beecher, T. Richards, C. Robertson, A. Wald, A. Paul, and T.
Annear. 2008. Integrated Approaches to Riverine Resource Management: Case Studies, Science, Law,
People, and Policy. Instream Flow Council, Cheyenne, WY. 430 pp.
Maine DEP. 2010. Chapter 587—In-Stream Flow and Lake and Pond Water Levels Information Site. URL
http://www.maine.gov/dep/water/swup/index.htm#intro
Montgomery, W. L., McCormick, S. D., Naiman, R. J., Whoriskey Jr, F. G., and Black, G. A. 1983. Spring Migratory
Synchrony of Salmonid, Catostomid, and Cyprinid Fishes in Riviere a La Truite, Quebec. Canadian Journal of
Zoology, 61(11), pp.2495–2502.
Næsje, T., Jonssons, B., and Skurdal, J. 1995. Spring Flood: A Primary Cue for Hatching of River Spawning
Coregoninae. Canadian Journal of Fisheries and Aquatic Sciences, 52(10), pp.2190–2196.
National Research Council. 2005. The Science of Instream Flows: A Review of the Texas Instream Flow Program.
(Committee on Review of Methods for Establishing Instream Flows for Texas Rivers, National Research
Council, Ed.). Washington D.C.: National Academy Press, p.162.
Nesler, T. P., Muth, R. T., and Wasowicz, A. 1988. Evidence for Baseline Flow Spikes as Spawning Cues for
Colorado Squawfish in the Yampa River, Colorado. American Fisheries Society Symposium 5, pp.68–79.
Poff, N. L., Allan, J. D., Bain, M. B., Karr, J. R., Prestegaard, K. L., Richter, B. D., and Stromberg, J. C. 1997. The
Natural Flow Regime. BioScience, 47(11), pp.769–784.
Poff, N. L., Richter, B. D., Arthington, A. H., Bunn, S. E., Naiman, R. J., Kendy, E., and Warner, A. 2010. The
Ecological Limits of Hydrologic Alteration (ELOHA): A New Framework for Developing Regional
Environmental Flow Standards: Ecological Limits of Hydrologic Alteration. Freshwater Biology, 55(1),
pp.147–170.
Richter, B., Baumgartner, J. V., Wigington, R., and Braun, D. P. 1997. How Much Water Does a River Need?
Freshwater Biology, 37(1), pp.231–249.
Richter, B. D. 2009. Re-Thinking Environmental Flows: From Allocations and Reserves to Sustainability Boundaries.
River Research and Applications, 26, pp.1052–1063.
Richter, B. D., Baumgartner, J. V., Powell, J., and Braun, D. P. 1996. A Method for Assessing Hydrologic Alteration
within Ecosystems. Conservation Biology, 10(4), pp.1163–1174.
Richter, B. D., Davis, M. M., Apse, C., and Konrad, C. 2011. A Presumptive Standard for Environmental Flow
Protection. River Research and Applications, 28(8), pp.1312–1321.
Robison, G.E. 2007. Calculating Channel Maintenance / Elevated Instream Flows When Evaluating Water Right
Applications for Out-of-Stream and Storage Water Rights. Salem, OR: Oregon Department of Fish and
Wildlife.
Robison, G., Bach, L., Conlon, T., James, G., Reiser, D. W., Roll, B., and Tullos, D. 2010. White Paper: Peak and
Ecological Flow; a Scientific Framework for Implementing Oregon HB 3369. (B. F. Norris, Ed.). Salem, OR:
Oregon Water Resources Department, p.91.

A Proposed “Percent of Flow” Approach for Water Storage Projects in Oregon Page 43
Sanderson, J. S., Rowan, N., Wilding, T., Bledsoe, B. P., Miller, W. J., and Poff, N. L. 2012. Getting to Scale with
Environmental Flow Assessment: The Watershed Flow Evaluation Tool. River Research and Applications,
28(9), pp.1369–1377.
Schmidt, L. J., and Potyondy, J. P. 2004. Quantifying Channel Maintenance Instream Flows: An Approach for
Gravel- Bed Streams in the Western United States. Gen. Tech. Rep. No. RMRS- GTR-128. Fort Collins, CO:
U.S. Department of Agriculture Forest Service, Rocky Mountain Research Station.
Seegrist, D. W., and Gard, R. 1972. Effects of Floods on Trout in Sagehen Creek, California. Transactions of the
American Fisheries Society, 101(3), pp.478–482.
Sparks, R. E. 1995. Need for Ecosystem Management of Large Rivers and Their Floodplains. BioScience, 45(3),
pp.168–182.
Thompson, K. 1972. Determining Streamflows for Fish Life. In Proceedings of the Instream Flow Requirement
Workshop. Vancouver, WA: Pacific Northwest River Basins Commission.
Trépanier, S., Rodríguez, M. A., and Magnan, P. 1996. Spawning Migrations in Landlocked Atlantic Salmon: Time
Series Modelling of River Discharge and Water Temperature Effects. Journal of Fish Biology, 48(5), pp.925–
936.
Trush, W. J., McBain, S. M., and Leopold, L. B. 2000. Attributes of an Alluvial River and their Relation to Water
Policy and Management. Proceedings of the National Academy of Sciences of the United States, 97(22),
pp.11858–11863.
Wald, A. R. 2009. Report of Investigations in Instream Flow: High Flows for Fish and Wildlife in Washington.
Habitat Program, Washington Department of Fish and Wildlife. Olympia, WA: Washington State Department
of Printing, p.29.
Welcomme, R. 1992. River Conservation-Future Prospects. In P. Boon and P. Raven (Eds.), River Conservation and
Management. New York: John Wiley & Sons, pp. 454-462.
White, R. G. 1975. A Proposed Methodology for Recommending Stream Resource Maintenance Flows for Large
Rivers. In Stream Resource Maintenance Flow Studies. Idaho Department of Water Resources, Idaho
Department of Fish and Game, Idaho Cooperative Fishery Research Unit, pp. 3-20.

Page 44 A Proposed “Percent of Flow” Approach for Water Storage Projects in Oregon