Embed Size (px)
Citation preview

© Rod
rígu
ez-A
vi&
Ariza
-Lóp
ez
/ U
nive
rsid
ad d
e Ja
én (
Spa
in)
A proposal of a statistical test to control positional accuracy by means
of 2 tolerances simultaneously
Dpto. Ingeniería Cartográfica, Geodésica y Fotogrametría
Universidad de Jaén
José Rodríguez-Avi & Francisco Javier Ariza-López
«A proposal of a statistical test to
control positional accuracy by means of 2 tolerances
simultaneously»

© Rod
rígu
ez-A
vi&
Ariza
-Lóp
ez
/ U
nive
rsid
ad d
e Ja
én (
Spa
in)
A proposal of a statistical test to control positional accuracy by means
of 2 tolerances simultaneously
Introduction
• Spatial data are data referring to features that have a position in space, and for this reason positional quality is one of the most desirable characteristics of spatial data sets (SDS)
• Positional accuracy of SDS has traditionally been evaluated using control points. NMAS, EMAS, NSSDA, STANAG 2215, ASPRS, …
• The majority of Positional Accuracy Assessment Methodologies (PAAMs) take as an underlying hypothesis the Gaussian distribution (Normal Distribution)
• It is also important to notice here that prior to any statistical analysis of the data assuming normality, the outliers must be eliminated.
• But several studies indicate that this hypothesis (normality of errors) is not true. In these cases, some other error’s models have been proposed, as well as distribution‐free models:
• LIDAR (Maune, 2007): Without a parametric model (distribution free)• Manual digitizing (Bolstad et al 1990): Bimodal• Digitizing (Tong & Liu, 2004): p‐norm (Normal + Laplace)• Geocodification (Cayo and Talbot 2003; Karimi and Durcik 2004, Whitsel et al. 2004):
Log normal• GNSS Observations (Wilson, 2006; Logsdon, 1995): Raleigh, Weibull• Other models that are mentioned: Folded Normal, Half Normal, Gamma

© Rod
rígu
ez-A
vi&
Ariza
-Lóp
ez
/ U
nive
rsid
ad d
e Ja
én (
Spa
in)
A proposal of a statistical test to control positional accuracy by means
of 2 tolerances simultaneously
Introduction
• Nowadays we can access to very large data sets, and by very large computing capabilities, so we can use the observed distribution functions (Free‐Distribution Functions or Parameters‐Free‐Distribution Functions) without major problems.
• The PAAMs based on Free‐Distribution Functions are scarce in positional accuracy assessment. For instance, the use of percentiles is proposed for dealing with height data of DEM when capture (e.g. by Lidar) is performed on a vegetal cover.
• Some methods that can be applied to data belonging to free‐distribution functions have been developed. A step further would require a statistical method allowing control in the same way (mean value, variation, control of outliers) as performed when data come from a Normal Distribution Function.
© Rod
rígu
ez-A
vi&
Ariza
-Lóp
ez
/ U
nive
rsid
ad d
e Ja
én (
Spa
in)
A proposal of a statistical test to control positional accuracy by means
of 2 tolerances simultaneously
Introduction
• Our aim is to propose a general positional accuracy control method for dealing with data following any kind of distribution function.
• It is a method based on the observed distribution function of the data and can be applied to 1D, 2D or 3D data without the limitations of homogeneity of variances stated in traditional methods (e.g. EMAS, NSSDA, STANAG 2215, etc.).
• To achieve this aim we propose a method based on proportions of a multinomial distribution function in order to establish a strict control over data coming from any distribution function.
• The control is multiple and can test jointly proportions corresponding to tolerances related with, for instance, median values, extreme values (e.g. 95%), or the amount of outliers existing in the data set.
• The proposed control is based on an exact test, in the same way as the Fisher's exact test (Fisher 1922, Freeman and Halton 1951, Müller 2001).
© Rod
rígu
ez-A
vi&
Ariza
-Lóp
ez
/ U
nive
rsid
ad d
e Ja
én (
Spa
in)
A proposal of a statistical test to control positional accuracy by means
of 2 tolerances simultaneously
Approaching the idea
• In order to analyse a pass/fail model applied to positional accuracy control, an approximation is given in terms of the Binomial distribution (Ariza‐López & Rodríguez‐Avi, 2014).
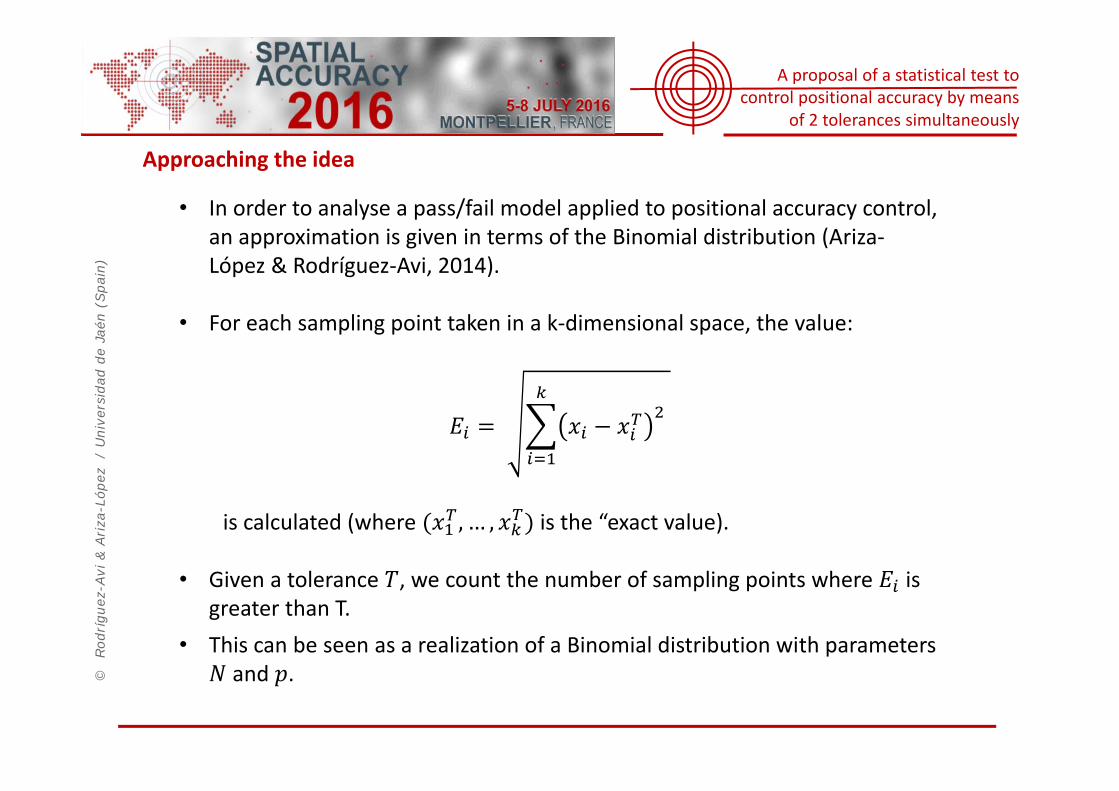
• For each sampling point taken in a k‐dimensional space, the value:
is calculated (where , … , is the “exact value).
• Given a tolerance , we count the number of sampling points where is greater than T.
• This can be seen as a realization of a Binomial distribution with parameters and .

© Rod
rígu
ez-A
vi&
Ariza
-Lóp
ez
/ U
nive
rsid
ad d
e Ja
én (
Spa
in)
A proposal of a statistical test to control positional accuracy by means
of 2 tolerances simultaneously
• The test is:: the proportion of defectives points is less or equal than ,
against: the proportion of defectives is greater than .
• is rejected if ~ , where is the number of defectives (i.e. number of points whose error is greater than the previously specified tolerance) found in the sample.
• This approximation is a pass/fail procedure and implies that we are not able to distinguish the “degree of bad quality” of a defective point (in position).
Approaching the idea
][ TolEP i
Tol
Correct
Positional defective
100%
TolEi (fail event)

© Rod
rígu
ez-A
vi&
Ariza
-Lóp
ez
/ U
nive
rsid
ad d
e Ja
én (
Spa
in)
A proposal of a statistical test to control positional accuracy by means
of 2 tolerances simultaneously
Proposed Method
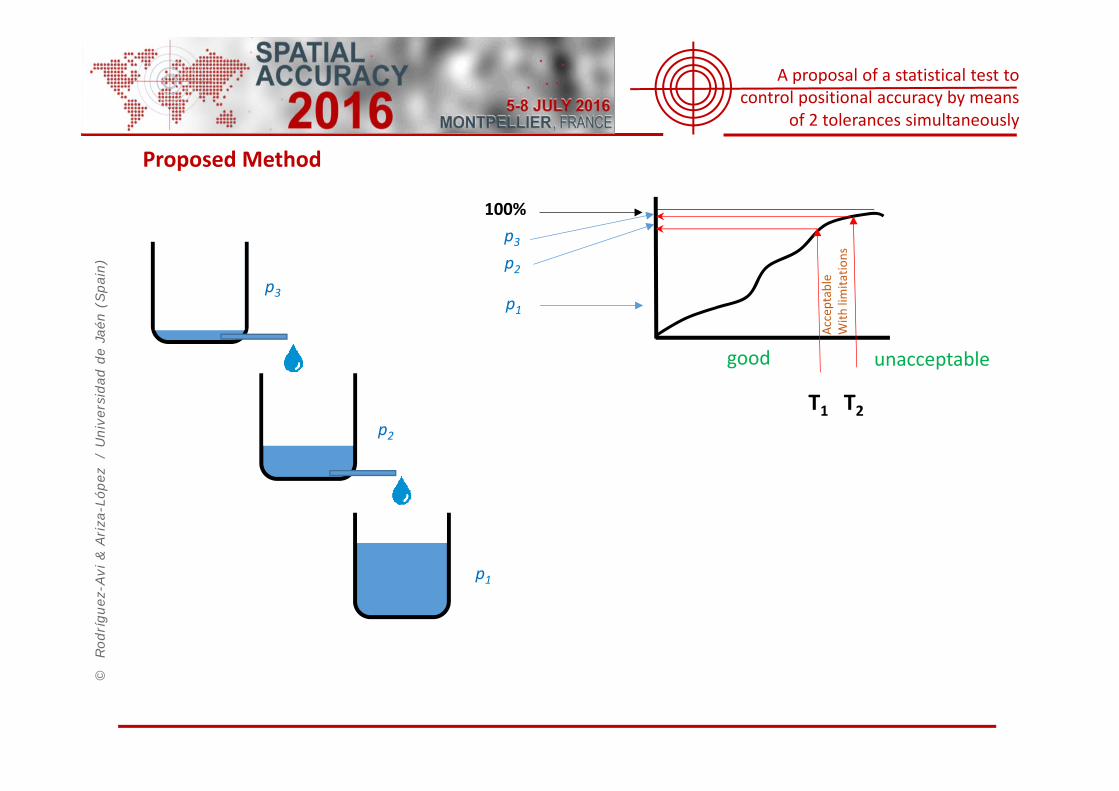
• We propose a gradation in the degree of positional defectiveness, splitting the interval, the excess of error greater than the tolerance, into two parts through two metric tolerances
• Each interval defines a quality level, and we can determine the minimum percentage of “correct” points in the first level (best level), and the maximum percentage of points in each of the other two levels (worse levels).
• For instance, we can stablish a percentage of at least a % of points with an error less than a tolerance and at most a % of points with an error between tolerances and and, in consequence, at most a percentage of % 100 % %of points whit error greater than tolerance .
• So, we classify the sample into three (instead of two, as before) categories, and consequently, the multinomial approximation instead of the binomial approximation is adequate.
© Rod
rígu
ez-A
vi&
Ariza
-Lóp
ez
/ U
nive
rsid
ad d
e Ja
én (
Spa
in)
A proposal of a statistical test to control positional accuracy by means
of 2 tolerances simultaneously
Proposed Method
p1
p2
p3
T1
p1
good
100%
T2
p2
p3
Acceptab
leWith
limita
tions
unacceptable

© Rod
rígu
ez-A
vi&
Ariza
-Lóp
ez
/ U
nive
rsid
ad d
e Ja
én (
Spa
in)
A proposal of a statistical test to control positional accuracy by means
of 2 tolerances simultaneously
Proposed Method
• Multinomial distribution is a multivariate extension of a binomial distribution when we classify the result of an experiment into more than two categories.
• If we realize N independent experiments where we classify the results for exactly one of 3 categories, with probabilities , π , , and π
1, then the mass probability function of a such multinomial , , π , is given by:
, , !! N ! !
• Where is the number of points that belongs to the category , which has a probability .
• We use the multinomial distribution to propose an exact test to decide whether a specified hypothesis is false or not. Firstly we decide two tolerance levels, and , to decide if a point is
• adequate ( ), • slightly inadequate ( ) or • roughly inadequate ( ).
© Rod
rígu
ez-A
vi&
Ariza
-Lóp
ez
/ U
nive
rsid
ad d
e Ja
én (
Spa
in)
A proposal of a statistical test to control positional accuracy by means
of 2 tolerances simultaneously
Proposed Method
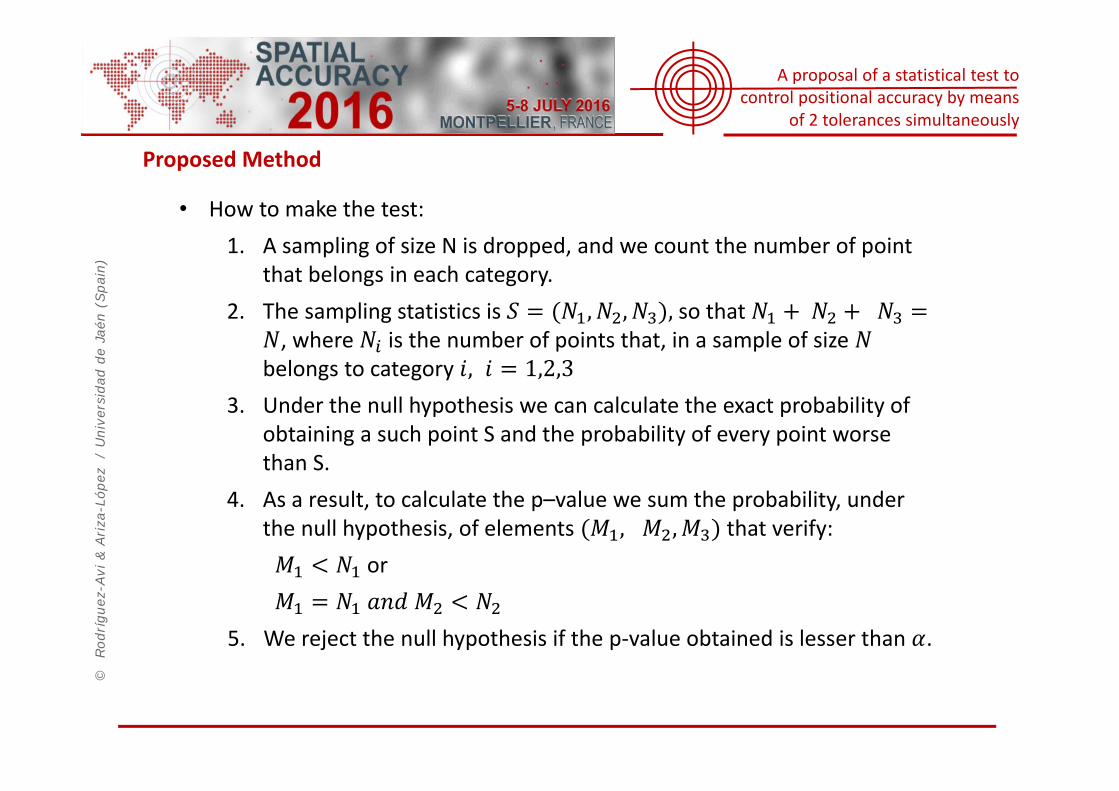
• How to make the test:1. A sampling of size N is dropped, and we count the number of point
that belongs in each category. 2. The sampling statistics is , , ,so that
, where is the number of points that, in a sample of size belongs to category , 1,2,3
3. Under the null hypothesis we can calculate the exact probability of obtaining a such point S and the probability of every point worse than S.
4. As a result, to calculate the p–value we sum the probability, under the null hypothesis, of elements , , that verify:
or
5. We reject the null hypothesis if the p‐value obtained is lesser than .

© Rod
rígu
ez-A
vi&
Ariza
-Lóp
ez
/ U
nive
rsid
ad d
e Ja
én (
Spa
in)
A proposal of a statistical test to control positional accuracy by means
of 2 tolerances simultaneously
Proposed Method
• We can state for the two tolerances case that:
1. The sampling statistics are: , , , so that .
2. Parameters of the multinomial distributions are: N, , , 1 .
3. The null hypothesis is:: Counting has a multinomial distribution with parameters N,
, , where /100 and 1.
4. The alternative hypothesis is:
: At least one of these conditions: or , or , is true.

© Rod
rígu
ez-A
vi&
Ariza
-Lóp
ez
/ U
nive
rsid
ad d
e Ja
én (
Spa
in)
A proposal of a statistical test to control positional accuracy by means
of 2 tolerances simultaneously
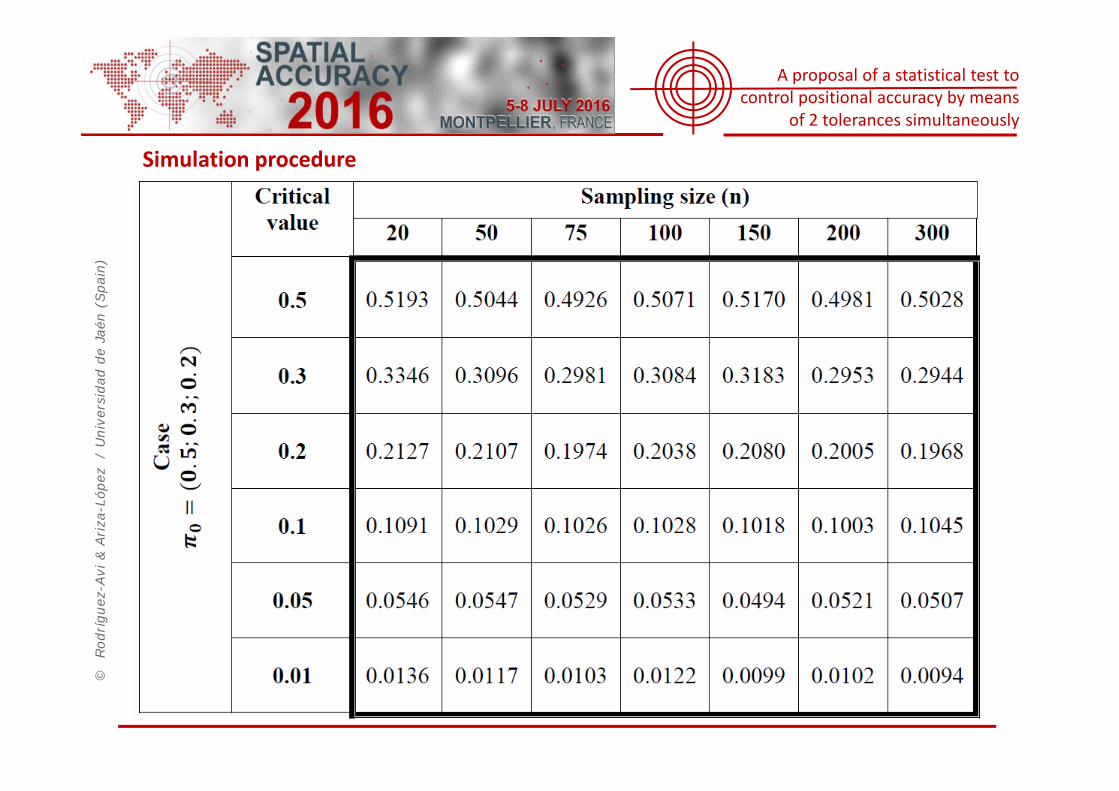
Simulation procedure
• This is an exact test, so the p–value is calculated as follows; 1. Given , , , we calculate the probability in the multinomial
fixed by the null hypothesis to the obtained value and those counting of elements , , that verify:
y 2. Adding up the p‐value of all the cases that verify these conditions,
rejecting the null hypothesis if the p‐value obtained is lesser than .
• To prove the validity of our proposal we develop two complementary simulations:• The first one is in order to prove the validity of the contrast with
respect to the Type I error.• The second one is in order to prove the power of the contrast, that it
is to say, the probability of rejecting the null hypothesis when this hypothesis is false.

© Rod
rígu
ez-A
vi&
Ariza
-Lóp
ez
/ U
nive
rsid
ad d
e Ja
én (
Spa
in)
A proposal of a statistical test to control positional accuracy by means
of 2 tolerances simultaneously
Simulation procedure
• First step1. We choose several values for N, the sampling size.
2. For each value of N and a given value of , , , a space of events of a multinomial is generated, with all the corresponding probabilities. For each event the probability according to a multinomial , , , is calculated.
3. 2000 samples of three numbers coming from the above multinomial through a Montecarlo method are generated . For each one of the random samples the ‐value is calculated according to the previously described procedure.
4. The proportion of samples where the p‐value is lesser than a fixed alpha is determined by counting.
5. We repeat this procedure 50 times

© Rod
rígu
ez-A
vi&
Ariza
-Lóp
ez
/ U
nive
rsid
ad d
e Ja
én (
Spa
in)
A proposal of a statistical test to control positional accuracy by means
of 2 tolerances simultaneously
Simulation procedure
• Second step
• To analyse the power of the contrast we proceed to a simulation
• Sampling values are obtained from a multinomial distribution ,where is worse that the specification indicated by the null hypothesis. In consequence, the null hypothesis should be rejected.
• So we calculate the probabilities of each simulated case under the null hypothesis, which is a multinomial , .
• In each case, simulations have been realized according to the simulation procedure described above.

© Rod
rígu
ez-A
vi&
Ariza
-Lóp
ez
/ U
nive
rsid
ad d
e Ja
én (
Spa
in)
A proposal of a statistical test to control positional accuracy by means
of 2 tolerances simultaneously
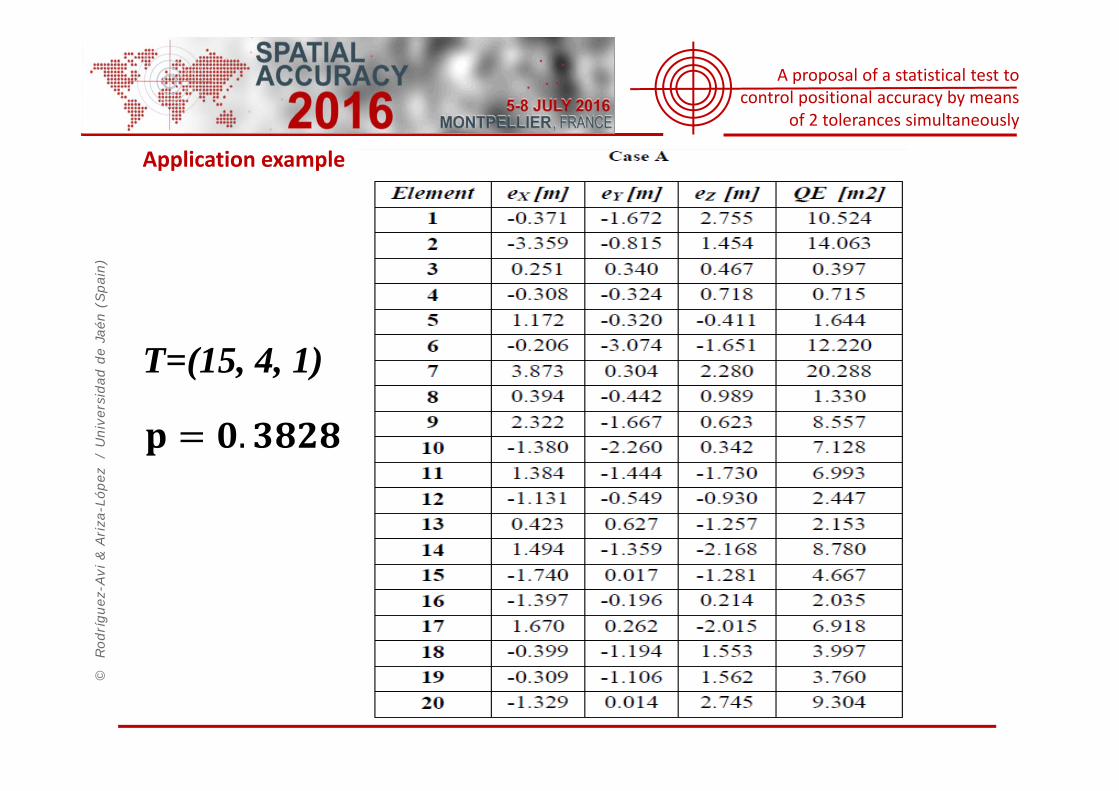
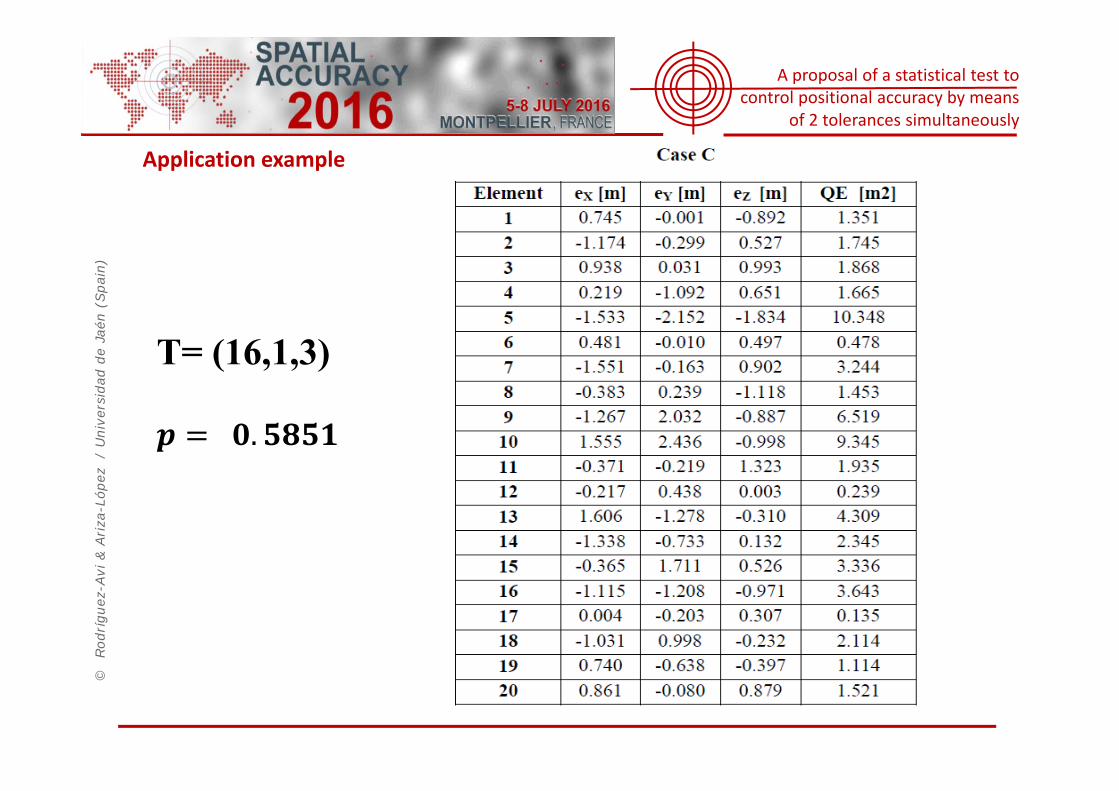
Application example
• We show this procedure with three different examples.1. is true, and we are going to see what happens if a sample confirms
this hypothesis or not. 2. The true model is worse, in the sense of generating a higher number of
errors than the desired mode3. The sample refers to a situation which is better, in the sense of reduced
errors, than that stated by .
• Errors in X, Y and Z are distributed according to three 0, 1.5
• The quadratic error in each element is:
which is Gamma(3/2, 4.5). In this case:• Prob. that an element has a 9.243m2 is 0.75, • Prob. that an element has a 14.065m2 is 0.90.
• In consequence, under the sampling statistics follow a multinomial distribution with parameters (N, 0.75, 0.15, 0.10).
© Rod
rígu
ez-A
vi&
Ariza
-Lóp
ez
/ U
nive
rsid
ad d
e Ja
én (
Spa
in)
A proposal of a statistical test to control positional accuracy by means
of 2 tolerances simultaneously
Application example
T=(15, 4, 1)

© Rod
rígu
ez-A
vi&
Ariza
-Lóp
ez
/ U
nive
rsid
ad d
e Ja
én (
Spa
in)
A proposal of a statistical test to control positional accuracy by means
of 2 tolerances simultaneously
Application example
, ,
.
© Rod
rígu
ez-A
vi&
Ariza
-Lóp
ez
/ U
nive
rsid
ad d
e Ja
én (
Spa
in)
A proposal of a statistical test to control positional accuracy by means
of 2 tolerances simultaneously
Conclusions
• We propose a general positional accuracy control method, splitting points into three categories in respect with measurement errors.
• It may be employed without any previous hypothesis about the undelaying distribution of errors, and it can be applied to 1D, 2D or 3D error data.
• It is an exact statistical hypothesis testing based on multinomial distribution with three parameters, N, ,
• The proposed statistical test is exact, so the p‐value can be derived by exploring a space of solutions and summing up the probabilities of each isolated case of this space.
• This contrast has some advantages, such as its easy realization and implementation, for instance in R program.
• Albeit we have applied it in a continuous underlying situation (measurement errors), it is also useful for free distribution error models as well as discrete or cathegorical situations.

© Rod
rígu
ez-A
vi&
Ariza
-Lóp
ez
/ U
nive
rsid
ad d
e Ja
én (
Spa
in)
A proposal of a statistical test to control positional accuracy by means
of 2 tolerances simultaneously
Conclusions
© Rod
rígu
ez-A
vi&
Ariza
-Lóp
ez
/ U
nive
rsid
ad d
e Ja
én (
Spa
in)
A proposal of a statistical test to control positional accuracy by means
of 2 tolerances simultaneously

© Rod
rígu
ez-A
vi&
Ariza
-Lóp
ez
/ U
nive
rsid
ad d
e Ja
én (
Spa
in)
A proposal of a statistical test to control positional accuracy by means
of 2 tolerances simultaneously
Simulation procedure
© Rod
rígu
ez-A
vi&
Ariza
-Lóp
ez
/ U
nive
rsid
ad d
e Ja
én (
Spa
in)
A proposal of a statistical test to control positional accuracy by means
of 2 tolerances simultaneously
Simulation procedure

© Rod
rígu
ez-A
vi&
Ariza
-Lóp
ez
/ U
nive
rsid
ad d
e Ja
én (
Spa
in)
A proposal of a statistical test to control positional accuracy by means
of 2 tolerances simultaneously
Simulation procedure

© Rod
rígu
ez-A
vi&
Ariza
-Lóp
ez
/ U
nive
rsid
ad d
e Ja
én (
Spa
in)
A proposal of a statistical test to control positional accuracy by means
of 2 tolerances simultaneously
Simulation procedure

© Rod
rígu
ez-A
vi&
Ariza
-Lóp
ez
/ U
nive
rsid
ad d
e Ja
én (
Spa
in)
A proposal of a statistical test to control positional accuracy by means
of 2 tolerances simultaneously
Simulation procedure

© Rod
rígu
ez-A
vi&
Ariza
-Lóp
ez
/ U
nive
rsid
ad d
e Ja
én (
Spa
in)
A proposal of a statistical test to control positional accuracy by means
of 2 tolerances simultaneously
Simulation procedure
© Rod
rígu
ez-A
vi&
Ariza
-Lóp
ez
/ U
nive
rsid
ad d
e Ja
én (
Spa
in)
A proposal of a statistical test to control positional accuracy by means
of 2 tolerances simultaneously
Application example
T= (16,1,3)
.