Embed Size (px)
Citation preview

QUANTITATIVE ANALYSIS OF SELECTIVE HEAVY METALS
IN WATER AND FOOD
B. Sc. Engineering Project Work
Submitted to the University of Rajshahi in partial fulfillment of the requirement for the Degree of Bachelor of Science in
Examination Roll No: 11065099
B. Sc. (Engineering), Odd Semester, Part
Sha Md. Shahan Shahriar
Department of Applied Chemistry and Chemical Engineering
Department of Applied Chemistry and Chemical Engineering
A PROJECT ON
QUANTITATIVE ANALYSIS OF SELECTIVE HEAVY METALS
IN WATER AND FOOD
B. Sc. Engineering Project Work
A DissertationSubmitted to the University of Rajshahi in partial fulfillment of the requirement for the
Degree of Bachelor of Science in Applied Chemistry and Chemical Engineering
Submitted by
Md. Omar FaroqueExamination Roll No: 11065099
Registration No: 2322Session: 2010-2011
B. Sc. (Engineering), Odd Semester, Part-IV, Examination-2014
Supervisor
Sha Md. Shahan ShahriarLecturer
Department of Applied Chemistry and Chemical EngineeringUniversity of Rajshahi
Rajshahi-6205, Bangladesh
Department of Applied Chemistry and Chemical Engineering
University of Rajshahi
April 2015
QUANTITATIVE ANALYSIS OF SELECTIVE HEAVY METALS
Submitted to the University of Rajshahi in partial fulfillment of the requirement for the Applied Chemistry and Chemical Engineering
2014
Department of Applied Chemistry and Chemical Engineering

ACKNOWLEDGEMENT
First of all, I remember from the core of my heart, the name of almighty Allah who gave me the
ability to complete the project work up to the final stage.
I would like to acknowledge my heartfelt gratitude to my honorable teacher and project
supervisor Sha Md. Shahan Shahriar, Lecturer, Department of Applied Chemistry and Chemical
Engineering, University of Rajshahi, for his valuable and proper guidance, continuous
encouragement and time to time suggest throughout the project work.
I would also like to express my extreme gratefulness, intense appreciation and profound
indebtedness to my respectable teacher Dr. Md. Ahsan Habib, Professor, Department of Applied
Chemistry and Chemical Engineering, University of Rajshahi, for his everlasting help and
suggestions, perpetual inspirations, scholastic guidance, enthusiastic encouragement, valuable
and never ending instructions.
I convey my heartiest grateful thanks to Professor Md. Abul Kalam Azad-l, Chairman of this
Department, Professor Dr. M. Fakrul Islam (Professor Emeritus), Professor Dr. Sk. Mohammad
Mohsin Ali, Professor Ranjit Kumar Biswas, Professor Dr. M. Abu Sayeed, Professor Dr. M.
Rostom Ali, Professor Dr. Md. Shameem Ahsan, Professor Dr. Md. Abul Hossain Molla,
Professor Dr. C. M. Mostafa, Professor Md. Ibrahim H. Mondal, Professor Dr. M. Sahedur
Rahman, Professor Dr. Dil Afroz Begum, Professor Dr. Sayed M. A. Salam, Professor Dr. Md.
Rezaul Karim Sheikh, Professor Dr. Md. Rakib-uz-Zaman, Professor Dr. Abul Kalam Azad-2,
Professor Dr. Md. Abu Bakr, Professor Dr. M. Taufiq Alam, Professor Dr. Mele Jesmin, Dr.
Aneek Krishna Karmakar, Lecturer, Dr. Md. Anwarul Karim, Lecturer and other respectable
teachers of this Department for their inspiration and help in various ways to complete my project
work.
Finally, I express appreciation to my beloved parents and others family members who sacrificed
a lot for carrying out this study.
Md. Omar Faroque

ABSTRACT
Environmental pollution is a worldwide problem, heavy metals belonging to the most important
pollutants. The main threats to human health from heavy metals are associated with exposure to
mercury, cadmium, lead, copper, and arsenic. These metals have been extensively studied and
their effects on human health regularly reviewed by international bodies such as the WHO.
Heavy metals have been used by humans for thousands of years. Although several adverse health
effects of heavy metals have been known for a long time, exposure to heavy metals continues,
and is even increasing in some parts of the world, in particular in less developed countries,
though emissions have declined in most developed countries over the last 100 years. In this
project work estimation of selected heavy metals such as mercury, cadmium, lead, copper, and
arsenic will be carried out in water and food consumed by households. Detection and estimation
of the level of heavy metal will be carried out by using Atomic Absorption Spectrophotometer.
The samples will be digested using 96% of nitric acid to remove organic material by
decomposing them into carbon dioxide (CO2); (CH2)n + 2HNO3 → CO2 + 2NO + 2H2O and also
to convert the metals present into soluble forms. The samples will be randomly selected for
analysis. This research will investigate the exposure to heavy metals in the average diet in
Bangladesh, as well levels of contaminations in water and food in Bangladesh. This will be done
through the total diet study (TDS) approach. This will provide information on the dietary
exposure to heavy metal contaminants, on it potential health implications as well as the potential
sources of contamination and recommendations for action. Research findings will provide the
necessary evidence to mobilize support for implementing national policies that commit the
Government to reducing heavy metal contamination of water and food.
Key word: heavy metal, mercury, cadmium, lead, copper, and arsenic.
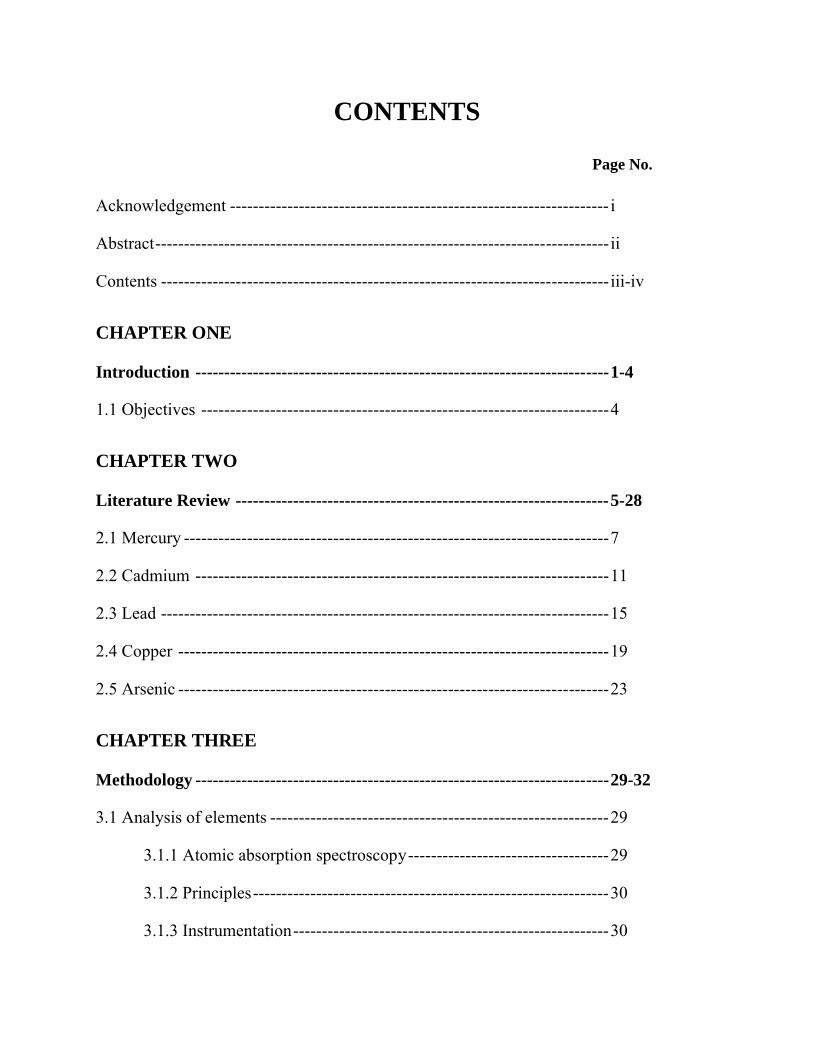
CONTENTS
Page No.
Acknowledgement ------------------------------------------------------------------ i
Abstract-------------------------------------------------------------------------------ii
Contents ------------------------------------------------------------------------------iii-iv
CHAPTER ONE
Introduction ------------------------------------------------------------------------1-4
1.1 Objectives -----------------------------------------------------------------------4
CHAPTER TWO
Literature Review -----------------------------------------------------------------5-28
2.1 Mercury --------------------------------------------------------------------------7
2.2 Cadmium ------------------------------------------------------------------------11
2.3 Lead ------------------------------------------------------------------------------15
2.4 Copper ---------------------------------------------------------------------------19
2.5 Arsenic ---------------------------------------------------------------------------23
CHAPTER THREE
Methodology ------------------------------------------------------------------------29-32
3.1 Analysis of elements -----------------------------------------------------------29
3.1.1 Atomic absorption spectroscopy-----------------------------------29
3.1.2 Principles--------------------------------------------------------------30
3.1.3 Instrumentation-------------------------------------------------------30

3.2 Sample collection---------------------------------------------------------------32
3.2.1 Sample preparation --------------------------------------------------32
3.2.2 Analytical methods and instrumentation--------------------------32
3.2.3 Measurement of different variables -------------------------------32
3.2.4 Data analysis----------------------------------------------------------32
CHAPTER FOUR
Result and Discussion-------------------------------------------------------------33-36
CHAPTER FIVE
Conclusions and Future Prospects ---------------------------------------------37
REFERENCES --------------------------------------------------------------38-49
INTRODUCTIONHeavy Metals are those elements which have density more than 5 g/cm3, atomic weight 63.546
to 200.590 and a specific gravity greater than 4.01,2. These metals include mercury, arsenic,
cadmium, chromium, copper, lead, nickel, zinc, molybdenum and vanadium. Living organisms
normally require some of these heavy metals up to certain limits and in case excess accumulation
occurs it will lead to severe detrimental1.
Environmental pollution by heavy metals can occur by many different ways, either directly or
indirectly. Soils, water and plants are contaminated by material from the air or by direct
deposition of pollutants. Heavy metals are introduced into the eco-system by the manufacturers
and the use of materials containing heavy metals as well as the disposal of this waste. Heavy
metals in air, soil, and water are global problems that are a growing threat to the environment.
There are many sources of heavy metal pollution, including the coal, natural gas, paper, and
industries3.
The main routes to transfer metals throughout the environment are the atmosphere and flowing
waters. Under normal conditions, the end results of migration are sediments, soil and
underground waters. Heavy metals may enter the food chain as a result of their uptake by edible
plants, thus, the determination of heavy metals in environmental samples is very important. The
importance of interactions between metals and solid phases of soils, soil water, and air within
and above soil depends on a variety of chemical factors. Absorption of metals from soil water to
soil particles is the most important chemical determinant that limits mobility in soils4.
The accumulation of these contaminants is aided by the capability of soil to bind them with clay
minerals or organic substances. Heavy metals are natural components of soil. Most elements are
only present in minimal, insignificant eco-toxicological concentrations in undisturbed locations.
A few heavy metals are important as trace elements for physiological processes in plants and
animals. Heavy metals contamination of soil is widespread due to metal processing industries,
tannery, combustion of wood, coal and mineral oil, traffic, and plant protection. Heavy metals
may reach and contaminate plants, vegetables, fruits and canned foods through air, water, and
soil during cultivation5.
Inhalation and ingestion of heavy metals may cause various diseases such as anemia,
neuropsychological effects, liver diseases, gastrointestinal pathologies, teratogenic implications6.
Moreover, it is known that the DNA-damaging effects of certain metals in humans can lead to
induction of cancer and a decrease of fertility .In addition, heavy metals in soils may adversely
affect soil ecology, agricultural production or products and water quality.
Some metals are essential for life, but if an individual's intake exceeds a certain threshold,
toxicity may develop. Metals and minerals in food and fodder are of great interest because of
their potential effects on human and animal health. Some have no beneficial biological function
but exposures in differs on deficiency may be harmful to health. For example, organic mercury
compounds are neurotoxins, exposure to lead can be harmful to neurophysiological development;
inorganic arsenic is a human carcinogen and cadmium can affect renal function. While some
elements, such as cobalt, iron and copper are essential to health, they may be toxic at high levels
of exposure. Exposure to metals can be in a number of ways, including at work in certain
industries, from drinking water and eating contaminated foods.
The risk to health from certain elements in food can be assessed by comparing estimates of
dietary exposures with the Provisional Tolerable Weekly Intakes (PTWIs) and Provisional
Maximum Tolerable Daily Intakes (PMTDIs) recommended by the Joint Expert Committee on
Food Additives (JECFA) of Food and Agriculture Organization (FAO) and World Health
Organization (WHO) programmers on chemical safety.
Extreme accumulation of heavy metals in agricultural soils through wastewater irrigation, may
not only result in soil contamination, but also lead to elevated heavy metal uptake by crops, and
thus affect food quality and safety. Heavy metal accumulation in soils and plants is of increasing
concern because of the potential human health risks. This food chain contamination is one of the
important pathways for the entry of these toxic pollutants into the body of the human. Heavy
metal accumulation in plants depends on plant species, and the efficiency of different plants in
absorbing metals is evaluated by either plant uptake or soil-to plant transfer factors of the metals.
Vegetables cultivated in wastewater-irrigated soils take up heavy metals in large enough
quantities to cause potential health risks to the consumers. In order to assess the health risks, it is
necessary to identify the potential of a source to introduce risk agents into the environment,
estimate the amount of risk agents that come into contact with the human-environment .
Heavy metal pollution is a rising environmental problem, which requires immediate attention.
With current commercial remediation reagents failing to provide the needed requirements as safe
and effective metal chelators, the need for new technology is critical. The emissions of sulfur per
day, together with dust loaded heavy metals, both discharged from smelter and industries cause
many environmental pollution.
Anthropogenic activities (mining, ultimate disposal of treated and untreated waste) effluents
containing toxic metals as well as metal chelates from different industries and also the
indiscriminate use of heavy metal containing fertilizers and pesticides in agriculture resulted in
deterioration of water quality rendering serious environmental problems posing threat on human
beings. However some of the metals for example Hg, Cd, Pd, Cu and As are essential as
micronutrients for life processes in plants and microorganisms, while many other metals like Cd,
Hg and Pb have no known physiological activity.
It is needed to take action to prevent and control contamination of the food chain by heavy
metals and trace elements in Bangladesh is therefore becoming increasingly obvious.
The National Food Policy Plan of Action (2008-2015)7 (area of intervention 3.6), as well as other
national policies such as the National Agricultural Policy (1999), the National Fisheries Policy
(1998), National Livestock Policy (2007), National Plan of Action for Nutrition (1997), the
National Health Policy (2010) and the forthcoming National Food Safety Policy and Plan of
Action, recognize the importance of reducing food contamination in Bangladesh in order to
improve human health. However, while the extent and sources of arsenic contamination are well
known, more comprehensive information on the extent to which the population of Bangladesh is
exposed to food contamination by other toxic heavy metals namely Arsenic, Cadmium, Lead,
copper and Mercury is not widely available. This undermines the ability for decision makers to
recognize the importance of interventions for reducing heavy metal contamination of food.
1.1 Objectives
1. To detect the presence of heavy metals (mercury, cadmium, lead, copper, and arsenic) in water
and food consumed by households.
2. To estimate the level of selected heavy metals (mercury, cadmium, lead, copper, and arsenic)
in water and food consumed by households.
3. To determine the toxicity of each metal in comparing with the standard label of toxicity of
heavy metal.

LITERATURE REVIEW
Among all the pollutants, heavy metals are most dangerous one as these are non – biodegradable
and persist in environment. These enter into the water resources through both natural and
anthropogenic sources. More attention is being given to the potential health hazards posed by
heavy metals. The term heavy metal refers to any metallic chemical element that has a relatively
high density. Examples of heavy metals include mercury (Hg), cadmium(Cd), arsenic (As),
chromium (Cr), thallium (Tl), lead (Pb), Copper (Cu), Zinc (Zn), Cobalt (Co), Nickel (Ni), and
Iron (Fe). These metals are classified in to three categories: toxic metals (such as Hg, Cr, Pb, Zn,
Cu, Ni, Cd, As, Co, Sn, etc), precious metals (such as Pd, Pt, Ag, Au, Ru etc.) and radionuclides
(such as U, Th, Ra, Am, etc.)8. Toxic metals cause toxicity to organisms even at ppm level of
concentration. Heavy metals are natural components of the earth's crust. To a small extent they
enter our bodies via food, drinking water and air. As trace elements, some of these heavy metals
(e.g. copper, selenium, zinc) are essential to maintain the metabolism of the human body.
However, at higher concentrations they can lead to poisoning. Heavy metal poisoning could
result from drinking-water contamination, high ambient air concentrations near emission sources,
or intake via the food chain. Heavy metals are dangerous because these tend to bioaccumulate.
Bioaccumulation means an increase in the concentration of a chemical in an organism over time,
compared to its concentration in the environment. Compounds accumulate in living systems
when these are taken up and are stored faster than these are broken down(metabolized) or
excreted. Heavy metals may enter a water supply through industrial or consumer wastes
releasing heavy metals into streams, lakes, rivers, and groundwater. Unlike organic pollutants,
heavy metals, being non-biodegradable pose a different kind of challenge for remediation. A
well known environmental disaster associated with heavy metals is the Minamata disease caused
by Mercury pollution in Japan. Heavy metal toxicity can result in lower energy levels and
damage blood composition, lungs, liver, kidneys and other vital organs, damaged or reduced
mental and central nervous function or even cause cancer9. Heavy metal poisoning is more likely
to result from inhalation, ingestion, skin contact. with the metals or compounds from dust, fumes
or materials from workplace, or in residential settings, especially homes with lead paints or old
plumbing10.

Historically the accumulation of heavy metals is not a new experience. Many historians believe
lead coated utensils as a major cause for the fall of Roman Empire11.
Heavy metals enter the milieu through air emanation from coal burning plants, smelters and
other industrial amenities12. Other than civil, natural processes also play an important role in
decaying heavy metals in the ground water e.g. naturally occurring geological deposits of arsenic
in ground water13. Once heavy metals are on the rampage to the environment, they remain for
years to increase the chances of revelation to humans and livestock. Recent studies have shown
that the modern products like cosmetics, mercury amalgam dental filling, paints and ground
water residues of certain chemicals lead to chronic exposure to these heavy metals.
Foodstuffs grown on contaminated soil or irrigated with impure water accumulate metal contents
and are a big source of heavy metals exposure to the animals and humans14 . Along with these
factors many occupations involve direct contact of workers to the heavy metals like dental
surgeons, painters and welders etc15. Heavy metals are an important source of food
contamination and health hazard. The main threats to human health are associated with exposure
to arsenic, cadmium, lead, copper and mercury. Sources of food contamination include
environmental and industrial pollution, agricultural practices, food processing and packaging.
Absorption of heavy metals through food has been shown to have serious consequences on
health and thereby economic development associated with a decline in labour productivity as
well as the direct costs of treating illnesses such as kidney disease, damage to the nervous
system, diminished intellectual capacity, heart disease, gastrointestinal diseases, bone fracture,
cancer and death16.

2.1 Mercury
Mercury is a shiny metallic liquid that occurs in only trace amounts in igneous and sedimentary
rocks17. It is not naturally abundant element but its residues frequently occur in many
environmental compartments18. World production of mercury is around 8.000 tons per year19.
Mercury enters the environment through normal breakdown of minerals present in rocks, which
is transferred to soil by air and water. The concentration of the mercury in the environment is
increasing day by day, and this is subjected to human activity.
Most of the mercury is released into air through fossil fuel combustion, mining, smelting and
solid waste combustion. It has been found that phosphate fertilizers also contain some amount of
mercury. In agriculture regions, organo-mercurial seed dressings have been the major source of
mercury exposure to farm animals.
These fungicidal treatments have been limited to much extent in many countries in recent
years20. Other sources include cement production, crematoria and industries waste that use
mercury in their process. In industrial and urban areas, animals are additionally exposed to
mercury, which is released from various anthropogenic sources21.
Drainage from mercury mines is also an environmental concern. Field studies suggest that
mercury mine drainage contains high concentrations of inorganic mercury, MeHg, and sulfate.
Elevated concentrations of sulfate (around 1000 mg/l) in mercury mine drainage favor the growth
of sulfate reducing bacteria (SRB), which are mediators of mercury methylation (Rytuba, 2000).
Thus, it is believed that mercury mine drainage has a high methylation rate (Rytuba, 2000).In
addition to gold and mercury mining activities, silver mining processes also emit a large quantity
of mercury into the environment. In South America, silver mining activities released
approximately 400 metric tons of mercury into the environment each year from the late 16th
century through the early 20th century22.
Pribram, a Czech Republic town close to Prague, is historically active in lead mining and
smelting. Throughout this town, samples of topsoil averaged about 0.36 mg/g of mercury, which
was approximately 7 times higher than the background concentration23. In the vicinity of the
smelter and the center of the mining area, mercury concentrations were about 2 mg/g, which was
almost 40 times higher than the background concentration23. Because of the persistence of
mercury in the environment, historical mercury emitted from mining sources is still a serious
environmental concern to surrounding areas. In Nevada, HgT concentration in a creek was 40e60
times higher than that in surrounding areas. Because other sources of mercury contamination
were insignificant, it is suggested that historical gold and silver mining activities dating back to
the 19th century are responsible for the mercury contamination problem24. In Oregon, most
mining activities began and ended before World War II. Mercury contamination in the
downstream sediment of an inactive gold mine is still 2e20 times higher than that in the
surrounding areas25.
Combustion and industrial sources are important sources of mercury emission into the
environment. In the United States, it is estimated that about 97% of total anthropogenic mercury
emissions come from combustion and industrial sources .Important combustion fuels include
coal, waste, and oil. Major combustion devices include utility combustors, waste incinerators,
industrial boilers, and residential combustors .Mercury from combustion sources usually first
enters the atmosphere. Then some of it settles in nearby water or land. The rest remains in the
atmosphere and becomes part of the regional or global atmospheric mercury cycle.
On the global scale, Asia (especially China and India) accounts for about 50% of total
anthropogenic mercury emissions26. Combustion of coal as an energy source is the major source
of mercury emissions in Asia26. In China, coal contains an average of 0.22 mg/kg of mercury, of
which approximately 70% is emitted into the environment during combustion. It is also
noteworthy that coal combustion comprises almost 50% (79 metric tons annually) of total
anthropogenic mercury emissions (158 metric tons annually) in the United States .Metal
production and recovery sectors have emitted large amounts of mercury into the environment. In
Ontario, Canada, mercury from metal recovery (such as iron, steel, lead, and zinc) is the single
largest environmental contamination source. From this source alone, approximately 6.8 metric
tons of mercury contaminate the environment each year27. On a larger scale, Canada emits about

24 metric tons of mercury each year from metal production and recovery sectors. This source is,
by far, the most important point source of anthropogenic mercury emissions in Canada27.
Heavy metal such as mercury has no known vital or beneficial effect on the living organisms. All
chemical forms of mercury can cross the placental barrier and also secreted in milk. Mercury has
the ability to cross the blood brain barrier for example methyl-mercury. It causes the toxicity of
central nervous system in animals and as well as in humans. Experiment performed on
Alzheimer’s disease patients showed elevated level of mercury in various parts of brain and
subcelluar fractions28. Another study confirmed the above findings and showed that high
concentration of mercury was found in blood and cerebrospinal fluid of Alzheimer’s disease
patients29. There are many incidents of human poisoning with mercury in Japan. A well
documented environmental disaster associated with heavy metals is the Minamata disease.
Minamata disease is sometimes referred to as Chisso- Minamata disease. It is a neurological
syndrome caused by severe mercury poisoning. The cause of this disease was the release of
methyl mercury in industrial wastewater. This highly toxic chemical bio-accumulated in shellfish
and fish in Minamata Bay, which when eaten by the local population resulted in mercury
poisoning30. Subsequently, much information is collected on mercury contamination in fish and
seafood. Currently fishmeal added to the feed, is the main source of mercury for livestock and
ultimately for humans. Mercury is able to accumulate in livestock and can cause toxic
effects31.The amount of data on mercury contamination in livestock and in meat products is very
scanty. Accumulation of heavy metals in the body of domestic animals affected the health of
animals. Reproduction problems as well as immunity decline, cancerous and teratogenic diseases
are also related to heavy metal poisoning. It is also found that excretion of mercury is low in the
offspring’s.
A study was performed on the cattle of Asturias and Galicia to determine the levels of certain
toxic and essential metals. This study revealed that the concentration of mercury was within the
permissible limit as set by the. Many efforts have been made to control all the stages of meat
production starting with forage and going to the final products. An experiment was performed to
determine the mercury concentrations in cattle from NW Spain. The results indicated that
concentration of mercury was found higher in kidney samples of Similarly, detected that the
level of mercury was highest in the liver and kidneys of cattle. Farm animals are important
indicators of the environmental pollution with heavy metals. Sheep and cattle reared freely on
pasture are also indicator of environmental pollution. Milk and milk products are most essential
food due to its protein and mineral contents, contamination of these products is a major public
health problem in many countries. Concentration of heavy metals in milk is mainly described in
cows. Chronic mercury toxicity was induced in goats by administering mercuric chloride at 100
μg Ml-1 in drinking water. Following toxic signs are observed, gastrointestinal disturbances,
renal dysfunction, spleen necrosis, Zenker's degeneration of cardiac muscles and oedema in the
brain. In addition, hyperemia, oedema and tissue hemorrhages were evident in most of the
organs. In order to produce products ecologically pure and safe for public health, the
improvements of methods for the control in contamination become primarily important32.
DMPS (2,3 Dimercapto-1-Propanesulfonate) is an analog of British Anti-Lewisite (BAL) with
high affinity for mercury. Due to its superior safety, it has been widely used in Germany for the
past fifty years and is available over the counter in that country. Protocols determining the
pharmacokinetics of DMPS and evaluating its use for diagnostic purposes have been published
in Germany, Sweden, New Zealand, and Mexico and in the United States. Maiorino gave his
volunteers DMPS 300mg orally; over 90% of the absorbed DMPS was converted rapidly to
disulfide forms. Published absorption of ingested DMPS varies from 39% to 60%. The excretory
half life of unaltered DMPS was 4.4 ± 1.1 hours. The excretory half life of the disulfide forms of
DMPS was 9.9 ± 1.6 hours. Hurlbut et al.’s volunteers were given an unusually large dose of
DMPS (3mg/kg intravenously over 5 minutes)33. Two subjects had a transient 20mmHg drop in
systolic blood pressure during infusion, without other changes in vital signs. Excretory half life
of unaltered DMPS ranged from 1.3 to 4.0 hours. Half life of the altered DMPS was from 19.8 to
37.5 hours. In each of the cited studies, mercury output following provocation with DMPS
correlated significantly with amalgam number and/or occupational or dietary exposure. There
were no significant complications in any of the trials. Consequently, all the investigators but
one concluded that urine output provoked by DMPS represented a fair estimate of body
burden34.
Overview of the above literature indicated that mercury is not only carcinogenic but also causes
severe diseases, which ultimately end in death of human beings or animals.

2.2 Cadmium
Cadmium is the most abundant, naturally occurring element, it was discovered in early 19th
century35.Cadmium is a soft, malleable, ductile, bluish-white bivalent metal and is highly
carcinogenic for living beings. It is found in nature in mineral form and is extracted from
cadmium ore known as greenockite. Cadmium compounds are extremely toxic for plants,
animals and human beings36. Cadmium is widely distributed in air, soil, water, plants and finally
in animal tissues.
The most important sources of cadmium contamination are smelters. Other sources include
burning fossil fuels such as coal and incineration of metropolitan waste such as plastics and
nickel-cadmium batteries37. Cadmium may also flee into the air, from iron and steel production
process. When cadmium is released into the atmosphere by smelting or mining or some other
processes, its particles are carried to long distances. Cadmium can also deposit on the earth by
rain falling and its solubility in water is enhanced by increasing the acidity of water. It can easily
move through water movement in the upper layers of soil, from where it is absorbed by plants
and is accumulated in leafy vegetables, root crops, cereals and grains as a result of which it
enters into food chain38.
Cadmium concentrations in drinking water supplies are up to 1 part per billion (ppb) considered
as permissible limit38. Groundwater rarely contains high levels of cadmium until or unless it is
contaminated by industrial wastewater, wastes from mining or seepage from hazardous waste
sites. Soft or acidic water has higher tendency to dissolve cadmium from water lines and even its
low levels by deposit in body tissues.
Environment exposed to cadmium can contaminate the food and water. Concentrations of
cadmium present in food items vary widely depending on the place of their production, as the
industrial areas are much responsible for contamination .The dietary intake of cadmium has been
found in the range of 10-35μg39.
Cadmium has been observed to cause oxidative stress and histologically visible membrane
disturbances in the central nervous system, with reduction in acetylcholinesterase activity,
increase in oxidative stress markers, depletion of glutathione, superoxide dismutase 2, and other
antioxidants, and depletion of catalase, glutathione peroxidase, and glutathione-S-transferase.
These changes have apparently led to apoptosis of cortical cells in the central nervous
system,possibly due to phosphorylation of calcium/calmodulin-dependent protein kinase II. Cd
can also inhibit influx through calcium channels40.
Clinically, humans with elevated blood or urine Cd demonstrate decreased attention level and
memory41. Additionally, humans with high urinary Cd levels had significantly decreased low-
frequency hearing. Similarly, rats with high urinary Cd exhibit decreased learning ability.
Intranasal cadmium destroys olfactory nerve function in the rat42. Cadmium raises the frequency
of spontaneous cortical electrical activity in the rat, lengthens the latency of sensory-evoked
potentials, and impairs frequency following ability even in rats without detectable Cd brain
deposition .
The United States Environmental Protection Agency considers Cd to be a Class B1 carcinogen43.
There is contradictory evidence linking Cd exposure to breast cancer and denying that link.
Prostate cancer is also correlated with Cd consumption as is pancreatic cancer. In the Third
NHANES cohort, Cd was associated with pancreatic and lung cancer and non-Hodgkin’s
lymphoma. Other investigators have found a plausible association between Cd and lung cancer
and weak evidence for a link between Cd and non-Hodgkin’s lymphoma.
It has been found that cadmium has not a single physiological function within the human body.
Therefore, attention has been diverted to its biohazardous potential. Once cadmium is absorbed,
it accumulates in the body even throughout the life. Even low concentration of cadmium can
adversely affect the number of metabolic processes in animal body. Cadmium intoxication can
lead to kidney, bone and pulmonary damages44. Data indicated that cadmium toxicity affects
various organs such as the liver, lung, testis and hematopoietic system in animals45. Literature
indicates that excessive intake of cadmium in cattle can lead to loss of appetite, anemia, poor
growth, abortions and teratogenic effects. Excessive intake of cadmium alters the metabolism of
zinc and copper in animals.

Besides the above-mentioned findings, there are also some evidences which, indicated that
mitochondrial dysfunction is resulted due to cytotoxicity of cadmium. Acute toxicity in humans
with cadmium can occur at the level of 1,500 to 8,900 mg or 20 to 30 mg kg -1 which results in
human fatalities. Besides human fatalities, high doses of cadmium are known to cause gastric
annoyance that finally results in vomiting, abdominal pain and diarrhoea. An acute toxicity
symptom generally includes abdominal and muscular cramps, headache, overtiredness, shock
and ultimately death46. Cadmium is also absorbed in significant quantities from cigarette smoke
which ultimately cause toxic effects on both human and animal health. The deleterious effects
are especially on kidneys, liver and vascular system but most undesirable effects have been seen
on reproductive tissues and developing embryos47.
Male infertility in rats from Cd exposure is due to damage to the blood-testis barrier, decreasing
germ cell adhesion leading to germ cell loss, reduced sperm count and subfertility or infertility .
Rat studies further suggest Cd may induce production of prostaglandin F2 alpha which causes
cavernosal vasoconstriction and suppressed testosterone synthesis and secretion in the male, as
well as destruction of corpus luteum and fetus in the female. These occur perhaps through
inhibition of steroidogenic acute regulatory protein which is responsible for the rate limiting step
in steroidogenesis. Human epidemiological studies have not, however, supported Cd as a cause
of male infertility or erectile dysfunction.
The earliest sign of kidney damage to the workers who are exposed to cadmium during mining,
smelting or roasting process in industries includes an increase in urinary levels of β2-
microglobulin and retinal binding protein. But these signs are absent in general population48.
Cadmium is considered to be a metalloestrogen, but evidence to support that contention is
stronger in in vitro and in vivo animal studies than in population-based human studies . IT is
based partly on binding of Cd to breast cancer estrogen receptors. It seems that estrogen-like
effects of Cd result from a mechanism different from that of steroidal estrogens49.
Studies on cadmium toxicity in animals as well as in humans are well documented found that
contamination in animals occurs through forage, feed and water while in human being cadmium
contamination can occur by the utilization of dairy products like meat and milk50. He also studied
the relationship between cadmium concentration in organs of cattle and cadmium contents in soil
and found that contamination in cattle organs is due to the feeding on forages growing on
contaminated soils. Most countries of the world are giving great attention to the production of
safe and healthy meat for human use.
Many researchers studied the metal toxicity in the meat and other organs of cattle51. In this
regard an experiment was performed on liver and kidneys of cattle to find the heavy metal
accumulation in these organs. The results suggested that cadmium gradually and progressively
accumulated in animal tissues, especially in kidneys .A study showed that kidneys of cattle older
than 5 years are unfit for human consumption because of accumulation of cadmium in high
amounts. It was also observed that organically raised cows had lower levels of cadmium in
kidney, liver and mammary tissue than conventionally raised cows which may be due to feeding
of organically raised animal on the roughage containing less amount of cadmium .
Milk is an essential diet for children as well as for adults. If lactating cows are exposed to high
quantities of toxic metals, such as cadmium and lead, these metals disturb different metabolic
activities as well as health of children. Therefore, Jeng et al. studied 107 milk samples collected
from different dairy farms for cadmium and lead contamination and found that cadmium was not
at toxic level52. Another study endorses the above findings that the concentration of cadmium
was found to be under permissible level in cow and buffalo milk of Madras city (India) which
ranged from 4.0-25.2 mg mL-1 .While there is difference of opinion to above results as
Smirjakova et al. found high concentration of cadmium in animal milk and fatty tissues53. As a
result of utilization of this milk and fatty tissues, many people were exposed to cadmium
toxicity.
Miller et al. found that only a small fraction of dietary cadmium accumulated in milk of goats54.
More over 104 specimens were collected from the rural area of Arnea and metal contaminated
area of Olympias for copper, zinc, lead and cadmium analysis in the liver and kidney of goats.
Liver and mainly kidney specimens collected from Olympias had higher cadmium levels than
permissible, so these should be avoided for human utilization55.

2.3 Lead
Lead is a naturally occurring bluish-grey metal found in small amounts in the earth's crust56. It is
a ubiquitous element that is found in rocks, soil, plants, animals and human beings however, it
naturally occurs in a quite low level. For centuries, lead has been mined, used in industry and in
household products such as petrol, cigarettes, paint, ceramic glazes, smelters, televisions,
pesticides, computer monitors, batteries, explosives, pipes and toys. The current annual world
production of lead is approximately 5.4 million tons and still continues to rise resulting an
intensive pollution of the environment with this metal.
The synthesis of new chemical substances also gives rise to the chemical or heavy metal
pollution which causes toxic, mutagenic or carcinogenic effects on human health57. Lead toxicity
was recognized in early 200 B.C. It was found in 250 B. C. that lead causes anemia and colic in
human beings. Sugar of lead was used to sweeten wine that results in a disease known as
saturnine gout. Lead can also be found in some cosmetics from the Middle East, India, Pakistan,
and some parts of Africa, and surma from India58.
Source of lead in drinking water is mainly though the lead pipes or tin solders and brass fixture
Materials. Phosphate rock is thought to be one of the important sources of heavy metal pollution
in Pakistan. Phosphate rock of Pakistan has high concentration of lead than the imported rocks.
These rocks are mainly used in fertilizers preparations. In addition, this phosphate is also used in
detergent manufacturing and used in livestock and poultry feed preparation .So, phosphate rocks
are found to be one of the sources of lead in air, water and soil which ultimately enters in food
chain59.
According to Occupational Safety and Health Administration (OSHA), National Institute for
Occupational Safety and Health (NIOSH) and American Conference of Governmental Industrial
Hygienists (ACGIH) permissible limit of lead in the air of workplace is 50μg m-3. While
according to FDA calculations, the permissible limit regarding lead exposure that a person can
consume without being ill is 0.5 μg mL-1 60.
The Center for Disease Control and Prevention (CDC) states that a person having blood lead
level (BLL) 10 μg dL-1 or above is a matter of great concern. Lead can impair the development
of children even at BLLs below 10 μg dL -1 61."Maximum allowable level" of lead in drinking
water is 0.05 mg L-1. While, lead at 500 mg L -1in soil or solid waste is said to be as "hazardous
waste". But today no level of lead is considered to be safe as it produces a strong negative effect
on human and animal health. Today every one is exposed to environmental lead in the form of
industrial wastes, leaded gasoline and other anthropogenic sources13. Air pollution is very
common in the big cities because of the vehicles burn gasoline containing lead. It is thought that
lead is responsible for number of deaths. Its pollution can affect the individual of any age but
children are more susceptible to it which may exhibit change in behavioral patterns62.
It has been observed that symptomatic lead poisoning in children generally develops at blood
lead levels greater than 80 ug dL-1 and shows the signs such as abdominal pain,
irritability,lethargy, anorexia, pallor, ataxia and slurred speech. In the case of sever poising,
symptoms can be worse like convulsions, nephropathy and ultimately death. Lead can also cause
renal cancer and CNS damage63.
Local studies have supported the above view that the vegetables grown on the agriculture land
irrigated with waste water or dressed with solid sewage sludge are at high risk of heavy metal
contamination. Land application of sewage sludge or sewage water and other industrial wastes
gradually increases the toxic metals in the soils which contaminate plants. These plants absorb
toxic metals which finally enter into the food chain. Lead from soil tends to concentrate in root
vegetables (e.g., onion, carrot, turnip, radish, etc.) and leafy green vegetables e.g. spinach,
lettuce. Many authors have reported that presence of heavy metals in sludge used for irrigation
purpose can result in phytotoxic effects. Soil and water contamination with heavy metals and
their accumulation in food products can be hazardous for human health. It has been reported that
deficiency of calcium, iron, or zinc in diets promotes the lead absorption in individuals64.
All the food of animal origin contains lead in higher concentration .So, the contamination of the
human consumer can happen by using meat, offal and milk. The world production of goat milk is
relatively less as compared to bovine milk. In the last 20 years the world goat population reached

758 million with 55% increase and goat milk production has reached 12.2 million tones with
58% increase during the same period 65. Children are at the high risk of lead toxicity because
they use indirectly the contaminated food especially milk and milk products. An experiment was
performed to study the concentration of lead in the milk of cow and buffalo reared in Madras
city. The concentration of lead was found to be high than the permissible range. The
concentration ranged from ND- 36.6 ng mL -1 and 4.0- 25.2 ng mL -1 in cow and buffalo milk
respectively .While the effect of lead feeding and its secretion in cow milk was noted by
Marshall et al. which showed that lead contents increased in cow milk after oral intake of large
quantities of lead through forages66. Similarly, in another study the lead contents in the milk
sample of cows was found to be in the following range 22.1-59.2 μg L-1 .But in contrast to the
above findings, lead level was found low than the tolerable limit in cows milk. Lopez et al. found
that in goat milk the level of lead was high in both raw and pasteurized goats than in cow’s milk
feeding with normal forages67. Rodriguez et al. found that concentration of lead in goat milk is
higher than that of cow milk68. Okada et al. found that lead level was high in the goat milk of
southeastern Brazil which was over the maximum limit of 0.05 mg kg -1 established by Brazilian
legislation69.
Besides goats, studies in cattle showed that lead accumulates in the tissues/organs of cattle but
their concentrations were higher in liver and kidneys than the other organs and tissues. Similarly,
Miranda et al. conducted the same study on cattle of industrial and rural area of Asturias
(northern Spain) to determine the lead concentration70. Their observations indicated that samples
collected from cattle of industrial area have high concentration of lead especially in liver and
kidneys than that of rural area. But in contrast to the above findings, lead level in different
tissues (liver, kidney, muscles and blood) of cattle has been measured by Alonso et al. in Spain
and found that overall levels of lead did not constitute a risk for animal health71.
Similarly in an experiment performed in Slovenia in a period between 1989 and 1993 on cattle to
determine the concentration of lead in their tissues the results showed that the level of lead was
within the tolerable limit in the tissues of cattle .However, Jukna et al, found high concentration
of lead in lungs, liver and kidney of cattle72.
Abou Doina performed a study in Cairo for the estimation of lead concentration in different
animal muscles and consumable organs including muscles, livers, kidneys, spleen and hearts of
animals such as buffaloes, cattle, sheep and goats73. It has been observed that kidney sampled
from the cattle beside heavy traffic area and urban area contained the highest concentration of
lead which was 0.198 and 0.490 mg/kg, respectively, while kidneys of buffaloes collected from
industrial area contained the highest concentration of lead 0.790 mg kg-1. It can be inferred from
the above experiment that the concentrations of lead in liver and kidney was found to be the
highest in industrial area than the other areas. So consumption of meat and consumable organs
obtained from the industrial areas should be avoided.
A study was performed in Nigeria to determine the lead level of some fruits and leafy vegetables.
The results of the analysis showed that the levels of Pb in all samples were between 0.072 mg/kg
in pawpaw and 0.21 mg/kg in fluted pumpkin plant with range of 0.021 - 0.108 and 0.15 - 0.27,
respectively. The highest levels of Pb in fruits were observed in pineapple, banana, apple and
watermelon and in leafy vegetables. Highest contents were observed from fluted pumpkin plant,
water leaf, plumed cocks comb and gboma plant in that order. Pb being a serious cumulative
body poison enters into the body system through air, water and food and cannot be removed by
washing fruits and vegetables. The high levels of Pb in some of these plants may probably be
attributed to pollutants in irrigation water, farm soil or due to pollution from the highways traffic.
The level of Pb reported in this study is comparable to those reported for apple (0.19 and 0.76
mg/kg); watermelon (0.30 mg/kg); orange (0.15 mg/kg) and banana (0.02 mg/kg) by Radwan
and Salama and Parvean et al.74 75.

2.4 Copper
Copper is a reddish brown nonferrous mineral which has been used for thousands of years by
many cultures76. The name for the metal comes from Kyprios, the Ancient Greek name for
Cyprus, an island which had highly productive copper mines in the Ancient world. Its atomic
number is 29, placing it among the transition metals. The metal is highly conductive of both
electricity and heat, and many of its uses take advantage of this quality. Copper can be found in
numerous electronics and in wiring. It is also used to make cooking pots. This metal is also
relatively corrosion resistant. For this reason, it's often mixed with other metals to form alloys
such as bronze and brass. The metal is closely related with silver and gold, with many properties
being shared among these metals. Modern life has a number of applications for copper, ranging
from coins to pigments, and demand for the metal remains high, especially in industrialized
nations. Many consumers interact with it in various forms on a daily basis.
In addition to being useful in manufacturing, copper is also a vital dietary nutrient, although
only small amounts of the metal are needed for well-being. It appears in several enzymes,
facilitates the absorption of iron, and helps to transmit electrical signals in the body. In high
doses, however, the metal can be extremely toxic77. Copper can also saturate the water and soil,
posing risks to wildlife. On a more benign level, it can stain clothing and flesh, as many people
have probably noticed.
The main foods that have high amounts of Copper are: Shellfish, Nuts and Seeds (except for
pumpkin seeds), Soybeans (tofu, miso, etc.), Legumes, Wheat, Coconut, Avocado, Chocolate,
Coffee, Leafy Greens.
The circulation and proper utilization of copper in the body requires good functioning of the
liver, gall bladder and adrenal glands. If any of those organs are impaired, the body cannot
properly excrete and utilize copper. Initially, the copper will build up in the liver, further
impairing its ability to excrete copper78. As copper retention increases, it will build up in the
brain, the joints and the lungs, adversely affecting the structure and function of the tissues.
Copper is a powerful oxidant causing inflammation and free radical damage to the tissues. To
avoid these toxic effects, it must be bound to the binding proteins, ceruloplasmin and metallo-
thionein. These proteins can become deficient due to impaired adrenal and liver function which
allows free copper to build up. It can have a toxic effect (similar to other heavy metals) on the
body and mind and it is a contributor to many chronic illnesses and mental disturbances.
The incidence of copper sulphate poisoning varies at different geographical areas depending on
the local use and the availability of other suicidal poisons. Its incidence is reported to be 34%
and 65% of the total poisoning cases in two studies from Agra and New Delhi in 1960s. The
mortality rates vary from 14-18.8%. In another study from Aligarh in 1970s, it was the
commonest mode of poisonings at that center accounting to 118 cases over four and a half years.
However, the incidence of copper sulphate poisoning is declining in certain parts of India. Chugh
et al., reported a decrease in the number of cases of acute renal failure attributed to intentional
copper sulphate ingestion among patients admitted to a renal unit in northern India over a period
of three decades from five per cent in the 1960s to one per cent in the 1980s. In another autopsy
series from north India, copper sulphate ingestion was responsible for 22% of deaths due to
poisoning from 1972 to 1977. However, it declined to 3.85 and 3.33% between 1977-1982 and
1982-1987 respectively. Pediatric cases of copper sulphate ingestion are rare, with only few case
reports available in literature79.
Two hundred seventy-five United States coins were discovered in the stomach of a mentally
disturbed individual at autopsy. Many coins containing copper were corroded by prolonged
contact with gastric juice, with subsequent absorption and deposition of copper in the liver and
kidneys. The patient died from complications related to the acute toxic phase of chronic copper
poisoning. As a discussion to the case, foreign-body ingestion, gastric bezoars and the
mechanism of copper toxicity is presented. To our knowledge, this is the first death due to
copper intoxication following a massive ingestion of coins.
The influence of pH, dissolved organic carbon (DOC) concentration, water hardness, and
dissolved organic matter (DOM) source on the acute toxicity of copper were investigated with
standardized 48-h Daphnia magna toxicity tests. Toxicity tests were conducted according to a
four-factor complete factorial design. Nominal factor levels were as follows: pH 6 and 8; DOC,
2.5 and 10 mg/L; hardness, 10, 20, and 40 mg/L as CaCO3; and two DOM sources (collected
from the Black River and Edisto River, SC, USA). The experimental design resulted in 24
different factor level combinations. Results indicated that all factors had significant effects on
copper toxicity. Furthermore, a strong interactive effect of DOC concentration and pH was
detected. Because the biotic ligand model (BLM) has become a widely used tool for predicting
toxicity and interpreting toxicity test results, its performance with these data was evaluated.
Seventy percent of BLM predictions were within twofold of the observed median lethal
concentrations. However, BLM parameters could be adjusted to improve model performance
with this data set. This analysis suggested that in soft waters, the CuOH+ complex binds more
strongly with the biotic ligand and that the competitive effect of hardness cations should be
increased. The results of the present study may have implications for application of the BLM to
some types of surface waters. Furthermore, a comprehensive analysis of BLM performance with
all available data should be performed, and necessary updates to model parameters should be
made to produce the most robust and widely applicable model80.
Fish either can not or will not avoid copper concentrations that might be detrimental. Holland et
al. reported some of the effects copper has on fish81. Copper salts combine with proteins present
in the mucus of the fish's mouth, gills, and skin, preventing aeration of the blood. Death
sometimes results. Turnbull et al. also noted a copper precipitate clinging to fish82. Bluegill
exhibited several weeks of periodic muscle spasms. Baker, working with flounders, observed
neuromuscular disorders just prior to death. Brook trout that were exposed to copper had
increased cough frequencies. Grande noticed that salmon fry darkened and refused to eat83. Loss
of appetite was also noticed in brook trout. Perhaps the feeding inhibition prevented fathead
minnow fry in copper solutions from growing as rapidly as the control fry. Mummichogs
developed lesions along the lateral line. O'hara stated that bluegill's oxygen consumption
increased about 3 to 6 hours after copper was introduced84.
It is unclear whether copper nanoparticles are more toxic than traditional forms of dissolved
copper. This study aimed to describe the pathologies in gill, gut, liver, kidney, brain and muscle
of juvenile rainbow trout, Oncorhynchus mykiss, exposed in triplicate to either a control (no
added Cu), 20 or 100 mu gl(-1) of either dissolved Cu (as CuSO4) or Cu-NPs (mean primary
particle size of 87 +/- 27 nm) in a semi-static waterborne exposure regime. Fish were sampled at
days 0, 4, and 10 for histology. All treatments caused organ injuries, and the kinds of pathologies
observed with Cu-NPs were broadly of the same type as CuSO4 including: hyperplasia,
aneurisms, and necrosis in the secondary lamellae of the gills; swelling of goblet cells, necrosis
in the mucosa layer and vacuole formation in the gut; hepatitis-like injury and cells with
pyknotic nuclei in the liver; damage to the epithelium of some renal tubules and increased
Bowman's space in the kidney. In the brain, some mild changes were observed in the nerve cell
bodies in the telencephalon, alteration in the thickness of the mesencephalon layers, and
enlargement of blood vessel on the ventral surface of the cerebellum. Changes in the
proportional area of muscle fibres were observed in skeletal muscle. Overall the data showed that
pathology from CuSO4 and Cu-NPs were of similar types, but there were some material-type
effects in the severity or incidence of injuries with Cu-NPs causing more injury in the intestine,
liver and brain than the equivalent concentration of CuSO4 by the end of the experiment, but in
the gill and muscle CuSO4 caused more pathology85.
The four larval instars of the midge Chironomus tentans Fabricius were exposed to copper to
determine their relative sensitivities. The impact of copper on adult emergence and effect of
exposure time on LC50 values were also determined. First-instar larvae appeared to be the most
sensitive to acute exposure, with a 96-h LC50 of 298 mµg/L copper, followed by second-instar
(LC50 = 773 mµg/L), third-instar (LC50 = 1,446 mµg/L) and fourth-instar (LC50 = 1,690
mµg/L) larvae, at a water hardness of 71 to 84 mg/L. Adults emerged successfully from fourth-
instar larvae and pupae that survived 20-d copper exposures of up to 235 mµg/L; the 20-day
EC50 was 77.5 mµg/L.Methods for continuous culture of C. tentans in a flow-through rearing
facility using Cerophyl, a commercially available powdered grass product, as food and substrate
are presented86.
.

2.5 Arsenic
Arsenic toxicity was recognized from centuries and it has been used since 3000 BC87. In the
United Kingdom, it was used for the extraction of iron from iron ore. Arsenic was extensively
used as a pesticide. In a year, 20,000 tons arsenic was imported to USA and was used to spray on
crops. No attention was paid to this finally arsenic now appears in foodstuffs, which is one of the
major intimidator for human health. Arsenic is among the most toxic metals found in the
environment. It has three valence states: As (0), As (III) and As (VI) (ATSDR, 2000). Inorganic
form of arsenic is generally more toxic than organic form. Arsenic contamination has become a
trouble in many parts of the world including Australia, Canada, Japan, Mexico, Thailand, United
Kingdom, Argentina, Bangladesh, Cambodia, China, Ghana, Hungary, Inner Mongolia, Mexico,
Nepal, New Zealand, Philippines, Taiwan, the United States and Vietnam. It is ubiquitous metal
present in air, soil and water88. In air it enters through burning of materials, contaminated with
arsenic such as wood, coal, metal alloys and arsenic wastes. Arsine gas is highly dangerous
source of poison. Arsine gas is generated from microelectronics industries, metallurgical and
mining processes.
Contamination of arsenic is also found in ground water which is also a serious problems
encountered especially in third world countries .Arsenic in drinking water and food supply
causes slow poisoning and risk of death in more than 100 million people worldwide. Any person
who drinks water containing 60 ppm arsenic will soon die89.
Bangladesh people are exposed to arsenic pollution through food chain. The amount of arsenic is
less in food than drinking water. It has been estimated that in Bangladesh, 35-77 million people
are at the risk of arsenic poisoning from drinking water90. Arsenic has contaminated 85% of
groundwater of the total area of Bangladesh. It accumulates in human bodies by the intake of
polluted drinking water. The level of arsenic in soil ranged from 7.37-10.97 mg kg -1 and the tube
well water contains much higher concentrations of arsenic i.e. 0.48 mg L-1 and 0.46 mg L-1.
Finally this arsenic is transferred into food stuffs like rice grain. The contaminated rice straw is
used in feed for the cattle that might increase the arsenic accumulation in cattle tissues and
organs. The leafy vegetables like tomato, brinjal had higher arsenic accumulation than the fruits.
Therefore, the use of arsenic contaminated leafy vegetables would be dangerous for health91.

Arsenic in drinking water can affect human health and is considered as one of the most
significant environmental causes of cancer in the world92. Therefore, it is necessary to document
the levels of As in drinking water, and its chemical speciation, and for establishing regulatory
standards and guidelines93. The FAO health limit for As in groundwater was until recently 50
μg/L, but in view of recent incidences of As poisoning in the Indian subcontinent, a decrease to
5–10 μg/L is being considered by a number of regulatory bodies throughout the world. The
temporary WHO guideline for As in drinking water is 10 μg/L. This is based on a 6×10⁻⁴ excess
skin cancer risk, which is 60 times higher than the factor normally used to protect human health.
However, the WHO states that the health-based drinking water guideline for As should in reality
be 0.17 μg/L. Previously, such low levels were not feasible to determine as many analytical
techniques had detection limits of 10 μg/L, which is why the less protective guideline was
adopted.
The US EPA drinking water standard for As was set at 50 μg/L in 1975, based on a Public Health
Service standard originally established in 194294. On the basis of investigations initiated by the
National Academy of Sciences, it was concluded that this standard did not eliminate the risks of
skin, lung, and prostate cancer from long-term exposure to low As concentrations in drinking
water. In addition, there are several non-cancer effects related to ingestion of As at low levels,
which include cardiovascular disease, diabetes, and anemia, as well as reproductive,
developmental, immunological, and neurological disorders. In order to achieve the EPA’s goal of
protecting public health, recommendations were made to lower the safe drinking water limit to 5
μg/L, slightly higher than what is considered the technically feasible measurable level (3 μg/L)95.
Recently, the US EPA has established a healthbased, non-enforceable Maximum Contaminant
Level Goal (MCLG) of zero As and an enforceable Maximum Contaminant Level (MCL) of 10
μg As/L in drinking water. This would apply to both non-transient, non-community water
systems, as well as to the community water systems, as opposed to the previous MCL of 50 μg
As/L set by the US EPA in 1975. However, the current drinking water guideline for As adopted
by both the WHO and the US EPA is 10 μg/L. This is higher than the proposed Canadian and
Australian maximum permissible concentrations of 5 and 7 μg As/L, respectively.
Arsenicosis is a chronic illness resulting from drinking water with high levels of As over a long
period of time. It is commonly known as As poisoning. Arseniasis means chronic arsenical
poisoning, also called arsenicalism; the term arsenicism refers to a disease condition caused by
slow poisoning with As.
In a recent publication, Centeno et al. report that As is a unique carcinogen96. It is the only
known human carcinogen for which there is adequate evidence of carcinogenic risk by both
inhalation and ingestion. In a very detailed study spanning a 7-year period, Rahman et al.
indicated that As-affected patients in West Bengal had severe skin lesions97. It was not clear
what number of patients suffered from cancers, because they were too poor to afford the
investigations. However, patients that had premature death due to cancer had serious arsenical
skin lesions prior to that. Also, in follow-up visits, people that were exposed to high levels of As
from drinking water and/or food for many years were frequently developing cancer. These small
communities in West Bengal use groundwater sources for drinking, and this study showed that
intervention of water management is critical.
Taiwanese studies investigated the risk association at 50 μg/L As in drinking water, the standard
that was being reevaluated by the US EPA at that time. Data from Taiwan indicated that there is
increased risk of internal cancers from As exposure through drinking water. In a follow-up study
of 8102 residents from an arseniasis-endemic area in Northeastern Taiwan, the association
between ingested As and risk of cancers of urinary organs was investigated. It indicated that
residents being exposed to well water As for 40 years or more had greater chances of getting
urinary tract cancer than residents that had less than 40 years of exposure98. Conclusions from
these studies suggested that the US EPA needed to revise the 50 μg/L As standard, which has
now been done. It is believed that there is a long latent stage between the time that humans are
exposed to As and final cancer diagnosis. In addition, Ferrecio et al. presented a positive
correlation between ingestion of inorganic As and lung cancer in humans in Chile99. It is already
known that cigarette smoking is a main risk factor for lung cancer, but the authors found that
cigarette smoking plus ingestion of As from drinking water had a synergistic effect.
A significant relationship between As exposure and skin cancer has been observed. In a review,
Rossman et al. pointed out that arsenite can play a role in the enhancement of UV-induced skin
cancers100. The mechanism of action may involve effects on DNA methylation and DNA repair.
In addition, Luster and Simeonova reported epidemiological evidence indicating that As is
associated with cancers of skin and internal organs, as well as with vascular disease.
In a major U.S. study conducted on a population with chronic As exposure through drinking
water, Steinmaus et al. did not find a clear association between bladder cancer risk and exposure101. The risks were lower than those in Taiwan with high As exposure. However, in the U.S.
study there was an elevated risk of bladder cancer in smokers that were exposed to As in
drinking water near 200 μg/L, compared with smokers consuming lower As levels. These data
suggest that As is synergistic with smoking at relatively high As levels (200 μg/L). Steinmaus et
al. highlighted that latency of As exposure causing bladder cancer can be very long (more than
40 years)101.
Hopenhayn-Rich et al. found that mortality from lung cancer was significantly increased with
increasing As ingestion102. In addition, As and cigarette smoke are synergistic, thus increasing
the risk of lung cancer. In a recent Taiwanese study, residents in arseniasis-endemic areas were
followed during an 8-year period. An increased risk of lung cancer was associated with high
levels of As exposure via drinking water. The authors suggested that reduction in As exposure
should reduce the lung cancer risk in cigarette smokers. Southwest Taiwan has been a region that
used wells with high As levels for the past 5 decades. Researchers looked at lung cancer
mortality versus standard mortality ratio (SMR). Their study further indicated that the mortality
from lung cancer declined after the levels of As in the well water were reduced.
China is another country where millions of people are exposed to elevated levels of As. In the
review of Xia and Liu, it was stressed that chronic arsenism in China is a serious health issue,
which the authorities are now trying to tackle103. Measures are being implemented to improve
drinking water sources, patient treatment, and health education. However, in As-endemic areas it
is predicted that cancer incidence may increase over the next 10– 20 years mainly due to
previous exposures. This shows that urgent effective prevention is needed. Often in China, areas

that have chronic arsenism also have increased levels of fluoride in the drinking water. There are
suggestions that the combination of the two could increase the risk to human health due to
potential synergism. This should be further evaluated.
In a study with mice, Wu et al. found that chronic low-level As exposure may affect heme
metabolism, causing porphyrin changes104. These changes may appear in the beginning stages of
arsenicosis, before the carcinogenesis and can be a clinical indicator to diagnosis.
In a cross-sectional study in Taiwan, Tsai et al. suggested that longterm accumulated As may
cause neurobehavioral effects in adolescence; therefore consumption of As in childhood may
affect behavior later in life105. In addition, these effects will be more severe if lead is present,
because of synergistic effects. This facet of As toxicity needs to be addressed further.
Arsenic neuropathy is a recognized complication of As toxicity. Peripheral neuropathy (an
abnormal and usually degenerative state of the peripheral nerves) due to chronic As exposure is
one of the most common complications of the nervous system. The neuropathy is usually sensor
(affects sensation), and the course of development is chronic. Patients can suffer from constant
pain, hypersensitivity to stimuli, muscle weakness, or atrophy. Sensory and sensorimotor
(sensation and muscles are affected) neuropathy have also been observed. The authors suggest
that neurological symptoms are more frequently associated with people that have chronic As
exposure, so duration, amount of As exposure, and nutritional factors together may affect As
toxicity.
A study of children in Mexico found that urinary As concentration was inversely associated with
verbal IQ and long-term memory. In addition, it was found that long-term memory, attention and
the ability to understand speech may be affected by exposure to As in people with chronic
malnutrition. Wasserman et al. have also shown that children’s intellectual function can be
decreased by increased As exposure106. This correlation was proportional to the dose, which
means children that had more than 50 μg/L As exposure had lower performance scores than
children with less than 5.5 μg/L exposure. However, this study was limited to a certain period of
time for a certain group of the population and some questions remained unanswered, like the role
of exposure to As on the intellectual functions, and developing a better understanding of
exposure-outcome by follow-up at an earlier age.
In addition, Watanabe et al., evaluating the effects of As at different ages, found that age is a
very important factor when evaluating effects107. In younger generations, clinical manifestations
are not always obvious and, as a result, can be missed or underestimated, producing
complications later. Effects of early-life exposure are not well understood compared with the
effects of adult exposure.
Lee et al. reported that As ingestion affects the platelets. Platelets are key players in
cardiovascular disease108. In the presence of thrombin, trivalent As (arsenite) was observed to
increase platelet aggregation. In vivo, As in drinking water increased arterial thrombus formation
in rats. The authors indicated that platelet aggregation increased with long-term exposure to As
in drinking water, being one of the factors causing cardiovascular disease. The authors proposed
that their results may be used for estimation of risks from thrombosis and cardiovascular disease
in humans, but further evidence is necessary to support their findings.
Guha Mazumder confirms the findings of previous studies in that chronic exposure to As is
associated with pigmentation, keratosis, skin cancer, weakness, anemia, dyspepsia, enlargement
of the liver, spleen, and ascites (fluid in abdomen)109. Other symptoms included chest problems
like cough, restrictive lung disease, polyneuropathy, altered nerve conduction velocity, and
hearing loss. In West Bengal, India, people are endemically exposed to more than 50 μg/L As in
drinking water. Patients reported having irritability, lack of concentration, depression, sleep
disorders, headaches, fatigue, skin itching, burning of eyes, weight loss, anemia, chronic
abdominal pain, diarrhea, edema of feet, liver enlargement, spleen enlargement, cough, joint
pain, decreased hearing, decreased vision, loss of appetite, and weakness. Liver enzymes were
increased and liver histology showed fibrosis (fibrotic tissue in liver). Other symptoms included
cirrhosis (end stage of hepatic reaction to liver parencymal cell injury), hematemesis (vomiting
with blood), and melena (the passage of dark, pitchy and grumous stools stained with blood
pigments or with altered blood). It was found that the longer the time of exposure, the more
severe the signs and symptoms of As toxicity.

METHODOLOGY
3.1 Analysis of elements
For screening heavy metals, the principal methods used are energy dispersive X-Ray
fluorescence110, neutron activation analysis (NAA)111, mass spectrometry (MS)112, flame atomic
absorption spectroscopy (AAS)113 and flame atomic emission spectrometry (AES)113, chemical
polarography114, voltametric methods115, Infrared spectroscopy (IR), Nuclear magnetic resonance
spectroscopy (NMR), anodic stripping voltammetry116 and High performance liquid
chromatography (HPLC)117. This study will be done by atomic absorption spectroscopy (AAS)
because of its availability.
3.1.1 Atomic absorption spectroscopy
Atomic absorption spectrometry was first used as an analytical technique, and the underlying
principles were established in the second half of the 19th century by Robert Wilhelm Bunsen and
Gustav Robert Kirchhoff, both professors at the University of Heidelberg, Germany.
The modern form of AAS was largely developed during the 1950s by a team of Australian
chemists. They were led by Sir Alan Walsh at the Commonwealth Scientific and Industrial
Research Organisation (CSIRO), Division of Chemical Physics, in Melbourne, Australia.
Atomic absorption spectrometry has many uses in different areas of chemistry such as:
Clinical analysis: Analyzing metals in biological fluids and tissues such as whole blood,
plasma, urine, saliva, brain tissue, liver, muscle tissue, semen
Pharmaceuticals: In some pharmaceutical manufacturing processes, minute quantities of a
catalyst that remain in the final drug product
Water analysis: Analyzing water for its metal content.
3.1.2 Principles
The technique makes use of absorption spectrometry to assess the concentration of an analyte in
a sample. It requires standards with known analyte content to establish the relation between the
measured absorbance and the analyte concentration and relies therefore on the Beer-Lambert
Law.
In short, the electrons of the atoms in the atomizer can be promoted to higher orbitals (excited
state) for a short period of time (nanoseconds) by absorbing a defined quantity of energy
(radiation of a given wavelength). This amount of energy, i.e., wavelength, is specific to a
particular electron transition in a particular element. In general, each wavelength corresponds to
only one element, and the width of an absorption line is only of the order of a few picometers
(pm), which gives the technique its elemental selectivity. The radiation flux without a sample
and with a sample in the atomizer is measured using a detector, and the ratio between the two
values (the absorbance) is converted to analyte concentration or mass using the Beer-Lambert
Law. Radiation flux is a measure of the flow of radiation from a given radioactive source.
Φ = L⁄4πr2 is the radiation flux, L is the Luminosity (measured in Watts) and r is the distance from
the radiation source. Radiation flux density is a related measure that adds area dimensions to the
above definition
3.1.3 Instrumentation
In order to analyze a sample for its atomic constituents, it has to be atomized. The atomizers
most commonly used nowadays are flames and electrothermal (graphite tube) atomizers. The
atoms should then be irradiated by optical radiation, and the radiation source could be an
element-specific line radiation source or a continuum radiation source. The radiation then passes
through a monochromator in order to separate the element-specific radiation from any other
radiation emitted by the radiation source, which is finally measured by a detector

Figure: Schematic diagram of AAS equipment
a. Radiation source (Hollow cathode lamp)
This is the source of analytical light line for the element of interest and gives a constant and
intense beam of that analytical line.
b. Atomiser (Flame)
The atomiser will destroy any analyte ions and break complexes to create atoms of the element
of interest.
c. Wavelength selector (Monochromator)
A wavelength selector isolates analytical line photons passing through the flame and remove
scattered light of the other wavelength from the flame. This only impinges a narrow line on the
photomultiplier tube.
d. Detector (Photomultiplier tube (PMT)
It determines the intensity of the analytical line exiting the monochromator. The PMT is the most
commonly used detector for AAS.
3.2 Sample collection: Raw milk samples will be collected from 30 dairy farms which are
situated around Industrial area or waste disposal area in Bangladesh.
3.2.1 Sample preparation: Liquid samples will be prepared by Acid Digestion method
which is described in the literature118. In general, nitric acid is used as oxidant alone or in
combination with other acids (e.g., sulfuric and hydrochloric acids) or sometimes with hydrogen
peroxide. In addition, hydrofluoric acid can be used in combination with nitric acid for the total
decomposition of silica containing organic matrices. Nitric acid is popular because of its
chemical compatibility, oxidizing ability, availability, purity, and low cost119. Solid samples will
be prepared Dry ashing method which is described in literature118. Dry ashing or oxidation is
usually performed by placing the sample in an open vessel and destroying the combustible
(organic) portion of the sample by thermal decomposition, normally in the presence of an ashing
aid, using a muffle furnace. Typical ashing temperatures are 450 to 550°C at atmospheric
pressure, and the ash residues are dissolved in 5-10%.
3.2.2 Analytical methods and instrumentation: Copper and lead in milk and milk
products will be determined according to previously described methods. The samples will be
analyzed in a laboratory with a quality assurance schemes by using Atomic Absorption
Spectrophotometer.
3.2.3 Measurement of different variables: Exposure estimates will be compared to
health-based toxicological reference values (e.g. heavy metals to be compared with acceptable
daily intakes ADI).
3.2.4 Data analysis: The concentration of copper and lead in milk and milk products will be
determined by using ASpect LS 1.2.0.0, Analytik Jena AG 2011-2012 system software.
Statistical analysis will be performed by using SPSS statistical software of version 17. All values
will be expressed as mean ± standard error of mean (SEM).

RESULT AND DISCUSSION
For centuries, mercury was an essential part of many different medicines, such as diuretics,
antibacterial agents, antiseptics, and laxatives. In the late 18th century, antisyphilitic agents
contained mercury. It was during the 1800s that the phrase "mad as a hatter" was coined, owing
to the effects of chronic mercury exposure in the hat-making industry, where the metal was used
in the manufacturing process. In 1889, Charcot, in his Clinical Lectures on Diseases of the
Nervous System, attributed some rapid oscillatory tremors to mercury exposure120.
In Wilson's classic textbook of neurology, published in 1940, Wilson concurred with Charcot's
attribution of tremors to mercury poisoning, but also described mercury-induced cognitive
impairments, such as inattention, excitement, and hallucinosis121.
In 1961, researchers in Japan correlated elevated urinary mercury levels with the features of the
previously mysterious Minamata disease. Before the etiology of Minamata disease was
discovered, it plagued the residents around Minamata Bay in Japan with tremors, sensory loss,
ataxia, and visual field constriction122.
Organic mercury compounds, specifically methyl mercury, are concentrated in the food chain.
Fish from contaminated waters are the most common culprits. Industrial mercury pollution is
often in the inorganic form, but aquatic organisms and vegetation in waterways such as rivers,
lakes, and bays convert it to deadly methyl mercury. Fish eat contaminated vegetation, and the
mercury becomes biomagnified in the fish. Fish protein binds more than 90% of the consumed
methyl mercury so tightly that even the most vigorous cooking methods (eg, deep-frying,
boiling, baking, pan-frying) cannot remove it.
Fish is widely consumed in many parts of the word by humans because it has high protein
content, low saturated fat and also contains calcium, phosphorus, iron, trace elements like copper
and a fair proportion of the B-vitamins known to support good health123.Many reports on
contamination of fish by chemicals in the environment were reported124. Heavy metals are
considered the most important constituents of pollution from the aquatic environment and the sea
due to toxicity and accumulation by marine organisms, such as fish.

All the aquatic samples collected from the sites contained detectable amounts of the elements
studied (Cadmium, Mercury, Lead). These elements were present in all the fish samples and at
varying concentrations. It must be noted that, varying concentrations of the heavy metals were
measured in the sampled fishes with some fishes reporting very high concentrations whilst other
samples measured relatively lower concentrations. Cadmium is classified as chemical hazards
and maximum residual have been prescribed for human125.Cadmium tended to be the least
concentrated in the fish as compared to other elements measured. Concentrations of cadmium
varied from 0.50± 0.01 mg/Kg (dry wt.) which is high compared to the permissible level of 0.01
mg/Kg. Exposure to heavy metals such as cadmium is of immediate environmental concern. A
direct relationship between heavy metal poisoning and thyroid dysfunction was reported in
rabbits by Ghosh and Bhattacharya126.According to the Third National Report on Human
Exposure to Environmental Chemicals (NHANES), Cd exposure is widespread in the general
population . No standards exist correlating blood or urine Cd measurements with clinical
toxicity; The kidney is considered the critical target organ for the general population as well as
for occupationally exposed populations. The accumulation of cadmium in the kidney leads to
renal dysfunction. Chronic obstructive airway disease is associated with long-term high-level
occupational exposure by inhalation.
The lead levels recorded in all the species exceeded the permissible limits of WHO which
mentioned that lead level should not be more than 2 mg/Kg127. Humans that relay on the fish and
water from OgoniL and are at great risk. The bioaccumulation of these metals may pose great
hazard to health of humans. Chronic lead poisoning is characterized by neurological defects,
renal tubular dysfunction and anemia.
EDTA is approved by the FDA for lead and other heavy metals, and has a long history of safe
use. It should not be given faster than one gram per hour nor in dosage greater than three grams
per session. Sessions should be at least five days apart, and replacement of essential minerals
should be done orally between sessions. Several effective protocols exist implementing these
principles128.

In an earlier evaluation the Joint FAO/WHO Committee on Food Additives (JECFA) reaffirmed
a previous tentative evaluation of a maximum daily load of 0.5 mg/kg body weight as a
Provisional Maximal Tolerable Intake (PMTDI) for man from all sources, which amounts to 30
mg/day for a 60 kg person129. The Scientific Committee on Food (SCF) has established a
Population Reference Intake (PRI) of 1.1 mg copper/day130. The Tolerable Upper Intake Level
(UL) for copper set by the SCF is 5 mg/day for adults, which would correspond to 6.34 mg/day
of copper(II) oxide and 1-4 mg/day for children, depending on age.
Copper salts have moderate acute toxicity, with soluble salts being more toxic than insoluble
ones. In short- term (2 weeks) repeated dose toxicity tests in rats and mice, copper salts are
associated with adverse effects such as gastro-intestinal irritation and liver and kidney toxicity.
Reported NOAELs are in the range of 23-104 mg/kg bw/day copper, but kidney effects have
been shown in male rats at levels as low as 10 copper mg/kg bw/day.
Acute toxicity of copper in humans is rare. An average daily consumption of 1.64 litres of
drinking water containing 3 mg/L ionised copper(II) was associated with nausea, abdominal pain
or vomiting.
In a human study both copper sulphate (a soluble compound) and copper(II) oxide (an insoluble
compound) showed comparable effects, implying that the ionic copper present in the stomach is
responsible for the induction of gastrointestinal manifestations. Twenty subjects presented
gastrointestinal disturbances at least once during the study, suffering diarrhea (with or without
abdominal pain and vomiting), and the other eleven subjects reported abdominal pain, nausea, or
vomiting.
Four methods have been described for evaluating As exposure in humans based on As
concentration in drinking water. The first method uses the concentration of As in drinking water
as an index of exposure, but it does not consider individual consumption volume. This reflects
only current exposure that correlates with short-term effects, but provides less information about
long-term effects. The second method seeks to establish the daily body burden of As from the
amount of drinking water consumed. Air temperature and humidity may effect the daily

individual consumption. The third method is based on average As exposure. This is an advanced
index because it can assess the link between exposure and chronic health effects, such as cancer,
occurring after long-term exposure. The last method is a cumulative As exposure index, which is
more appropriate for cases where As levels in drinking water have changed, or where there has
been a long period of low level As exposure131.
Preliminary studies in different parts of Bangladesh indicate that the food chain in is exposed to
contamination by heavy metals and trace elements. Islam et al. found that industrial sludge, often
used as a soil conditioner or fertilizer, has high concentrations of heavy metals132. Similarly, high
levels of heavy metals were found in soils in the Sundarbans133. When these metals are absorbed
by crops and animals they enter the food chain and constitute a serious health hazard. An
analysis of heavy metal concentrations in vegetables in Jessore shows that all of the vegetables
commonly consumed in diets contain dangerously high concentrations of heavy metals134.
This study will investigate the exposure to heavy metals (mercury, cadmium, lead, copper, and
arsenic) in water and food in Bangladesh. This will be done through the total diet study (TDS)
approach. Research findings will provide the necessary evidence to reduce food contamination in
Bangladesh in order to improve human health.

CONCLUSIONS AND FUTURE PROSPECTS
Contamination of metals in the environment and human diet represents a persistent problem that
will continue to be a burden on human health. The purpose of this study will be focused on
concentration of selected metals in water and food. The results of this study will be compared
with those of other studies revealed similar levels of metals in water and food. Future studies
focus on the ability of lactobacilli to bind an array of heavy metals at human physiologically
relevant concentrations and assess in humans the extent to which levels can be reduced over
time. If such interventions can encompass locally produced foods, this may potentially provide
an affordable option for billions of people around the world who are consuming these toxic
metals inadvertently on a daily basis.

REFERENCES
1. Kennish, M. J., 1992. Ecology of Estuaries Anthropogenic Effects. CRC Press, Boca
Raton. pp. 494.
2. Connell, D.W. and Miller, G.J., 1984. Chemistry of Ecotoxicology Pollution. John Wiley
and Sons, New York.
3. Alloway, B.J., 1990 Heavy metals in soils. John Wiley and Sons, Inc. New York, ISBN
0470215984 EC 1999 Integrated Pollution Prevention and Control (IPPC) Best available
techniques reference document on the production of iron and steel. Publ: EC European
IPPC Bureau 370 pp.
4. Baralkiewicz, D. Karas, Z. Siepak, J., 1997.Application of the fast ETAAS Method for
the determination of chromium, cobalt and nickel in samples of preserved food, Chem.
Anal. 42,691.
5. Husain, A., Baroon Z., Al-Khalafawi S., Al-Ati T.and Sawaya W., 1995. Heavy metals in
fruits and vegetables grown in Kuwait during the oil well fires. J. Sci. Research. 13:
(3)535-542.
6. Needleman H L, and Bellinger D, 1991.Annual Review of Public Health, Vol. 12: 111 -
140.
7. National Food Policy Plan of Action 2008-2015. Food Planning andMonitoring Unit
(FPMU), Ministry of Food and Disaster Management,Government of the People’s
Republic of Bangladesh.
8. Volesky B. Biosorption and biosorbents. In: Volesky B, editor.Biosorption of Heavy
Metals. Florida: CRC press; 1990a. p. 3–5.
9. Canlý, M. and Atlý, G., 2003. The relationships between heavy metal (Cd, Cr, Cu, Fe,
Pb, Zn) levels and the size of six Mediterranean fish species. Environmental Pollution,
121:129-136.
10. Mtanga, A., & Machiwa, J. F., 2007. Heavy metal pollution levels in water and Oysters,
Saccostrea cucullata, from Mzinga creek and Ras Dege mangrove ecosystems, Tanzania.
African Journal of aquatic science, 32(3), 235-244.
11. Andrada, D., F.G. Pinto, C.G. Magalhaes, B.R. Nunes, M.B. Franco and J.B.B. D. Silva,
2006. Direct determination of lead in human urine and serum samples by electrothermal

atomic absorption spectrometry and permanent modifiers. J. Braz. Chem.Soc., 17(2):328-
332.
12. Fernandes, A.G., Ternero M. and. Barragan G.F, 2000. An approach to characterization
of sources of urban air born particles through heavy metal speciation. Chemosphere, 2:
123-136.
13. Sanyal, S.K. and Nasar S.K.T., 2002. Arsenic Contamination of Groundwater in West
Bengal (India): Build up in soil-crop system. In: Analysis and Practice in Water
Resources Engineering for Disaster Mitigation. New age International (P) limited,
Publishers, New Delhi, pp. 216-222.
14. Ward, N.I. and Savage J.M., 1994. Metal dispersion and transportational activities using
food crops as biomonitors. Sci. Total Environ., 146: 309- 319.
15. Olah, L. and Tolgyessy J., 1985. Determination of heavy metals in welder's working
environment using nuclear analytical methods. J. Radio. Nucl. Chem., 93(1): 43-53.
16. Jarup, L., 2003. Hazards of heavy metal contamination. British Medical Journal, 68: 167-
182.
17. Banfield, J., 1995. Mercury, URL: http://www.geology.wisc.edu/~jill/hg.html.
18. Navarro, M., Lopez H., Sanchez M. and Lopez M.C., 1993. The effect of industrial
pollution on mercury levels in water, soil and sludge in the coastal area of Motril,
Southeast Spain. Arch. Environ. Contam. Toxicol., 24: 11-15.
19. Lenntech, 1998-2008 Why oxygen dissolved in water is important.
http://www.lenntech.com.
20. Janicki, K., Dobrowolski J. and Krasnicki K., 1987. Correlation between contamination
of the rural environment with mercury and occurrence of leukaemia in men and cattle.
Chemosphere, 16: 253-257.
21. Nriagu, J.O. and Pacyna J.M., 1988. Quantitative assessment of worldwide contamination
of air, water and soils by trace elements. Nature, 333: 134-139.
22. Aula, I., Braunschweiler, H., Malin, I., 1995. The watershed flux of mercury examined
with indicators in the Tucuruı´ reservoir in Para´ , Brazil. The Science of the Total
Environment 175, 97e107.

23. Rieuwerts, J.S., Farago, M., 1996. Mercury concentrations in a historic lead mining and
smelting town in the Czech Republic: a pilot study. The Science of the Total
Environment 188, 167e171.
24. Lyons, W.B., Wayne, D.M., Warwick, J.J., Doyle, G.A., 1998. The Hg geochemistry of a
geothermal stream, steamboat creek, Nevada: natural vs. anthropogenic influences.
Environmental Geology 34, 143e150.
25. Hygelund, B.N., Ambers, R.K.R., Ambers, C.P., 2001. Tracing the source of mercury
contamination in the Dorena Lake Watershed, Western Oregon. Environmental Geology
40, 853e859.
26. Pacyna, E.G., Pacyna, J.M., 2002. Global emission of mercury from anthropogenic
sources in 1995. Water, Air, and Soil Pollution 137, 149e165.
27. Innanen, S., 1998. The ratio of anthropogenic to natural mercury release in Ontario: three
emission scenarios. The Science of the Total Environment 213, 25e32.
28. Ehmann W.D., Markesbery W.R., Alauddin M.,. Hossain T.I and Brubaker E.H., 1986.
Brain trace elements in Alzheimer's disease. Neurotoxi., 7: 195- 206.
29. Basun, H., Forssell L.G., Wetterberg L. and Winblade B., 1991. Metals and trace
elements in plasma and cerebrospinal fluid in normal aging and Alzheimer's disease. J.
Neural Transm. Park. Dis. Dement. Sect. 3:231- 258.
30. Minamata Disease Archives, 2006. National Institute for Minamata Disease, retrieved 29
October.
31. Simpson, V.R., Stuart N.C, Munro R., Hunt A. and Livesey C.T., 1997. Poisoning of
dairy heifers by mercurous chloride. Vet. Rec., 140: 549- 552.
32. Vaizen, G.N. and Vaizen G.A., 2002. The use of easer technology in beef producting.
Zootech., 6: 28-30.
33. Hurlbut K. M., Maiorino R. M., Mayersohn M., Dart R. C., Bruce D. C., and Aposhian
H. V., 1994. “Determination and metabolism of dithiol chelating agents XVI:
pharmacokinetics of 2,3-dimercapto-1-propanesulfonate after intravenous administration
to human volunteers,” Journal of Pharmacology and Experimental Therapeutics, vol. 268,
no. 2, pp. 662–668.
34. Sallsten G., Barregard L., and Schutz A., 1994. “Clearance half life of mercury in urine
after the cessation of long term occupational exposure: influence of a chelating agent

(DMPS) on excretion of mercury in urine,” Occupational and Environmental Medicine,
vol. 51, no. 5, pp. 337–342.
35. Bernard, A., 2008. Cadmium and its adverse effects on human health. Indian. J. Med.
Res., 128: 557-564.
36. Friberg, L., Nordberg G.F. and Vouk V.B., 1979. Handbook on the Toxicology of
Metals. Elsevier North-Holland Biomedical Press, Amsterdam – New York – Oxford.
37. Sahmoun, A. E., Case L. D., Jackson S. A. and Schwartz G. G., 2005. Cadmium and
prostate cancer: A critical epidemiological analysis. Cancer Investi., 23(3): 256-263.
38. ATSDR (Agency for Toxic Substances and Disease Registry), 1999a. Toxicological
Profile for Cadmium. US Department of Human and Health Services. USA.
39. Galal-Gorchev, H., 1991. Dietary intake of pesticide residues, cadmium, mercury and
lead. Food Additives and Contaminants, 8:793-806.
40. Bodereau-Dubois B., List O., Calas-List D., 2012., “Transmembrane potential
polarization, calcium influx, and receptor conformational state modulate the sensitivity of
the imidacloprid-insensitive neuronal insect nicotinic acetylcholine receptor to
neonicotinoid insecticides,” Journal of Pharmacology and Experimental Therapeutics,
vol. 341, no. 2, pp. 326–339.
41. Pacini S., Fiore M. G., Magherini S., 2012. “Could cadmium be responsible for some of
the neurological signs and symptoms of Myalgic Encephalomyelitis/Chronic Fatigue
Syndrome,” Medical Hypotheses, vol. 79, no. 3, pp. 403–407.
42. Czarnecki L. A., Moberly A. H., Turkel D. J., 2012 “Functional rehabilitation of
cadmium-induced neurotoxicity despite persistent peripheral pathophysiology in the
olfactory system,” Toxicological Sciences, vol. 126, no. 2, pp. 534–544.
43. Cadmium Compounds, Technology Transfer Network Air Toxics Web Site,
Environmental Protection Agency, Washington, DC, USA, 2007.
44. Godt, J., Scheidig F., Grosse-Siestrup C., Esche V., Brandenburg P., Reich A. and
Groneberg A., 2006. The toxicity of cadmium and resulting hazards for human health. J.
Occup. Med. Toxicol., 1: 22-23.
45. Kocak, M. and Akc E., 2006. The effects of chronic cadmium toxicity on the hemostatic
system. Pathophy. Haemo.Thromb., 35: 411-416.
46. USAF. 1990. Cadmium. In: Installation Restoration Program Toxicology Guide, Vol. 5.
Harry G. Armstrong Aerospace Medical Research Laboratory, Wright Patterson AFB,
OH.
47. Thompson, J. and Bannigan J., 2008. Cadmium: Toxic effects on the reproductive system
and the embryo. Reprod. Toxicol., 25(3): 304-315.
48. Elinder, C.G., Edling C., Lindberg E., Kagedal B. and Vesterburg O., 1985. β2
Microglobulinuria among workers previously exposed to cadmium: follow-up and dose-
response analyses. Am. J. Ind. Med., 9: 553-64.
49. Ali I., Damdimopoulou P., Stenius U., 2012., “Cadmium-induced effects on cellular
signaling pathways in the liver of transgenic estrogen reporter mice,” Toxicological
Sciences, vol. 127, no. 1, pp. 66–75.
50. Satoh. M., Koyama H., Kaji T., Kito H. and Tohyama C., 2002. Perspectives on cadmium
toxicity research. Tohoku J. Exp. Med., 196: 23-32.
51. Zasadowski, A., Barski D., Markiewicz1 K., Zasadowski Z., Spodniewska A. and
Terlecka A., 1999. Levels of cadmium contamination of domestic animals (Cattle) in the
Region of Warmia and Masuria. Pol. J. Environ. Stu., 8(6): 443-446.
52. Jeng, S.L., Lee S.J. and Lin S.Y., 1994. Determination of cadmium and lead in raw milk
by graphite furnace atomic absorption spectrophotometer. J.Dairy Sci., 77(4): 945-9.
53. Smirjakova, S., Ondrasovicova O., Kaskova A. and Laktiiovd K., 2005. The effect of
cadmium and lead pollution on human and animal health. Folia Vete., 49(3): 31-32.
54. Miller, W. J., Blackman D.M., Gentry R.P. and Pate F.M., 1969. Effect of dietary
cadmium on tissue distribution of 109-cadmium following a single oral dose in young
goats. J. Dairy Sci., 52: 2029-2035.
55. Antoniou V., Zantopoulos N. and Tsoukali-Papadopoulou H., 1995. Selected heavy metal
concentrations in goat liver and kidney. Vet Hum Toxicol, 37(1):20-22.
56. ATSDR (Agency for Toxic Substances and Disease Registry), 1993. Toxicological
Profile for Lead. US Department of Human and Health Services. USA.
57. Hura, C., 2002. Chemical contaminants in food and human body, 1990–2000. Cermi
Press, Iasi, ISBN 973-8188-01-6.
58. Aslam, M., Davis S.S. and. Healy M.A, 1979. Heavy metals in some Asian medicines
and cosmetics. Pub. Heatlh, 93: 274-284.

59. Javed, I., Jan I.U., Muhammad F., Rahman Z.U., Khan M.Z., Aslam B., Sultan J.I., 2009.
Heavy Metal Residues in the Milk of Cattle and Goats during Winter Season. Bull.
Environ. Contam. Toxicol., 82: 616-620.
60. FDA. 1995. Substances prohibited from use in human food. Substances prohibited from
indirect addition to human food through food-contact surfaces. U.S. Food and Drug
Administration. Code of Federal Regulations. 21 CFR 189.240.
61. Lead and Brain Injury, 2007. Retrieved on 2007-08-14.
62. ATSDR (Agency for Toxic Substances and Disease Registry), 1999b. Toxicological
profile for lead. US Department of Health and Human Services Atlanta, USA.
63. Turkdogan, M. K., Kilicel F., Kara K., Tuncer I. and Uygan I., 2003. Heavy metals in
soil, vegetables and fruits in the endemic upper gastrointestinal cancer region of Turkey.
Environ. Toxicol. Pharma., 13(3): 175-179.
64. Mahaffey, K.R., 1990. Environmental lead toxicity: Nutrition as a component of
intervention. Environ. Health Perspect., 89:75-78.
65. FAO STAT data, 2004. Agricultural Statistics (on line: http://faostat.fao.org/). Last
accessed December.
66. Marshall, T.C., Slate J. Kruuk L.E.B and Pemberton J.M., 1998. Statistical confidence for
likelihood-basesd paternity inference in natural populations. Mol. Ecol., 7: 639-655.
67. Lopez. A., Collins W. F. and Williams H. L., 1985. Essential elements, cadmium, and
lead in raw and pasteurized cow and goat milk. J. Dairy Sci., 68:1878-1886.
68. Rodriguez, E., Delgado E. and Diaz C., 1999. Concentrations of cadmium and lead in
different types of milk. European Food Res. Technol., 208: 162- 168.
69. Okada, I.A., Sakuma A.M., Maio F.D., Dovidauskas S. and Zenebon O., 1997.
Evaluation of lead and cadmium levels in milk in environmental contamination in the
Vale do Paraíba Region, southeastern Brazil. Rev Saude Publica, 31(2): 140-143.
70. Miranda, M., Lopez-Alonso M., Castillo C., Hernandez J. and Benedito J. L., 2005.
Effects of moderate pollution on toxic and trace metal levels in calves from a polluted
area of northern Spain. Environ. Inter., 31: 543- 548.
71. Alonso, L.M., Benedito J.L., Mirada M., Castillo C., Herandez J., and Shore R.F., 2002.
Contribution of cattle products to dietary intake and toxic elements in Galicia, Spain.
Food Addit. Contam., 19: 533-541.

72. Jukna, C., Jukna V. and Siugzdaite J., 2006. Determination of heavy metals in viscera
and muscles of cattle. Bulg. J. Vet. Med., 9: 35-41.
73. Abou Donia, M.A., 2008. Lead Concentrations in Different Animals Muscles and
Consumable Organs at Specific Localities in Cairo. Global Veterina., 2 (5): 280-284.
74. Radwan MA, Salama AK, 2006. Market basket survey for some heavy metals in
Egyptian fruits and vegetables. Food Chem. Toxicol. 44: 1273-1278.
75. Parveen Z, Khuhro MI, Rafiq N, 2003. Market basket survey for lead, cadmium, copper,
chromium, nickel and zinc in fruits and vegetables. Bull. Environ. Toxicol. 71: 1260-
1264.
76. Jones Al and Dorgan PI, Hepatic toxicology, In: Shannon MW, Borron SW, Burns MJ,
eds. Haddad and Winchester's , Res.S.E., 2007.Clinical Management of Poisoning and
Drug Overdose, 4th ed. Philadelphia, Chap 11.
77. Saravu K, Jose J, Bhat MN, Jimmy B, and Shastry B.A., Acute ingestion of copper
sulphate: A review on its clinical manifestations and management, Res. S. E. 74-80 2007.
Available from: http://www.ijccm.org/text.asp 2007/11/2/74/33389.
78. Goeringa P.L and Barber D.S, Hepatotoxicity of Copper, Iron, Cadmium, and Arsenic,
Comprehensive Toxicology, (9), 501-526.
79. http://chestofbooks.com/health/reference/Home-Cyclopedia-Of-Health-And-
Medicine/Copper-Poisoning.html.
80. Ryan A.C., Tomasso J.R., Klaine S.J., 2009. "Influence of pH, Hardness, Dissolved
Organic Carbon Concentration, and Dissolved Organic Matter Source on the Acute
Toxicity of Copper to Daphnia Magna in Soft Waters: Implications for the Biotic Ligand
Model." Environmental Toxicology and Chemistry 28 (8): 1663-1670.
81. Holland, G. A., J.E. Lasater, Neumann E. D., and Eldridge W. E., 1960. Toxic effects of
organic and inorganic pollutants on young salmon and trout. Washington State
Department of Fisheries, Research Bulletin No. 5.
82. Turnbull, H., DeMann J. G., and Weston R. M., 1954. Toxicity of various refinery
materials to fresh water fish. Industrial and Engineering Chemistry v. 46 (2):324-333.
83. Grande, M. 1967. Effect of copper and zinc on salmonid fishes. Proceedings International
Conference on Advances in Water Pollution Research v. 1:97-111.

84. O'hara, James. 1971. Alterations in oxygen consumption by bluegills exposed to
sublethal treatment with copper. Water Research v.5 (6):321 327.27.
85. Al-Bairuty,G.A.,2013. "Histopathological effects of waterborne copper nanoparticles and
copper sulphate on the organs of rainbow trout (Oncorhynchus mykiss)." Aquatic
Toxicology 126: 104-115.
86. Alan, V. N., 1984. "Relative sensitivity of Chironomus tentans life stages to copper."
Environmental Toxicology and Chemistry 3(1): 151-158.
87. Partington, J.R., 1935. Origins and Development of Applied Chemistry, Longmans,
Green & Co., London.
88. Matschullat, J., 2000. Arsenic in the geosphere-A review. Sci. Total Environ., 249: 297-
312.
89. Sambu, S. and R. Wilson, 2008. Arsenic in food and water – a brief history. Toxicol.
Indus. Health, 24: 217-226.
90. Anonymous, 2008. Arsenic threatens global health. CRC CARE, University of
Canberra,Australia.http://www.sciencealert.com.au/news/20081802- 16913-2.html.
91. Delowar, H.K.M., Yoshida I., Harada M., Sarkar A.A., Miah M.N.H., Razzaque A.H.M.,
Uddin M.I., Adhana K. and Perveen M.F., 2005. Growth and uptake of arsenic by rice
irrigated with As-contaminated water. J. Food Agric. Environ., 3:287-291.
92. Smith, A.H.; Hopenhayn-Rich, C.; Bates, M.N.; Goeden, H.M.; Hertz-Picciotto, I.;
Duggan, H.M.; Wood, R.; Kosnett, M.J.; Smith, M.T., 1992. Env. Health Perspect. 97,
259–267.
93. Welch, A.H.; Westjohn, D.B.; Helsel, D.R.; Wanty, R.B., 2000. Arsenic in ground water
of the United States-occurrence and geochemistry. Ground Water 38 (4), 589–604.
94. US EPA. US EPA Drinking Water Regulations and Health Advisories; EPA 822-B- 96-
002: Washington, DC, 1996.
95. NRC. Arsenic in Drinking Water; National Academy Press: Washington, DC, 1999;
310p.
96. Centeno, J.A.; Tchounwou, P.B.; Patlolla, A.K.; Mullick, F.G.; Murakata, L.; Meza, E.;
Gibb, H.; Longfellow, D.; Yedjou, C.G. Environmental Pathology and Health Effects of
Arsenic Poisoning: A Critical Review. In Managing Arsenic in the Environment: From

Soil to Human Health; Naidu, R.; Smith, E.; Owens, G.; Bhattacharya, P.; Nadebaum,,
Eds.; CSIRO Publishing: Melbourne, Australia, 2006; 311–327. (ISBN: 0643068686).
97. Rahman, M.M.; Mandal, B.K.; Chowdhury, T.R.; Sengupta, M.K.; Chowdhury, U.K.;
Lodh, D.; Chanda, C.R.; Basu, G.K.; Mukherjee, S.C.; Saha, K.C.; Chakraborti, D.
Arsenic groundwater contamination and sufferings of people in North 24-Parganas,one of
the nine arsenic affected districts of West Bengal, India. J. Environ. Sci. Health, 2003,
A38, 25–59.
98. Chiou, H.Y.; Chiou, S.T.; Hsu, Y.H.; Chou, Y.L.; Tseng, C.H.; Wei, M.L.; Chen, C.J.,
2001. Incidence of transitional cell carcinoma and arsenic in drinking water: a follow-up
study of 8,102 residents in an arseniasis-endemic area in northeastern Taiwan. Am. J.
Epidemiol. 153 (5), 411–418.
99. Ferreccio, C.; Gonzalez, C.; Milosavjlevic, V.; Marshall, G.; Sancha, A.M.; Smith, A.H.,
2000. Lung cancer and arsenic concentrations in drinking water in Chile. Epidemiology
11 (6), 673–679.
100. Rossman, T.G.; Uddin, A.N.; Burns, F.J. Evidence that arsenite acts as a cocarcinogen
in skin cancer. Toxicol. Appl. Pharmacol. 2004, 198, 394–404
101. Steinmaus, C.; Yuan, Y.; Bates, M.N.; Smith, A.H., 2003. Case-control study of
bladdercancer and drinking water arsenic in the western United States. Am. J.
Epidemiol. 158, 1193–1201.
102. Hopenhayn-Rich, C.; Biggs, M.L.; Smith, A.H. Lung and kidney cancer mortality
associated with arsenic in drinking water in Cordoba, Argentina. Int. J. Epidemiol.
1998, 27 (4), 561–569.
103. Xia, Y.; Liu, J., 2004. An overview on chronic arsenism via drinking water in PR China.
Toxicology 198, 25–29.
104. Wu, H., 2004. Urinary arsenic speciation and porphyrins in C57Bl/6J mice chronically
exposed to low doses of sodium arsenate. Toxicol. Lett. 154 (1–2), 149–157.
105. Tsai, S.Y.; Chou, H.Y.; The, H.W.; Chen, C.M.; Chen, C.J 2003. The effects of chronic
arsenic exposure from drinking water on the neurobehavioral development in
adolescence. Neurotoxicology 24, 747–753.
106. Wasserman, G.A.; Liu, X.; Parvez, F.; Ahsan, H.; Factor-Litvak, P.; van Geen,A.;
Slavkovich, V.; LoIacono, N.J.; Cheng, Z.; Hussain, I.; Momotaj, H.; Graziano,

J.H.,2004. Water arsenic exposure and children’s intellectual function in Araihazar,
Bangladesh. Environ. Health Perspect. 112 (13), 1329–1333.
107. Watanabe, C.; Inaoka, T.; Matsui, T.; Ishigaki, K.; Murayama, N.; Ohtsuka, R. Effects
of arsenic on younger generations. J. Environ. Sci. Health 2003, A38, 129–139.
108. Lee, M.Y.; Bae, O.N.; Chung, S.M.; Kang, K.T.; Lee, J.Y.; Chung, J.H., 2002.
Enhancement of platelet aggregation and thrombus formation by arsenic in drinking
water: A contributing factor to cardiovascular disease. Toxicol. Appl. Pharmacol.
179,83–88.
109. Guha Mazumder, D.N. Chronic arsenic toxicity: clinical features, epidemiology, and
treatment: experience in West Bengal. J. Environ Sci Health 2003, A38, 141– 163.
110. Albaiges,L.,2000. International congress on analytical techniques in environmental
chemistry, Pergamon Press, Spain; pp. 315-324.
111. Jamieson, R.W. and Hancock, R.G.V., 2004. Neutron Activation Analysis of Colonial
Ceramics from Southern Highland Ecuador. Archaeometr 46 (4) 569-583.
112. Swart, D.J., Ezer, H.L., Pacqette, J.B. and Meonsson, S., 1998. Laser Induced
Fluorescence of Se, As and Sb in an Electrothermal Atomizer. Analytical Chemistry 70:
1324-1330.
113. Taylor, S., Branch, S., Day, M., Patriciarca, M., and White, M., 2006. Atomic
spectrometry update. Journal of analytical and atomic spectrometry 21: 114-121.
114. Joseph, W., 1983. Anodic Stripping Voltametry. An Instrumental Analysis Experiment.
Journal of Chemistry 60: 1074-1075.
115. Melluci, D. and Locatelli, C. 2007. Sequential voltammetric determination of trace
metals in meats. Micro chemica Journal, Bologna, Italy; 85 (2): 321-328.
116. Salisbury, J.W., Walter, L.S., Vergo, N. and D‘Aria, D.M., 1991. Spectra of Minerals.
John Hopkins University Press. Baltimore Md.
117. Stolker, A.A.M., Zuidema, T. and Nielen, M.W.F., 2007. Trends in Annals of
Chemistry 26: 967.
118. Bader, N. R., 2011. Sample preparation for flame atomic Absorptionb spectroscopy: an
overview, Rasayan Journal of Chemistry, 4(1), 49-55, ISSN: 0974-1496, CODEN:
RJCABP.

119. E. M. Flores, J. S. Barin, M. F. Mesko, G. Knapp, 2007, Sample preparation techniques
based on combustion reactions in closed vessels - A brief overview and recent
applications. Spectrochimica Acta Part B, 62 (9), 1051-1067.
120. Charcot JM. Clinical lectures of diseases of the nervous system. The Landmark Library
of Neurology and Neurosurgery. 1994;186.
121. Wilson SAK. Neurology. The Landmark Library of Neurology and Neurosurgery.
1994;739-740.
122. Harada M. Minamata disease: methylmercury poisoning in Japan caused by
environmental pollution. Crit Rev Toxicol. 1995;25(1):1-2
123. B.W. Tucker, Overview of current seafood nutritional issues: Formation of potentially
toxic products, in Shahidi F, Jones Y, Kitts DD (Eds.), Seafood safety, processing and
biotechnology. Technomic Publishing Co. Inc., Lancaster, PA(USA), 2007.
124. M. Tuzen, M. Soylak, Food Chem. 2007, 101(4),1378-1382.
125. FAO, Food and Agriculture Organization, Compilation of Legal Limits for Hazardous
Substances in Fish and Fishery Products. Food and Agriculture Organization of the
United Nations, Rome, Italy, 1983, 5-100.
126. N. Ghosh, S. Bhattacharya, Biomed. Environ, Sci., 1992, 5, 236-240.
127. WHO, Evaluation of food additives and contaminates. 27th Report of the Joint
FAO/WHO Expert Committee on food additives. WHO Technical Report No. 695,
Geneva, 1984.
128. International College of Integrative Medicine, “Diagnostic and treatment protocols for
safer, effective mercury human biohazard management,” Tech. Rep., Consensus
Development Working Group of the International College of Integrative Medicine,
Bluffton, Ohio, USA, 2003.
129. JECFA (Joint FAO/WHO Expert Committee of Food Additives), 1982. Copper. In:
Evaluation of certain food additives and contaminants. WHO Food Additives Series
No.17. Twenty-sixth Report of the Joint FAO/WHO Expert Committee of Food
Additives. World Health Organisation. Geneva.
130. SCF (Scientific Committee for Food), 1993. Reports of the Scientific Committee for
Food of the European Community. Thirty-first series. Nutrient and energy intakes for
the European Community. Commission of the European Countries. Luxembourg.

131. Yoshida, T.; Yamauchi, H.; Fan, S.G., 2004. Chronic health effects in people exposed to
arsenic via the drinking water: Dose-response relationships in review. Toxicol. Appl.
Pharmacol. 198, 243–252.
132. Islam, M. M.; Halim, M. A.; Safiullah, S.; Waliul Hoque, S. A. M. and Saiful Islam, M.,
2009. Heavy metal content in textile sludge in Gazipur, Bangladesh. Research Journal
of Environmental Sciences, 3(3): 311-315.
133. Awal, M. A.; Hale, W. H. G. and Stern B., 2009. Trace element concentrations in
mangrove sediments in the Sundarbans, Bangladesh. Marine Pollution Bulletin, 58(12):
1944-1948.
134. Alam, M. G. M.; Snow, E. T. and Tanaka, A., 2003. Arsenic andheavy metal
contamination of vegetables grown in Samta Village, Bangladesh, Science of the Total
Environment, 308(1-3): 83-96.s