Embed Size (px)
Citation preview

A PROFILE OF THE AUTOMOBILE SECTORIN THE U.S. AND SOUTHEASTERN STATES
Matthew N. Murray, Associate DirectorCenter for Business and Economic Research
The University of Tennessee
David T. Mayes, InstructorDepartment of Economics and Finance
Kennesaw State University
Kathleen Hoffman, Graduate Research AssistantThe University of Tennessee
Prepared by theCenter for Business and Economic Research
College of Business AdministrationThe University of Tennessee
Knoxville, Tennessee
Prepared forState of Tennessee
Department of Economic and Community Development
August 1999

ii
Contents
EXECUTIVE SUMMARY . . . . . . . . . . . . . . . . . . . . . . . . . . . . . . . . . . . . . . . . . . . . . . . . v
I. INTRODUCTION . . . . . . . . . . . . . . . . . . . . . . . . . . . . . . . . . . . . . . . . . . . . . . . . . . . . . . . 1
II. THE SIZE, SCOPE AND PERFORMANCE OF THE MODERN U.S. AUTO INDUSTRY . . . . . . . . . . . . . . . . . . . . . . . . . . . . . . . . . . . . . . . . . . . . . . . . . . . . . . 2
III. THE EXPANSION OF THE AUTOMOBILE ASSEMBLY SECTOR INTO THE SOUTHEAST . . . . . . . . . . . . . . . . . . . . . . . . . . . . . . . . . . . . . . . . . . . . . . . . 10
IV. AUTOMOTIVE SUPPLIER INVESTMENTS IN THE SOUTHEAST . . . . . . . . . . . . . 19
V. JAPANESE AUTOMOTIVE SUPPLIER INVESTMENTS . . . . . . . . . . . . . . . . . . . . . 21
VI. NON-JAPANESE OWNED SUPPLIER INVESTMENTS: DBR. . . . . . . . . . . . . . . . . 25
VII. CONCLUSION . . . . . . . . . . . . . . . . . . . . . . . . . . . . . . . . . . . . . . . . . . . . . . . . . . . . . . . . 30
APPENDIX . . . . . . . . . . . . . . . . . . . . . . . . . . . . . . . . . . . . . . . . . . . . . . . . . . . . . . . . . . . 34

iii
Tables
Table Page
1 Key Automotive Supplier Industries. . . . . . . . . . . . . . . . . . . . . . . . . . . . . . . . . . . . . . . . . 42 Top Ten States in Car Production: 1980. . . . . . . . . . . . . . . . . . . . . . . . . . . . . . . . . . . . . 103 Top Ten States in Car Production 1998. . . . . . . . . . . . . . . . . . . . . . . . . . . . . . . . . . . . . . 104 Top Ten States in Truck Production: 1990 Model Year. . . . . . . . . . . . . . . . . . . . . . . . . 115 Top Ten States in Truck Production 1998. . . . . . . . . . . . . . . . . . . . . . . . . . . . . . . . . . . . 116 USIAS Assembly Facilities: 1996 Capacity. . . . . . . . . . . . . . . . . . . . . . . . . . . . . . . . . . 147 Heavy Trucks 1997. . . . . . . . . . . . . . . . . . . . . . . . . . . . . . . . . . . . . . . . . . . . . . . . . . . . . 158 Establishment and Employment Data for Transportation Equipment . . . . . . . . . . . . . . . 169 Establishment and Employment Data for Motor Vehicle and Equipment . . . . . . . . . . . . 1610 Motor Vehicle Manufacturers Parts and Assembly Facilities by States, 1981-1990. . . . 1711 Motor Vehicle and Equipment Manufacturers by State (SIC 371). . . . . . . . . . . . . . . . . 1812 Automobile Assembly Plants in the Southeast . . . . . . . . . . . . . . . . . . . . . . . . . . . . . . . . 2013 Selected Characteristics of Japanese Automotive Supplier Investments in the U.S. . . . . 2214 Characteristics of Japanese Automotive Supplier Investments in the Southeast . . . . . . . 2415 Characteristics of Non-Japanese Owned Automobile Supplier Firms in the
Alabama, Georgia, North Carolina and Tennessee . . . . . . . . . . . . . . . . . . . . . . . . . . . . . 2616 Number of Auto Supplier Companies and Employment by County, 1998. . . . . . . . . . . 2817 Nissan Suppliers by State . . . . . . . . . . . . . . . . . . . . . . . . . . . . . . . . . . . . . . . . . . . . . . . . . 3018 Nissan Suppliers in Tennessee: by County. . . . . . . . . . . . . . . . . . . . . . . . . . . . . . . . . . . 3019 Number of Auto Supplier Companies and Employment by County, 1997. . . . . . . . . . . 3120 Number of Suppliers by County. . . . . . . . . . . . . . . . . . . . . . . . . . . . . . . . . . . . . . . . . . . 32

iv
Figures
Figure Page
1 Percent Change in Average Annual U.S. Employment 1950-1998. . . . . . . . . . . . . . . . . . 62 Number of Assembly Plants by State, 1997. . . . . . . . . . . . . . . . . . . . . . . . . . . . . . . . . . . . 83 U.S. Light Vehicle Production. . . . . . . . . . . . . . . . . . . . . . . . . . . . . . . . . . . . . . . . . . . . . . 94 Domestic vs. Import Light Vehicle Production. . . . . . . . . . . . . . . . . . . . . . . . . . . . . . . . 125 USIAS U.S. Vehicle Production and Sales of Imports, 1982-1996. . . . . . . . . . . . . . . . . 13
EXECUTIVE SUMMARY
The automotive industry has long played an important role in the U.S.economy, but its contribution to the Southeast has been modest. Beginning
in the early 1980s, the Southeast staked its claim as a rising leader in automotiveproduction with the location of new assembly plants and an extensive array ofintegrated suppliers. The automotive sector is helping to reshape the region’smanufacturing base, creating high-wage, high value-added jobs that can competeeffectively in the global economy.
The Center for Business and Economic Research at the University ofTennessee, Knoxville is conducting an on-going examination of the automotiveindustry in Tennessee and the Southeast. The goal of the current report is todocument and detail the movement of assembly and supplier activity to theregion, with particular focus on Tennessee. The report is intended to provide acompendium of data to benchmark this important industry and its regionaldevelopment.
Key findings include:
� Automobile manufacturing is one of the largest three-digit SICmanufacturing industries in the U.S. economy.
In 1998, more than 988,300 workers were employed in the U.S. automotiveindustry, accounting for about 5.3 percent of all manufacturing employment.These jobs support economic activity in virtually all sectors of the nationaleconomy.
� Earnings in the automotive industry tend to be higher than those in theU.S. economy.
The automotive industry’s average weekly earnings are about 39 percenthigher than earnings in the nation’s broader manufacturing sector. Earningswere nearly 77 percent higher in the automotive industry than the average forall private non-agricultural workers.
vi
� Twelve automobile assembly plants werelocated in the Southeast at the end of the1997 model year.
Output from these twelve facilities accountedfor 17.5 percent of the total automobileproduction in the United States for 1997. TheSoutheast’s role in automobile partsmanufacturing and automobile assembly willexpand further as Mercedes Benz reachescapacity and the new Honda facility comes online in Alabama in 2002.
� Half of the heavy truck assembly facilitiesin the U.S. are located in the Southeast.
North Carolina and South Carolina each havetwo assembly plants and Tennessee has oneplant. The Southeast is responsible for 56.1percent of total heavy truck production in theU.S.
� Tennessee leads the Southeast inemployment for both transportationequipment (SIC 37) and motor vehicles andequipment (SIC 371) manufacturing.
In the transportation sector (SIC 37),Tennessee had a total of 47,034 jobs in 1996.This is a 38.1 percent increase since 1990 andaccounts for 3.1 percent of this sector’s U.S.jobs. Tennessee’s transportation equipmentsector represents 9.1 percent of totalmanufacturing jobs and 2.1 percent of totalnon-agricultural jobs. Looking at the narrowermotor vehicles and equipment sector (SIC371), Tennessee accounted for 38,795 jobs in1996, (a 66.5 percent increase from 1990),which represents 4.9 percent of this sector’sjobs in the United States. The motor vehiclesand equipment sector (narrowly defined asSIC 371) represents 7.4 percent of allmanufacturing jobs in Tennessee and 1.8
percent of the non-agricultural employment. Thesenumbers understate the automotive sector’scontribution to the state by a wide margin as theydon’t account for many supplier jobs, nor jobssupported through the ripple effect of themultiplier.
� Tennessee is home to three assemblyfacilities responsible for 15,832 jobs.
Tennessee has three assembly plants whichproduce cars, light trucks or heavy trucks.Saturn, which produces passenger cars,accounts for 8,461 jobs; Nissan provides6,000 jobs in Tennessee and produces bothcars and light trucks; and in heavy truckproduction, Tennessee is the home of aPeterbilt plant which provides 1,371 jobs.
� Tennessee remains in the top ten for carproduction.
Tennessee ranked fourth in the nation in carproduction for 1998, while the state did noteven appear in the rankings as recently as1980. The state accounted for production of466,709 cars in 1998, which is 5.9 percent oftotal industry production. In light truckproduction Tennessee was sixteenth withproduction of 86,104 units for the 1998 modelyear. The Southeast is responsible for 19.4percent of total industry light truckproduction.
� Information on supplier firms showvarying numbers of establishments inTennessee, due to differences in industrydefinition, data sources and data collectionprocedures.
The 1999 Harris Tennessee ManufacturersDirectory lists 335 automotive supplier firmsin the state, based on firm reporting of SIC
vii
code. Data from Elm International, whichincludes only tier 1 supplier establishments, listsTennessee as having only 149 suppliers. The1998 Automotive Supplier Directory, put out bythe Tennessee Department of Economic andCommunity Development, lists 622 automotivesupplier firms in the state of Tennessee. Thisdirectory goes beyond tier 1 suppliers andincludes firms which supply any share of theiroutput to the automotive industry.

A PROFILE OF THE AUTOMOBILESECTOR IN THE U.S. ANDSOUTHEASTERN STATES*
I. INTRODUCTION
T he automotive industry has long held its place as an important part of
American life and a key element of the national economy. In the early
part of this century, Henry Ford’s introduction of the moving assembly line and
mass production techniques enabled widespread availability of economical motor
coach transportation and heralded the dawn of the American Dream. Yet as late
as 1980, there was little automotive related production activity in the Southeast
region. In fact, in 1980 only one Southeastern state—Georgia—ranked in the
top ten of U.S. car producing states, with production of over 500 thousand units
(or 6.9 percent of U.S. industry production). By 1998 two newcomers—
Tennessee and Kentucky—had climbed to 4th and 5th in the rankings, respectively,
together accounting for over 880 thousand units and 11.1 percent of domestic
production. Georgia’s contribution, while showing some decline, still placed it
6th with over 250 thousand units.
The contribution of automobile assembly simply touches the surface of a
much larger iceberg. The Southeast has also established itself as a major source
of light truck assembly (which includes the new sport utility model lines) and
heavy truck assembly. Moreover, other forms of transportation equipment
manufacture—including boats, planes, motorcycles and bicycles—are important
elements of the regional economy and are closely tied through common supplier
linkages. These supplier linkages are rather dramatic, having been aided by the
location of new assembly facilities dating back to the early 1980s.
2
The benefits of this industry’s growth to the
Southeast are undeniable. The introduction of
new assembly facilities has helped transform the
Southeast’s manufacturing sector, moving it away
from its historical reliance on low wage and low
capital intensity production of nondurable goods.
In fact, this movement is much stronger and much
more important than simple numbers can suggest.
The assembly facilities themselves represent new
investments, embodying new technologies and
production processes, and new styles of
management. The supplier linkages that have
followed the assembly facilities have been forced
by market pressures to become ever more
productive and efficient. The result is a broad-
based industry in the Southeast that competes well
in the global economy. The economic contribution
is notable, with jobs in Tennessee’s automotive
parts manufacture and automobile assembly sector
providing worker earnings that are about 40
percent higher than the average earnings in the
state’s overall manufacturing sector.
This report is a continuation of CBER’s
ongoing examination of the automotive industry
in Tennessee and the Southeast. The purpose of
the current study is to document and detail the
movement of assembly and supplier activity to the
region, with particular emphasis on Tennessee.
The discussion begins with a national perspective
on the automotive industry’s development to place
trends for the Southeast in context. The focus
then turns to the movement of assemblers and
suppliers to the region.
II. THE SIZE, SCOPE ANDPERFORMANCE OF THE MODERNU.S. AUTO INDUSTRY
Commercial production of automobiles in the
U.S. is believed to have begun with the Duryea
Motor Wagon Company of Springfield,
Massachusetts in 1895. Duryea was the industry
sales leader that year, with the production of four
motor cars.1 Henry Ford’s introduction of the
moving assembly line in 1912 heralded the
beginning of the American Dream, as car prices
fell and automobiles became accessible to the
average consumer. By 1935 motor vehicle and
parts production had become the most important
manufacturing industry in the country, ranking
first in the number of production workers, size of
payroll, value added during manufacture, cost of
materials and overall value of shipments. The
U.S. automobile industry endured serious hardship
in the 1970s and early 1980s in the face of rising
fuel prices, problems of product quality and sharp
inroads from foreign producers, most notably the
Japanese. As the decade of the 90s approaches its
close, the U.S. automobile industry has
repositioned itself as a global leader in automobile
production. Within the southeast in 1992,
Tennessee’s transportation equipment sector
accounted for over 45,000 jobs, making it the
largest component of the state’s durable goods
manufacturing sector. By 1998, Tennessee’s
transportation equipment sector accounted for
over 54,000 jobs.
There are both narrow and broad definitions of
the automobile industry. Narrowly, the automobile
and equipment manufacturing industry (Standard
Industry Classification 371) includes
3
establishments whose primary activities are
producing motor vehicles and car bodies
(SIC 3711), truck and bus bodies (SIC 3713),
motor vehicle parts and accessories (SIC 3714),
truck trailers (SIC 3715), and motor homes
(SIC 3716). A broader definition would include
all transportation equipment (SIC 37), which
includes automobile equipment and
manufacturing, as well as aircraft and parts, ship
and boat building, railroad equipment,
motorcycles and bicycles and guided missiles and
space vehicles. This broader transportation
equipment sector, which has a strong presence in
Tennessee, utilizes similar inputs, similar worker
skills and similar production techniques.
Because of the complexity of automobile
production and the fact that most modern
automobile plants are actually engaged in
assembly of motor vehicles from purchased
components (or components shipped from other
divisions within the same company) rather than
complete vehicle production, the actual scope of
automobile-related manufacturing industries is
much broader than these narrow classifications
suggest. Based on figures from input-output
tables of the U.S. economy—which show the
detailed inputs required to produce the final
automobile—motor vehicle and car body
producers utilize inputs from over 170 different
industries in their manufacturing process. Table
1 lists the key supplier industries to automobile
manufacturers, along with estimates of the
percentage of their output supplied to the
automotive industry (SIC 371) in 1992. Note that
only sixteen industry classifications are shown in
this table. The contribution of these and other
industries to the broader transportation equipment
sector (SIC 37) would be much larger than that
indicated in the table.
Given the number and variety of industries
supplying inputs to the automobile industry it is
no surprise that the fortunes of automobile
manufacturers have a significant impact on the
U.S. economy. In 1998, the industry employed
just over 988,300 workers, representing nearly 9.0
percent of total employment in durable goods
manufacturing and about 5.3 percent of all
manufacturing employment.2 These figures make
automobile manufacturing one of the largest
three-digit SIC manufacturing industries in the
economy. In total for the U.S., about 1 percent of
the 105,970,000 workers on total private payrolls
in 1998 were employed directly by automobile
and equipment manufacturers.
Because of the vast network of automobile
industry suppliers, however, these data understate
the employment impact of automobile production
on the national economy. Still, estimation of the
number of automobile-related jobs in supplier
industries is difficult because most supplier
establishments do not produce exclusively for
automobile industry consumption, as is clear from
Table 1. Some suppliers may produce for broader
elements of the transportation equipment sector
while others will supply a significant share of
their output to sectors unrelated to the
transportation sector. As shown in Table 1, even
the automotive stampings industry on average
supplied about three-fourths of its output to motor
vehicle and car body producers. In total, these
supplier industries employed an estimated
1,875,600 U.S. workers in 1998. If this figure is

4
Table 1: Key Automotive Supplier Industries
Supplier Industry SIC
Value of Purchases by Auto Industry
(Millions)
Percent Output to Auto
Industry
Steel springs, except wire 3493 406 86.1
Automotive Stampings 3465 11,762 73.7
Motor vehicle parts and accessories 3714 40,186 53.4
Fabricated Textiles, nec 2399 1,478 46.5
Auto Apparel & Trimmings 2396 2,582 42.3
Engine Electrical Equipment 3694 2,294 33.4
Radio & Television Receivers 3651 1,770 22.9
Internal Combustion Engines 3519 2,020 17.2
Carburetors, pistons, rings, valves 3592 300 16.4
Hardware, nec 3429 1,311 15.3
Tires & Inner Tubes 3010 1,511 12.8
Refrigeration & Heating Equipment 3585 2,225 12.1
Glass & glass products 3210 1,504 11.5
Fabricated Rubber Products, nec 3060 1,263 11.2
Lighting fixtures and equipment 3640 558 6.5
Storage batteries 3691 195 5.7
Source: Author’s calculations from data in 1992 Benchmark Input-Output Tables.
adjusted to account for the percentage of
production by these industries that is dedicated to
automotive inputs, these supplier establishments
employed about 740,173 automobile-related
workers in 1998, or about 40 percent (on average)
of their total 1998 employment.3 Adding these
supplier industry jobs yields a conservative
estimate of total employment in automobile
manufacturing and directly-related industries in
1998 of almost 1.7 million. Thus in terms of jobs,
the automotive industry directly represented about
9.2 percent of the manufacturing sector of the
national economy in 1998 and about 1.6 percent
of workers on all private nonagricultural payrolls.
But even this measure understates the industry’s
contribution to the economy by ignoring the ripple
effects of the multiplier.

5
Other measures of the size and impact of the
automobile industry on the U.S. economy can be
found in data on consumption expenditures,
wages, and personal income. Between 1972 and
1992, consumption of motor vehicles and
equipment consistently accounted for between 3.0
and 4.0 percent of inflation-adjusted gross
domestic product (GDP). This is a substantial
impact for a three-digit SIC industry, accounting
for over forty percent of all expenditures on
durable goods. In 1998, consumption of new
automobiles alone accounted for 1.1 percent of
inflation-adjusted GDP, with sales of
approximately $82.8 million in 1992 dollars.
The automobile industry also has a relatively
large impact in terms of wages and personal
income. The average auto manufacturing job
generates double the wage, property, and profit
income produced by the average job in the U.S. 4
In 1998, the industry's average weekly earnings of
$780.39 were 39 percent higher than the average
earnings in all manufacturing industries and 77
percent higher than the average for all private non-
agricultural workers. In terms of personal income
generated, which includes property, interest, and
other income in addition to wages and salaries, the
automotive industry generated 1.4 percent of all
private non-farm income in 1997, or about 1.2
percent of total non-farm personal income.5
Again, for a three-digit manufacturing industry
this represents a significant impact on the overall
economy.
The first years of this decade were not banner
years for the profitability of the nation’s
automakers. During the period of general
economic growth in the 1980's, the industry
managed an annual after-tax rate of profit of about
$5.5 billion. By the fourth quarter of 1990,
however, the economy had entered a recession and
the automakers’ profits dipped into the red as
well. Between 1990 and 1992, the industry lost
$3.3 billion per year, on average. As the recession
ended, however, profitability quickly returned to
the industry, as is typically the case. In the spring
of 1999, U.S. automobile production was being
stretched to its capacity by strong domestic
consumer demand.
The wide fluctuation in profits demonstrates
how closely linked the automobile industry is with
the national economy. Because of its size and
scope, the automobile industry tends to lead the
economy throughout the business cycle,
precipitating its decline during recessions and
driving it toward the next peak during periods of
growth. This pattern is shown in Figure 1, using
time-trend employment data for the
nonagricultural sector of the national economy,
the overall manufacturing sector and the narrowly
defined automotive sector (SIC 371).
Employment in manufacturing is clearly more
volatile than is overall employment. Similarly,
the automotive sector displays greater variation in
employment over time than manufacturing.
During periods of expansion, employment
expands sharply, but during periods of
contraction, job losses are rather dramatic. Note
also that automotive sector employment has been
uncharacteristically stable since the mid 1980s
(which corresponds to the beginning of the
industry’s growth in Tennessee).
A snapshot of the 1997 North American
automobile industry in terms of assembly capacity
and the intensity of production, is provided in
Appendix Tables 1 and 2, which list car and truck

6
Figure 1: Percent Change in Average Annual U.S. Employment 1950-1998
Source: Bureau of Labor Statistics, Current Employment Statistics.
production and capacity by manufacturer,
including models produced, for each plant in the
U.S., Mexico and Canada. As Appendix Table 1
shows, there were forty-nine passenger car
production lines in operation for the 1997 model
year in the U.S., Canada and Mexico: five owned
by Chrysler, ten by Ford, seventeen by General
Motors, and seventeen belonging to foreign
transplants or joint ventures between foreign car
makers and their Big Three partners. In total these
plants produced 8.1 million vehicles in 1997,
including 5.4 million in output from Big Three
facilities and 2.7 million from transplant or joint
venture plants. As the figures on capacity
utilization demonstrate, the 1997 model year was
outstanding in terms of output as thirteen of these
plants operated either at or above their normal
capacity. The most extreme example of over-
utilization is the Toyota production line in
Georgetown, Kentucky, where the Camry is
assembled. This plant operated 30.7 percent above
its rated capacity of 198,016 vehicles per year. In
total, the 5.4 million cars assembled at Big Three
facilities accounted for 87.6 percent of their
normal capacity (down from 95.3 percent in
1994); the output at transplant and joint-venture
plants of 2.7 million represented 88.7 percent of
their typical year’s production.
Another notable feature of the plant data
reported in Appendix Table 1 is that only a few of
the models produced by any of these
manufacturers required more than one production
facility to satisfy demand. At Chrysler, only the
Stratus and Neon were assembled at more than
one facility. Despite the popularity of the Ford
Taurus and Mercury Sable, Ford’s most popular
corporate twins, only two of Ford’s ten production
7
facilities were needed for production. This
limitation of production to a single facility for all
but the most popular models is a direct
consequence of the maturation of the U.S. vehicle
market. The mature stage of the auto industry’s
evolution is, in part, characterized by the need for
increased variety in the number of different
platforms offered by automakers. Because of the
proliferation of models, very few reach the sales
volumes required to warrant more than a single
production line. Further, the minimum efficient
scale of production at the plant level has declined
and the production line has become more flexible
allowing multiple platforms to be produced in a
single facility, as is the case for the majority of the
plants listed in Appendix Table 1.
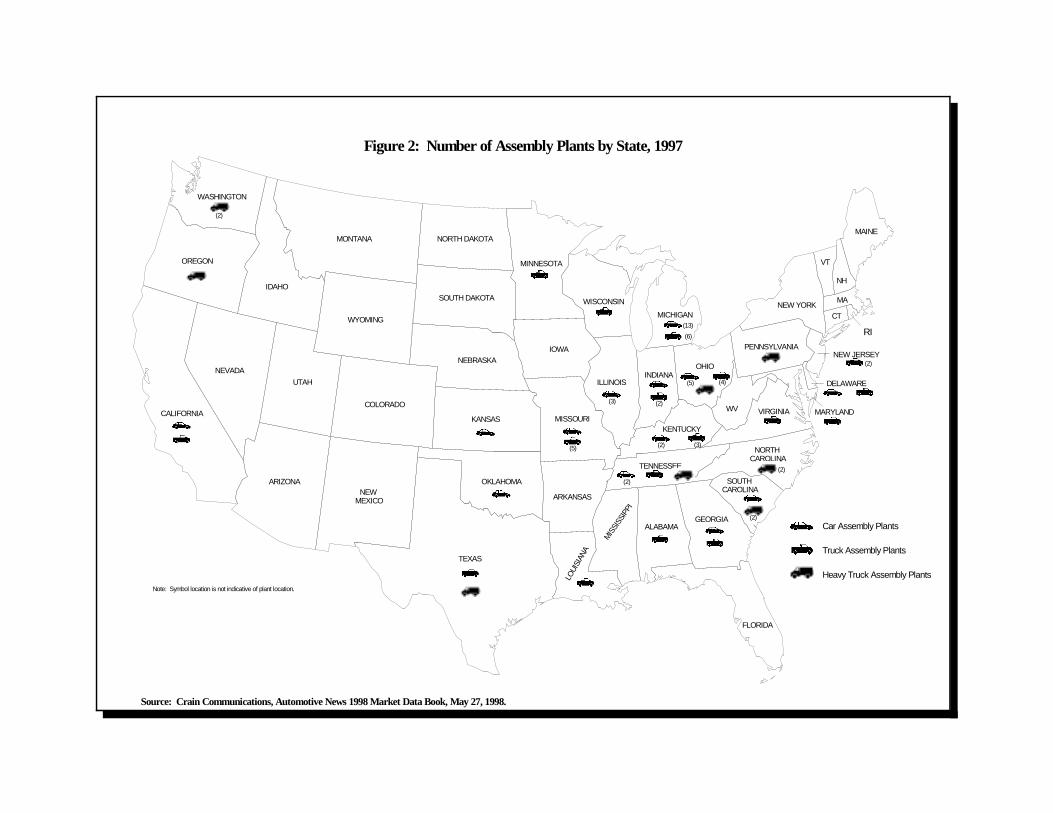
Geographically, there are fourteen U.S. states
(California, Delaware, Georgia, Illinois, Indiana,
Kansas, Kentucky, Michigan, Missouri, Ohio,
Oklahoma, South Carolina, Tennessee, and Texas)
and three Canadian provinces (Nova Scotia,
Ontario, and Quebec) represented in this listing.
The geographic dispersion of the plants is shown
in Figure 2.
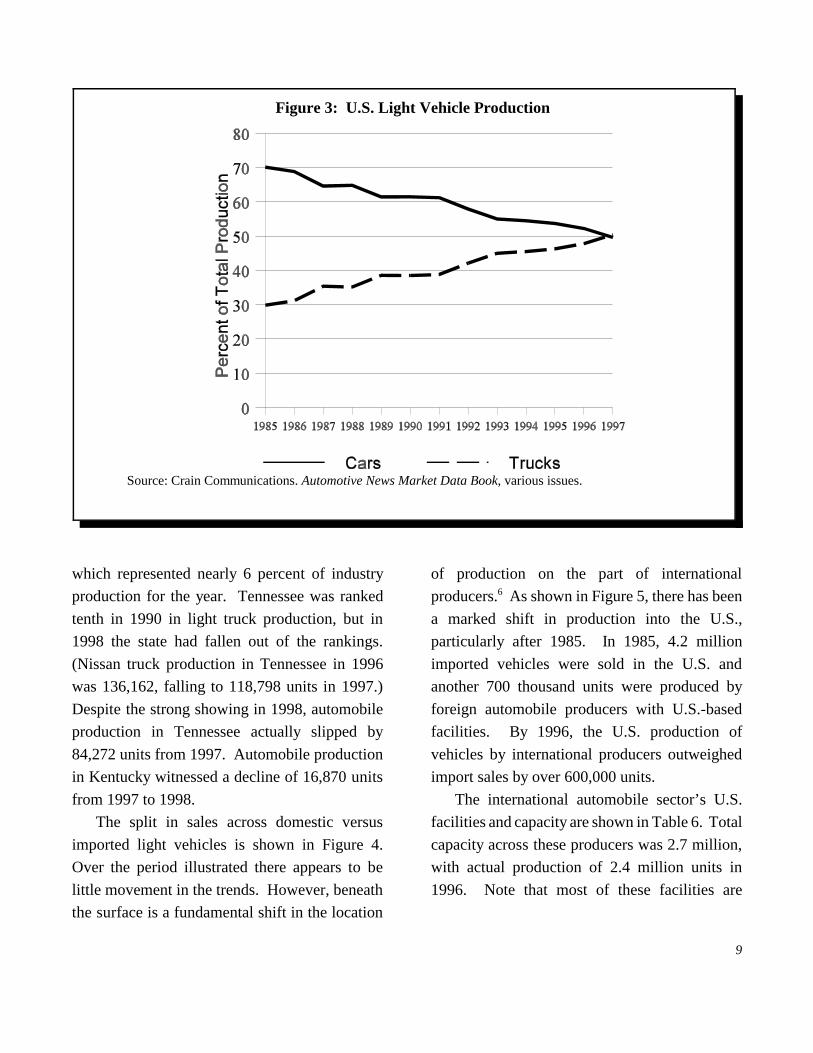
An additional outgrowth of the structural
change that has taken place in the American
automobile market since reaching its mature stage
is the increased popularity of light trucks and
sport-utility vehicles, especially since 1981. Not
only are consumers demanding a wider variety of
passenger car offerings, but segmentation of the
market has spilled over to more heavy-duty
vehicles, which at one time was only a specialized
niche market catering to agricultural users and off-
road enthusiasts. Sales of light trucks (0-14,000
lbs.) accounted for about half of the light vehicle
market in 1997, compared to only twenty percent
in 1980 (see Figure 3). This increase in truck
demand is clearly evident from the capacity
utilization data shown in Appendix Table 2. Of
the forty-two lines assembling trucks in the U.S.,
Canada and Mexico in the 1997 model year,
sixteen (or 38 percent) operated at or above their
normal capacity. Overall, the industry output of
7.2 million light trucks (up from 6.5 million in
1994), 6.8 million from Big Three facilities and
0.5 million from transplant facilities, accounted
for 98.7 percent of total U. S.-Canadian-Mexican
truck assembly capacity. In addition, the
popularity of trucks is evidenced by the fact that,
in contrast to passenger cars, multiple plants are
required to produce many of the various truck
models. A prime example of this is the popular
Ford F-series pickup which was produced in five
of Ford’s thirteen truck facilities. The continued
expansion of the light truck market induced
Toyota to build a truck assembly facility in
Indiana.
The top ten states for both car and light truck
production are shown in Tables 2-5. Tables 2 and
3 show top car producing states in 1980 and 1998,
respectively; Tables 4 and 5 show the top light
truck producing states for the 1990 and 1998. In
1980, Tennessee did not even appear in the
ranking for cars, but rose to fourth in 1998, with
production of more than 466 thousand units,
Car Assembly Plants
Truck Assembly Plants
Heavy Truck Assembly Plants
SOUTH CAROLINA
CALIFORNIA
IDAHO
OREGON
WASHINGTON
MONTANA
WYOMING
UTAH
COLORADO
ARIZONANEW
MEXICO
TEXAS
OKLAHOMA
KANSAS
NEBRASKA
SOUTH DAKOTA
NORTH DAKOTA
MINNESOTA
WISCONSIN
IOWA
ILLINOIS
OHIOINDIANA
KENTUCKY
WV VIRGINIA
NORTH CAROLINA
GEORGIA
FLORIDA
ALABAMA
MIS
SISS
IPPI
MISSOURI
ARKANSAS
LOUI
SIAN
A
NEVADA
MICHIGAN
PENNSYLVANIANEW JERSEY
NEW YORKCT
MA
VT
NH
MAINE
TENNESSEE
RI
MARYLAND
DELAWARE
(3)
(2)
(13)
(5)
(2)
(2)
(3)
(6)
(5)
(2)
(4)
(2)
(2)
(2)
Source: Crain Communications, Automotive News 1998 Market Data Book, May 27, 1998.
Figure 2: Number of Assembly Plants by State, 1997
Note: Symbol location is not indicative of plant location.
9
Figure 3: U.S. Light Vehicle Production
Source: Crain Communications. Automotive News Market Data Book, various issues.
which represented nearly 6 percent of industry
production for the year. Tennessee was ranked
tenth in 1990 in light truck production, but in
1998 the state had fallen out of the rankings.
(Nissan truck production in Tennessee in 1996
was 136,162, falling to 118,798 units in 1997.)
Despite the strong showing in 1998, automobile
production in Tennessee actually slipped by
84,272 units from 1997. Automobile production
in Kentucky witnessed a decline of 16,870 units
from 1997 to 1998.
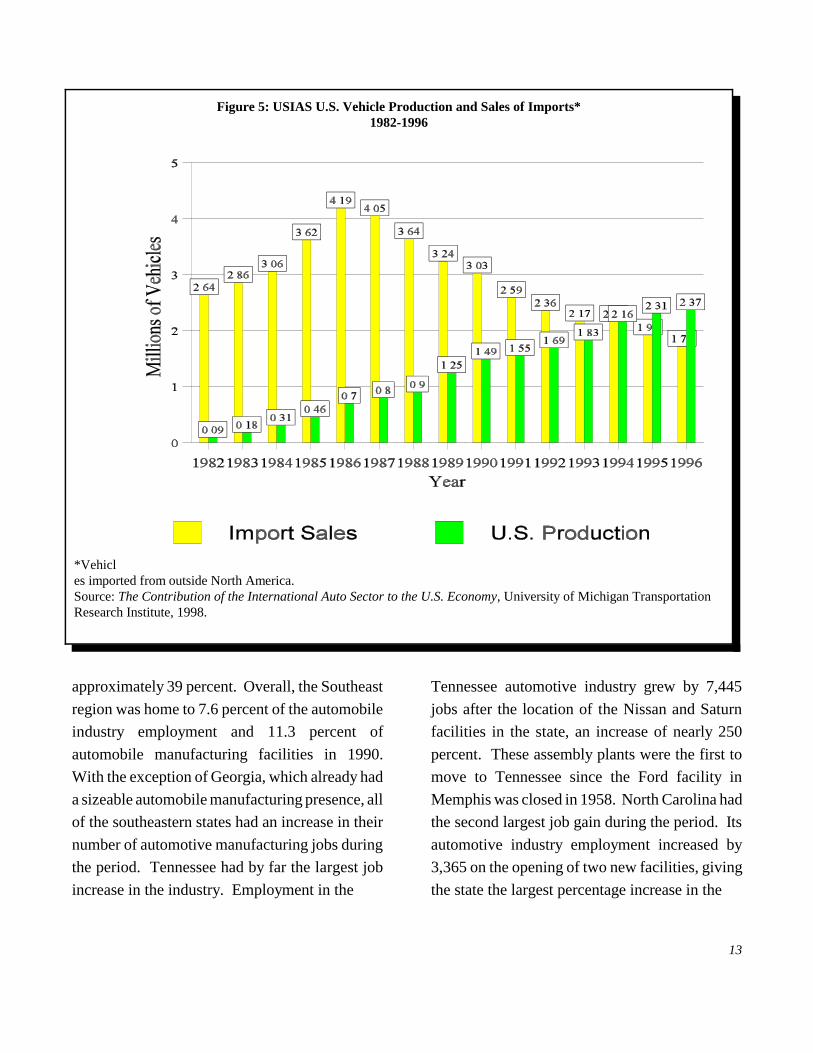
The split in sales across domestic versus
imported light vehicles is shown in Figure 4.
Over the period illustrated there appears to be
little movement in the trends. However, beneath
the surface is a fundamental shift in the location
of production on the part of international
producers.6 As shown in Figure 5, there has been
a marked shift in production into the U.S.,
particularly after 1985. In 1985, 4.2 million
imported vehicles were sold in the U.S. and
another 700 thousand units were produced by
foreign automobile producers with U.S.-based
facilities. By 1996, the U.S. production of
vehicles by international producers outweighed
import sales by over 600,000 units.
The international automobile sector’s U.S.
facilities and capacity are shown in Table 6. Total
capacity across these producers was 2.7 million,
with actual production of 2.4 million units in
1996. Note that most of these facilities are

10
Table 2: Top Ten States in Car Production: 1980
State Production
% ofIndustry
Production
1. Michigan 1,731,830 26.9
2. Ohio 501,278 7.8
3. Georgia 501,278 6.9
4. Delaware 430,067 6.7
5. New Jersey 370, 783 6.2
6. Missouri 370,783 5.8
7. Illinois 363,146 5.7
8. Oklahoma 329,201 5.1
9. Kansas 312,849 4.9
10. New York 287,491 4.5
Source: Crain Communications, Automotive News1981 Market Data Book, April 29, 1981.
Table 3: Top Ten States in Car Production 1998
State Production% of Industry
Production
1. Michigan 1,718,889 21.6
2. Ohio 1,016,066 12.8
3. Illinois 698,298 8.8
4. Tennessee 466,709 5.9
5. Kentucky 412,776 5.2
6. Georgia 257,035 3.2
7. Kansas 232,203 2.9
8. Oklahoma 215,242 2.7
9. California 203,266 2.6
10. Missouri 169,763 2.1
Source: Author’s calculations from data in 1999 Market Data Book. Crain Communications, Automotive News 1999 Market Data Book, May 1999.
concentrated in the same general region of the
lower midwest and upper Southeast of the U.S.
A total of 140,963 heavy trucks were produced
in the U.S. in 1997. Heavy truck production, like
the production of light vehicles, has important
impacts both in terms of assembly activity, and
supplier activity as well. As shown in Table 7, the
Southeast has a quiet, but well-established
presence, in this field of production, with North
Carolina, South Carolina and Tennessee
accounting for the production of 79,031 heavy
trucks, or over 56 percent of total U.S. production.
The proximity of the Kenworth production line in
Ohio likely provides important supplier-linked
spillovers into the southeastern states.
III. THE EXPANSION OF THE AUTOMOBILE ASSEMBLY SECTOR INTO THE SOUTHEAST
While the Southeast played a minor role in
automotive production during the branch plant
era, the modern development of the automotive
production infrastructure in the region has been
far more dramatic due to structural change that
began to hit the industry in the mid-1970's. We
document these trends, using a variety of data
sources. Table 8 shows establishment and
employment data for the broad transportation
equipment sector (SIC 37), for the years 1980,
1990 and 1996, for selected southeastern states.
Tennessee clearly stands out in terms of its
dominance in employment, which totaled 47,034
in 1996. Tennessee also has enjoyed one of the
strongest gains in employment, trailing only

11
Table 4: Top Ten States in Truck Production:
1990 Model Year
State Production
% ofIndustry
Production
1. Michigan 747,500 22.8
2. Missouri 582,033 17.8
3. Ohio 565,464 17.3
4. Kentucky 277,691 8.5
5. Indiana 251,073 7.7
6. Minnesota 173,925 5.3
7. Maryland 170,055 5.2
8. Virginia 156,793 4.8
9. New York 147,972 4.5
10. Tennessee 127,084 3.9
Source: Crain Communications, Automotive News1991 Market Data Book, May 29, 1991.
Table 5: Top Ten States in Truck Production 1998
State Production
% ofIndustry
Production
1. Missouri 1,020,215 13.4
2. Michigan 928,038 12.2
3. Ohio 896,267 11.8
4. Kentucky 773,088 10.2
5. New Jersey 328,786 4.3
6. Indiana 269,568 3.5
7. Georgia 257,236 3.4
8. Virginia 222,961 2.9
9. Wisconsin 207,974 2.7
10. Louisiana 187,932 2.5
Source: Author’s calculations from data in 1999 Market Data Book. Crain Communications, Automotive News 1999 Market Data Book, May 1999.
Kentucky. Georgia and Alabama have each
witnessed a decline in industry employment
between 1980 and 1996. Alabama’s situation
should improve as the supplier network for
Mercedes Benz establishes itself and as the newly
announced Honda facility comes on line. The
establishment data for this sector tell a somewhat
different story. North Carolina has the largest
number of plants (303), yet it ranks fourth in
employment. Surprisingly, Tennessee’s growth in
the number of establishments in the 1990s places
it second, ahead of Alabama. Together these
figures suggest relatively large facilities within
Tennessee.
Table 9 presents similar data, focusing on the
more narrowly defined motor vehicle and
equipment sector, SIC 371. Tennessee once again
stands out as the regional leader in employment
(38,795 jobs in 1996), and accounts for 148
facilities, trailing only North Carolina (which
accounts for 164 plants). Tennessee’s
establishment growth is quite weak compared to
the other states shown, although its employment
growth puts it in second place.
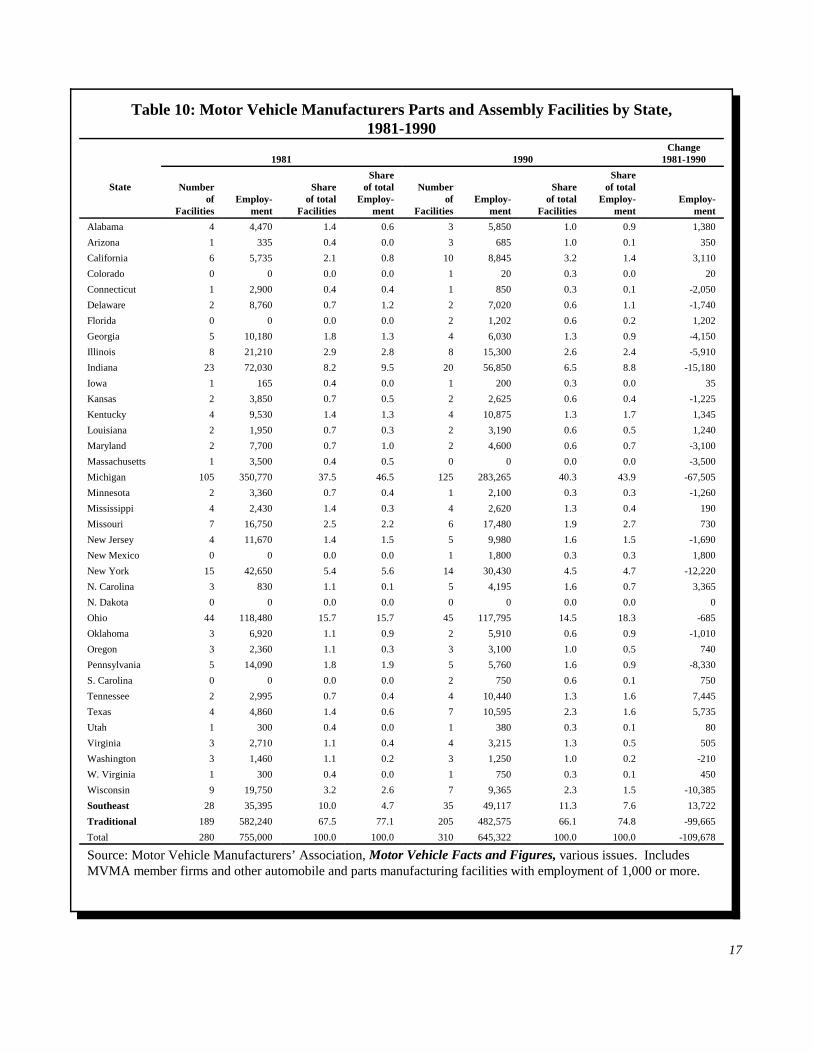
Table 10 places these trends for the Southeast
in a broader context, by including all states. As
the table shows, the traditional automotive
manufacturing states—Illinois, Indiana, Michigan,
Ohio, and Wisconsin—remain home to the
majority of the automotive manufacturing
industry.7 Combined, these states housed 66.1
percent of all facilities and 74.8 percent of all jobs
in auto manufacturing in 1990, with Michigan's
125 facilities and 283,265 jobs accounting for a

12
Figure 4: Domestic vs. Import Light Vehicle Production
Source: Crain Communications. Automotive News Market Data Book, various issues, and American AutomobileManufacturers Association AAMA Motor Vehicle Facts and Figures, various issues.
majority of each. Through the 1980's, however,
when the industry lost over 100,000 jobs
nationwide, each of these states, except Ohio,
suffered a dramatic decline in their total number
of automobile industry jobs. As a group,
automobile and parts manufacturers in these states
lost 99,665 jobs between 1981 and 1990,
accounting for over 90 percent of the job losses
nationwide. Michigan was the biggest job loser,
suffering a decline of almost 68,000, or nearly
twenty percent of its automotive industry
employment. Indiana had a similar percentage
decline in its automotive industry, losing about
twenty-one percent of its automotive industry jobs
with a decline of 15,180. Illinois lost a slightly
higher percentage of its automotive industry
during the 1980's. Employment in its eight motor
vehicle and parts facilities declined by nearly
6,000 or about twenty-eight percent. Although
not the biggest loser in terms of the number of
jobs, Wisconsin’s loss of over 10,000 represented
a loss of fifty-three percent of its auto
manufacturing employment. The presence of
Honda, the first Japanese manufacturer to
establish U.S. production, prevented a similar
decline in automotive industry employment in
Ohio where the loss of jobs totaled only 685
during the period.
In contrast, the number of Motor Vehicle
Manufacturers’ Association (MVMA) facilities in
the Southeast increased by twenty-five percent
between 1981 and 1990 bringing a corresponding
rise in the number of automotive industry jobs in
the region of nearly 14,000, an increase of
13
Figure 5: USIAS U.S. Vehicle Production and Sales of Imports*1982-1996
*Vehicles imported from outside North America.Source: The Contribution of the International Auto Sector to the U.S. Economy, University of Michigan TransportationResearch Institute, 1998.
approximately 39 percent. Overall, the Southeast
region was home to 7.6 percent of the automobile
industry employment and 11.3 percent of
automobile manufacturing facilities in 1990.
With the exception of Georgia, which already had
a sizeable automobile manufacturing presence, all
of the southeastern states had an increase in their
number of automotive manufacturing jobs during
the period. Tennessee had by far the largest job
increase in the industry. Employment in the
Tennessee automotive industry grew by 7,445
jobs after the location of the Nissan and Saturn
facilities in the state, an increase of nearly 250
percent. These assembly plants were the first to
move to Tennessee since the Ford facility in
Memphis was closed in 1958. North Carolina had
the second largest job gain during the period. Its
automotive industry employment increased by
3,365 on the opening of two new facilities, giving
the state the largest percentage increase in the

14
Table 6: USIAS Assembly Facilities: 1996 Capacity
Company LocationCar
CapacityTruck
CapacityTotal
Capacity
Actual1996
ProductionEmploy-
ment
Invest-ment
($ Millions)Start-up
Date
AutoAlliance Flat Rock, MI 240,000 -- 240,000 129,441 3,665 1,000 9/87
BMW Spartanburg, SC 90,000 -- 90,000 50,278 1,350 400 9/94
Honda Marysville, OH 430,000 -- 430,000 424,462 5,800 1,700 11/82
East Liberty, OH 230,000 -- 230,000 209,912 2,500 659 12/89
Mercedes-Benz
Vance, AL -- 70,000 70,000 -- 1,500 300 2/97
Mitsubishi Normal, IL 240,000 -- 240,000 192,961 4,000 650 9/88
NUMMI Fremont, CA 240,000 150,000 390,000 365,469 4,600 1,700 12/84
Nissan Smyrna, TN 310,000 140,000 450,000 414,031 6,000 1,350 6/83
Subaru-Isuzu Lafayette, IN 90,000 90,000 180,000 194,871 2,300 670 9/89
Toyota Georgetown, KY 400,000 -- 400,000 385,657 6,000 3,000 5/88
AIAM Total 2,270,000 350,000 2,720,000 2,367,082 37,715 11,429
Source: Contribution of the International Auto Sector to the U.S. Economy, University of Michigan TransportationResearch Institute, 1998.
Southeast (over 405 percent). Four other states in
the region, Alabama, Florida, Kentucky and
Louisiana, also added substantially to their auto
manufacturing payrolls, each gaining more than
1,200 jobs in the industry. South Carolina,
Virginia, and West Virginia all had much smaller
increases of less than one thousand jobs, though
the addition of 450 jobs in West Virginia still
amounted to a 150 percent increase in the size of
its auto industry. The only job loser in the
Southeast, Georgia, saw its auto industry
employment decline from 10,180 to 6,030
primarily from the closing of GM’s Lakewood
plant in 1989.
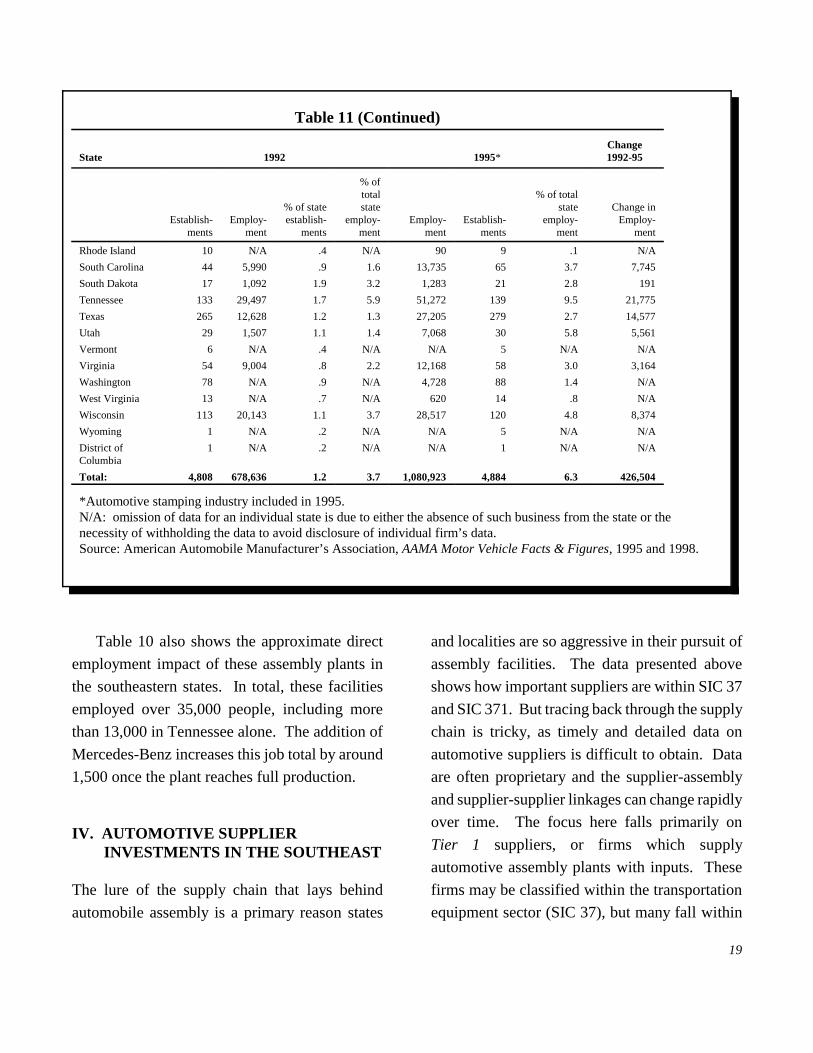
More recent data on facilities by state are
shown in Table 11 for 1992 and 1995. In 1992,
Alabama, Georgia, Kentucky, South Carolina and
Tennessee accounted for 9.6 percent of total
establishments, rising to a 10.2 percent share by
1995. These same states employed a total of
80,226 workers in these facilities (11.8 percent of
national employment in SIC 371), increasing
sharply to 142,073 jobs (12.0 percent of national
employment in SIC 371) by 1995. South Carolina
enjoyed the largest percentage gain (129.3
percent) while Tennessee enjoyed the largest
absolute gain (21,775 jobs). Illinois, Indiana,
Michigan and Wisconsin each saw the number of
plants decline between 1992 and 1995. At the
same time employment in these states advanced
indicating a consolidation of suppliers.

15
Table 7: Heavy Trucks 1997
State City Make ProductionPercent of Total
Production
North Carolina Cleveland Freightliner 23,521 16.7
Mt. Holly Freightliner 18,462 13.1
Ohio Chillicothe Kenworth 11,565 8.2
Oregon Portland Freightliner 17,453 12.4
Pennsylvania Macungie Mack 11,342 8.0
South Carolina Winnsboro Mack 15,496 11.0
Gaffney Freightliner 10,665 7.6
Tennessee Madison Peterbilt 10,887 7.7
Texas Denton Peterbilt 10,846 7.7
Washington Renton Kenworth 10,726 7.6
Total 140,963 --
Source: Crain Communications, Automotive News 1997 Market Data Book, May 28, 1997, and AmericanAutomobile Manufacturer’s Association, AAMA Motor Vehicle Facts & Figures, 1997.
Notable for several states is the share of
statewide employment dedicated to automotive
parts production and assembly. In 1981,
automotive parts and assembly employment in
Tennessee accounted for only 0.4 percent of total
employment, rising to 9.5 percent in 1995.
Kentucky has had similar growth, with
employment in automotive parts and assembly
representing 10.5 percent of 1995 jobs.
These data clearly demonstrate that the
Southeast has emerged as a significant component
of the nation's automobile production
infrastructure. Although the region was part of
the original branch plant strategies of Ford and
GM, it did not garner a substantial share of the
industry's investments until the early 1980's and
the arrival of the Japanese transplants. Since then,
the region has attracted new investments from
both the Big Three and other foreign
manufacturers, the most recent being the locations
of BMW in Spartanburg, South Carolina, and
Mercedes-Benz in Tuscaloosa, Alabama. And as
noted above, the Southeast accounted for 56
percent of U.S. heavy truck production in 1997.
At the end of the 1994 model year there were
eleven automobile assembly facilities located in
the Southeast. (The Mercedes Benz facility in
Alabama is classified as a light truck facility, as

16
Table 8: Establishment and Employment Data for Transportation EquipmentTransportation equipment (SIC 37)
Total establishments Employment
Percent change Percent change
State 1980 1990 1996 80-96 90-96 1980 1990 1996 80-96 90-96
Alabama 134 205 220 64.2 7.3 22,641 22,583 19,680 -13.1 -12.9
Georgia 128 220 257 100.8 16.8 31,955 41,224 40,421 26.5 -1.9
Kentucky 69 112 142 105.8 26.8 14,161 21,442 31,112 119.7 45.1
North Carolina 152 249 303 99.3 21.7 15,092 22,459 28,807 90.9 28.3
South Carolina 64 115 164 156.3 42.6 4,271 12,409 17,213 303.0 38.7
Tennessee 163 238 273 67.5 14.7 27,405 34,064 47,034 71.6 38.1
United States 8,369 10,787 11,908 42.3 10.4 1,855,912 1,797,524 1,521,541 -18.0 -15.4
Source: U.S. Department of Commerce, Bureau of the Census, County Business Patterns series.
Table 9: Establishment and Employment Data for Motor Vehicle and EquipmentMotor vehicles and equipment (SIC 371)
Total establishments Employment
Percent change Percent change
State 1980 1990 1996 80-96 90-96 1980 1990 1996 80-96 90-96
Alabama 57 80 101 77.2 26.3 6,718 11,434 10,563 57.2 -7.6
Georgia 68 118 121 77.9 2.5 14,933 15,758 14,154 -5.2 -10.2
Kentucky 44 68 87 97.7 27.9 12,769 19,196 28,811 125.6 50.1
North Carolina 69 116 164 137.7 41.4 11,437 14,808 23,215 103.0 56.8
South Carolina 15 36 71 373.3 97.2 2,340 6,324 12,582 437.7 99.0
Tennessee 84 131 148 76.2 13.0 16,604 23,306 38,795 133.6 66.5
United States 3,524 4487 5,049 43.3 12.5 778,449 707,160 785,168 0.9 11.0
Source: U.S. Department of Commerce, Bureau of the Census, County Business Patterns series.
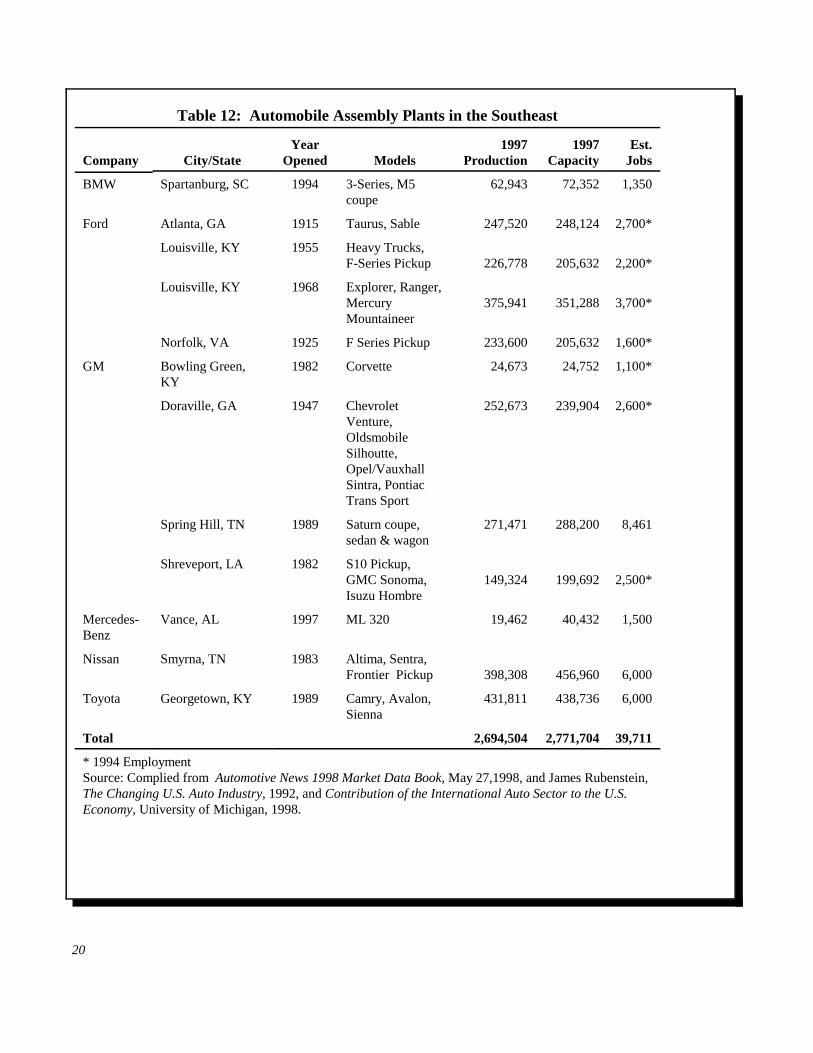
the plant currently produces only sports utility
vehicles). Table 12 gives an accounting of these
plants, including their 1994 output and production
capacity. The total output of these facilities of
over 2.3 million units represented 18.6 percent of
the total automobile production in the U.S. in
1994, and these plants' 1994 capacity of 2.2
million units accounted for 18.5 percent of all
U.S. automobile production capacity. Notice that
half of these southern plants are new investments
that were constructed and began operations during
the 1980's.
17
Table 10: Motor Vehicle Manufacturers Parts and Assembly Facilities by State,1981-1990
1981 1990Change
1981-1990
State Numberof
FacilitiesEmploy-
ment
Shareof total
Facilities
Shareof total
Employ-ment
Numberof
FacilitiesEmploy-
ment
Shareof total
Facilities
Shareof total
Employ-ment
Employ-ment
Alabama 4 4,470 1.4 0.6 3 5,850 1.0 0.9 1,380
Arizona 1 335 0.4 0.0 3 685 1.0 0.1 350
California 6 5,735 2.1 0.8 10 8,845 3.2 1.4 3,110
Colorado 0 0 0.0 0.0 1 20 0.3 0.0 20
Connecticut 1 2,900 0.4 0.4 1 850 0.3 0.1 -2,050
Delaware 2 8,760 0.7 1.2 2 7,020 0.6 1.1 -1,740
Florida 0 0 0.0 0.0 2 1,202 0.6 0.2 1,202
Georgia 5 10,180 1.8 1.3 4 6,030 1.3 0.9 -4,150
Illinois 8 21,210 2.9 2.8 8 15,300 2.6 2.4 -5,910
Indiana 23 72,030 8.2 9.5 20 56,850 6.5 8.8 -15,180
Iowa 1 165 0.4 0.0 1 200 0.3 0.0 35
Kansas 2 3,850 0.7 0.5 2 2,625 0.6 0.4 -1,225
Kentucky 4 9,530 1.4 1.3 4 10,875 1.3 1.7 1,345
Louisiana 2 1,950 0.7 0.3 2 3,190 0.6 0.5 1,240
Maryland 2 7,700 0.7 1.0 2 4,600 0.6 0.7 -3,100
Massachusetts 1 3,500 0.4 0.5 0 0 0.0 0.0 -3,500
Michigan 105 350,770 37.5 46.5 125 283,265 40.3 43.9 -67,505
Minnesota 2 3,360 0.7 0.4 1 2,100 0.3 0.3 -1,260
Mississippi 4 2,430 1.4 0.3 4 2,620 1.3 0.4 190
Missouri 7 16,750 2.5 2.2 6 17,480 1.9 2.7 730
New Jersey 4 11,670 1.4 1.5 5 9,980 1.6 1.5 -1,690
New Mexico 0 0 0.0 0.0 1 1,800 0.3 0.3 1,800
New York 15 42,650 5.4 5.6 14 30,430 4.5 4.7 -12,220
N. Carolina 3 830 1.1 0.1 5 4,195 1.6 0.7 3,365
N. Dakota 0 0 0.0 0.0 0 0 0.0 0.0 0
Ohio 44 118,480 15.7 15.7 45 117,795 14.5 18.3 -685
Oklahoma 3 6,920 1.1 0.9 2 5,910 0.6 0.9 -1,010
Oregon 3 2,360 1.1 0.3 3 3,100 1.0 0.5 740
Pennsylvania 5 14,090 1.8 1.9 5 5,760 1.6 0.9 -8,330
S. Carolina 0 0 0.0 0.0 2 750 0.6 0.1 750
Tennessee 2 2,995 0.7 0.4 4 10,440 1.3 1.6 7,445
Texas 4 4,860 1.4 0.6 7 10,595 2.3 1.6 5,735
Utah 1 300 0.4 0.0 1 380 0.3 0.1 80
Virginia 3 2,710 1.1 0.4 4 3,215 1.3 0.5 505
Washington 3 1,460 1.1 0.2 3 1,250 1.0 0.2 -210
W. Virginia 1 300 0.4 0.0 1 750 0.3 0.1 450
Wisconsin 9 19,750 3.2 2.6 7 9,365 2.3 1.5 -10,385
Southeast 28 35,395 10.0 4.7 35 49,117 11.3 7.6 13,722
Traditional 189 582,240 67.5 77.1 205 482,575 66.1 74.8 -99,665
Total 280 755,000 100.0 100.0 310 645,322 100.0 100.0 -109,678
Source: Motor Vehicle Manufacturers’ Association, Motor Vehicle Facts and Figures, various issues. IncludesMVMA member firms and other automobile and parts manufacturing facilities with employment of 1,000 or more.

18
Table 11: Motor Vehicle and Equipment Manufacturers by State (SIC 371)
State 1992 1995*Change1992-95
Establish-ments
Employ-ment
% of stateestablish-
ments
% oftotalstate
employ-ment
Employ-ment
Establish-ments
% of totalstate
employ-ment
Change inEmploy-
ment
Alabama 76 11,240 1.2 3.0 19,599 91 5.0 8,359
Alaska 1 N/A .2 N/A N/A 1 N/A N/A
Arizona 72 2,698 1.5 1.5 6,089 65 3.0 3,391
Arkansas 60 6,895 1.5 3.0 11,473 60 4.6 4,578
California 647 28,964 1.3 1.5 43,910 605 2.4 14,946
Colorado 64 N/A 1.2 N/A 3,223 68 1.7 N/A
Connecticut 35 N/A .6 N/A 3,462 34 1.2 N/A
Delaware 4 N/A .5 N/A N/A 7 N/A N/A
Florida 168 6,979 1.0 1.5 9,966 175 2.1 2,987
Georgia 127 13,131 1.3 2.4 25,221 118 4.2 12,090
Hawaii 2 N/A .2 N/A N/A 3 N/A N/A
Idaho 18 355 1.0 .5 1423 15 2.0 1,068
Illinois 206 28,015 1.1 2.9 50,977 186 5.0 22,962
Indiana 332 58,181 3.5 9.4 128,687 328 19.1 70,506
Iowa 86 8,632 2.2 3.8 18,044 86 7.3 9,412
Kansas 56 5,925 1.6 3.1 8,690 58 4.4 2,765
Kentucky 80 20,368 1.8 7.4 32,246 83 10.6 11,878
Louisiana 27 N/A .7 N/A 147 22 .1 N/A
Maine 20 N/A .9 N/A 25 11 .0 N/A
Maryland 35 4,478 .8 2.3 4,371 35 2.3 -107
Massachusetts 51 1,619 .5 .3 1,429 48 .3 -190
Michigan 505 178,435 3.1 20.4 245,577 490 25.6 67,142
Minnesota 71 4,481 .9 1.2 6,700 85 1.6 2,219
Mississippi 55 6,554 1.4 2.7 11,141 59 4.5 4,587
Missouri 143 N/A 1.8 N/A 31,828 154 7.5 N/A
Montana 9 N/A .6 N/A 266 9 1.2 N/A
Nebraska 32 3,787 1.6 3.8 4,945 33 4.4 1,158
Nevada 14 301 1.1 1.1 470 19 1.3 169
New Hampshire 5 N/A .2 N/A N/A 10 N/A N/A
New Jersey 85 3,881 .6 .7 6,949 89 1.3 3,068
New Mexico 13 1,062 .8 2.7 823 17 1.9 -239
New York 160 20,429 .6 2.0 34,796 148 3.6 14,367
North Carolina 124 15,425 1.0 1.9 30,494 152 3.5 15,069
North Dakota 11 N/A 1.6 N/A N/A 16 N/A N/A
Ohio 313 92,678 1.7 8.9 145,982 318 13.3 53,304
Oklahoma 85 8,833 2.1 5.6 15,850 96 9.5 7,017
Oregon 74 4,101 1.1 2.0 15,850 86 3.8 11,749
Pennsylvania 178 15,446 1.0 1.6 36,308 170 3.9 20,862
19
Table 11 (Continued)
State 1992 1995*Change1992-95
Establish-ments
Employ-ment
% of stateestablish-
ments
% oftotalstate
employ-ment
Employ-ment
Establish-ments
% of totalstate
employ-ment
Change inEmploy-
ment
Rhode Island 10 N/A .4 N/A 90 9 .1 N/A
South Carolina 44 5,990 .9 1.6 13,735 65 3.7 7,745
South Dakota 17 1,092 1.9 3.2 1,283 21 2.8 191
Tennessee 133 29,497 1.7 5.9 51,272 139 9.5 21,775
Texas 265 12,628 1.2 1.3 27,205 279 2.7 14,577
Utah 29 1,507 1.1 1.4 7,068 30 5.8 5,561
Vermont 6 N/A .4 N/A N/A 5 N/A N/A
Virginia 54 9,004 .8 2.2 12,168 58 3.0 3,164
Washington 78 N/A .9 N/A 4,728 88 1.4 N/A
West Virginia 13 N/A .7 N/A 620 14 .8 N/A
Wisconsin 113 20,143 1.1 3.7 28,517 120 4.8 8,374
Wyoming 1 N/A .2 N/A N/A 5 N/A N/A
District ofColumbia
1 N/A .2 N/A N/A 1 N/A N/A
Total: 4,808 678,636 1.2 3.7 1,080,923 4,884 6.3 426,504
*Automotive stamping industry included in 1995.N/A: omission of data for an individual state is due to either the absence of such business from the state or thenecessity of withholding the data to avoid disclosure of individual firm’s data.Source: American Automobile Manufacturer’s Association, AAMA Motor Vehicle Facts & Figures, 1995 and 1998.
Table 10 also shows the approximate direct
employment impact of these assembly plants in
the southeastern states. In total, these facilities
employed over 35,000 people, including more
than 13,000 in Tennessee alone. The addition of
Mercedes-Benz increases this job total by around
1,500 once the plant reaches full production.
IV. AUTOMOTIVE SUPPLIER INVESTMENTS IN THE SOUTHEAST
The lure of the supply chain that lays behind
automobile assembly is a primary reason states
and localities are so aggressive in their pursuit of
assembly facilities. The data presented above
shows how important suppliers are within SIC 37
and SIC 371. But tracing back through the supply
chain is tricky, as timely and detailed data on
automotive suppliers is difficult to obtain. Data
are often proprietary and the supplier-assembly
and supplier-supplier linkages can change rapidly
over time. The focus here falls primarily on
Tier 1 suppliers, or firms which supply
automotive assembly plants with inputs. These
firms may be classified within the transportation
equipment sector (SIC 37), but many fall within
20
Table 12: Automobile Assembly Plants in the Southeast
Company City/StateYear
Opened Models1997
Production1997
CapacityEst.
Jobs
BMW Spartanburg, SC 1994 3-Series, M5coupe
62,943 72,352 1,350
Ford Atlanta, GA 1915 Taurus, Sable 247,520 248,124 2,700*
Louisville, KY 1955 Heavy Trucks,F-Series Pickup 226,778 205,632 2,200*
Louisville, KY 1968 Explorer, Ranger,MercuryMountaineer
375,941 351,288 3,700*
Norfolk, VA 1925 F Series Pickup 233,600 205,632 1,600*
GM Bowling Green,KY
1982 Corvette 24,673 24,752 1,100*
Doraville, GA 1947 ChevroletVenture,OldsmobileSilhoutte,Opel/VauxhallSintra, PontiacTrans Sport
252,673 239,904 2,600*
Spring Hill, TN 1989 Saturn coupe,sedan & wagon
271,471 288,200 8,461
Shreveport, LA 1982 S10 Pickup,GMC Sonoma,Isuzu Hombre
149,324 199,692 2,500*
Mercedes-Benz
Vance, AL 1997 ML 320 19,462 40,432 1,500
Nissan Smyrna, TN 1983 Altima, Sentra,Frontier Pickup 398,308 456,960 6,000
Toyota Georgetown, KY 1989 Camry, Avalon,Sienna
431,811 438,736 6,000
Total 2,694,504 2,771,704 39,711
* 1994 Employment Source: Complied from Automotive News 1998 Market Data Book, May 27,1998, and James Rubenstein,The Changing U.S. Auto Industry, 1992, and Contribution of the International Auto Sector to the U.S.Economy, University of Michigan, 1998.
21
other industry classifications, as suggested by
Table 1. Because of data quality concerns and the
disparate availability of descriptive data for
suppliers, the information presented below come
from a variety of different sources: the Japanese
Automotive Supplier Investment Directory
(JASID), compiled by the Office for the Study of
Automotive Transportation at the University of
Michigan; the Dunn and Bradstreet Registry of
U.S. Companies (DBR); more recent data on first
and second tier suppliers obtained from Elm
International; and a database of suppliers
maintained by the State Department of Economic
and Community Development (ECD). As its
name indicates, the JASID covers only supplier
establishments that are at least partially owned by
a Japanese firm and represents a complete
accounting of Japanese investments in the U.S.
automotive industry as of April 1995 (the most
recent year for which data are available). For each
Japanese-owned establishment the Directory
presents information on location, plant size,
investment, year established, type of operation,
employment, parent company, product produced,
destination of exports, customers, suppliers, sales,
percent of output to the auto industry, customer
quality ratings, and union affiliation. Because it is
compiled from surveys, however, some of these
items may be missing for any given plant. In
addition, SIC codes were assigned for each of
these facilities based on product information
provided in the database. The DBR, alternatively,
includes all firms, regardless of ownership, and
were obtained for only four states in the
Southeast: Alabama, Georgia, North Carolina,
and Tennessee.8 Because of the overlap between
these two data sources in terms of ownership,
duplicate records for Japanese supplier plants
were eliminated from the DBR database to
eliminate double counting these establishments in
the statistical tabulations and analysis.
Although the DBR is not an exact match for
the JASID, it was possible to compile some of the
same information on U.S. companies that is
included in the JASID. This information includes
data on plant location, plant size, employment,
year started, product, and SIC code. Note also
that because the DBR includes companies in all
industries and does not directly identify
automotive supplier firms like the JASID,
establishments had to be selected for inclusion in
the supplier database on the basis of other
information. Without direct identification of
automotive supplier firms, this database will
necessarily be less precise because of the risk that
some plants are included in the database that have
no ties to auto assembly facilities or are not
dependent on the auto industry for a significant
portion of their sales.9
Finally, the information from Elm
International and ECD provide only spartan
descriptive data on the suppliers. Accordingly we
simply show the locational distribution of these
suppliers within the region.
V. JAPANESE AUTOMOTIVE SUPPLIER INVESTMENTS
The JASID reports a year-end 1995 total of 345
facilities. Of these, 271 are components facilities
and the other seventy-four produce and supply
materials or capital equipment (e.g. machine tools

22
Table 13: Selected Characteristicsof Japanese Automotive Supplier
Investments in the U.S.
Average Age 8.5 years
Average Employment 293
Average plant size (squarefeet)
209,000
Average capital investment $39.9 million
Percent of plants unionized 12.3
Percent of plants withexports
72.4
Source: Japanese Automotive SupplierInvestment Directory, Sixth Edition, Office forthe Study of Automotive Transportation, TheUniversity of Michigan, April 1995.
and dies) to assemblers. The influx of Japanese
components facilities began in 1982, the same
year Honda of America opened its Marysville,
Ohio plant, and grew steadily until the latter part
of the decade. The peak years for Japanese
component plant investments occurred in 1987
(50 new facilities), 1988 (62 new facilities) and
1989 (53 new facilities). Once the Japanese
assembly firms reached full production,
established their supplier networks, and achieved
their domestic sourcing goals, however, growth in
new supplier investments slowed to a trickle.
Only two new plants opened in 1992, with no new
plants since the JASID survey.
While the rate of growth will not likely ever
return to its pace of the 1980's, substantial
additional investments in U.S. capacity by
Japanese suppliers may be forthcoming if the
political pressure on assemblers to increase the
domestic content of their vehicles persists and if
currency fluctuations continue to make the
importation of critical large components like
engines and transmissions risky in terms of
profits. During the initial years of assembly
operations, lack of confidence in the ability of
U.S. firms to meet Japanese supplier standards
made importing of key vehicle systems a standard
practice. Because of continued exchange rate
volatility and high transportation costs, we are
likely to see some expansion of domestic engine
production capacity at Japanese assembly plants,
as with the relatively new Nissan facility in
Decherd, Tennessee. In addition, Honda
announced on May 7, 1999 that it would build a
facility in Alabama to support assembly of
minivans and sport utility vehicles. Production is
to begin in 2002 and the plant will employ 1,500
workers. Domestic supplier firms have now
proven able to conform to the quality and
deliverability requirements of Japanese
automakers and the increased use of U.S.
suppliers may dampen future additions to the
Japanese supplier network. In addition, because
nearly all of these Japanese supplier plants
included in the JASID survey were established in
the 1980's we cannot expect any major additions
to their capacity in the near future. The average
age of the facilities listed in the JASID is only 8.5
years.
In addition to the average age of Japanese-
owned supplier establishments, Table 13 lists
some other important features of these new plant
investments. The average employment in these
facilities is 293 workers, compared with an
average size of about 50 workers for all
manufacturing operations in the U.S. Another
interesting characteristic of these plants is that
23
sixty-five percent of them are exporters. Because
of the integration of the U.S. and Canadian
vehicle markets established under the AutoPact in
1962, most of these exports are destined for
Canada, though many of these firms also serve
automotive manufacturers in their home market of
Japan. Europe and Mexico also receive exports
from Japanese parts suppliers in the U.S. Note
also that only 12.3 percent of these establishments
are unionized, giving support to the common
perception that the Japanese are averse to the
traditional labor-management relationship in U.S.
manufacturing plants.
Although nearly all of these Japanese
suppliers serve at least one of the eight transplant
facilities established by Japanese automakers in
the U.S., most also provide components to Big
Three firms as well. Also, as stated above,
American-owned supplier firms have made
inroads into the Japanese supplier network. This
increased reliance on U.S. firms is due, in part, to
the high degree of component outsourcing
practiced by Japanese assembly plants, a fact that
makes the supplier network for any one plant
quite extensive. Nissan, for example had about
225 domestic suppliers for its U.S. built vehicles
making it impossible for the company to rely
exclusively on transplanted Japanese firms for all
of its components. Similarly, Toyota’s
Georgetown, Kentucky facility had more than 200
domestic suppliers (Haywood, 1992).
Some specific data for Japanese automotive
supplier investments in the southeast region are
given in Table 14. In addition to a count of these
plants in the region and descriptive data on plant
size, age, employment, investment, and
percentage of output to the auto industry, the
plants have been grouped by SIC code to provide
an overview of the characteristics of
establishments by industry.
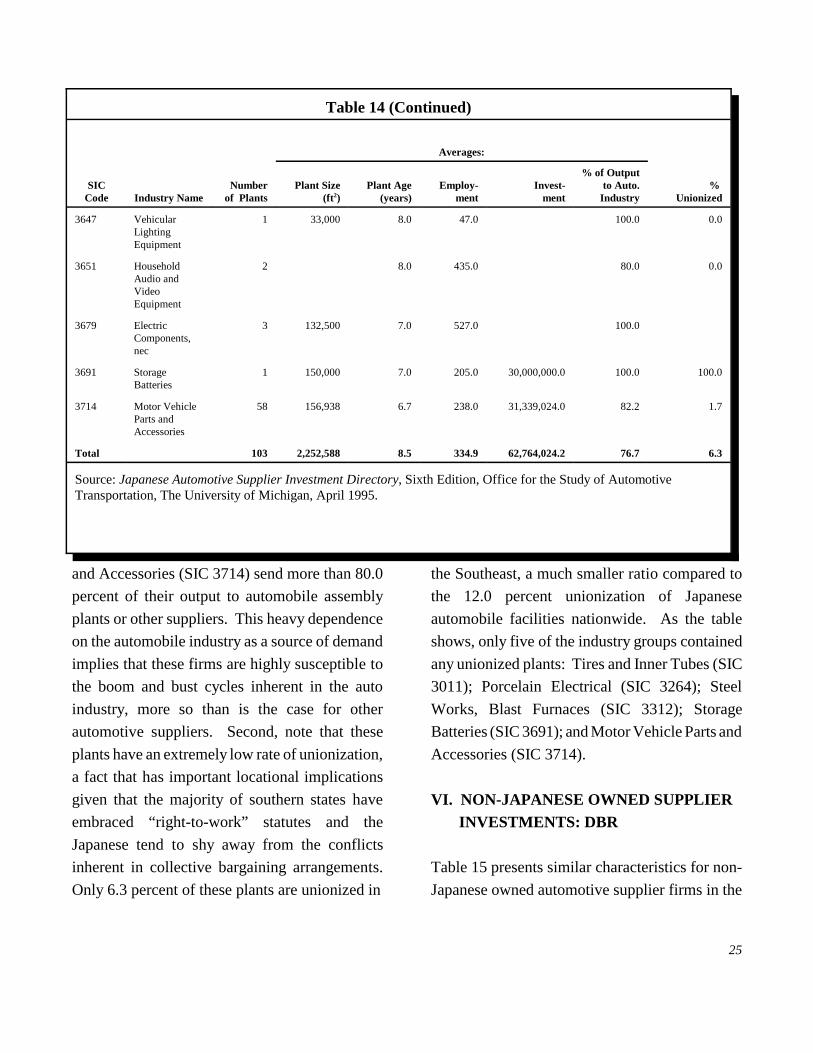
In total there are twenty-one different
industries represented among the Japanese
automotive supplier investments in the Southeast.
Of the 103 establishments in the region, the
majority (fifty-six percent) are engaged in
production of motor vehicle parts and accessories.
On average these facilities employ 335 workers
and have $62.7 million in fixed capital. Note that
nearly all of these investments were made in the
last fifteen years. The overall average age of these
plants (as of 1995) given in the last row of
Table 12 is 8.5 years; only three of the industry
groups have an average plant age greater than ten
years. In fact, only three of the 103 facilities in
the region represent investments made more than
fifteen years ago, a finding that clearly coordinates
the timing of these supplier investments with the
influx of Japanese assembly facilities during the
1980's.
Two additional features of these plants should
be noted from the last row of the table. First is the
fact that the customer base is almost exclusively
comprised of automobile assemblers or other auto
supplier firms. On average 76.7 percent of the
output of these plants is destined for automobile
or parts manufacturing facilities, and 45.0 percent
of the firms in these industries produce
exclusively for the automobile industry.10 Plants
in four other industries: Ball and Roller Bearings
(SIC 3562), Industrial Process Furnaces and
Ovens (SIC 3567), Household Audio and Video
Equipment (SIC 3651) and Motor Vehicle Parts

24
Table 14: Characteristics of Japanese Automotive Supplier Investmentsin the Southeast
SICCode Industry Name
Number of
Plants
Averages:
PlantSize (ft2)
PlantAge
(years)Employ-
mentInvest-
ment
% ofOutput to
Auto.Industry
% Unionized
2296 Tire Cord and Fabrics 1 490,000 14.0 748.0 99.0 0.0
2399 Fabricated TextileProducts, nec
3 111,000 7.3 310.0 7,600,000.0 100.0 0.0
3011 Tires and Inner Tubes 3 1,800,000 9.7 1683.0 163,000,000.0 100.0 66.6
3211 Flat Glass 4 243,725 6.3 358.0 232,075,000.0 100.0 0.0
3231 Glass Products 1 65,600 8.0 195.0 100.0 0.0
3264 Porcelain ElectricalSupplies
1 160,000 9.0 150.0 12,000,000.0 52.0 100.0
3312 Steel Works, BlastFurnaces
1 200,000 7.0 105.0 20.0 100.0
3316 Cold-Rolled SteelSheet, Strip, and Bars
3 55,600 7.7 43.0 4,000,000.0 50.0 0.0
3356 Rolling, Drawing andExtruding ofNonferrous Metals,nec
1 6.0 40.0 0.0
3429 Hardware, nec 2 30,250 4.0 70.0 2,500,000.0 100.0 0.0
3465 AutomotiveStampings
3 277,000 7.0 557.0 333,970,000.0 100.0 0.0
3469 Metal Stampings, nec 1 8.0 305.0 100.0 0.0
3493 Steel Springs, ExceptWire
1 330,000 7.0 194.0 100.0 0.0
3535 Conveyors andConveying Equipment
2 135,000 9.5 150.0 8,000,000.0 36.5 0.0
3541 Machine Tools, MetalCutting Types
4 153,750 9.5 174.0 16,500,000.0 15.0 0.0
3542 Machine Tools, MetalForming Types
1 450,000 21.0 450.0
3562 Ball and RollerBearings
3 70,000 11.3 246.0 15,000,000.0 66.7 0.0
3567 Industrial ProcessFurnaces and Ovens(Paint BakingSystems)
1 33,000 8.0 32.0 1,700,000.0 100.0 0.0
3621 Motors andGenerators
2 227,000 6.5 481.5 52,500,000.0 100.0 0.0
25
Table 14 (Continued)
SICCode Industry Name
Numberof Plants
Averages:
Plant Size(ft 2)
Plant Age(years)
Employ-ment
Invest-ment
% of Outputto Auto.Industry
% Unionized
3647 VehicularLightingEquipment
1 33,000 8.0 47.0 100.0 0.0
3651 HouseholdAudio andVideoEquipment
2 8.0 435.0 80.0 0.0
3679 ElectricComponents,nec
3 132,500 7.0 527.0 100.0
3691 StorageBatteries
1 150,000 7.0 205.0 30,000,000.0 100.0 100.0
3714 Motor VehicleParts andAccessories
58 156,938 6.7 238.0 31,339,024.0 82.2 1.7
Total 103 2,252,588 8.5 334.9 62,764,024.2 76.7 6.3
Source: Japanese Automotive Supplier Investment Directory, Sixth Edition, Office for the Study of AutomotiveTransportation, The University of Michigan, April 1995.
and Accessories (SIC 3714) send more than 80.0
percent of their output to automobile assembly
plants or other suppliers. This heavy dependence
on the automobile industry as a source of demand
implies that these firms are highly susceptible to
the boom and bust cycles inherent in the auto
industry, more so than is the case for other
automotive suppliers. Second, note that these
plants have an extremely low rate of unionization,
a fact that has important locational implications
given that the majority of southern states have
embraced “right-to-work” statutes and the
Japanese tend to shy away from the conflicts
inherent in collective bargaining arrangements.
Only 6.3 percent of these plants are unionized in
the Southeast, a much smaller ratio compared to
the 12.0 percent unionization of Japanese
automobile facilities nationwide. As the table
shows, only five of the industry groups contained
any unionized plants: Tires and Inner Tubes (SIC
3011); Porcelain Electrical (SIC 3264); Steel
Works, Blast Furnaces (SIC 3312); Storage
Batteries (SIC 3691); and Motor Vehicle Parts and
Accessories (SIC 3714).
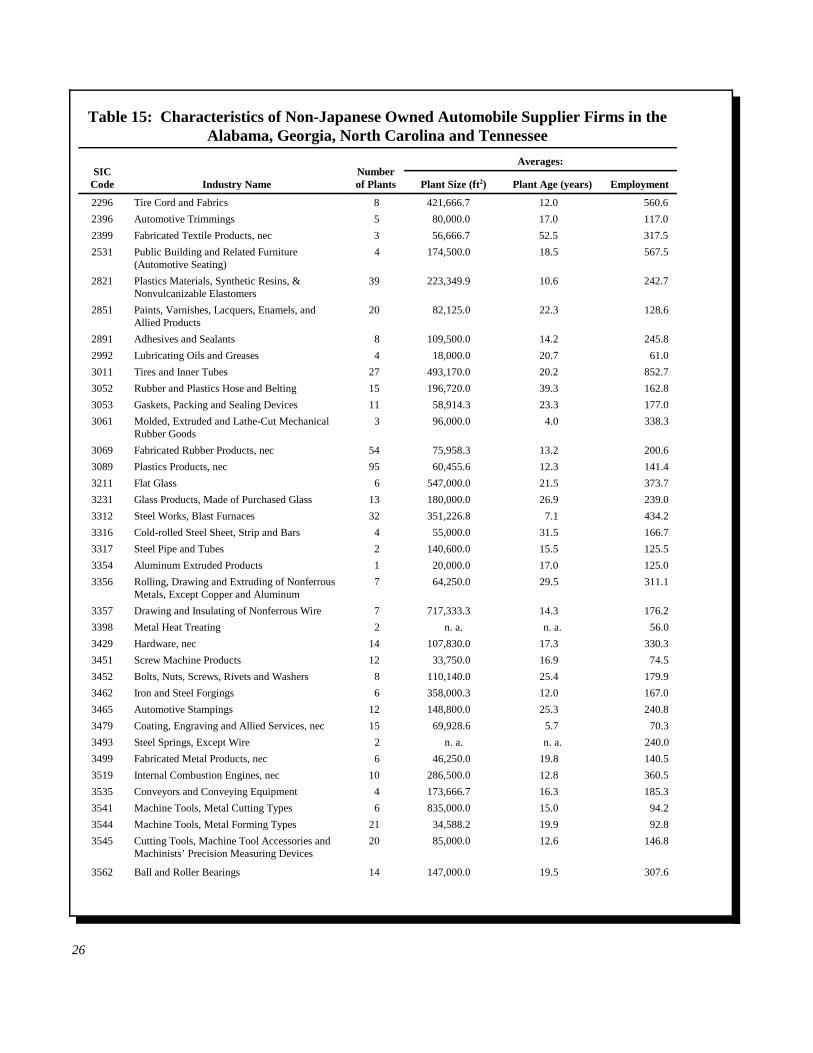
VI. NON-JAPANESE OWNED SUPPLIER INVESTMENTS: DBR
Table 15 presents similar characteristics for non-
Japanese owned automotive supplier firms in the
26
Table 15: Characteristics of Non-Japanese Owned Automobile Supplier Firms in theAlabama, Georgia, North Carolina and Tennessee
SICCode Industry Name
Numberof Plants
Averages:
Plant Size (ft2) Plant Age (years) Employment
2296 Tire Cord and Fabrics 8 421,666.7 12.0 560.6
2396 Automotive Trimmings 5 80,000.0 17.0 117.0
2399 Fabricated Textile Products, nec 3 56,666.7 52.5 317.5
2531 Public Building and Related Furniture(Automotive Seating)
4 174,500.0 18.5 567.5
2821 Plastics Materials, Synthetic Resins, &Nonvulcanizable Elastomers
39 223,349.9 10.6 242.7
2851 Paints, Varnishes, Lacquers, Enamels, andAllied Products
20 82,125.0 22.3 128.6
2891 Adhesives and Sealants 8 109,500.0 14.2 245.8
2992 Lubricating Oils and Greases 4 18,000.0 20.7 61.0
3011 Tires and Inner Tubes 27 493,170.0 20.2 852.7
3052 Rubber and Plastics Hose and Belting 15 196,720.0 39.3 162.8
3053 Gaskets, Packing and Sealing Devices 11 58,914.3 23.3 177.0
3061 Molded, Extruded and Lathe-Cut MechanicalRubber Goods
3 96,000.0 4.0 338.3
3069 Fabricated Rubber Products, nec 54 75,958.3 13.2 200.6
3089 Plastics Products, nec 95 60,455.6 12.3 141.4
3211 Flat Glass 6 547,000.0 21.5 373.7
3231 Glass Products, Made of Purchased Glass 13 180,000.0 26.9 239.0
3312 Steel Works, Blast Furnaces 32 351,226.8 7.1 434.2
3316 Cold-rolled Steel Sheet, Strip and Bars 4 55,000.0 31.5 166.7
3317 Steel Pipe and Tubes 2 140,600.0 15.5 125.5
3354 Aluminum Extruded Products 1 20,000.0 17.0 125.0
3356 Rolling, Drawing and Extruding of NonferrousMetals, Except Copper and Aluminum
7 64,250.0 29.5 311.1
3357 Drawing and Insulating of Nonferrous Wire 7 717,333.3 14.3 176.2
3398 Metal Heat Treating 2 n. a. n. a. 56.0
3429 Hardware, nec 14 107,830.0 17.3 330.3
3451 Screw Machine Products 12 33,750.0 16.9 74.5
3452 Bolts, Nuts, Screws, Rivets and Washers 8 110,140.0 25.4 179.9
3462 Iron and Steel Forgings 6 358,000.3 12.0 167.0
3465 Automotive Stampings 12 148,800.0 25.3 240.8
3479 Coating, Engraving and Allied Services, nec 15 69,928.6 5.7 70.3
3493 Steel Springs, Except Wire 2 n. a. n. a. 240.0
3499 Fabricated Metal Products, nec 6 46,250.0 19.8 140.5
3519 Internal Combustion Engines, nec 10 286,500.0 12.8 360.5
3535 Conveyors and Conveying Equipment 4 173,666.7 16.3 185.3
3541 Machine Tools, Metal Cutting Types 6 835,000.0 15.0 94.2
3544 Machine Tools, Metal Forming Types 21 34,588.2 19.9 92.8
3545 Cutting Tools, Machine Tool Accessories andMachinists’ Precision Measuring Devices
20 85,000.0 12.6 146.8
3562 Ball and Roller Bearings 14 147,000.0 19.5 307.6
27
Table 15 (Continued)
SICCode Industry Name
Numberof Plants
Averages:
Plant Size (ft2) Plant Age (years) Employment
3563 Air and Gas Compressors 5 44,000.0 37.0 140.4
3585 Air Conditioning and Warm Air HeatingEquipment
18 87,181.8 18.9 261.4
3592 Carburetors, Pistons, Piston Rings and Valves 5 50,000.0 9.8 172.5
3599 Industrial and Commercial Machinery andEquipment, nec
64 50,094.6 16.0 131.7
3621 Motors and Generators 25 105,180.1 21.3 330.0
3641 Electric Lamp Bulbs and Tubes 2 172,000.0 35.5 417.5
3643 Current Carrying Wiring Devices 21 65,333.3 35.3 193.2
3644 Noncurrent Carrying Wiring Devices 1 50,000.0 n. a. 150.0
3647 Vehicular Lighting Equipment 2 n. a. 18.0 270.0
3651 Household Audio and Video Equipment 6 63,666.7 16.0 313.6
3691 Storage Batteries 7 128,800.0 10.0 198.7
3694 Electrical Equipment for Internal CombustionEngines
14 43,166.7 18.2 254.7
3711 Motor Vehicles and Car Bodies 20 638,127.3 7.0 833.5
3713 Truck and Bus Bodies 26 80,421.1 16.0 238.9
3714 Motor Vehicle Parts and Accessories 128 117,583.1 16.0 284.6
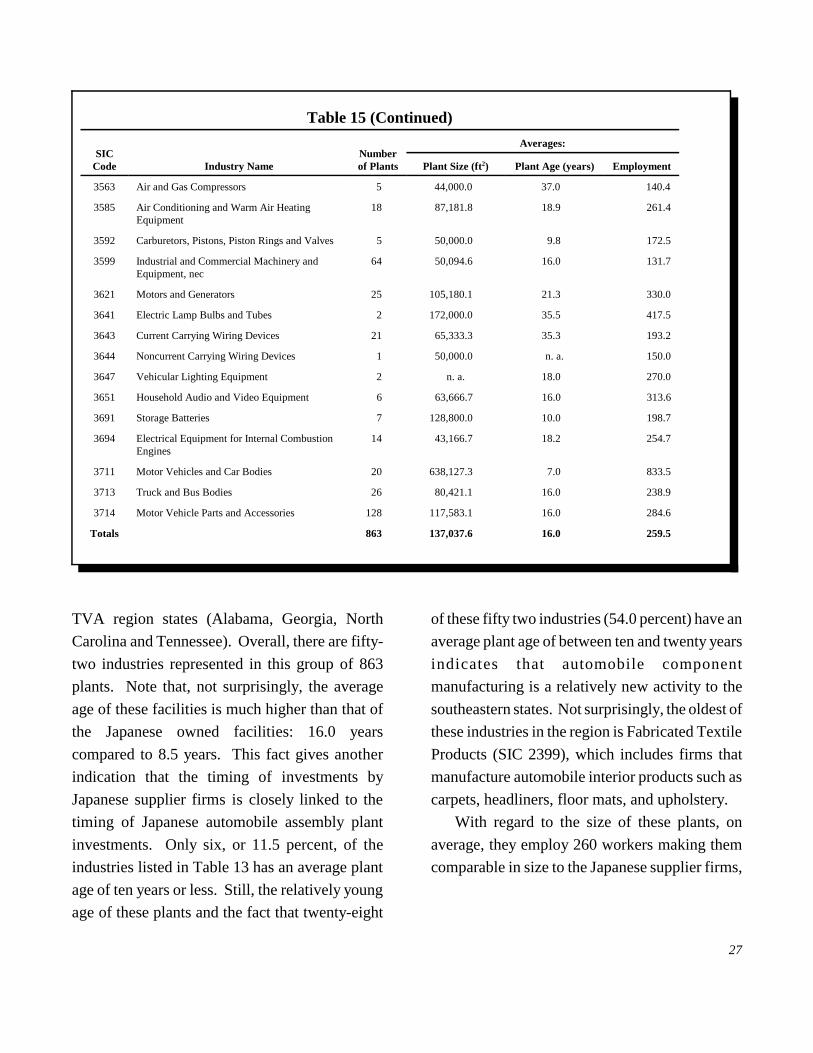
Totals 863 137,037.6 16.0 259.5
TVA region states (Alabama, Georgia, North
Carolina and Tennessee). Overall, there are fifty-
two industries represented in this group of 863
plants. Note that, not surprisingly, the average
age of these facilities is much higher than that of
the Japanese owned facilities: 16.0 years
compared to 8.5 years. This fact gives another
indication that the timing of investments by
Japanese supplier firms is closely linked to the
timing of Japanese automobile assembly plant
investments. Only six, or 11.5 percent, of the
industries listed in Table 13 has an average plant
age of ten years or less. Still, the relatively young
age of these plants and the fact that twenty-eight
of these fifty two industries (54.0 percent) have an
average plant age of between ten and twenty years
indicates that automobile component
manufacturing is a relatively new activity to the
southeastern states. Not surprisingly, the oldest of
these industries in the region is Fabricated Textile
Products (SIC 2399), which includes firms that
manufacture automobile interior products such as
carpets, headliners, floor mats, and upholstery.
With regard to the size of these plants, on
average, they employ 260 workers making them
comparable in size to the Japanese supplier firms,
28
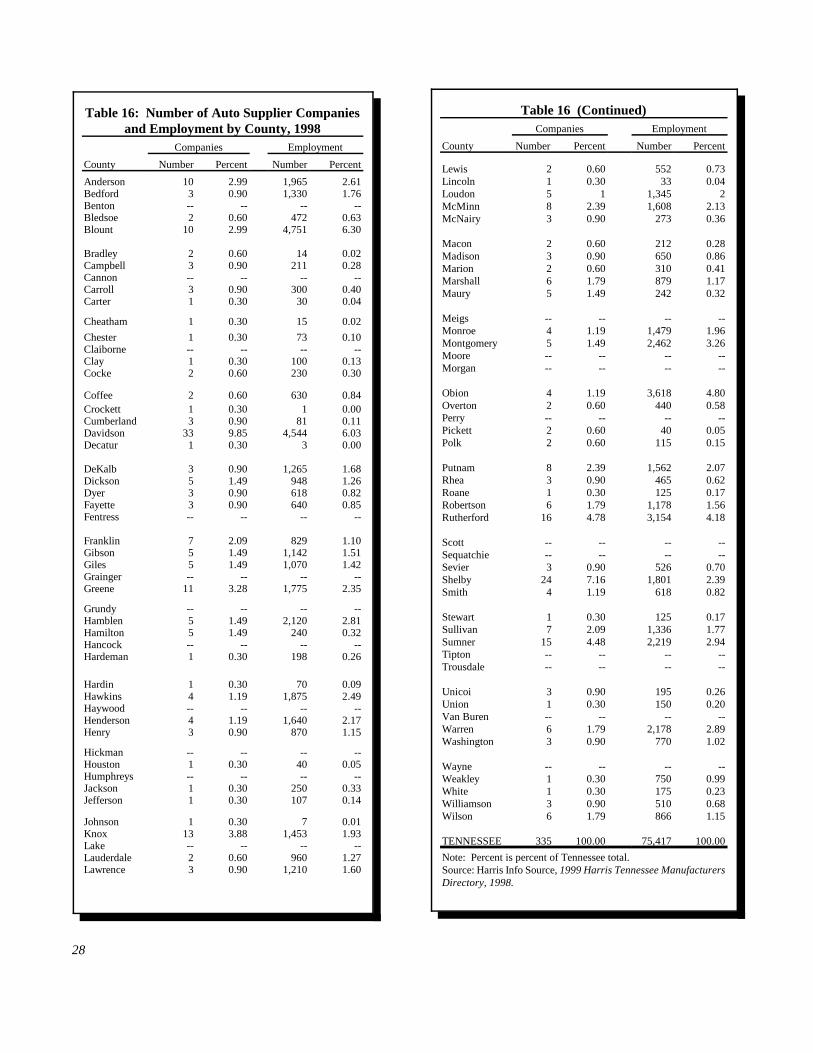
Table 16 (Continued)Companies Employment
County Number Percent Number Percent
Lewis 2 0.60 552 0.73Lincoln 1 0.30 33 0.04Loudon 5 1 1,345 2McMinn 8 2.39 1,608 2.13McNairy 3 0.90 273 0.36
Macon 2 0.60 212 0.28Madison 3 0.90 650 0.86Marion 2 0.60 310 0.41Marshall 6 1.79 879 1.17Maury 5 1.49 242 0.32
Meigs -- -- -- --Monroe 4 1.19 1,479 1.96Montgomery 5 1.49 2,462 3.26Moore -- -- -- --Morgan -- -- -- --
Obion 4 1.19 3,618 4.80Overton 2 0.60 440 0.58Perry -- -- -- --Pickett 2 0.60 40 0.05Polk 2 0.60 115 0.15
Putnam 8 2.39 1,562 2.07Rhea 3 0.90 465 0.62Roane 1 0.30 125 0.17Robertson 6 1.79 1,178 1.56Rutherford 16 4.78 3,154 4.18
Scott -- -- -- --Sequatchie -- -- -- --Sevier 3 0.90 526 0.70Shelby 24 7.16 1,801 2.39Smith 4 1.19 618 0.82
Stewart 1 0.30 125 0.17Sullivan 7 2.09 1,336 1.77Sumner 15 4.48 2,219 2.94Tipton -- -- -- --Trousdale -- -- -- --
Unicoi 3 0.90 195 0.26Union 1 0.30 150 0.20Van Buren -- -- -- --Warren 6 1.79 2,178 2.89Washington 3 0.90 770 1.02
Wayne -- -- -- --Weakley 1 0.30 750 0.99White 1 0.30 175 0.23Williamson 3 0.90 510 0.68Wilson 6 1.79 866 1.15
TENNESSEE 335 100.00 75,417 100.00
Note: Percent is percent of Tennessee total.Source: Harris Info Source, 1999 Harris Tennessee ManufacturersDirectory, 1998.
Table 16: Number of Auto Supplier Companiesand Employment by County, 1998
Companies Employment
County Number Percent Number Percent
Anderson 10 2.99 1,965 2.61Bedford 3 0.90 1,330 1.76Benton -- -- -- --Bledsoe 2 0.60 472 0.63Blount 10 2.99 4,751 6.30
Bradley 2 0.60 14 0.02Campbell 3 0.90 211 0.28Cannon -- -- -- --Carroll 3 0.90 300 0.40Carter 1 0.30 30 0.04
Cheatham 1 0.30 15 0.02
Chester 1 0.30 73 0.10Claiborne -- -- -- --Clay 1 0.30 100 0.13Cocke 2 0.60 230 0.30
Coffee 2 0.60 630 0.84Crockett 1 0.30 1 0.00Cumberland 3 0.90 81 0.11Davidson 33 9.85 4,544 6.03Decatur 1 0.30 3 0.00
DeKalb 3 0.90 1,265 1.68Dickson 5 1.49 948 1.26Dyer 3 0.90 618 0.82Fayette 3 0.90 640 0.85Fentress -- -- -- --
Franklin 7 2.09 829 1.10Gibson 5 1.49 1,142 1.51Giles 5 1.49 1,070 1.42Grainger -- -- -- --Greene 11 3.28 1,775 2.35
Grundy -- -- -- --Hamblen 5 1.49 2,120 2.81Hamilton 5 1.49 240 0.32Hancock -- -- -- --Hardeman 1 0.30 198 0.26
Hardin 1 0.30 70 0.09Hawkins 4 1.19 1,875 2.49Haywood -- -- -- --Henderson 4 1.19 1,640 2.17Henry 3 0.90 870 1.15
Hickman -- -- -- --Houston 1 0.30 40 0.05Humphreys -- -- -- --Jackson 1 0.30 250 0.33Jefferson 1 0.30 107 0.14
Johnson 1 0.30 7 0.01Knox 13 3.88 1,453 1.93Lake -- -- -- --Lauderdale 2 0.60 960 1.27Lawrence 3 0.90 1,210 1.60
29
which employ 278 workers, on average. With
regard to plant size, the average square footage of
these facilities of approximately 137,000.
By March 1994, seven months before limited
production began officially at BMW, eleven
suppliers had already located to the Greenville-
Spartanburg area in South Carolina.11 These
supplier facilities represent a total investment of
about $475 million and will employ just over
1,000 workers. Because BMW has set a domestic
target of 80 percent for its U.S. built vehicles, this
supplier network has likely shown significant
growth.
Table 16 presents the number of supplier
establishments and employment by county from
the 1999 Harris Tennessee Manufacturers
Directory. Nashvi l le-Davidson MSA
(Metropolitan Statistical Area) contains 27
percent of the supplier establishments and 21
percent of the jobs. Davidson, Rutherford, and
Sumner Counties hold the largest number of
establishments as well as the largest number of
jobs. Rutherford County, which accounts for
3,154 jobs in 16 establishments, is the home of the
Nissan plant in Smyrna. The Knoxville MSA
follows behind Nashville-Davidson with 13
percent of supplier establishments and 14 percent
of the jobs. The greatest number of supplier
plants seem to be located in or near areas with
major interstates or highways, providing easy
access to the automobile assembly plants.
Tables 17 and 18 list Nissan suppliers by state
and county, respectively in Tennessee. Tennessee
contains the largest number of Nissan suppliers
with 41. It is followed by Michigan with 26 and
Ohio with 15 establishments. Indiana, Illinois and
Kentucky each contain 8 supplier firms. As
shown in Table 18, Rutherford county contains
the largest number of establishments with 6
companies. Davidson, Lawrence, Robertson and
Sumner follow next with 3 firms each. All of
these counties, with the exception of Lawrence,
are located in the Nashville-Davidson MSA.
Table 19 shows the distribution of Tier 1
supplier establishments and employment by
county for Tennessee from The Elm Guide: North
American Supplier Database. Nashville-Davidson
MSA remains the leader with 22.8 percent of the
establishments and 17.2 percent of the jobs in
Tennessee. Sumner County has the greatest
number of establishments. Its 11 companies
account for 7.4 percent of the total number of
establishments. Rutherford County has 2,871 jobs
in 7 establishments. The Knoxville MSA follows
Nashville-Davidson with 11 percent of the
establishments and 10 percent of the jobs. Blount
County emerges with the largest number of
employees in the state with 3,632 jobs in 9
establishments. This accounts for approximately
7.0 percent of the total supplier employment in
Tennessee. Maury County, home of Saturn, only
represents 1.0 percent of the establishments and
0.2 percent of employment in the Elm database.
Finally, Table 20 shows the number of
suppliers by county using the State Department of
Economic and Community Development’s 1998
Automotive Suppliers Directory. This source
reports a total of 662 suppliers in Tennessee.
Shelby County is the leader, with 56
establishments, followed by Davidson County (44
firms) and Rutherford County (41 firms). Maury
County is home to only 9 supplier establishments.

30
Table 17: Nissan Suppliers by State
State Number of Suppliers
California 2
Connecticut 4
Georgia 2
Illinois 8
Indiana 8
Kentucky 8
Michigan 26
Minnesota 1
New York 1
North Carolina 2
Ohio 15
Pennsylvania 3
South Carolina 2
Tennessee 41
Texas 2
Vermont 1
Virginia 1
Wisconsin 4
Total 131
Source: Tennessee Department of Economic andCommunity Development.
Table 18: Nissan Suppliers in Tennessee: byCounty
County Number of Suppliers
Bedford 1
Carroll 2
Davidson 3
Franklin 1
Giles 1
Hawkins 1
Henderson 1
Henry 1
Lawrence 3
Loudon 1
Marshall 2
Mc Minn 2
Monroe 1
Overton 2
Perry 1
Putnam 2
Robertson 3
Rutherford 6
Sullivan 1
Sumner 3
Warren 1
Williamson 1
Wilson 1
Total 41
Source: Tennessee Department of Economic andCommunity Development.
Together the supplier data tell a consistent
story regarding location patterns. Generally the
suppliers are concentrated in the vicinity of
assembly plants, in or near the state’s larger
metropolitan areas, and in proximity to a large
labor pool and transportation infrastructure. They
provide a strong complement to the region’s
automobile assembly facilities and lead to sharp
increases in state and local tax bases.
VII. CONCLUSION
The automotive industry took its time moving to
the Southeast. But now that it is here it is
reshaping the region’s manufacturing base,
providing new capital investment that embodies
state-of-art technology and production techniques,
and new modes of management. The jobs created
in the automotive industry tell the story quite
clearly, paying wages in Tennessee that are 40
percent above the average for the state’s
manufacturing industry.
The automotive industry is more than simply
automobile assembly. The region also is a national
leader in heavy truck production, and supports

31
Table 19: Number of Auto SupplierCompanies and Employment
by County, 1997Companies Employment
County Number Percent Number Percent
Anderson 3 2.0 700 1.4Bedford 3 2.0 790 1.5Benton -- -- -- --Bledsoe 2 1.3 402 0.8Blount 9 6.0 3,632 7.0
Bradley 1 0.7 582 1.1Campbell -- -- -- --Cannon -- -- -- --Carroll 2 1.3 325 0.6Carter 2 1.3 1,035 2.0
Cheatham -- -- -- --Chester -- -- -- --Claiborne -- -- -- --Clay 1 0.7 90 0.2Cocke 1 0.7 250 0.5
Coffee 1 0.7 550 1.1Crockett -- -- -- --Cumberland 2 1.3 450 0.9Davidson 2 1.3 360 0.7Decatur -- -- -- --
DeKalb 3 2.0 1,255 2.4Dickson 2 1.3 770 1.5Dyer 2 1.3 575 1.1Fayette -- -- -- --Fentress -- -- -- --
Franklin 2 1.3 633 1.2Gibson 4 2.7 1,350 2.6Giles 4 2.7 1,208 2.3Grainger -- -- -- --Greene 7 4.7 2,027 3.9
Grundy -- -- -- --Hamblen 5 3.4 2,530 4.9Hamilton 1 0.7 1,600 3.1Hancock -- -- -- --Hardeman -- -- -- --
Hardin -- -- -- --Hawkins 4 2.7 1,850 3.6Haywood -- -- -- --Henderson 2 1.3 1,286 2.5Henry 3 2.0 385 0.7
Hickman -- -- -- --Houston -- -- -- --Humphreys -- -- -- --Jackson 1 0.7 300 0.6Jefferson -- -- -- --
Johnson -- -- -- --Knox 1 0.7 200 0.4Lake -- -- -- --Lauderdale 3 2.0 820 1.6Lawrence 3 2.0 1,561 3.0
Table 19 (Continued)Companies Employment
County Number Percent Number Percent
Lewis -- -- -- --Lincoln -- -- -- --Loudon -- -- -- --McMinn 4 2.7 1,463 2.8McNairy -- -- -- --
Macon 1 0.7 168 0.3Madison 3 2.0 868 1.7Marion -- -- -- --Marshall 3 2.0 1,280 2.5Maury 1 0.7 94 0.2
Meigs -- -- -- --Monroe 2 1.3 910 1.8Montgomery 2 1.3 350 0.7Moore -- -- -- --Morgan -- -- -- --
Obion 1 0.7 3,000 5.8Overton 3 2.0 571 1.1Perry 2 1.3 1,225 2.4Pickett -- -- -- --Polk -- -- -- --
Putnam 3 2.0 1,037 2.0Rhea 1 0.7 220 0.4Roane -- -- -- --Robertson 3 2.0 704 1.4Rutherford 7 4.7 2,871 5.5
Scott 1 0.7 196 0.4Sequatchie -- -- -- --Sevier 3 2.0 630 1.2Shelby 3 2.0 442 0.9Smith 5 3.4 944 1.8
Stewart -- -- -- --Sullivan 1 0.7 500 1.0Sumner 11 7.4 1,693 3.3Tipton -- -- -- --Trousdale -- -- -- --
Unicoi -- -- -- --Union -- -- -- --Van Buren 1 0.7 450 0.9Warren 2 1.3 1,150 2.2Washington -- -- -- --
Wayne -- -- -- --Weakley -- -- -- --White 3 2.0 1,342 2.6Williamson 1 0.7 100 0.2Wilson 6 4.0 2,084 4.0
TENNESSEE 149 100.0 51,808 100.0
Note: Percent is percent of Tennessee total.
Source: ELM International, Inc., 1998.
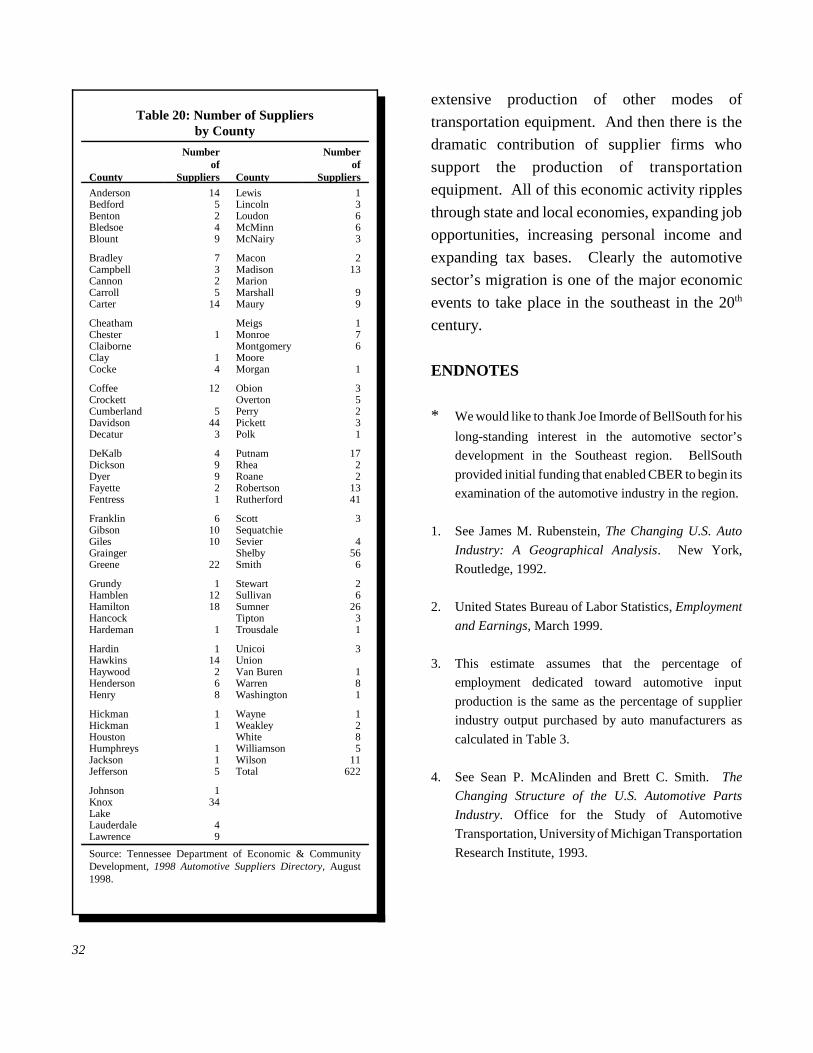
32
Table 20: Number of Suppliersby County
County
Numberof
Suppliers County
Numberof
Suppliers
Anderson 14 Lewis 1Bedford 5 Lincoln 3Benton 2 Loudon 6Bledsoe 4 McMinn 6Blount 9 McNairy 3
Bradley 7 Macon 2Campbell 3 Madison 13Cannon 2 MarionCarroll 5 Marshall 9Carter 14 Maury 9
Cheatham Meigs 1Chester 1 Monroe 7Claiborne Montgomery 6Clay 1 MooreCocke 4 Morgan 1
Coffee 12 Obion 3Crockett Overton 5Cumberland 5 Perry 2Davidson 44 Pickett 3Decatur 3 Polk 1
DeKalb 4 Putnam 17Dickson 9 Rhea 2Dyer 9 Roane 2Fayette 2 Robertson 13Fentress 1 Rutherford 41
Franklin 6 Scott 3Gibson 10 SequatchieGiles 10 Sevier 4Grainger Shelby 56Greene 22 Smith 6
Grundy 1 Stewart 2Hamblen 12 Sullivan 6Hamilton 18 Sumner 26Hancock Tipton 3Hardeman 1 Trousdale 1
Hardin 1 Unicoi 3Hawkins 14 UnionHaywood 2 Van Buren 1Henderson 6 Warren 8Henry 8 Washington 1
Hickman 1 Wayne 1Hickman 1 Weakley 2Houston White 8Humphreys 1 Williamson 5Jackson 1 Wilson 11Jefferson 5 Total 622
Johnson 1Knox 34LakeLauderdale 4Lawrence 9
Source: Tennessee Department of Economic & CommunityDevelopment, 1998 Automotive Suppliers Directory, August1998.
extensive production of other modes of
transportation equipment. And then there is the
dramatic contribution of supplier firms who
support the production of transportation
equipment. All of this economic activity ripples
through state and local economies, expanding job
opportunities, increasing personal income and
expanding tax bases. Clearly the automotive
sector’s migration is one of the major economic
events to take place in the southeast in the 20th
century.
ENDNOTES
* We would like to thank Joe Imorde of BellSouth for his
long-standing interest in the automotive sector’s
development in the Southeast region. BellSouth
provided initial funding that enabled CBER to begin its
examination of the automotive industry in the region.
1. See James M. Rubenstein, The Changing U.S. Auto
Industry: A Geographical Analysis. New York,
Routledge, 1992.
2. United States Bureau of Labor Statistics, Employment
and Earnings, March 1999.
3. This estimate assumes that the percentage of
employment dedicated toward automotive input
production is the same as the percentage of supplier
industry output purchased by auto manufacturers as
calculated in Table 3.
4. See Sean P. McAlinden and Brett C. Smith. The
Changing Structure of the U.S. Automotive Parts
Industry. Office for the Study of Automotive
Transportation, University of Michigan Transportation
Research Institute, 1993.

33
5. Calculated from data given in Survey of Current
Business, U.S. Department of Commerce, Bureau of
Economic Analysis, October 1998.
6. For a detailed discussion of this issue, see The
Contribution of the International Auto Sector to the
U.S. Economy, Transportation Research Institute, the
Office for the Study of Automotive Transportation and
The Institute of Labor and Industrial Relations,
University of Michigan, March 1998.
7. Note that these data do not represent a comprehensive
count of motor vehicle and parts manufacturing
facilities in the U. S. since they only include Motor
Vehicle Manufacturers’ Association member and large
non-member establishments. Thus, the magnitude of
the facility and employment counts is likely to be
understated. Still, the calculated shares of facilities and
jobs and the changes in these shares should be a fair
reflection of the actual shift in automotive
manufacturing activity among the states.
8. This dataset was provided by the Tennessee Valley
Authority so its geographic coverage is limited to states
having territory in the TVA region.
9. To limit this risk automotive supplier firms were
selected from the DBR listing using a two-part
screening procedure. First, the establishment records
were screened by SIC code to select out plants in
certain industries likely to sell a considerable portion of
their output to auto manufacturers or other auto
suppliers. The SIC codes used for this first screen
were selected by utilizing information contained in
input-output tables for the United States, which allows
rough calculation of the percentage of output sold to
the automobile industry from a given supplier industry.
A partial listing of the supplier industries is given
above in Table 1. In addition, although the input-
output tables include purchases by the auto industry
from non-manufacturing firms (e. g. wholesalers,
business service providers, etc.) the identification
procedure was limited to firms within manufacturing in
order to more precisely focus on industries likely to
produce a substantial amount of their output for the
auto industry. Wholesaling and service activities are
less apt to be dependent on auto plants for their
profitability. After this initial industry level screen, the
product information for each record was reviewed to
eliminate obvious cases where a non-automotive
supplier firm remained in the database. For example,
several manufacturers of office, church and
institutional furniture were eliminated from SIC 2531
(Public Building and Related Furniture) which also
includes firms that manufacture automobile seats.
Some aircraft seat manufacturers were also eliminated
from this industry category. Combined, these two
screens eliminated 2,696 records from the original
TVA database leaving behind a fairly concisely defined
group of automobile supplier firms.
10. This percentage excludes firms in SIC 3542 since data
on the percent of their output to the auto industry were
not given in the JASID.
11. Appalachian Council of Governments, Spartanburg
County Economic Activity Report and Greenville
County Economic Activity Report.
APPENDIX

34
Appendix Table 1: Car Assembly Plants in the U.S., Canada and Mexico, Models, Production, Capacity, and Utilization, 1997 Model Year
Company City State Models Production Capacity %Utilized
Chrysler Belvidere IL Dodge NeonChrysler NeonPlymouth Neon
211,487 266,560 79.3
Bramalea Ontario Chrysler ConcordeChrysler LHS*Chrysler 300M*Dodge Intrepid
204,131 216,320 94.4
Detroit MI Dodge ViperPlymouth Prowler
2,253 7,616 29.6
Sterling Hts MI Chrysler CirrusDodge StratusPlymouth Breeze
226,977 258,944 87.7
Toluca Mexico Chrysler StratusChrysler Sebring convertibleDodge/Plymouth Neon
133,292 167,552 79.6
Total Chrysler 778,140 916,992 84. 9
Ford Atlanta GA Ford TaurusMercury Sable
248,124 247,520 100.2
Chicago IL Ford TaurusMercury Sable
247,610 247,520 100.0
Cuautitlan Mexico Ford ContourMercury Mystique
44,444 114,240 38.9
Dearborn MI Ford Mustang 119,196 186,592 63.9
Hermosillo Mexico Escort Tracer
126,941 152,320 83.3
Kansas City MO Ford ContourMercury Mystique
179,830 239,904 75.0
Lorain OH Ford ThunderbirdMercury Cougar
71,092 141,440 50.3
St. Thomas Ontario Ford Crown VictoriaMercury Grand Marquis
228,616 227,520 100.5
Wayne MI Ford Escort 277,454 285,600 97.1
Wixom MI Lincoln ContinentalLincoln Mark VIIILincoln Town CarLincoln LS6 (winter 98)*Lincoln LS8 (winter 98)*
146,482 198,016 74.0
Total Ford 1,689,789 2,040,672 82.8
GM BowlingGreen
KY Chevrolet Corvette 24,673 24,752 99.7
Flint (BuickCity)
MI Buick LeSabrePontiac Bonneville
205,924 227,792 90.4
Detroit-Hamtramck
MI Cadillac DeVille/ConcoursCadillac EldoradoCadillac Seville
170,998 228,480 74.8

35
Appendix Table 1 (Continued)
Company City State Models Production Capacity % Utilized
Fairfax KS Pontiac Grand PrixOldsmobile Intrigue
239,030 208,800 114.5
Lansing (M plant) MI Oldsmobile Alero*Pontiac Grand Am*
185,001 228,480 81.0
Lansing ( C plant) MI Pontiac Grand Am* 228,387 228,480 100.0
Lansing (Genassy) MI Chevrolet CavalierconvertiblePontiac Sunfire convertible
16,001 19,040 84.0
Lansing (LansingCraft Center)
MI EV1 374 3,760 9.9
Lordstown OH Chevrolet CavalierToyota Cavalier**Pontiac Sunfire
371,577 388,960 95.5
Oklahoma City OK Chevrolet MalibuOldsmobile Cutlass
174,632 247,520 70.6
Orion Township MI Buick Park AvenueBuick RivieraOldsmobile AuroraOldsmobile Eighty EightPontiac Bonneville
207,321 228,480 90.7
Oshawa (No. 1) Ontario Chevrolet LuminaChevrolet Monte Carlo
257,085 242,688 105.9
Oshawa (No. 2) Ontario Buick RegalBuick CenturyChevrolet Lumina
243,331 246,480 98.7
Ramos Arizpe Mexico Chevrolet CavalierChevrolet Joy/SwingPontiac Sunfire
158,110 152,320 103.8
Ste. Therese Quebec Chevrolet CamaroPontiac Firebird
90,397 190,548 47.4
Spring Hill TN Saturn coupe, sedan & wagon 271,471 288,200 94.2
Wilmington DE Chevrolet Malibu 98,817 206,964 47.7
Total GM 2,943,129 3,361,744 87.5
Auto Alliance Flat Rock MI Mazda 626Mercury Cougar
100,648 189,652 53.1
BMW Spartanburg SC BMW Z3BMW M5 coupe
62,943 72,352 87.0
CAMI Ingersoll Ontario Chevrolet MetroSuzuki Swift
71,744 116,560 61.6
Honda Alliston Ontario Acura ELHonda Civic
165,040 152,320 108.4

36
Appendix Table 1 (Continued)Company City State Models Production Capacity % Utilized
East Liberty OH Acura CLHonda Civic
232,680 220,864 105.3
Marysville OH Acura TL (fall 98)*Honda Accord
415,588 383,040 108.5
Total Honda 813,308 756,224 107.5
Mitsubishi MotorManufacturing
Normal IL Chrysler Sebring coupeDodge AvengerMitsubishi Eclipse coupe &convertibleMitsubishi Galant
189,086 239,904 78.8
Nissan Smyrna(Line1)
TN Nissan 200SXNissan AltimaNissan Sentra
115,576 129,472 89.3
Smyrna (Line2)
TN 163,934 201,824 81.2
Aguascalientes andCuernavaca
Mexico Nissan Tsuru (Sentra)Nissan Tsubame wagonNissan Lucino (200SX)
129,686 247,520 52.4
Total Nissan 409,196 578,816 70.7
NUMMI Fremont CA Chevrolet PrizmToyota Corolla
209,829 219,360 95.7
Subaru-Isuzu Lafayette IN Subaru Legacy 102,180 99,008 103.2
Toyota Cambridge Ontario Toyota CorollaToyota Solara (fall 98)*
108,952 108,439 100.5
Georgetown(Line 1)
KY Toyota Camry 258,713 198,016 130.7
Georgetown(Line 2)
KY Toyota Avalon 146,260 209,440 69.8
Total Toyota 513,925 515,895 99.6
Volkswagen Puebla Mexico Volkswagen BeetleVolkswagen New BeetleVolkswagen GolfVolkswagen JettaVolkswagen Cabrio
257,366 289,408 88. 9
Volvo Halifax NovaScotia
Volvo 70 Series 6,524 9,480 68.8
Total Big Three 5,411,058 6,319,408 87.6
Total Transplant 2,736,749 3,086,659 88.7
Total Car 8,147,807 9,406,067 86.6
Source: Crain Communications, Automotive News 1998 Market Data Book, May 27, 1998.
*1999 model**For export only
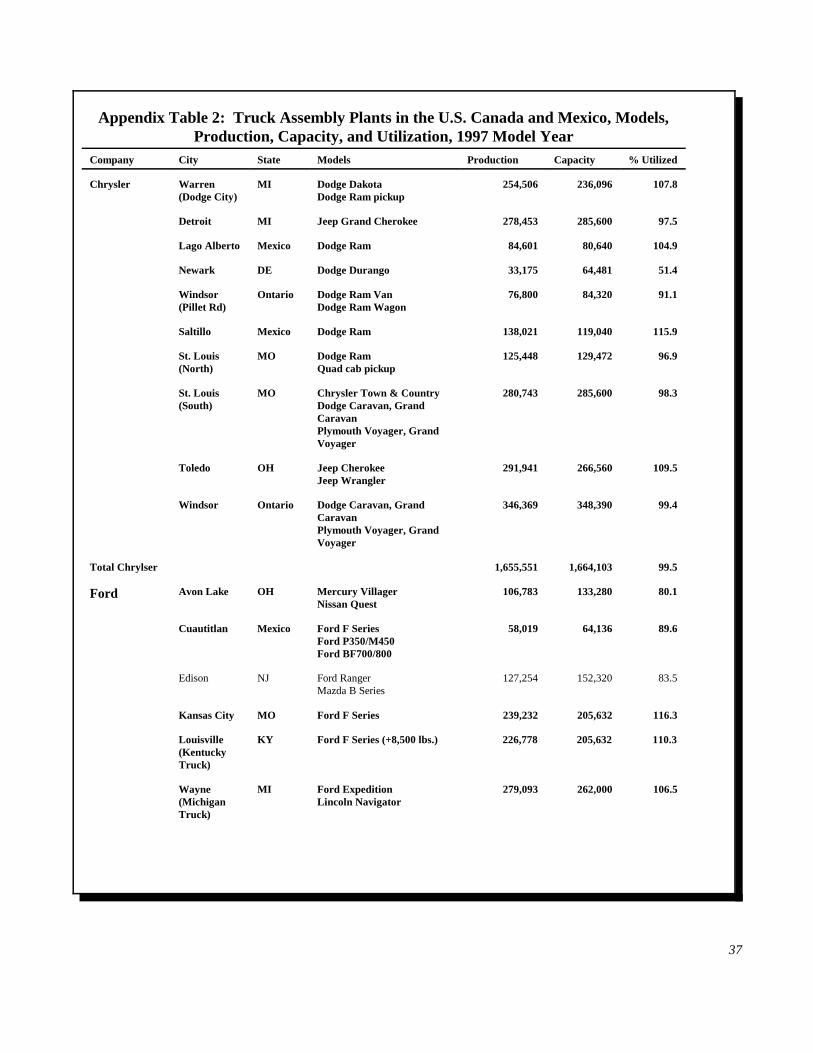
37
Appendix Table 2: Truck Assembly Plants in the U.S. Canada and Mexico, Models,Production, Capacity, and Utilization, 1997 Model Year
Company City State Models Production Capacity % Utilized
Chrysler Warren(Dodge City)
MI Dodge DakotaDodge Ram pickup
254,506 236,096 107.8
Detroit MI Jeep Grand Cherokee 278,453 285,600 97.5
Lago Alberto Mexico Dodge Ram 84,601 80,640 104.9
Newark DE Dodge Durango 33,175 64,481 51.4
Windsor(Pillet Rd)
Ontario Dodge Ram VanDodge Ram Wagon
76,800 84,320 91.1
Saltillo Mexico Dodge Ram 138,021 119,040 115.9
St. Louis(North)
MO Dodge RamQuad cab pickup
125,448 129,472 96.9
St. Louis(South)
MO Chrysler Town & CountryDodge Caravan, GrandCaravanPlymouth Voyager, GrandVoyager
280,743 285,600 98.3
Toledo OH Jeep CherokeeJeep Wrangler
291,941 266,560 109.5
Windsor Ontario Dodge Caravan, GrandCaravanPlymouth Voyager, GrandVoyager
346,369 348,390 99.4
Total Chrylser 1,655,551 1,664,103 99.5
Ford Avon Lake OH Mercury VillagerNissan Quest
106,783 133,280 80.1
Cuautitlan Mexico Ford F SeriesFord P350/M450Ford BF700/800
58,019 64,136 89.6
Edison NJ Ford RangerMazda B Series
127,254 152,320 83.5
Kansas City MO Ford F Series 239,232 205,632 116.3
Louisville(KentuckyTruck)
KY Ford F Series (+8,500 lbs.) 226,778 205,632 110.3
Wayne(MichiganTruck)
MI Ford ExpeditionLincoln Navigator
279,093 262,000 106.5

38
Appendix Table 2 (Continued)Company City State Models Production Capacity % Utilized
Norfolk VA Ford F Series 233,600 205,632 113.6
Oakville Ontario Ford WindstarFord F Series
292,687 276,816 105.7
Oakville(OntarioTruck)
Ontario Ford F Series 109,526 142,200 77.0
St. Louis MO Ford Explorer 228,501 190,400 120.0
St Paul(Twin Cities)
MN Ford Ranger 164,826 171,360 96.2
Total Ford 2,642,749 2,574,544 102.6
GM Arlington TX Cadillac Escalade (‘99model)Chevrolet Silverado*Chevrolet C/K heavy duty*Chevrolet Tahoe*GMC Sierra*GMC Sierra heavy duty*GMC Yukon*
43,362 55,200 78.6
Baltimore MD Chevrolet AstroGMC Safari
170,804 190,400 89.7
Detroit MI Chevrolet P modelGMC P model
22,904 34,272 66.8
Doraville GA Chevrolet VentureOldsmobile SilhouetteOpel/Vauxhall SintraPontiac Trans Sport
252,673 239,904 105.3
Flint MI Chevrolet Silverado crewcab*GMC Sierra crew cab*
71,093 66,640 106.7
Janesville(lines 1 & 2)
WI Line 1:Chevrolet Tahoe*Chevrolet Suburban*GMC Yukon*GMC Suburban*Line 2:Chevrolet KodiakGMC Topkick
241,393 201,824 119.6
Linden NJ Chevrolet BlazerChevrolet S10 pickupGMC JimmyGMC Sonoma
178,530 190,400 93.8
Moraine OH Chevrolet BlazerGMC JimmyOldsmobile Bravada
294,214 257,040 114.5
Oshawa Ontario Chevrolet Silverado*GMC Sierra*
304,161 265,440 114.6
Pontiac(East)
MI Chevrolet Silverado*GMC Sierra*
215,212 285,600 75.4
Shreveport LA Chevrolet S10 pickupGMC SonomaIsuzu Hombre
149,324 199,692 74.8
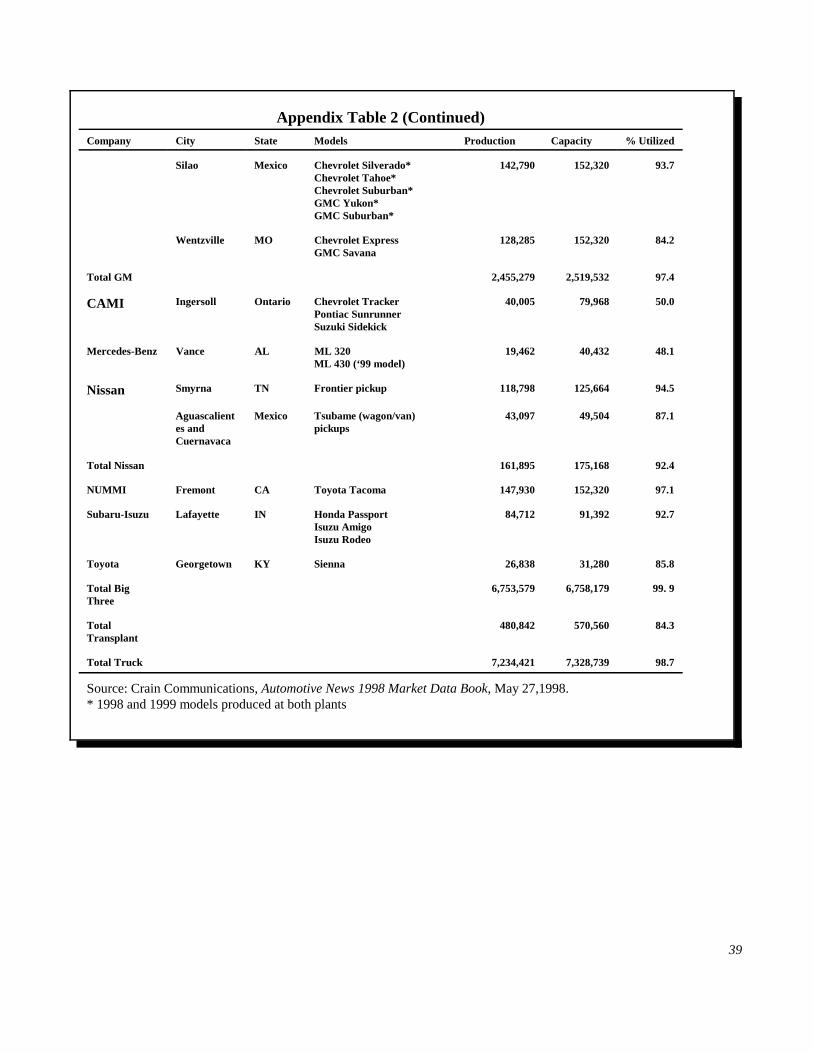
39
Appendix Table 2 (Continued)Company City State Models Production Capacity % Utilized
Silao Mexico Chevrolet Silverado*Chevrolet Tahoe*Chevrolet Suburban*GMC Yukon*GMC Suburban*
142,790 152,320 93.7
Wentzville MO Chevrolet ExpressGMC Savana
128,285 152,320 84.2
Total GM 2,455,279 2,519,532 97.4
CAMI Ingersoll Ontario Chevrolet TrackerPontiac SunrunnerSuzuki Sidekick
40,005 79,968 50.0
Mercedes-Benz Vance AL ML 320ML 430 (‘99 model)
19,462 40,432 48.1
Nissan Smyrna TN Frontier pickup 118,798 125,664 94.5
Aguascalientes andCuernavaca
Mexico Tsubame (wagon/van)pickups
43,097 49,504 87.1
Total Nissan 161,895 175,168 92.4
NUMMI Fremont CA Toyota Tacoma 147,930 152,320 97.1
Subaru-Isuzu Lafayette IN Honda PassportIsuzu AmigoIsuzu Rodeo
84,712 91,392 92.7
Toyota Georgetown KY Sienna 26,838 31,280 85.8
Total BigThree
6,753,579 6,758,179 99. 9
TotalTransplant
480,842 570,560 84.3
Total Truck 7,234,421 7,328,739 98.7
Source: Crain Communications, Automotive News 1998 Market Data Book, May 27,1998.* 1998 and 1999 models produced at both plants

40
Appendix Table 3: Number of Suppliers in Tennessee by SIC
SIC Number of Suppliers
2211 Broadwoven Fabric Mills, Cotton 2
2241 Narrow Fabric and Other Smallwares Mills: Cotton, Wool, Silk, and Manmade Fiber 2
2258 Lace and Wrap Knit Fabric Mills 1
2269 Finishers of Textiles, nec 1
2273 Carpets and Rugs 2
2296 Tire Cord and Fabrics 3
2297 Nonwoven Fabrics 1
2299 Textile Goods, nec 1
2393 Textile Bags 1
2394 Canvas and Related Products 3
2396 Automotive Trimmings, Apparel Findings, and Related Products 1
2399 Fabricated Textile Products, nec 5
2441 Nailed and Lock Corner Wood Boxes and Shook 2
2448 Wood Pallets and Skids 3
2449 Wood Containers, nec 1
2542 Office and Store Fixtures, Shelving, Lockers 2
2621 Paper Mills 1
2631 Paperboard Mills 1
2653 Corrugated and Solid Fiber Boxes 11
2657 Folding Paperboard Boxes including Sanitary 1
2672 Coated and Laminated Paper, nec 2
2674 Uncoated Paper and Multiwall Bags 1
2675 Die-Cut Paper and Paperboard and Cardboard 2
2721 Periodicals: Publishing or Publishing and Printing 1
2731 Books: Publishing or Publishing and Printing 1
2752 Commercial Printing, Lithographic 4
2759 Commercial Printing, nec 3
2761 Manifold Business Forms 1
2812 Alkalies and Chlorine 1
2819 Industrial Inorganic Chemicals, nec 3
2821 Plastic Materials, Synthetic Resins, and Nonvulcanized Elastomers 7
2822 Synthetic Rubber (Vulcanized Elastomers) 8
2841 Soap and Other Detergents, Except Specialty Cleaners 2
2842 Specialty Cleaning, Polishing, and Sanitation Prepartations 4
2843 Surface Active Agents, Finishing Agents, Sulfonated Oils and Assistants 1
2851 Paints, Varnishes, Lacquers, Enamels, and Allied Products 5
2869 Industrial Organic Chemicals, nec 7

41
Appendix Table 3 (Continued)
SIC Number of Suppliers
2891 Adhesives and Sealants 3
2899 Chemical and Chemical Preparations, nec 1
2911 Petroleum Refining 1
2992 Lubricating Oils and Greases 4
3011 Tires and Inner Tubes 9
3052 Rubber and Plastics Hose and Belting 6
3053 Gaskets, Packing, and Sealing Devices 9
3061 Molded, Extruded, and Lathe-Cut Mechanical Rubber Goods 2
3069 Fabricated Rubber Products, nec 24
3081 Unsupported Plastics Film and Sheet 1
3082 Unsupported Plastics Profile Shapes 1
3086 Plastics Foam Products 9
3087 Custom Compounding of Purchased Plastic Resins 1
3089 Plastics Products, nec 56
3211 Flat Glass 2
3229 Pressed and Brown Glass and Glassware, nec 2
3231 Glass Products, Made of Purchased Glass 4
3264 Porcelain Electrical Supplies 1
3291 Abrasive Products 2
3292 Asbestos Products 1
3295 Minerals and Earths, Ground or Otherwise Treated 1
3296 Mineral Wool 1
3312 Steel Works, Blast Furnaces (including Coke Ovens), and Rolling Mills 9
3315 Steel Wiredrawing, Steel Nails, and Spikes 6
3316 Cold-Rolled Steel Sheet, Strip, and Bars 9
3317 Steel Pipe and Tubes 4
3321 Gray and Ductile Iron Foundries 3
3325 Steel Foundries, nec 1
3334 Primary Production of Aluminum 1
3341 Secondary Smelting and Refining of Nonferrous Metals 2
3353 Aluminum Sheet, Plated, and Foil 3
3356 Rolling, Drawing and Extruding of Nonferrous Metals, Except Copper and Aluminum 2
3357 Drawing and Insulating of Nonferrous Wire 2
3363 Aluminum Die-Castings 5
3364 Nonferrous Die-Castings, Except Aluminum 3
3365 Aluminum Foundries 4
3366 Copper Foundries 1
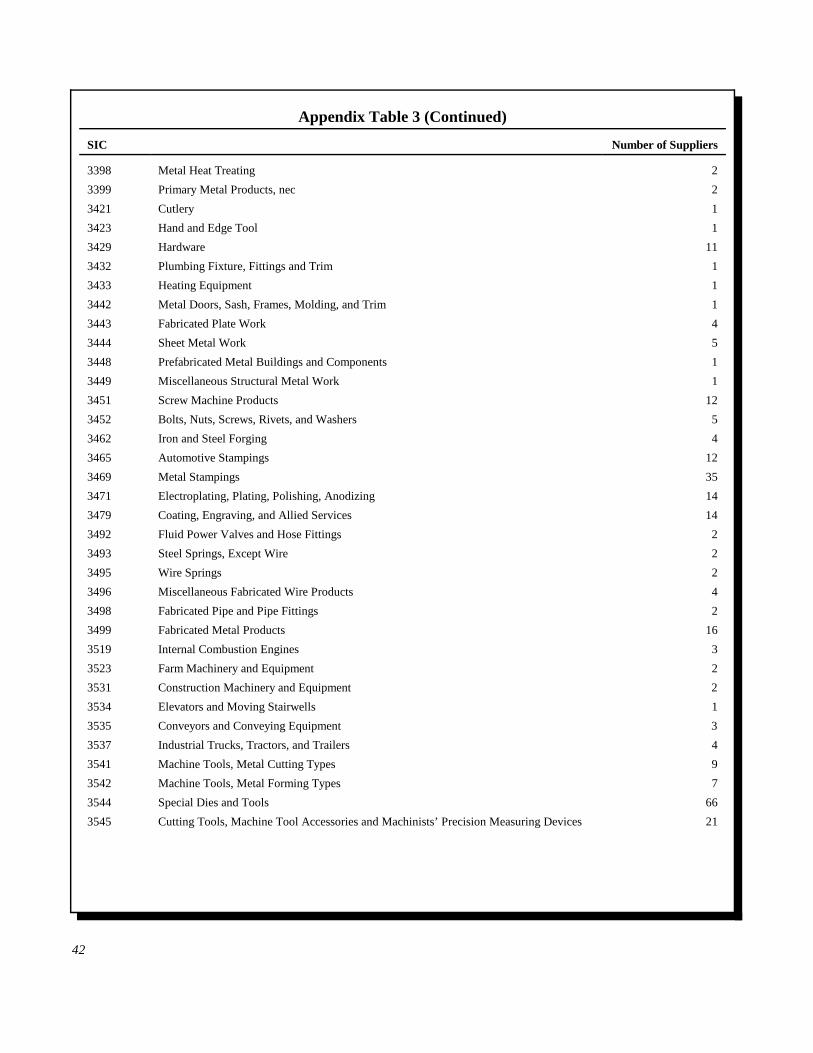
42
Appendix Table 3 (Continued)
SIC Number of Suppliers
3398 Metal Heat Treating 2
3399 Primary Metal Products, nec 2
3421 Cutlery 1
3423 Hand and Edge Tool 1
3429 Hardware 11
3432 Plumbing Fixture, Fittings and Trim 1
3433 Heating Equipment 1
3442 Metal Doors, Sash, Frames, Molding, and Trim 1
3443 Fabricated Plate Work 4
3444 Sheet Metal Work 5
3448 Prefabricated Metal Buildings and Components 1
3449 Miscellaneous Structural Metal Work 1
3451 Screw Machine Products 12
3452 Bolts, Nuts, Screws, Rivets, and Washers 5
3462 Iron and Steel Forging 4
3465 Automotive Stampings 12
3469 Metal Stampings 35
3471 Electroplating, Plating, Polishing, Anodizing 14
3479 Coating, Engraving, and Allied Services 14
3492 Fluid Power Valves and Hose Fittings 2
3493 Steel Springs, Except Wire 2
3495 Wire Springs 2
3496 Miscellaneous Fabricated Wire Products 4
3498 Fabricated Pipe and Pipe Fittings 2
3499 Fabricated Metal Products 16
3519 Internal Combustion Engines 3
3523 Farm Machinery and Equipment 2
3531 Construction Machinery and Equipment 2
3534 Elevators and Moving Stairwells 1
3535 Conveyors and Conveying Equipment 3
3537 Industrial Trucks, Tractors, and Trailers 4
3541 Machine Tools, Metal Cutting Types 9
3542 Machine Tools, Metal Forming Types 7
3544 Special Dies and Tools 66
3545 Cutting Tools, Machine Tool Accessories and Machinists’ Precision Measuring Devices 21
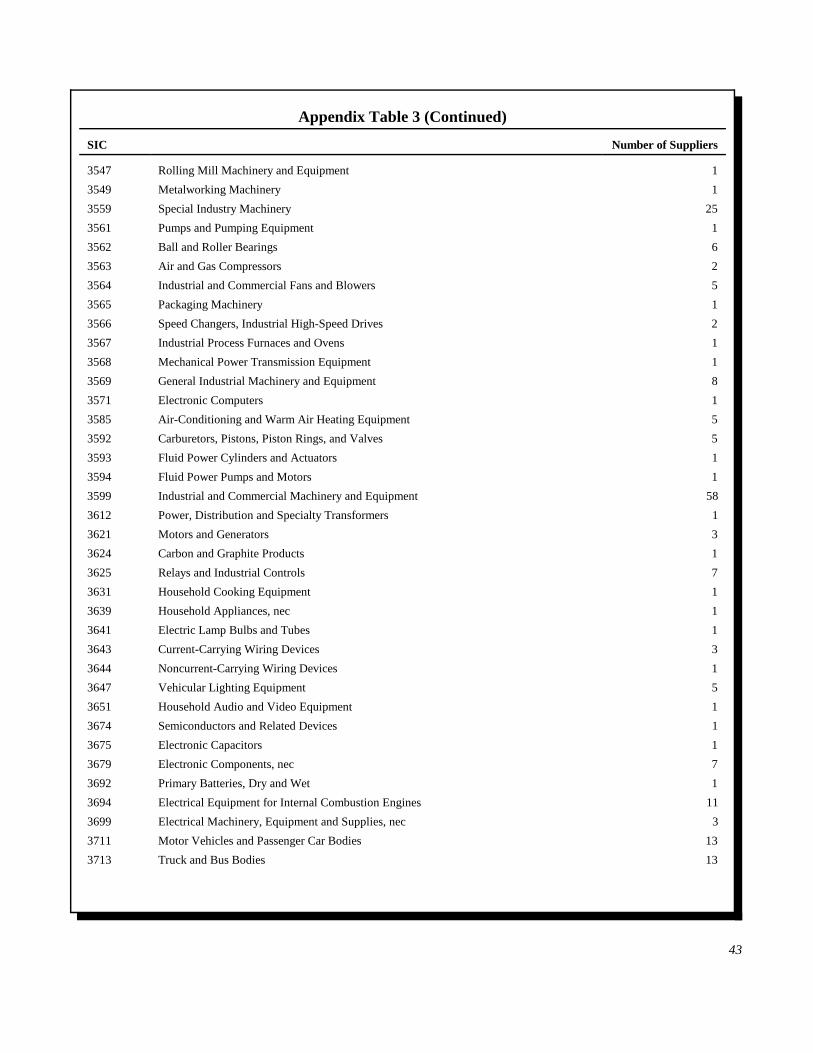
43
Appendix Table 3 (Continued)
SIC Number of Suppliers
3547 Rolling Mill Machinery and Equipment 1
3549 Metalworking Machinery 1
3559 Special Industry Machinery 25
3561 Pumps and Pumping Equipment 1
3562 Ball and Roller Bearings 6
3563 Air and Gas Compressors 2
3564 Industrial and Commercial Fans and Blowers 5
3565 Packaging Machinery 1
3566 Speed Changers, Industrial High-Speed Drives 2
3567 Industrial Process Furnaces and Ovens 1
3568 Mechanical Power Transmission Equipment 1
3569 General Industrial Machinery and Equipment 8
3571 Electronic Computers 1
3585 Air-Conditioning and Warm Air Heating Equipment 5
3592 Carburetors, Pistons, Piston Rings, and Valves 5
3593 Fluid Power Cylinders and Actuators 1
3594 Fluid Power Pumps and Motors 1
3599 Industrial and Commercial Machinery and Equipment 58
3612 Power, Distribution and Specialty Transformers 1
3621 Motors and Generators 3
3624 Carbon and Graphite Products 1
3625 Relays and Industrial Controls 7
3631 Household Cooking Equipment 1
3639 Household Appliances, nec 1
3641 Electric Lamp Bulbs and Tubes 1
3643 Current-Carrying Wiring Devices 3
3644 Noncurrent-Carrying Wiring Devices 1
3647 Vehicular Lighting Equipment 5
3651 Household Audio and Video Equipment 1
3674 Semiconductors and Related Devices 1
3675 Electronic Capacitors 1
3679 Electronic Components, nec 7
3692 Primary Batteries, Dry and Wet 1
3694 Electrical Equipment for Internal Combustion Engines 11
3699 Electrical Machinery, Equipment and Supplies, nec 3
3711 Motor Vehicles and Passenger Car Bodies 13
3713 Truck and Bus Bodies 13
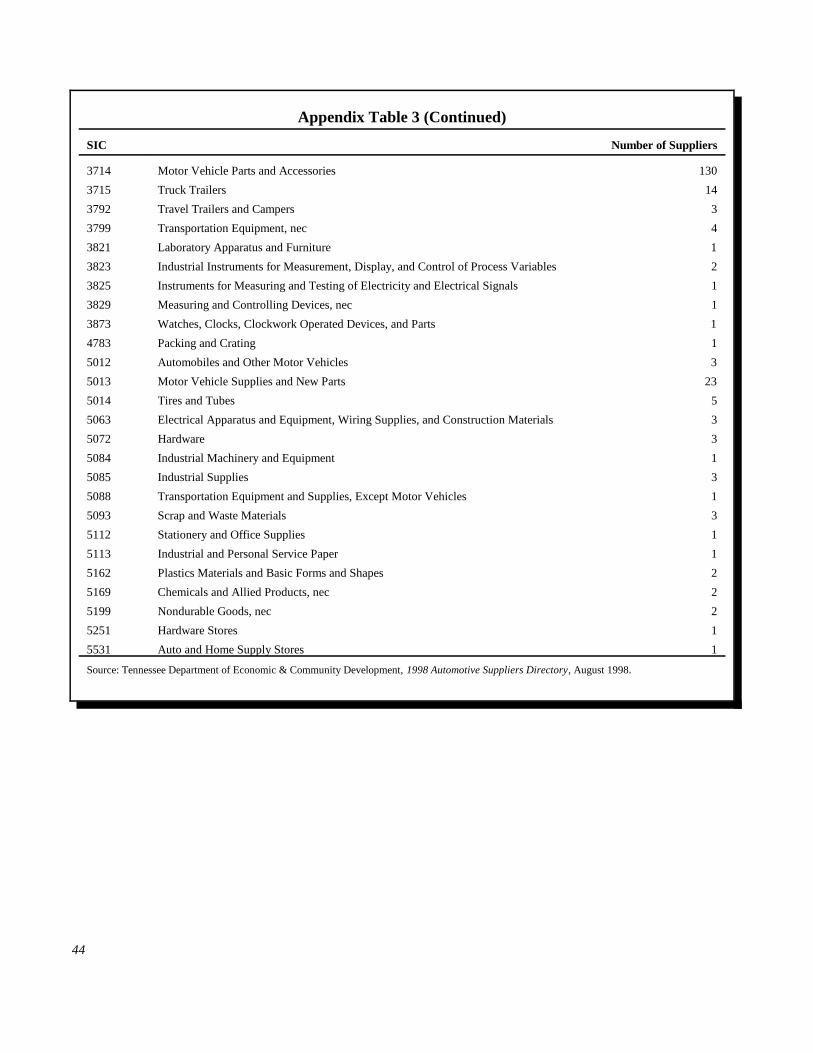
44
Appendix Table 3 (Continued)
SIC Number of Suppliers
3714 Motor Vehicle Parts and Accessories 130
3715 Truck Trailers 14
3792 Travel Trailers and Campers 3
3799 Transportation Equipment, nec 4
3821 Laboratory Apparatus and Furniture 1
3823 Industrial Instruments for Measurement, Display, and Control of Process Variables 2
3825 Instruments for Measuring and Testing of Electricity and Electrical Signals 1
3829 Measuring and Controlling Devices, nec 1
3873 Watches, Clocks, Clockwork Operated Devices, and Parts 1
4783 Packing and Crating 1
5012 Automobiles and Other Motor Vehicles 3
5013 Motor Vehicle Supplies and New Parts 23
5014 Tires and Tubes 5
5063 Electrical Apparatus and Equipment, Wiring Supplies, and Construction Materials 3
5072 Hardware 3
5084 Industrial Machinery and Equipment 1
5085 Industrial Supplies 3
5088 Transportation Equipment and Supplies, Except Motor Vehicles 1
5093 Scrap and Waste Materials 3
5112 Stationery and Office Supplies 1
5113 Industrial and Personal Service Paper 1
5162 Plastics Materials and Basic Forms and Shapes 2
5169 Chemicals and Allied Products, nec 2
5199 Nondurable Goods, nec 2
5251 Hardware Stores 1
5531 Auto and Home Supply Stores 1
Source: Tennessee Department of Economic & Community Development, 1998 Automotive Suppliers Directory, August 1998.