Embed Size (px)
Citation preview

A Profile
of
Older Americans: 2016
Administration on Aging
Administration for Community Living
U.S. Department of Health and Human Services

Table of Contents
HIGHLIGHTS* ................................................................................................................................................ 1
THE OLDER POPULATION ......................................................................................................................... 2
FUTURE GROWTH ........................................................................................................................................ 3
FIGURE 1: NUMBER OF PERSONS 65+: 1900-2060 (NUMBERS IN MILLIONS) ................................................................... 3
MARITAL STATUS ........................................................................................................................................ 4
FIGURE 2: MARITAL STATUS OF PERSONS 65+, 2016 ...................................................................................................... 4
LIVING ARRANGEMENTS .......................................................................................................................... 5
FIGURE 3: LIVING ARRANGEMENTS OF PERSONS 65+: 2016 ........................................................................................... 5
RACIAL AND ETHNIC COMPOSITION .................................................................................................... 6
GEOGRAPHIC DISTRIBUTION .................................................................................................................. 6
FIGURE 4: PERSONS 65+ AS A PERCENTAGE OF TOTAL POPULATION, 2015 .................................................................... 7 FIGURE 5: PERCENT INCREASE IN POPULATION 65+, 2005 TO 2015 ................................................................................ 7 FIGURE 6: THE 65+ POPULATION BY STATE, 2015 ........................................................................................................... 8
INCOME ........................................................................................................................................................... 9
FIGURE 7: PERCENT DISTRIBUTION BY INCOME: 2015 ..................................................................................................... 9
POVERTY ....................................................................................................................................................... 10
HOUSING ....................................................................................................................................................... 11
EMPLOYMENT ............................................................................................................................................. 11
EDUCATION .................................................................................................................................................. 11
HEALTH AND HEALTH CARE ................................................................................................................. 11
HEALTH INSURANCE COVERAGE ........................................................................................................ 13
FIGURE 8: PERCENTAGE OF PERSONS 65+ BY TYPE OF HEALTH INSURANCE COVERAGE, 2015 .................................... 13
DISABILITY AND ACTIVITY LIMITATIONS........................................................................................ 14
FIGURE 9: PERCENTAGE OF PERSONS 65+ WITH A DISABILITY, 2015............................................................................. 14
CAREGIVING ................................................................................................................................................ 15
NOTES ............................................................................................................................................................. 16

1
Highlights*
• Over the past 10 years, the population 65 and over increased from 36.6 million in 2005 to 47.8
million in 2015 (a 30% increase) and is projected to more than double to 98 million in 2060.
• Between 2005 and 2015 the population age 60 and over increased 34% from 49.8 million to 66.8
million.
• The 85+ population is projected to triple from 6.3 million in 2015 to 14.6 million in 2040.
• Racial and ethnic minority populations have increased from 6.7 million in 2005 (18% of the older
adult population) to 10.6 million in 2015 (22% of older adults) and are projected to increase to 21.1
million in 2030 (28% of older adults).
• The number of Americans aged 45-64 – who will reach 65 over the next two decades – increased by
14.9% between 2005 and 2015.
• About one in every seven, or 14.9%, of the population is an older American.
• Persons reaching age 65 have an average life expectancy of an additional 19.4 years (20.6 years for
females and 18 years for males).
• There were 76,974 persons aged 100 or more in 2015 (0.2% of the total 65+ population).
• Older women outnumber older men at 26.7 million older women to 21.1 million older men.
• In 2015, 22% of persons 65+ were members of racial or ethnic minority populations--9% were
African-Americans (not Hispanic), 4% were Asian or Pacific Islander (not Hispanic), 0.5% were
Native American (not Hispanic), 0.1% were Native Hawaiian/Pacific Islander, (not Hispanic), and
0.7% of persons 65+ identified themselves as being of two or more races. Persons of Hispanic origin
(who may be of any race) represented 8% of the older population.
• Older men were much more likely to be married than older women---70% of men, 45% of women.
In 2016, 34% older women were widows.
• About 29% (13.6 million) of noninstitutionalized older persons live alone (9.3 million women,
4.3 million men).
• Almost half of older women (46%) age 75+ live alone.
• The median income of older persons in 2015 was $31,372 for males and $18,250 for females.
Median money income (after adjusting for inflation) of all households headed by older people
increased by 4.3% (which was statistically significant) between 2014 and 2015. Households
containing families headed by persons 65+ reported a median income in 2015 of $57,360.
• The major sources of income as reported by older persons in 2014 were Social Security (reported by
84% of older persons), income from assets (reported by 62%), earnings (reported by 29%), private
pensions (reported by 37%), and government employee pensions (reported by 16%).
• Social Security constituted 90% or more of the income received by 33% of beneficiaries in 2014
(21% of married couples and 43% of non-married beneficiaries).
• Over 4.2 million older adults (8.8%) were below the poverty level in 2015. This poverty rate is
statistically different from the poverty rate in 2014 (10.0%). In 2011, the U.S. Census Bureau also
released a new Supplemental Poverty Measure (SPM) which takes into account regional variations in
living costs, non-cash benefits received, and non-discretionary expenditures but does not replace the
official poverty measure. In 2015, the SPM shows a poverty level for older persons of 13.7%
(almost 5 percentage points higher than the official rate of 8.8%). This increase is mainly due to
including medical out-of-pocket expenses in the poverty calculations.
*Principal sources of data for the Profile are the U.S. Census Bureau, the National Center for Health
Statistics, and the Bureau of Labor Statistics. The Profile incorporates the latest data available but not all
items are updated on an annual basis.

2
The Older Population
The population age 65 years or older numbered 47.8 million in 2015 (the most recent year for which data are
available). They represented 14.9% of the U.S. population, about one in every seven Americans. The number
of older Americans increased by 11.1 million or 30% since 2005, compared to an increase of 5.7% for the
under-65 population.
Between 2005 and 2015, the number of Americans aged 45-64 (who will reach age 65 over the next two
decades) increased by 14.9% and the number of Americans age 60 and over increased by 34.2% from 49.8
million to 66.8 million.
In 2015, there were 26.7 million older women and 21.1 million older men, or a sex ratio of 126.5 women for
every 100 men. At age 85 and over, this ratio increases to 189.2 women for every 100 men.
Since 1900, the percentage of Americans 65+ has more than tripled (from 4.1% in 1900 to 14.9% in 2015),
and the number has increased over fifteen times (from 3.1 million to 47.8 million). The older population
itself is increasingly older. In 2015, the 65-74 age group (27.6 million) was more than 12 times larger than in
1900 (2,186,767); the 75-84 group (13.9 million) was more than 17 times larger (771,369), and the 85+
group (6.3 million) was 51 times larger (122,362).
In 2015, persons reaching age 65 had an average life expectancy of an additional 19.4 years (20.6 years for
females and 18 years for males). A child born in 2015 could expect to live 78.8 years, more than 30 years
longer than a child born in 1900 (47.3 years). Much of this increase occurred because of reduced death rates
for children and young adults. However, the period of 1990-2007 also has seen reduced death rates for the
population aged 65-84, especially for men – by 41.6% for men aged 65-74 and by 29.5% for men aged 75-
84. Life expectancy at age 65 increased by only 2.5 years between 1900 and 1960, but has increased by 4.2
years from 1960 to 2007. Nonetheless, some research has raised concerns about future increases in life
expectancy in the US compared to other high-income countries, primarily due to past smoking and current
obesity levels, especially for women age 50 and over (National Research Council, 2011).
In 2015, 3.5 million persons celebrated their 65th birthday. Census estimates showed an annual net increase
between 2014 and 2015 of 1.6 million in the number of persons age 65 and over.
Between 1980 and 2015, the centenarian population experienced a larger percentage increase than did the
total population. There were 76,974 persons aged 100 or more in 2015 (0.2% of the total 65+ population).
This is more than double the 1980 figure of 32,194.
-----
Sources: U.S. Census Bureau, Population Division, Annual Estimates of the Resident Population for Selected
Age Groups by Sex for the United States, States, Counties, and Puerto Rico Commonwealth and Municipios:
April 1, 2010 to July 1, 2015. Release Date: June 2016; Table 1. Intercensal Estimates of the Resident Population by Sex and Age for the United States: April 1, 2000 to July 1, 2010. Release Date: September
2011; Annual Estimates of the Resident Population by Single Year of Age and Sex for the United States,
States, Counties, and Puerto Rico Commonwealth and Municipios: April 1, 2010 to July 1, 2015. Release
Date: July 1, 2016; 2010 Census Special Reports, Centenarians: 2010, C2010SR-03, 2012; Hobbs, Frank and
Nicole Stoops, Census 2000 Special Reports, Series CENSR-4, Demographic Trends in the 20th Century,
Table 5. Population by Age and Sex for the United States: 1900 to 2000, Part A; National Center for Health
Statistics, Xu JQ, Murphy SL, Kochanek KD, Arias E. Mortality in the United States, 2015. NCHS
data brief, no 267. Hyattsville, MD: 2016; and National Research Council, Crimmins EM, Preston SH,
Cohen B, editors. Explaining Divergent Levels of Longevity in High-Income Countries. Panel on
Understanding Divergent Trends in Longevity in High-Income Countries, 2011.

3
Future Growth
The older population will continue to grow significantly in the future (Figure 1). This growth slowed
somewhat during the 1990's because of the relatively small number of babies born during the Great
Depression of the 1930's. But the older population is beginning to burgeon as the first wave of the "baby
boom" generation is reaching age 65.
The population age 65 and over has increased from 36.6 million in 2005 to 47.8 million in 2015 (a 30%
increase) and is projected to more than double to 98 million in 2060. By 2040, there will be about 82.3
million older persons, over twice their number in 2000. People 65+ represented 14.9% of the population in
the year 2015 but are expected to grow to be 21.7% of the population by 2040. The 85+ population is
projected to more than double from 6.3 million in 2015 to 14.6 million in 2040.
Racial and ethnic minority populations have increased from 6.7 million in 2005 (18% of the older adult
population) to 10.6 million in 2015 (22% of older adults) and are projected to increase to 21.1 million in
2030 (28% of older adults). Between 2015 and 2030, the white (not Hispanic) population 65+ is projected to
increase by 43% compared with 99% for older racial and ethnic minority populations, including Hispanics
(123%), African-Americans (not Hispanic) (81%), American Indian and Native Alaskans (not Hispanic)
(82%), and Asians (not Hispanic) (90%).
Figure 1: Number of Persons 65+: 1900-2060 (numbers in millions)
Note: Increments in years are uneven.
Source: U.S. Census Bureau, Population Estimates and Projections.
-----
Sources: U.S. Census Bureau, Population Division, Annual Estimates of the Resident Population for Selected
Age Groups by Sex for the United States, States, Counties, and Puerto Rico Commonwealth and Municipios:
April 1, 2010 to July 1, 2015, Release Date: June 2016; Intercensal Estimates of the Resident Population by
Sex and Age for the United States: April 1, 2000 to July 1, 2010. Release Date: September 2011; Intercensal
Estimates of the White Alone Resident Population by Sex and Age for the United States: April 1, 2000 to
July 1, 2010; 2014 National Population Projections: Summary Tables, Table 3. Projections of the Population
by Sex and Selected Age Groups for the United States: 2015 to 2060, released December 10, 2014; and
NP2014_D1: Projected Population by Single Year of Age, Sex, Race, and Hispanic Origin for the United
States: 2014 to 2060.
3.1 4.99
16.2
25.5
35
47.856.4
82.3
98.2
0
20
40
60
80
100
120
1900 1920 1940 1960 1980 2000 2015 2020 2040 2060
Year (as of July 1)
Figure 1: Number of Persons 65+, 1900 to 2060 (numbers in millions)

4
Marital Status
In 2016, older men were much more likely to be married than older women--70% of men, 45% of women
(Figure 2). Widows accounted for 34% of all older women in 2016. There were more than three times as
many widows (8.8 million) as widowers (2.6 million).
Divorced and separated (including married/spouse absent) older persons represented only 14% of all older
persons in 2016. However, this percentage has increased since 1980, when approximately 5.3% of the older
population were divorced or separated/spouse absent.
Figure 2: Marital Status of Persons 65+, 2016
Source: U.S. Census Bureau, Current Population Survey, Annual Social and Economic Supplement.
----- Source: U.S. Census Bureau, Current Population Survey, Annual Social and Economic Supplement, Table
A1. Marital Status of People 15 Years and Over, by Age, Sex, and Personal Earnings: 2016.
45%
34%
16%
5%
70%
12% 13%
5%
0%
10%
20%
30%
40%
50%
60%
70%
80%
90%
100%
Married Widowed Divorced orSeparated/
Spouse Absent
Single (nevermarried)
Figure 2: Marital Status of Persons 65+, 2016
Women Men

5
Living Arrangements
Over half (59%) of older noninstitutionalized persons age 65+ lived with their spouse (including partner) in
2016. Approximately 15.5 million or 73% of older men, and 12 million or 47% of older women, lived with
their spouse (Figure 3). The proportion living with their spouse decreased with age, especially for women.
Only 34% of women 75+ years old lived with a spouse.
About 29% (13.6 million) of all noninstitutionalized older persons in 2016 lived alone (9.3 million women,
4.3 million men). They represented 35% of older women and 20% of older men. The proportion living alone
increases with advanced age. Among women aged 75 and over, for example, almost half (46%) lived alone.
A relatively small number (1.5 million) and percentage (3.1%) of the 65+ population in 2015 lived in
institutional settings. Among those who did, 1.2 million lived in nursing homes. However, the percentage
increases dramatically with age, ranging (in 2015) from 1% for persons 65-74 years to 3% for persons 75-84
years and 9% for persons 85+.
Figure 3: Living Arrangements of Persons 65+: 2016
Source: U.S. Census Bureau, Current Population Survey, Annual Social and Economic Supplement.
-----
Sources: U.S. Census Bureau, American Community Survey; Current Population Survey, Annual Social and
Economic Supplement 1967 to present; Table AD3. Living arrangements of adults 65 to 74 years old, 1967
to present; Table AD3. Living arrangements of adults 75 and over, 1967 to present.

6
Racial and Ethnic Composition
In 2015, 22% of persons age 65+ were members of racial or ethnic minority populations—9% were African-
Americans (not Hispanic), 4% were Asian or Pacific Islander (not Hispanic), 0.5% were Native American
(not Hispanic), 0.1% were Native Hawaiian/Pacific Islander, (not Hispanic), and 0.7% of persons age 65+
identified themselves as being of two or more races. Persons of Hispanic origin (who may be of any race)
represented 8% of the older population.
Only 9% of all the people who were members of racial and ethnic minority populations were 65+ in 2015
compared with 19% of non-Hispanic whites. The percentage of people age 65 and over within each racial
and ethnic minority group are as follows: 11% of African-Americans (not Hispanic), 12% of Asians (not
Hispanic), 8% of Native Hawaiian and Other Pacific Islanders (not Hispanic), 10% of American Indian and
Native Alaskans (not Hispanic) and 7% of Hispanics.
-----
Source: U.S. Census Bureau, Population Division, Annual Estimates of the Resident Population by Sex, Age,
Race, and Hispanic Origin for the United States and States: April 1, 2010 to July 1, 2015. Release Date: June
2016.
Geographic Distribution
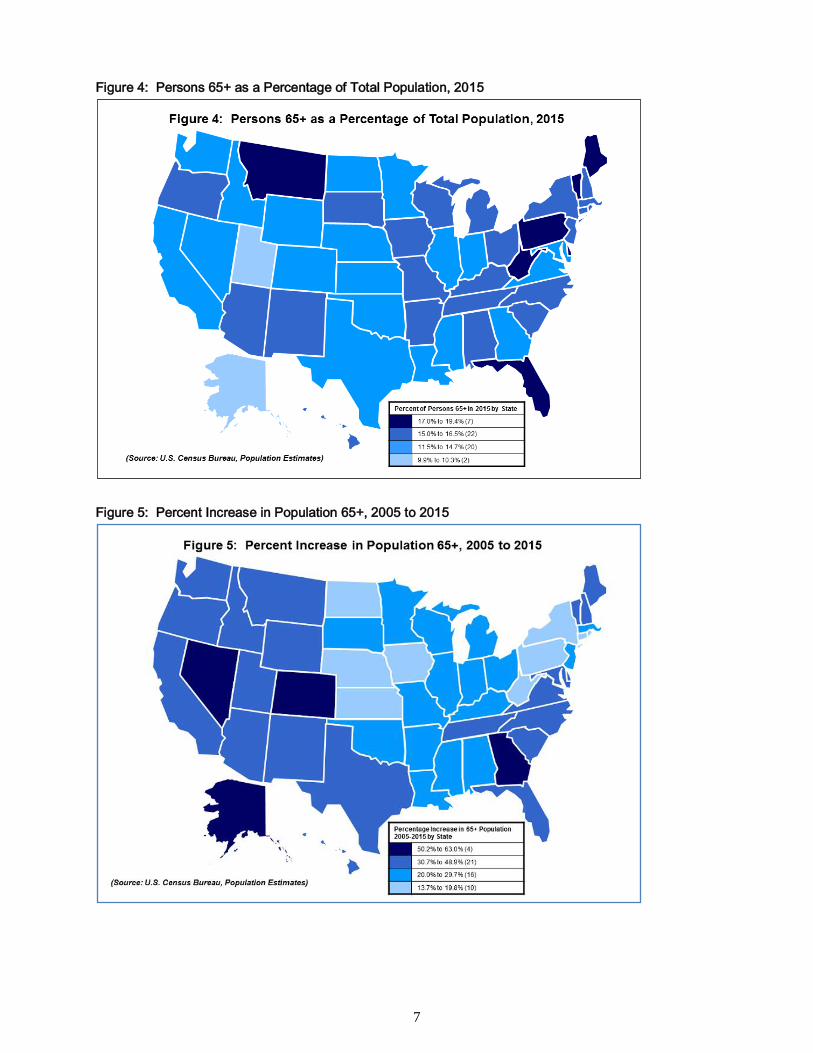
The proportion of older persons in the population varies considerably by state with some states experiencing
much greater growth in their older populations (Figures 4 and 5). In 2015, more than half (54%) of persons
65+ lived in 10 states: California (5.2 million); Florida (3.9 million); Texas (3.2 million); New York (3.0
million); Pennsylvania (2.2 million); Ohio (1.8 million); Illinois (1.8 million); Michigan (1.6 million); North
Carolina (1.5 million); New Jersey (1.3 million); and Georgia, Virginia, Arizona, Massachusetts, Washington
and Tennessee each had well over 1 million (Figure 6).
Persons 65+ constituted approximately 18% or more of the total population in three states in 2015: Florida
(19.4%); Maine (18.8%); and West Virginia (18.2%).
In 5 states, the 65+ population increased by 50% or more between 2005 and 2015: Alaska (63%); Nevada
(55%); Colorado (54%); Georgia (50%); and South Carolina (50%).
The 10 jurisdictions with poverty rates over 10% for older adults during 2015 were: District of Columbia
(15.2%); Louisiana (12.8%); Mississippi (12.5%); Kentucky (11.2%); New York (11.2%); New Mexico
(11.1%); Arkansas (10.3%); Florida (10.3%); Rhode Island (10.3%); and Texas (10.3%).
Older adults are less likely to change residence than other age groups. From 2015 to 2016, only 3% of older
persons moved as opposed to 13% of the under 65 population. Most older movers (62%) stayed in the same
county and 22% remained in the same state (different county). Only 16% moved out-of-state or abroad.
-----
Sources: Administration for Community Living agid.acl.gov. Data Source: Population Estimates 2005,
accessed December 12, 2016. U.S. Census Bureau, American Community Survey; Current Population
Survey, Annual Social and Economic Supplement; Table 1. General Mobility, by Race and Hispanic Origin,
Region, Sex, Age, Relationship to Householder, Educational Attainment, Marital Status, Nativity, Tenure,
and Poverty Status: 2015 to 2016; Annual Estimates of the Resident Population for Selected Age Groups by
Sex for the United States, States, Counties, and Puerto Rico Commonwealth and Municipios: April 1, 2010
to July 1, 2015. Release date June 2016.
7
Figure 4: Persons 65+ as a Percentage of Total Population, 2015
Figure 5: Percent Increase in Population 65+, 2005 to 2015

8
Figure 6: The 65+ Population by State, 2015
State
Number of Persons
65 and Older (1)
Percent of
All Ages
Percent Increase
from 2005 to 2015
Percent Below
Poverty 2015 (2)
US Total (50 States + DC) 47,760,852 14.9% 30.3% 8.8%
Alabama 764,162 15.7% 27.1% 9.9%
Alaska 72,837 9.9% 63.0% 4.5%
Arizona 1,120,054 16.4% 48.0% 9.0%
Arkansas 477,149 16.0% 24.2% 10.3%
California 5,188,754 13.3% 35.2% 9.9%
Colorado 711,625 13.0% 53.8% 7.0%
Connecticut 566,806 15.8% 19.3% 7.2%
Delaware 160,515 17.0% 43.2% 6.2%
District of Columbia 77,004 11.5% 15.8% 15.2%
Florida 3,942,468 19.4% 32.3% 10.3%
Georgia 1,304,924 12.8% 50.2% 9.7%
Hawaii 236,914 16.5% 35.4% 7.8%
Idaho 243,494 14.7% 47.8% 8.7%
Illinois 1,830,277 14.2% 20.6% 8.5%
Indiana 966,127 14.6% 24.4% 7.2%
Iowa 502,877 16.1% 15.1% 7.0%
Kansas 426,410 14.6% 19.6% 7.3%
Kentucky 672,765 15.2% 27.5% 11.2%
Louisiana 653,094 14.0% 22.7% 12.8%
Maine 250,536 18.8% 30.7% 8.8%
Maryland 849,571 14.1% 33.1% 7.3%
Massachusetts 1,045,222 15.4% 23.1% 9.2%
Michigan 1,570,671 15.8% 25.1% 7.8%
Minnesota 805,643 14.7% 29.7% 6.9%
Mississippi 439,701 14.7% 23.5% 12.5%
Missouri 954,922 15.7% 23.5% 8.5%
Montana 178,011 17.2% 37.3% 7.6%
Nebraska 278,711 14.7% 18.9% 7.4%
Nevada 422,118 14.6% 55.3% 8.4%
New Hampshire 218,942 16.5% 38.6% 6.1%
New Jersey 1,343,626 15.0% 20.0% 7.9%
New Mexico 330,405 15.8% 39.7% 11.1%
New York 2,964,315 15.0% 19.0% 11.2%
North Carolina 1,516,824 15.1% 43.2% 9.2%
North Dakota 107,281 14.2% 13.7% 8.9%
Ohio 1,842,952 15.9% 20.7% 7.6%
Oklahoma 576,250 14.7% 23.4% 8.4%
Oregon 660,876 16.4% 40.4% 7.3%
Pennsylvania 2,179,788 17.0% 15.5% 7.8%
Rhode Island 169,976 16.1% 14.5% 10.3%
South Carolina 794,795 16.2% 48.9% 9.3%
South Dakota 134,420 15.7% 22.6% 8.3%
Tennessee 1,016,552 15.4% 35.3% 9.8%
Texas 3,225,168 11.7% 42.9% 10.3%
Utah 307,867 10.3% 44.0% 6.8%
Vermont 109,893 17.6% 34.4% 6.6%
Virginia 1,188,393 14.2% 38.0% 7.3%
Washington 1,036,046 14.4% 45.0% 7.4%
West Virginia 336,288 18.2% 19.8% 8.5%
Wisconsin 902,134 15.6% 24.3% 7.1%
Wyoming 84,699 14.5% 36.1% 8.0%
Puerto Rico 626,962 18.0% 27.4% 41.0%
Notes: (1) Population Estimates (2) Poverty data for US are from the Current Population Survey, Poverty
data for States and Puerto Rico are from the American Community Survey.
Data Sources: U.S. Census Bureau, Current Population Survey, Annual Social and Economic Supplement;
Population Estimates; and American Community Survey.

9
Income
The median income of older persons in 2015 was $31,372 for males and $18,250 for females. From 2014 to
2015, median money income (after adjusting for inflation) of all households headed by older people
increased by 4.3% which was statistically significant. Households containing families headed by persons 65+
reported a median income in 2015 of $57,360 ($60,266 for non-Hispanic Whites, $42,334 for Hispanics,
$43,855 for African-Americans, and $64,688 for Asians). About 5% of family households with an older adult
householder had incomes less than $15,000 and 72% had incomes of $35,000 or more (Figure 7).
Figure 7: Percent Distribution by Income: 2015
Note: Percentages may not add to 100 due to rounding.
Source: U.S. Census Bureau, Current Population Survey, Annual Social and Economic Supplement.
2%
3%
9%
13%
16%
19%
37%
0% 20% 40% 60% 80% 100%
Under $10,000
$10,000 - $14,999
$15,000 - $24,999
$25,000 - $34,999
$35,000 - $49,999
$50,000 - $74,999
$75,000 and over
Family Households 65+ Householder, 2015
$57,360 median for 16.6 million family households 65+
4%
11%
16%
23%
13%
12%
21%
0% 20% 40% 60% 80% 100%
Under $5,000
$5,000 - $9,999
$10,000 - $14,999
$15,000 - $24,999
$25,000 - $34,999
$35,000 - $49,999
$50,000 and over
Persons 65+ Reporting Income, 2015
$22,887 median for 45.9 million persons 65+ reporting income

10
For all older persons reporting income in 2015 (45.9 million), 15% reported less than $10,000 and 46%
reported $25,000 or more. The median income reported was $22,887.
The major sources of income as reported by older persons in 2014 were Social Security (reported by 84% of
older persons), income from assets (reported by 62%), earnings (reported by 29%), private pensions
(reported by 37%), and government employee pensions (reported by 16%). In 2014, Social Security benefits
accounted for 33% of the aggregate income1 of the older population. The bulk of the remainder consisted of
earnings (32%), asset income (10%), pensions (21%) and other (4%). Social Security constituted 90% or
more of the income received by 33% of beneficiaries (21% of married couples and 43% of non-married
beneficiaries).
-----
Sources: U.S. Census Bureau, Current Population Survey, Annual Social and Economic Supplement, FINC-
01. Selected Characteristics of Families by Total Money Income in 2015; PINC-01. Selected Characteristics
of People 15 Years Old and Over by Total Money Income in 2015, Work Experience in 2015, Race,
Hispanic Origin, and Sex; and U.S. Census Bureau, Income and Poverty in the United States: 2015, Current
Population Reports, P60-256(RV), issued September 2016. Social Security Administration, “Fast Facts and
Figures About Social Security, 2016.”
Poverty
Over 4.2 million people age 65 and over (8.8%) were below the poverty level in 2015.2 This poverty rate is
statistically different from the poverty rate in 2014 (10.0%). Another 2.4 million or 5% of older adults were
classified as "near-poor" (income between the poverty level and 125% of this level).
Just over 2.4 million older Whites (alone, not Hispanic) (6.6%) were poor in 2015, compared to 18.4% of
older African-Americans (alone), 11.8% of older Asians (alone), and 17.5% of older Hispanics (any race).
Older women had a higher poverty rate (10.3%) than older men (7%) in 2015. Older persons living alone
were much more likely to be poor (15.4%) than were older persons living with families (5.7%). The highest
poverty rates were experienced among older Hispanic women who lived alone (40.7%).
In 2011, the U.S. Census Bureau released a new Supplemental Poverty Measure (SPM). The SPM
methodology shows a significantly higher number of older persons below poverty than is shown by the
official poverty measure. For persons 65 and older this poverty measure shows a poverty level of 13.7% in
2015 (almost 5 percentage points higher than the official rate of 8.8%). Unlike the official poverty rate, the
SPM takes into account regional variations in the cost of housing etc. and, even more significantly, the
impact of both non-cash benefits received (e.g., SNAP/food stamps, low income tax credits, and WIC) and
non-discretionary expenditures including medical out-of-pocket (MOOP) expenses. For persons 65 and
over, MOOP was the major source of the significant differences between these measures. The SPM does not
replace the official poverty measure.
-----
Sources: U.S. Census Bureau, Current Population Survey, Annual Social and Economic Supplement; POV01: Age and Sex of All People, Family Members and Unrelated Individuals Iterated by Income-to-
Poverty Ratio and Race: 2015; "Income and Poverty in the United States: 2014," P60-256, issued September,
2016; Poverty Thresholds for 2015 by Size of Family and Number of Related Children Under 18 Years; and
“The Supplemental Poverty Measure: 2015,” P60-258(RV), revised September 2016.
1 Aggregate income refers to the total income of couples and nonmarried persons aged 65 or older. 2 The poverty threshold in 2015 was $11,367 for householders age 65 and over living alone.

11
Housing
Of the 11.9 million households headed by persons age 75 and over in 2015, 76% were owners and 24% were
renters. The median family income of older homeowners was $31,000. The median family income of older
renters was $17,400. In 2015, almost 44% of older householders spent more than one-third of their income
on housing costs - 36% for owners and 78% for renters.
For older homeowners age 75 and over in 2015, the median construction year was 1969 compared with 1978
for all homeowners. Among the homes owned by people age 75 and older, 3.5% had moderate to severe
problems with plumbing, heating, electric, wiring, and/or upkeep. In 2015, the median value of homes owned
by older persons was $150,000 (with a median purchase price of $53,000). In comparison, the median home
value all homeowners was $180,000 (with a median purchase price of $127,000). About 78% of older
homeowners in 2015 owned their homes free and clear.
-----
Source: Department of Housing and Urban Development, American Housing Survey, National Tables: 2015.
Employment
In 2015, 8.8 million (18.9 %) Americans age 65 and over were in the labor force (working or actively
seeking work), including 4.8 million men (23.4%) and 4 million women (15.3%). They constituted 5.6% of
the U.S. labor force. About 3.8% were unemployed. Labor force participation of men 65+ decreased steadily
from 63.1% in 1900 to 15.8% in 1985; then stayed at 16%-18% until 2002; and has been increasing since
then to over 20%. The participation rate for women 65+ rose slightly from 8.3% in 1900 to 10.9% in 1956,
fell to 7.3% in 1985, and then stayed at 8%-9% during the 1990s. Beginning in 2000, labor force
participation of older women started to gradually rise from 9.7% to the 2015 level. This increase is especially
noticeable among the population aged 65-69.
----
Source: Bureau of Labor Statistics, Current Population Survey, Labor Force Statistics,
Education
The educational level of the older population is increasing. Between 1970 and 2016, the percentage of older
persons who had completed high school rose from 28% to 85%. About 28% in 2016 had a bachelor's degree
or higher. The percentage who had completed high school varied considerably by race and ethnic origin in
2016: 90% of Whites (not Hispanic), 80% of Asians (not Hispanic), 77% of African-Americans (not
Hispanic), 71% of American Indian/Alaska Natives (not Hispanic), and 54% of Hispanics. The increase in
educational levels is also evident within these groups. In 1970, only 30% of older Whites and 9% of older
African-Americans were high school graduates.
-----
Source: U.S. Census Bureau, Current Population Survey, Annual Social and Economic Supplement.
Health and Health Care
In 2015, 39% of noninstitutionalized people age 75 and over assessed their health as excellent or very good
(compared to 54% for persons aged 45-64 years). Most older persons have at least one chronic condition and
many have multiple conditions. In 2015, the most frequently occurring conditions among older persons age
75 and over were: diagnosed arthritis (53%), all types of heart disease (35%), any cancer (32%), diagnosed
diabetes (22% in 2011-2014), and hypertension (high blood pressure or taking antihypertensive medication)
(72% among men age 75 and over and 80% among women age 75 and over in 2011-2014).

12
In January-June 2016, 70% of people age 65 and over reported that they received an influenza vaccination
during the past 12 months and 68% reported that they had ever received a pneumococcal vaccination. About
30% (of persons 60+) reported height/weight combinations that placed them among the obese. Slightly under
half (45%) of persons aged 65-74 and 29% of persons 75+ reported that they engaged in regular leisure-time
physical activity. Only 9% reported that they are current smokers and 8% reported excessive alcohol
consumption. Less than 3% reported that they had experienced serious psychological distress during the past
30 days.
In 2015, 7.1 million people age 65 and over stayed in a hospital overnight at least one night during the year.
Among this group of older adults, 10% stayed overnight 1 time, 3% stayed overnight 2 times, and 2% stayed
overnight 3 or more times. This is approximately double the number of overnight hospital stays for the
population age 45 to 64; 6% had stayed overnight 1 time, 1% stayed overnight 2 times, and 1% stayed
overnight 3 or more times. Older persons averaged more office visits with doctors than younger persons in
2015. Among people age 75 and over, 23% had 10 or more visits to a doctor or other health care professional
in the past 12 months compared to 15% among people age 45 to 64.
In January-June 2016, 97% of older persons reported that they did have a usual place to go for medical care
and only 2% said that they failed to obtain needed medical care during the previous 12 months due to
financial barriers.
In 2015 older consumers averaged out-of-pocket health care expenditures of $5,756, an increase of 37%
since 2005 ($4,193). In contrast, the total population spent considerably less, averaging $4,342 in out-of-
pocket costs. Older Americans spent 12.9% of their total expenditures on health, as compared with 7.8%
among all consumers. Health costs incurred on average by older consumers in 2015 consisted of $3,893
(68%) for insurance, $967 (17%) for medical services, $672 (12%) for drugs, and $224 (4%) for medical
supplies.
-----
Sources: National Center for Health Statistics, National Health Interview Survey, Early Release of Selected
Estimates Based on Data from the January-June 2016; Tables of Summary Health Statistics for U.S. Adults:
2015. Bureau of Labor Statistics, Consumer Expenditure Survey, Table 1300. Age of Reference Person:
Annual Expenditures Means, Shares, Standard Errors, and Coefficient of Variation, 2015.

13
Health Insurance Coverage
In 2015, almost all (93%) non-institutionalized persons age 65+ were covered by Medicare. Medicare covers
mostly acute care services and requires beneficiaries to pay part of the cost, leaving about half of health
spending to be covered by other sources. About half of older adults (52%) had some type of private health
insurance, 7% had military-based health insurance,7% were covered by Medicaid, and 1% had no coverage
(Figure 8).
Figure 8: Percentage of Persons 65+ by type of Health Insurance Coverage, 2015
Note: A person can be represented in more than one category.
Source: U.S. Census Bureau, Current Population Survey, Annual Social and Economic Supplement.
----- Sources: U.S. Census Bureau, Current Population Survey, Annual Social and Economic Supplement; and
Health Insurance in the United States: 2015," P60-257, issued September, 2016.
99%
52%
28% 27%
94% 93%
7% 7%1%
0%
10%
20%
30%
40%
50%
60%
70%
80%
90%
100%
Figure 8: Percentage of Persons 65+ by type of Health Insurance Coverage, 2015

14
Disability and Activity Limitations
According to the U.S. Census Bureau’s American Community Survey, some type of disability (i.e., difficulty
in hearing, vision, cognition, ambulation, self-care, or independent living) was reported by 35% of people
age 65 and over in 2015. The percentages for individual disabilities ranged from almost one quarter (23%)
having an ambulatory disability to 7% having a vision difficulty (Figure 9).
Figure 9: Percentage of persons 65+ with a disability, 2015
Source: U.S. Census Bureau, American Community Survey.
Using limitations in activities of daily living (ADLs) and instrumental activities of daily living (IADLs) to
measure disability, in 2013, 30% of community-resident Medicare beneficiaries age 65+ reported difficulty
in performing one or more ADLs and an additional 12% reported difficulty with one or more IADLs. By
contrast, 95% of institutionalized Medicare beneficiaries age 65 and over had difficulties with one or more
ADLs and 81% of them had difficulty with three or more ADLs. [ADLs include bathing, dressing, eating,
and getting around the house. IADLs include preparing meals, shopping, managing money, using the
telephone, doing housework, and taking medication.] Limitations in activities because of chronic conditions
increase with age.
-----
Sources: U.S. Census Bureau, American Community Survey. Centers for Medicare and Medicaid Services,
Medicare Current Beneficiary Survey.
35%
15%
7%
9%
23%
8%
15%
0% 20% 40% 60% 80% 100%
Any disability
Hearing difficulty
Vision difficulty
Cognitive difficulty
Ambulatory difficulty
Self-care difficulty
Independent living difficulty
Figure 9: Percentage of Persons 65+with a disability, 2015

15
Caregiving
The need for caregiving increases with age. In January-June 2016, older adults aged 85 and over were more
than twice as likely (20%) as adults age 75–84 (7%) to need help with personal care from other persons, and
adults age 85 and over were more than six times as likely as adults age 65–74 (3%) to need help with
personal care from other persons. Among older adults age 85 and over, women were more likely (23%) than
men (14%) to need help with personal care from other persons.
Older adults not only need care, but often also provide care to younger family members. For example,
approximately 1 million grandparents age 60 and over were responsible for the basic needs of one or more
grandchildren under age 18 living with them in 2015. Of these caregivers, 593,495 were grandmothers and
429,377 were grandfathers.
In addition, in 2013, among the 3.6 million people with Intellectual and Developmental Disabilities (I/DD)3
living with a family caregiver, 24% had caregivers who were age 60 or over (863,314). The percentage of
people with I/DD living with older caregivers ranges from 11% in Alaska to 25% in Florida.
-----
Sources: National Center for Health Statistics, National Health Interview Survey, Early Release of Selected
Estimates Based on Data from the January-June 2016. U.S. Census Bureau, American Community Survey.
Braddock, D., Hemp, R., & Rizzolo, M. K. (2015). State of the States in Developmental Disabilities.
American Association on Intellectual and Developmental Disabilities.
3 The total number of people with Intellectual and Developmental Disabilities (I/DD) is estimated to be 5 million.

16
Notes
Principal sources of data for the Profile are the U.S. Census Bureau, the National Center for Health Statistics,
and the Bureau of Labor Statistics. The Profile incorporates the latest data available but not all items are
updated on an annual basis.
Age-adjusted estimates are used when available.
The data presented in this report refer to the noninstitutionalized population except where noted.
A Profile of Older Americans: 2016 was developed by the Administration on Aging (AoA), Administration
for Community Living, U.S. Department of Health and Human Services.
AoA serves as an advocate for older adults within the federal government and is working to encourage and
coordinate a responsive system of family and community based services throughout the nation. AoA helps
states develop comprehensive service systems which are administered by 56 State Units on Aging, 629 Area
Agencies on Aging, 244 Tribal organizations, and 2 Native Hawaiian organizations.