Embed Size (px)
Citation preview

31
Claire Costello Owen Molloy
A process model to support automated measurement and detection of out-of-bounds events in a hospital laboratory process
Journal of Theoretical and Applied Electronic Commerce ResearchISSN 0718–1876 Electronic Version VOL 4 / ISSUE 2 / AUGUST 2009 / 31-54 © 2009 Universidad de Talca - Chile
This paper is available online at www.jtaer.com DOI: 10.4067/S0718-18762009000200004
A process model to support automated measurement and detection of out-of-bounds events in a hospital laboratory
process Claire Costello1 and Owen Molloy2
Department of Information Technology, National University of Ireland Galway Ireland. 1 [email protected], 2 [email protected]
Received 15 January 2009; received in revised form 1 June 2009; accepted 15 June 2009
Abstract
Business Activity Monitoring (BAM) allows organizations to capture enterprise events from their source systems and utilize these to detect non-compliant business situations. Similar concepts may be leveraged in the healthcare domain to improve the quality of patient care and the efficiency of clinical processes. This paper introduces a generic set of constructs for formally specifying threshold values relevant for cycle time and utilization calculations. It also describes a mechanism to capture information, including thresholds, about important business parameters for Six Sigma measurement. This full set of constructs are the basis for automated measurement and monitoring and are incorporated into the process model during the definition or capture phase thereby linking the definition and monitoring phases through a common underlying process model. Bespoke software is also described which uses the constructs contributed by this research to manage and monitor process models and enterprise events. A process performance module provides automated measurement and monitoring capabilities. At an aggregate level, this is achieved through the provision of process cycle time data for selected time periods on demand and the examination of business processes at frequent intervals with alerts generated for exceptional scenarios. At a more granular level, this solution uses a rules-based approach to evaluate individual events and generate alerts for out-of-bounds business parameters. This paper demonstrates the benefits of these capabilities for health informatics through application to a Laboratory Testing process observed at a local hospital. The paper also suggests recommendations for the extension of current modelling languages with respect to the constructs detailed herein.
Key words: Business activity monitoring, Process performance measurement, Process modelling and definition languages, Event modelling, Six Sigma

32
Claire Costello Owen Molloy
A process model to support automated measurement and detection of out-of-bounds events in a hospital laboratory process
Journal of Theoretical and Applied Electronic Commerce ResearchISSN 0718–1876 Electronic Version VOL 4 / ISSUE 2 / AUGUST 2009 / 31-54 © 2009 Universidad de Talca - Chile
This paper is available online at www.jtaer.com DOI: 10.4067/S0718-18762009000200004
1 Introduction Cantara et al. of Gartner Research predict that by 2012, “organizations that don't take an end-to-end process view will compromise their business performance" [5]. This process view requires clear definition and understanding of business processes. A business process is one of the core elements of organizational ‘being’. Many definitions exist, but two are selected here. A process “contains purposeful activity", “is carried out collaboratively by a group", “crosses functional boundaries", and is invariably driven by the outside world" [25]. A process is designed, foremost, to deliver value to its customers (internal or external) and comprises a sequence of steps (actions, tasks, activities or functions) potentially spanning multiple departments, and even organizations. A business process is “a collection of interrelated work tasks, initiated in response to an event, that achieves a specific result for the customer of the process" [28]. From these two definitions, certain characteristics of business processes emerge. They are customer-focused, cross-functional, have a specific scope, require a precise definition of each task and have a measurable output. Despite this seemingly logical design, organizations are typically compartmentalized into departments making it difficult to manage cross-functional processes. Organizations find themselves functionally-oriented instead of process-oriented [28]. The wider context for the research detailed in this paper is process improvement. Organizations typically apply the Define, Measure, Analyse, Improve, Control (DMAIC) approach to (continuous) process improvement. This is a closed feedback loop and of these five phases, the first three relate directly to this research. The measure and analyse phases may be facilitated through the implementation of Business Activity Monitoring (BAM) solutions based on event-driven architectures for delivering operational-level monitoring capabilities. Although containing the terms “business activity” in the title, this approach can be applied to any domain. Healthcare sometimes lags behind other industry sectors and process monitoring remains a big challenge. Until now research has focused mostly on electronic patient records and patient care. Clearly important elements of the patient journey, the addition of automated measurement and monitoring capabilities would greatly improve healthcare processes as it would raise visibility of process performance providing healthcare professionals with better understanding of process steps. This research uses direct measurements of key characteristics to determine the performance of a given activity. This follows closely with the belief that “Measurements are key. If you cannot measure it, you cannot control it. If you cannot control it, you cannot manage it. It you cannot manage it, you cannot improve it” [12]. Coupled with this performance measurement approach, this research also applies the concepts of BAM to a laboratory process of a local teaching hospital to demonstrate the benefits of such concepts in healthcare. Prior to analyzing the process in question, each step was performed in isolation with little visibility of the end-to-end performance of the process as a whole. This paper is organized as follows: Section 2 will give a background into the state of the art in business process modelling as well as discuss related work with respect to performance modelling and monitoring. It will outline current limitations with respect to the provision of modelling constructs supportive of automated process performance measurement and monitoring. It also describes BAM as a relevant aspect of this research work. Section 3 presents the modelling constructs developed and describes their attribute and element definitions using XML as the representation language of choice. In particular, the contributions made by this research work are highlighted by positioning them alongside the Business Intelligence approach to business analysis. Section 4 describes iWISE as an IT architecture to manage and monitor process models defined using these new constructs presented in Section 3. A demonstration is described in Section 5 through the application of these new constructs and software to a local hospital’s laboratory testing process. This section will describe the end-to-end activities required to measure and monitor the process as well as detect out-of-bounds events. Section 6 concludes this paper and discusses the output of this research and describes a set of development points for further work.
2 State of the Art and Related Work
2.1 Business Process Modelling and Execution Languages
A Process modelling language (PML) is a standard used to graphically depict a business process. Some PMLs have an underlying XML format. A Process execution or definition language (PEL or PDL) is a specification which contains semantics understood by process execution engines. Some PMLs have mappings to PELs. If it is not possible to classify a process language as a PML or PEL, it is more generally classified as a PDL. The Business Process Modelling Notation (BPMN) and Business Process Definition Metamodel (BPDM) are examples of PMLs whilst the XML Process Definition Language (XPDL) and Business Process Execution Language are examples of PELs. These are described briefly in the following paragraphs.
2.1.1 BPMN According to the BPMN specification [4], “the objective of BPMN is to support process management by both technical users and business users by providing a notation that is intuitive to business users yet able to represent complex process semantics.'' BPMN allows businesses to construct a Business Process Diagram (BPD) per

33
Claire Costello Owen Molloy
A process model to support automated measurement and detection of out-of-bounds events in a hospital laboratory process
Journal of Theoretical and Applied Electronic Commerce ResearchISSN 0718–1876 Electronic Version VOL 4 / ISSUE 2 / AUGUST 2009 / 31-54 © 2009 Universidad de Talca - Chile
This paper is available online at www.jtaer.com DOI: 10.4067/S0718-18762009000200004
business process. The specification provides a formal mechanism for translating the BPMN notation into an executable business process expressed in BPEL. In particular, the BPMN specification models private processes, interface processes, and collaboration processes. Private processes are the internal processes of an organization. For example, these private processes will map to a single BPEL document. Interface (or abstract) processes represent the interaction between a private process and another process or participant. The interface defines the sequence of messages that the external entity must use to interact with the process. On the other hand, a collaboration process depicts the interaction between more than one business entity.
2.1.2 BPDM The OMG finalized the Business Process Definition Metamodel (BPDM) [24] specification in July 2008. From the specification, “BPDM provides the capability to represent and model business processes independent of notation or methodology, thus bringing these different approaches together into a cohesive capability.'' BPDM process models may be exchanged between modelling tools, and between tools and execution environments. In particular, the BPDM specification defines a language for specification of orchestration and choreography processes and views this as two sides of the same coin. In order to function as an interchange language, BPDM was mandated to provide support for multiple notations and process modelling approaches. As a result, BPDM provides support for many constructs. For example, it supports all BPMN notation concepts, conditional execution paths, enterprise events and Service Oriented Architecture (SOA) concepts.
2.1.3 XPDL The XML Process Definition Language (XPDL) forms part of WfMC's Interface 1 (of 5) “Supporting Process Definition Import and Export” specification. This interface includes a common meta-model for describing the process definition and also an XML Schema for the interchange of process definitions to support the transfer of workflow process definitions between separate process management products. The meta-model caters for activity and transition definitions, declaration of workflow participants, inclusion of system and environment data as well as the definition of data relevant to the workflow.
2.1.4 BPEL The Business Process Execution Language (BPEL) [23] is a combination of two competing standards: Microsoft's XML business process language for BizTalk, XLANG, and IBM's Web Services Flow Language (WSFL). An OASIS technical committee was charged with advancing BPEL, and the mission of this committee has been achieved and activity has completed with the release of BPEL version 2.0. BPEL leverages Web services to address business-to-customer, business-to-business and application-to-application processes. The specification proposes that the language effectively defines a portable execution format for business processes that rely exclusively on Web service resources and XML data. Applications must expose functionality as Web services to allow BPEL to incorporate them into the process definition. BPEL refers to service descriptions specified using Web Services Description Language (WSDL).
2.1.5 Comparison of Standards
Table 1: Comparison of process modelling and execution standards. Adapted from [19]
BPM
N
BPD
M
BPE
L
XPD
L
Task / Activity Control Flow Data Handling Instance Correlation Roles Events Exceptions Transactions Graphic Position Statistical Data
A comparison of process languages using a set of common meta-modelling concepts is given in [19]. Table 1 contains 10 modelling concepts. Task represents a process step. Quality attributes relate to the ability of software to decide the most appropriate service using Quality of Service metrics. This would apply in Web service-based process definitions. Control flow specifies the sequencing of tasks. Data handling specifies variables and their usage in a process. Instance correlation refers to the way in which messages are uniquely identified across process

34
Claire Costello Owen Molloy
A process model to support automated measurement and detection of out-of-bounds events in a hospital laboratory process
Journal of Theoretical and Applied Electronic Commerce ResearchISSN 0718–1876 Electronic Version VOL 4 / ISSUE 2 / AUGUST 2009 / 31-54 © 2009 Universidad de Talca - Chile
This paper is available online at www.jtaer.com DOI: 10.4067/S0718-18762009000200004
instances. Roles represent an abstract definition of process participant and these could be linked with organizational structure. Events are real-world triggers of processes or are related to step execution in some way. Exceptions are handled using specific exception handlers invoked in specific cases. Transactions which do not complete successfully must be dealt with using compensation processes. This is particularly important in long-running business processes. Graphic position refers to the (x, y) coordinate position for visualization software. Statistical data is required for performance analysis of a business process that builds on data such as costs or duration of tasks [19]. What emerges from this comparison is that statistical data is the least supported modelling concept. For obvious reasons, control flow is the most supported concept. This analysis of current modelling languages is important as it highlights what such languages lack with respect to process performance measurement. Without support for the measurement aspect of a process, BAM remains an independent activity in the overall process management life cycle. The existence of many standards makes the “seamless integration of the business process management life cycle a difficult task” [20]. A common model is necessary to support and link the various stages of a process life cycle, namely, process modelling, deployment, execution and monitoring. One of the primary aims of this research is to provide modelling constructs that support automated process performance measurement and monitoring and this is described in Section 3.
2.2 Business Activity Monitoring
Business Activity Monitoring relies upon event-driven architecture principles and components to enable companies monitor their business operations. “Data latency” is a term referring to the interval between the time an event occurs and the time it is perceived by the user [9] or stored and made available for analysis [10], [16]. Decreasing data latency, and hence decision latency [10] experienced by decision makers will help organizations in their quest for agility and responsiveness. This is achieved through dissemination of information in a timely manner before the window of opportunity to respond has closed. BAM software aims to minimize a decision maker's response time to time-critical situations and relies exclusively on enterprise event management technologies, both for the detection and rapid processing of high volumes of event and business-related data. In this way, BAM is the antithesis of batch-oriented information processing systems. There are four important modules required for a serious BAM solution [7]: an event processing module, a process definition module, a monitoring module and a visualization module. The event processing module is the core component of a BAM solution. Event processing refers to the extraction and collection of business data as events are detected in the source and is achieved using messaging and adapter technologies. Events may be classified into three categories [33]: a business event, an Information Systems event, and a software event. The relevant event and business data, once extracted, may be loaded and transformed by the processing software or it may be manipulated by the extraction software before being loaded into a central staging area for processing [8]. However, real-time event stream processing is not reserved entirely for business usage. Critical care research activity uses event processing technologies combined with SOA-based solutions to deliver critical patient data to clinicians in real-time [18], [30]. Event processing modules may also include Complex Event Processing capabilities which analyse events and event patterns to provide an aggregate result for monitoring purposes [17]. Although not available in mainstream products, a process definition will provide context for business data as it is being collected from the source systems. Research in this area has produced some good results with respect to the ability to understand data from a business process perspective and disseminate alerts where certain business thresholds have been crossed [32], [35]. What is not so obvious from these approaches is the level of integration between process improvement phases using a common underlying model to support the automated data collection and performance measurement undertaken by the monitoring module. Once data is collected and transformed, the BAM system will apply proprietary business logic to analyse the data. [1] describes a metamodel and authoring tool for “describing business performance for business services in the context of SOA.” For this work, the business metrics are modeled and hard-coded into the performance model and this model leverages common event attributes such as start event timestamp and end event timestamp to calculate turnaround times for individual process instances. Although this research elevates metrics as valuable citizens of the process model, it is unknown how this data is further processed and analysed to provide per instance or aggregate-level process performance monitoring capabilities. This is also the focus of this research; to design an IT architecture to manage and monitor process models defined using new constructs and this is described in Section 4. Finally, presenting the analyzed data and generating alerts for business users can be done using dashboard technology as named after the typical cockpit-style dashboards with dials and gauges used to present information about the immediate environment and its functions. A particular favourite with users of such technologies are the red, amber and green traffic light style of status reporting. Novel visualization techniques are also being applied to events as demonstrated by the work carried out in [31] where “visualization is based on the metaphor of considering the event stream as a cylindrical tunnel, which is presented to the user from multiple perspectives.” Business Intelligence (BI) is a complimentary technology to BAM. The data warehouse (DWH) is the central component of a BI solution. A DWH “is a subject-oriented, integrated, nonvolatile, and time-variant collection of data in support of management’s decisions” [14]. It is accepted that BI approaches provide a historical perspective on

35
Claire Costello Owen Molloy
A process model to support automated measurement and detection of out-of-bounds events in a hospital laboratory process
Journal of Theoretical and Applied Electronic Commerce ResearchISSN 0718–1876 Electronic Version VOL 4 / ISSUE 2 / AUGUST 2009 / 31-54 © 2009 Universidad de Talca - Chile
This paper is available online at www.jtaer.com DOI: 10.4067/S0718-18762009000200004
what has happened and does not provide insight into what is happening in an organization at any given moment [9], [22]. However, BAM solutions will not replace data warehouse solutions since they serve entirely different functions. Primarily, a data warehouse solution aggregates information and data using specific data models to assist historical analysis and future planning activities [6], [22]. BAM solutions are required where the decision making cycle time is very quick. In particular, BAM tools can monitor quality data streams and alert personnel when exceptional events occur [22]. This rules-based event driven alerting mechanism is important for decision making and prevention of problems before they escalate.
2.3 Rules for BAM
Various classifications of business rules exist [11], [27], and [34]. The classification of rules relevant to this particular research is known as reaction rules. Such rules are statements that initiate activities, trigger new events or send messages when certain conditions are satisfied or, more simply, reaction rules respond to events by performing actions. Rules for information systems can be expressed in many ways depending on the usage scenario. Rules can be expressed during system design using the Unified Modelling Language's Object Constraint Language (OCL) or they can be set for databases using SQL expressions. Rules, when described and mastered as part of a rules architecture, can be leveraged to great effect in application and data integration scenarios, for example, with a BAM solution. In particular, XML-based rule mark-up languages exist which allow the expression of “business rules as modular, stand-alone units in a declarative way, and to publish them and interchange them between different systems and tools” [34]. The Semantic Web Rule Language (SWRL) [13] is a W3C Member Submission that facilitates rule authoring using ontology concepts as part of rule predicates. SWRL is based on the RuleML and as such it inherits the RuleML rule structure. A rule consists of an antecedent (body) and a consequent (head), each of which consists of a set of atoms. When the conditions in the antecedent are true, then the conditions listed in the consequent are also true. An atom, as its name suggests, is the lowest level of specification for a rule; it is a rule predicate. SWRL supports only unary (1-term) and binary (2-term) predicates which must result in truth or falsehood in application. An example of a SWRL rule written in a human-readable syntax might be [13]:
)?,(?)?,(?)?,(? zxhasUnclezyhasBrotheryxhasParent ⇒∧
?x, ?y and ?z are said to be variables. This rule example reads as ”if ?x has a parent ?y and ?y has a brother ?z, then ?x has an uncle ?z.” Once prescribed, business rules may be executed by a business rule engine (BRE). A BRE is a software component that will execute business rules against a set of facts from a given scenario and typically consists of a knowledge of rules base, working memory (current facts regarding the business) and an inference engine [26]. A multitude of free and open-source rules engines exist with some providing support for SWRL whilst others use proprietary rule formats. One such example providing support for SWRL is the Bossam rule engine [15]. It will be seen in Section 4 how this contribution has been leveraged by this work.
2.4 Six Sigma Process Performance Measurement
One of the most challenging aspects of implementing a Six Sigma improvement programme for service processes is “what to measure and how?” [3]. The DMAIC approach provides a proven framework for Six Sigma improvement initiatives. The five phases may be summarized as follows:
1. Define Capture and define the process requirements in a manageable format. Include in this definition key measurements required for analyzing process execution times or other related performance information.
2. Measure Continuously calculate key process metrics as processes are executing using the model defined
in the previous step. Metrics definitions may be based on cycle times and Six Sigma calculations.
3. Analyse Analyse enterprise processes for critical changes based on acceptable limits for key parameters, for example, cycle time measurements exceeding a given target. Provide analysis using applicable tools or techniques such as correlation graphs, pareto charts and cause-and-effect (fishbone) diagrams. Today, more and more, Web-based dashboard portal technologies are used as a central point for process monitoring and visualization.
4. Improve Use dashboards to identify bottlenecks and inefficiencies in the process and propose
improvements. If possible, simulate suggested process improvements to evaluate effect on process design and implement as approved.

36
Claire Costello Owen Molloy
A process model to support automated measurement and detection of out-of-bounds events in a hospital laboratory process
Journal of Theoretical and Applied Electronic Commerce ResearchISSN 0718–1876 Electronic Version VOL 4 / ISSUE 2 / AUGUST 2009 / 31-54 © 2009 Universidad de Talca - Chile
This paper is available online at www.jtaer.com DOI: 10.4067/S0718-18762009000200004
5. Control Use control charts and other techniques to verify predictable process states. If necessary, implement chosen course of action to modify process to improve performance. Continue to repeat the DMAIC method until process reaches a predictable process state.
In particular, the measure phase of the DMAIC approach should consider the following aspects [3]:
determine the current performance of the business process
decide what to measure and how to measure it
establish a measurement system
use benchmarking to compare process performance Six Sigma is a data-driven approach to process analysis and improvement through reduction of process output variations. It is implemented through the application of methods and measurements. There are some important terms that are central to the Six Sigma approach [29]. A key characteristic is one that determines the acceptability of the end product to the user. The design specification width is the acceptable range of variation of a key characteristic or other parameter in a design. Normal Variation refers to plus or minus three standard deviations for a given parameter. The Lower Specification Limit (LSL) and Upper Specification Limit (USL) define the design specification width. LSL and USL are also referred to as the Lower Control Limit (LCL) and Upper Control Limit (UCL). Values of the given key characteristic which fall outside either of these limits are deemed to be defective or non-conforming values. From iSixSigma.com, a unit is any item that is produced or processed which is liable for measurement or evaluation against predetermined criteria or standards. According to [2], a unit is a discrete quantity of output that can be counted, verified, and measured. From isixsigma.com, an opportunity is any area within a product, process, service, or other system where a defect could be produced or where the provider fails to achieve the ideal product in the eyes of the customer. Given the definition of these two important terms, Table 2 lists some core Six Sigma measurements and their descriptions.
Table 2: Summary of Six Sigma metrics
Measure Description Formula
Defects per Unit (DPU) Defects Per Unit represents the ratio of total defects to total number of units processed. TotalUnits
tsTotalDefec
Defects per Million Opportunities (DPMO)
Defects Per Million Opportunities considers the opportunities for variation during processing. The long term goal is 3.4 DPMO; or 6σ.
000,000,1∗tunitiesTotalOppor
DPU
Rolled Throughput Yield (RTY) Yield is the percentage of a process that is free of defects.
DPUe−
Sigma Level The process quality level can be approximated by using the given formula. DPMOln221.237.298406.0 ∗−+
To summarize, for a given process, the following steps will produce estimates for the process DPMO, process yield and process Sigma level:
Step 1: Identify key characteristics and define each type of defect
Step 2: Define each type of opportunity
Step 3: Measure the defects, opportunities and units produced (for a given time period)
Step 4: Calculate DPU (see Table 2)
Step 5: Calculate DPMO (see Table 2)
Step 6: Calculate yield (see Table 2)
Step 7: Calculate Sigma quality level (see Table 2)

37
Claire Costello Owen Molloy
A process model to support automated measurement and detection of out-of-bounds events in a hospital laboratory process
Journal of Theoretical and Applied Electronic Commerce ResearchISSN 0718–1876 Electronic Version VOL 4 / ISSUE 2 / AUGUST 2009 / 31-54 © 2009 Universidad de Talca - Chile
This paper is available online at www.jtaer.com DOI: 10.4067/S0718-18762009000200004
3 Modelling for Automated Process Monitoring Given the current limitations found within current process modelling and definition standards with respect to process performance measurement and monitoring, there are two aims framing the contributions of this research. The first aim is to provide modelling constructs that support automated process performance measurement and monitoring. The second aim is to develop an IT architecture to manage and monitor process models defined using these new constructs. The first aim is achieved through the development of a set of constructs for formally specifying threshold values relevant for process cycle time and utilization calculations. This research also develops a mechanism to capture information, including thresholds, about important business parameters for Six Sigma measurement. These constructs are incorporated into the process model during the definition or capture phase which links the definition and monitoring phases through a common underlying process model. Note that although the Six Sigma measurement approach has been chosen to demonstrate the value of the modelling constructs developed as part of this research, the contribution is not restricted to the measurement framework to which it is applied. The second aim is achieved through the design and implementation of the iWISE software which uses the constructs contributed by this research to manage and monitor process models and enterprise events. A process performance module provides automated measurement and monitoring capabilities using a rules-based approach. At an aggregate level, this is achieved through the provision of process cycle time data for selected time periods on demand and the examination of business processes at frequent intervals with alerts generated for exceptional scenarios. At a more granular level, this solution also provides event-level evaluation and generates alerts for out-of-bounds business parameters as and when they are detected, processed and examined. Since processes and enterprise events are intrinsically related, the iWISE software demonstrates that they can be consolidated into a single platform to support process measurement and performance monitoring using BAM technology. The contributions described here are illustrated in Figure 1. The first contribution described above is highlighted as part of the Define element of Figure 1 and the second contribution is highlighted as part of the Execute element of Figure 1. Standard BAM solutions will contain event stream processing capabilities. Depending on the implementation, a rules engine or other processing add-ons may also exist. For this work, the addition of process performance and event monitoring modules brings together process and event definitions into a single platform. In this way, both the constructs and iWISE software developed extend current BAM capabilities to enforce the process dimension of business operations and provide automated measurement and monitoring functionality. The domain of application is not restricted and this paper will describe how these contributions may be applied in a healthcare domain to demonstrate their viability.
Figure 1: Positioning this research

38
Claire Costello Owen Molloy
A process model to support automated measurement and detection of out-of-bounds events in a hospital laboratory process
Journal of Theoretical and Applied Electronic Commerce ResearchISSN 0718–1876 Electronic Version VOL 4 / ISSUE 2 / AUGUST 2009 / 31-54 © 2009 Universidad de Talca - Chile
This paper is available online at www.jtaer.com DOI: 10.4067/S0718-18762009000200004
3.1 A Model for Activity Monitoring
The main modelling constructs are depicted using an UML Class Diagram in Figure 2. The central concept is a model which contains processes connected by transitions. Each process has multiple event type definitions and each event type definition may be associated with one or more parameter definitions. Each of these concepts is described in detail in the following sections.
Figure 2: High-level event-based model
3.1.1 Definition of Model Element The process model and related performance information uses XML as its canonical representation. Figure 3 presents the XML element Model. The Model element is the root element of the process model and acts as a container for all other concepts. Each model has a unique ID, modelID, for identification purposes. The Name and Description elements contain general information about the model. A boolean attribute, root, indicates if this model is the root model of a given multi-level model. A hierarchy of models can be created and each level of the hierarchy is connected through the definition of sub-models for a particular process. For example, a root model, M0, contains two processes, P1 and P2. Process P1 is decomposed to a greater level of detail in model M1 and P2 is decomposed to a greater level of detail in P2. However, model M0 is not aware of models M1 or M2. Models contain processes where a Process represents a business activity or step. A modeller would decide the level of granularity and encapsulation required. In this way, a process could represent a collection of other processes or an atomic task. Processes are connected via Transition elements.
Figure 3: Model XML Schema

39
Claire Costello Owen Molloy
A process model to support automated measurement and detection of out-of-bounds events in a hospital laboratory process
Journal of Theoretical and Applied Electronic Commerce ResearchISSN 0718–1876 Electronic Version VOL 4 / ISSUE 2 / AUGUST 2009 / 31-54 © 2009 Universidad de Talca - Chile
This paper is available online at www.jtaer.com DOI: 10.4067/S0718-18762009000200004
3.1.2 Definition of Process Element A Process element represents a process step. The XML Schema for a process is given in Figure 4. The ProcessID attribute and the Name and Description elements are self-describing. Each process has a ProcessOwner which captures the business sponsor responsible for the process definition. A process owner has typical attributes such as name, email address and mobile number. Multiple events may be defined with a process and this taxonomy is described in Section 3.1.3. A start and end event are mandatory event definitions as they are necessary for calculating total processing time for a process. Therefore, at a minimum, it must always be possible to specify and capture start and end events for a process. As mentioned previously, multi-level modelling is supported. A process model can be decomposed to another level of detail using a sub-model definition. This is specified using the SubModelID element. The sub-model is also a model and follows the model element structure. Sub-models are never set as root models. The remaining attributes are related to the performance aspect of a business activity. Some elements are defined at process capture whilst others are updated as process statistics are calculated at runtime. The following set of elements are specified when the process is captured:
CycleTimeUnits Specifies the unit in which cycle time should be expressed, for example, seconds, minutes, hours etc. Relevant in the context of TargetCycleTime for a process.
TargetCycleTime Specifies what the target cycle time (or total processing time) for a process is and is expressed in measurement units of CycleTimeUnit.
EfficiencyTimeUnit Specifies the unit in which efficiency of a process is measured. This element is necessary when calculating process utilization and productivity statistics as a process is executing. Relevant to the Capacity and UtilizationLCL of a process.
Capacity Specifies the maximum throughput possible when a process is operating at its capacity. This element is necessary when calculating process utilization and productivity statistics as a process is executing.
UtilizationLCL Specifies the lower control limit (LCL) acceptable for process utilization statistics. This is expressed as a percentage.
The remaining elements are statistics gathered as a process is executing. These are calculated using the pre-defined set of attributes described above. In essence, these elements are calculated at runtime and represent an aggregate view of process execution for specified time intervals.
CurrentProductivity Records a current snapshot of how many units are being processed by a process for a given EfficiencyTimeUnit This can also be expressed as the number of completed instances of a running process within a given time frame.
CurrentUtilization Records the current utilization level of a process as productivity expressed as a percentage of Capacity for a pre-specified time unit.
AverageCycleTime Records the average cycle time of a process for a given period of time.
StDevCycleTime Records the standard deviation of cycle time of a process for a given period of time.
MinimumCycleTime The lowest processing time of a process for a given period of time.
MaximumCycleTime The highest processing time of a process for a given period of time.
Figure 4: Process XML Schema

40
Claire Costello Owen Molloy
A process model to support automated measurement and detection of out-of-bounds events in a hospital laboratory process
Journal of Theoretical and Applied Electronic Commerce ResearchISSN 0718–1876 Electronic Version VOL 4 / ISSUE 2 / AUGUST 2009 / 31-54 © 2009 Universidad de Talca - Chile
This paper is available online at www.jtaer.com DOI: 10.4067/S0718-18762009000200004
3.1.3 Definition of Event Type Element An event type element documents the definition of an event instance. It is called an “event type” as it is the blueprint for an actual event and serves to provide some meta-data about the event. The XML Schema for an event type is given in Figure 5. Every event type has a Name, Description, and unique id. Combining events and business data with their process execution context is achieved using the XMLSchema element and as its name suggests, this element contains an XML Schema. Maintaining its usual function and using any of its allowable constructs, the XML Schema describes the structure of the business data that should be packaged with any event to be consumed by an event processing engine. It is the responsibility of the adapter software detecting the events to perform the transformation necessary to produce XML that conforms to this XML Schema definition. As long as the data can be defined, captured and transformed from the source system, this approach provides a very flexible way of defining events and business data. In this way, business data is not hard-coded into the event type definition.
Figure 5: Event type XML Schema With EDA, it is important to correlate events as they occur with their respective process definitions. Without the ability to correlate events, it is not possible to generate metrics per process instance and the metrics generated would be incorrect. XMLPathExpression refers to an element or attribute from the XML document that is used to uniquely identify an event instance for a particular process instance during execution. This is known as instance correlation and is specified in order to correctly correlate start and end event instance data (or any other instance data) for particular instances of a process. For example, for an order process, the order number can be used to match start and end events, or the process instance ID (if transmitted in the event) may also be used. Since this information is included as part of the actual event payload, then it must be selected at design time in order to correctly correlate the event instance data at runtime.
Figure 6: Runtime event XML Schema The software for “detecting” or “listening” for events must package the event in the format specified by the XML Schema in Figure 6. The Timestamp element contains the time at which the event occurred (and not when it is packaged). EventTypeID is an important element as it specifies the event type which is the blueprint for this particular event. This information is configured on the listening software when the event is defined initially. The
41
Claire Costello Owen Molloy
A process model to support automated measurement and detection of out-of-bounds events in a hospital laboratory process
Journal of Theoretical and Applied Electronic Commerce ResearchISSN 0718–1876 Electronic Version VOL 4 / ISSUE 2 / AUGUST 2009 / 31-54 © 2009 Universidad de Talca - Chile
This paper is available online at www.jtaer.com DOI: 10.4067/S0718-18762009000200004
business data is inserted into an XMLPayload element which conforms to the XML Schema as specified in the XMLSchema element in event type definition Figure 5.
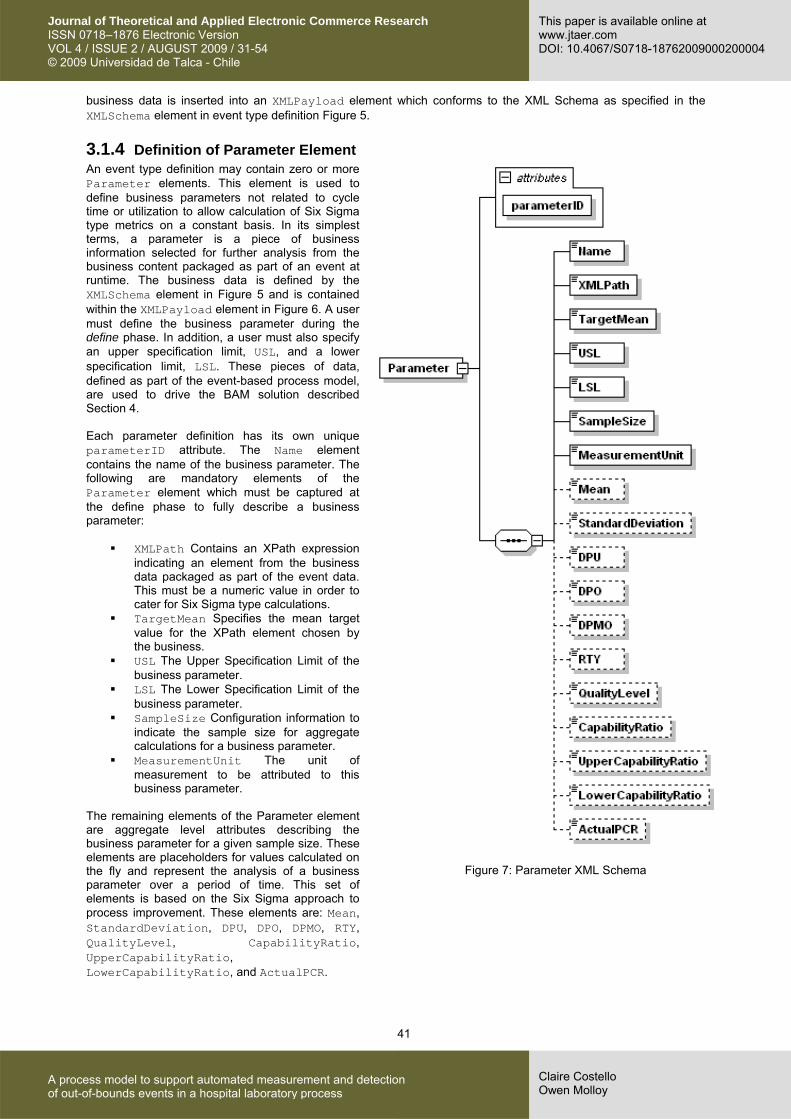
3.1.4 Definition of Parameter Element An event type definition may contain zero or more Parameter elements. This element is used to define business parameters not related to cycle time or utilization to allow calculation of Six Sigma type metrics on a constant basis. In its simplest terms, a parameter is a piece of business information selected for further analysis from the business content packaged as part of an event at runtime. The business data is defined by the XMLSchema element in Figure 5 and is contained within the XMLPayload element in Figure 6. A user must define the business parameter during the define phase. In addition, a user must also specify an upper specification limit, USL, and a lower specification limit, LSL. These pieces of data, defined as part of the event-based process model, are used to drive the BAM solution described Section 4. Each parameter definition has its own unique parameterID attribute. The Name element contains the name of the business parameter. The following are mandatory elements of the Parameter element which must be captured at the define phase to fully describe a business parameter:
XMLPath Contains an XPath expression indicating an element from the business data packaged as part of the event data. This must be a numeric value in order to cater for Six Sigma type calculations.
TargetMean Specifies the mean target value for the XPath element chosen by the business.
USL The Upper Specification Limit of the business parameter.
LSL The Lower Specification Limit of the business parameter.
SampleSize Configuration information to indicate the sample size for aggregate calculations for a business parameter.
MeasurementUnit The unit of measurement to be attributed to this business parameter.
The remaining elements of the Parameter element are aggregate level attributes describing the business parameter for a given sample size. These elements are placeholders for values calculated on the fly and represent the analysis of a business parameter over a period of time. This set of elements is based on the Six Sigma approach to process improvement. These elements are: Mean, StandardDeviation, DPU, DPO, DPMO, RTY, QualityLevel, CapabilityRatio, UpperCapabilityRatio, LowerCapabilityRatio, and ActualPCR.
Figure 7: Parameter XML Schema

42
Claire Costello Owen Molloy
A process model to support automated measurement and detection of out-of-bounds events in a hospital laboratory process
Journal of Theoretical and Applied Electronic Commerce ResearchISSN 0718–1876 Electronic Version VOL 4 / ISSUE 2 / AUGUST 2009 / 31-54 © 2009 Universidad de Talca - Chile
This paper is available online at www.jtaer.com DOI: 10.4067/S0718-18762009000200004
4 iWISE The iWISE architecture is illustrated in Figure 8 and consists of a single data-store with each subsystem presenting different views of that data to its users. The Event Server subsystem is responsible for managing the data store. The Process Dashboard subsystem uses portal technologies to present the model and event data. Each component is described in the following paragraphs.
Figure 8: iWISE high-level system architecture As-is business process models are captured using the iWISE Process Capture Tool (PCT) which is a standalone software application developed using Microsoft Visio libraries. The PCT allows users to construct a process map and define all important enterprise events linked to a process. Once events are defined, users may also define business parameters based on the business data defined as part of the event payload. The business parameters are linked to the business process through their event definitions. Therefore, each business parameter is associated with a particular process instance increasing traceability of data and information further downstream. For each parameter defined, users must specify the USL and LSL values in accordance with the structure outlined in Figure 7. For the process definition, users assign metric thresholds such as target cycle time, capacity of a process, and efficiency time units for calculating utilization and productivity metrics. The iWISE Event Server manages models, event streams and metric calculations using the three software packages shown in Figure 8: the Model Manager, Event Manager and Metric Manager. The Model Manager receives process models from the iWISE PCT and compiles them for further processing. The Event Manager component receives enterprise events defined in the format as specified during process capture. When raw events arrive, they are parsed and associated with the correct process. In parallel with event processing, the Metric Manager component automates metric calculations to provide both an up-to-date process view for the iWISE Process Dashboard and to generate alerts for subscribers when exceptional situations are detected. The iWISE Legacy Listener components are configured to detect events in IT systems in real-time. Once detected, the events are constructed using the format in Figure 6 and sent to the iWISE Event Server where they are parsed and stored. Multiple listener components may be deployed within a business operating environment.

43
Claire Costello Owen Molloy
A process model to support automated measurement and detection of out-of-bounds events in a hospital laboratory process
Journal of Theoretical and Applied Electronic Commerce ResearchISSN 0718–1876 Electronic Version VOL 4 / ISSUE 2 / AUGUST 2009 / 31-54 © 2009 Universidad de Talca - Chile
This paper is available online at www.jtaer.com DOI: 10.4067/S0718-18762009000200004
The iWISE Process Dashboard is a Microsoft portal application that provides a timely snapshot of process performance. This component converses with the iWISE Event Server to generate interactive process maps with drill-down capabilities. The portal user interface for a process model depicts each process as it is defined by the PCT. The layout of the original process diagram is preserved and rendered within the portal. Models defined by users are interactive. Therefore, in a multi-level model, users can select process nodes and drill-down to the next level in the process hierarchy or they may choose to view process metrics and charts. For example, users can view a full screen cycle time chart for a process which includes a target cycle time value as a clearly marked line in the chart. This target cycle time is a value set at the process definition phase and rendered as part of the charting process area.
4.1 Event Server Architecture and Functionality
As can be seen from Figure 8, the Event Server is deployed within J2EE compliant JBoss Application Server (JBoss 4.x AS). A combination of Enterprise Java Beans (EJBs) 2.1 and Container Managed Persistence (CMP) 2.0 is used to store information. The EJB structure comprises entity, session and message-driven beans for client software interactions. The Process Capture Tool and Non-JMS Clients interact with the Event Server using EJB Web service endpoints. All data is persisted to an underlying Microsoft SQL Server 2005 database. Process cycle time metrics are calculated by the Event Server as events arrive. The dashboard software is the main client of cycle time metric services exposed by the Event Server for on-demand reporting. The Protégé SWRL Rule Editor provides an environment to create SWRL rules based on metric thresholds. At runtime, a monitoring component calculates parameter metrics at specified intervals (configurable using application settings) and invokes the Bossam SWRL Rule Engine to test if the process parameter is out-of-bounds. If certain thresholds are not adhered to, the monitoring component will create the requisite records to be picked up by MS SQL Notification Services (NS) which generates alerts to pre-configured subscribers. Figure 9 presents the package structure of the Event Server which includes three packages: Model Manager, Event Manager and Metric Manager. Each package contains a combination of stateless session beans, entity beans and, in the case of the Event Manager package, a message driven bean to cater for the message queue requirements of the Event Server. The Model Manager contains entity beans and one stateless session bean which exposes Web services for interaction with the Model Manager. In particular, this bean services the interaction requirements between the PCT and Event Server. The Event Manager package manages the enterprise events that arrive from listeners implemented throughout the business context. The Metrics Manager is responsible for calculating process cycle times and business parameter metrics and contains session and entity beans to achieve this. The Metrics Manager is dependent on the Event Manager to supply runtime event data for its calculations.
+EventBean+EventMessageBean+EventServicesBean+EventServicesEndpoint
EventManager.*
+ProcessCycleTimeBean+MonitoringEngineBean+MetricServicesBean+MetricServicesEndpoint
MetricManager.*+ModelBean+TransitionBean+RoleBean+OrganizationalUnitBean+ParticipantBean+ProcessBean+EventTypeBean+ParameterTypeBean+ModelServicesBean+ModelServicesEndpoint
ModelManager.*
<<import>>
<<import>>
<<import>>
Figure 9: Event Server software package structure

44
Claire Costello Owen Molloy
A process model to support automated measurement and detection of out-of-bounds events in a hospital laboratory process
Journal of Theoretical and Applied Electronic Commerce ResearchISSN 0718–1876 Electronic Version VOL 4 / ISSUE 2 / AUGUST 2009 / 31-54 © 2009 Universidad de Talca - Chile
This paper is available online at www.jtaer.com DOI: 10.4067/S0718-18762009000200004
4.2 Process Cycle Time Analytics
A process has a target cycle time attributed to it (see Figure 4). This is specified during process capture using the iWISE PCT. The process and its target cycle time are defined jointly during process capture therefore linking the definition to the monitoring phases of the process bridging the gap that exists normally between these business design activities. These attributes, together with event timestamps, are used to calculate cycle time and throughput statistics to form the basis for analyzing process performance. EventMessageBean in the Event Manager package (see Figure 9) delegates the creation and calculation of process cycle time to the MetricServicesBean session bean in the Metrics Manager package if and only if the event received and processed is an end event. The interaction between the Dashboard Portal and the Event Server is managed using Web services technologies. As with all component interactions, each Web service is declared as part of a Java RMI Remote Interface class and implemented by a corresponding method in an EJB session bean implementation or realization class. The methods designed and implemented for the Dashboard Portal are exposed by the MetricsServicesBean. The MetricServicesBean session bean exposes methods through the MetricServicesEndpoint remote interface bean. Using the cycle time data generated as events are processed, the MetricServicesBean services requests from the iWISE Dashboard Portal.
4.3 Monitoring Processes and Business Parameters
Figure 10 contains the class diagram listing the core methods, both public and private, required to realize a process monitoring capability at frequent pre-defined intervals. MetricsTimerServlet is a listening servlet deployed with the Event Server software application. This servlet initialises an instance of MonitoringEngineBean to perform process analysis at pre-defined intervals. The MonitoringEngineBean executes SWRL rules by invoking the Bossam rules engine, generates exceptions where necessary and saves the exceptions to a database for processing by MS SQL Notification Services. The method that initiates this processing is ejbTimeout which is invoked at every specified time interval. Two monitoring approaches are described here. The first is the Six Sigma metric monitoring function and the second is the per event monitoring function.
Figure 10: Monitoring engine entity bean and Servlet class diagram The set of steps required to calculate Six Sigma metrics for a business parameter is illustrated in Figure 11. The first step is to retrieve a list of deployed process definitions. The remaining steps are applied to each process definition. The efficiency time unit will determine within what time frame the Six Sigma calculations will apply. Efficiency time unit is an attribute of a process and is explained in Section 3.1.2. For each event type defined for a process (start, end, cancel etc), retrieve the set of business parameters defined as part of that event type definition. For each parameter definition that exists, retrieve the enterprise events that occurred within the last time unit. For example, if the efficiency time unit is hours, retrieve all events that occurred within the last hour. The parameter sample size is used to limit the number of event occurrences processed for Six Sigma calculations. Recall that sample size is an attribute of a business parameter and is explained in Section 3.1.4. Due to the aggregate nature of the processing performed at a predefined interval, the monitoring solution described here is not real-time.

45
Claire Costello Owen Molloy
A process model to support automated measurement and detection of out-of-bounds events in a hospital laboratory process
Journal of Theoretical and Applied Electronic Commerce ResearchISSN 0718–1876 Electronic Version VOL 4 / ISSUE 2 / AUGUST 2009 / 31-54 © 2009 Universidad de Talca - Chile
This paper is available online at www.jtaer.com DOI: 10.4067/S0718-18762009000200004
Figure 11: Metric calculation steps for Six Sigma

46
Claire Costello Owen Molloy
A process model to support automated measurement and detection of out-of-bounds events in a hospital laboratory process
Journal of Theoretical and Applied Electronic Commerce ResearchISSN 0718–1876 Electronic Version VOL 4 / ISSUE 2 / AUGUST 2009 / 31-54 © 2009 Universidad de Talca - Chile
This paper is available online at www.jtaer.com DOI: 10.4067/S0718-18762009000200004
Once all events are retrieved, process each one individually for Six Sigma calculations. This works as follows: for each event, extract the data item from the payload as specified by the XML path element defined as part of the business parameter definition. This attribute, XMLPath, is described in Section 3.1.4. Examine the parameter value and compare against its upper and lower limit specifications, incrementing an out-of-bounds counter when necessary. Once all events are processed, the processBusinessParameters method calculates standard Six Sigma type calculations and sets them against the business parameter definition. These are updated again at the next time interval. Once these calculations are performed, evaluateEventParameters connects to the Bossam SWRL rule engine, “tells” it various facts and then queries the process to determine if it is in an exception state. The thresholds supplied to Bossam are set when the business parameter is defined and deployed with the process definition. The second monitoring function to be described by this paper is the per event instance monitoring function. This function examines each individual business parameter defined on each event as the event is processed by the Event Server’s Event Manager. The entity bean EventBean (see Figure 9) performs a check for parameter definitions for the event type with which the event is associated. If parameter definitions exist, then the value specified by parameter XML path from the event XML payload is extracted for range analysis. At this point, the Bossam rule engine is invoked and alerts are generated if individual parameter values fall outside their pre-defined limits, that is, the parameter value is out-of-bounds. The EventBean calls a stored procedure located in the iWISEDataStore database on SQL Server 2005. The stored procedure inserts the event data into the appropriate table, also in the iWISEDataStore. In effect, the Event Server produces events which MS SQL NS consumes. MS SQL NS will periodically check for new data in the tables and generate email notifications to subscribers.
5 Hospital Laboratory Process The set of activities followed as part of this demonstration to model and monitor a laboratory testing process from a local teaching hospital are illustrated in Figure 12. Beginning from the left-side, these activities are also listed in Table 3. These activities are grouped together in four main work streams (described below). Each stream corresponds to an element of the DMAIC process improvement methodology. Figure 12 displays these work streams where all steps that require human involvement are denoted by a user icon overlaid on the process step.
Table 3: Activities for defining and deploying the Lab Testing process
Step Description1 Observe real world process 2 Capture as-is process 3 Configure metrics 4 Define SWRL rules 5 Configure iWISE legacy listeners 6 Configure MS SQL NS Events and Alerts 7 Process events 8 Analyse processes 9 Access iWISE Dashboard portal 10 Receive MS SQL Notifications
Capture and Deploy This phase corresponds to the Define phase of DMAIC. Identify and map the as-is
process, including all events and business parameters. Define targets for cycle time and utilization. Define SWRL rules. Deploy the process, events, business parameters and SWRL rules.
Configure Application Since this work comprises a systems implementation, this phase also corresponds
to the Define phase of DMAIC. The Legacy Listeners are configured to detect the events defined in the Capture and Deploy phase. Finally, the events and alerts are defined and deployed using MS SQL NS. The deployment steps correspond to the Deploy phase.
Execute and Measure This phase corresponds to the Measure phase of DMAIC. Once the process, events,
business parameters and rules are deployed, enterprise events are packaged by the Legacy Listeners and sent to the Event Server for processing. The Event Server monitors process utilization and business parameters at each predefined time interval. There is also overlap with the Analyse phase here as rules are used to analyse processes and business parameters. This automated analysis is based on the activities carried out in the Capture and Deploy phase.
Visualize and Monitor This phase corresponds to the Analyse phase of DMAIC. Business users can
monitor, on demand, the cycle times of processes mapped in the Capture and Deploy phase. The graphs displayed through the Dashboard Portal and the notifications sent through MS SQL NS technology enhances users understanding of their business processes. Users may judge that a process is out of control and take necessary action to adjust and therefore improve the process.

47
Claire Costello Owen Molloy
A process model to support automated measurement and detection of out-of-bounds events in a hospital laboratory process
Journal of Theoretical and Applied Electronic Commerce ResearchISSN 0718–1876 Electronic Version VOL 4 / ISSUE 2 / AUGUST 2009 / 31-54 © 2009 Universidad de Talca - Chile
This paper is available online at www.jtaer.com DOI: 10.4067/S0718-18762009000200004
Figure 12: High-level overview of steps required to monitor activities The Improve and Control phases of the DMAIC improvement process are out of scope for this demonstration. Improving a process requires using the data available to re-define the process to work towards the ideal state. This may require numerous iterations of the approach described here. This work bridges the gap between (as-is) process definition and monitoring by incorporating a performance aspect into the process definition phase. The loop is closed by translating that information into process improvements.
5.1 Observe and Capture the Laboratory Testing Process
The laboratory (‘lab’) testing process documented in this section is the result of a direct observation of the activities carried out by a local hospital. Processing tests requested by GPs at the hospital lab requires steps that are both electronic and paper-based. A process hierarchy, illustrated in Figure 13, is used to present the as-is model. Beginning with the highest level, Level 0, a GP sends the specimen (also known as a sample), accompanied by a test request form, to the hospital laboratory. The form is “RL6 GP Request Form for Medical Microbiology” and contains the following fields:
• Patient's details. This includes a Patient Reference Number, date of birth, surname, first name, and address
• Requesting Doctor's details. Generally, an ink stamp is used here and includes name, address, and telephone number
• Requesting Doctor’s Signature
• Specimen details. This section details the specimen type, analysis required, and date of sample collection
• Clinical details and previous report numbers
• Section for laboratory use only (barcode labels are affixed here at the hospital)
The output of this process is a set of results which are sent back to the GP using conventional post. In Figure 13, the Level 0 process model, M0, contains one top level process named “P0: Analyse Sample” which is the root process in the process model hierarchy. P0 is decomposed into the first level of tasks to capture a more detailed view of the Lab Testing process. The RL6 form is converted by “P1: Intake” to an order that is processed by the lab. When P1

48
Claire Costello Owen Molloy
A process model to support automated measurement and detection of out-of-bounds events in a hospital laboratory process
Journal of Theoretical and Applied Electronic Commerce ResearchISSN 0718–1876 Electronic Version VOL 4 / ISSUE 2 / AUGUST 2009 / 31-54 © 2009 Universidad de Talca - Chile
This paper is available online at www.jtaer.com DOI: 10.4067/S0718-18762009000200004
completes, the main data flow is a test request order form. The “P2: Analysis” step is where the sample is tested and the output is passed to the “P3: Match Results” step. A machine, known as the “analyzer”, is used to test the various samples according to the analysis requirement specified by the GP. In P3, the specimen test results produced by the analyzer are matched with the appropriate patient record within the iLab patient record system. The last activity, “P4: Finalise Results” packages the results for the GP. In the printing room, the test results are printed for distribution to the GP. This contains potentially hundreds of test results which are subsequently placed into envelopes and mailed to the GP.
(a) Top-down: M2.1: Intake
(b) Top-down: M2.2: Analysis
Figure 13: Top-down as-is Lab Testing process model(s) A further level of decomposition is mapped for P1 and this is shown in model “M2.1: Intake” in Figure 13. When the specimens are received, they are sorted into batches and a barcode is placed on each specimen. A label is attached to the test request form which corresponds to the barcode attached to the specimen. In the case where a request form includes two specimens, two separate labels are placed on the form corresponding to the two specimens. This set of steps completes with an order entry on APEX, the software system used by the lab to manage all test requests submitted by GPs to the laboratory.

49
Claire Costello Owen Molloy
A process model to support automated measurement and detection of out-of-bounds events in a hospital laboratory process
Journal of Theoretical and Applied Electronic Commerce ResearchISSN 0718–1876 Electronic Version VOL 4 / ISSUE 2 / AUGUST 2009 / 31-54 © 2009 Universidad de Talca - Chile
This paper is available online at www.jtaer.com DOI: 10.4067/S0718-18762009000200004
Once intake and order entry are complete, the sample is analysed. “P2: Analysis” is decomposed into two discrete steps and this is shown in model “M2.2: Analysis” in Figure 13. Once the tests are entered into the APEX system, the specimens are sent through the analyser. The specimens are placed into racks with the barcode facing out for scanning by the analyser. When the specimens are analysed, the results are electronically queued for authorisation by a technician. Abnormal results are flagged which can be dealt with appropriately by a lab technician. <?xml version="1.0" encoding="UTF-8" standalone="yes"?> <Model modelID="119b81d5-b178-472f-b996-323425da87bf" root="true">
<Name>Lab Testing</Name> <Description>This model represents the root of the "Lab Testing" process hierarchy. </Description> <Processes>
<Process processID="a0134585-b0eb-4622-b980-745c578455a6"> <Name>Analyse Sample</Name> <Description/> <QueueEvent> ... </QueueEvent> <StartEvent> ... </StartEvent> <EndEvent> ... </EndEvent> <ProcessOwner>
<Participant> <ParticipantID>30cab89f-4d07-4b2a-b4c6-122b770f021d</ParticipantID> <FirstName>Costello</FirstName> <LastName>Claire</LastName> <EmailAddress>[email protected]</EmailAddress> <MobileNumber/>
</Participant> </ProcessOwner> <SubModelID>d49169f6-c92e-46e4-9b05-611f67168765</SubModelID> <CycleTimeUnits>days</CycleTimeUnits> <TargetCycleTime>7</TargetCycleTime> <EfficiencyTimeUnit>days</EfficiencyTimeUnit> <Capacity>18</Capacity> <UtilizationLCL>0</UtilizationLCL>
</Process> </Processes> <Transitions/>
</Model>
Figure 14: XML Listing for the Level 0 process model: “M0: Lab Testing” Whilst the user is capturing the as-is process model with the PCT, the underlying XML is being compiled according to the model described in Section 3. The XML constructed for the Lab Testing process is given in Figure 14. The event type definitions for the queue, start and end event are omitted for clarity. Each model component is assigned a unique identifier for storage and retrieval purposes. Since this model is the root of the process model hierarchy, the root attribute is set to true. As seen in Figure 14, there are no transitions for the topmost model and therefore, the transitions element for Figure 14 is empty. Each process step identified in Figure 13 has corresponding queue, start and end events as mandatory event type definitions. For each of the queue, start and end event types defined, an XML Schema must be supplied by the user. This XML Schema is directly associated with that event type and specifies what the actual enterprise event payload must conform to. Therefore, it is a business activity to analyse what business data may be captured by that event at runtime followed by careful consideration to specify what data should be selected for inclusion in the event payload. Once this has been clarified, an XML Schema needs to be created for selection by the PCT user when capturing the as-is process and defining the event types.
5.2 As-is Process Metric Configuration
There are two ways in which users can monitor the Lab Testing process. The iWISE Dashboard Portal illustrates, using graphs, how a process is performing against its target cycle time whilst the MS SQL NS generates alerts to subscribers when business parameters are skewed with respect to their control limits or when process utilization is out-of-bounds. This section addresses the configuration of the Lab Testing process for Dashboard Portal reporting and MS SQL NS email alerting and notification. Calculating and recording total cycle time (TCT), value added time (VAT), and non value added time (NVAT) for a process step is achieved using event timestamps. TCT, VAT and NVAT are calculated based on the existence of a

50
Claire Costello Owen Molloy
A process model to support automated measurement and detection of out-of-bounds events in a hospital laboratory process
Journal of Theoretical and Applied Electronic Commerce ResearchISSN 0718–1876 Electronic Version VOL 4 / ISSUE 2 / AUGUST 2009 / 31-54 © 2009 Universidad de Talca - Chile
This paper is available online at www.jtaer.com DOI: 10.4067/S0718-18762009000200004
correlated triple of queue, start and end event instances. This data is insufficient on its own to indicate if a process is running under or over its target cycle time. Using the PCT, the user specifies the target cycle time and the granularity of units used to express both this target and actual cycle time data (see Section 3.1.2). Once the cycle time has been calculated for a process step, the overall performance of the process can be tracked against its target. The cycle time data is graphed against the target cycle time and rendered on the Dashboard Portal. The Dashboard Portal is refreshed on demand for date ranges selected by the user. The definition of business parameters is driven by a business need to measure and monitor a key characteristic of a process step. A business parameter was defined for the “P2.1: Test Sample” process step (see Figure 13). This is the step in the process where the sample is actually tested using machine resources. Each test will combine chemicals with the sample to determine the presence of signs indicative of certain illnesses or conditions. Although the dosage is accurate, any change can result in a spoiled sample. The procedure for defining a business parameter to monitor chemical dosage is described below. <EndEvent>
<EventType id="fd8fb7fd-4703-4c33-8e95-7f875d105bae"> <Name>End Analyse Sample</Name> <Description/> <XMLSchema> ... </XMLSchema> <XMLPathExpression>/LabTest/TestRefNo</XMLPathExpression> <Parameters>
<Parameter parameterID="332776b2-0e8e-1w3r-9ead-5d57689g06c3d"> <Name>Chemical Mixing Agent</Name> <XMLPath>/LabTest/ChemicalLevel</XMLPath> <TargetMean>50.0</TargetMean> <USL>55.0</USL> <LSL>45.0</LSL> <SampleSize>10</SampleSize> <MeasurementUnit>percent</MeasurementUnit>
</Parameter> </Parameters>
</EventType> </EndEvent>
Figure 15: "Test Sample" business parameter definition
Firstly, an XML Schema was composed to define the data to be contained in an event occurring in the laboratory technical infrastructure. This XML Schema contains definitions for test-related data items and patient name and address details. This schema is used to define the XML Payload for the end event type definition for the Test Sample step in Figure 13. Once the event type was defined, the business parameter was defined. The end event type definition and its business parameter definition are given in Figure 15. Each attribute contained within Parameter was defined before the process was deployed to the Event Server. The actual chemical level is measured and specified in the XML element /LabTest/ChemicalLevel and packaged as part of the event payload. The target average for the chemical level is 50% with upper and lower limits of 55% and 45% respectively. The sample size is 10 and refers to the number of actual measurements to be used in order to calculate Six Sigma metrics. In this way, the last 10data points are used to determine mean and process capability.
5.3 Defining Rules for Exception Monitoring
Rules were defined using the Protégé SWRL rule authoring tool. There are five rules defined for the Lab Testing process, two of which are described in this paper. The first rule tests the mean value of the business parameter to determine if it is greater than the target mean value. Where all conditions of the rule antecedent are true, the process is in an exception state. The rule may be expressed using a similar notation to that of Section 2.3:
)?,(?)?,(?:
)?,(?)?,(?
)?,(?)?,(?
)(?
bxonhasExceptiazngreaterThaswrlb
zyValuehasAverageayuehasGoalVal
yxanceMetrichasPerformbxcthasBizObje
xprocess
⇒
∧∧
∧∧
∧

51
Claire Costello Owen Molloy
A process model to support automated measurement and detection of out-of-bounds events in a hospital laboratory process
Journal of Theoretical and Applied Electronic Commerce ResearchISSN 0718–1876 Electronic Version VOL 4 / ISSUE 2 / AUGUST 2009 / 31-54 © 2009 Universidad de Talca - Chile
This paper is available online at www.jtaer.com DOI: 10.4067/S0718-18762009000200004
The second rule is designed to test the value of individual business parameter values against a range of acceptable values. In our demonstration, the range of acceptable values for the Chemical Mixing Agent business parameter in Figure 15 is 45% to 55%. If an individual value lies outside this range, a non-conforming business situation has occurred in the Lab Testing process. The rule conditions will be satisfied resulting in a process that is in an exception state.
5.4 Configure, Execute and Visualize the Lab Testing Process
This section describes the core activities and outputs for the remaining steps in Figure 12 (steps 5 through 10). To summarize, the Lab Testing process model has been captured and deployed to the Event Server. The event types, metric thresholds and SWRL rules have been defined as part of this deployment. Steps 5 and 6 of Figure 12 relate to the configuration of the Legacy Listeners to detect and transmit events to the Event Server and the definition of MS SQL NS alerts and subscribers. <?xml version="1.0" encoding="UTF-8"?> <Event eventInstanceID="EVENT.4CROYND3">
<Timestamp>2006-01-11 08:29:13.647</Timestamp> <EventTypeID>fd8fb7fd-4703-4c33-8e95-7f875d105bae</EventTypeID> <XMLPayload> <![CDATA[
<?xml version="1.0" encoding="UTF-8"?> <LabTest> <TestRefNo>SPECIMEN.I0UO8DTE</TestRefNo> <ChemicalName>Chemical XYZ</ChemicalName> <ChemicalLevel>43</ChemicalLevel> <Patient>
<PatientRefNo>LOOKUP MEDICARE SYSTEM</PatientRefNo> <DOB>LOOKUP MEDICARE SYSTEM</DOB> <Surname>LOOKUP MEDICARE SYSTEM</Surname> <Firstname>LOOKUP MEDICARE SYSTEM</Firstname> <Address>
<AddressLine1>LOOKUP MEDICARE SYSTEM</AddressLine1> <AddressLine2>LOOKUP MEDICARE SYSTEM</AddressLine2> <City>LOOKUP MEDICARE SYSTEM</City> <County>LOOKUP MEDICARE SYSTEM</County>
</Address> </Patient> <MachineResource>
<ID>ANALYSER-2000</ID> <Description>Specimen Analyser</Description>
</MachineResource> </LabTest> ]]> </XMLPayload>
</Event>
Figure 16: “P2.1:Test Sample” end event XML (sample) Each event sent to the Event Server follows the same structure. End events for the process step “P1.2: Test Sample” resemble the sample event given in Figure 16. The EventTypeID element contains the unique identifier for the event type defined when the process end event was defined for this process during process capture. The ChemicalLevel value is examined by the EventBean when the event is processed by the Event Server. The MonitoringEngineBean performs aggregate Six Sigma calculations at pre-defined intervals and reports exceptions where necessary. Table 4 contains a set of end events for the Test Sample process step. The table data contains the event ID, the time the event occurred, the correlation ID (in this case, the Test Reference Number) and the value of the business parameter captured when the event took place. For the Test Sample process, the business parameter is the Chemical Value recorded when the event happens. The acceptable range of values for the chemical value is 45% to 55%. The efficiency time unit specified during process capture was used to gather the sample set. The sample size is the number of events occurring in the most recent efficiency time unit. The efficiency time unit for Test Sample process is days. On January 11th, 2006 there were 10 end events that occurred for “P2.1: Test Sample”. This set of events serve as the basis for the calculations in Table 5 performed by the Event Server MonitoringEngineBean for the Test Sample business parameter. The DPMO was 40,000 and the Sigma value was 3.2. There are some aspects of the measurement process, such as the sample size, that could be refined to more accurately calculate the DPMO and Sigma values. Overall, this process, it could be argued, is generating a high proportion of non-conforming results due to spoiled test samples. Table 4 shows that there were four tests where the chemical value did not adhere to the defined range of values. These parameter values resulted in email alerts generated at run time. The EventBean is responsible for analysing parameter values as it extracts them from the event payload. For the Test Sample business parameter, non-conforming values are reported via email alerts generated by MS SQL NS. This illustrates the ability of the solution

52
Claire Costello Owen Molloy
A process model to support automated measurement and detection of out-of-bounds events in a hospital laboratory process
Journal of Theoretical and Applied Electronic Commerce ResearchISSN 0718–1876 Electronic Version VOL 4 / ISSUE 2 / AUGUST 2009 / 31-54 © 2009 Universidad de Talca - Chile
This paper is available online at www.jtaer.com DOI: 10.4067/S0718-18762009000200004
design to detect and act on out-of-bounds events for this laboratory process. The parameters, once defined during the process definition phase (see Figure 15), are monitored as events are processed by the iWISE Event Server’s EventManager software component. From the Dashboard Portal, users can load process models from a list of deployed models, navigate the process model and view metrics and charts. Cycle time information is displayed using line charts and histograms on the Portal. Users can select a time period over which they wish to view cycle time performance for a process. For example, they may choose to examine value added cycle time by days.
Table 4: Test Sample end events for 11-01-2006
Event ID Timestamp Test Ref. No. Value EVENT.4CROYND3 11/01/2006 10:33:23 SPECIMEN.I0UO8DTE 43 EVENT.4PWCV1RZ 11/01/2006 11:03:31 SPECIMEN.3MHM36ON 52 EVENT.R02V2NUA 11/01/2006 11:37:37 SPECIMEN.FLHWOKEO 51 EVENT.5FGUF7UN 11/01/2006 12:34:20 SPECIMEN.KROHU4AY 42 EVENT.JDRH3CTY 11/01/2006 13:05:10 SPECIMEN.DYHX0CY9 50 EVENT.LTFEMI13 11/01/2006 13:34:25 SPECIMEN.MHHT62XZ 41 EVENT.CG82NJRR 11/01/2006 14:06:40 SPECIMEN.O8WMWLY6 57 EVENT.NNJBD9JS 11/01/2006 14:37:27 SPECIMEN.4WBNQWJL 46 EVENT.NO3A2QXI 11/01/2006 15:05:40 SPECIMEN.RFEHLHFH 47 EVENT.TSYIF30X 11/01/2006 15:32:09 SPECIMEN.TUPQ3WO7 45
Table 5: Event Server Six Sigma calculations for Test Sample
Measurement ValueUnits 10 Mean 47.4 Standard Deviation 15.677 Non-conforming 4 Opportunities 10 Total Opportunities 100 DPU 0.4 DPO 0.04 DPMO 40,000 RTY 0.670 Sigma Quality 3.256
6 Conclusions The first contribution of this research is a process modelling approach incorporating generic constructs for enterprise events and business parameters to support any taxonomy of events or class of business parameters. Extra process constructs have been defined to support the automated calculation of cycle time and process utilization statistics. For the purpose of this research activity, Six Sigma was chosen as a significantly complex process measurement technique for understanding the requirements for the definition of the business parameter constructs. Integrating these constructs into a process model at the modelling phase supports the monitoring phase of the process life cycle. This closes the gap that currently exists which treats these as independent phases through the use of different tools and models. The second contribution of this research is an IT implementation that leverages the process, event and business parameter constructs defined. The successful implementation and evaluation of iWISE using a Laboratory Testing process observed from a local hospital demonstrated that it is possible to both formally model and automate the process of data collection for monitoring a process. Cycle time and utilization measurements are the minimal sets of metrics that can be captured and monitored. There are two important monitoring functions deployed for the Laboratory Testing process. The first is the ability to measure and monitor Six Sigma measurements at frequent intervals. The second is the ability to monitor parameters as events are processed by the iWISE software. In both cases, e-mail alerts are generated and sent to subscribers where out-of-bounds situations or events are detected. Automated monitoring for the Laboratory Testing process has been achieved through the implementation of the constructs and technology contributed by this research. On a final note, the contribution from this research can be used to extend the concepts already developed as part of process definition languages such as BPDM and BPMN. In particular, BPDM provides constructs for start, end and exceptional events and even considers these as “event types”. Actual events are termed “occurrences”. The concept of BPDM events relates to messages passed between collaborating parties in orchestration or choreography

53
Claire Costello Owen Molloy
A process model to support automated measurement and detection of out-of-bounds events in a hospital laboratory process
Journal of Theoretical and Applied Electronic Commerce ResearchISSN 0718–1876 Electronic Version VOL 4 / ISSUE 2 / AUGUST 2009 / 31-54 © 2009 Universidad de Talca - Chile
This paper is available online at www.jtaer.com DOI: 10.4067/S0718-18762009000200004
processes. The design artifacts produced by this research extends the current knowledge base for process modelling and pushes the boundaries for what is already possible from a data gathering and metric calculation perspective. The addition of business parameters to such languages is also an area for exploration.
References [1] Mari Abe, Jun-Jang Jeng and Teruo Koyanagi, Authoring Tool for Business Performance Monitoring and
Control, in Proceedings IEEE International Conference on Service Oriented Computing and Applications (SOCA'07) Newport Beach, California, IEEE, 2007. pp. 107-113.
[2] Cary W. Adams, Praveen Gupta and Charles E. Wilson, Six Sigma Deployment, Butterworth Heinmann of Elsevier Science, 2003.
[3] Jiju Antony, Six sigma for service processes, Business Process Management Journal, vol. 12, no. 2, pp. 234-248, 2006.
[4] BPMI.org. (2004, May) Business Process Modelling Notation (BPMN) v1.0. [Online]. Available http://www.bpmi.org/specifications.htm
[5] Michele Cantara, Eric Deitert, Bill Rosser, David Norton and David W. McCoy, Predicts 2008: Business Process Management Alters Business and IT Collaboration, Gartner Research (G00151878), 2007.
[6] Surajit Chaudhuri and Umeshwar Dayal An overview of data warehousing and OLAP technology, SIGMOD Record, vol. 26, no. 1, pp. 65-74, 1997.
[7] Joseph M. DeFee. (2004, February) Business Activity Monitoring and Simulation. [Online]. Available http://www.bptrends.com
[8] Shiwa S. Fu, Trieu C. Chieu, Jih-Shyr Yih and Santhosh Kumaran, An Intelligent Event Adaptation Mechanism for Business Performance Monitoring, IEEE International Conference on e-Business Engineering (ICEBE'05), Beijing, China, 2005.
[9] Matteo Golfarelli, Stefano Rizzi and Iuris Cella, Beyond Data Warehousing: What's Next in Business Intelligence, 7th ACM International Workshop on Data Warehousing and OLAP, Washington DC, USA, 2004, pp. 1-6.
[10] Richard Hackathorn. (2002, November) Current Practices in Active Data Warehousing. [Online]. Available http://www.bolder.com/pubs/NCR200211-ADW.pdf
[11] Barbara von Halle, Business Rules Applied: Building Better Systems with the Business Rules Approach, New York: John Wiley & Sons, 2001.
[12] H. James Harrington, Business Process Improvement: The Breakthrough Strategy for Total Quality, Productivity and Competitiveness, McGraw-Hill, 1991.
[13] Ian Horrocks, Peter F. Patel-Schneider, Harold Boley, Said Tabet, Benjamin Grosof and Mike Dean. (2004, May) SWRL: A Semantic Web Rule Language Combining OWL and RuleML. [Online]. Available http://www.w3.org/Submission/SWRL/
[14] W. H. Inmon, Building Data Warehouses, John Wiley and Sons, 2006. [15] Minsu Jang and Joo-Chan Sohn, Bossam: An Extended Rule Engine for OWL Inferencing, Rules and Rule
Markup Languages for the Semantic Web. Third International Workshop, RuleML 2004, Hiroshima, Japan, 2004, pp. 128-138.
[16] Jun-Juan Jeng, Henry Chag and Jen-Yao Chung, A Policy Framework for Business Activity Management, IEEE International Conference on E-Commerce (CEC'03), Newport Beach, California, 2003.
[17] David Luckham, The Power of Events, Pearson Education Inc., Addison-Wesley, 2002. [18] Carolyn McGregor and J. Mikael Eklund, Real-Time Service-Oriented Architectures to Support Remote Critical
Care: Trends and Challenges, Annual IEEE International Computer Software and Applications Conference (COMPSAC), Los Alamitos, CA., USA: IEEE Computer Society, 2008, pp. 1199-1204.
[19] Jan Mendling and Gustaf Neumann, A Comparison of XML Interchange Formats for Business Process Modelling, WfMC Workflow Handbook 2005, Ed. Layna Fischer Lighthouse Point, Florida: Future Strategies Inc., 2005, pp. 185-198.
[20] Jan Mendling and Markus Nuttgens, XML interchange formats for Business Process Management, International Journal of Information Systems and E-Business Management, pp. 217-220, 2006.
[21] Henry Morrie, Dan Vesset, Bod Blumstein and Kathleen Wilhide, BAM, Real-Time and Event-based BI: An Application Perspective, DM Review, vol. 13, no. 9, pp. 55-57, 2004.
[22] Diaz Nesamoney, BAM: Event-driven Business Intelligence for the Real-Time Enterprise, DM Review, vol. 14, no. 3, 38-40, 2004.
[23] OASIS. (2007, April) Business Process Execution Language for Web Services, Version 2.0. [Online]. Available http://docs.oasis-open.org/wsbpel/2.0/OS/wsbpel-v2.0-OS.html
[24] OMG. (2008, July) Business Process Definition Metamodel (BPDM), Version 2.0. [Online]. Available http://www.omg.org/cgi-bin/doc?dtc/08-05-10
[25] Martin Ould, Business Processes, West Sussex, England: Wiley and Sons Ltd, 1995. [26] Florian Rosenberg and Schahram Dustdar, Design and Implementation of a Service-Oriented Business Rules
Broker, in Proceedings of the 2005 Seventh IEEE International Conference on E-Commerce Technology Workshops (CECW'05), Munich, Germany, 2005.
[27] J. Shao and C. J. Pound, Extracting business rules from information systems, BT Technology Journal, vol. 17, no. 4, 1999.

54
Claire Costello Owen Molloy
A process model to support automated measurement and detection of out-of-bounds events in a hospital laboratory process
Journal of Theoretical and Applied Electronic Commerce ResearchISSN 0718–1876 Electronic Version VOL 4 / ISSUE 2 / AUGUST 2009 / 31-54 © 2009 Universidad de Talca - Chile
This paper is available online at www.jtaer.com DOI: 10.4067/S0718-18762009000200004
[28] Alec Sharpe and Patrick McDermott, Workflow Modelling: Tools for Process Improvement and Application Development, Norwood, MA.: Artech House, 2001.
[29] Bill Smith, Making war on defects: Six-sigma design, IEEE Spectrum, vol. 30, no. 9, pp. 43-47, 1993. [30] Michael Stacey and Carolyn McGregor, Temporal abstraction in intelligent clinical data analysis: A survey,
Artificial Intelligence in Medicine, vol. 39, no. 1, pp. 1-24, 2007. [31] Martin Suntinger, Hannes Obweger, Josef Schiefer and M. Eduard Groller, The Event Tunnel: Interactive
Visualization of Complex Event Streams for Business Process Pattern Analysis, in Proceedings IEEE VGTC Pacific Visualization Symposium 2008 (PacificVis) Kyoto, Japan, 2008, pp. 111-118.
[32] Kepa Mendibil Telleria, Trevor J. Turner and Umit S. Bititci, Measuring and Improving Business Process Reliability, International Journal of Business Performance Management, vol. 4, no. 1, pp. 76-94, 2002.
[33] Olegas Vasilecas and Diana Bugaite, Business Rules Elicitation in the Process of Enterprise Information System Development, in Proceedings International Conference on Enterprise Information Systems, Paphos, Cyprus, 2006.
[34] Gerd Wagner, How to Design a General Rule Markup Language, in Proceedings XML Technologies for the Semantic Web Workshop (XSW2002), Berlin, Germany, 2002.
[35] L. Zeng, H. Lei, M. Dikun, H. Chang, K. Bhaskaran and J. Frank, Model-driven Business Performance Management, in Proceedings IEEE International Conference on e-Business Engineering, 2005 (ICEBE 2005), Beijing, China, 2005, pp. 295-304.