Embed Size (px)
Citation preview
Contents lists available at ScienceDirect
Climate Services
journal homepage: www.elsevier.com/locate/cliser
Original research article
A process-based statistical seasonal prediction of May–July rainfallanomalies over Texas and the Southern Great Plains of the United States
D. Nelun Fernandoa, Sudip Chakrabortyb,⁎, Rong Fub, Robert E. Macea,1
aWater Science & Conservation, Texas Water Development Board, Austin, TX, USAbDepartment of Atmospheric and Ocean Sciences, University of California-Los Angeles, CA, USA
A R T I C L E I N F O
Keywords:DroughtRainfall forecastTexasEarly warning
A B S T R A C T
With the aim of providing actionable drought early warning information that water managers and reservoiroperators in Texas could use to implement drought contingency triggers on water supply sources, we havedeveloped a statistical seasonal prediction system using a canonical correlation analysis prediction model topredict rainfall from May through July (MJJ), the main rainfall season over much of Texas and the SouthernGreat Plains. The statistical model is trained with data between 1982 and 2005 using standardized anomalousgeopotential height at 500 hPa, convective inhibition energy, and soil moisture content in April as the predictorsto generate tercile categorical forecasts of MJJ rainfall. Based on commonly used forecast skill metrics, thisstatistical prediction system provides 20–60% higher skill than that obtained from dynamical seasonal forecasts,and the exceeds skill due to the persistence of MJJ rainfall anomalies over Texas, western Louisiana, Oklahomaand the Southern Kansas. 2011 hindcast shows that below-normal MJJ rainfall anomalies comparable to thoseobserved over most of the region. The forecasts for 2014 captured the above-normal MJJ rainfall anomalies asobserved in that year. The forecasts since 2014 have shown acceptable prediction skills at one-to-three months’lead-time. We have also extended the lead-time to generate probabilistic MJJ rainfall forecasts from Januarythrough March using a hybrid dynamical-statistical forecast scheme. The predictions have been used by theTexas Water Development Board to inform the Texas State Drought Preparedness Council and to support theimplementation of drought contingency triggers for water supply sources by stakeholders, such as river au-thorities.
Practical Implications.We have developed a hybrid dynamical-statistical rainfall
forecast tool to enhance the reliability of the summer droughtearly warning over Texas and Southern Great Plains region of theUnited States. May and June are the wettest months across muchof Texas and southern Great Plains region. July is the start of therainfall season for the western part of the state. Failure of theMay–July rains is an indicator that Texas is in the throes of asummer drought. Such a drought could worsen in August, gen-erally the driest and hottest month of the year over much of thestate. Improving seasonal forecasts of May–July rainfall overTexas thus serves as an early warning of the likelihood of summerdrought over the state. Unfortunately, dynamical climate modelshave virtually no skill in predicting rainfall in this season overTexas and Southern Great Plains (Hao et al., 2018; Infanti andKirtman 2014; Livneh and Hoerling 2016; Mo and Lyon 2015;
Slater et al. 2016). The dynamical-statistical prediction modelreported in this study was developed at the request of the TexasWater Development Board. Its predictions have shown to be ofdirect utility for summer drought early warning over Texas.
The hybrid dynamical-statistical rainfall forecast tool wasdesigned, developed, and tested in collaboration with the TexasWater Development Board, which is the state agency responsiblefor collecting and disseminating water data, compiling the statewater plan based on sixteen regional water plans, and providinglow-cost financing for water, wastewater, and flood mitigationprojects. The model is based on our previous research, also un-dertaken in consultation with the Texas Water DevelopmentBoard, on the predictability of drought over Texas.
The impetus for developing such a tool came on the heels ofthe 2011 drought over the state, which was the worst one-yeardrought on record. In response to the 2011 drought over Texas,the Texas Administrative Code § 358.3 (1) on Guidance Principlesfor the State Water Plan Development (http://txrules.elaws.us/rule/
https://doi.org/10.1016/j.cliser.2019.100133Received 24 September 2018; Received in revised form 23 August 2019; Accepted 16 October 2019
⁎ Corresponding author.E-mail address: [email protected] (S. Chakraborty).
1 Current affiliation: The Meadows Center for Water and the Environment, USA.
Climate Services 16 (2019) 100133
Available online 14 November 20192405-8807/ © 2019 The Author(s). Published by Elsevier B.V. This is an open access article under the CC BY-NC-ND license (http://creativecommons.org/licenses/BY-NC-ND/4.0/).
T
title31_chapter358_sec.358.3) was modified to state that: “Thestate water plan shall provide for the preparation for and re-sponse to drought conditions”. These rule changes require allregional water plans to have a chapter dedicated to drought re-sponse information, activities, and recommendations. With theserule modifications, it became a requirement, in 2012, that allregional water planning groups to include a chapter on droughtmanagement with the aim of implementing short-term waterdemand reductions in the face of impending or existing droughtconditions. Each water user group in a water planning region isrequired to develop drought contingency plans and drought ac-tion triggers for their respective water supply sources. Water usergroups need to consult existing information on impending orcurrent drought conditions before deciding on whether to im-plement drought contingency triggers, which set in place volun-tary or mandatory water use restrictions. Tools such as theMay–July seasonal rainfall forecast provide water user groupswith information on impending drought conditions. Such in-formation has been used to aid their decisions on whether to planfor short-term water supply reductions.
Given the improvement in prediction skills demonstrated bythe hybrid dynamical-statistical forecast, the Texas WaterDevelopment Board has been issuing county-level probabilisticrainfall forecasts for the May–July season, based on the hybridforecast system, since 2016 via https://waterdatafortexas.org/drought/rainfall-forecasts. Archives of probabilistic forecasts andhindcasts of May–July rainfall, obtained using the statisticalforecast model, are also available at this website.
In summary, we identified through user consultation, the keyseason in which having a skillful rainfall forecast would improvedecision-making in the water management sector. We workedwith an interdisciplinary team that included climate scientists,hydrologists, water managers, river authorities and developers ofthe scientific applications to provide the rainfall forecast via aninterface that decision makers in the water sector across Texasconsult for drought information. Through this interface, we havepresented the forecast as county-level and Hydrological Unit Code(HUC) level 8 categorical probabilistic rainfall forecasts, and asquantitative forecasts with associated probabilities of exceedancecurves so that users, such as reservoir operators, could select thetype of forecast information of most relevance to their decisionneed. We have also provided detailed guidance on what types ofinformation the forecast conveys and a link through which userscould submit questions (https://waterdatafortexas.org/drought/rainfall-forecast-info) on the tool. The web interface is constantlybeing improved with feedback from users such as river authoritiesin the state. For example, we included the provision of the rainfallforecast by the U.S. Geological Survey’s Hydrological Unit Code(HUC) 8 level watershed regions within Texas based on feedbackfrom the Brazos River Authority of Texas. The steps we havetaken in designing, testing, sharing, communicating, and im-proving the rainfall forecast tool conform to the key steps neededfor the development of a climate service prototype that is tailoredto fit user requirements (Christel et al. 2018).
1. Introduction
The U.S. Southern Great Plains is an important region for food andenergy production. The value of agriculture in the region exceeds tensof billions of dollars (Steiner et al. 2018). However, this region is alsoprone to extreme droughts. Recent studies suggest that strong summerdroughts over the U.S. Southern Great Plains (110°W-92°W and 24°N-40°N) are often characterized by a rapid intensification of drynessduring late spring – early summer (Fernando et al. 2016). Dynamicalclimate models could not predict these droughts (Hoerling et al. 2014;Kumar et al. 2013; Seager et al. 2014) two–three months in advanceand underestimate rainfall variance (Kam et al. 2014) in part owing totheir limitations in representing summertime convection and land-sur-face feedbacks (Dai and Trenberth 2004; Wang et al. 2015). In fact,
three-month lead time seasonal rainfall forecasts from dynamicalforecast models show less skill than the autocorrelation of rainfallanomalies (Hoerling et al. 2014; Quan et al. 2012).
Early warnings of May–July (MJJ) rainfall anomalies relative to thehistorical mean over the Southern Great Plains are essential for droughtresiliency planning in agriculture, water management, energy, andforestry, and for supporting emergency management. For example, animproved MJJ rainfall anomalies can enable early initiation of droughtprotocols for wildfire prevention, stocking up on drinking water sup-plies, restriction of non-essential water use, early action to curtailevaporative water loss from water supply reservoirs, etc. The improvedseasonal prediction of MJJ rainfall anomalies reported in this studyenables the stakeholders to implement water conservation, and acquireneeded permits and supplies for drought risk reduction and wildfirepreparedness planning with one-to-three months’ lead-time, whichcould reduce the economic cost and structural damage from droughtand wildfires.
What causes late spring - early summer or MJJ drought over the USSouthern Great Plains? Droughts in Texas are generally associated withLa Niña-induced cooler sea surface temperature (SST) anomalies(Ropelewski and Halpert 1986, 1987; Schubert et al. 2009). Establishedin the fall, cooler than normal SST anomalies contribute to winterdrought over Texas by causing a poleward displacement of the sub-tropical jet stream (Eichler and Higgins 2006; Kousky 1989). In addi-tion, Fernando et al. (2016) have observed that dry springs play a pi-votal role in the onset of severe-to-extreme summer drought events overTexas and the Great Plains, consistent with past case studies (Namias1982; Seager et al. 2014). In particular, the advection of warm and drywesterly winds in the lower troposphere from the Mexican plateau inApril can increase temperature at 700 hPa, which in turn increasesconvective inhibition energy (CIN, negative buoyancy in the lowertroposphere) (Fernando et al. 2016; Ryu and Hayhoe 2017a,b). Thesefactors inhibit the development of convective systems during the onsetof summer rainfall and are the main contemporaneous cause of droughtduring June through August over Texas (Fernando et al. 2016; Myoungand Nielsen-Gammon 2010a). Thus, these studies concluded that anenhanced CIN in the spring is an important precursor for summerdrought over the region.
Only half of the La Niñas lead to summer droughts over the US GreatPlains (Pu et al. 2016). Thus, La Niña alone is not a good predictor ofthe summer droughts. Rather, Fernando et al. (2016) shows that about12 out of 13 summer droughts over the US Great Plains since 1950 werepreceded by a dry spring. They attribute such a spring to summermemory to land surface feedbacks, based on many previous studies(Hong and Kalnay 2002; Lyon and Dole 1995). For example, Kosteret al. (2004) using simulations show that soil moisture and precipitationare strongly coupled over the Central United States, including theSouthern Great Plains. The lack of precipitation from winter throughearly-spring leads to significant cumulative soil moisture deficits, areduction in evapotranspiration, and an increase in sensible heating aswell as surface temperature to balance the decrease of evapo-transpiration (Fernando et al. 2016). Dry soil owing to the precipitationdeficit provides a positive feedback and further enhances such deficits(Mueller and Seneviratne 2012). Such a positive land surface feedbackmanifests itself as a significant correlation between dry soil moistureanomalies and lagged 500 hectoPascals (hPa) geopotential heightanomalies (2–3weeks) over the South-Central United States (Fernandoet al., 2016). In addition to the local feedbacks, a persistent westwardexpansion of the North Atlantic Subtropical High over the region couldsuppress convection over the region (Ryu and Hayhoe 2017b). Dry soilmoisture, reduced cooling owing to evapotranspiration along with ahigh pressure raise the surface temperature, convective inhibition overthe domain and lead to a reduction in precipitation.
This study aims to apply the above discussed predictive under-standing to improve probabilistic prediction of MJJ rainfall anomaliesby introducing a statistical forecast system based on multivariate
D.N. Fernando, et al. Climate Services 16 (2019) 100133
2
Empirical Orthogonal Function (EOF) and Canonical CorrelationAnalysis (CCA) provided by the Climate Prediction Toolkit (Mason andTippet, 2016). Our predictor variables are based on our understandingof these key processes responsible for the initiation and persistence ofrainfall deficits. We show the sensitivity of our statistical model skills tovarious input datasets, compare the statistical forecast skill with thoseof the dynamical forecasts, and assess the skill of hindcasts of MJJrainfall anomalies for known dry and near-normal years over Texas andthe Southern Great Plains region. We also discuss the steps we took toprovide the forecasts from our statistical model through a website thatwas designed and updated with continuous user feedback.
2. Datasets
We used monthly 1˚x1˚ rainfall from the CPC global land pre-cipitation dataset (Chen et al. 2002) to derive seasonal rainfall for theperiod 1982–2014 (https://www.esrl.noaa.gov/psd/data/gridded/data.unified.daily.conus.html).
We also used anomalous monthly 500 hPa geopotential height,temperature at 700 hPa, 2-meter dewpoint temperature and 0–10 cmdepth liquid volumetric soil moisture (non-frozen) for March, April, andMarch-May (MAM) from the National Centers for EnvironmentalPrediction (NCEP) Climate Forecast System Reanalysis (CFSR) for theperiod of 1982–2010 (Saha et al. 2010), and the monthly values of thesame fields derived from the 6-hourly Climate Forecast System version2 (CFSv2) real-time data for the period 2011–2014 (Saha et al. 2014).These CFSR and CFSv2 data are obtained from the Data Library of theInternational Research Institute for Climate and Society (http://iridl.ldeo.columbia.edu).
The latitudinal means were removed from the 500 hPa geopotentialheight data. CIN is calculated by subtracting temperature at the 700 hPapressure level from 2m dew point temperature following (Myoung andNielsen-Gammon 2010b).
To test the sensitivity of the prediction skills to the uncertainty ofdata for the predictors, we used 500 hPa geopotential height and tem-perature at 700 hPa from monthly means of analyzed state meteorologyproduct (MAIMNPANA, https://cmr.earthdata.nasa.gov/search/concepts/C1274767784-GES_DISC); relative humidity and air tem-perature at 925 hPa from the 3-hourly instantaneous meteorologyproduct (MAI3CPASM); and root zone soil wetness data from themonthly mean land surface diagnostics product (MATMNXLND) forApril 1982–2013 from the National Aeronautics and SpaceAdministration (NASA) Modern Era Retrospective-analysis for Researchand Applications (MERRA) (Rienecker et al. 2011). Monthly dew pointis derived using the 3-hourly relative humidity and air temperaturefields. The latitudinal means are removed from the 500 hPa geopoten-tial height data. MERRA reanalysis is available at OPeNDAP/DODSaccess to the NASA GES DISC GrADS data server (https://goldsmr3.gesdisc.eosdis.nasa.gov/opendap/).
To test the sensitivity of the prediction skill to soil moisture inputand the potential improvement of prediction skill using satellite ob-servations of the soil moisture anomalies, we also used daily soilmoisture, aggregated to monthly values, from the merged active andpassive microwave retrievals product of the European Space AgencyClimate Change Initiative Essential Climate Variable Soil Moisture(ECV-SM) dataset version 1 (http://www.esa-soilmoisture-cci.org; (Liuet al., 2011, 2012) for the period 1982–2010. These data are availableat 25 km resolution.
To compare the skills of the statistical prediction model to those ofthe ensemble seasonal prediction by dynamical models, we obtainedthe ensemble mean rainfall predictions of all the ensemble members(listed in parentheses) of seven models that participated in the NorthAmerican Multi-model Ensemble Project (NMME, Kirtman et al., 2014).These models are the CMC1-CanCM3 (10), CMC2-CanCM4 (10), COLA-RSMAS-CCSM3 (6), GFDL-CM2p1-aer04 (10), GFDL-CM2p5-FLOR-A06(12), NASA-GMAO-062012 (12), and CFSv2 (28). The skills of these
ensemble rainfall predictions for MJJ during the period of 1982–2010are compared to those of the statistical prediction. These can also bedownloaded from http://iridl.ldeo.columbia.edu.
All data fields cover the domain 24°N-40°N and 110°W to 92°W,referred to in this study as the Texas and Southern Great Plains domain.All the data fields were gridded to 1° horizontal resolution using bi-linear interpolation.
3. Statistical prediction tool and forecast products
3.1. Computing the predictor and predictand inputs for the statisticalforecast model:
We use datasets over a period of 1982–2005 to train the statisticalprediction model. First, we convert all the predictor variables (CIN, soilmoisture, and 500 hPa geopotential height) into standardized anoma-lies to highlight the rainfall anomalies relative to their local variabilityand to minimize the impacts of data biases. The predictor variables aresubjected to multivariate EOF analysis using the Singular ValueDecomposition (SVD) algorithm. Multivariate EOF of the predictorvariables enables the extraction of the most coherent spatial and tem-poral variances in a dataset (Lorenz 1956) and maximize the explainedcovariance. The leading modes of the multivariate EOF analysis capturethe largest co-variability found in the original dataset (Wilks, 2006). Weretained the first two EOF modes, accounting for at least 70 percent ofthe variance in the predictor fields. We then applied the Varimaxmethod (Kaiser 1958) to rotate the first two multivariate EOF modes(Richman 1986). The rotated EOF modes are linear combinations of thetwo orthogonal multivariate EOF modes and represent interrelatedclusters (Barnston and Livezey 1987) of the predictor fields. The code isavailable at https://github.com/twdb/wdft-drought/tree/master/dataand can be accessed by sending a permission request to [email protected].
We use standardized anomalous soil moisture, geopotential height,and CIN during April as inputs to the CCA statistical model for pre-dicting rainfall in late spring - early summer (May-July, or MJJ). Themonthly standardized anomaly at each grid point was calculated bysubtracting the monthly mean for a given month from the observedvalue at a grid point and, then dividing by the monthly standard de-viation for that grid point. Each grid point has twelve monthly meansand standard deviations, respectively. This method of deriving monthlyanomalies removes seasonality.
We input the spatial loadings of the rotated multivariate EOF modesas predictor variables to a Canonical Correlation Analysis (CCA) (vonStorch and Zwiers, 2002) using the Climate Predictability Tool (CPT,http://iri.columbia.edu/our-expertise/climate/tools/cpt/, (Mason andTippet 2016; Simon J. Mason 2017). To compute the skills and theprobabilities of the occurrences of drought, we have used CPT version14. We have also undertaken the analysis using CPT versions 14 and 15.Therefore, the analysis can be replicated using the latest CPT version.We arrange the yearly rotated values for the first two modes and use asX input to the CPT. For Y input, we use the chronological rainfall valuesfor May-June period. CCA maximizes the correlations between theprincipal components of the leading multivariate EOF of the predictorsand the principal components of the predictand. In doing so, it identi-fies a sequence of pairs of patterns between the predictors and thepredictand fields (Wilks 2006). CCA has been shown to be an effectiveapproach for forecasting SSTs (Landman and Mason 2001), seasonaltemperatures over land (Shabbar and Barnston 1996), and ENSO epi-sodes (Barnston and Vandendool 1993). Thus, we choose CCA forconstructing our statistical model for seasonal forecast of MJJ rainfallanomalies.
3.2. Hybrid dynamical-statistical forecast
For the hybrid dynamical-statistical forecast, we use forecasts of
D.N. Fernando, et al. Climate Services 16 (2019) 100133
3

predicted values of April atmospheric circulation patterns and soilmoisture over Texas known to influence May–July rainfall at 3-month(January), 2-month (February), and 1-month (March) lead times. Thepredictions are obtained from the Climate Forecast System version 2(CFSv2, Saha et al., 2014), which is the operational dynamical seasonalforecast model of the National Oceanic and Atmospheric Administra-tion-National Centers for Environmental Prediction. The hybrid dyna-mical-statistical forecast is based on the Model Output Statistics wherethere is a lag time between the predictor and the predictand unlike thePerfect Prognosis approach, where the is no lag time between thepredictor and the predictand.
3.3. Skill scores
Forecast skill assessment was undertaken using cross-validatedforecasts (Barnston and Ropelewski 1992; Michaelsen 1987) over a24 year training period from 1982 through 2005, with a 3-year cross-validation window. The strength of the predictor fields was assessedbased on the goodness-of-fit between the cross-validated forecasts andthe observation time series (CPC precipitation measurements). Theforecasts are available as deterministic forecasts (i.e. for rainfallanomalies) or as categorical probabilistic forecasts (i.e. probabilities ofwhether seasonal rainfall will be below-, near-, or above-normal).
Skills of the statistical models are assessed in two steps. First, theskill of deterministic forecasts of seasonal cumulative rainfall is as-sessed using Spearman’s Ranked Correlation between observations andcross-validated rainfall at each grid point. Second, the skill of prob-abilistic forecasts was assessed using the Two Alternative Forced Choicescore for forecast categories (2AFC; (Mason and Weigel 2009), the areaunder the Relative Operating Characteristics curve for the below-normal category (ROC; (Mason and Graham 2002), and the RankedProbability Skill Score (RPSS, Muller et al., 2005), again at each gridpoint. The 2AFC score ranges from 0 to 100 percent. 2AFC scores> 50percent indicates that the forecast is able to discriminate beyondrandom guessing (Mason and Weigel 2009). The ROC compares hit rateversus false alarm of the prediction to those of random noise. The areaunder the curve represents the probability that the prediction is correctbeyond that by chance. The RPSS is used to explore how these skillscores compare to the mean square error in a probability space. RPSS isa widely used method to compute skills for ensemble forecasts. RPS iscalculated from a cumulative distribution. The difference in the ob-servation and the prediction is squared to calculate the score.
Given our interest in late spring - summer drought early warning,we use the ROC score to assess whether the statistical rainfall forecast isable to correctly discriminate the below-normal forecast category fromthe near-normal or above-normal forecast categories. The ROC scorealso ranges from 0 to 1 and only a score> 0.5 indicates that the fore-cast is able to discriminate beyond random guessing. For the RPSS, weadopted the subjective RPSS threshold of five percent (5%) as re-presenting “good skill” in a forecast after Goddard and Dilley (2005).set a subjective. We have used this threshold in the interpretation of theforecast skill from our statistical model.
To assess if statistical predictions can provide higher skills thanthose of the dynamical prediction, we also compare 2AFC, ROC, andRPSS for the three-month lead NMME forecasts of MJJ precipitationwith those scores obtained from the statistical forecast of MJJ rainfall,both initialized in April. The tercile probabilities for the NMME fore-casts were obtained using the GCM validation option in CPT, which letsthe user compare model output to observed data either on a station orgrid box basis.
3.4. Developing rainfall forecast products of use to Texas stakeholders
The Texas State Drought Preparedness Council, on page 32 of its2014 Drought Annex (https://www.preparingtexas.org/Resources/documents/State%20and%20Fed%20Plans/2014_04_04_Drought
%20Annex.pdf), states that: “Although drought is a slow moving in-cident, public information on forecasted or persistent drought condi-tions and impacts is extremely vital. The release of timely, consistentand effective public information helps all Texans understand threats,potential impacts, available services, funding options and timelines forresponse and recovery.” The MJJ rainfall forecast has direct utility toTexas’ Drought Annex.
The TWDB is a member of the Texas Drought Preparedness Counciland is responsible for providing monthly (or quarterly, if there is no on-going drought) updates on drought and water supply conditions in thestate. It has been providing real-time reservoir storage conditions,drought indices, water supply conditions, etc., via water-datafortexas.org since 2012. Given that the statistical model couldforecast summer rainfall over Texas and the Southern Great Plains re-gion in the spring with skill levels acceptable to decision makers, andbecause drought resilience within Texas could be enhanced through theprovision of advanced information for drought preparedness planning,the TWBD automated the rainfall forecast model and started providingprobabilistic forecasts of average May–July rainfall in each county inTexas from the beginning of May 2016. The forecasts were issued frommid-January through May 1 of each year. The forecasts are updated atthe beginning and middle of each month using forecasts of April pre-dictors initialized on January 15, February 1, February 15, March 1,and March 15. Forecast updates issued on April 1 and April 15 usereanalysis fields of April predictors from the CFSR dataset. The forecastsare, in effect, be summer drought forecasts at 6.5- and 6-month(January initial conditions), 5.5- and 5-month (February initial condi-tions), 4.5- and 4-month (March initial conditions), and 3.5 and 3-month (April initial conditions) lead times.
Drought management as a water management strategy is an interimstrategy designed to meet near-term needs through demand reductionuntil long-term water supply measures are implemented. Such astrategy typically targets a reduction in municipal water demand. In thelong-term it increases water use efficiency and serves more users. Newrules adopted for TWDB’s water planning process in 2012 (http://txrules.elaws.us/rule/title31_chapter358_sec.358.3) requires all re-gional water planning groups to include a chapter dedicated to droughtresponse information, activities, and recommendations. The waterplanning regions are required to seek better information on droughtaction-triggers, and to provide recommendations for each existingwater source (triggers and responses).
The TWDB collaborated with the Brazos River Authority, a keywater management and reservoir operations entity in Texas, to applythe rainfall forecast tool to provide guidance information on the like-lihood of reservoir storage dropping below drought trigger levels. Thisinformation could set in place drought response stage restrictions asdefined in drought contingency plans of water user groups in Texas.
We worked closely with the Brazos River Authority’s Water Services(BRA) staff in developing the reservoir storage forecast methodology.Engagement with BRA staff commenced in October 2015 when weasked them if they would be interested in working with the Texas WaterDevelopment Board on developing a test scenario of the application ofseasonal rainfall forecasts for reservoir storage forecasts. BRA staff wasvery receptive to our inquiry and was eager to collaborate with us. Wemet several times with them in person and had frequent communicationvia e-mail regarding datasets, forecast methodologies, and progressupdates. They also helped us identify test reservoirs, explained theirinformation needs related to drought contingency trigger implementa-tion, provided us with historic monthly diversion data for their re-servoirs, and provided us with diversion estimates for the forecastseasons.
BRA staff has let us know that they have been tracking the bi-weeklyrainfall, and have also let us know that they will be including therainfall forecast tool as a resource to be checked for drought initiationin their 2019 Drought Contingency Plan revision. We consider theirintention to include the tool in their Drought Contingency Plan update
D.N. Fernando, et al. Climate Services 16 (2019) 100133
4
as a major achievement of our effort to develop a climate service fordrought early warning in Texas. While working on the experimentalreservoir storage forecasts we realized that the probabilistic rainfallforecasts did not provide sufficient information by which to tailor thereservoir forecast. Exceedance probability plots provide information onthe probability of exceedance of a particular percentile, or percentageof normal, of rainfall. Such information is useful when designing a re-servoir forecast because it provides the user with information abouthow much drier or wetter a particular season is going to be. Suchquantitative (or deterministic) information is more useful to watermanagers than is information on only the likelihood of whether theseasonal will be above-, near-, or below-normal. Therefore, we devel-oped added functionality to the rainfall forecast tool to include graphsof rainfall exceedance probabilities for each county on the interactiverainfall forecast map. We also included the provision of the rainfallforecast by the U.S. Geological Survey’s Hydrological Unit Code (HUC)8 level watershed regions within Texas based on feedback from theBrazos River Authority of Texas.
4. Results
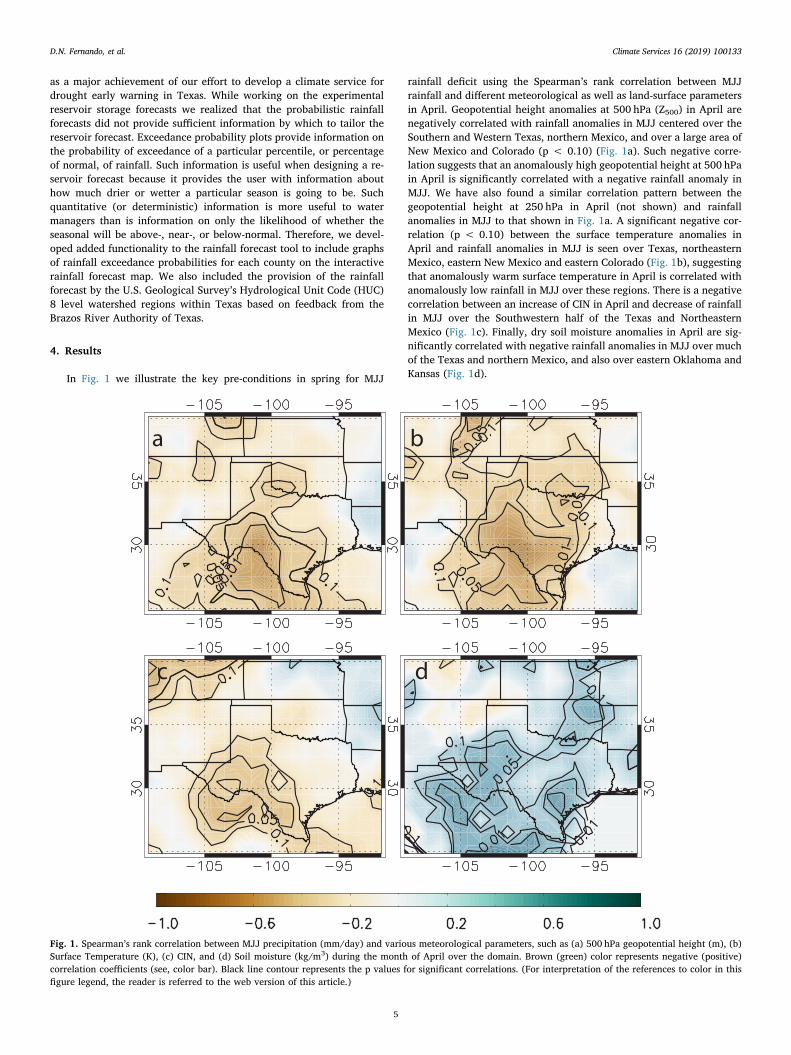
In Fig. 1 we illustrate the key pre-conditions in spring for MJJ
rainfall deficit using the Spearman’s rank correlation between MJJrainfall and different meteorological as well as land-surface parametersin April. Geopotential height anomalies at 500 hPa (Z500) in April arenegatively correlated with rainfall anomalies in MJJ centered over theSouthern and Western Texas, northern Mexico, and over a large area ofNew Mexico and Colorado (p < 0.10) (Fig. 1a). Such negative corre-lation suggests that an anomalously high geopotential height at 500 hPain April is significantly correlated with a negative rainfall anomaly inMJJ. We have also found a similar correlation pattern between thegeopotential height at 250 hPa in April (not shown) and rainfallanomalies in MJJ to that shown in Fig. 1a. A significant negative cor-relation (p < 0.10) between the surface temperature anomalies inApril and rainfall anomalies in MJJ is seen over Texas, northeasternMexico, eastern New Mexico and eastern Colorado (Fig. 1b), suggestingthat anomalously warm surface temperature in April is correlated withanomalously low rainfall in MJJ over these regions. There is a negativecorrelation between an increase of CIN in April and decrease of rainfallin MJJ over the Southwestern half of the Texas and NortheasternMexico (Fig. 1c). Finally, dry soil moisture anomalies in April are sig-nificantly correlated with negative rainfall anomalies in MJJ over muchof the Texas and northern Mexico, and also over eastern Oklahoma andKansas (Fig. 1d).
a b
c d
Fig. 1. Spearman’s rank correlation between MJJ precipitation (mm/day) and various meteorological parameters, such as (a) 500 hPa geopotential height (m), (b)Surface Temperature (K), (c) CIN, and (d) Soil moisture (kg/m3) during the month of April over the domain. Brown (green) color represents negative (positive)correlation coefficients (see, color bar). Black line contour represents the p values for significant correlations. (For interpretation of the references to color in thisfigure legend, the reader is referred to the web version of this article.)
D.N. Fernando, et al. Climate Services 16 (2019) 100133
5
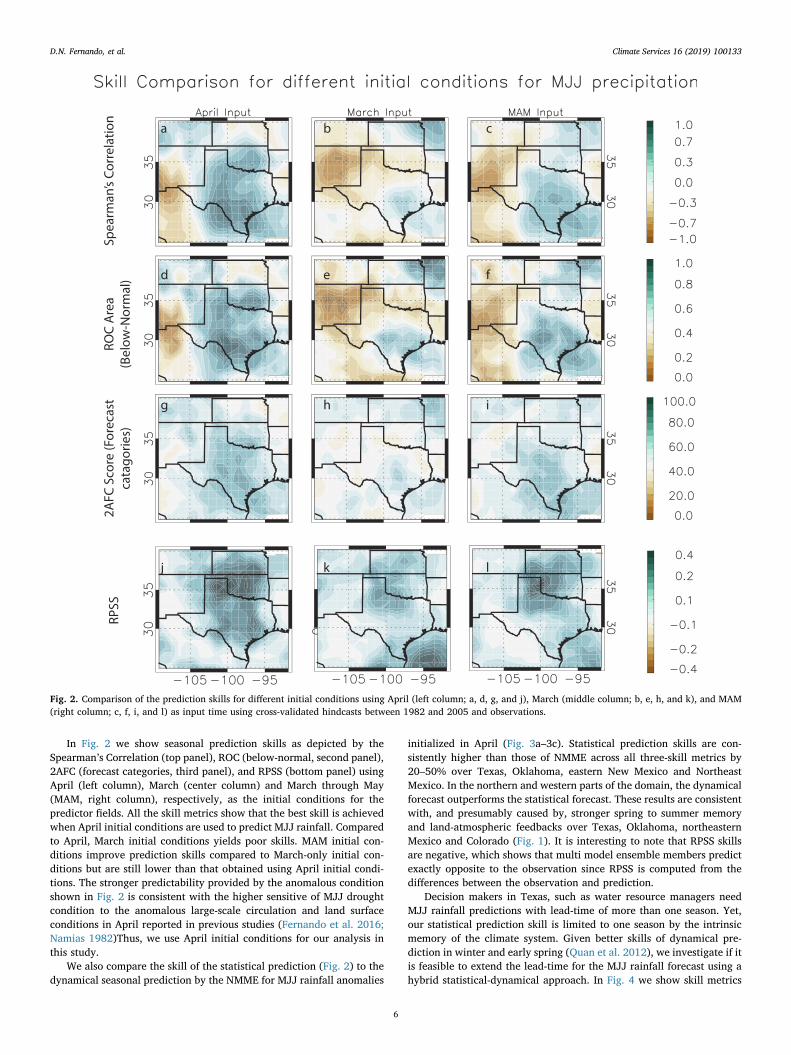
In Fig. 2 we show seasonal prediction skills as depicted by theSpearman’s Correlation (top panel), ROC (below-normal, second panel),2AFC (forecast categories, third panel), and RPSS (bottom panel) usingApril (left column), March (center column) and March through May(MAM, right column), respectively, as the initial conditions for thepredictor fields. All the skill metrics show that the best skill is achievedwhen April initial conditions are used to predict MJJ rainfall. Comparedto April, March initial conditions yields poor skills. MAM initial con-ditions improve prediction skills compared to March-only initial con-ditions but are still lower than that obtained using April initial condi-tions. The stronger predictability provided by the anomalous conditionshown in Fig. 2 is consistent with the higher sensitive of MJJ droughtcondition to the anomalous large-scale circulation and land surfaceconditions in April reported in previous studies (Fernando et al. 2016;Namias 1982)Thus, we use April initial conditions for our analysis inthis study.
We also compare the skill of the statistical prediction (Fig. 2) to thedynamical seasonal prediction by the NMME for MJJ rainfall anomalies
initialized in April (Fig. 3a–3c). Statistical prediction skills are con-sistently higher than those of NMME across all three-skill metrics by20–50% over Texas, Oklahoma, eastern New Mexico and NortheastMexico. In the northern and western parts of the domain, the dynamicalforecast outperforms the statistical forecast. These results are consistentwith, and presumably caused by, stronger spring to summer memoryand land-atmospheric feedbacks over Texas, Oklahoma, northeasternMexico and Colorado (Fig. 1). It is interesting to note that RPSS skillsare negative, which shows that multi model ensemble members predictexactly opposite to the observation since RPSS is computed from thedifferences between the observation and prediction.
Decision makers in Texas, such as water resource managers needMJJ rainfall predictions with lead-time of more than one season. Yet,our statistical prediction skill is limited to one season by the intrinsicmemory of the climate system. Given better skills of dynamical pre-diction in winter and early spring (Quan et al. 2012), we investigate if itis feasible to extend the lead-time for the MJJ rainfall forecast using ahybrid statistical-dynamical approach. In Fig. 4 we show skill metrics
Fig. 2. Comparison of the prediction skills for different initial conditions using April (left column; a, d, g, and j), March (middle column; b, e, h, and k), and MAM(right column; c, f, i, and l) as input time using cross-validated hindcasts between 1982 and 2005 and observations.
D.N. Fernando, et al. Climate Services 16 (2019) 100133
6

Fig. 3. NMME skill maps for MJJ rainfall anomalies initialized in April.
Fig. 4. Skill comparison maps for MJJ rainfall anomalies using initial conditions in (a) January-April (6 months lead), (b), February-April (5 months lead), (c) Marchand April (4months lead), and (d) April (4 months lead) .
D.N. Fernando, et al. Climate Services 16 (2019) 100133
7
for longer lead-time forecasts of MJJ rainfall. As expected, predictionskill decreases as forecast lead-time increases. However, despite theweakening of atmospheric memory with longer lead-time initial con-ditions, this hybrid dynamical-statistical prediction system begins toshow skills for the probabilistic predictions (> 0.5) as early as in Feb-ruary (Fig. 4b, the middle and right panels). Grid points with thehighest ROC and 2AFC scores lie within Texas and Oklahoma for theprobabilistic forecasts initialized with April inputs (Fig. 4d, middle andright panels). Deterministic forecast skill, RPSS (> 0.3), or the Spear-man’s correlation coefficient is also high (> 0.6) when we use April asthe initial condition. Thus, the hybrid dynamical-statistical predictionhas shown the potential to provide useful information to support de-cision-making in the water sector.
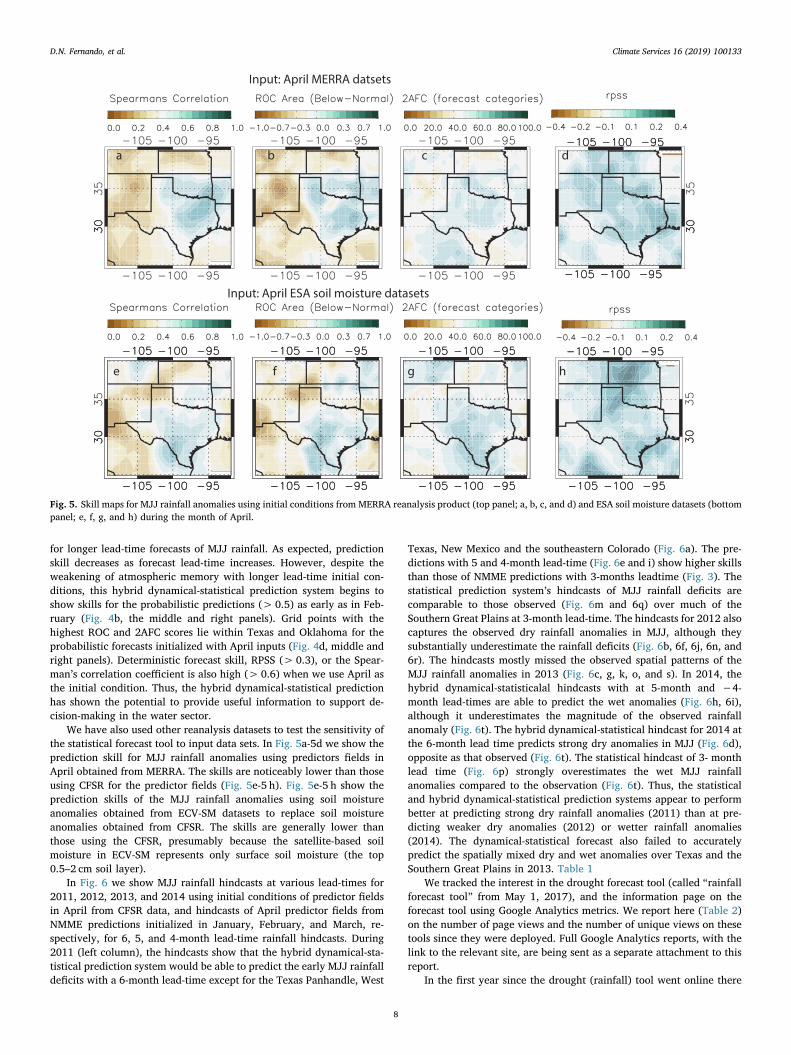
We have also used other reanalysis datasets to test the sensitivity ofthe statistical forecast tool to input data sets. In Fig. 5a-5d we show theprediction skill for MJJ rainfall anomalies using predictors fields inApril obtained from MERRA. The skills are noticeably lower than thoseusing CFSR for the predictor fields (Fig. 5e-5 h). Fig. 5e-5 h show theprediction skills of the MJJ rainfall anomalies using soil moistureanomalies obtained from ECV-SM datasets to replace soil moistureanomalies obtained from CFSR. The skills are generally lower thanthose using the CFSR, presumably because the satellite-based soilmoisture in ECV-SM represents only surface soil moisture (the top0.5–2 cm soil layer).
In Fig. 6 we show MJJ rainfall hindcasts at various lead-times for2011, 2012, 2013, and 2014 using initial conditions of predictor fieldsin April from CFSR data, and hindcasts of April predictor fields fromNMME predictions initialized in January, February, and March, re-spectively, for 6, 5, and 4-month lead-time rainfall hindcasts. During2011 (left column), the hindcasts show that the hybrid dynamical-sta-tistical prediction system would be able to predict the early MJJ rainfalldeficits with a 6-month lead-time except for the Texas Panhandle, West
Texas, New Mexico and the southeastern Colorado (Fig. 6a). The pre-dictions with 5 and 4-month lead-time (Fig. 6e and i) show higher skillsthan those of NMME predictions with 3-months leadtime (Fig. 3). Thestatistical prediction system’s hindcasts of MJJ rainfall deficits arecomparable to those observed (Fig. 6m and 6q) over much of theSouthern Great Plains at 3-month lead-time. The hindcasts for 2012 alsocaptures the observed dry rainfall anomalies in MJJ, although theysubstantially underestimate the rainfall deficits (Fig. 6b, 6f, 6j, 6n, and6r). The hindcasts mostly missed the observed spatial patterns of theMJJ rainfall anomalies in 2013 (Fig. 6c, g, k, o, and s). In 2014, thehybrid dynamical-statisticalal hindcasts with at 5-month and −4-month lead-times are able to predict the wet anomalies (Fig. 6h, 6i),although it underestimates the magnitude of the observed rainfallanomaly (Fig. 6t). The hybrid dynamical-statistical hindcast for 2014 atthe 6-month lead time predicts strong dry anomalies in MJJ (Fig. 6d),opposite as that observed (Fig. 6t). The statistical hindcast of 3- monthlead time (Fig. 6p) strongly overestimates the wet MJJ rainfallanomalies compared to the observation (Fig. 6t). Thus, the statisticaland hybrid dynamical-statistical prediction systems appear to performbetter at predicting strong dry rainfall anomalies (2011) than at pre-dicting weaker dry anomalies (2012) or wetter rainfall anomalies(2014). The dynamical-statistical forecast also failed to accuratelypredict the spatially mixed dry and wet anomalies over Texas and theSouthern Great Plains in 2013. Table 1
We tracked the interest in the drought forecast tool (called “rainfallforecast tool” from May 1, 2017), and the information page on theforecast tool using Google Analytics metrics. We report here (Table 2)on the number of page views and the number of unique views on thesetools since they were deployed. Full Google Analytics reports, with thelink to the relevant site, are being sent as a separate attachment to thisreport.
In the first year since the drought (rainfall) tool went online there
Fig. 5. Skill maps for MJJ rainfall anomalies using initial conditions from MERRA reanalysis product (top panel; a, b, c, and d) and ESA soil moisture datasets (bottompanel; e, f, g, and h) during the month of April.
D.N. Fernando, et al. Climate Services 16 (2019) 100133
8

were 876 unique views on the page. In the second year (May 1,2017–April 30, 2018) and the start of the third year (May 1–May 31,2018) there were 966 unique views on the page. This is a 10.27%
increase in the second year since the tool was launched. Similarly, therewas a 60.8% increase in unique views on the drought forecast/rainfallforecast information page in the second year. We interpret this increase
Fig. 6. Maps of statistical forecasts of rainfall anomalies based on initial conditions in (a-d) January (6months lead), (e-h), February (5months lead), (i-l) March(4months lead), and (m-p) April (3 months lead) for 2011–2014. (q-t) observed precipitation anomaly during 2011–2014 using CPC data sets. All anomalies areestimated based on 1982–2010 mean of hindcasts and observation.
D.N. Fernando, et al. Climate Services 16 (2019) 100133
9
in the number unique page views to represent an increased interest inthe forecast tool (and its associated information) and an increasedadoption of the tool by decision makers as a source of drought earlywarning information.
5. Conclusions and discussion
Rainfall during May-July (MJJ) has strong impacts on agricultureand water resource availability and demand over the Southern GreatPlains and Texas. However, predicting MJJ rainfall on the seasonalscale is especially challenging for dynamical weather-climate modelsover the Southern US Great Plains (Quan et al. 2012). To address thischallenge, we have developed a seasonal statistical and a dynamical-statistical prediction system based on the observed relationship be-tween spring anomalous atmospheric and land surface conditions andthe MJJ rainfall anomalies reported extensively in the literature. Thisstatistical prediction system is based on CCA (implemented using theIRI’s Climate Predictability Tool) and has the three key pre-conditionsin spring, i.e. 500 hPa geopotential height, the CIN index determined bythe difference in temperature between 700 hPa and dewpoint at thesurface, and soil moisture anomalies, as the predictor variables andmean MJJ rainfall anomalies as the predictand. The model is trainedusing observations for the period of 1982–2005. Our analysis showsthat the best skill between forecast and observed MJJ rainfall anomaliesis achieved by using April initial conditions of these three predictorvariables (Fig. 2). The predictand used in this paper is MJJ rainfallanomalies. The rainfall forecast can be provided either as a determi-nistic forecast of rainfall anomalies or as categorical probabilisticforecasts of the likelihood that MJJ rainfall will be below-, above, ornear-normal (e.g. https://waterdatafortexas.org/drought/rainfall-forecast).
The skill of this seasonal statistical prediction system, as measuredby the Spearman’s correlation coefficient, 2AFC, and ROC, is 20–60%higher than that of the dynamical predictions by NMME (Fig. 3). RPSSalso confirm that the best skills for MJJ rainfall prediction are achievedwhen April initial conditions are used. The highest skill scores are foundin Texas, Oklahoma, and northeastern Mexico. Hindcasts outside of thetraining period show that this prediction system would have predictedthe dry rainfall anomalies during MJJ of 2011 with the pattern and
magnitude similar to those observed, especially over Texas, Oklahoma,and northeastern Mexico. It also predicted wetter rainfall anomaliesduring MJJ in 2014, although substantially overestimated their mag-nitude.
We have also tested the sensitivity of the prediction skills for dif-ferent reanalysis and soil moisture datasets. The results suggest that theinputs (predictors) derived from the CFSR provide better predictionskills than those from MERRA and ESA-SM soil moisture data.
To address the need for water resource decisions, we further ex-plored a hybrid dynamical-statistical prediction system to predict MJJrainfall anomalies with 4–6months lead-time. This hybrid statistical-dynamic prediction system combines the strengths of the dynamicalpredictions of the large-scale atmospheric circulation and land surfacecondition in winter and spring with that of the statistical prediction ofMJJ rainfall anomalies. It uses the predicted 500 hPa geopotentialheight, the CIN index, and soil moisture anomalies in April by theNMME predictions initialized in January, February, and March, re-spectively. This system shows prediction skills up to 3–5month leadtime (Fig. 4). The hindcasts suggest that this hybrid dynamical-statis-tical prediction system would have predicted the 2011 and 2012 dryrainfall anomalies with up to 3–6-months lead-time. It could also pre-dict the observed wetter anomalies of 2014 with up to 3–5months’lead-time, although the prediction over-estimates the magnitude.
The combination of the statistical and hybrid statistical-dynamicprediction systems is able to provide an early warning of a drier-than-normal or wetter-than-normal late-spring– early-summer season withlead-time of up to 3–6-months. Given the prediction skills demonstratedby this system, the Texas Water Development Board has been issuingcounty-level probabilistic rainfall forecasts for the MJJ season in May of2016 via https://waterdatafortexas.org/drought/rainfall-forecast.These forecasts provide rainfall information, to assist water user groupsin the state in their implementation of drought contingency triggers fortheir water supply sources in the event of an impending MJJ drought.These forecasts provide a window of opportunity for improved forecastskills and predictions (Rodwell and Doblas-Reyes 2009) and have beenapplied to guide the implementation of drought contingency for watersupply reservoirs in Texas. These forecast tools available on Water Datafor Texas have been tailored to address climate information needs ofreservoir operators in Texas. In doing so, these seasonal rainfall
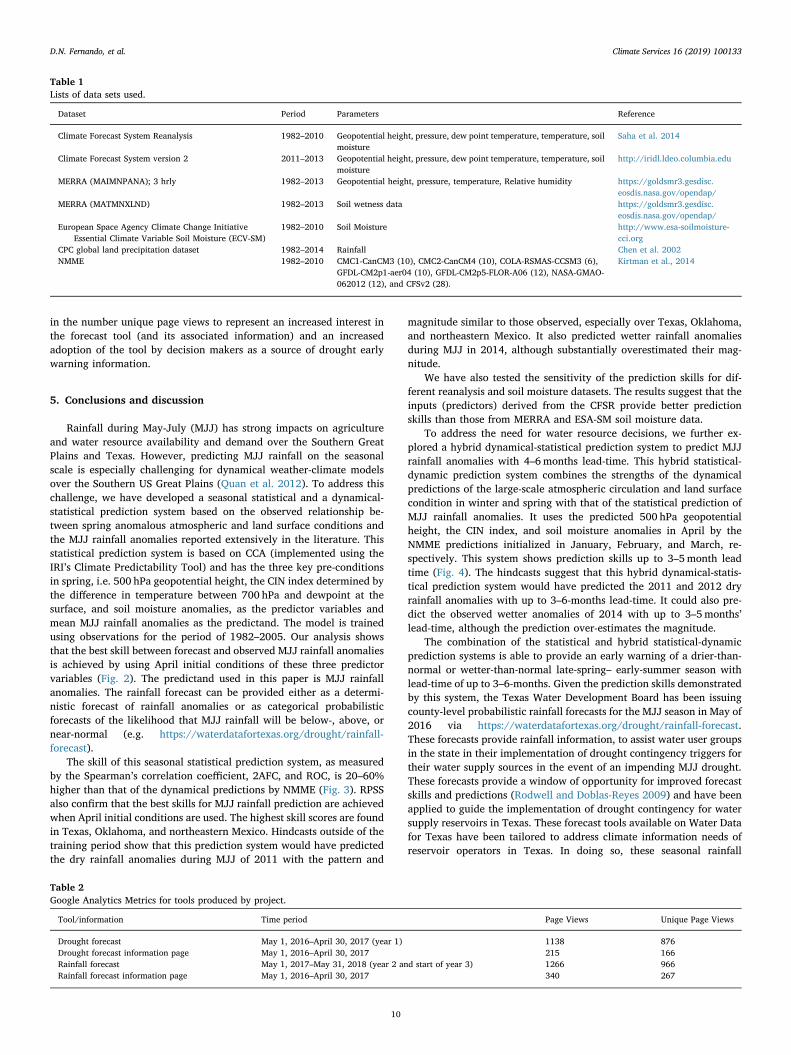
Table 1Lists of data sets used.
Dataset Period Parameters Reference
Climate Forecast System Reanalysis 1982–2010 Geopotential height, pressure, dew point temperature, temperature, soilmoisture
Saha et al. 2014
Climate Forecast System version 2 2011–2013 Geopotential height, pressure, dew point temperature, temperature, soilmoisture
http://iridl.ldeo.columbia.edu
MERRA (MAIMNPANA); 3 hrly 1982–2013 Geopotential height, pressure, temperature, Relative humidity https://goldsmr3.gesdisc.eosdis.nasa.gov/opendap/
MERRA (MATMNXLND) 1982–2013 Soil wetness data https://goldsmr3.gesdisc.eosdis.nasa.gov/opendap/
European Space Agency Climate Change InitiativeEssential Climate Variable Soil Moisture (ECV-SM)
1982–2010 Soil Moisture http://www.esa-soilmoisture-cci.org
CPC global land precipitation dataset 1982–2014 Rainfall Chen et al. 2002NMME 1982–2010 CMC1-CanCM3 (10), CMC2-CanCM4 (10), COLA-RSMAS-CCSM3 (6),
GFDL-CM2p1-aer04 (10), GFDL-CM2p5-FLOR-A06 (12), NASA-GMAO-062012 (12), and CFSv2 (28).
Kirtman et al., 2014
Table 2Google Analytics Metrics for tools produced by project.
Tool/information Time period Page Views Unique Page Views
Drought forecast May 1, 2016–April 30, 2017 (year 1) 1138 876Drought forecast information page May 1, 2016–April 30, 2017 215 166Rainfall forecast May 1, 2017–May 31, 2018 (year 2 and start of year 3) 1266 966Rainfall forecast information page May 1, 2016–April 30, 2017 340 267
D.N. Fernando, et al. Climate Services 16 (2019) 100133
10
predictions shown in this paper is an example of developing a climateservice to fill an information gap and meet to meet climate informationneeds related to drought from stakeholders in the water sector in Texas.
The statistical prediction system is mainly limited to spring andearly summer seasons (April-July) when drought memory is observed.In other seasons, dynamical predictions could out-perform this statis-tical prediction system, as large-scale dynamics of the atmosphere andoceanic forcing become more important in determining rainfallanomalies.
Acknowledgments
Drought early warning research at the University of Texas at Austinand the University of California Los Angeles is funded by the NASAIndicators for the National Climate Assessment Program (GrantsNNX16AN12G, NNX13AN39G), NOAA’s Climate Program Office’sModeling, Analysis, Predictions, and Projections Program (Grant AwardNA17OAR4310123) and the Jackson School of Geosciences. Droughtresearch at, and the provision of interactive rainfall forecasts to aidDrought Contingency Planning by, the Texas Water Development Boardhave been funded by the U.S. Army Corps of Engineers Texas WaterAllocation Assistance Program (Grant Award W45XMA12285923) andthe U.S. Bureau of Reclamation Drought Response Program (GrantAward R15AP00184). The research was also supported by the PostdocsApplying Climate Expertise Postdoctoral Fellowship Program from2011–2013, which was partially funded by NOAA’s Climate ProgramOffice and administered by the University Corporation for AtmosphericResearch Visiting Scientist Programs. Links to data sets used in thispaper can be found in Table 1. We also extend our thanks to Dr. BingPu, Dr. Ying Sun, and Dr. Binyan Yan for their help in this study.
References
Barnston, A.G., Livezey, R.E., 1987. Classification, Seasonality and Persistence of Low-Frequency Atmospheric Circulation Patterns. Mon. Weather Rev. 115, 1083–1126.
Barnston, A.G., Ropelewski, C.F., 1992. Prediction of Enso Episodes Using CanonicalCorrelation-Analysis. J. Climate 5, 1316–1345.
Barnston, A.G., Vandendool, H.M., 1993. A Degeneracy in Cross-Validated Skill inRegression-Based Forecasts. J. Climate 6, 963–977.
Chen, M.Y., Xie, P.P., Janowiak, J.E., Arkin, P.A., 2002. Global land precipitation: A 50-yrmonthly analysis based on gauge observations. J. Hydrometeorol. 3, 249–266.
Christel, I., Hemment, D., Bojovic, D., Cucchietti, F., Calvo, L., Stefaner, M., Buontempo,C., 2018. Introducing design in the development of effective climate services. Clim.Serv. 9, 111–121.
Dai, A., Trenberth, K.E., 2004. The diurnal cycle and its depiction in the CommunityClimate System Model. J. Climate 17, 930–951.
Eichler, T., Higgins, W., 2006. Climatology and ENSO-related variability of NorthAmerican extratropical cyclone activity. J. Climate 19, 2076–2093.
Fernando, D.N., Coauthors,, 2016. What caused the spring intensification and winterdemise of the 2011 drought over Texas? Clim. Dynam. 47, 3077–3090.
Goddard, L., Dilley, M., 2005. El Nino: Catastrophe or opportunity. J. Climate 18,651–665.
Hao, Z.C., Singh, V.P., Xia, Y.L., 2018. Seasonal Drought Prediction: Advances,Challenges, and Future Prospects. Rev. Geophys. 56, 108–141.
Hoerling, M., Coauthors,, 2014. Causes and Predictability of the 2012 Great PlainsDrought. B. Am. Meteorol. Soc. 95, 269–282.
Hong, S.Y., Kalnay, E., 2002. The 1998 Oklahoma-Texas drought: Mechanistic experi-ments with NCEP global and regional models. J. Climate 15, 945–963.
Infanti, J.M., Kirtman, B.P., 2014. Southeastern US Rainfall Prediction in the NorthAmerican Multi-Model Ensemble. J. Hydrometeorol. 15, 529–550.
Kaiser, H.F., 1958. The Varimax Criterion for Analytic Rotation in Factor-Analysis.Psychometrika 23, 187–200.
Kam, J.H., Sheffield, J., Yuan, X., Wood, E.F., 2014. Did a skillful prediction of sea surfacetemperatures help or hinder forecasting of the 2012 Midwestern US drought?Environ. Res. Lett. 9.
Kirtman, B.P., Min, D., Infanti, J.M., 2014. The North American Multimodel Ensemble:Phase-1 Seasonal-to-Interannual Prediction; Phase-2 toward DevelopingIntraseasonal Prediction. B. Am. Meteorol. Soc. 95, 585–601.
Koster, R.D., Coauthors,, 2004. Regions of strong coupling between soil moisture andprecipitation. Science 305, 1138–1140.
Kousky, V.E., 1989. The Global Climate for September-November 1988: High SouthernOscillation Index and Cold Episode Characteristics Continued. J. Climate 2, 173–192.
Kumar, A., Chen, M.Y., Hoerling, M., Eischeid, J., 2013. Do extreme climate events re-quire extreme forcings? Geophys. Res. Lett. 40, 3440–3445.
Landman, W.A., Mason, S.J., 2001. Forecasts of near-global sea surface temperatures
using canonical correlation analysis. J. Climate 14, 3819–3833.Liu, Y.Y., Coauthors,, 2011. Developing an improved soil moisture dataset by blending
passive and active microwave satellite-based retrievals. Hydrol. Earth Syst. Sc. 15,425–436.
Liu, Y.Y., Coauthors,, 2012. Trend-preserving blending of passive and active microwavesoil moisture retrievals. Remote Sens. Environ. 123, 280–297.
Livneh, B., Hoerling, M.P., 2016. The Physics of Drought in the US Central Great Plains. J.Climate 29, 6783–6804.
Lorenz, E. N., 1956. Empirical Orthogonal Functions and Statistical Weather Prediction.Massachusetts Institute of Technology, Department of Meteorology.
Lyon, B., Dole, R.M., 1995. A Diagnostic Comparison of the 1980 and 1988 Us SummerHeat Wave-Droughts. J. Climate 8, 1658–1675.
Mason, S.J., Graham, N.E., 2002. Areas beneath the relative operating characteristics(ROC) and relative operating levels (ROL) curves: Statistical significance and inter-pretation. Q. J. Roy. Meteor. Soc. 128, 2145–2166.
Mason, S.J., Weigel, A.P., 2009. A Generic Forecast Verification Framework forAdministrative Purposes. Mon. Weather Rev. 137, 331–349.
Mason, S. J., Tippet, M. K., 2016: Climate Predictability Tool version 15.3. ColumbiaUniversity Academic Commons, doi:https://doi.org/10.7916/D8NS0TQ6.
Michaelsen, J., 1987. Cross-Validation in Statistical Climate Forecast Models. J. Clim.Appl. Meteorol. 26, 1589–1600.
Mo, K.C., Lyon, B., 2015. Global Meteorological Drought Prediction Using the NorthAmerican Multi-Model Ensemble. J. Hydrometeorol. 16, 1409–1424.
Mueller, B., Seneviratne, S.I., 2012. Hot days induced by precipitation deficits at theglobal scale. P. Natl. Acad. Sci. USA 109, 12398–12403.
Muller, W.A., Appenzeller, C., Doblas-Reyes, F.J., Liniger, M.A., 2005. A debiased rankedprobability skill score to evaluate probabilistic ensemble forecasts with small en-semble sizes. J. Climate 18, 1513–1523.
Myoung, B., Nielsen-Gammon, J.W., 2010a. The Convective Instability Pathway to WarmSeason Drought in Texas. Part II: Free-Tropospheric Modulation of ConvectiveInhibition. J. Climate 23, 4474–4488.
Myoung, B., Nielsen-Gammon, J.W., 2010b. The Convective Instability Pathway to WarmSeason Drought in Texas. Part I: The Role of Convective Inhibition and Its Modulationby Soil Moisture. J. Climate 23, 4461–4473.
Namias, J., 1982. Anatomy of Great Plains Protracted Heat Waves (Especially the 1980United-States Summer Drought). Mon. Weather Rev. 110, 824–838.
Pu, B., Fu, R., Dickinson, R.E., Fernando, D.N., 2016. Why do summer droughts in theSouthern Great Plains occur in some La Nina years but not others? J. Geophys. Res.-Atmos. 121, 1120–1137.
Quan, X.W., Hoerling, M.P., Lyon, B., Kumar, A., Bell, M.A., Tippett, M.K., Wang, H.,2012. Prospects for Dynamical Prediction of Meteorological Drought. J. Appl.Meteorol. Clim. 51, 1238–1252.
Richman, M.B., 1986. Rotation of Principal Components. J. Climatol. 6, 293–335.Rienecker, M.M., Coauthors,, 2011. MERRA: NASA's Modern-Era Retrospective Analysis
for Research and Applications. J. Clim. 24, 3624–3648.Rodwell, M. J., Doblas-Reyes, F. J., 2009. Medium-Range, Monthly, and Seasonal
Prediction for Europe and the Use of Forecast Information (vol 19, pg 6025, 2006). J.Climate, 22, 3511-3511.
Ropelewski, C.F., Halpert, M.S., 1986. North-American Precipitation and TemperaturePatterns Associated with the Elnino Southern Oscillation (Enso). Mon. Weather Rev.114, 2352–2362.
Ropelewski, C.F., Halpert, M.S., 1987. Global and Regional Scale Precipitation PatternsAssociated with the El-Nino Southern Oscillation. Mon. Weather Rev. 115,1606–1626.
Ryu, J.H., Hayhoe, K., 2017a. Observed and CMIP5 modeled influence of large-scalecirculation on summer precipitation and drought in the South-Central United States.Clim. Dynam. 49, 4293–4310.
Ryu, J. H., Hayhoe, K., 2017b: Observed and CMIP5 modeled influence of large-scalecirculation on summer precipitation and drought in the South-Central United States(vol 49, pg 4293, 2017). Clim. Dynam. 49, 4311-4311.
Saha, S., Coauthors,, 2014. The NCEP Climate Forecast System Version 2. J. Climate 27,2185–2208.
Saha, S., Coauthors, 2010. The Ncep Climate Forecast System Reanalysis. B. Am.Meteorol. Soc. 91, 1015–1057.
Schubert, S., Coauthors, 2009. A US CLIVAR Project to Assess and Compare the Responsesof Global Climate Models to Drought-Related SST Forcing Patterns: Overview andResults. J. Clim. 22, 5251–5272.
Seager, R., Goddard, L., Nakamura, J., Henderson, N., Lee, D.E., 2014. Dynamical Causesof the 2010/11 Texas-Northern Mexico Drought*. J. Hydrometeorol. 15, 39–68.
Shabbar, A., Barnston, A.G., 1996. Skill of seasonal climate forecasts in Canada usingcanonical correlation analysis. Mon. Weather Rev. 124, 2370–2385.
Simon J. Mason, M. K. T., 2017: Climate Predictability Tool version 15.6.3. ColumbiaUniversity Academic Commons.
Slater, L.J., Villarini, G., Bradley, A.A., 2016. Evaluation of the skill of North-AmericanMulti-Model Ensemble (NMME) Global Climate Models in predicting average andextreme precipitation and temperature over the continental USA. Clim. Dynam. 1–16.
Steiner, J.L., Briske, D.D., Brown, D.P., Rottler, C.M., 2018. Vulnerability of SouthernPlains agriculture to climate change. Clim. Change 146, 201–218.
von Storch, H., Zwiers, F.W., 2002. Statistical analysis in climate research. CambridgeUniversity Press.
Wang, Y.C., Pan, H.L., Hsu, H.H., 2015. Impacts of the triggering function of cumulusparameterization on warm-season diurnal rainfall cycles at the AtmosphericRadiation Measurement Southern Great Plains site. J. Geophys. Res.-Atmos. 120,10681–10702.
Wilks, D.S., 2006. Statistical Methods in the Atmospheric Sciences, 2nd ed. AcademicPress, pp. 463.
D.N. Fernando, et al. Climate Services 16 (2019) 100133
11