Embed Size (px)
Citation preview
1
A PRO-FORMA APPROACH TO CAR-CARRIER DESIGN
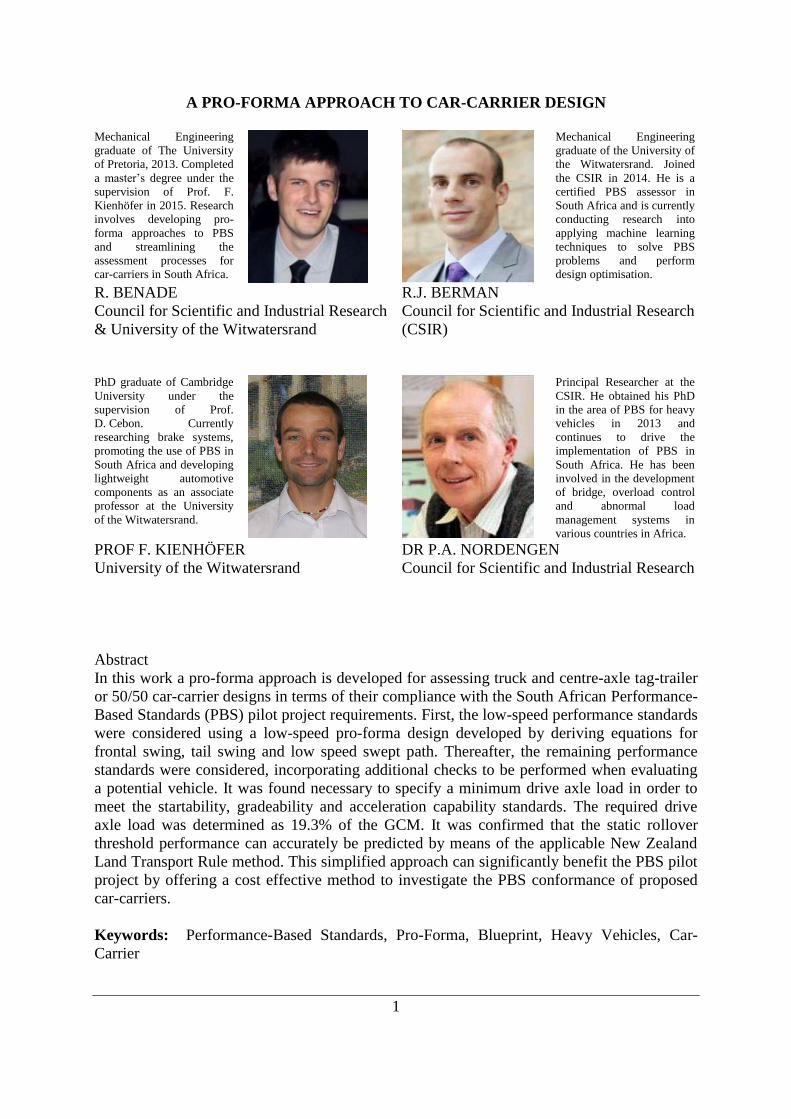
Mechanical Engineering
graduate of The University
of Pretoria, 2013. Completed
a master’s degree under the
supervision of Prof. F.
Kienhöfer in 2015. Research
involves developing pro-
forma approaches to PBS
and streamlining the
assessment processes for
car-carriers in South Africa.
Mechanical Engineering
graduate of the University of
the Witwatersrand. Joined
the CSIR in 2014. He is a
certified PBS assessor in
South Africa and is currently
conducting research into
applying machine learning
techniques to solve PBS
problems and perform
design optimisation.
R. BENADE
Council for Scientific and Industrial Research
& University of the Witwatersrand
R.J. BERMAN
Council for Scientific and Industrial Research
(CSIR)
PhD graduate of Cambridge
University under the
supervision of Prof.
D. Cebon. Currently
researching brake systems,
promoting the use of PBS in
South Africa and developing
lightweight automotive
components as an associate
professor at the University
of the Witwatersrand.
Principal Researcher at the
CSIR. He obtained his PhD
in the area of PBS for heavy
vehicles in 2013 and
continues to drive the
implementation of PBS in
South Africa. He has been
involved in the development
of bridge, overload control
and abnormal load
management systems in
various countries in Africa.
PROF F. KIENHÖFER
University of the Witwatersrand
DR P.A. NORDENGEN
Council for Scientific and Industrial Research
Abstract
In this work a pro-forma approach is developed for assessing truck and centre-axle tag-trailer
or 50/50 car-carrier designs in terms of their compliance with the South African Performance-
Based Standards (PBS) pilot project requirements. First, the low-speed performance standards
were considered using a low-speed pro-forma design developed by deriving equations for
frontal swing, tail swing and low speed swept path. Thereafter, the remaining performance
standards were considered, incorporating additional checks to be performed when evaluating
a potential vehicle. It was found necessary to specify a minimum drive axle load in order to
meet the startability, gradeability and acceleration capability standards. The required drive
axle load was determined as 19.3% of the GCM. It was confirmed that the static rollover
threshold performance can accurately be predicted by means of the applicable New Zealand
Land Transport Rule method. This simplified approach can significantly benefit the PBS pilot
project by offering a cost effective method to investigate the PBS conformance of proposed
car-carriers.
Keywords: Performance-Based Standards, Pro-Forma, Blueprint, Heavy Vehicles, Car-
Carrier
2
1. Introduction
As a result of successful initiatives in Australia, New Zealand and Canada, a performance-
based standards (PBS) scheme has been operated as a demonstration project in South Africa
since 2004 (Nordengen, 2014). This pilot project has successfully been running in parallel
with the prescriptive legislative framework specified by the National Road Traffic Act
(Department of Transport, 1996), or NRTA. Since the commissioning of the first two South
African PBS vehicles in 2007, the pilot project has shown a fourfold benefit, offering more
economic payload transportation, improved vehicle safety, reduced road infrastructure wear
per tonne of payload transported, and reduced emissions. South African heavy vehicle
operators that wish to participate in the PBS or Smart Truck pilot project are required to have
their vehicle designs assessed in terms of the Australian National Transport Commission’s
(NTC) PBS standards, which have been slightly modified for the South African context. In
South Africa, the safety PBS assessments were initially conducted by Australian NTC-
accredited PBS assessors but more recently are generally conducted by the Council for
Scientific and Industrial Research (CSIR) or the University of the Witwatersrand using
commercially available vehicle dynamics simulation software packages such as TruckSim®.
Infrastructure performance standards are assessed using South African pavement and bridge
design methodologies.
One significant drawback of the PBS approach in South Africa is the time and expertise
required for conducting PBS assessments, generally consisting of gathering input data,
modelling and post-processing of output data. The back-and-forth exchanging of design
modifications between trailer manufacturers and PBS assessors in trying to arrive at a PBS-
compliant design, can also be time-consuming. This is troublesome in South Africa, where
there are only four qualified PBS assessors, while the industry is starting to show substantial
interest in the PBS project. In addition to this, on 10 March 2014, the final version of the
South African Roadmap for Car-Carriers (RCC) was accepted by the Abnormal Load
Technical Committee (Abnormal Load Technical Committee, 2014). The RCC specifies that
all car-carriers registered after 1 April 2013 will only be granted overall length and height
exemptions if the design is shown to meet Level 1 PBS performance requirements. This
exemption allows car-carriers to operate up to an overall length of 23 m (including payload
projection) and an overall height of 4.6 m, slightly less strict than the NRTA’s limits of 22 m
and 4.3 m respectively. The new requirement to qualify for these relaxed limitations (which
were previously granted regardless of PBS compliance and offer significant benefits to the
car-carrier industry in terms of productivity) has resulted in an increased demand for car-
carrier PBS assessments. One of the main challenges with these assessments is that each car-
carrier design (superstructure and trailer) needs to be assessed with each hauling unit that the
operators plan to use, as any change in suspension or other design characteristics of the
combination could potentially compromise its PBS compliance. Currently, three commercial
car-carrier manufacturers (Unipower Natal, Lohr Transport Solutions ZA, and Rolfo South
Africa) are pursuing 23 m designs in South Africa and have developed ten PBS car-carrier
design concepts. If each trailer design is assessed with three hauling units, this would require
30 assessments with significant associated assessment costs. Apart from the financial burden,
the formal PBS assessment process may cause delays in getting the vehicles on the road and is
thus not a sustainable solution. Sparked by the pro-forma approach as implemented in Canada
and New Zealand as well as the “Blue-print” approach in Australia, this paper describes the
development of a simplified assessment tool to assess truck and centre-axle tag-trailer car-
3
carrier designs or 50/50 type car-carriers in South Africa. The 50/50 car-carriers get their
name from the fact that the proportional lengths of the truck and trailer are respectively
approximately 50% and 50% of the total length of the vehicle. The 50/50 car-carriers
transport two vehicle units behind the cab on the truck, and are differentiated from short-long
car-carriers, which have a significantly shorter wheel-base and transport one vehicle unit
behind the cab on the truck.
2. Development of Simplified Assessment Tool
As a starting point, a suitable 50/50-type South African car-carrier was selected and assessed
in accordance with the PBS framework. This combination was found to meet the Level 1 PBS
requirements. To explore potential pro-forma limits for this design, the low-speed standards
were first investigated.
2.1 Low-Speed PBS
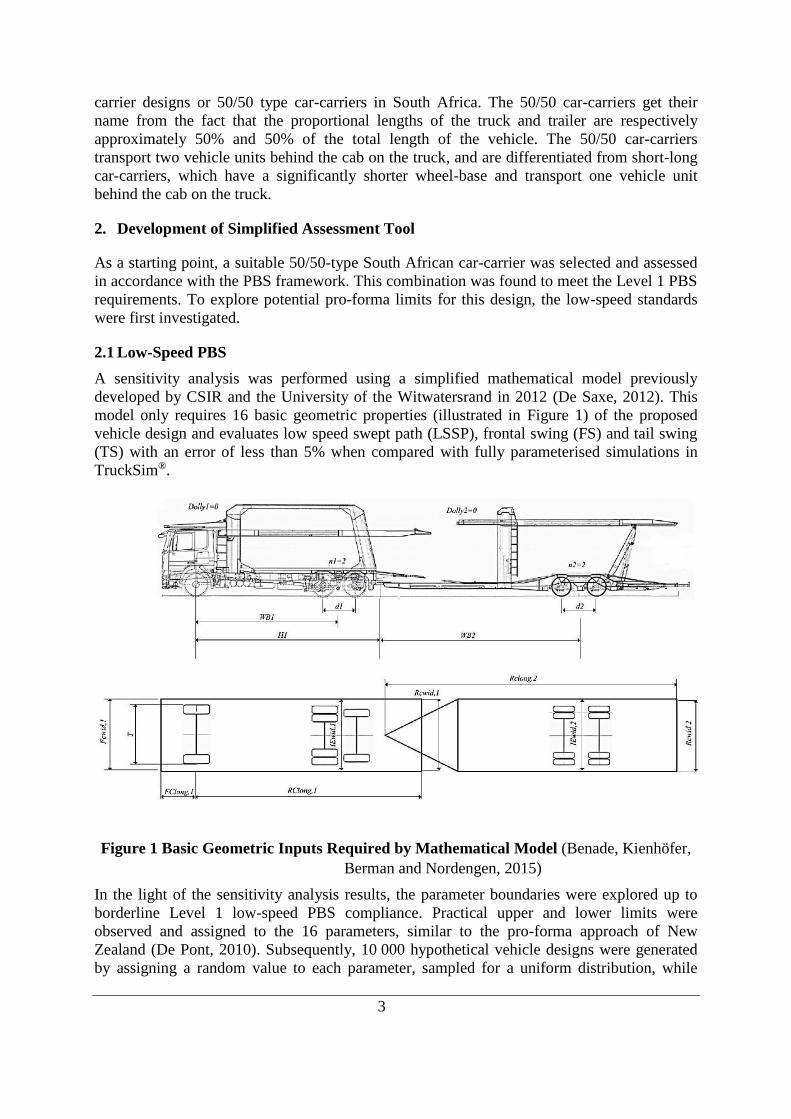
A sensitivity analysis was performed using a simplified mathematical model previously
developed by CSIR and the University of the Witwatersrand in 2012 (De Saxe, 2012). This
model only requires 16 basic geometric properties (illustrated in Figure 1) of the proposed
vehicle design and evaluates low speed swept path (LSSP), frontal swing (FS) and tail swing
(TS) with an error of less than 5% when compared with fully parameterised simulations in
TruckSim®.
Figure 1 Basic Geometric Inputs Required by Mathematical Model (Benade, Kienhöfer,
Berman and Nordengen, 2015)
In the light of the sensitivity analysis results, the parameter boundaries were explored up to
borderline Level 1 low-speed PBS compliance. Practical upper and lower limits were
observed and assigned to the 16 parameters, similar to the pro-forma approach of New
Zealand (De Pont, 2010). Subsequently, 10 000 hypothetical vehicle designs were generated
by assigning a random value to each parameter, sampled for a uniform distribution, while
4
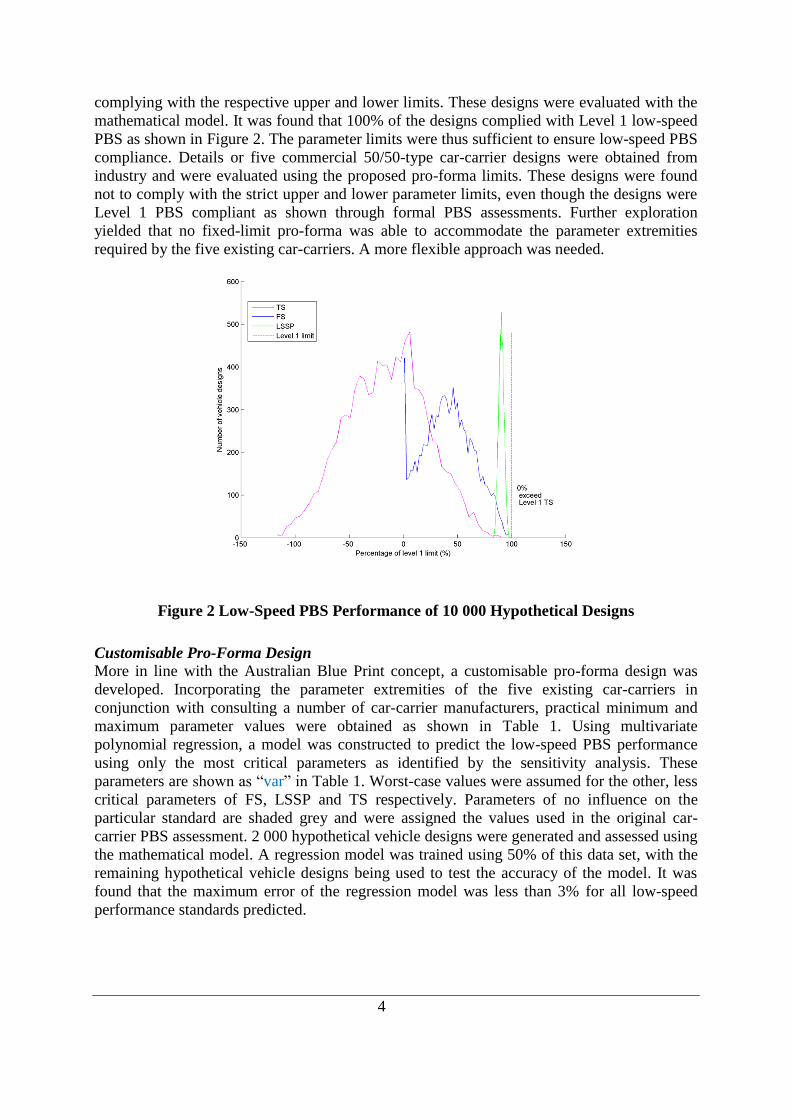
complying with the respective upper and lower limits. These designs were evaluated with the
mathematical model. It was found that 100% of the designs complied with Level 1 low-speed
PBS as shown in Figure 2. The parameter limits were thus sufficient to ensure low-speed PBS
compliance. Details or five commercial 50/50-type car-carrier designs were obtained from
industry and were evaluated using the proposed pro-forma limits. These designs were found
not to comply with the strict upper and lower parameter limits, even though the designs were
Level 1 PBS compliant as shown through formal PBS assessments. Further exploration
yielded that no fixed-limit pro-forma was able to accommodate the parameter extremities
required by the five existing car-carriers. A more flexible approach was needed.
Figure 2 Low-Speed PBS Performance of 10 000 Hypothetical Designs
Customisable Pro-Forma Design
More in line with the Australian Blue Print concept, a customisable pro-forma design was
developed. Incorporating the parameter extremities of the five existing car-carriers in
conjunction with consulting a number of car-carrier manufacturers, practical minimum and
maximum parameter values were obtained as shown in Table 1. Using multivariate
polynomial regression, a model was constructed to predict the low-speed PBS performance
using only the most critical parameters as identified by the sensitivity analysis. These
parameters are shown as “var” in Table 1. Worst-case values were assumed for the other, less
critical parameters of FS, LSSP and TS respectively. Parameters of no influence on the
particular standard are shaded grey and were assigned the values used in the original car-
carrier PBS assessment. 2 000 hypothetical vehicle designs were generated and assessed using
the mathematical model. A regression model was trained using 50% of this data set, with the
remaining hypothetical vehicle designs being used to test the accuracy of the model. It was
found that the maximum error of the regression model was less than 3% for all low-speed
performance standards predicted.
5
Table 1 Customisable Pro-Forma Limits
Proposed limits Bounds for LSMM
Standard
Parameter Min Max FS LSSP TS (Truck) TS (Trailer)
T 2.1935 2.494 2.494 2.351 2.351 2.351
WB1 5.75 6.35 var var var var
FClong,1 0.5 1.94 var var 1.352 1.352
FCwid,1 1 2.5 var var 0.2596 2.596
RClong,1 8.35 11.93 10.025 10.025 var 6.45
RCwid,1 1 2.5 2.3 2.3 var 0.23
n1 2 2 2 2 2 2
d1 1.3 1.5 1.5 1.5 1.3 1.3
IEwid,1 2.5 2.6 var 2.6 var 2.58
H1 7.5 8.5 7.825 var 7.825 var
WB2 7.5 9.2 8.5 var 8.5 var
FClong,2
0 0 0 0
FCwid,2
0 0 0 0
RClong,2 11.2 14.7 12.735 12.735 8.6 var
RCwid,2 1 2.5 2.58 2.58 0.258 var
n2 2 2 2 2 2 2
d2 1.3 1.8 1.5 1.8 1.5 1.3
IEwid,2 2.5 2.6 2.58 2.6 2.58 var
H2
0 0 0 0
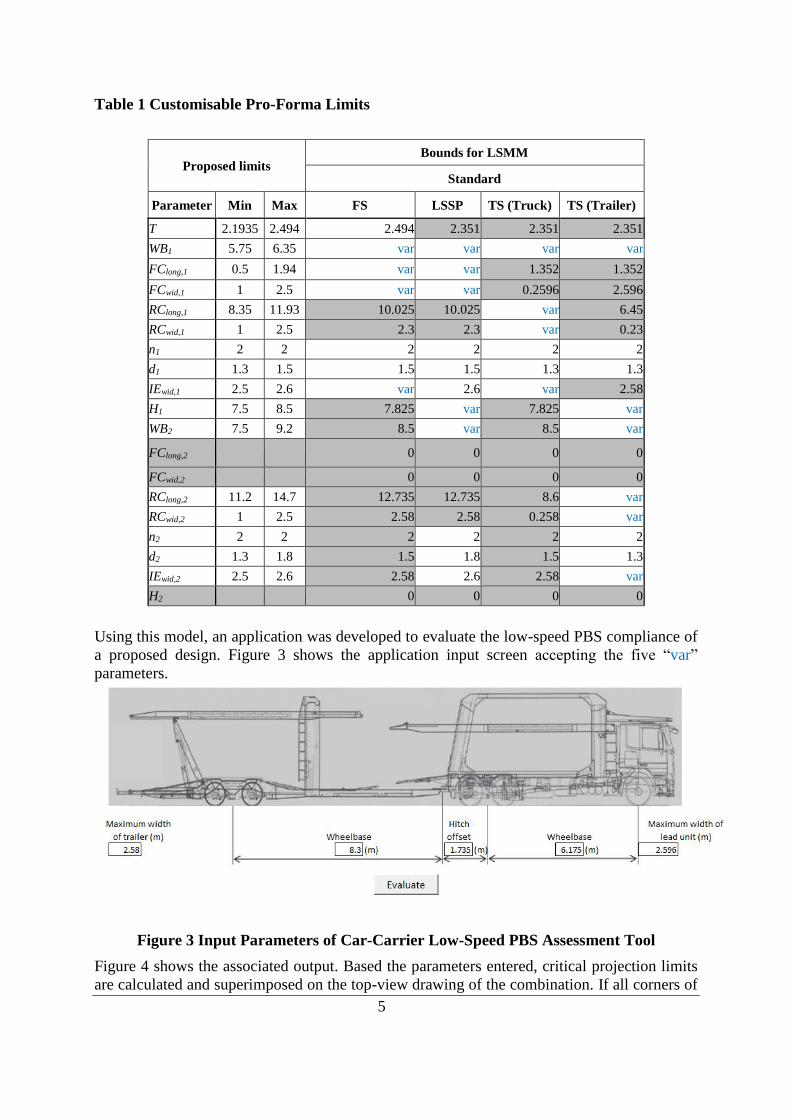
Using this model, an application was developed to evaluate the low-speed PBS compliance of
a proposed design. Figure 3 shows the application input screen accepting the five “var”
parameters.
Figure 3 Input Parameters of Car-Carrier Low-Speed PBS Assessment Tool
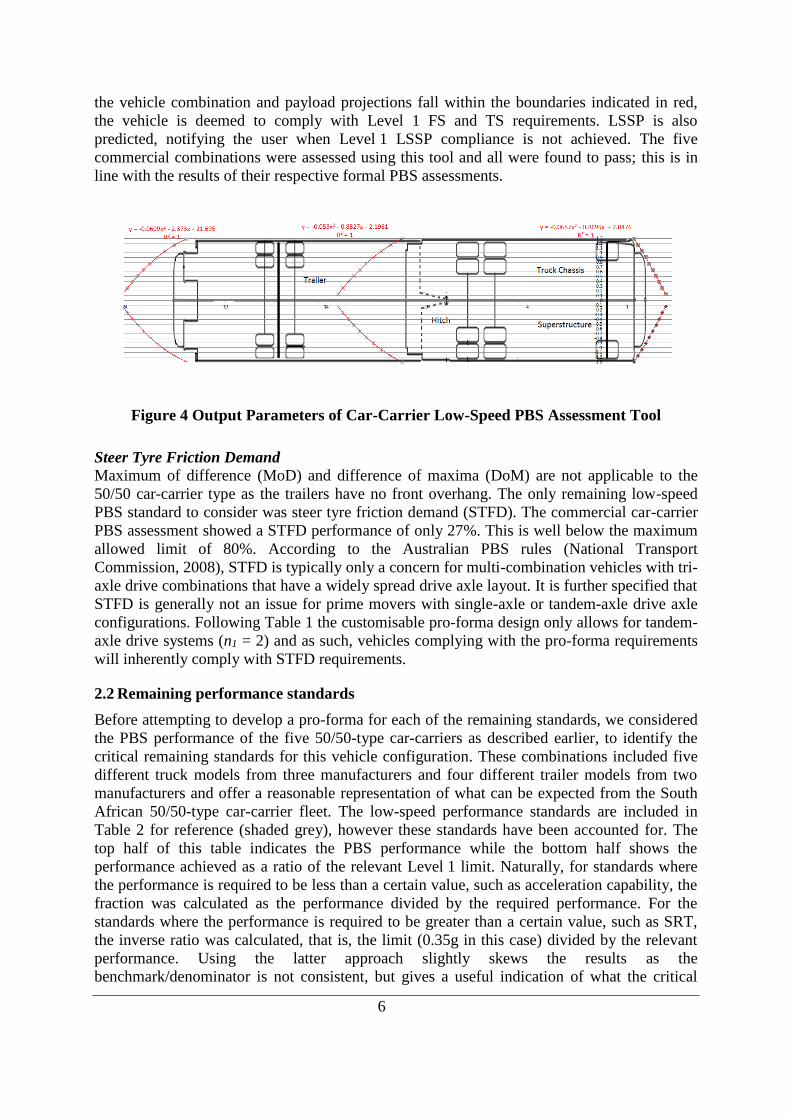
Figure 4 shows the associated output. Based the parameters entered, critical projection limits
are calculated and superimposed on the top-view drawing of the combination. If all corners of
6
the vehicle combination and payload projections fall within the boundaries indicated in red,
the vehicle is deemed to comply with Level 1 FS and TS requirements. LSSP is also
predicted, notifying the user when Level 1 LSSP compliance is not achieved. The five
commercial combinations were assessed using this tool and all were found to pass; this is in
line with the results of their respective formal PBS assessments.
Figure 4 Output Parameters of Car-Carrier Low-Speed PBS Assessment Tool
Steer Tyre Friction Demand
Maximum of difference (MoD) and difference of maxima (DoM) are not applicable to the
50/50 car-carrier type as the trailers have no front overhang. The only remaining low-speed
PBS standard to consider was steer tyre friction demand (STFD). The commercial car-carrier
PBS assessment showed a STFD performance of only 27%. This is well below the maximum
allowed limit of 80%. According to the Australian PBS rules (National Transport
Commission, 2008), STFD is typically only a concern for multi-combination vehicles with tri-
axle drive combinations that have a widely spread drive axle layout. It is further specified that
STFD is generally not an issue for prime movers with single-axle or tandem-axle drive axle
configurations. Following Table 1 the customisable pro-forma design only allows for tandem-
axle drive systems (n1 = 2) and as such, vehicles complying with the pro-forma requirements
will inherently comply with STFD requirements.
2.2 Remaining performance standards
Before attempting to develop a pro-forma for each of the remaining standards, we considered
the PBS performance of the five 50/50-type car-carriers as described earlier, to identify the
critical remaining standards for this vehicle configuration. These combinations included five
different truck models from three manufacturers and four different trailer models from two
manufacturers and offer a reasonable representation of what can be expected from the South
African 50/50-type car-carrier fleet. The low-speed performance standards are included in
Table 2 for reference (shaded grey), however these standards have been accounted for. The
top half of this table indicates the PBS performance while the bottom half shows the
performance achieved as a ratio of the relevant Level 1 limit. Naturally, for standards where
the performance is required to be less than a certain value, such as acceleration capability, the
fraction was calculated as the performance divided by the required performance. For the
standards where the performance is required to be greater than a certain value, such as SRT,
the inverse ratio was calculated, that is, the limit (0.35g in this case) divided by the relevant
performance. Using the latter approach slightly skews the results as the
benchmark/denominator is not consistent, but gives a useful indication of what the critical
7
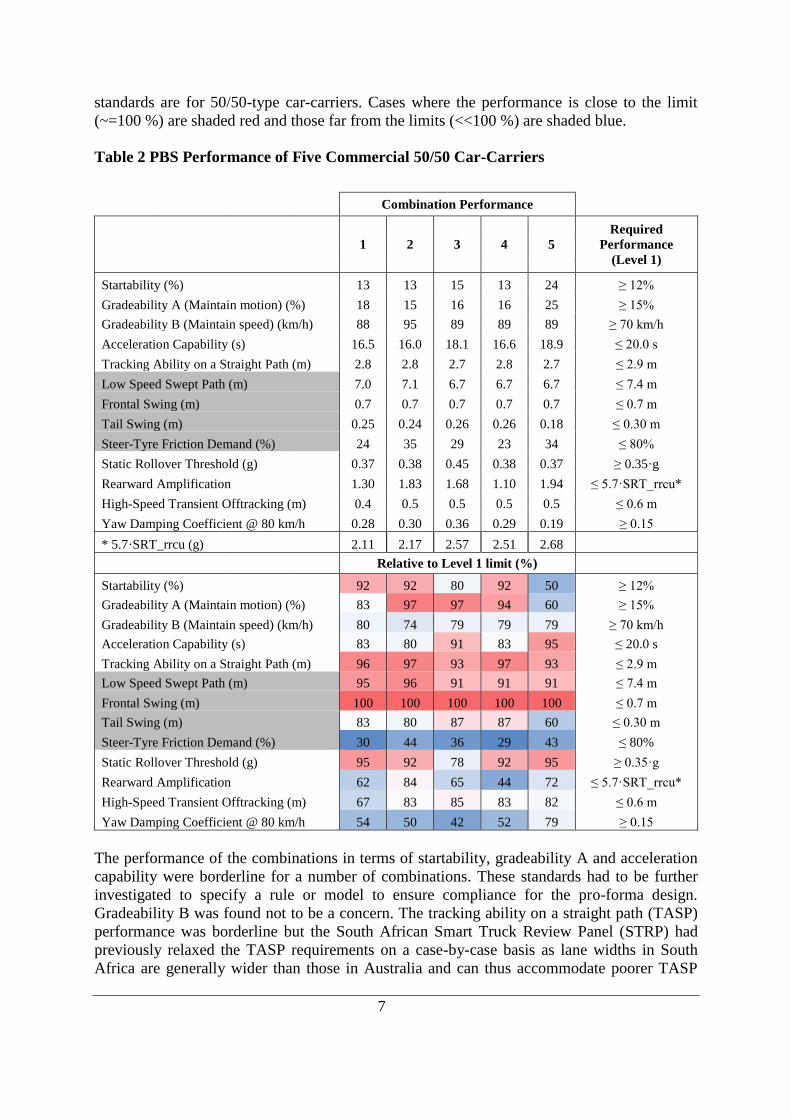
standards are for 50/50-type car-carriers. Cases where the performance is close to the limit
(~=100 %) are shaded red and those far from the limits (<<100 %) are shaded blue.
Table 2 PBS Performance of Five Commercial 50/50 Car-Carriers
Combination Performance
1 2 3 4 5
Required
Performance
(Level 1)
Startability (%) 13 13 15 13 24 ≥ 12%
Gradeability A (Maintain motion) (%) 18 15 16 16 25 ≥ 15%
Gradeability B (Maintain speed) (km/h) 88 95 89 89 89 ≥ 70 km/h
Acceleration Capability (s) 16.5 16.0 18.1 16.6 18.9 ≤ 20.0 s
Tracking Ability on a Straight Path (m) 2.8 2.8 2.7 2.8 2.7 ≤ 2.9 m
Low Speed Swept Path (m) 7.0 7.1 6.7 6.7 6.7 ≤ 7.4 m
Frontal Swing (m) 0.7 0.7 0.7 0.7 0.7 ≤ 0.7 m
Tail Swing (m) 0.25 0.24 0.26 0.26 0.18 ≤ 0.30 m
Steer-Tyre Friction Demand (%) 24 35 29 23 34 ≤ 80%
Static Rollover Threshold (g) 0.37 0.38 0.45 0.38 0.37 ≥ 0.35·g
Rearward Amplification 1.30 1.83 1.68 1.10 1.94 ≤ 5.7·SRT_rrcu*
High-Speed Transient Offtracking (m) 0.4 0.5 0.5 0.5 0.5 ≤ 0.6 m
Yaw Damping Coefficient @ 80 km/h 0.28 0.30 0.36 0.29 0.19 ≥ 0.15
* 5.7·SRT_rrcu (g) 2.11 2.17 2.57 2.51 2.68
Relative to Level 1 limit (%)
Startability (%) 92 92 80 92 50 ≥ 12%
Gradeability A (Maintain motion) (%) 83 97 97 94 60 ≥ 15%
Gradeability B (Maintain speed) (km/h) 80 74 79 79 79 ≥ 70 km/h
Acceleration Capability (s) 83 80 91 83 95 ≤ 20.0 s
Tracking Ability on a Straight Path (m) 96 97 93 97 93 ≤ 2.9 m
Low Speed Swept Path (m) 95 96 91 91 91 ≤ 7.4 m
Frontal Swing (m) 100 100 100 100 100 ≤ 0.7 m
Tail Swing (m) 83 80 87 87 60 ≤ 0.30 m
Steer-Tyre Friction Demand (%) 30 44 36 29 43 ≤ 80%
Static Rollover Threshold (g) 95 92 78 92 95 ≥ 0.35·g
Rearward Amplification 62 84 65 44 72 ≤ 5.7·SRT_rrcu*
High-Speed Transient Offtracking (m) 67 83 85 83 82 ≤ 0.6 m
Yaw Damping Coefficient @ 80 km/h 54 50 42 52 79 ≥ 0.15
The performance of the combinations in terms of startability, gradeability A and acceleration
capability were borderline for a number of combinations. These standards had to be further
investigated to specify a rule or model to ensure compliance for the pro-forma design.
Gradeability B was found not to be a concern. The tracking ability on a straight path (TASP)
performance was borderline but the South African Smart Truck Review Panel (STRP) had
previously relaxed the TASP requirements on a case-by-case basis as lane widths in South
Africa are generally wider than those in Australia and can thus accommodate poorer TASP
8
performance. In addition, the maximum width of heavy vehicles in South Africa is 2.6 m
compared with 2.5 m in Australia. In coherence with the NTC’s arguments, STFD was found
to be non-critical for the five combinations. The static rollover threshold (SRT) performance
of four of the five combinations were close to the limit. SRT had to be investigated further,
especially considering its significant influence on vehicle safety. The rearward amplification
(RA) performance of all five car-carriers was well within the relevant limit. This is typical for
this vehicle configuration with a low number of articulation points. High-speed transient
offtracking (HSTO) and yaw damping (YD) were also far from the respective Level 1 limits.
The standards that were identified as borderline and not regulated by the low-speed pro-forma
were investigated further with the aim of finding a simple method to insure compliance.
Startability, Gradeability A and Acceleration Capability
In South Africa, engine power is governed by the NRTA’s power-to-weight ratio
regulations (Department of Transport, 1996). Subsequently, the general trend in the PBS
demonstration project thus far has been that startability, gradeability A, and acceleration
capability performance are typically limited by traction, rather than by engine power. This is
particularly applicable to 6x2 car-carrier trucks as the load on the drive axle is low. Ensuring
an acceptable drive axle load is thus the main priority when attempting to ensure acceptable
startability, gradeability A and acceleration capability performance.
A simple, effective method to ensure that sufficient drive axle load is achieved is to specify a
minimum drive axle load per ton of total combination mass. To specify such a value for
50/50-type car-carriers, a worst-case hypothetical design was assessed at 100 kg drive axle
load increments to find the minimum required drive axle load allowing Level 1 startability,
gradeability A, and acceleration capability performance to be achieved. In the light of
hypothesising a worst-case design, the GCMs of all five commercial car-carriers were
considered. The highest GCM was recorded as 43 300 kg. This was conservatively rounded
up to 44 000 kg for the hypothetical worst-case. The driveline data of a popular hauling unit
was assumed to be representative. A worst case frontal area was assumed as 4.6 m x 2.6 m,
the maximum allowed height and width based on NRTA (Department of Roads and
Transport, 1996) and RCC (Abnormal Load Technical Committee, 2014). The minimum
required drive axle loads based on startability, gradeability A, and acceleration capability
were 7 340 kg, 8 480 kg and 4 200 kg respectively. The critical standard is gradeability A,
requiring the highest drive axle load (8 480 kg). As a fraction of GCM (44 000kg), this means
that 19.3% (or more) of the total GCM is required to be loaded onto the drive axle to ensure
compliance.
Static Rollover Threshold
A number of simplified approaches to predicting SRT have been developed over the years.
These approaches are typically less accurate but offer a simplified approach without requiring
costly computer software packages. The simplest approximation of predicting SRT as
explained by Gillespie (1992) is as follows:
2
TSRT
H (1)
where:
T = track width (m)
H = CoG height of entire vehicle including payload (m)
9
This method disregards the effects of deflection in the suspension and tyres. According to
Gillespie, this method is a first-order estimate, and although it is a useful tool for comparing
vehicle performance, it is not a good predictor of absolute SRT performance.
An improvement to Equation (1) is an approximation developed by Elischer and Prem (1998),
incorporating a factor, F, empirically derived to approximate the lateral shift of the sprung
mass CoG as the body rolls. Elischer and Prem (1998) confirmed that this model was found to
produce SRT results accurate to 7% for vehicles with a variety of load densities and
configurations.
2
TSRT
HF (2)
where:
T = track width (m)
H =CoG height of entire vehicle including payload (m)
F =
1p p e
e p
W H H
H W W
where:
pW = payload mass (kg)
eW = empty vehicle mass (kg)
pH = height of CoG of payload (m)
eH = height of CoG of empty vehicle (m)
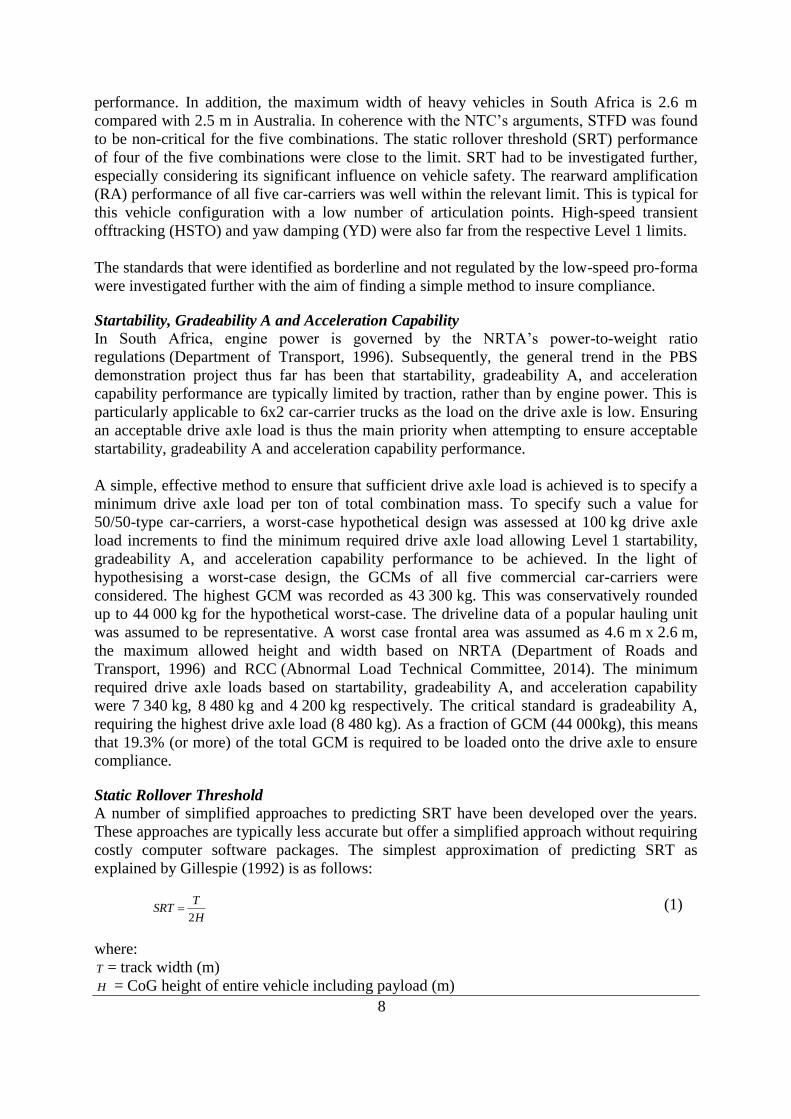
An even more detailed approximation is required by New Zealand’s Land Transport Rule
(NZLTR, 2002), “case 1”, “case 2” and “case 3”. This method calculates the roll of the axle
itself due to tyre compliance (φ ), as well as the roll of the sprung mass relative to the axle
due to suspension compliance (θ ) as shown in Figure 5. Various physical suspension
properties, including lash are incorporated into the model allowing for more accurate
prediction.
Figure 5 Land Transport Rule Method (New Zealand Government, 2014)
More detail of each approach is summarised in a paper presented at the South African
Transport Conference earlier in 2016. (Benade, Berman, Nordengen and Kienhöfer, 2016)
10
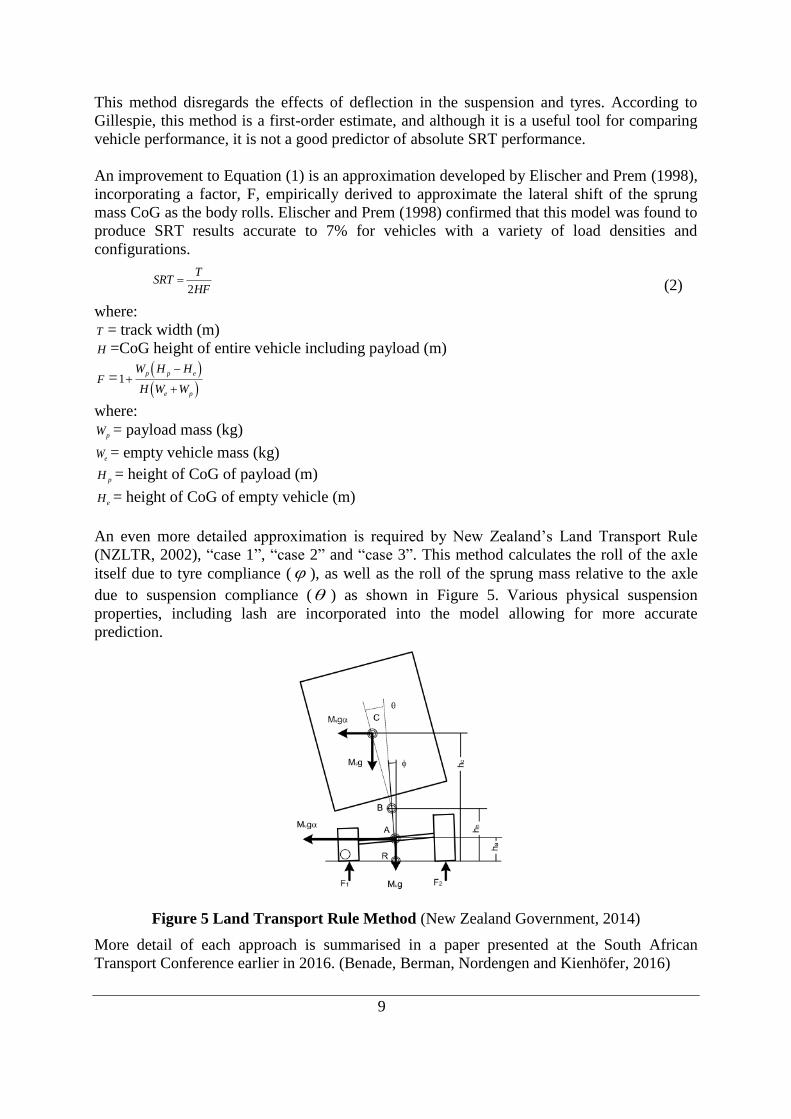
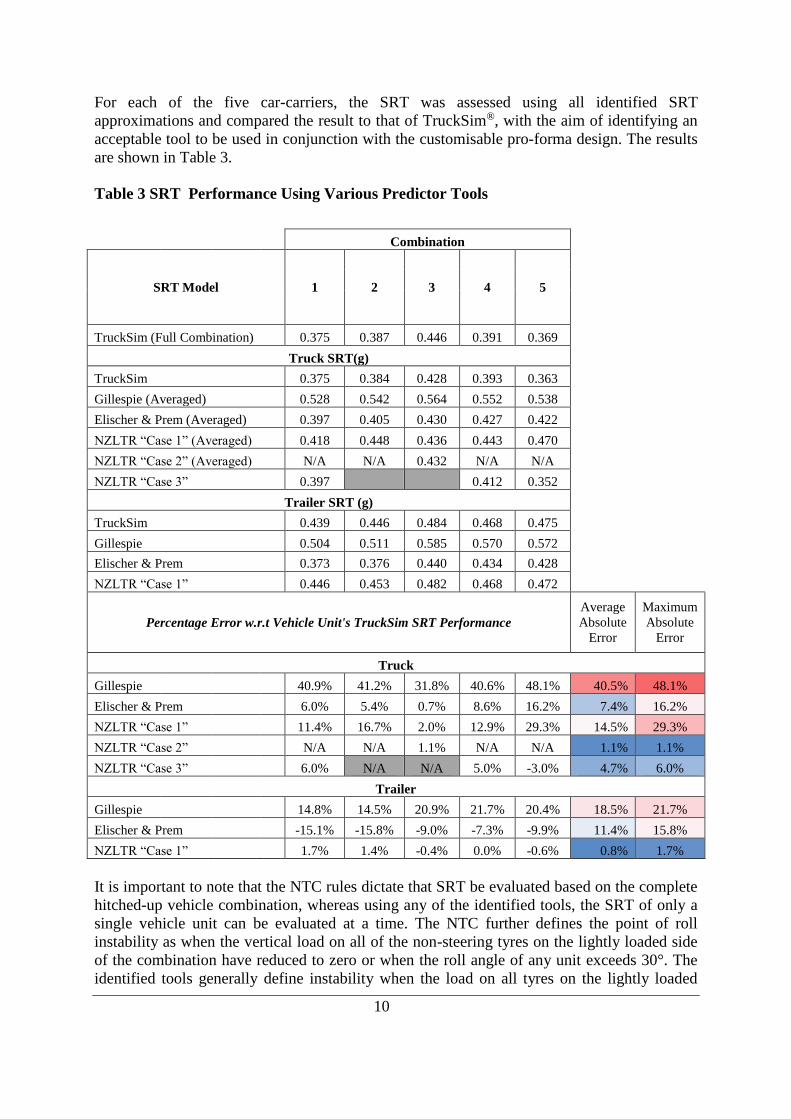
For each of the five car-carriers, the SRT was assessed using all identified SRT
approximations and compared the result to that of TruckSim®, with the aim of identifying an
acceptable tool to be used in conjunction with the customisable pro-forma design. The results
are shown in Table 3.
Table 3 SRT Performance Using Various Predictor Tools
Combination
SRT Model 1 2 3 4 5
TruckSim (Full Combination) 0.375 0.387 0.446 0.391 0.369
Truck SRT(g)
TruckSim 0.375 0.384 0.428 0.393 0.363
Gillespie (Averaged) 0.528 0.542 0.564 0.552 0.538
Elischer & Prem (Averaged) 0.397 0.405 0.430 0.427 0.422
NZLTR “Case 1” (Averaged) 0.418 0.448 0.436 0.443 0.470
NZLTR “Case 2” (Averaged) N/A N/A 0.432 N/A N/A
NZLTR “Case 3” 0.397 0.412 0.352
Trailer SRT (g)
TruckSim 0.439 0.446 0.484 0.468 0.475
Gillespie 0.504 0.511 0.585 0.570 0.572
Elischer & Prem 0.373 0.376 0.440 0.434 0.428
NZLTR “Case 1” 0.446 0.453 0.482 0.468 0.472
Percentage Error w.r.t Vehicle Unit's TruckSim SRT Performance
Average
Absolute
Error
Maximum
Absolute
Error
Truck
Gillespie 40.9% 41.2% 31.8% 40.6% 48.1% 40.5% 48.1%
Elischer & Prem 6.0% 5.4% 0.7% 8.6% 16.2% 7.4% 16.2%
NZLTR “Case 1” 11.4% 16.7% 2.0% 12.9% 29.3% 14.5% 29.3%
NZLTR “Case 2” N/A N/A 1.1% N/A N/A 1.1% 1.1%
NZLTR “Case 3” 6.0% N/A N/A 5.0% -3.0% 4.7% 6.0%
Trailer
Gillespie
14.8% 14.5% 20.9% 21.7% 20.4% 18.5% 21.7%
Elischer & Prem -15.1% -15.8% -9.0% -7.3% -9.9% 11.4% 15.8%
NZLTR “Case 1” 1.7% 1.4% -0.4% 0.0% -0.6% 0.8% 1.7%
It is important to note that the NTC rules dictate that SRT be evaluated based on the complete
hitched-up vehicle combination, whereas using any of the identified tools, the SRT of only a
single vehicle unit can be evaluated at a time. The NTC further defines the point of roll
instability as when the vertical load on all of the non-steering tyres on the lightly loaded side
of the combination have reduced to zero or when the roll angle of any unit exceeds 30°. The
identified tools generally define instability when the load on all tyres on the lightly loaded
11
side of the vehicle unit have reduced to zero. Generally, 50/50-type car-carrier trailers are
hauled by pintle hitches with negligible roll-coupling. It was therefore expected that the SRT
performance of the worst-performing vehicle unit would correlate well with the overall
combination performance.
For all the combinations, the trucks (as assessed using TruckSim®) were the worst-performing
vehicle units and their results correlated well with the results of the respective “full
combination”, also assessed using TruckSim®. Assessing the trucks using the methods of
Gillespie (Gillespie, 1992), Elischer & Prem (Elischer and Prem, 1998), NZLTR “Case1” and
NZLTR “Case2” required some assumptions to be made to arrive at an effective suspension
i.e. combining the front and rear suspension of the truck. The axle track width, for example,
was taken as the average of that of the front and rear suspensions, weighted by the axle group
load. Similar assumptions were made for spring track and roll centre heights. Stiffness
features were summed as these function in parallel. For NZLTR “Case3”, the front and rear
suspension characteristics are required to be specified separately, however again the concept
of averaging was applied in combining the drive and tag axles where non-identical. As
expected, when compared to the TruckSim® vehicle unit results as a baseline, the method of
Gillespie (Gillespie, 1992) did not provide accurate results, with an average absolute error of
40.5% for trucks and 18.5% for trailers. The method of Elischer & Prem (Elischer and Prem,
1998) provided more accurate results, especially considering the simplicity of the model with
an average absolute error of 7.4% for trucks and 11.4% for trailers. With the truck
assessments, NZLTR “Case1” proved to be less accurate than Elischer & Prem’s (Elischer
and Prem, 1998) method, with an absolute average error of 14.5%. NZLTR “Case2” was only
applicable to the third truck, which showed a 1.15% error. The remainder of the trucks
experienced wheel lift-off before lash could occur and was thus not assessed using NZLTR
“Case2”. The reason for this is the high auxiliary roll stiffness of the respective trucks’
averaged suspensions. When using NZLTR “Case3”, the individual axle groups
characteristics were incorporated allowing an improved accuracy or an average absolute error
of 4.7%. With the trailer assessments, the NZLTR “Case1” provided excellent accuracy with
an average absolute error of 0.8%. Here lash was also not achieved due to the high auxiliary
roll stiffness of the trailer axles. The methods of the NZLTR for predicting SRT was found to
provide the best correlation with TruckSim® results. This is likely due to the fact that the
NZLTR approach incorporates customised suspension characteristics, such as spring stiffness,
auxiliary roll stiffness, tyres stiffness and lash, allowing for improved prediction accuracy.
3. Conclusion
A pro-forma approach has been developed for assessing 50/50-type car-carrier designs in
terms of compliance with the South African PBS pilot project requirements. All the relevant
PBS were considered and simplified means of assessing the critical standards were
established. The low-speed performance standards were considered and a customisable low-
speed pro-forma design was developed by deriving equations for the frontal swing, tail swing
and low speed swept path standards, with a maximum absolute error of 3%. These equations
were incorporated into a simplified tool for assessing the low-speed PBS compliance of car-
carriers using a top-view drawing of the design. The minimum drive axle load required was
determined as 19.3% of the total combination mass to ensure that the vehicle passes
startability, gradeability A and acceleration capability. It was determined that the SRT
performance can accurately be predicted by means of the NZLTR method, with a maximum
absolute error of 6% for the truck and 1.7% for the trailer. The pro-forma approach offers a

12
cost-effective and sustainable alternative to conventional TruckSim® PBS assessments. The
study is limited to 50/50-type car-carriers, however the methodology developed will be used
to construct assessment frameworks for short-long and tractor-and-semitrailer car-carrier
combinations as well as heavy combinations in other industries. The pro-forma approach can
have a significantly positive impact on the South African PBS pilot project by allowing for
the efficient and sustainable PBS assessment of future 50/50-type car-carrier combinations.
4. Recommendations and Practical Implications Going Forward
The NZLTR method for calculating SRT specifies various default suspension parameters such
as typical spring stiffness, suspension track width, composite roll stiffness, axle lash and roll
centre height for generic steer, steel and air suspensions. For our validation, the exact values
of these properties were sourced from TruckSim® and relevant PBS reports. As this
information is time-consuming to gather from OEMs, it is recommended that further
investigation is done to assess the impact of using the generic NZLTR suspension
characteristics when assessing SRT for 50/50-type car-carriers. If these generic characteristics
provide acceptable results, it would streamline the assessment process significantly. It is
envisaged that this approach will replace the formal PBS assessment for 50/50-type car-
carriers in South Africa. As an interim, these assessments should only be conducted (and
reported on) by certified PBS assessors, but with the necessary training can later be delegated
to members of the Department of Transport. The default PBS permits and commissioning
procedures hold. The potential use of the low-speed PBS tool for the purpose of design
optimisation should be investigated.
5. References
Abnormal Load Technical Committee, 2014. Roadmap for the Regulation of Car
Carriers in South Africa.
Benade, R., Berman, R., Nordengen, P. and Kienhöfer, F., 2016. Assessing the Roll
Stability of Heavy Vehicles in South Africa. In: South African Transport Conference.
Pretoria.
Benade, R., Kienhöfer, F., Berman, R. and Nordengen, P., 2015. A Pro-Forma Design for
Car-Carriers : Low-Speed Performance-Based Standards. In: South African Transport
Conference. Pretoria, pp.253–265.
Department of Transport, 1996. National Road Traffic Act. Republic of South Africa.
Elischer, M. and Prem, H., 1998. Stability of Over-Height Low-Density Freight Vehicles
and Its Prediction. In: 5th International Symposium on Heavy Vehicle Weights and
Dimensions. Queensland, pp.147–160.
Gillespie, T.D., 1992. Fundamentals of Vehicle Dynamics. Society of Automotive
Engineers.
National Transport Commission, 2008. Performance Based Standards Scheme – The
Standards and Vehicle Assessment Rules. Melbourne.
De Pont, J., 2010. The Development of Pro-Forma Over-Dimension Vehicle Parameters.
TERNZ.
De Saxe, C.C., 2012. Performance-Based Standards for South African Car-Carriers.
MSc disseration, University of the Witwatersrand, Johannesburg.