Embed Size (px)
Citation preview
A Preliminary Quantitative Survey of the Echinoid Faunaof Kealakekua and Honaunau Bays, Hawaii'
THOMAS A. EBERT2
DURING 8 DAYS in early August and October,1968, the members of an expedition from theUniversity of Hawaii examined the distributionand abundance of sea urchins in two bays alongthe Kona (leeward) Coast of the Island ofHawaii (Fig. 1) : Kealakekua Bay (19 0 28' N;155 0 55' W) and Honaunau Bay (19 0 25' N ;155 0 55' W). The major sampling effort wasexpended in Kealakekua, the larger of the twobays. The expedition was part of a program tosurvey the biota of Kealakekua. Informationgathered from this survey will form a baselinefor assessing changes that may be brought aboutby the activities of tourists and shoreline residents. At the present time, there is a small village on Kealakekua (Napoopoo) plus a smallnumber of homes at the middle and south endsof the bay. The north end, by Captain CookMonument, is uninhabited. At Honaunau Baythere is a small village, Honaunau, and theCity of Refuge National Historical Park. Bayrelated activities of people resident along theshorelines are fishing, principally with nets andhandlines, and domestic-waste pollution. Somesea urchins are taken for food, but not in greatnumbers. Tourist activities include the collection of slate-pencil sea urchins (Heterocentrotusmamm illattls) for their spines and the removalof snails and small coral heads. Tourists appearto be concentrated in Kealakekua Bay at Kaawaloa Cove by Captain Cook Monument. Boatsbring visitors from Kailua-Kona and, during thesummer months, make two trips per day carrying up to 120 passengers per trip. Honaunau hasno tourist boats and so possibly is not used asextensively. The area near Cook's Monumentwas selected for intensive sampling because ofthe high tourist density.
The August survey party consisted of Dr. J.Branham, E. Brecknock, J. McVey, and the
1 Manuscript received July 1, 1970.2 Department of Biology, San Diego State College,
San Diego , California 92115.
author; in October, the team consisted of E.Brecknock and D. Kelso.
ORGANISMS
Edmondson (1946) lists 14 regular urchinsfound as members of shallow-water benthic assemblages in Hawaiian waters. Eleven of thesewere found in Kealakekua and Honaunau baysand are listed below. The classification of Hyman (1955) is used.
Order CidaroideaFamily Cidaridae
Chondrocidaris gigantea A. AgassizEucidaris metularia (Lamarck)
Order DiadematoideaFamily Diadematidae
Diadema pa1lcispina A. AgassizEchinothrix calamaris (Pallas)E. diadema (Linnaeus)
Family ToxopneustidaeTripn enstes gratilla (Linnaeus)
Family EchinometridaeColobocentratus atratus (Linnaeus)Ecbinometrn matbaei (de Blainville)E. obionga (de Blainville)Ecbinostrepbus adculatus A. AgassizH eterocentrotus mammillatus (Lin-
naeus)
METHODS
Five areas were examined within KealakekuaBay, and single sites were selected withinHonaunau Bay and 1 mile south of Honaunau(Fig. 1) . From north to south, the samplingareas will be called: Napoopoo Light, KaawaloaCove, Napoopoo Breakwater, Ashihara Cottage,Palemano Point, Honaunau Bay, and 1 milesouth of Honaunau.
Urchin densities in Kealakekua were anticipated to be less than one animal per squaremeter. A plotless method of sampling was
112

Survey of Echinoid Fauna-THoMAS A. EBERT 113
DIK E..r .:':
.1 km.
POIN T
F IG. 1. Outl ine of Kealakekua and Honaunau bays, indicating their position in the Hawaiian chain.
selected, rather than quadrats, because I felt thatan appropriate quadrat with such densitieswould be so large that it would be cumbersomefor divers, or would have to be constructed ateach sampling site. The quarter method offorest sampling (Cottom and Curtis, 1956) wasmodified for underwater use by divers withSCUBA. A concrete block or smooth lava stoneweighing about 7 kg was used as the body ofthe sampling device. A cross of orange Glolitetape (such as used by construction survey teams)was attached to the block either with epoxy glueor small concrete-studs. A threaded stud wasdriven into the center of the cross and a snapswivel placed over the stud . A nut and washerprevented the swivel from coming off, but still
allowed the swivel to move freely around thestud. A 50-foot stainless steel tape was attached to the snap. In each quadrant, a divermeasured to the nearest sea urchin and recordedboth distance and species. Data were written onwhite plastic slates. The plastic is distributed byTransparent Products Corporation (1727-43 W.Pico Boulevard, Los Angeles, California 90015 )as no. VS-5300-08 pp, matte surface on bothsides, and 0.02" thick. It is available in 20" X40" sheets that are easily cut. Three divers wereused, and generally each was able to measurebetween eight and 13 points per dive. Initialpoints were haphazardly selected at the deepestportion of the transect. Divers were taken byboat or swam to the area above the deepest

114
port ion of the transect. Each diver was thengiven a concrete block and the first point waswherever he landed on the bottom. Subsequentpoints were taken along a line towards shore at20- to 25-foot (7 - to 8-meter) intervals.
Densities were calculated by first summing allthe individual distances without regard to species, determining the mean distance, standarddeviation, and standard error, and convertingthese into meters. The mean distance was thensquared, and used to estimate the mean area containing one urchin. Confidence intervals wereset by adding or subtracting one standard errorfrom the mean and redetermin ing the meanarea by squaring the result. Th is procedure issimilar to handling data on which a square-roottransformation has been performed (Sokol andRohlf, 1969) . For example, the mean distanceoff the breakwater at N apoopoo was 7.56 -t- .69feet.
7.56 ± .69 ft X 0.3048 m/ft =2.30 ± .21 meters2.302 = 5.29-the mean distance squared( 2.30 + .21) 2 = 6.30-the mean plus 1 SE squared(2 .30 - .21) 2 =4.37- the mean minus 1 SE
squared
The reciprocals of each of these squares givean estimate of the mean number of animals persquare meter plus or minus 1 SE of the mean ofthe distance measurements.
1/5 .29 =.19- the mean1/6.30 = .161/4.37 = .23
x=.19 + .4 or - .03 animals per square meter
The number of each species per square meterwas calculated by multiplying the total densityby the relative densities of the species. Relativedensity is defined as the number of a givenspecies divided by total number of individuals inthe sample. For a further discussion of thequarter method, see Cottom and Curtis (1956).
The initial August survey indicated higherdensities than anticipated, so sampling in October was done with I-m eter-square quadrats.Sampling was initiated as in quarter-methodsampling. The quadrat for the first sample wasplaced at the greatest depth; the next samplewas taken by simply turning the quadrat over,thus advancing 1 meter up the slope. Th e resultwas a set of quadrats forming a I -meter-wideband transect from deep water to the shore.
Ecbinometra sp. and Colobocentrotus were
PACIFIC SCIENCE, Vol. 25, January 1971
not included in the quarter method of samplingin August, but were included in the quadratcounts.
In analyzing urchin distribution and abundance, several parameters were estimated, whichwere also used in a phytosociological description(Curtis and Mcintosh, 1950, 1951) . Theseparameters are defined as:
Relative freqltency = number of occurrencesof one species as a percentage of the total number of occurrences of all species.
Relative density = number of individuals ofone species as a percentage of the total numberof individ uals of all species.
Relative weight = total wet weight of onespecies as a percentage of the total wet weight.
These relative values will be used to comparethe species composition of different areas, andare descript ive addit ions to the estimates ofabsolute density (number of individuals persquare meter) .
Relative frequency and density were determined directly from the quadrat counts or fromthe points of the quarter method; however, because individuals were not weighed whencounted, certain calculations were required toestimate weight. Animals were collected atseveral locations to determine the size structureof the populations. A sample (genera lly about100 individuals) was taken by collecting asmany animals from one location as possible. Itmust be stressed that the size distributions represent animals exposed enough to be seen by aswimmer. Thi s obviously introduces a bias infavor of large individuals, and animals under1 em were probably inadequately sampled, although the diver efficiency indicated by Larsson(1968) may mean that sampling was not adequate even for animals as large as 4 em.
Size distributions (Figs. 2 and 3) were constructed for H eterocentrotus, Ecbinotbrix calamaris, and Diadema in Kaawaloa Cove, forTripnenstes at Palemano Point, and for H eterocentrotus at Honaunau Bay. Because Ecblnometra lives in holes in the coral and is generallydifficult to extract, the sampling technique forthis species was different from that used forthe other urchins. Individuals were measured inplace in a series of I -meter quadrats in thecorner of Kaawaloa Cove. The urchins were
Survey of Echinoid Fauna-THoMAS A. EBERT 115
8
N ' 76
4 5 6 7TEST D.IAMETER (em)
3
H. M AMM ILLATUS N, 47LAVA RUBBLE, CAPT. COO K'S MONUMENT
H. MAMMILLATUS
HONAUNAU BAY
10
~
>-~ 30w:::>
5bo'"u,
~ 10
~w
'" 30
20
10
2
20
HETEROCENTROTUS M AMMILLATUS
30 CAPTAIN COO K'S MO NUMEN T
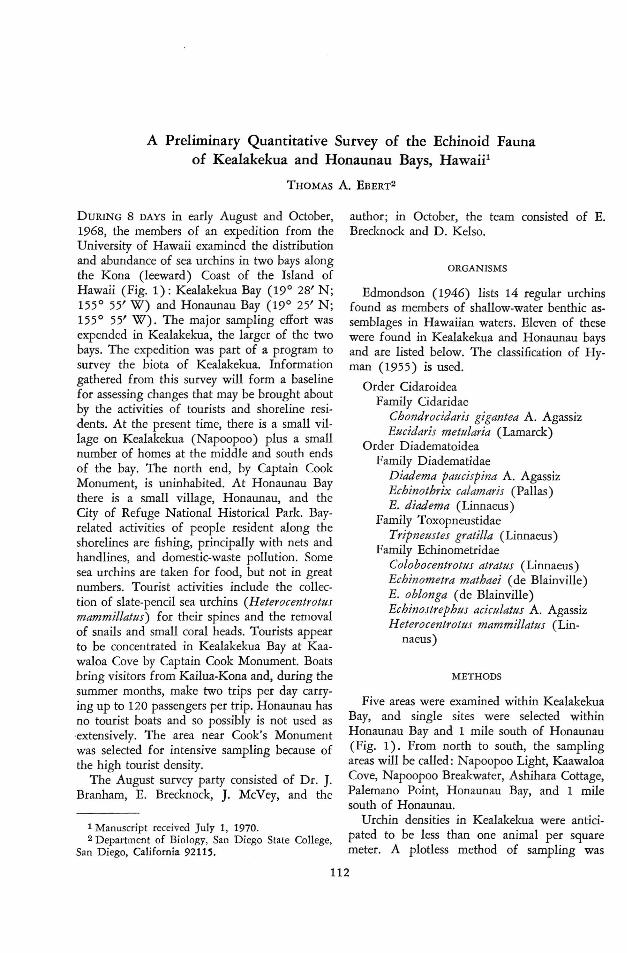
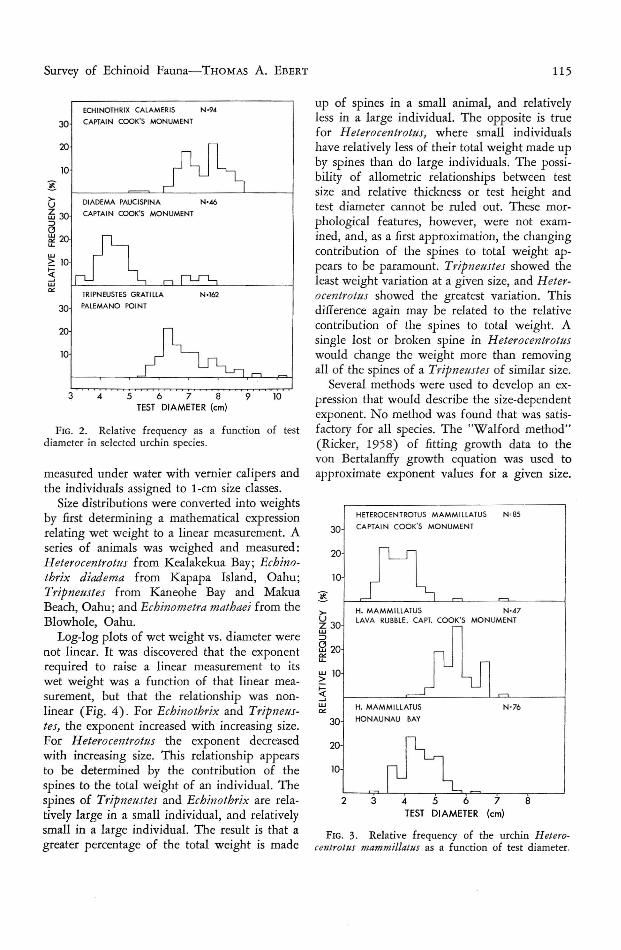
up of spines in a small animal , and relativelyless in a large individual. The opposite is truefor H eterocentrotus, wher e small individualshave relatively less of their total weight made upby spines than do large individuals. The possibility of allometric relationships between testsize and relative thickness or test height andtest diameter cannot be ruled out. These morphol ogical features , however, were not examined, and, as a first app roximati on, the changingcontribution of the spines to total weight appears to be paramount. Tripneustes showed theleast weight variation at a given size, and H eterocentrotus showed the greatest variation. Thisdifference again may be related to the relat ivecontribution of the spines to total weight. Asingle lost or broken spine in H eterocentrotuswould change the weight more than removingall of the spines of a T ripneustes of similar size.
Several methods were used to develop an expression that would describe the size-dependentexponen t. No method was found that was satisfactory for all species. The "W alford method"(R icker, 1958) of fitting growth data to thevon Bertalanffy growth equation was used toapproximate exponen t values for a given size.
FIG. 3. Relative frequ ency of the urchin H eterocentrotus mammillatus as a fun ction of test diameter.
105 678 9TEST DIAMET ER (em)
4
DIADEMA PAUCISPINA N '46
CAPTAIN COOK'S MO NUMENT
3
10
~>u~ 30:::>C~ 20u,
ECH INOTHRIX CALAMERIS N ·94
30 CAPTAIN COOK'S MON UMENT
20
FIG. 2. Relative frequency as a function of testdiameter in selected urchin species.
measured under water with vernier calipers andthe individuals assigned to t -ern size classes.
Size distributions were converted into weightsby first determining a mathematical expressionrelating wet weight to a linear measurement. Aseries of animals was weighed and measured :H eterocentrotus from Kealakekua Bay; Ecbinothrix diadem« from Kapapa Island, Oahu;Tripneustes from Kaneohe Bay and MakuaBeach, Oahu ; and Ecbinometra matbaei from theBlowhole, Oahu.
Log-log plots of wet weight vs. diameter werenot linear. It was discovered that the exponentrequired to raise a linear measurement to itswet weight was a functi on of that linear measurement, but that the relat ionship was nonlinear (Fig. 4) . For Echinothrix and Tripneustes, the exponent increased with increasing size.For Heterocentrotus the exponent decreasedwith increasing size. This relationship appearsto be determined by the contribution of thespines to the total weight of an individual. Thespines of Tripn eustes and Ecbinotbrix are relatively large in a small individual, and relativelysmall in a large individual. The result is that agreater percentage of the total weight is made

116 PACIFIC SCIENCE, Vol. 25, January 1971
.....zwz2xw
3
2
..o •~ .
• HETEROCENTROTUS MAMMILLATUS
3 ECHINOTHRIX DIADEMA
TR IPNEUSTES GRATILLA
selected for X max (Ricker, 1958). The value ofX m ax was adjusted to give the straightest line bya computer pr ogram that maximized the correlation coefficient. The constants derived fromthe regression of IIl(Xmax - Xd) on d wereused to write an expression relating the valueof an exponent to the animal size. The genera lform of the expression is :
Xd= xmax (1 - e-1'Cd- do») (1)
and, then to determine wet weight in grams,
W d = d"'d (2 )
where W d is wet weigh t at a given size and dis test diameter.
A second method of finding exponents wasby selecting constants from a regression of10glOx d on log-log d.
Wd= d" (l ogd). (3)
2 3 4 5 6 7 8 9TEST DIAMETER (em)
FIG. 4. Exponent (x) requ ired to convert ur chintest diameter (D) into wet weight in the express ionwet weight =D'" (diamet er in cent imeters and weightin gra ms ) .
Size classes were set up with a l -cm interval,and the mean exponent (x ) at a diameter (d +1 cm) was plotted as a funct ion of the exponentat size d. This is comparable to W alford 's lengthat ( t + 1) as a function of length at time t .The maximum exponent determined in thismanner was used as a trial value in the plot ofIIl( Xmax - Xd ) as a function of d. The straightness of such a plot is a function of the value
A third method was by using constants froma regression of lnlnW d on lnln d .
(4)
Gener ally, the best fit was obtained from expression 3 (Table 1). N o attempt was made todetermine a general expression relating wetweight to size for Ecbinometra. The size distribution of Ecbinometra matbaei in KaawaloaCove had a small mean and small standard deviation (mean diameter = 2.4 -1- .7 [SD] cm) .It was felt that an adequate estimate of weightdid not require the establishment of a generalexpression. Nine small Ecbinometrn were collected from rocky pools near the Blowhole,Oahu . Size range was from 2.27 cm to 3.74 cm.
TABLE 1
R EGRESSION EQUATIO NS R ELATI N G LI N EAR T EST MEASUREM EN TS IN CE N TI METERS (D) TO WET W EIGHTS
IN G RAMS ( W T)
SPE CIES
Heterocentrotusmammillatus
Echinothrixdiadema
T ripneustesgrati/la
AREA OF COLLECTIO N
Kealakekua Bay, Hawaii
Kap apa Island , Oahu
Kaneohe Bay, Oahu andMakua Beach, Oahu
N
26
35307
EXPR ESSION
W t =D 3. 063 (l og D) -.1<01
Wt =D2.8 39(logD) ··'·2
W t =D 2.688 (1_ e - ·7• ow- .51>O»
W t =e2. I 94 C11ID )1·"' ·
Wt =D2.620 (logD ) ·1<82
N OTE: Equations are listed for each species in order of adeq uacy in relating wet weight to test diameter. Goodness of fitwas determined by eye. Greatest length was measured in H eterocentrotus; diameters were measured in Tr ipneustes and Echinotbrix , All anim als were collec ted during August 1968.

Survey of Echinoid Fauna- THoMAS A. EBERT
W et weight of a 2.4-cm individual was determined graphi cally and found to be 8.2 grams.Average weigh ts for the other urchin specieswere found by calculating the weight of eachclass in the size distribution and multiplyingthis by the relative frequency of the class. Thesum of weight times frequency for all classesis an estimate of the weigh t of an average ind ividual , and was used to estimate the weight of agiven density of urchins and to calculate relativeweights.
For a species where no size distribut ion wasconstructed, weights were approximated by theurchin that most closely resembled it in size.Bucidnris and Ecbinostrepbus were approximated by Ecbinometre; Chondrocidaris was approximated by H eterocentrotus. All relativeweight values were based on the size distributions indicated above : all Ecbinotbrix populations were assumed to be like the one measuredin Kaawaloa Cove; all Tripneustes populationswere assumed to be like the one measured atPalemano Point; and so forth. The relativeweight values are subject to the errors inherentin these approximations of size structure. Aproblem developed in the underwater identification of the two species of Ecbin otbrix, so thatthere is doubt surrounding the actual field records; both E. dladema and E. calamaris werepresent, but data are pooled to avoid conveyinginconsistencies.
RESULTS
T otal Urchin Density
The initial stage of quarter data analyses wasto combine distance measurements at the pointsinto statistically homogeneous subsets of the entire sample. Because transects were made upa physical cline (dep th) in all but the N apoopoobreakwater transect, an analysis procedure wasselected that would permit separation of thetransect into subsets showing similar densities.Beginning at the bottom of the transects, distance measurements from adjoining pairs ofpoints were pooled, yielding subsets of eightmeasurements each (four measurements perpoint). For example, measurements from pointsone and two were pooled, those from pointsthree and four were pooled, etc. Cottom, Cur tis,and Hale ( 1953) showed that the mean values
117
of the four measurements at the points arenormally distributed so the means of the subsetswere tested for homogeneity by analysis of variance. The subsets were combined where nonsignificance of difference (p > .05) was indicated by Duncan's mul tiple range test (Walpole,1968). This procedure gave a single subset forthe entire transect, or the transect was brokeninto several homogeneous subsets (Table 2) .
Data gathered from the use of quadrats wereprocessed differently. In Kaawaloa Cove, quadrats were segreg ated by t o-foot depth intervals and the quadrats for the five transects werecombined on this basis. Statistical analysis involved the calculation of means and variances ateach la-foot level (Table 3) . A single meanwas calculated for areas showing low urchindensities (Napoopoo Ligh t and 1 mile south ofHonaunau).
Analysis of Species Comp osition in Each Area
AREA 1, BETWEEN NAPOOPOO LIGHT ANDKAAWALOA COVE : Of the sites sampled, thisarea and the transect 1 mile south of Honaunauwere the most exposed to waves. The bottomsloped rapidly away from the shore with severalvertical ledges of 15 to 20 feet ( 5 to 7 meters).Near shore, in the surf, the rocks were relativelybarren, with only a few Colobocentrotns. At adepth of about 30 feet ( 10 meters) the bottomwas covered with coral heads. Below this depth,the bottom dropped to 28 fat homs at an angleof about 30°. Three quarter-method transectsand a single transect using quadrats were run inthis area. Transects were perpendicular to theshore and started at a depth of about 80 feet( 25 meters). Of all regions sampled by thequarter method, distances to urchins from thecenter point were greatest in th is area. W hen nourchin could be found in a quadrant withi n aradius of 50 feet, the value of 50 feet was recorded and the species called "bl ank." Thisregion and the transects at N apoopoo breakwaterwere the only areas where blanks were recorded.Other areas fulfill ed the requirements of thequarter method with an urchin recorded forevery quadrant. The means of the distance measurements of the three transects were nothomogeneous by an analysis of variance (F (2 .8 1 )
= 11.22, P < .01). Means of two transects,

118 PACIFIC SCIENC E, Vol. 25, January 1971
TABLE 2
UR CHIN DENSITY ESTIMATES BASED ON THE Q UARTER M ETHOD OF SAMPLING
N UMBER OF DISTANCE ( m ) DENSITY**AREA SUBSET* MEASUREMENTS MEAN ± 1 SE ( n o ./m 2 )
1. N ap oopoo A 72 4.77 ± .56 .03 .04 .06
L ight B .006-
12 11.7 ± 1.0 .007 .009
2. K aaw alo a At 8 7.26 ± 2.32 .01 .02 .04
Cove B 16 2.08 ± .26 .20 .23 .30
C 32 1.62 ± .17 .31 .38 .47
D 4 3.61 ± .52 .06 .08 .10E 176 .64 ± .03 2.22 2M 2.73F 8 .84 ± .16 1.01 1.43 2.16
G 8 1.28 ± .16 .49 .61 .80
3. N ap oop ooBreakwater A 76 2.30 ± .21 .16 .19 .23
4. Ash ihara A 48 .92 ± .10 .96 1.18 1.48
Co tt age B 20 1.86 ± .24 .15 .29 .72-5. H o nau nau A 92 .68 ± .05 1.87 2.14 2.48
Bay B 40 .96 ± .10 .99 1.08 1.25
• Subsets determi ned by analysis of variance and Dun can 's multiple range test . Full explanation given in text.•• T he mean is underlined and bracketed by estimates based on I SE of the mean distance. See text for sample calcul ation ,t Spat ial relationship of the subsets in Kaawaloa Cove is shown in Figure 5. Relationships of subsets in other areas are
described in the text .
however, formed a homogeneous subset by Duncan's least significant range test. The two transects that were combined bracketed the statistically distinct transect. The variation between thetwo subsets accordingly cannot be attributed toa cline and is probably due to chance. Thelarger subset contained 72 distance measurements with 14 percent blanks. The smaller subset contained 12 measurements and had 33 percent blanks. Because the quar ter method requires
that the individuals be randomly dispersed, itwas necessary to determine whether the urchinswere indeed randomly distributed in the areasthat were sampled. The estimate of densityusing the quarter method is too low in aggregated populations and too high in regularly dispersed populations (Greig-Smith, 1964) . If apopulation is randomly dispersed, then thedistance measurements, if grouped into classes,should follow a Poisson distributi on. Deviation
T ABLE 3
ESTIMATE OF URCH IN D ENSITY FOR KA AWALOA COVE
MEANDENSITY DEVIATION
( n um ber per FROM A
DEPTH NUMBER OF square POISSON
( feet ) QUADRATS m eter) J2 ( chi2 ) d.f , SIGNIFICANCE
0.1-10.0 26 5.4 20.1 8 .19 2 P < .0510.1-20.0 27 5.7 5.5 0.65 2 N .S.
20.1-30.0 28 3.5 8.3 14.3 2 P < .0130.1-40.0 25 2.1 3.7 0.29 1 N .S.
40.1- 50.0 25 1.8 1.7 0.05 1 N .S .
50.1- 70 .0 22 1.1 0.9 0.0 4 1 N .S.
N OTE: Estimate based on I-square-meter quadr ats arra nged in band transects perpendicular to th e shore. Ecbin ametra isnot included in estimate.

Survey of Echinoid Fauna-THoMAS A. EBERT
from randomness was examined for each subsetof measurements by first constructing five frequency distributions using 0.5, 1, 2, and 4 feet,and the mean distance as interval widths. It wasfelt that construction of five distributions wouldbe similar to selecting five quadrat sizes forexamining dispersion. The choice of a singleinterval size for construction of the frequencydistribution would be analogous to arbitrarilyselecting a quadrat size for sampling, and sointerval size would influence statements concerning pattern and interpretation of the densityestimate using the quarter method. In the caseof the Napoopoo Light transects, the 72-valuesubset indicated that urchins were aggregated atall interval widths . Using a I-foot interval,significance of difference was at the .01 level(chi 2 ( 7 ) = 74.1) and the variance-mean ratiowas 13.4, which indicates that the deviation ofthe observed distribution from the expectedPoisson distribution was due to aggregation,rather than regular dispersion. When the meandistance was used as the interval size (15.7 feet,rather than 1 foot) , the resulting distributionwas still significantly different from a Poisson(chi 2 ( 2 ) = 45.5, P < .01); however, the variance-mean ratio was only 1.7. The decrease inthe variance-mean ratio with increasing intervalsize suggests that the animals appeared less aggregated when a large sampling unit was used.This decrease in the ratio may also mean thatthe animals occurred in large clumps or inaggregates of small clumps.
The 12-value subset was too small to analyzeby grouping values into a frequency distribution; however, the variance-mean ratio of thedistance measurements was 3.7, again indicatingaggregation. Estimates of density for the twosubsets are .04 + .02 or -.01 urchins persquare meter for the 72-point subset and .007 +.002 or -.001 urchins per square meter for the12-value subset (Table 2). Because the urchinswere not randomly dispersed, these density estimates are low.
Densities estimated from quadrats are higher.The single transect by the lighthouse gave adensity estimate of .67 -1- .24 (SE) animals persquare meter, not including Echinometra and.83 -1- .27 urchins per square meter , includingEchinometra. Aggregation, however, was stillindicated with a variance-mean ratio of 2.
119
Echinothrix and Heterocentratus were the dominant urchins, according to the quarter method,with relative weights (percentage of urchin biomass) of 65.5 and 29.4, respectively (Table 4).Tripneustes, Eucidaris, and Ecbinostrepbus weresimilar with relative weights all less than 5 percent. Relative weights determined from thequadrats were similar, although H eterocentrotushad a somewhat lower value and Echin othrixhad a somewhat higher value: 20 for H eterocentrotus and 75.9 for Echin othrix. Tripneustes,Eucidaris, and Echinometra were less than 5.Ecbin ostrepbus was not detected in the quadrattransect, and Echinom etra was not counted whenthe quarter method was used. The wet weight ofurchins per square meter indicated by thequarter method was 5 grams for the 72-pointsubset, and 1 gram for the 12-point subset. Thewet weight calculated fr om the quadrat datawas 130 grams per square meter. As indicatedby forest populations (Cottom and Curtis ,1956) , when individuals are aggregated, thedistance measurements of the quarter methodare too long, and indicate fewer individuals perunit area than are actually present. Althoughnot documented , all divers agreed that whendensities were low there was a good chance thatthe urchin closest to the block would not alwaysbe found. The small number of quadratscounted may also lead to an error in estimation .
AREA 2, KAAW ALOA COVE: The cove appearedto be very protected fr om waves. The degreeof protection is suggested by the fact that thebay is used for boat moorage during winterstorms. Six quarter-method transects were run:three in front of Cook's Monument (one directly off the Monument, and one on each side)and three south of the Monument, and off a geologic dike (one transect directly off the dike andone on each side). Five quadrat transects wererun from directly in front of the Monument tothe corner of the cove between the Monumentand the dike . The rate of descent was between30° and 50°, with the highest rate directly infront of the Monument. The shallow waters,less than 4 feet deep, were different in the twoareas of the cove. The area off the dike was atthe base of a tallus slope, and was composed oflarge lava boulders that did not support a lushcoral growth. Coral rubble with some livingcoral formed the substrate in the shallows in

120 PACIFIC SCIENCE, Vol. 25, Janu ary 1971
TABLE 4
RELATIVE DENSITY AND RELATIVE W EIGHT OF URCHINS IN EACH AREA
RELATIVENUMBER OF DENSITY
QUADRATSOR (number/POINTS OF NUMBER OF total RELATIVE
AREA SPECIES OCCURRENCE URCHINS number) WEIGHTt
1. Napoopoo H eterocentrotus 16 33 47.1 29.4Light (quar ter ) Echin othrix 17 26 37.1 65.5
T ripneustes 4 4 5.7 4.5Eucidaris 3 5 7.1 0.4Ecbinostrepbus 2 2 2.9 0.2
1. N apoopoo H eterocentrotus 6 9 32.1 20.0Ligh t (quadrat) Echin oth rix 10 12 42.9 75.9
T ripneustes 1 1 3.6 2.8Eucidaris 2 3 10.7 0.6Ecb in om etra 3 3 10.7 0.6
2. Kaawaloa H eterocentrotus 2 2 15.4 9.8Cove (quarter) Echin othrix 3 3 23.1 4 1.7Subset B Tr ipneus tes 3 7 53.8 43.6
Chond rocidaris 1 1 7.7 4.9
2. Kaawaloa H eterocentrotus 6 13 40.6 30.1Cove (quart er) Echin othrix 4 4 12.5 26.3Subset C Tripneustes 7 14 43 .7 41.3
Ch ondrocidaris 1 1 3.1 2.3
2. Kaawaloa H eterocentrotus 42 145 84.3 69.1Cove (quarter ) Echinothrix 13 21 12.2 28.5Subset E T ripneustes 1 2 1.2 1.2
Eucidaris 1 1 0.6 0.0Chondrocidaris 1 1 0.6 0.5D iadema 1 2 1.2 0.7
2. Kaawaloa H eterocent rotus 103 363 49.8 ( 75.1) * 57.4 (5 9.5) *Cove (quadrat) Echinothrix 41 69 9.5 ( 14.3) 31.1 (32 .2 )
T ripneustes 31 37 5.1 ( 7.7) 7.5 (7.8)Eucidaris 9 10 1.4 ( 2.1) 0.0 (0 .0)Ecbinom etra 50 246 33.7 - 3.5 -D iadema 3 3 0.4 (0.6) 0.4 (0 .4)Ech in ostrephu s 1 1 0.1 (0.2) 0.0 (0 .0)
3. Napoopoo H eterocent rotu s 19 55 77.5 60.4Breakwater Echinothrix 8 10 14.1 31.2(quarter) Tripneust es 4 6 8.4 8.4
4. Ashihar a H eterocentrotus 12 46 95.8 94 .0Cottage Echin othrix 1 1 2.1 5.8(quart er) Eucidaris 1 1 2.1 .2Subset A
4. Ashihara H eterocentrotus 5 13 65.0 41.5Cottage Echin othrix 3 6 30.0 54.5(quar ter) T ripneustes 1 1 5.0 4. 1Subset B
6. H onaunau H eterocent rotus 23 90 97.8 95 .9Bay (quart er) Echinothrix 1 2 2.2 4. 1Subset A
6. Honaunau H eterocen trotus 10 37 92.5 86.6Bay (quarter) Echin othrix 2 3 7.5 13.4Subset B

Survey of Echinoid Fauna-THoMAS A. EBERT 121
TABLE 4 (Continued)
RELATI VE
NU MBER OF DENSITY
QUADRATS OR (number/POINTS OF NUMBER OF total RELATIVE
AREA SPE CIES OCCU RRENCE URC HI NS number) WEIGHTt
7. 1 Mile H eterocentrotus 4 9 45.0 52.6South of Tr ipneustes 4 6 30.0 44.7Honaunau Eucidaris 1 1 5.0 0.5(quadrat) Ecbin ometra 3 4 20.0 2.1
• Relati ve values do not include Ecbin ometra.t Relative weight == calculated weight of a species/calcul ated weight of all species.
;
• J
•
•••
••
••
•
. ....-......... .( : F') •'-,~...j • ~· . ~
•
•
•
•
•
•
• ,.--'" ..._...._-/.'· ~...//.~. ~
•
•.\ ,..........
( ..<:.. Ci \ .>\.
I. • " \ .
0
r ••10 ; •i •i •20 \ •
B \-,\.
80 i . "::-"
90 ~-- -:~~A
110
100
tu 40 ; .wu.
:I: 60li:w070
TRANSECT AREACOOK MONUMENT DI.KE
2 3456TRAN SECT NUMBER
son (chi 2( 4 ) = 6.75, P > .05) . However, sig
nificant difference was obtained when the interval size was 0.5 foot (chi 2 (7) = 32.2, P < .01),which suggested that if a nonrandom patternexists, it is of a small scale. Distributions usinginterval sizes of 2 and 4 feet, and the meandistance (2.1 feet) also were not significantly
FIG . 5. Areas of equal urchin density in KaawaloaCove determined by the quarter metho d of samplingand variance analysis. Values for each area are givenin Table 2.
front of the Monument. Below 4 to 5 feet, therewas living coral in both areas. At depths below30 to 40 feet (10 to 15 meters), the two areasonce again differed. Off the Monument, Poritescompressa was the principal coral found, but theheads appeared dead except for their tips ; algaewere abundant between the coral fingers; andthere was considerable rubble, perhaps causedby anchor chains. Off the dike Porites pttkoe1Zsiswas more abundant, and more of the coral appeared to be alive.
The distance measurements of the six quartertransects were lumped to form two-point subsetsin each transect. The subsets were then groupedinto horizontal sets composed of similar pointsof all transects (i .e., all subsets formed frompoints one and two of all transects were groupedinto a single set; all subsets formed from pointsthree and four of all transects were grouped intoa single set, etc.) . Subsets within each set weretested for homogeneity of means and were combined according to Duncan's multiple range testat the .05 level. These new subsets were thentested vertically for homogeneity of means andcombined when not significantly different. Theresulting subsets represented regions of thetransects that had similar distance measurements.Seven regions were segregated by this technique (Fig. 5). One subset, subset E, includedthe major portion of the sampled region andcontained 43 points (172 measurements). Therewas one region with eight poin ts, subset C; onewith four points, subset B; three with twopoints, subsets A, F, and G: and one subset withonly one point, subset D. A frequency distribution of the distance measurements was constructed using intervals of 1 foot. This distribution was not significantly different from a Pois-

122
different from Poisson distributions with similarmeans. Subset B did not indicate aggregation atany interval size. Subset C distances were ofrandom length using a 0.5-foot interval (ch i'' (3)
= 6.0, P > .05) , and nonrandom at I- foot and. 2-foot intervals (chi2 ( 5 ) = 12.7, P < .05) , and
(chi2(3 ) = 8.46, P < .05). Mean distance
(Table 2) for subset A, the deepest subset (100feet), was 7.26 ± 2.32 meters, which gives adensity estimate of .02 + .02 or - .01 animalsper square meter. For subset B, at depths extending from 70 to 100 feet, the mean distance was2.08 ± .26 meters, which gives a density estimate of .23 + .07 or - .03 animals per squaremeter. For subset E, the shallowest subset (average depth about 30 feet), the mean distance was.64 -t- .03 meters, and the density 2.45 + .28 or-.23 urchins per square meter, indicatingdefinite decreases in density with depth, a conclusion also reached using the quadrat data(Table 3) . All species except T ripneustes decreased in density with increasing depth (F igs.6 and 7) . Densities were somewhat higher thanindicated by the quarter method, which gave anaverage density for a depth range from 5 to 60feet (2 to 20 meters). The range indicated fr omquadrat data, excluding Echinometra to make itcomparable to the quarter survey, was 5.4 -t- 0.9animals per square meter at a depth of zero to10 feet (2 to 3 meters) and 1.1 -t- .2 per squaremeter at 50 to 70 feet (19 to 20 meters) . If thevalues from quadrat sampl ing are weighted and
w 7en
+1 KAAWALOA COVE6
Clw
• HETEROCENTROTUSc<-c 5
o ECHINOTHRIX::J0en 4c<wto-w 3::Ec<w 2c,
c<W
""::E::JZ
5 15 25 35 45 55 65 75 85 95
DEPTH IN FEET
FIG. 6. D ensity of H eterocentrotus and Ecbinothrix as a function of depth in Kaawaloa Cove.
PACIFIC SCIEN CE, Vol. 25, January 1971
10 KA AWALOA COVE
w 9 • ECHINOMETRAeno TRI PNEUSTES
+l 8£:)wc<
7-c:::l0en 6c<wto-W 5::Ec<w 4n,
c<Wco 3::E::JZ 2
5 15 25 35 45 55 65 75 85 95
DEPTH IN FEET
FIG. 7. D ensity of Echinometra and T ripneustesas a fun ction of depth in Kaawaloa Cove.
combined in such a manner as to approximatethe quarter samples of subset E, the density estimate is 3.7 urchins per square meter, which ishigh er than the quarter-method estimate of 2.45-t- 0.28 or -0.23 and is a pattern often foundwhen quadrat and quarter data are compared(Risser and Zedler, 1968) . This difference againappears to be related to dispersion pattern . Generally, the urchins tended to be randomly dispersed within Kaawaloa Cove at any par ticulardepth (Ta ble 3); however, the exceptions atzero to 10 feet and 20 to 30 feet, if real,will influence the estimate of density. The safestconclusion is that the density for the majorportion of Kaawaloa Cove lies between 2.5 and3.7 urchins per square meter, exclusive ofEcbinometra, and that there are moee individualsin shallow areas.
According to the quadrat data, the only species to increase with depth was Tripneustes. Thistrend was also shown by the quarter method,where subsets B and C had greater densitiesof T ripneustes than did subset E. Relativeweights (Table 4) are similar by both samplingmethods: H eteracentrotus, with a relative weight

Survey of Echinoid Fauna-THoMAS A. EBERT
of 59.5 by the quadrat sampling method, and69.1 by the quarter sampling methods in subsetE, contributed the most to total biomass ofurchins . The next important urchin in terms oftotal biomass was Ecbinotbrix with a relativeweight of 32.2 using quadrats, and 28.5 in subset E of quarter sampling. All other urchinswere of minor importance in shallower waters .In deeper water, in subset B, Tr ipneustes contributed most to the urchin biomass with a relative weight of 43.6. Ecbinotbrix had nearly thesame relative weight (41.7), and Heterocentrotus formed only 9.8 percent of the urchin biomass. In subset C, the relative weights were:H eterocentrotns, 30.1; Ecbinotbrix, 26.3; andTripneustes, 41.3.
The total wet weight of urchins based onquadrat sampling was a function of depth inKaawaloa Cove (Fig. 8), approaching 1 kilogram per square meter in shallow water, anddecreasing to 100 grams per square meter at80 to 100 feet (30 meters) .
AREA 3, NAPOOPOO BREAKWATER: Directly
11 00
1000
900
800
w 700If)
+1 600N
2~ 500:coW 4003
300
200
100
5 15 25 35 45 55 65 7585DEPTH IN FEET
FIG. 8. Urchin biomass (w et weight) as a functi onof dep th in Kaawaloa Cove.
123
in front of the breakwater at Napoopoo, thebottom consisted of large coral mounds separated by sand. Two quarter-method transectswere run 100 and 200 feet from shore, andparallel to it. Water depth was 10 to 20 feet(3 to 5 meters) . Analysis of variance indicatedthat the measured distances of the two tran sects were homogeneous (F (l . 69 ) = 1.28, P >.05) , so distance measurements of the twotransects were combined. Distance measurements grouped by 0.5 foot intervals formed afrequency distribution significantly differentfrom a Poisson (chi 2 {1 3 ) = 224, P < .01) . Distributions also were significantly different froma Poisson using I-foot and 2-foot intervals, butwere not significant with a 4-foot interval, orwith the interval equal to the mean of 7.56 feet(chi2
{ 3 ) = 8.0, P < .05 and chi2( 2 ) = 1.7, P >
.05). The variance-mean ratio using a 0.5-f ootinterval was 5.1, which indicates aggregation.The mean distance was 2.30 + .04 or - .03animals per square meter (Table 2) . Becausethe population had an aggregated dispersionpattern, this estimate of density is too low. Thenature of the substrate explains the aggregation:coral heads separated by sandy areas whereurchins were not found . Relative weights (Table4) are, however, still valid in describing thecomposition of the urchin biomass. Heterocentrotus and Echinothrix were similar to subset Eof Kaawaloa Cove, and Tripnenst es was higher:60.4 for H eterocentrotus, 31.2 for Ecbinotbrix,and 8.4 for Tr ipneustes .
AREA 4, ASHIHARA COTTAGE. The fourth areawas a lava rock shore in front of a cottageowned by T. Ashihara of Kealakekua, Hawaii .A single 17-point transect was run from about300 feet (100 meters) offshore into a smallcove in front of the cottage. Water depth wasfrom about 30 to 5 feet (10 to 2 meters) .Measured distances for two-point subsets did notform a homogeneous set for the entire transect(F (S ,59 ) = 4.81, P < .01). Two homogene oussets could be forme d using Duncan's multiplerange test which separated the transect into itsupper five points and lower 12 points. Withinthe lower 12 poin ts, the frequency distributionof distances grouped by I-foot intervals was notsignificantly different from a Poisson (chi 2 (3 ) =7.59,p < .05) , indicating a rand om distribution of animals. Using o.S-foo t intervals, the

124
resulting distribution of distance measurementswas significantly different from a Poisson(chi 2 (5 ) = 28.9, P < .01), with a variancemean ratio of 3.6. In the upper five points, useof a 4-foot interval size produced a frequencydistribution that departed significantly from aPoisson (chi 2 ( 6 ) = 17.1, P < .01); other interval sizes produced frequency distributions thatwere not significantly different from Poisson distributions. Accordingly, the urchins can be considered to be generally randomly dispersed, andestimates of density should be accurate. Themean distances were 0.92 -I- 0.10 meters in thelower subset and 1.86 -I- 0.24 meters in theupper subset. These give density estimates of1.18 -I- .30 or - .22 and 0.29 + .43 or -0.14,respectively. H eterocentrotus contributed mostto urchin biomass in the lower subset with arelative weight of 94.0. In the upper subset, itformed 4.5 percent of the biomass. Ecbinotbrixmade up 5.8 percent of the biomass in the lowerand 54.4 percent in the upper subset. Eucidariswas present in the lower and not present in theupper subset, and Tripneustes was in the upperand not present in the lower subset. The distribution of the urchins is interesting whencompared with subset E in Kaawaloa Cove,where Eucidaris was present near the surface,and not deep, and Trip neustes was rare near thesurface, and more abundant at lower depths.
AREA 5, PALEMANO POINT : The fifth area wasa protected shelf at Palemano Point at the southend of Kealakekua Bay. A lava flow formed aflat area with rocks rising above the water surface. There were many shallow pools, some ofwhich were sandy. The plotless method was notused here, but rather a I-meter quadrat was employed to sample a densely aggregated population of Tripneustes. A total of 30 quadrats wereenumerated in 1Y2 meters of water . The band ofurchins was about 8 meters wide and 20 meterslong. Mean density within the aggregation was4.3 per square meter; however, the range wasfrom zero to 12. Heterocentrotus, Ecbin otbrix ,and Ecbinometra were present in the area aroundthe Tripn eustes bed, but were not abundant. Theareas where Tripneustes was present were bareof algae, although algae and coral were presentin surrounding areas.
AREA 6, HONAUNAU BAY: Sampling was donejust north of the canoe landing at the village of
PACIFIC SCIENCE, Vol. 25, January 1971
Honaunau. The bottom was principally composed of living coral. Depth ranged from 10 to35 feet (3 to 10 meters) . The bottom slopedvery gently for a distance of about 100 metersfrom shore, where it descended rapidly to 23fathoms. Although the average slope was small,the bottom consisted of very large coral mounds,separated by coral-filled valleys, so locally therewas high relief. Some of the mounds appearedto be dead . Sampling was initiated just shoreward of the drop-off, where three plotless transects were run perpendicular to the shore.
The means of the distance measurements ofthe three transects did not form a homogeneoussubset (F (2,129 ) = 4.10, P < .05) . Duncan'sleast significant range test indicated that two subsets should be formed, one with 23 points (subset A) , and the other with 10 (subset B). Meandistance in subset A was .68 -I- .05 meter, and insubset B, it was .96 -I- .10 meter. These givedensity estimates of 2.14 + .34 or -.27 animals per square meter, and 1.08 + .17 or -.09.Distance measurements grouped in I-foot andlarger intervals formed frequency distributionsnot significantly different from a Poisson in bothsubsets, indicating that the urchins were randomly dispersed. Relative weight values of thetwo subsets were similar, although Echin othrixwas somewhat more important in subset B. Thevalues were: for H eterocentrotus, 95.9 in subsetA, and 86.6 in subset B; and Ecbinotbrix 4.1 insubset A, and 13.4 in subset B. The two subsetsdiffered slightly in the method of selectingpoints. The two transects making up subset Awere set directly perpendicular to the shore, andso points were sampled both on the tops of thecoral mounds, and in the valleys betweenmounds. Subset B was taken by following avalley, and did not include points from the topsof the mounds. The conclusion is that the topsof the mounds may differ from valleys by havingmore animals, and there are more Echinothrixat the tops of mounds . Whether this is the result of the same interactions that produced zonation in Kaawaloa Cove is not known.
AREA 7, 1 MILE SOUTH OF HONAUNAU. Thefinal area that was sampled was about 1 milesouth of Honaunau Bay. A single transect usingquadrats was run from a depth of 60 to 20 feet( 20 to 6 meters). The bottom was lava, and theshore was exposed to the sea. The transect was

Survey of Echinoid Fauna- THoMAS A. EBERT
similar to the transect at Napoopoo Light withrespect to wave action, exposure, and so forth.Density of Ecbin otbrix was estimated to be.67 -f- .24 compared with .83 -f- .19 at the lighthouse, and with Ecbinometra, the density was.83 -f- .27 compared with .93 -f- .20 at thelighthouse. The urchins were aggregated asindicated by the variance-mean ratio of 2.0. Th eurchin biomass was composed of 52.6 percentH eterocentrotus, followed by T rip neustes (44.7percent). Echinothrix did not appear in thesample, and its absence is a major difference between this sample and those at Napoopoo Light,where Echinothrix formed the major segment
125
of the urchin biomass by both the quartermethod and quadrat sampling.
Comparison of Areas
Not only did major areas differ in absolutedensity of animals, but the relative contributionsof different urchin species varied from regionto region. To organize this information, aclustering analysis was performed which permitted similar areas to be lumped together(Table 5) . Th e distribution of relative densities or frequencies of a species in two areas distribute themselves in a 2 X 2 contingency tableaccording to chi-square (Greig-Smith, 1964, p .
TABLE 5
P OSSIBLE G ROUPS OF AREAS BAS ED ON R ELATI VE FR EQUENCY AN D R ELATI VE DEN SITY OF H eterocentrotus ,Ecbinotbrix, AND Tripneustes
H eterocentrot us
Gr oupI H onaunau A
(96, 98 )II Ashihara A, Honaun au B, Kaawaloa E, Na poopoo Breakwater
(86, 96) (83, 93) ( 71,84) (61,77)
III Napoopoo Breakwater, Kaawaloa Quadrats, Ashihara B
( 55,75) ( 56, 65)IV 1 Mile South of H onaunau, N apoopoo Light A and B, Kaawaloa C, N apoopoo Light Quadrats
(44, 56) (38,47 ) (33 ,41) (3 2, 36)V Kaawaloa B
( 22, 15)
Echinothrix
GroupI N apoopoo Light Quadrats, N apoopo o Light A and B, Ashihara B, Kaawaloa B
(5 3, 48) (41,37) (33, 30) ( 33. 23)
II Kaawaloa B, N apoopoo Breakwater, Kaawaloa Quadrats, Kaawaloa C, Kaawaloa E
( 26,14 ) ( 22, 14) ( 22, 12 ) ( 22,12)III Honaunau B, Ashih ara A, Honau nau A, 1 Mile South of Honaunau
( 17, 8 ) ( 7, 2) (4,2) (0 ,0)
Tripneustes
GroupI 1 Mi le South of Honaunau, Kaawa loa C, Kaawaloa B
(44, 38) (3 9, 44) (3 3,54 )II Kaawaloa Quadrats, N apoopoo Breakwater, Ashihara B, N apoopoo Ligh t A and B,
(17 , 8) (13 , 8) ( 11, 5) (9,6)N apoopoo Light Quadrats
(5 . 4)
III Napoopoo Light Quadrats, Kaawaloa E, Ashiha ra A, H onaun au A, Honaunau B( 2, 1) (0, 0 ) (0, 0) (0, 0 )
NOTE : Pair s of areas tested in. a 2 X 2 contingency table by chi" with Yates' s correction. Nu mbers in parentheses arerelative frequency an d relative density. respectively. Areas that are und erl ined are members of two groups.

126
39) . Recurrent groups were formed at the .05level of significance. Groups of areas wereformed for Heterocentrotus, Ecbinotbrix, andTripneustes. Grouping was done both by relative density and relative frequency. Relativefrequency is defined as the number of occurrences of one species as a percentage of the totalnumber of occurrences of all species (Curtis andMcIntosh, 1950, 1951). Not too surprisingly,the two measures generally agreed. A group ofareas for a species was formed by first rankingthe relative values from high to low; then thearea showing the highest value was placed withall those areas which did not differ significantlyfrom it. The group was checked with the firstgroup formed using relative frequency. Differences were confined to the last one or two areasassigned to a group. Only rarely, however, didthe penultimate member of a group overlapwith a succeeding group . The rule that was usedto decide whether a terminal member should beincluded in two groups or should be eliminatedwas that, if by either relative density or relativefrequency two areas were significantly differentat the .01 level, they would not be placed in thesame group, even though by one test, they maynot have been significantly different. If they
.were not significantly different by one test andsignificant at the .05 level by the other test,they were placed together . Occasionally, the lastmember of a group was used as the first memberof the succeeding group . Five groups of areaswere segregated for H eterocentrotus, three recurrent groups for Ecbinotbrix, and three forTripneustes. No definite pattern exists for anyspecies, although there is a tendency for Heterocentrotus to be densest inside protected areas,and in relatively shallow water. For H eterocentrotus, groups I, II, and III all have membersthat are either more protected or shallower orboth than are the members of groups I and V.The general pattern of Echinothrix is that , relatively, it may be more abundant in exposed areasthan Heterocentrotus, but the pattern is not consistent. Trip neustes appears to occur in greatestabundances where living coral is sparse. GroupI for Tripneustes consists of areas that are eitherexposed or deep. Group III, with the lowestabundances of Trip neustes, has four areas thatare protected from waves and have masses ofliving coral. Again, however, the pattern is not
PACIFIC SCIENCE, Vol. 25, January 1971
consistent. There are three recurrent groups,however, that are consistent for all three species:two of these recurrent groups are from insidebays and one is outside. One group from inside abay consisted of the Honaunau Bay transects,and the lower portion of the transect in frontof the Ashihara cottage in Kealakekua Bay. Theother group inside a bay was made up of themajor portion of Kaawaloa Cove, and the transects at Napoopoo breakwater, both in Kealakekua Bay. The group outside bays consisted ofthe transects at Napoopoo Light. Other areaswere variously grouped for different species.The great degree of variability in species composition was not expected and will be discussed inthe following section.
General Observations on Urchins
Kier and Grant (1965) suggest that the threeprimary factors controlling echinoid distributionin Key Largo Coral Reef Preserve, Florida aredepth, substrate, and distance from shore, withother possible influences being light penetrati on,wave agitation, current direction, water temperature, and food supply. In Kealakekua and Honaunau bays, there are at least six, and possiblyseven, factors which must be considered, someof which are the same as those suggested by Kierand Grant; these factors are: depth , substrate,exposure to waves, food, predators, animal behavior, and chance. None of these can be assessed with the data presented; however, severalreasonable suggestions can be made, and problems for further study defined.
DEPTH: There was little correlation betweenassemblage composition and depth. In KaawaloaCove, Tripneustes was infrequent near shore inshallow water, and showed both a higher densityand higher relative weight at lower depths . Itincreased in numbers as other urchins decreased.Off the Ashihara cottage, Tripneustes was rarein the lower part of the transect and moreabundant near the shore. At Palemano Point, itwas the most abundant urchin in 1 meter ofwater. Eacidaris in Kaawaloa Cove was foundonly near the surface, but is described by Edmondson (1946) as generally being more common at depths of several fathoms. Cbondrocidarls was found only in the deepest portions ofthe transects, and because transects generallywere not initiated below 50 to 60 feet (20

Survey of Echinoid Fauna-THo MAS A. EBERT
meters) , it was recorded only from KaawaloaCove, where some transects were begun at 110feet. This distribution is in accord with thatsuggested by Edmondson (1 946).
There was a striking decrease in the numb ersof urchins with increasing depth in KaawaloaCove. The reverse, however, was true for thetransect off the Ashihara cottage, where therewere more animals away from shore in deeperwater than were present in the shallows. Itwould seem that depth, pel" se, is unimportantin determinin g distribution. In cases where thereis a correlation with depth, it is necessary toexamine more environmental factors to de termine the causes for observed distributions.
SUBSTRATE: Certain substrate requirementsappeared to be associated with each species:crevices for H eterocentrotus, small ledges orlarge cavities for Ecbinotb rix , and low reliefwithout living coral for T ripneustes. Presence ofcoral, either living or dead, did not appear tobe required for H eterocentrotus or Ecbinotbrix.In the Ashih ara transect, there was living coralaway from shore, and near shore the rocks wererelatively barren. In Kaawaloa Cove, dead coralincreased with depth. The area at PalemanoPoint where T ripneustes was abundant alsolacked living coral. H eterocentrotus was foundboth on living and dead coral, and on lava rocks.The size distribution of H eterocentrotus on thelava tallus by the dike in Kaawaloa Cove wasskewed towards large individuals. Whether thiswas due to a more rapid growth rate or longerlife than urchin s in coral areas of KaawaloaCove is not known.
EXPOSURE : Exposure to the open sea is correlated with numbers of certain urchin species.Generally, density decreased fr om a protectedbay to the exposed coast. The cluster analysis ofareas segregated Napoopoo Light from thewithin-bay samples. H owever, the analysis didnot group the sample gathered 1 mile south ofHonaunau with the sample from N apoopooLight, although they had similar exposure towaves. There was a higher urchin density in allareas of Kealakekua and Honaunau bays thanin transects at N apoopoo Light and 1 mile southof Honaunau. Species diversity was high est inKaawaloa Cove, but was low in Honaunau Bay,so protection from high surf does not ensurehigh diversity of urchin species.
127
Colobocentrotns was not present in KaawaloaCove, but was common in the surf by the lighthouse, and was observed at the top of the transect at the Ashihara cottage. Echin ometra oblonga was rare in Kaawaloa Cove, but was moreabunda nt in slightly more exposed conditions,such as the Ashihara transect and at the tops ofthe transects in Honaunau Bay. Ecbinostrepbnswas recorded only in Kealakekua Bay, and had ahigher relative weight in samples from theligh thouse than in samples fr om KaawaloaCove. H eterocentrotus had high er relativeweight values and higher densities in protectedregions. Ecbin otbrix appeared to be less sensitiveto wave exposure than did H eterocentrotus, andtherefore its relative weight value tended toincrease even though its densities decreased.T ripneustes showed no consistent pattern withrespect to exposure. At N apoopoo Light itformed a relatively unimportant fraction ofthe urchins with a relative weight of 4.5 by thequarter method, and 2.8 in the quadrat transect.One mile south of Honaunau, T ripnenstes wasthe second most important animal with a relativeweight of 44.7. In Kaawaloa Cove, in subset B,which was below 50 feet ( 15 meters) , Tripneustes made up 43.6 percent of urchin biomass.According to the cluster analysis, the relativefrequ ency and density of subset B were notsignificantly different fr om subset C, or from thetransect 1 mile south of Honaunau . Tripneusteswas most dense in the highly protected area atPalemano Point. If there is any pattern, it isprobably that T ripneustes can survive under awide range of surf cond itions, but does best inprotected areas.
FOOD : In Kaawaloa Cove, the decrease inurchin numb ers with increasing depth doescorrelate with decreasing light, and so presumably with primary productivity. Unlike Strongylocentrotus (Ebert, 1968) , in which biomass butnot numbers appeared to be food limited, bothnumbers and biomass of urchins in KaawaloaCove correlate with decreasing pr imary production. W hether food was actually limit ingwas, of course, not determined by this study.
PREDATORS: It is difficult to assign significance to the roles of predators in the distribution and abundance of these urchins. There wasonly one direct observation in the field : InKaawal oa Cove, a small (shell length 17.5 cm)

128
triton shell ( Charonia tritonis ) was found feeding on a slate-pencil sea urchin. When found,it was on top of the urchin, and when it wasremoved, a region devoid of spines was exposed. The triton was held out of water forabout 15 minutes, at which time it regurgitatedsecondary spines of H eterocentrotus. Whether itwould have killed the urchin is not known; however, tritons have been impl icated as predatorsof other echinoderms (Ch esher, 1969; Endean,1968-1969). This single triton was the onlyone seen, and the only act of predation observed.Fishes such as triggerfish, parrotfish, and wrassesundoubtedly eat urchins. Diodon hystrix , apuffer fish, feeds on Echinometra lucsnter inPuerto Rico (Glynn, 1968) and seems to be thelarge spiny puffer of Hawaii (Gosline andBrock, 1960) , where it occurs inshore andreaches approximately 2 feet in length. Pufferswere not observed in either Kealakekua or Honaunau bays, but undoubtedly occur in both.
BEHAVIOR: Behavior during two stages of thelife cycle may be important in urchin distribution : larval settlement and movements of theadul ts. There are indications that urchins tendto settle where adults live (Moore et aI., 1963;Ebert, 1968). Adult Ecbinus make seasonal migrations (Elmhirst, 1922; Stott , 1931), andmovement of adult Strongylocentrotus purpuratus and S. [ranciscanus (Leighton, 1960) , andParacentrotus (Kitching and Ebling, 1961) , islinked with food availability. In KaawaloaCove, low production rates in deep water mayresult in adult migration into shallow water.Adult movement would be important only forthose species that do not live in cavities of theirown construction. It is unl ikely that the distribution of Ecbinometra or Ecbinostrepbus is determined by adult behavior, and aggregation ofechinoderms due to social responses is considered unlikely (Reese, 1966 ) . The aggregateddispersion patterns that were observed may bedue to environmental heterogeneity, althoughmembers of the family Diadematidae, particularly the genus Diadema, do respond to othermembers of the same species, apparently by achemical sense (Snyder and Snyder, 1970) .
CHAN CE: Certain features of the distributionof urchins in this study do not appear to beassociated with physical or biological factors.At Napoopoo Light, Ecbinotbrix formed 65.5
PACI FIC SCIENCE, Vol. 25, January 1971
percent of the biomass by the quarter methodand 75.9 percent of the biomass by the quadratmethod. Ecbinotbrix did not occur in the transect 1 mile south of Honaunau. T ripneustes alsohad different abundances at these two stations,as described in the section on exposure, with ahigher density south of Honaunau than by thelighthouse. Finally, H eterocentrotus was abundant at most of the sites examined along theKona Coast, yet is generally uncommon in otherareas along the Hawaiian Island chain. WhetherH eterocentrotus was always rare in other areas isuncertain. Edmondson (1946) , referring primarily to Oahu, lists Tripn eustes and Echinothrix as common forms, and says that H eterocentrotus "frequents the outer border of the reefplatform, but young specimens are sometimesseen near the shore." The impression given byEdmondson is that H eterocentrotus has not beena dominant element in the echinoid fauna ofOahu for the past 70 years, if it ever was. Although H eterocentrotas is collected to makewind chimes for tourists, and Oahu has a largerhuman population, there are areas both onOahu and other islands that are at least as freeof human intervention as is the Kona Coast ofHawaii. H eterocentrotus is even present on theKona Coast in Kailua Bay, which receives substantial human waste pollution. The environment along the Kona Coast appears similar tothat of many other areas of Hawaii. Because ofthe absence of clear correlations with environmental factors, it seems probable that chancehas played a role in determining local distributions of such urchins as Echinothrix and Tr ipneustes, and, on a larger scale, in the establishment of the larger populations of H eterocentrotus along the Kona Coast.
Several general conclusions are warrantedfrom this study of urchins of Kealakekua andHonaunau bays on the Kona Coast of Hawaii.First, nearly the entire shallow water regularechinoid fauna of Hawaii is represented in thebays at Kealakekua and Honaunau. In descending order of abundance, the urchins are H eterocentrotus, Ecbinotbrix, and Ecbinometra, followed by Tripneustes and several minor species:Eucidaris, Diadema, Colobocentrotus, Chondrocidaris, and Ecbinostrepbus. This list includesmost of the shallow-water regular echinoidfauna of Hawaii. Lytecbinus, Pseudoboletia, and

Survey of Echinoid Fauna-THoMAS A. EBERT
Centrostephenus may be present. In this respect,the bays are not unique, for the urchins appearto be generally distributed among the islands inthe Hawaiian chain (Edmondson, 1946). Onlythe high abundance of Heterocentrotus isunique because, other than the Kona Coast anda few sites on Maui, such as Molokini Reef,H eterocentrotus is not common. A second conclusion is that urchins form a segment of theshallow-water communities that probably receives a large portion of the energy from primary production: standing crops near shorereach nearly 1 kilogram per square meter. Athird conclusion is that the urchin species appear to distribute themselves into loose aggregates independently of each other, and not indefinite associations, as suggested for the echinoids of Key Largo, Florida (Kier and Grant,1965). And finally, the species respond differently to features of their environment, and eithersome of these features are very subtle or distributions, in part, are determined by chance.
DISCUSSION OF METHODS
Because the information in this article maybe used as a baseline for future comparisons, itis necessary to make some general statementsconcerning the sampling techniques, because,under many conditions, the techniques determine the density estimates (Greig-Smith, 1964).Both quadrat and plotless methods used in thisstudy assumed random distribution of individuals, and the accuracy of estimating density decreases as the populations deviate from a randomdispersion pattern. The best estimates of densityare for Kaawaloa Cove, part of the Ashiharatransect, and Honaunau Bay, because all threeof these regions had urchin populations whichtended to fulfill the requirement of randomdispersion. The analysis of pattern from theplotless data is a new method, and requiresfurther examination to determine whether it isindeed valid. Pielou (1969) examined pattern,using distance measurements; however, shestated that an independent density estimate isrequired. Therefore, caution is required in theinterpretation of the statements concerning pattern of urchins in this study. The trends, however, are probably valid, and the method ofanalyzing pattern in this study appears to fall
129
within the general assumptions of the method(Clark and Evans, 1954; Morisita, 1957; Heyting, 1968) .
In regions where an aggregated dispersionpattern was indicated, the relative values offrequency and density are still valid, althoughthe density estimate will be too low (Cottomand Curtis, 1956) . If the dispersion patterndoes not change, then comparisons can be madewith these areas if similar sampling methodsare used at later sampling dates. Although difficult to handle underwater, plotless methods thatdo not assume random dispersion patterns, suchas the wandering-quar ter (Catana, 1963), or theangle-order method (Morisita, 1957), may berequired . The wandering-quarter would haveto be modified for marine populations, becausethis method assumes that the shape of an aggregation is a circle and that clumps of individualsare randomly dispersed-two assumptions thatoften will not be true for benthic populations.
The method of estimating wet weights forurchin populat ions by utilizing size structure,density, and the relationship between a linearmeasurement and wet weight will probably continue to be of general use, but may more profitably be replaced by treating the component partsof an urchin (spines, test, gut, and so forth)separately, and describing weight of each ofthese as a function of a linear measurement similar to a method of describing growth developedby Laird (1965).
SUMMARY
1. A preliminary survey was made of thesea urchin populations of Kealakekua andHonaunau bays on the Kona Coast of Hawaii.Sampling was done using both I-meter-squa requadrats and a plotless method, the pointcentered quarter method .
2. Eleven of the 14 regular urchins reported for Hawaii occurred in the samples.Wi thin bays, the most abundan t urchin wasH eterocentrotus, followed by Echinothrix. Totaldensity of all species of urchins was highestwithin areas protected from waves. In KaawaloaCove, average urchin density was between 2.5and 3.5 animals per square meter.
3. Maximum biomass of urchins was in shallow water in Kaawaloa Cove, where it ap-

130
proached 1 kilogram (wet weight) per squaremeter. Urchins form a segment of these shallowwater communities that probably receives amajor portion of the energy from primary production .
4. Seven factors are suggested as possiblybeing important in determining urchin distribution and abundance : depth, substrate, exposureto waves, food, predators, animal behavior, andchance.
5. The urchin species appear to distributethemselves into loose aggregates indep endentlyof each other, and not into definite species associations.
ACKNOWLEDGMENTS
Field work was supported by the Office of theLieutenant Governor of Hawaii through theResearch Corporation of the University ofH awaii. Statistical analyses were done at theUniversity's Statistical and Computing Center onan IBM System 360/50. Compu ter time wassupported by funds from the Unive rsity. Development of survey techniques was supportedby a Summer Research Initiation Award fromthe Office of Research Administration , University of Hawaii . For all of this support, I amgrateful. Alison Kay, Ernst Reese, and JeanetteStruhsaker kindly read and criticized the manuscript. Discussions of the quarter method withPaul Zedler and Boyd Collier were particularlyhelpful. Art work was done by Barbara Downs.
LITERATURE CITED
CANTANA, A. J. 1963. The wandering quartermethod of estimating popu lation density.Ecology, vol. 44, pp. 349-360.
CHESHER, R. H. 1969. Destruction of Pacificcorals by the sea star A canthaster planci. Science, vol. 165, pp . 280-283.
CLARK, P. J., and F. C. EVANS. 1954. Distanceto nearest neighbor as a measure of spatial relationships in populations. Ecology, vol. 35,pp. 445-453.
COTTOM, G., J. T . CURTIS, and B. W. HALE.1953. Some sampl ing characteristics of a population of randomly dispersed individuals.Ecology, vol. 34, pp . 741-757.
COTTOM, G., and J. T . CURTIS. 1956. The use
PACIFIC SCIENCE, Vol. 25, January 1971
of distance measurements in phytosociologicalsampling. Ecology, vol. 37, pp . 451-460.
CURTIS, J. T., and R. P. McINTOSH. 1950. Theinter-relati ons of certain analytic and syntheticphytosociological characters. Ecology, vol. 31,pp . 434-455.
- - - 1951. An upland forest continuumin the prairie-for est border region of Wisconsin. Ecology, vol. 32, pp . 476-496.
EBERT, T . A. 1968. Growth rates of the seaurchin Strongylocentrotus ptt/'pttl'atm relatedto food availability and spine abrasion. Ecology, vol. 49, no. 6, pp. 1075- 1091.
EDMONDSON, C. H. 1946. Reef and shore faunaof H awaii. Bernice P. Bishop Museum SpecialPublication 22, iii + 381 pp ., 223 figs.
ELMHIRST, R. 1922. Hab its of Ecbinus esculentus , Nature, vol. 110, p. 667.
ENDEAN, R. 1968-1969. Report on investigations made into aspects of the current A cantbaster planci (crown of thorns) infestationsof certain reefs of the great barri er reefs. Unpub lished report to the Harbours and MarineDepartment and Marine Board, Queensland,Austra lia, 37 pp .
GLYNN, P. W. 1968. Mass mortalities ofechinoids and other reef flat organisms coincident with midday low water exposure inPuerto Rico. Marine Biology, vol. 1, pp. 226243.
GOSLINE, W . A., and V. E. BROCK. 1960.Handbook of Hawaiian fishes. University ofH awaii Press, Honolulu. ix + 372 pp ., 277figs.
GREIG-SMITH, P. 1964. Quantitative plant ecology, 2nd ed. Plenum Press, New York . xii +256 pp.
HEYTING, A. 1968. Discussion and development of the point-centered quarter method ofsampling grassland vegetation. Journal ofRange Management, vol. 21, pp . 370-380.
HYMAN, 1. H . 1955. The invertebrates . Vol.IV, Echinodermata. McGraw-Hill Book Co.,New York. vi + 763 pp.
KIER, P. M., and R. E. GRANT. 1965. Echinoiddistribution and habits, Key Largo Coral ReefPreserve, Florida . Smithsonian MiscellaneousCollections, vol. 149, no. 6, pp . 1- 68 + 16plates .
KITCHING, J. A., and F. J. EBLING. 1961. Theecology of Loch Ine. XI. The control of algae

Survey of Echinoid Fauna-THoMAS A. EBERT
by Paracentrotus lioidus. Journ al of AnimalEcology, vol. 30, pp . 373- 383.
LAIRD, A. K. 1965. Dynamics of relativegrowth. Growth, vol. 29, pp . 249-263.
LARSSON, B. A. S. 1968. SCUBA studies onvertical distribution of Swedish rocky-bottomechinoderms : a methodological study.Ophelia, vol. 5, pp. 137-156.
LEIGHTON, D. 1. 1960. Studies of kelp -grazingorganisms. Kelp Investigations ProgramQuarterly Progress Report , Janu ary I-March31, 1960. Un iversity of California Institute ofMarine Resources Reference 60-8, pp . 28-37.
MOORE, H . B., T . JUTARE, J. C. BAUER, and J.A. JONES. 1963. The biology of Lytecbinnsvariegattls. Bulletin of Marine Science, Gulfand Caribbean Fisheries Institute, vol. 13, pp.23-53.
MORISITA, M. 1957. A new method for the estimation of density by the spacing method applicable to non-randomly distributed populations. Physiology and Ecology (Kyoto) , vol.7, pp. 134-144 [In Japanese] . U.S. Department of Agriculture translation. 20 pp .
PIELOU, E. C. 1969. An introduction to rnathe-
131
matical ecology. John Wiley and Sons, NewYork . viii + 286.
REESE, E. S. 1966. The complex behavior ofechinoderms. In: R. A. Boolootian, ed., Physiology of Echinodermata, J. Wiley and Sons,N ew York. xviii + 822.
RICKER, W . E. 1958. Handbook of computations for biological statistics of fish populations. Fisheries Research Board of CanadaBulletin 119.
RISSER, P. G., and P. H . ZEDLER. 1968. Anevaluation of the grassland quarter method.Ecology, vol. 49, pp . 1006-1009.
SNYDER, N., and H . SNYDER. 1970. Alarm response of Diadems antillarnm, Science, vol.168, pp. 276-278.
SOKAL, R. R., and F. J. ROHLF. 1969. Biometry.W . H. Freeman and Co., San Francisco. xxi+776.
STOTT, F. C. 1931. The spawning of Echinusesculentus and some changes in gonad composition. Journal of Experimen tal Biology,vol. 8, pp. 133-150.
WALPOLE, R. E. 1968. Introduction to statistics.Macmillan Co., N ew York . xii + 365.