Embed Size (px)
Citation preview
A Preliminary Investigation of Algae and Cyanobacteria in
Lake Torment and Sherbrooke Lake
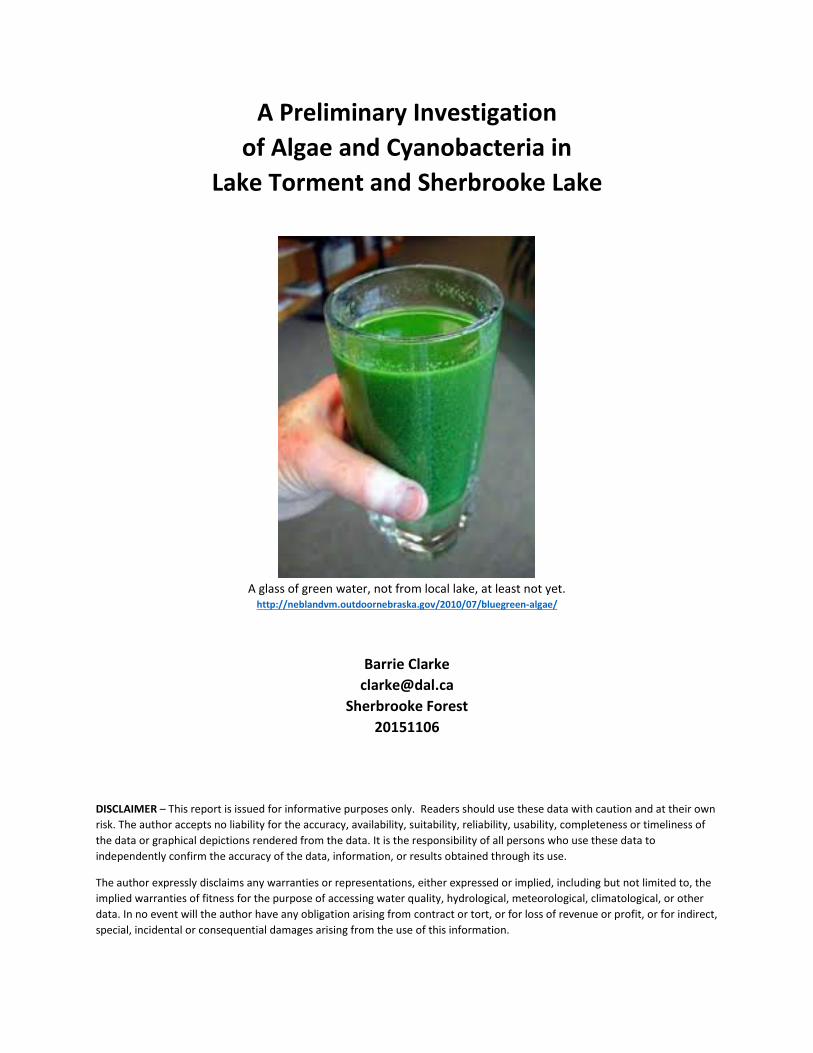
A glass of green water, not from local lake, at least not yet.
http://neblandvm.outdoornebraska.gov/2010/07/bluegreen-algae/
Barrie Clarke [email protected]
Sherbrooke Forest 20151106
DISCLAIMER – This report is issued for informative purposes only. Readers should use these data with caution and at their own risk. The author accepts no liability for the accuracy, availability, suitability, reliability, usability, completeness or timeliness of the data or graphical depictions rendered from the data. It is the responsibility of all persons who use these data to independently confirm the accuracy of the data, information, or results obtained through its use.
The author expressly disclaims any warranties or representations, either expressed or implied, including but not limited to, the implied warranties of fitness for the purpose of accessing water quality, hydrological, meteorological, climatological, or other data. In no event will the author have any obligation arising from contract or tort, or for loss of revenue or profit, or for indirect, special, incidental or consequential damages arising from the use of this information.

INTRODUCTION
Two types of “algae” grow in fresh-water systems: 1. large macroscopic algae, or freshwater “seaweed” of hundreds of different species, some of which attach themselves to the bottom and others that are buoyant in the water, and 2. tiny microscopic blue-green cyanobacteria suspended in the water, some species of which are highly toxic.
Algal blooms are the result of large increases in the amount of phytoplankton* or cyanobacteria in a water body, and these large increases in biomass lead to chemical and physical changes of the water. If cyanobacteria species dominate in a bloom, that bloom is potentially toxic, because some cyanobacteria species contain toxins in their cells that can be released during their life, or even after their death.
Experimental Lakes Area, NW Ontario. The lake in the foreground was artificially fertilized with phosphorus and has developed a green algal bloom. The lake in the background is natural. http://sevenhillslake.com/technical.html A common factor in triggering these blooms appears to be human activity, whether it is spraying of defoliants, clear-cutting, mink farms, cattle farms, malfunctioning sewage systems, straight pipes, use of fertilizers for farms or gardens or lawns, or some combination. All of these factors contribute an oversupply of nutrients to the waterways and promote the growth of algae and bacteria. (Under ideal conditions, 2 kg of fertilizer can produce 1000 kg (1 metric tonne!) of algae, so if every property on Sherbrooke Lake over-used just 1 kg of fertilizer, it could result in the growth of 100 tonnes of algae.) http://www.cleanwatermn.org/app_themes/cleanwater/pdfs/forTeachers/Algae.pdf
_________________________________________________________________________
*Phytoplankton are microscopic organisms occupying the sunlit upper layer of most bodies of salt and fresh water. By the process of photosynthesis, they use CO2 dissolved in the water to create organic compounds that form the foundation of the food chain. https://en.wikipedia.org/wiki/Phytoplankton

In recent years, several waterways in Nova Scotia have been negatively affected by cyanobacteria blooms, to the point that at least some of them were temporarily closed for health and/or recreational purposes. They include Mattatall Lake in Cumberland County, Blair Lake near Amherst, Lake Ainslie in Cape Breton, the Tusket-Carleton River system in Yarmouth County, and Lake Torment in King’s County. The first four are far away, but Lake Torment is only 8 km from Sherbrooke Lake.
Aerial photo of Mattatall Lake, October 2015 (courtesy of Bob MacLean)
Sherbrooke Lake has already shown the initial signs of developing algal blooms, the first one on June 23, 2014, and the second one on September 3, 2015. In both cases, these blooms showed up as narrow bands of green soup along the east shore of the lake (upper photo on next page). We should regard these two events as Nature’s warning shots across our bow.

Incipient algal bloom in Sherbrooke Lake, June 23, 2014. (Width of this photo is about 1 m.)
Western end of Lake Erie with Detroit-Windsor upper left. (Width of this photo is about 200 km.) Lake Erie is the smallest and shallowest of the Great Lakes, and is probably the one bordered by the most agricultural land. These conditions made it ideal for the lake to go green, but researchers worry that the other Great Lakes may go the same way. As Lake Erie is to the other Great Lakes, so Lake Torment may be to Sherbrooke Lake.
For more on Lake Erie, visit: http://news.algaeworld.org/2014/10/lake-erie-increasingly-susceptible-large-cyanobacteria-blooms/
NEW OBSERVATIONS ON SHERBROOKE AND TORMENT
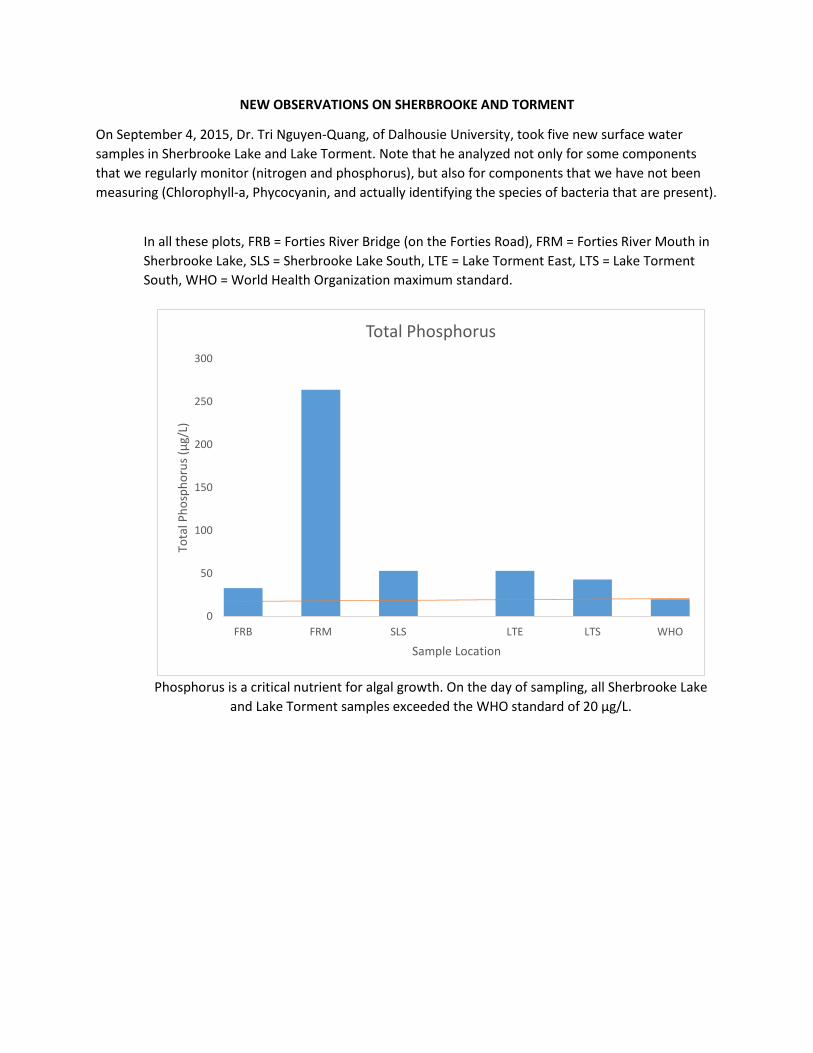
On September 4, 2015, Dr. Tri Nguyen-Quang, of Dalhousie University, took five new surface water samples in Sherbrooke Lake and Lake Torment. Note that he analyzed not only for some components that we regularly monitor (nitrogen and phosphorus), but also for components that we have not been measuring (Chlorophyll-a, Phycocyanin, and actually identifying the species of bacteria that are present).
In all these plots, FRB = Forties River Bridge (on the Forties Road), FRM = Forties River Mouth in Sherbrooke Lake, SLS = Sherbrooke Lake South, LTE = Lake Torment East, LTS = Lake Torment South, WHO = World Health Organization maximum standard.
Phosphorus is a critical nutrient for algal growth. On the day of sampling, all Sherbrooke Lake
and Lake Torment samples exceeded the WHO standard of 20 μg/L.
0
50
100
150
200
250
300
FRB FRM SLS LTE LTS WHO
Tota
l Pho
spho
rus (
μg/L
)
Sample Location
Total Phosphorus

Chlorophyll-a is a measure of the total algal biomass. It imparts the green colour to algal blooms. All samples are below the WHO standard of 10 μg/L, but Lake Torment East was close to exceeding this limit on the day of sampling.
Phycocyanin is an accessory pigment to Chlorophyll and a strong indicator of the presence of cyanobacteria (“blue-green algae”). It imparts the blue colour to algal blooms. Most of the samples have very low levels of Phycocyanin, but Lake Torment East, which also has high Chlorophyll-a, is way off the chart (the actual value is 12.35 μg/L).
0
2
4
6
8
10
12
FRB FRM SLS LTE LTS WHO
Chlo
roph
yll-a
(μg/
L)
Sample Location
Chlorophyll-a
0
0.5
1
1.5
2
2.5
3
3.5
4
4.5
5
FRB FRM SLS LTE LTS
Phyc
ocya
nin
(μg/
L)
Sample Location
Phycocyanin

Source: Biofluids and Biosystems Modeling Lab, Department of Engineering, Faculty of Agriculture, Dalhousie University.
Pie charts showing bacteria counts at the mouth of the Forties River in Sherbrooke Lake and at Lake Torment East. The Sherbrooke Lake sample has a greater variety of species, and contains some cyanobacteria species such as Anabaena flos-aquae, Anabaena subcylindrica, Merismopedia minima, Planktolyngbya limnetica, Pseudanabaena mucicola, Aphanocapsa planctonica, adding up to 41% of the total. The Lake Torment sample shows less diversity and contains much more cyanobacteria, with Anabaena flos-aquae, Merismopedia minima, and Aphanothese clathrata, adding up to 80% of the total. Anabaena is the variety that contains neurotoxins – Anabaena constitutes 12% of all bacteria at Sherbrooke Lake, and 33% of all bacteria in Lake Torment. For more information about toxic cyanobacteria, download the World Health Organization report entitled “Toxic Cyanobacteria in Water: A guide to their public health consequences, monitoring and management” from: http://www.who.int/water_sanitation_health/resourcesquality/toxcyanbegin.pdf

DISCUSSION
Summary of Results
The bottom line from these five new measurements is that phosphorus exceeds the WHO guidelines in both lakes (the reason for the very high concentration of P at FRM is unknown), and Chlorophyll-a and Phycocyanin are higher in Lake Torment than in Sherbrooke Lake. The toxic cyanobacteria Anabaena constitutes 12% of the bacteria in Sherbrooke Lake and 33% of the bacteria in Lake Torment.
Conditions Controlling Algal Growth (from: Clarke - Sherbrooke Lake Water Quality Report 2014)
Sometimes and in some places, there are a lot of algae, whereas in other times and places not so much. What conditions control their growth?
1. Lake size, shape, depth, amount of shore line, extent of shoals, and character of the bottom. So two adjacent lakes with different geometries could have different algal populations.
2. Soils of the watershed 3. Rate of precipitation 4. Sunlight 5. Nutrients in the water 6. Water pH (increases during photosynthesis in the day and decreases during respiration at night) 7. Wind mixing and concentrating
The algal population, both abundances and species, of a lake depends on all these factors. So, a narrow deep lake with no shoals, minimum shore line, little wind mixing, and unproductive watershed won’t have many algae, but Sherbooke Lake which is wide, mostly shallow, maximum shoreline, and highly susceptible to wind mixing will potentially have more algae.
Effects in Sherbrooke Lake
Lake Torment has already gone green more than once; Sherbrooke Lake has similar compositional properties, and is showing tendencies to do the same. Could we on Sherbrooke Lake be the cause these incipient blooms? The table below summarizes four important parameters over the last five years.
2010 2011 2012 2013 2014 Average WQIin 76 63 85 85 82 78 WQIout 71 62 85 78 82 76 Nout - Nin mg/L -0.082 -0.073 -0.077 -0.117 NR -0.087 Pout - Pin mg/L -0.002 -0.005 -0.007 -0.002 NR -0.004
WQI = Water Quality Index; N = nitrogen; P = phosphorus; NR = not reported
The first two rows show the Water Quality Index for water entering the lake (WQIin) and for water leaving the lake (WQIout). Within error, they are basically the same, suggesting that there is very little degradation of the quality of the water as it passes through the lake. The next two rows summarize two critical nutrients, nitrogen (N) and phosphorus (P). What is reported here are the concentrations of N

and P in the water leaving the lake minus the concentration of these nutrients entering the lake. In every case, the differences are negative, meaning that the concentrations of nutrients going out of the lake are lower than the concentrations coming in. The lake apparently consumes some of these nutrients, and there appears to be no overcompensating addition as a result of the current human activity on the lake.
Lessons from Mattatall Lake
Presumably the same might have been said about the impact of human activity Mattatall Lake at one time, but in September 2014 that lake suddenly went green. Should we start doing more in Sherbrooke Lake by analyzing for Chorophyll-a and testing for cyanobacteria? The cost of monitoring for algal toxicity would be much higher than what we currently spend for our water quality monitoring, but the costs of remediation are MUCH higher still.
Remediation has two aspects: one is to determine the source of nutrients to the lake and take appropriate steps to reduce their supply (but easier said than done - see Appendix at the end of this report), and the other is to clean up the algae that are already there. At Mattatall Lake, a small lake compared to Sherbrooke Lake, the remediation costs are estimated to be steep. And the cottage owners suffer a double jeopardy – first they have to pay for most or all of the remediation themselves, and second, their property values may decrease in the next assessment. Whatever that decrease is will cause a proportionate decrease in tax revenue from this lake for Cumberland County.
Mattatall Lake has about 85 cottages, divided into four cottage owners’ associations. The greening of the lake has led the residents to form a Mattatall Lake Stewardship Committee consisting of two members from each association, plus one additional member to avoid tie votes. So far, they have raised about $15,000 to begin the work of remediating this small lake. Is now the time to formally create a stewardship committee for Sherbrooke Lake? If not, are we just going to wait until the lake turns green?
One of the findings at Mattatall Lake was that some of the species of algae appear to be “invasive”, meaning that they are not native to that lake. One of the ways that species can invade is on the hulls of boats that have been in other waterways. That being the case, would we really want boats from places having high levels of toxic cyanobacteria to be frequenting Sherbrooke Lake, either from our own residents moving boats to another lake and coming back, or by opening the lake to more boats via some public access point? A lake that turns green is not good for anyone, not the visitors (the lake would be closed for their recreational use), not the residents (can’t use their own lake, drop in property values), and not the municipal councils of Lunenburg and Chester (loss of tax revenue). If closures and health advisories can happen in nearby Lake Torment, they certainly can happen in Sherbrooke Lake. As noted in the Introduction, the greater the degree of human activity, the greater the risk.

CONCLUSIONS
Sherbrooke Lake is showing some signs of developing an algae problem (occasional high levels of nutrients, increasing quantities of macroscopic algae, and occurrence of cyanobacterial blooms, some components of which are now known to be toxic). The one-time surface water sampling done on September 4th, 2015 confirms this concern. We now need to collect much more data on nutrients, Chlorophyll-a, Phycocyanin, and bacteria species to better understand the sources of nutrients, to take measures to reduce them in Sherbrooke Lake, and to assess the risk to public health.
Now is probably the time to form a Sherbrooke Lake Stewardship Committee. Its first task should be to find some person or agency with the interest, expertise, and perhaps also the money, to conduct a systematic investigation of the algal/bacterial levels in Sherbrooke Lake beginning in calendar year 2016.
In the meantime, it would be prudent to do nothing that might potentially increase the levels of nutrients and the populations of toxic cyanobacteria already in Sherbrooke Lake. The era of officially ignoring science has just recently come to an end in Canada. From now on, government policy at all levels should be informed by solid scientific evidence and advice.
ACKNOWLEDGEMENTS
Dr. Tri Nguyen-Quang, of the Faculty of Agriculture, Dalhousie University, for his interest in these lakes, for underwriting the costs of analysis, and for advice and assistance in preparing this report.
Bob and Marilyn MacLean, of Mattatall Lake, for sharing information about the algal blooms there.

Appendix: Restoring the Phosphorus Balance (in the Great Lakes) Source: https://www.ec.gc.ca/grandslacs-greatlakes/default.asp?lang=En&n=6201FD24-1 Managing phosphorus levels in lakes is complex, and inputs are only one part of the problem. Once in the lake, phosphorus and nutrients move throughout the system via the food web. The food web includes plants, animals and people as well as the habitats that support them. Along with nutrient sources, the structure of the food web and the organisms within it significantly influence the amount of nutrients available to contribute to excessive algal blooms. In recent years, the food web has been altered with the arrival of non-native invasive species. Over 180 aquatic non-native species have been either intentionally or accidently introduced into the Great Lakes since 1840. In some cases, these non-native invasive species have contributed to the increase in excessive algal growth in the Great Lakes, despite nutrient source reductions that were achieved in the 1970s. Non-native invasive organisms can take phosphorus and nutrients away from organisms that are native to the Great Lakes, altering the food web and ultimately changing the availability and forms of phosphorus in the ecosystem.
As a result of these ecosystem changes and changes in phosphorus sources, the nutrient management approaches used in the 1970s are no longer adequate.
To keep up with the ever-changing Great Lakes ecosystem of today, nutrient management must constantly adapt. New nutrient management approaches require research, monitoring and assessment, goal-setting, project implementation, and reporting that are reviewed and revised on a regular basis. By using this cyclical adaptive management model, changes related to phosphorus sources, the effectiveness of our management actions can be better understood. Nutrient management plans can be more targeted and more effective restoration actions can be identified and implemented.
THE NEXT TWO PAGES ARE THE NOVA SCOTIA INFORMATION SHEET ON “BLUE-GREEN ALGAE”


https://www.novascotia.ca/nse/water/docs/BlueGreenAlgae.pdf