Embed Size (px)
Citation preview
A Preliminary Examination of Snow to Liquid Ratios for Lake Effect
Snow at NWS Marquette, MI
Mike DutterNOAA/NWS Marquette, MI
Great Lakes Operational Meteorology WorkshopChicago, IL
14 March 2012Photo by Megan Babich
Purpose
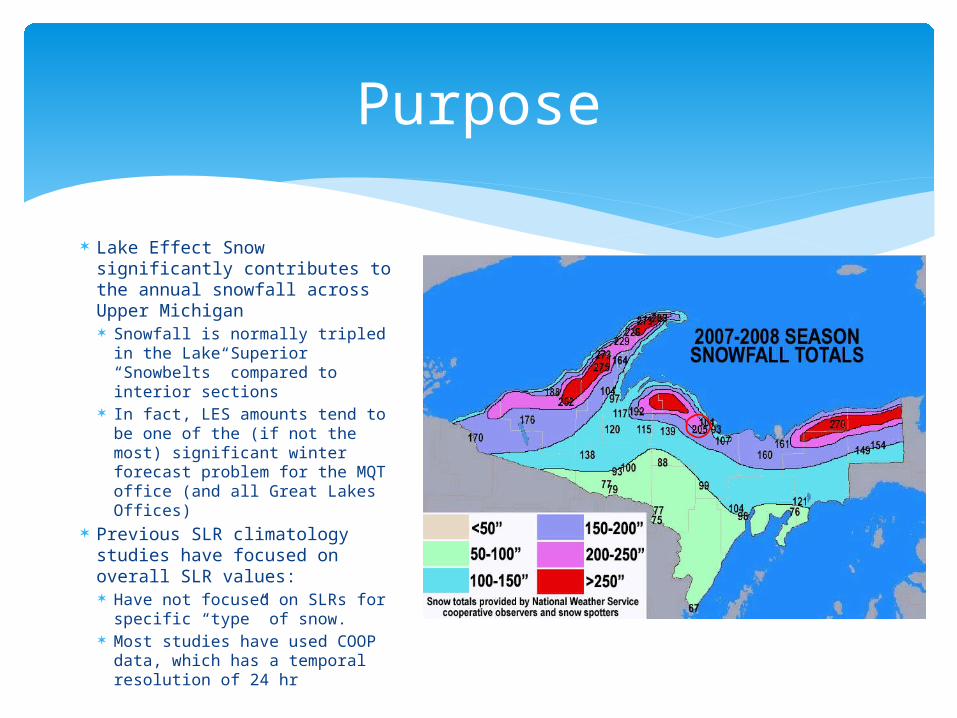
Lake Effect Snow significantly contributes to the annual snowfall across Upper Michigan Snowfall is normally tripled in
the Lake Superior “Snowbelts” compared to interior sections
In fact, LES amounts tend to be one of the (if not the most) significant winter forecast problem for the MQT office (and all Great Lakes Offices)
Previous SLR climatology studies have focused on overall SLR values: Have not focused on SLRs for
specific “type” of snow. Most studies have used COOP
data, which has a temporal resolution of 24 hr
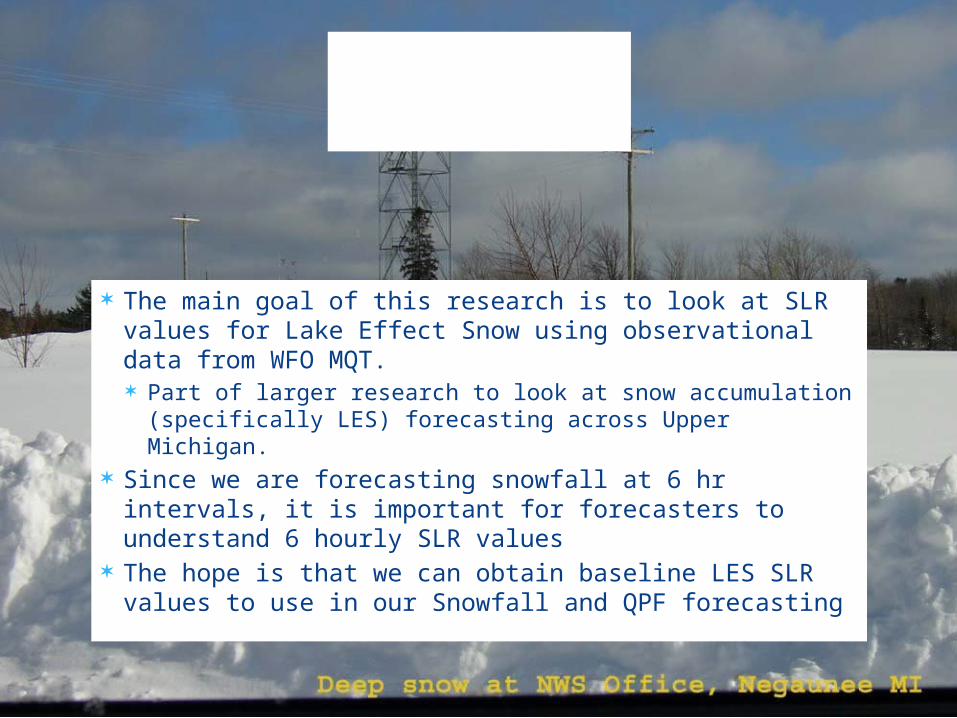
The main goal of this research is to look at SLR values for Lake Effect Snow using observational data from WFO MQT. Part of larger research to look at snow accumulation
(specifically LES) forecasting across Upper Michigan. Since we are forecasting snowfall at 6 hr intervals,
it is important for forecasters to understand 6 hourly SLR values
The hope is that we can obtain baseline LES SLR values to use in our Snowfall and QPF forecasting
Purpose
Looked at SLR climatology for the entire United States by National Weather Service WFO.
This study used COOP data to obtain a detailed SLR climatology for each WFO in the country.
Used 24 hr COOP data with snowfall amounts greater than 2 inches.
Although LES was mentioned in raising SLR values in the Great Lakes (especially in the middle of winter) little additional information was given regarding the impact of LES on the SLR values.
SLR Climatology from Baxter et al. (2005)
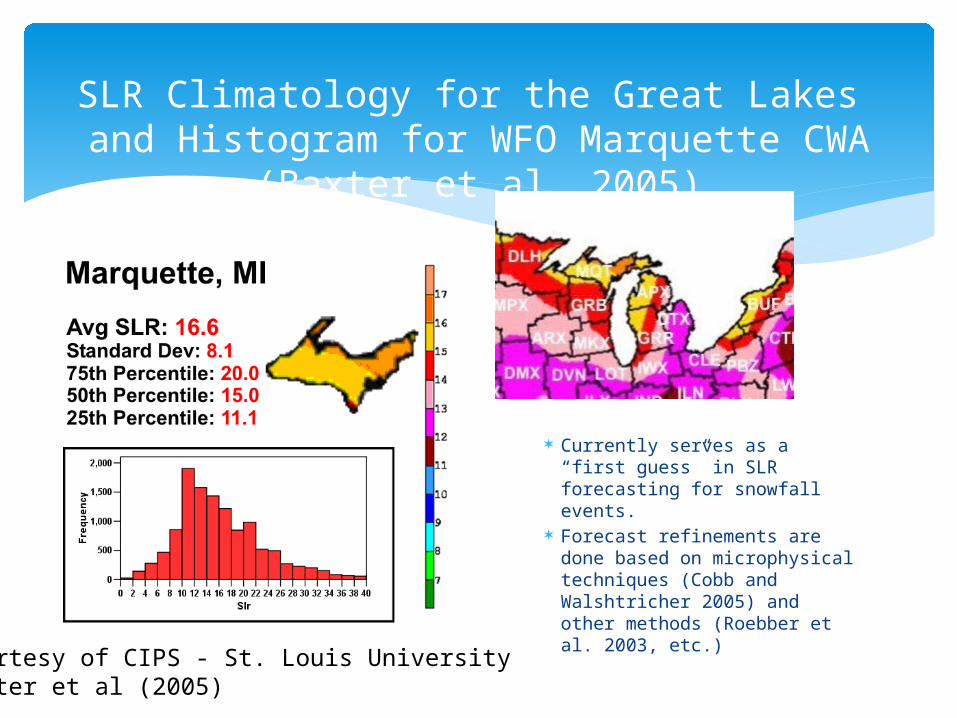
Currently serves as a “first guess” in SLR forecasting for snowfall events.
Forecast refinements are done based on microphysical techniques (Cobb and Walshtricher 2005) and other methods (Roebber et al. 2003, etc.)
SLR Climatology for the Great Lakes and Histogram for WFO Marquette CWA (Baxter
et al. 2005)
Courtesy of CIPS - St. Louis UniversityBaxter et al (2005)
Look at 6 hourly snowfall and snow water equivalent observations at WFO MQT 2007-2011 with 1 inch or greater snowfall. Six hourly data may help to minimize pressure effects
(settling) (Judson and Doeksen 2000) Plus, we forecast at 6 hourly intervals, so knowing 6 hourly
SLR is important operationally. Snowfall measurements were taken every 6 hours using a
standard white snow board. Snow Water Equivalent measurements were taken by
using the standard NWS 8 inch rain gage (shielded to help reduce wind under-catch).
LES SLR Climatology -- Methodology
Observing Location
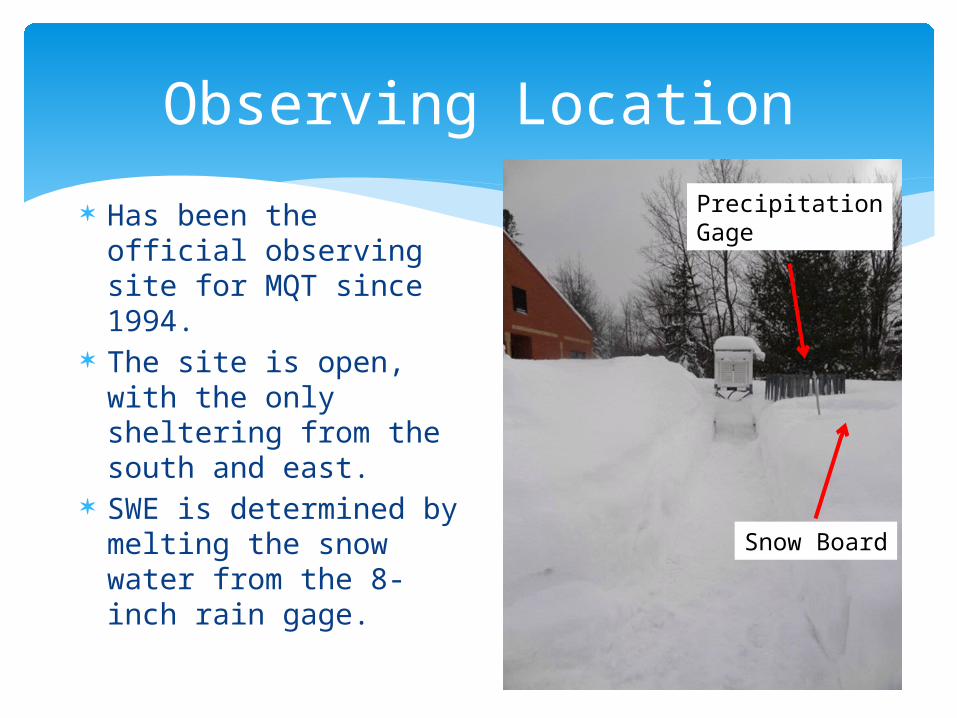
Has been the official observing site for MQT since 1994.
The site is open, with the only sheltering from the south and east.
SWE is determined by melting the snow water from the 8-inch rain gage.
Snow Board
PrecipitationGage
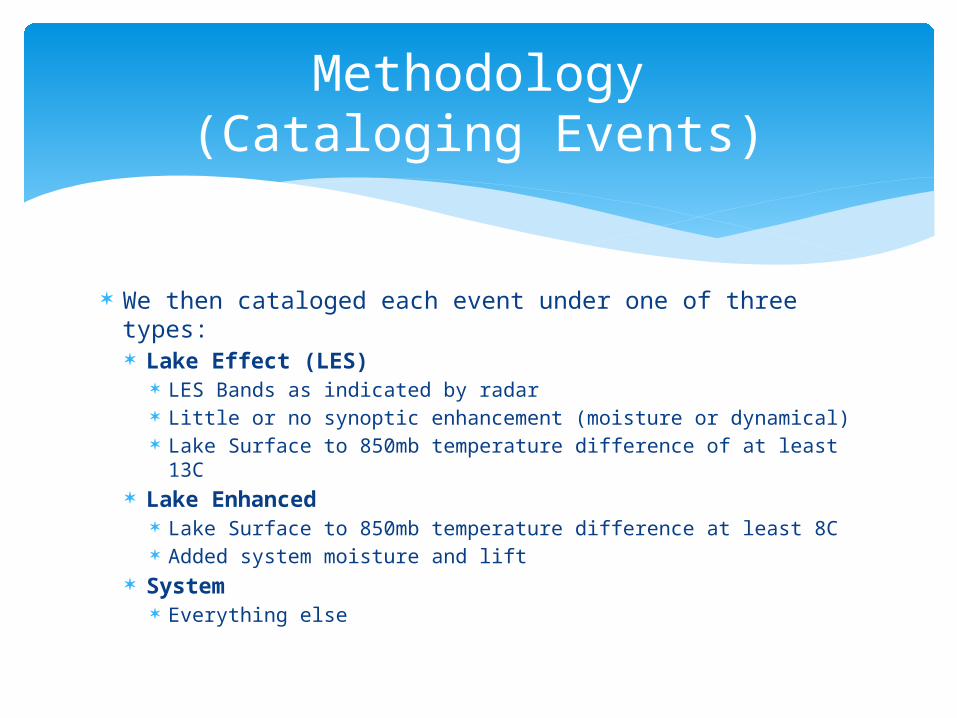
We then cataloged each event under one of three types: Lake Effect (LES)
LES Bands as indicated by radar Little or no synoptic enhancement (moisture or dynamical) Lake Surface to 850mb temperature difference of at least 13C
Lake Enhanced Lake Surface to 850mb temperature difference at least 8C Added system moisture and lift
System Everything else
Methodology(Cataloging Events)
After cataloging each event, a complete climatological analysis was done. Using additional information from WFO MQT Davis System
(Temperature, Winds, etc.) An analysis was done for cases with at least 1 inch/6 hr and
also for values of at least 2 in/6 hr. Roebber et al. (2003) and Baxter et al. (2005) used the 2 inch criteria for their studies.
In addition, a composite sounding was done for: All LES cases LES cases with SLR values 25th percentile or less LES cases with SLR values 75th percentile or more
Methodology
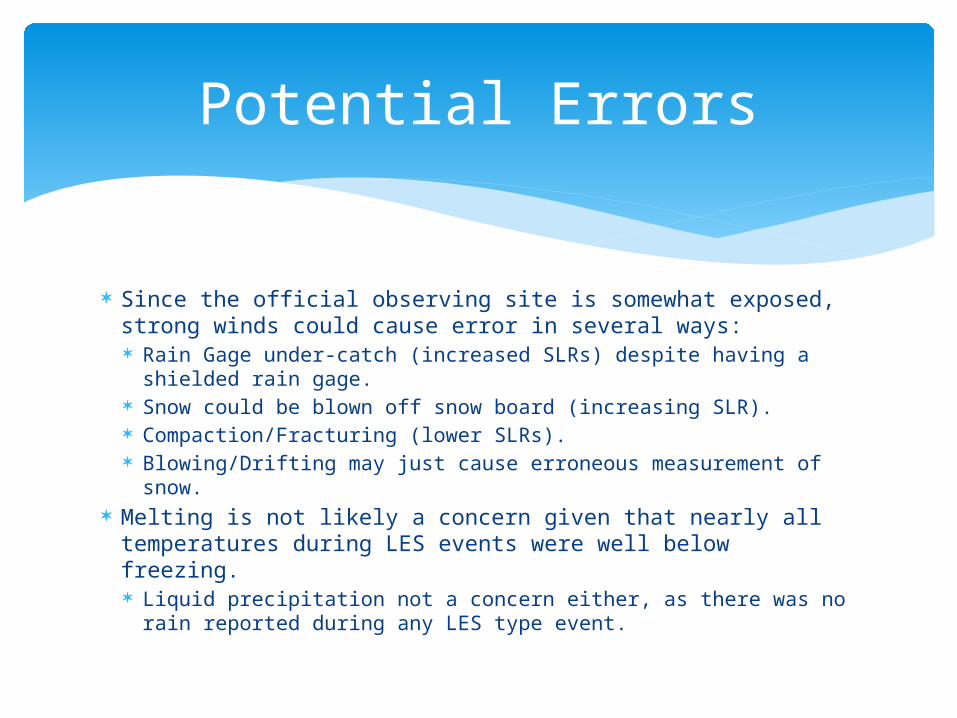
Since the official observing site is somewhat exposed, strong winds could cause error in several ways: Rain Gage under-catch (increased SLRs) despite having a
shielded rain gage. Snow could be blown off snow board (increasing SLR). Compaction/Fracturing (lower SLRs). Blowing/Drifting may just cause erroneous measurement of
snow. Melting is not likely a concern given that nearly all
temperatures during LES events were well below freezing. Liquid precipitation not a concern either, as there was no rain
reported during any LES type event.
Potential Errors
Results
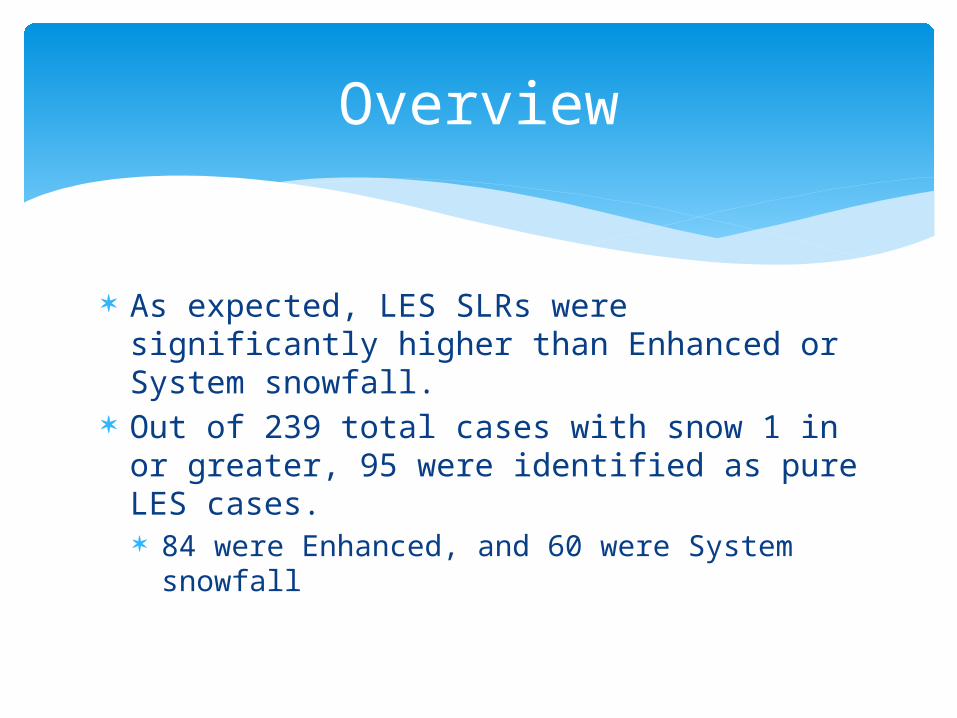
As expected, LES SLRs were significantly higher than Enhanced or System snowfall.
Out of 239 total cases with snow 1 in or greater, 95 were identified as pure LES cases. 84 were Enhanced, and 60 were System
snowfall
Overview
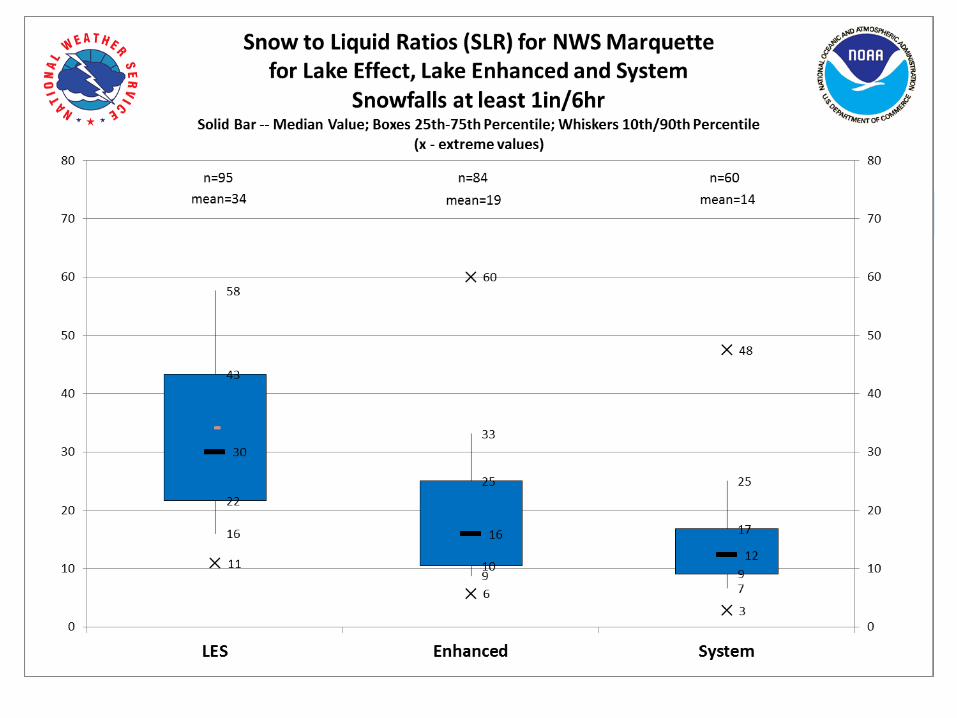
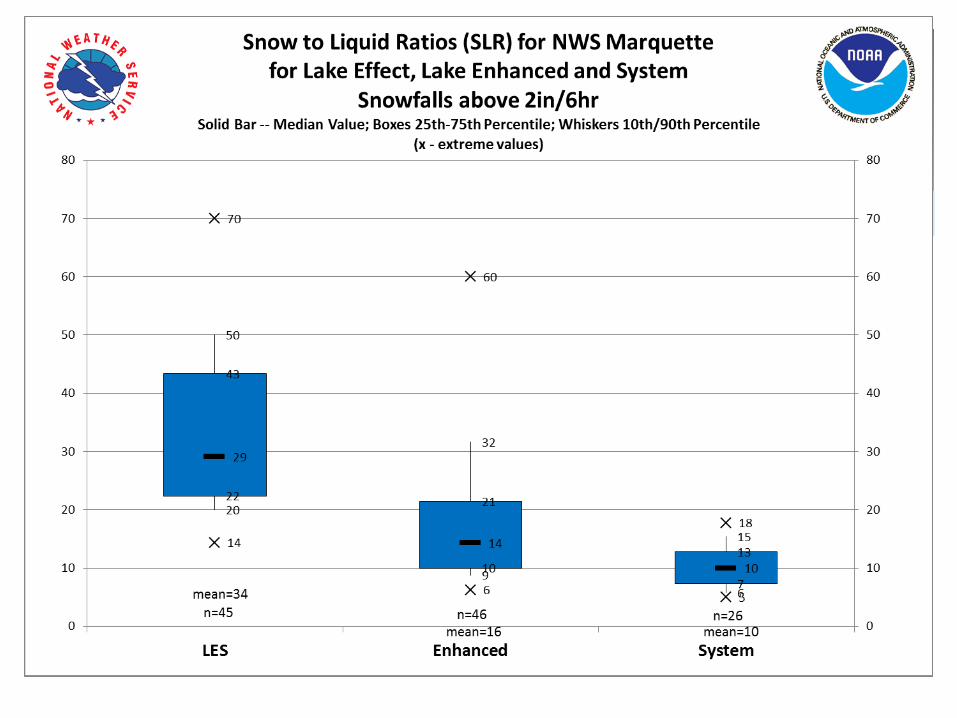
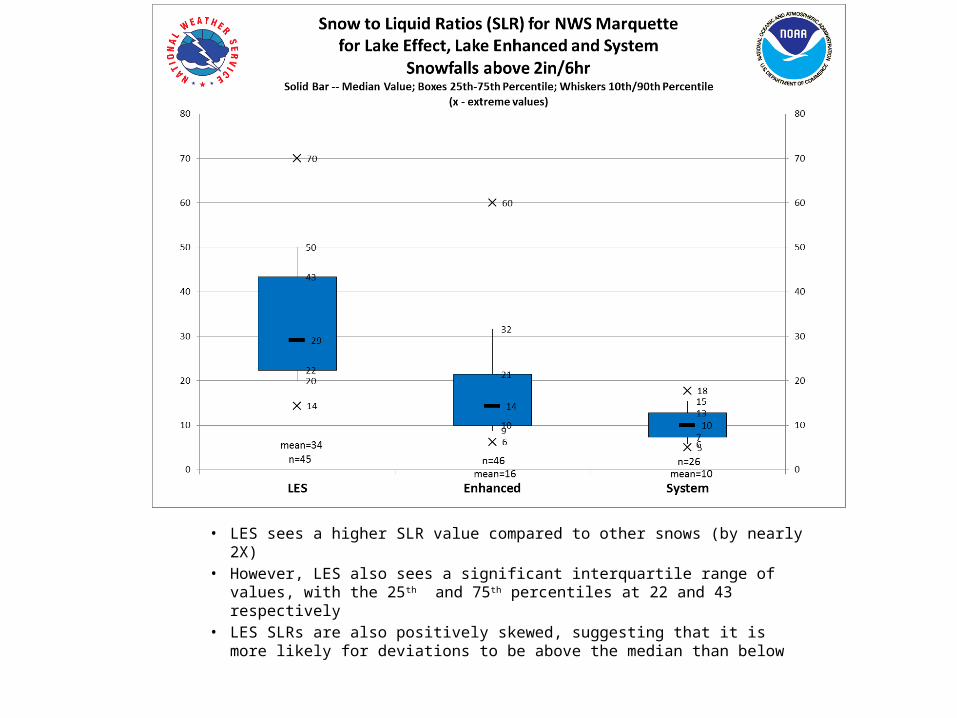
• LES sees a higher SLR value compared to other snows (by nearly 2X)• However, LES also sees a significant interquartile range of values,
with the 25th and 75th percentiles at 22 and 43 respectively• LES SLRs are also positively skewed, suggesting that it is more likely
for deviations to be above the median than below
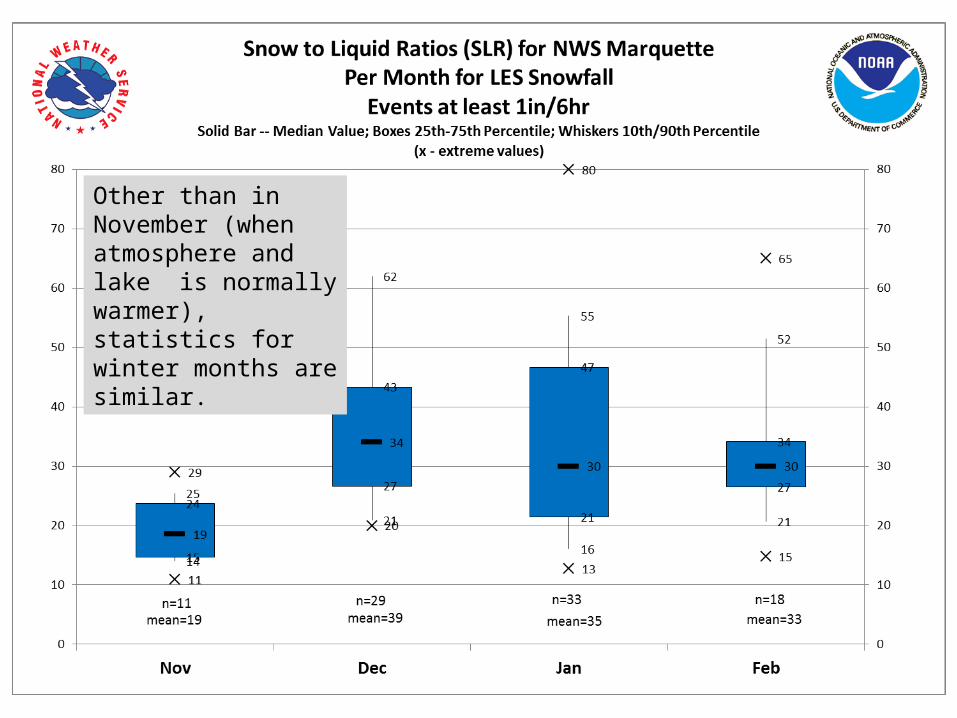
Other than in November (when atmosphere and lake is normally warmer), statistics for winter months are similar.
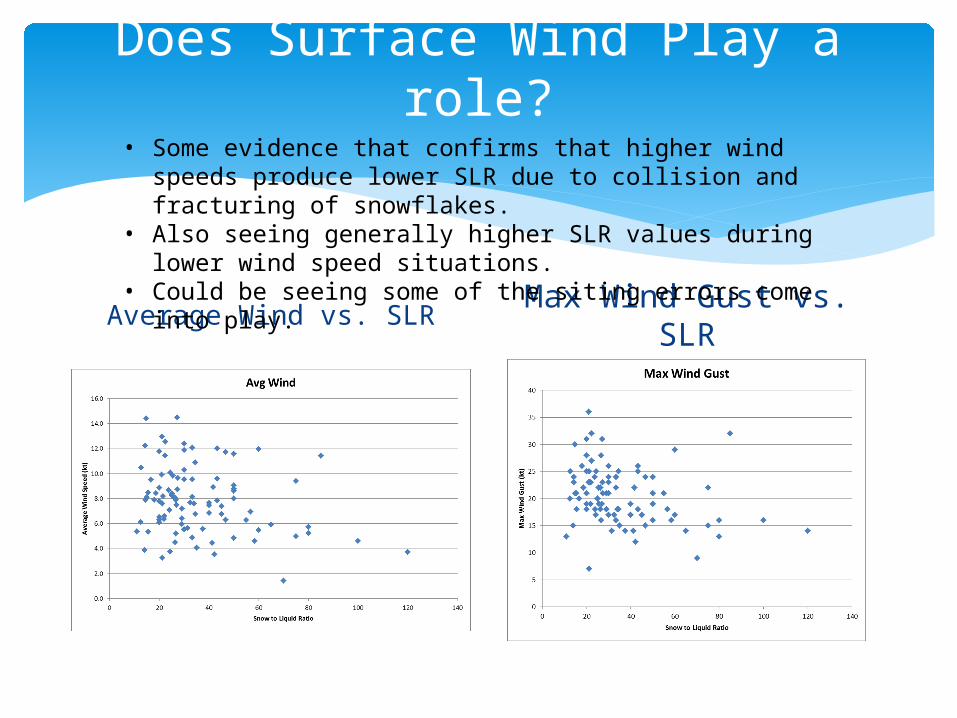
Does Surface Wind Play a role?
Average Wind vs. SLR Max Wind Gust vs. SLR
• Some evidence that confirms that higher wind speeds produce lower SLR due to collision and fracturing of snowflakes.
• Also seeing generally higher SLR values during lower wind speed situations.
• Could be seeing some of the siting errors come into play.
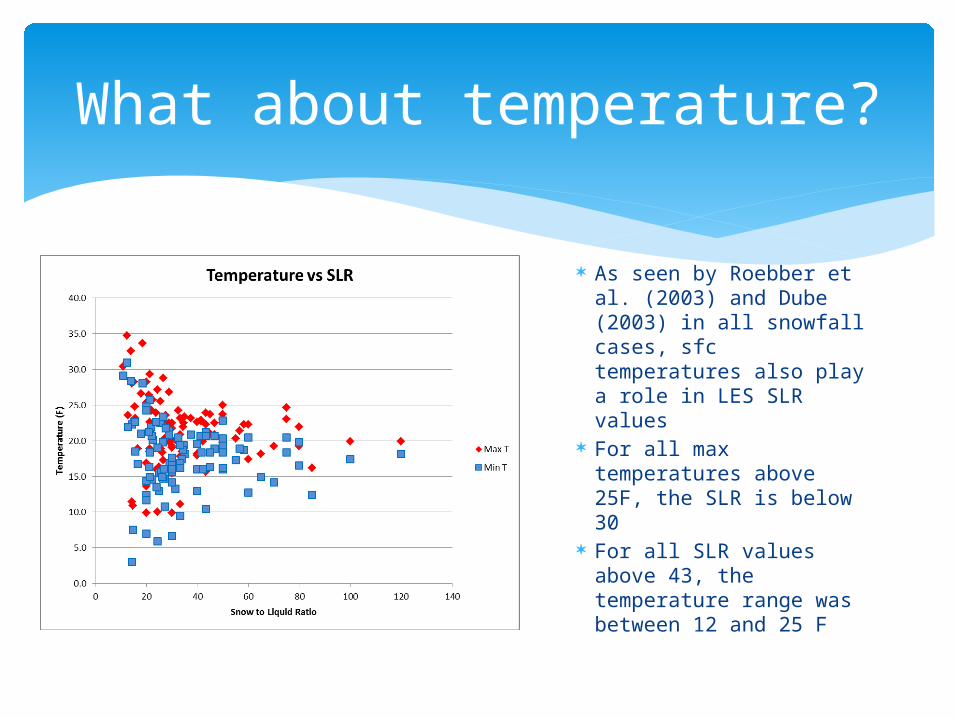
What about temperature?
As seen by Roebber et al. (2003) and Dube (2003) in all snowfall cases, sfc temperatures also play a role in LES SLR values
For all max temperatures above 25F, the SLR is below 30
For all SLR values above 43, the temperature range was between 12 and 25 F
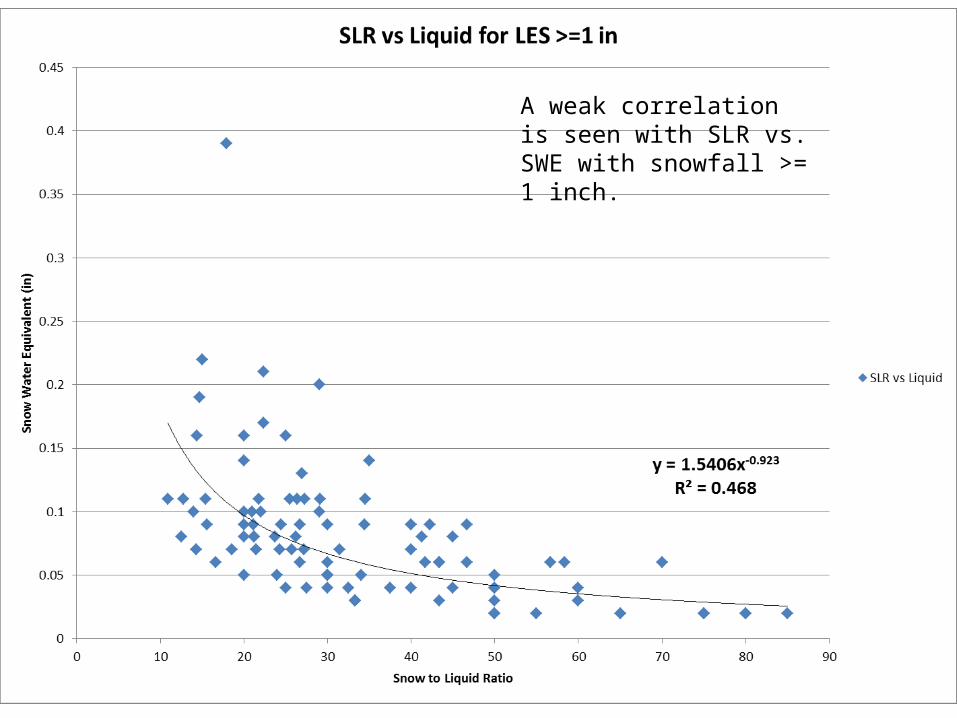
A weak correlation is seen with SLR vs. SWE with snowfall >= 1 inch.
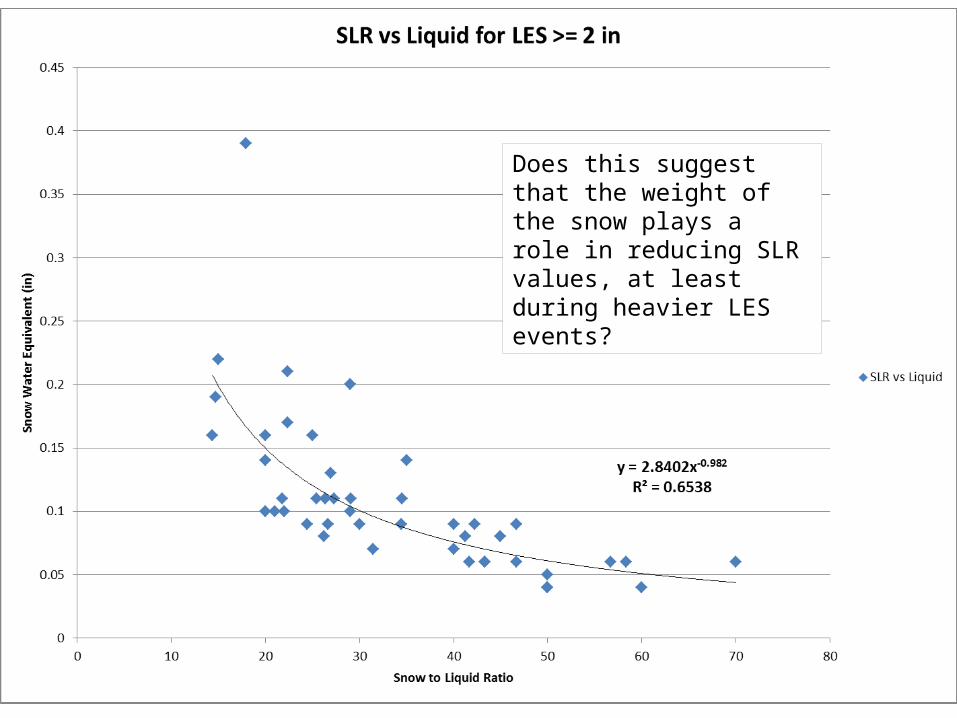
Does this suggest that the weight of the snow plays a role in reducing SLR values, at least during heavier LES events?
RUC 00hr (analysis) sounding data (from BUFR files).
Sounding time was -3hr from time of snow and SWE observation Taken to best represent the entire period of
observation. Software for creating composite sounding
data was developed by Andrew Just (NWS La Crosse, WI).
Composite Soundings
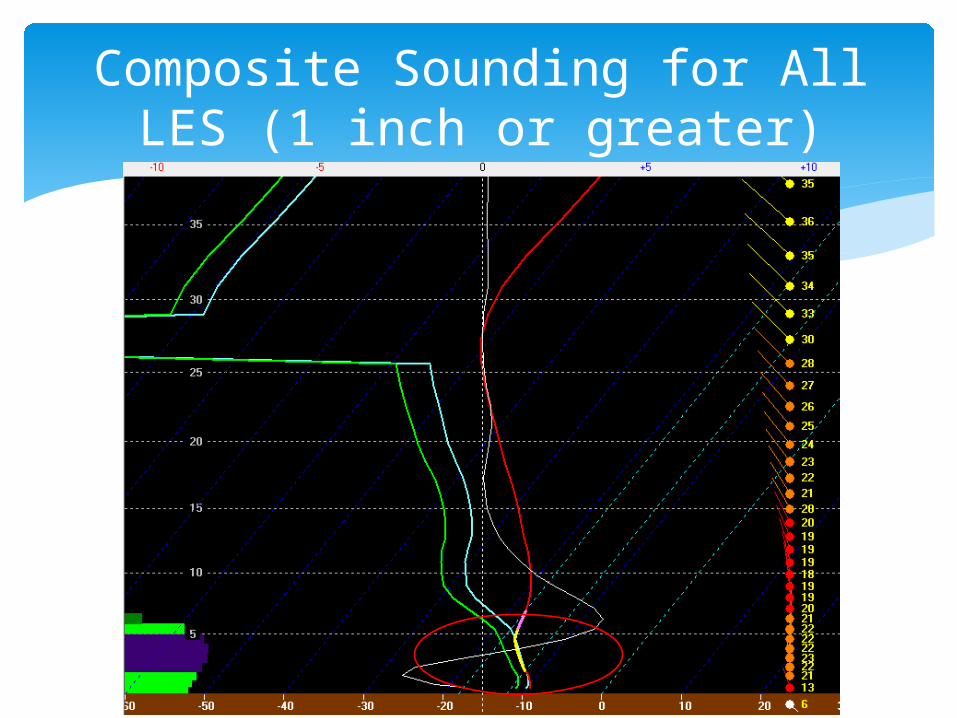
Composite Sounding for All LES (1 inch or greater)

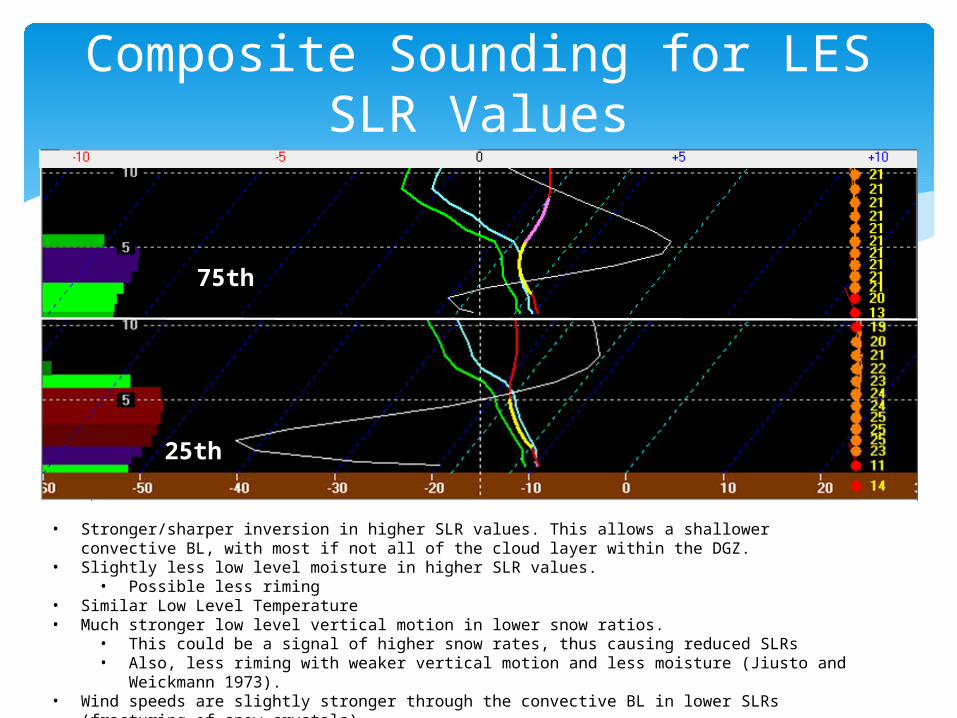
Composite Sounding for LES SLR Values
75th Percentile and above25th Percentile and
Below
Not many obvious differences which will make it very difficult to forecast extreme SLR values in LES.
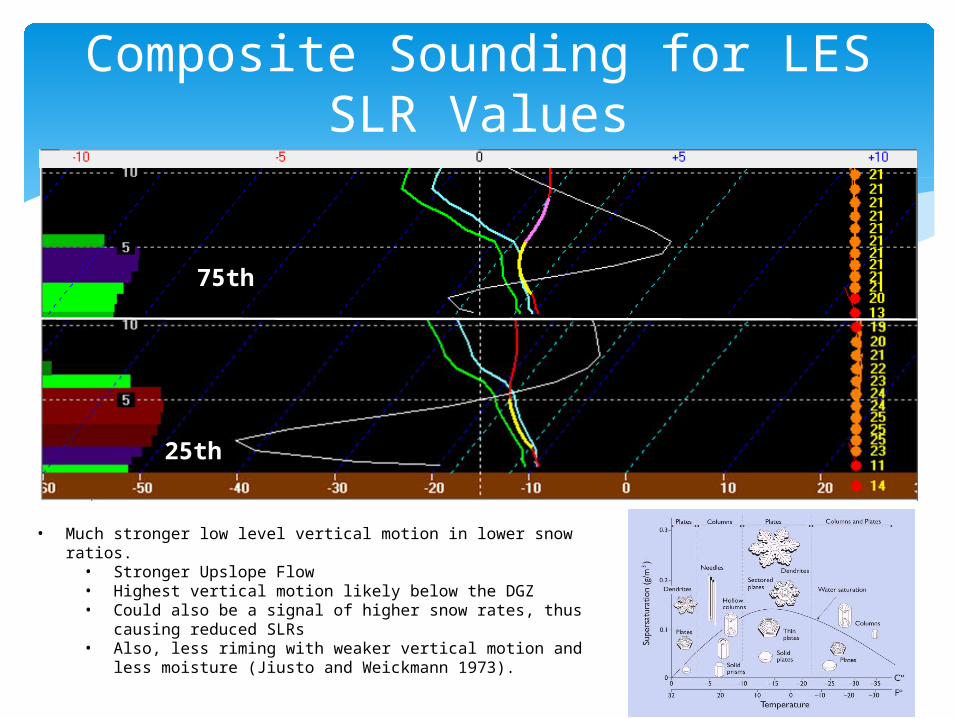
Composite Sounding for LES SLR Values
75th
25th
• Stronger/sharper inversion in higher SLR values. This allows a shallower convective BL, with most if not all of the cloud layer within the DGZ.
• Slightly less low level moisture in higher SLR values.• Possible less riming
• Similar Low Level Temperature• Much stronger low level vertical motion in lower snow ratios.
• This could be a signal of higher snow rates, thus causing reduced SLRs• Also, less riming with weaker vertical motion and less moisture (Jiusto and Weickmann
1973).• Wind speeds are slightly stronger through the convective BL in lower SLRs (fracturing of snow
crystals)
Composite Sounding for LES SLR Values
75th
25th
• Much stronger low level vertical motion in lower snow ratios.• Stronger Upslope Flow• Highest vertical motion likely below the DGZ• Could also be a signal of higher snow rates, thus causing
reduced SLRs• Also, less riming with weaker vertical motion and less
moisture (Jiusto and Weickmann 1973).
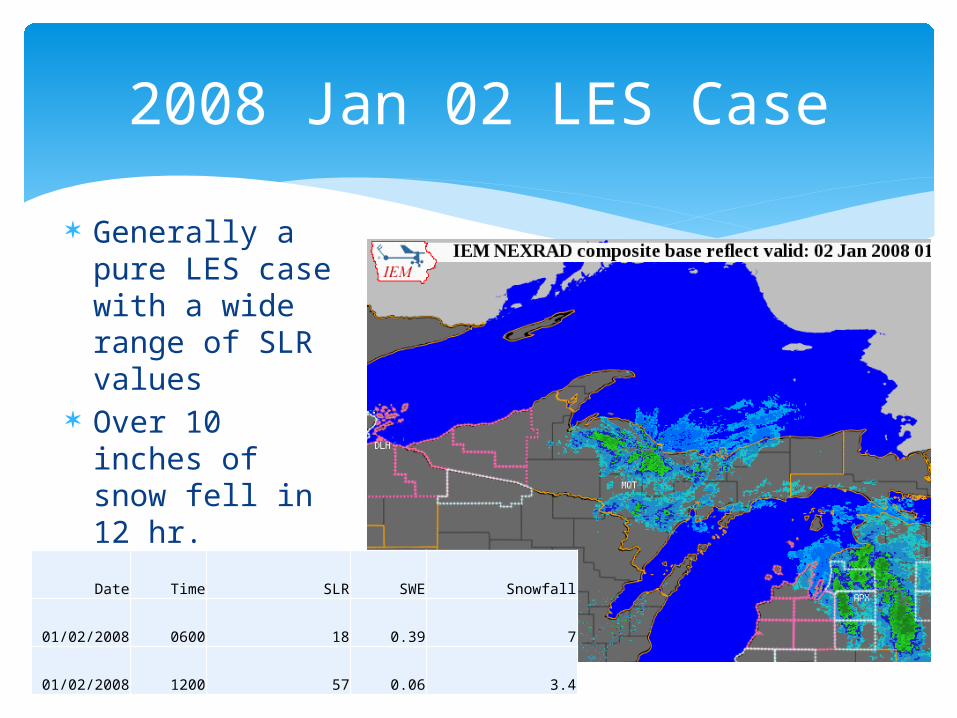
Generally a pure LES case with a wide range of SLR values
Over 10 inches of snow fell in 12 hr.
2008 Jan 02 LES Case
Date Time SLR SWE Snowfall
01/02/2008 0600 18 0.39 7
01/02/2008 1200 57 0.06 3.4
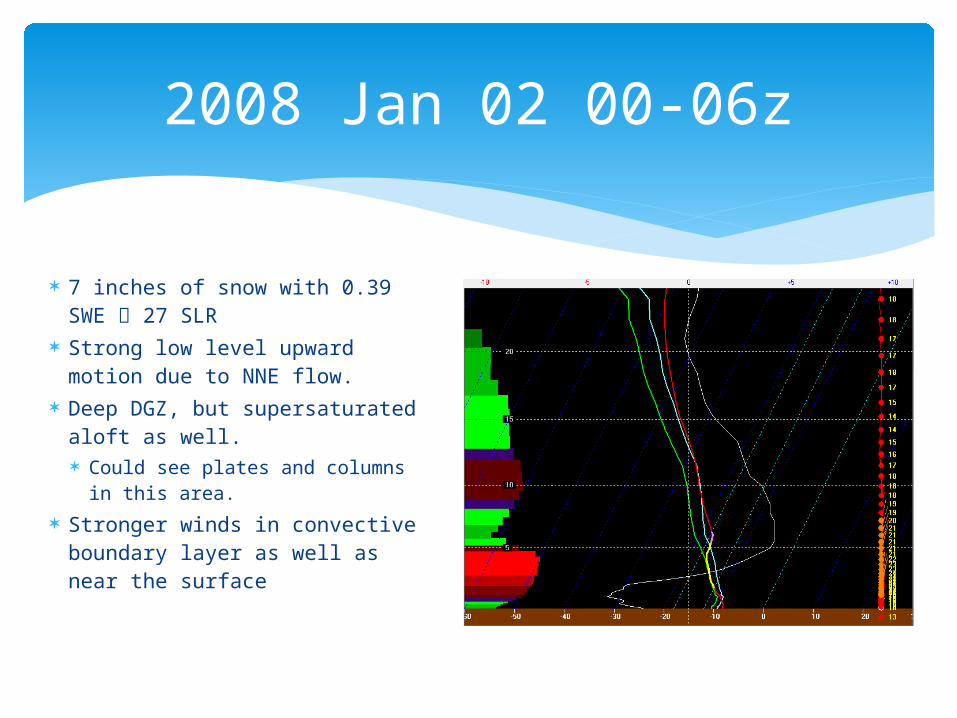
7 inches of snow with 0.39 SWE 27 SLR
Strong low level upward motion due to NNE flow.
Deep DGZ, but supersaturated aloft as well. Could see plates and
columns in this area. Stronger winds in
convective boundary layer as well as near the surface
2008 Jan 02 00-06z
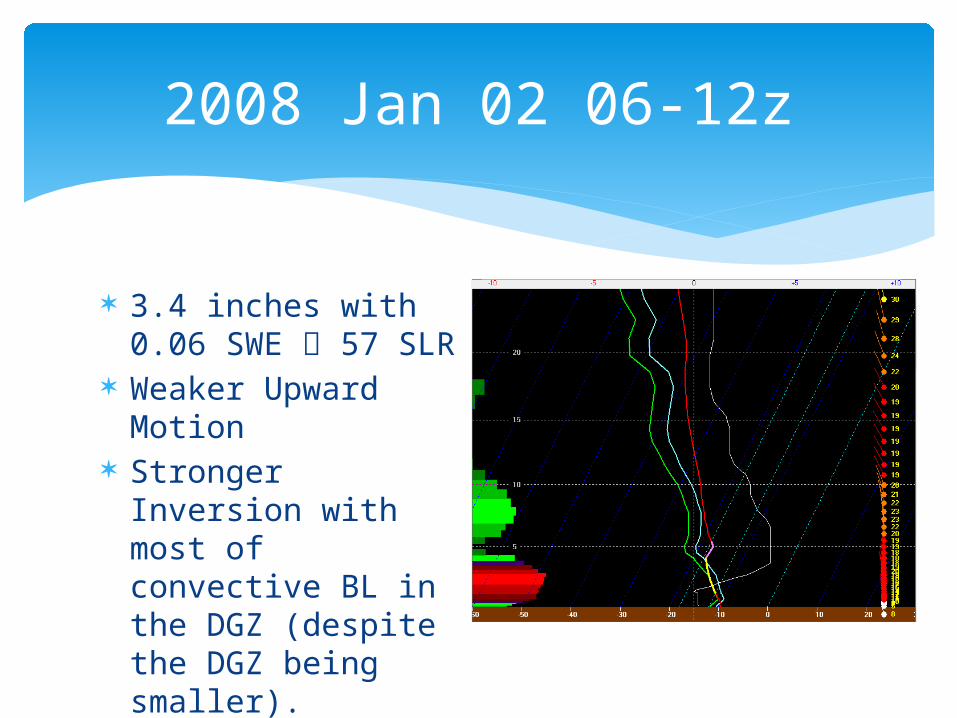
3.4 inches with 0.06 SWE 57 SLR
Weaker Upward Motion
Stronger Inversion with most of convective BL in the DGZ (despite the DGZ being smaller).
2008 Jan 02 06-12z
Overall, LES events have higher SLR values compared to System and Enhanced Snowfall Positively skewed with a median of 30
LES SLRs tend to behave like previous climatological studies, however the interquartile range is much higher compared to other “types” of snow.
Conclusions
Composite Soundings do not immediately give a clear understanding of the physical/microphysical reasoning for higher vs. lower SLRs Thermodynamics are very similar Stronger low level omega may be a proxy for higher snowfall
rates in lower SWE situations (heavier snow). Additional riming possible in these situations due to increased
moisture as seen in composite sounding. Most of cloud layer within DGZ in higher SWE situations. Although more research is needed, you might expect lower
SWE values (compared to the median) when forecasting LES events with strong low level upward vertical motion (single banded snow or strong upslope) vs. “light” snowfall associated with multibanded LES (weaker convective updrafts).
Conclusions
Retrieve more cases from 2001-2007. Look more at the different LES types. Retrieve more cases for other LES areas to
eventually better understand LES SLR climatology across the Great Lakes.
More work to do…
References:Banacos, Peter C., 2011 Box and Whisker Plots for Local Climate Datasets: Interpretation and Creation using Excel 2007/2010. Eastern Region Tech Attachment, 2011-01, 1-20.Baxter, Martin A., Charles E. Graves, James T. Moore, 2005: A climatology of snow-to-liquid ratio for the contiguous united states. Wea. Forecasting, 20, 729–744.Judson, Arthur, Nolan Doesken, 2000: Density of Freshly Fallen Snow in the Central Rocky Mountains. Bull. Amer. Meteor. Soc., 81, 1577–1587.Roebber, Paul J., Sara L. Bruening, David M. Schultz, John V. Cortinas, 2003: Improving Snowfall Forecasting by Diagnosing Snow Density. Wea. Forecasting, 18, 264–287.
Thank You