Embed Size (px)
Citation preview

FR-02-52
A Preliminary Analysis of Occupational Task Statements from the O*NET Data Collection Program Chad Van Iddekinge Suzanne Tsacoumis Jamie Donsbach Prepared for: National Center for O*NET Development
P.O. Box 27625 Raleigh, NC 27611 Project Number 126-TO41-HR11 Task Order No. 11 October 2002 (Revised March 2003)

Human Resources Research Organization (HumRRO) i
Executive Summary
The North Carolina O*NETTM Center has contracted with the Human Resources Research Organization (HumRRO) to develop and implement a methodology for analyzing occupational task statements. This report describes the results of an analysis of two sets of task data. The first set of tasks was 87 statements from the current task lists of eight pretest occupations. The second set of tasks included 1,088 write-in statements from the same eight occupations plus an additional eight occupations (16 total). These were statements that incumbents included in their survey response because they thought such tasks were not represented in the current task list for their respective occupation.
The main findings of this study were as follows. First, a procedure for identifying which
of the current task statements are critical to the occupation (i.e., “core”), “supplemental”, or “non-relevant” was developed and implemented using data from the eight pretest occupations. Second, a standardized process designed to analyze the write-in task data from the 16 occupations yielded a high level of agreement between analysts on several task judgments, such as whether a write-in statement was actually a task. Of the 1088 write-in statements analyzed, 712 (65.4%) were judged to be tasks. The remaining statements were incomprehensible, were too broad, or described a type of knowledge, skill, ability, or other characteristic or a generalized work activity. Of the statements judge to be tasks, 56% were unique from the current task lists of these occupations, while the other tasks were either partially redundant (25%) or completely redundant (19%) with one or more current tasks. Finally, 17 write-in statements were identified for an emerging list of tasks to be evaluated in future data collection efforts.
Based on the results of this study, several recommendations are offered for evaluating
task data from the remaining occupations in the O*NET database. We also provide a detailed decision tree and analyst instructions for judging the appropriateness of write-in task information. Finally, we describe a database for reporting current and write-in statements that we think will help maximize the usefulness of the task information the O*NET system provides.
Human Resources Research Organization (HumRRO) ii
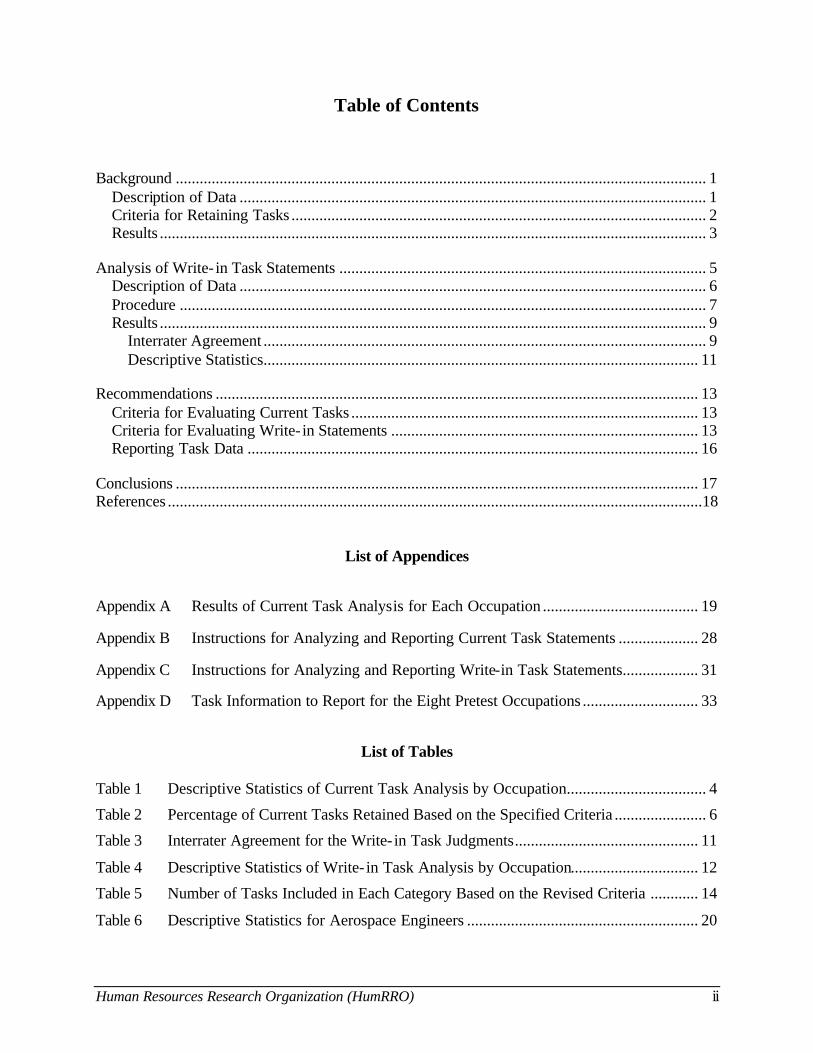
Table of Contents
Background ..................................................................................................................................... 1 Description of Data ..................................................................................................................... 1 Criteria for Retaining Tasks ........................................................................................................ 2 Results ......................................................................................................................................... 3
Analysis of Write- in Task Statements ............................................................................................ 5 Description of Data ..................................................................................................................... 6 Procedure .................................................................................................................................... 7 Results ......................................................................................................................................... 9
Interrater Agreement ............................................................................................................... 9 Descriptive Statistics............................................................................................................. 11
Recommendations ......................................................................................................................... 13 Criteria for Evaluating Current Tasks ....................................................................................... 13 Criteria for Evaluating Write- in Statements ............................................................................. 13 Reporting Task Data ................................................................................................................. 16
Conclusions ................................................................................................................................... 17 References ......................................................................................................................................18
List of Appendices
Appendix A Results of Current Task Analysis for Each Occupation ....................................... 19
Appendix B Instructions for Analyzing and Reporting Current Task Statements .................... 28
Appendix C Instructions for Analyzing and Reporting Write-in Task Statements................... 31
Appendix D Task Information to Report for the Eight Pretest Occupations ............................. 33
List of Tables
Table 1 Descriptive Statistics of Current Task Analysis by Occupation................................... 4
Table 2 Percentage of Current Tasks Retained Based on the Specified Criteria ....................... 6
Table 3 Interrater Agreement for the Write- in Task Judgments.............................................. 11
Table 4 Descriptive Statistics of Write- in Task Analysis by Occupation................................ 12
Table 5 Number of Tasks Included in Each Category Based on the Revised Criteria ............ 14
Table 6 Descriptive Statistics for Aerospace Engineers .......................................................... 20

Human Resources Research Organization (HumRRO) iii
Table of Contents (Continued)
Table 7 Descriptive Statistics for Architects............................................................................ 21
Table 8 Descriptive Statistics for Bus Drivers ......................................................................... 22
Table 9 Descriptive Statistics for Correction Officers and Jailers ........................................... 23
Table 10 Descriptive Statistics for Landscape Architects.......................................................... 24
Table 11 Descriptive Statistics for Locksmiths and Safe Repairers .......................................... 25
Table 12 Descriptive Statistics for Opticians............................................................................. 26
Table 13 Descriptive Statistics for Social and Human Service Assistants ................................ 27
List of Figures Figure 1 Initial Procedure Developed for Evaluating Write- in Statements ................................ 8
Figure 2 Modified Procedure Used to Evaluate Write- in Statements in the Present Study...... 10
Figure 3 Final Recommended Procedure for Evaluating Write- in Statements ......................... 15

Human Resources Research Organization (HumRRO) 1
Background
The Occupational Information Network (O*NETTM) is a comprehensive system developed by the U.S. Department of Labor that provides information about nearly 1,000 occupations within the U.S. economy. One purpose of the O*NET system is to describe the critical tasks for each occupation in the database. Job incumbents from each occupation have rated the relevance, importance, and frequency with which tasks are performed. Furthermore, since many occupations change over time (e.g., due to new technology), job incumbents are given the opportunity to write in information about important tasks they believe are excluded from the current task list for their occupation.
The North Carolina O*NET Center has contracted with the Human Resources Research
Organization (HumRRO) to develop and implement a methodology to analyze the task data collected during the O*NET data collection program. There are three main tasks in this project:
u Task 1: Develop the rationale and criteria for analyzing the task data u Task 2: Analyze a subset of occupations from the pretest data to evaluate the criteria
established in Task 1 u Task 3: Implement the task analysis for O*NET data collection program The work associated with Task 1, described in a previous deliverable, involved defining a
proposed methodology for analyzing both current and write-in task data. During Task 2, this methodology was implemented on a subset of eight pretest occupations and write-in data from eight additional occupations from the current data collection effort. The purpose of this report is to document the results of this study and evaluate the initial criteria. In addition, we make recommendations for analyzing occupational task information within the O*NET data collection program. We also describe a method for reporting current and write-in task data.
Analysis of Current Task Statements
One of the many functions of the O*NET database is to identify the important tasks of a particular occupation. It is possible that some of the tasks originally included on the survey distributed to incumbents are, in fact, not important or have become obsolete. The methodology proposed in Task 1 provided criteria for retaining tasks as important for an occupation. The purpose of this portion of the study was to implement and critique this methodology for evaluating and retaining current task statements. Description of Data
Given the proposed methodology, it was determined that a subset of eight pretest
occupations had sufficient quantifiable task data (i.e., relevance, importance, and frequency ratings) for use in the current study. The eight occupations were:
u Aerospace engineers u Architects u Bus drivers u Correction officers u Landscape architects

Human Resources Research Organization (HumRRO) 2
u Locksmiths and safe repairers u Opticians u Social and human services assistants.
There were 87 task statements across these occupations. Incumbents rated each task on three dimensions:
u Relevance to the occupation. Specifically, incumbents were asked to indicate whether
the task is not relevant to the occupation. u Importance to the occupation on a 5-point scale with anchors of not important (1),
somewhat important (2), important (3), very important (4), and extremely important (5).
u Frequency with which the task is performed on a 7-point scale with anchors of once a year or less (1), more than once a year (2), more than once a month (3), more than once a week (4), daily (5), several times a day (6), and hourly or more (7).
Criteria for Retaining Tasks
Three criteria were established for retaining the current task statements for a given
occupation. First, a criterion was established for the minimum number of raters per task statement. Previous research on the O*NET system has shown that approximately 15 raters are needed to estimate the mean importance of job knowledge, skills, abilities, and other characteristics (KSAOs) within 1-1.5 scale points, on a 7-point scale, with 95% confidence (Office of Management and Budget Clearance Packaging Support Statement and Data Collection Instruments, December 2000). Given this, the first recommended criterion for retention was that a minimum of 15 incumbents must indicate the task is not relevant or provide an importance rating for a given task.
The second criterion concerned the relevancy of tasks to their respective occupations.
The basic premise was that the resulting task list should reflect those tasks that are core to the majority of jobs within the target occupation. Given this, the proposed criterion was that more than 50% of respondents should indicate that a task is relevant to the occupation for that task to be retained. It should be noted that identifying whether a task is relevant is not always that straightforward. The task questionnaire does not directly solicit relevancy information. Instead, it asks whether the task is not relevant. Given this, the percent relevant was calculated by dividing the number of raters who provided importance or frequency ratings for a given task by the number of raters who provided this information, plus those who indicated that the task was not relevant to the occupation. Thus, raters who did not provide any information about a given task were not included in this calculation.
The third recommended criterion for task inclusion was a mean importance rating greater
than or equal to 3.0 (i.e., important to job).1 A review of the scale anchors, as well as common practice, suggests that an average importance rating of at least 3.0 will ensure that the resulting list contains only those tasks considered core to the occupation.
1 Relevance should not be incorporated into the computation of mean importance. Only the actual importance ratings should be used to calculate the mean.

Human Resources Research Organization (HumRRO) 3
As mentioned, incumbents also rated the frequency with which each task is performed. Although frequency ratings could serve as another criterion for determining whether to retain or eliminate current task statements, we did not recommend using it because there can be tasks that are infrequently performed yet highly important to the job.
In summary, three criteria for retaining current task statements were proposed, and in turn
evaluated in the current study: u At least 15 incumbents must rate the task’s relevance, importance, and/or frequency u More than 50% of incumbents, who rated the task on one or more of these
dimensions, must have indicated that the task is relevant to the occupation u Relevant tasks must have a mean importance rating > 3.0 to be considered core to the
occupation Results
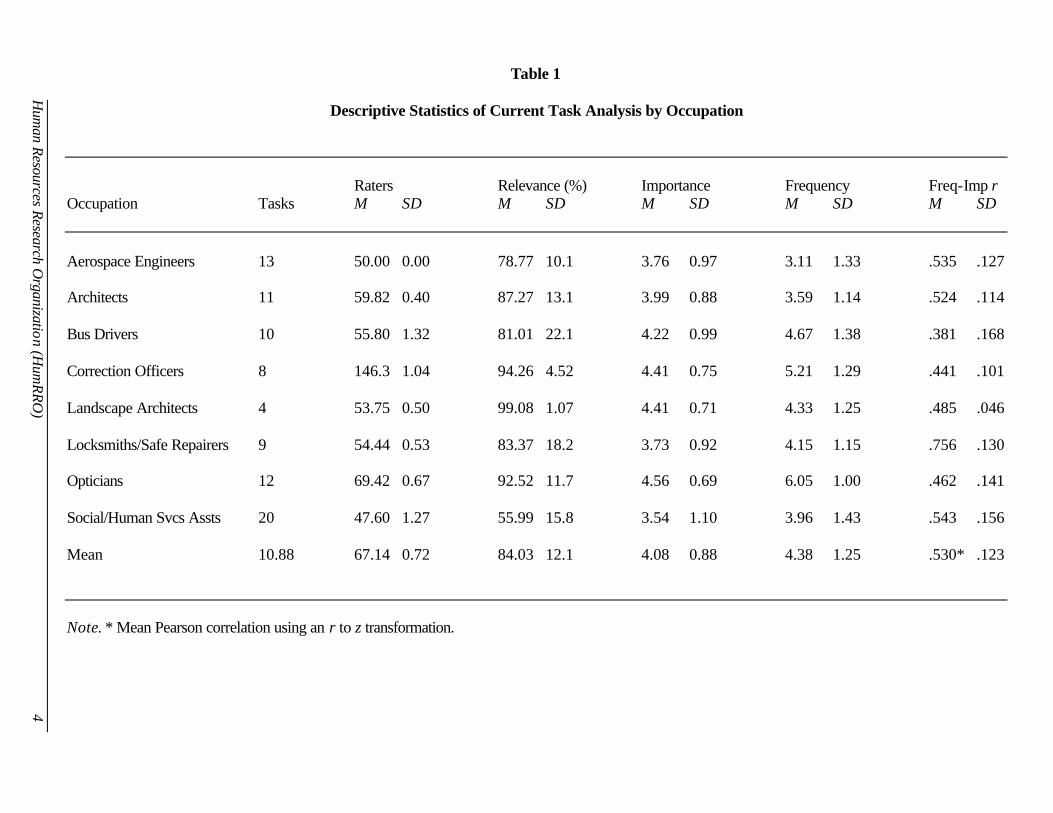
Data from the eight pretest occupations were analyzed to evaluate the three recommended criteria listed above. All of these analyses were conducted in SPSS and Microsoft Excel. The descriptive results across the eight occupations are summarized in Table 1 (see next page). The selected occupations included 87 task statements that were rated by an average of 67.14 job incumbents. The number of current task statements for these occupations ranged from 4 to 20 (M = 10.88). The vast majority of tasks were rated relevant (M = 84.03%), important (M = 4.08), and frequently performed (M = 4.38). The distribution of frequency and importance ratings across the occupations is shown below. One interesting finding is that there was a negative correlation between the number of tasks in an occupation and the ratings assigned (e.g., -.64 for importance ratings). That is, the fewer the tasks included in an occupation, the higher the relevance, importance, and frequency ratings of those tasks.
Frequency Importance
Rating N % N % 1 185 4.10 56 1.30 2 452 10.1 245 5.50 3 645 14.4 790 17.8 4 626 13.9 1156 26.0 5 1003 22.3 2192 49.4 6 733 16.3 7 851 18.9
Table 1 also displays the mean correlation between importance and frequency ratings for
each occupation. The correlations between importance and frequency ratings ranged from .38 to .76 with a mean of .53. A closer look at the data revealed considerable variability in the importance-frequency correlations across individual tasks (.12 to .82). Thus, it appears that there are tasks in these occupations that are important but infrequently performed, and vice vers
Hum
an Resources Research Organization (H
umRRO
) 4
Table 1
Descriptive Statistics of Current Task Analysis by Occupation
Raters Relevance (%) Importance Frequency Freq-Imp r Occupation Tasks M SD M SD M SD M SD M SD Aerospace Engineers 13 50.00 0.00 78.77 10.1 3.76 0.97 3.11 1.33 .535 .127 Architects 11 59.82 0.40 87.27 13.1 3.99 0.88 3.59 1.14 .524 .114 Bus Drivers 10 55.80 1.32 81.01 22.1 4.22 0.99 4.67 1.38 .381 .168 Correction Officers 8 146.3 1.04 94.26 4.52 4.41 0.75 5.21 1.29 .441 .101 Landscape Architects 4 53.75 0.50 99.08 1.07 4.41 0.71 4.33 1.25 .485 .046 Locksmiths/Safe Repairers 9 54.44 0.53 83.37 18.2 3.73 0.92 4.15 1.15 .756 .130 Opticians 12 69.42 0.67 92.52 11.7 4.56 0.69 6.05 1.00 .462 .141 Social/Human Svcs Assts 20 47.60 1.27 55.99 15.8 3.54 1.10 3.96 1.43 .543 .156 Mean 10.88 67.14 0.72 84.03 12.1 4.08 0.88 4.38 1.25 .530* .123 Note. * Mean Pearson correlation using an r to z transformation.

Human Resources Research Organization (HumRRO) 5
As noted above, the first recommended criteria was that at least 15 incumbents must indicate that the task is not relevant or provide an importance rating for a task to be retained. For the eight pretest occupations included in this study, all 87 task statements were rated by the requisite 15 incumbents. In fact, the lowest number of raters for a given task was 46. Nevertheless, we still wanted to assess the adequacy of the 15-rater criterion. To do so, we identified the number of raters typically needed to produce a standard error of the mean (SEM) less than or equal to .50 scale points from the calculated mean importance rating of a task. Specifically, we randomly selected tasks from each occupation that were rated by various numbers of raters (e.g., 5, 10, and 15) and computed the SEM for that sample. The mean SEM for 15 raters was .21 (with a range of .07 to .31). Interestingly, it was not until the number of raters was reduced to seven that we found a SEM (from our random selections) greater than .50 on one task. However, for most tasks the SEM was still below .50.
We then calculated the descriptive statistics for each occupation to evaluate the recommended relevance and importance criteria (see Tables 6-13, Appendix A). The following information is reported for each task: (a) the percentage of incumbents who thought the task was relevant to the occupation; (b) the mean, standard deviation, and range of importance ratings; and (c) the percentage of incumbents who endorsed each of the seven frequency scale points, along with the overall mean and standard deviation of the frequency ratings. Note that the tasks in bold type did not meet one or more of the specified criteria (i.e., N > 15, relevance > 50%, and/or importance > 3.0). There were four occupations for which all the tasks met or exceeded these three criteria. Two occupations had just one task that did not meet the criteria (Architects and Locksmiths/Safe Repairers), one occupation had two tasks below the criteria (Bus Drivers), and one occupation had seven tasks that did not satisfy the criteria (Social and Human Service Assistants).
Table 2 provides an overall summary of the percentage of task current statements (by occupation) in each occupation that would be retained using the three recommended criteria. The percentage of tasks retained according to the minimum raters, mean relevance ratings, and mean importance ratings were 100%, 92.36%, and 96.85% (respectively). Overall, 91.23% of the task statements would be retained across the three criteria. In fact, 7 of the 11 tasks that would be eliminated using these criteria were from one occupation (social and human services assistants), which also had the most tasks to be rated. All of these tasks would be eliminated because fewer than 50% of the respondents indicated that the tasks were relevant (25% to 48.94%).
The final analysis investigated the prevalence and impact of data outliers. The analysis revealed that outliers (i.e., cases +/- 3 SDs from the mean) accounted for less than .05% of the more than 5,500 importance ratings across the eight occupations. Furthermore, removing or recoding these data points did not impact the outcome of the analysis. For example, removing/recoding an outlier did not qualify a task that had a mean importance less than 3.0.
Analysis of Write-in Task Statements As mentioned, job incumbents can submit task statements that they think are not represented on the current task list for a given occupation. The second major purpose of this

Human Resources Research Organization (HumRRO) 6
Table 2
Percentage of Current Tasks Retained Based on the Specified Criteria
Raters Relevance Importance Occupation (> 15) (> 50%) (> 3.0) Overall Aerospace Engineers 100.0 100.0 100.0 100.0 Architects 100.0 100.0 90.91 90.91 Bus Drivers 100.0 80.00 100.0 80.00 Correction Officers 100.0 100.0 100.0 100.0 Landscape Architects 100.0 100.0 100.0 100.0 Locksmiths/Safe Repairers 100.0 88.89 88.89 88.89 Opticians 100.0 100.0 100.0 100.0 Social/Human Svcs Assts 100.0 70.00 95.00 70.00 Mean 100.0% 92.36% 96.85% 91.23% study was to implement and assess the proposed methodology for evaluating these write-in statements. Essentially, this methodology involved determining whether the statement was, in fact, a task that seems relevant to the occupation and unique from any current task. Description of Data
The write-in statements from the eight pretest occupations served as one source of data for this portion of the study. To obtain a more accurate understanding of the nature of the write-in tasks, the pretest data were supplemented with (a) write-in statements gathered during the current data collection effort for the eight occupations, and (b) write-in statements gathered during the current data collection for eight additional occupations. Importance and frequency ratings were provided in the eight pretest occupations, however such information was not available for the additional eight occupations. These occupations included:
u Accountants u Biologists u Correction officers u Employment interviewers u Insurance sales agents
Human Resources Research Organization (HumRRO) 7
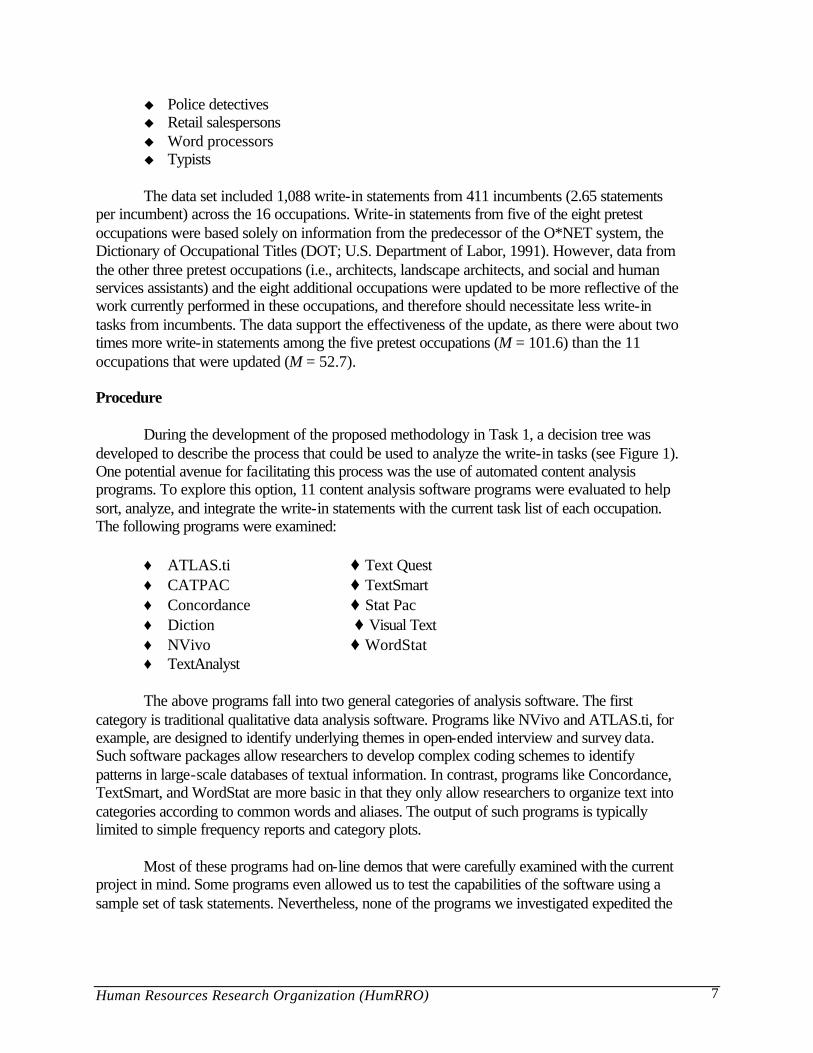
u Police detectives u Retail salespersons u Word processors u Typists
The data set included 1,088 write-in statements from 411 incumbents (2.65 statements
per incumbent) across the 16 occupations. Write-in statements from five of the eight pretest occupations were based solely on information from the predecessor of the O*NET system, the Dictionary of Occupational Titles (DOT; U.S. Department of Labor, 1991). However, data from the other three pretest occupations (i.e., architects, landscape architects, and social and human services assistants) and the eight additional occupations were updated to be more reflective of the work currently performed in these occupations, and therefore should necessitate less write-in tasks from incumbents. The data support the effectiveness of the update, as there were about two times more write-in statements among the five pretest occupations (M = 101.6) than the 11 occupations that were updated (M = 52.7).
Procedure
During the development of the proposed methodology in Task 1, a decision tree was
developed to describe the process that could be used to analyze the write-in tasks (see Figure 1). One potential avenue for facilitating this process was the use of automated content analysis programs. To explore this option, 11 content analysis software programs were evaluated to help sort, analyze, and integrate the write-in statements with the current task list of each occupation. The following programs were examined:
♦ ATLAS.ti ‚ Text Quest ♦ CATPAC ‚ TextSmart ♦ Concordance ‚ Stat Pac ♦ Diction ‚ Visual Text ♦ NVivo ‚ WordStat ♦ TextAnalyst The above programs fall into two general categories of analysis software. The first
category is traditional qualitative data analysis software. Programs like NVivo and ATLAS.ti, for example, are designed to identify underlying themes in open-ended interview and survey data. Such software packages allow researchers to develop complex coding schemes to identify patterns in large-scale databases of textual information. In contrast, programs like Concordance, TextSmart, and WordStat are more basic in that they only allow researchers to organize text into categories according to common words and aliases. The output of such programs is typically limited to simple frequency reports and category plots.
Most of these programs had on-line demos that were carefully examined with the current
project in mind. Some programs even allowed us to test the capabilities of the software using a sample set of task statements. Nevertheless, none of the programs we investigated expedited the

Human Resources Research Organization (HumRRO) 8
Figure 1
Initial Procedure Developed for Evaluating Write-in Statements
1.Does the
statement describe atask?
2. Is the statement
identical to a currenttask?
No
Yes
4.Is the statement similarenough to other write-in tasks that it can be
combined?
No
Yes
3.Is the statement
partially redundantwith a current
task?
Yes
5.Have 10 or more
incumbents rated thesetasks?
No
No
6.Does the mean
importance rating acrossthese statements satisfy the
criterion?
No
Yes
7.Is the statement
consistent with the definitionand GWAs of occupation?
No
Yes
8.Is the statement atappropriate level of
specificity/generality?
No
Yes
9.Is this statement in the
proper format (action verb-object)?
No
Yes
Yes
No
Yes
10. Write a new/revised statement to add to the emerging/current task list.
Revise or disregard
DisregardDocument
relevant task(s)Disregard or
collect more data
Disregard orcollect more data
Revise ordisregard
Revise ordisregard
Revise

Human Resources Research Organization (HumRRO) 9
analysis of the write-in data. There were varied reasons for this. For example, in most cases the task data would have to be reformatted prior to analysis. Other programs could only group similar tasks within the system and did not allow us to export the categorized tasks back to the original application (i.e., Excel). Furthermore, although some programs had preset aliases for grouping similar words/phrases, analysts themselves would have to develop numerous aliases to accommodate the unique tasks of each occupation. Taken together, we found it much easier and less time-consuming to manually code the statements within each occupation than to use any of these software applications. Thus, all the analyses described below were conducted in MS Excel.
Two researchers experienced in job analysis and with advanced degrees in industrial and
organizational psychology evaluated the write-in statements. Based on an examination of the first two occupations, several modifications were made to the decision-making process outlined in Figure 1 (see Figure 2). First, the researchers evaluated whether a statement was consistent with the available information about the occupation (e.g., the GWAs) earlier in the process (Step 4 vs. Step 7). Second, we increased the minimum number of write-in statements required to update a current task from 10 to 15 statements to be consistent with the 15-rater criterion used to evaluate current task statements. Finally, we moved steps 8 and 9 (from Figure 1) to the statement writing phase of the process.
There were four main steps in this process. First, the on-line definition, snapshot, and task
list of the occupation were reviewed. Second, several judgments for each write-in statement were made: (a) whether the statement was interpretable and (b) whether the statement was a job task or a statement that described something else, such as a generalized work activity (GWA) or KSAO. If a statement was a task, the next decision was to determine whether it was completely or partially redundant with one or more current tasks and documented the relevant task(s). If the task was partially redundant or unique from the current list of tasks, it was necessary to determine whether it was directly, intuitively (i.e., appears relevant but the task cannot be directly linked to the available information about the occupation), or not at all related to the occupation based on the available on-line information. Then, short task statements for these tasks were developed so that similar statements could be sorted and combined. Once all of the write-in statements were rated and categorized, the third step was to sort the partially redundant and unique tasks based on the abbreviated task statements created in Step 2. Finally, for unique and partially redundant tasks (both individual and groups of tasks), new statements were written to add to the emerging list of tasks.
Results
Interrater Agreement
One way to evaluate the efficacy of the process described above was to estimate the interrater agreement of the various judgments. Thus, both researchers evaluated the write-in statements from the first three occupations examined. Again, the two researchers made four primary judgments in the second step of the process:
u Is the statement a task (or could it be modified to represent a task)? u Is the statement completely redundant with one or more current task statements?

Human Resources Research Organization (HumRRO) 10
Figure 2
Modified Procedure Used to Evaluate Write-in Statements in the Present Study
1.Does the
statement describea task (or could it bemodified to describe
one)?
2.Is the statement
identical to a currenttask?
No
Yes
No
Yes
3.Is the statement
partially redundantwith a current
task?
Yes
No
4.Is the statement
consistent with the availableinformation about theoccupation (e.g., the
GWAs)?
Yes
No
7.Write a new statement to add to
current task list ($15 statements)or the emerging task list (10-14
statements).
4.Is the statement
consistent with the availableinformation about theoccupation (e.g., the
GWAs)?
Yes
No
5.Is the statement
identical (or highly similar)to at least 9 other
write-in statements?
Yes
No
6.Is the meanimportance
rating across thesestatements $3.0?
Yes
Disregard
Disregard
Disregard
Disregard
Disregard
Document the relevantcurrent task(s)
u Is the statement partially redundant with one or more current tasks? u To what extent is the statement related to the available information about the
occupation of interest (i.e., directly related, intuitively related, or not at all related). Table 3 displays the results of the interrater agreement analysis. The two researchers
agreed 96% of the time across the four judgments. The mean Kappa (Cohen, 1960) for these ratings was .88 (p < .001). Thus, the two researchers were making the same judgments in the vast

Human Resources Research Organization (HumRRO) 11
Table 3
Interrater Agreement for the Write-in Task Judgments Judgment Agreement Kappa 1. Is it a task? 93% .83 2. Is it completely redundant with a current task? 96% .86 3. Is it partially redundant with a current task? 96% .95 4. Is it consistent with the occupation? 97% .87 Mean 96% .88 Note. All Kappas are significant (p < .001). majority of cases. The few disagreements between the two analysts were about whether the statement described a task or whether it was really a KSAO or GWA. In general, such disagreements were easily resolved after a brief discussion. Only a couple of statements were not logically related to the occupation. Most statements were intuitively related to the occupation, while others were directly related to the definition and/or current task list.
Descriptive Statistics
Of the 1088 write-in statements, 675 were rated on importance and/or frequency (recall
that only statements from the eight pretest occupations included such ratings). Mean importance ratings ranged from 4.17 to 4.67 with a mean of 4.47 (SD = .72). Mean frequency ratings ranged from 3.65 to 5.51 with a mean of 4.93 (SD = 1.47). Only eight of the 675 importance ratings (1.2%) were below the cutoff of 3.0, while 121 frequency ratings were below the scale mean of 4.0 (17.9%). Approximately 2% of incumbents did not rate the importance and/or frequency of their suggested task statements.
Table 4 displays the descriptives for the 16 target occupations. On average, 25.69
incumbents provided write-in statements (7 to 73 incumbents per occupation). The number of statements per occupation varied between 14 and 211 (M = 68.0). Of the 1088 statements analyzed 376 (35%) were judged to be non-tasks, of which 39% of statements were incomprehensible, 27% were too broad, 18% were KSAOs, 14% were GWAs, and 2% were miscellaneous others (e.g., education and training requirements). Of the 712 statements judge to be tasks, 56% were unique from the current task lists of these occupations, while the remaining

Table 4
Descriptive Statistics of Write-in Task Analysis by Occupation Total Completely Partially Unique Raters per Unique Tasks Occupation N Statements Non-Tasks Redundant Redundant Tasks Unique Task per Category
Pretest Occupations
1. Aerospace Engineers 16 27 7 8 6 6 1.00 1.00 2. Architects 35 83 24 8 16 35 1.94 3.83 3. Bus Drivers 31 85 37 8 10 30 2.50 7.00 4. Correction Officers 73 211 67 36 25 83 3.95 7.20 5. Landscape Architects 34 90 35 10 15 30 1.72 6.20 6. Locksmiths/Safe Repairers 32 87 31 15 15 26 1.86 2.83 7. Opticians 35 98 28 3 32 35 3.56 5.33 8. Social/Human Svcs Assts 32 99 38 4 12 45 2.81 4.63 Mean 36.0 97.5 33.4 11.5 16.4 36.3 2.42 4.75
Additional Occupations 9. Accountants 19 46 15 11 12 8 1.33 2.00 10. Biologists 18 55 7 6 6 36 1.38 3.00 11. Construction Carpenters 7 20 7 4 0 9 1.28 2.00 12. Employment Interviewers 11 25 19 2 3 1 1.00 1.00 13. Insurance Sales Agents 17 43 16 10 5 12 1.00 1.00 14. Police Detectives 31 72 28 6 10 28 1.47 2.50 15. Retail Salespersons 9 14 8 3 1 2 2.00 2.00 16. Word Processors/Typists 11 33 9 4 6 14 3.50 2.67 Mean 15.4 38.5 13.6 5.8 5.4 13.8 1.62 2.02
Overall Mean 25.69 68.0 23.50 8.63 10.88 25.00 2.02 3.39 Totals 411 1088 376 138 174 400 --- ---
Hum
an Resources Research Organization (H
umRRO
) 12

Human Resources Research Organization (HumRRO) 13
tasks were either partially redundant (25%) or completely redundant (19%) with one or more current tasks. Finally, across the 16 occupations, one write-in task would be added to the current task list as a new task, two tasks would update a current task, and four write-in tasks would be added to the emerging task list.
Recommendations
In this section of the report, we provide recommendations for evaluating the remaining task information in the O*NET database based on what was learned in this study. The suggested criteria and methodology for analyzing current and write-in task data are described in turn. Criteria for Evaluating Current Tasks
Based on the results of this study and discussions with researchers from the North Carolina O*NET Center, it was determined that a finer distinction is needed between tasks that are critical to a particular occupation (i.e., “core tasks”) and those that were not (i.e., “non-relevant tasks”). This was addressed by developing a third category of tasks (i.e., “Supple- mentary tasks”) that falls between these two categories. Below are the recommended criteria for inclusion in each of these task categories:
u Core Tasks. These are tasks that the majority of incumbents consider relevant and
important to the occupation of interest. The criteria we recommend for these tasks are: (a) relevance > 67% and (b) a mean importance rating > 3.0.2
u Supplementary Tasks. These are tasks that may be relevant for a smaller percentage
of incumbents or may not be considered as important to performance in the occupation. We recommend that two sets of tasks be included in this category: (a) tasks rated > 67% on relevance but < 3.0 on importance, and (b) tasks rated between 10% and 66% on relevance, regardless of mean importance rating.
u Non-relevant Tasks. These are tasks that incumbents indicate are no longer relevant
to the occupation of interest. We suggest that this category include all tasks rated <10% on relevance, regardless of mean importance rating.
Table 5 presents that number of tasks in the eight pretest occupations that would be
included in each of these categories using the above criteria. The number of emerging tasks for each occupation is also provided based on a revised criterion described below. Instructions for analyzing and reporting existing tasks are provided in Appendix B. Criteria for Evaluating Write-in Statements
The following recommendations are offered for evaluating the write-in data from the remaining occupations in the O*NET database. First, we believe that the process for analyzing write-in statements used in the present study is appropriate and should be used to evaluate write-
2 Mean importance is computed by using only importance ratings. If a task is rated as not relevant, that information is not incorporated into the computation of the mean. That is, “0” should not be assigned to a task rated as not relevant.

Human Resources Research Organization (HumRRO) 14
Table 5
Number of Tasks Included in Each Category Based on the Revised Criteria Task Category ____________________________________________ Occupation Core Supplementary Non-Relevant Emerging Aerospace Engineers 12 1 0 0 Architects 10 1 0 1 Bus Drivers 8 2 0 3 Correction Officers 8 0 0 5 Landscape Architects 4 0 0 1 Locksmiths/Safe Repairers 7 2 0 2 Opticians 11 1 0 3 Social/Human Svcs Assts 4 16 0 1 Note. Emerging tasks include both unique tasks and statements that update a current task. in data from the remaining occupations. However, the number of incumbents who provided the same (or similar) write-in statements was typically far fewer than the number of incumbents who rated existing task statements. Thus, we do not recommend that any write-in tasks be added to the current task list or be used to update existing task statements. Instead, we suggest that unique and partially redundant write-in statements recommended by five or more incumbents be added to a list of emerging tasks for evaluation in future data collection projects. Write-in tasks that do not satisfy the criteria should be maintained for use in future data collection efforts. Furthermore, is unlikely that importance ratings will be a useful criterion, as the vast majority of incumbents indicated that their write-in statements were important to the occupation. Therefore this criterion is eliminated from the rating process. Finally, we also found that the write-in statements were consistent with the target occupation, which suggests the evaluation of their consistency is an unnecessary step in the process. Therefore, we eliminated this step in the evaluation procedures. The revised decision tree for analyzing write-in statements is shown in Figure 3.
Second, based on our review of numerous off-the-shelf content analysis programs, we
doubt that there is a software program that would facilitate the analysis of write-in data. We therefore recommend that future analyses be performed using MS Excel spreadsheets.

Human Resources Research Organization (HumRRO) 15
Figure 3
Final Recommended Procedure for Evaluating Write-in Statements
1.Does the
statement describea task (or could it
be modified to describeone)?
2.Is the statement
identical to a currenttask?
No
Yes
No
Yes
3.Is the statement
partially redundantwith an current
task?
Yes
No
4.Is the
statementidentical (or highly similar) to
at least four otherwrite-in statements?
Yes
No
5.Write a new task statement, or a revisedstatement if the write-in task is partiallyredundant with an current task, to be
added to the emerging task list.
Disregard
Disregard Document the relevantcurrent task(s)
Disregard
Our final recommendation concerns the number of researchers needed to analyze write-in data. In the present study, the time required for one researcher to analyze write-in statements for an occupation varied from 2 to 12 hours (M = 4 hours) depending on factors such as the number, quality, and complexity of task information. Although there was a high level of agreement between the ratings of the two analysts in this study, there were several occasions when the two researchers disagreed about whether a write-in statement actually described a task versus a KSAO or GWA. There were also some disparities in the groupings of unique tasks each analyst developed in the three initial occupations studied. For example, one researcher may have thought that several statements were similar enough to be considered the same general task, while the other researcher believed that the tasks were too disparate to be included in the same group. Nevertheless, given the strong interrater agreement and the improved evaluation procedure (see Figure 3), one analyst could evaluate the write-in tasks of each occupation. Analysts, however, should be well trained. It may also be advisable for an analyst trainee and a senior analyst to study 2-3 occupations during training and compare the results to help ensure the new analyst is on the right track. We also recommend that quality control measures be utilized wherever possible. For instance, we suggest that from time to time (e.g., every 20 occupations), two researchers evaluate the same occupation to monitor the interrater agreement of the various judgments required.

Human Resources Research Organization (HumRRO) 16
To summarize, the following recommendations are offered for evaluating write-in data from the remaining O*NET system occupations:
u Use the procedure developed and utilized in the present study. The final decision tree
for analyzing write-in statements is presented in Figure 3. Instructions for analyzing and reporting write-in statements are provided in Appendix C.
u Perform the analysis in Microsoft Excel. u Use one trained analyst to evaluate the write-in statements for each occupation with
the appropriate quality control measures (e.g. periodically evaluate interrater agreement between two analysts).
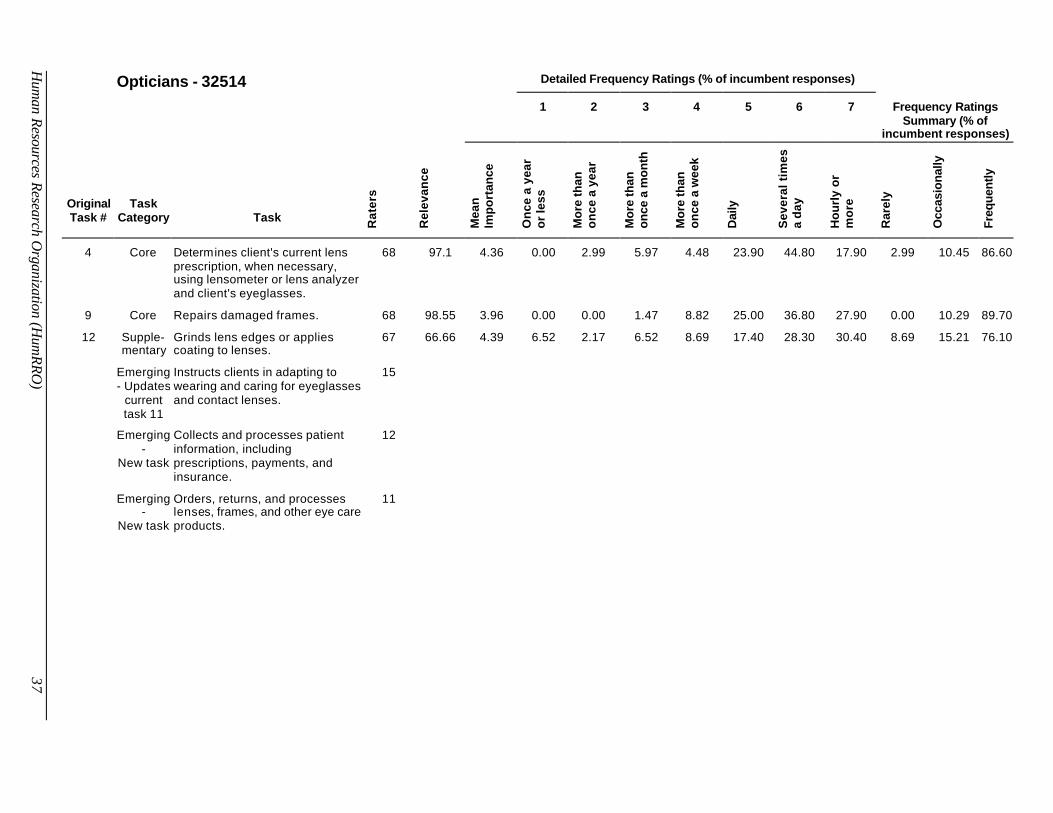
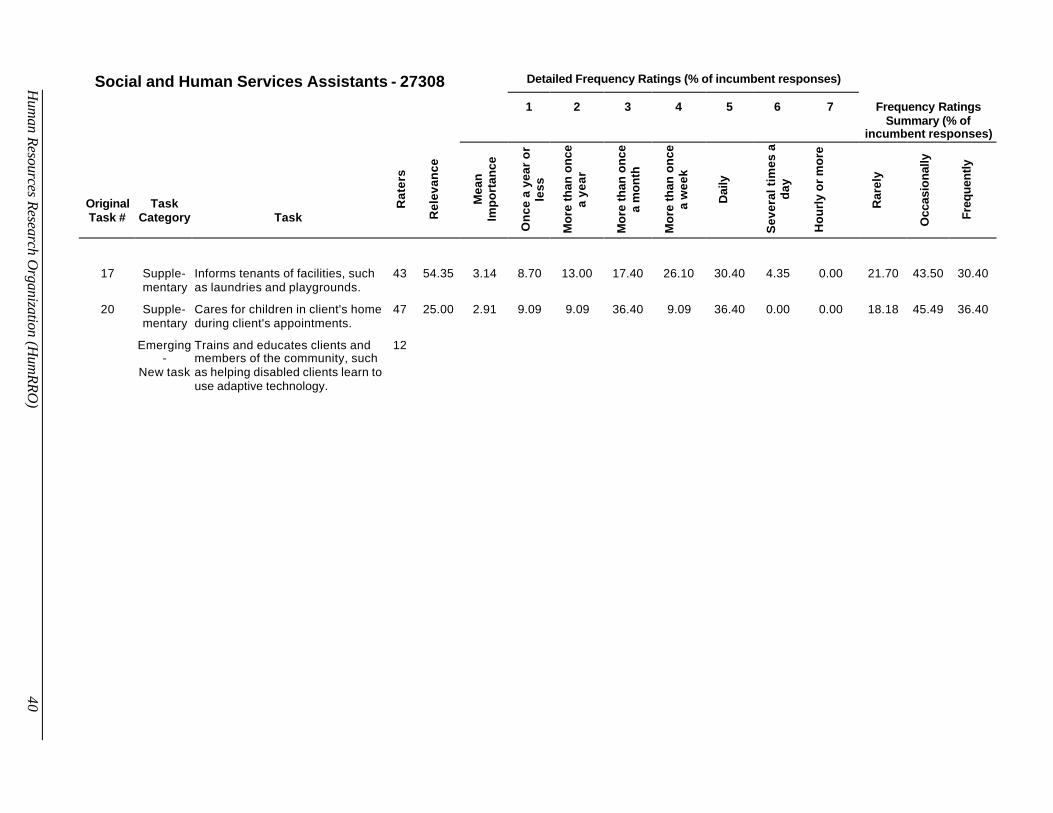
Reporting Task Data
Given the potential users and uses of O*NET system data, it is imperative to identify the data to be reported and the format that facilitates ease of its use. Appendix D displays the task information we recommend reporting using the eight pretest occupations as examples. For existing task statements (i.e., core, Supple- mentary, and non-relevant task categories), we recommend that the database include the following data fields:
u Category to which the task belongs (i.e., core, supplementary, and non-relevant) u Number of incumbents who provided task information u Percent of incumbents who indicated that the task is relevant to the occupation u Mean importance for the task. Tasks should be sorted in descending order of mean
importance. u Percentage of incumbents who endorsed each of the seven frequency scale points u Percentage of incumbent ratings in the following combined categories of frequency
ratings: a.) Rarely - once a year or less (1), more than once a year (2) b.) Occasionally - more than once a month (3), more than once a week (4) c.) Frequently - daily (5), several times a day (6), hourly or more (7)
For emerging tasks, two pieces of information should be reported for each task. First, the
type of task should be identified. That is, tasks that are entirely unique from the current task list should be labeled a “new task,” and tasks that are a revised version of current task should be identified as an “update of a current task.” The second piece of information to be reported for each write-in task is the number of incumbents who recommended it (sorted in descending order). We do not recommend including the importance or frequency ratings of emerging tasks because (a) only a small sample of incumbents provided these ratings, and (b) because not all incumbents have had an opportunity to evaluate these new tasks.

Human Resources Research Organization (HumRRO) 17
Conclusions Criteria for evaluating task information were developed and tested on 87 current statements and 1,088 write-in statements from 16 occupations from the O*NET data collection program. A procedure for categorizing existing tasks as core, supplemental, or non-relevant was developed and implemented on data from eight pretest occupations. The structured procedure designed to analyze the write-in task data from these occupations yielded a high level of agreement between the two researchers who conducted the analysis. Of the write-in statements examined, 65% described actual job tasks, over half of which (56%) were unique from information included in the current task lists for these occupations. Based on the final criteria, 17 write-in statements (16 from the eight pretest occupations and one from the additional occupations) were added to an emerging list of tasks to be evaluated in future O*NET system data collection projects. Finally, several recommendations were provided for evaluating and reporting task data from the remaining occupations in the O*NET database.

Human Resources Research Organization (HumRRO) 18
References Cohen, J. A. (1960). A coefficient of agreement for nominal scales. Educational and
Psychological Measurement, 20, 37-46. Office of Management and Budget Clearance Packaging Support Statement and Data Collection
Instruments (December 2000). United States Department of Labor (1991). Dictionary of occupational titles (4th ed.).
Washington, D.C.: Author.

Human Resources Research Organization (HumRRO) 19
Appendix A
Results of Current Task Analysis for Each Occupation

Table 6
Descriptive Statistics for Aerospace Engineers
Importance Frequency (%) Original Task # Relevance (%) M SD Range 1 2 3 4 5 6 7 M SD
1 94.00 3.79 0.88 2-5 8.51 27.7 36.2 17.0 4.30 2.13 4.26 3.04 1.37
2 88.00 3.89 0.87 2-5 4.55 25.0 25.0 34.1 6.80 2.27 2.27 3.30 1.25
3 82.00 3.80 1.23 1-5 17.1 24.4 26.8 17.1 12.2 0.00 2.44 2.93 1.42
4 74.00 3.84 0.90 2-5 8.11 27.0 18.9 16.2 18.9 5.41 5.41 3.49 1.64
5 72.00 3.97 1.00 1-5 11.1 25.0 25.0 19.4 11.1 5.56 2.78 3.22 1.51
6 90.00 3.93 0.89 2-5 6.67 22.2 22.2 24.4 15.6 4.44 4.44 3.51 1.50
7 94.00 4.21 0.88 2-5 2.13 8.51 17.0 17.0 38.3 8.51 8.51 4.40 1.44
8 76.00 3.63 1.00 2-5 10.5 21.1 26.3 18.4 21.1 0.00 2.63 3.29 1.43
9 78.00 3.62 0.97 2-5 12.8 38.5 25.6 20.5 2.56 0.00 0.00 2.62 1.04
10 64.00 3.84 0.88 2-5 9.40 25.0 37.5 15.6 9.40 0.00 3.13 3.03 1.31
11 76.00 3.66 1.07 1-5 10.5 44.7 28.9 7.89 5.26 2.63 0.00 2.61 1.13
12 68.00 3.47 1.08 1-5 8.82 26.5 32.4 26.5 5.88 0.00 0.00 2.94 1.07
13 68.00 3.21 1.09 1-5 44.1 20.6 20.6 11.8 2.94 0.00 0.00 2.09 1.19
Mean 78.77 3.76 0.97 --- 11.87 25.86 26.34 18.91 11.87 2.38 2.76 3.11 1.33 Note. N = 50.
Hum
an Resources Research Organization (H
umRRO
) 20

Table 7
Descriptive Statistics for Architects
Importance Frequency (%) Original Task # Relevance (%) M SD Range 1 2 3 4 5 6 7 M SD
1 96.67 4.47 0.80 1-5 0.00 6.90 13.8 8.62 39.7 15.5 15.5 4.90 1.44
2 93.33 4.35 0.73 3-5 0.00 10.7 32.1 17.9 32.1 7.14 0.00 3.93 1.17
3 93.32 4.18 0.86 2-5 0.00 10.9 32.7 32.7 20.0 3.64 0.00 3.73 1.03
4 93.33 4.25 0.81 2-5 1.79 5.36 12.5 25.0 41.1 5.36 8.93 4.50 1.31
5 93.33 4.34 0.82 1-5 1.79 8.93 42.9 26.8 12.5 5.36 1.79 3.63 1.15
6 91.67 3.93 0.74 3-5 0.00 18.2 49.1 30.9 0.00 1.82 0.00 3.18 0.80
7 95.00 4.14 0.91 2-5 0.00 1.75 22.8 17.5 29.8 22.8 5.26 4.65 1.26
8 88.33 4.29 0.80 2-5 3.78 17.0 18.9 22.6 26.4 5.66 5.66 3.91 1.50
9 86.67 3.46 1.00 2-5 11.5 59.6 25.0 3.85 0.00 0.00 0.00 2.21 0.70
10 76.27 3.71 1.06 1-5 13.3 28.9 28.9 11.1 13.3 4.44 0.00 2.96 1.38
11 51.67 2.74 1.12 1-5 35.5 38.7 22.6 3.23 0.00 0.00 0.00 1.94 0.85
Mean 87.24 3.99 0.88 --- 6.15 18.82 27.39 18.19 19.54 6.52 3.38 3.59 1.14 Note. N = 68–70 (M = 69.4). Tasks in bold type do not satisfy one or more of the specified criteria.
Hum
an Resources Research Organization (H
umRRO
) 21

Table 8
Descriptive Statistics for Bus Drivers
Importance Frequency (%) Original Task # Relevance (%) M SD Range 1 2 3 4 5 6 7 M SD
1 96.49 4.59 0.80 1-5 0.00 1.85 7.41 7.41 35.2 11.1 37.0 5.57 1.35
2 77.78 4.24 1.14 1-5 0.00 10.0 15.0 15.0 27.5 7.50 25.0 4.83 1.66
3 98.25 4.44 0.79 3-5 0.00 3.64 5.45 5.45 34.5 20.0 30.9 5.55 1.33
4 49.09 3.96 1.40 1-5 4.00 12.0 20.0 36.0 20.0 4.00 4.00 3.84 1.34
5 98.25 4.04 0.95 2-5 0.00 0.00 5.56 7.41 40.7 20.4 25.9 5.54 1.13
6 92.98 4.27 0.97 2-5 3.85 7.69 7.69 9.62 38.5 15.4 17.3 4.87 1.61
7 67.27 4.06 0.91 2-5 0.00 11.1 11.1 5.56 44.4 2.77 25.0 4.92 1.61
8 94.74 4.68 0.71 1-5 0.00 0.00 5.77 5.77 71.2 15.4 1.92 5.02 0.73
9 96.36 4.18 0.95 2-5 12.0 12.0 18.0 6.00 40.0 8.00 4.00 3.90 1.69
10 38.89 3.70 1.30 2-5 19.0 38.1 4.76 28.6 9.52 0.00 0.00 2.71 1.35
Mean 81.01 4.22 0.99 --- 3.89 9.64 10.07 12.68 36.15 10.46 17.10 4.67 1.38 Note. N = 54–57 (M = 55.8). Tasks in bold type do not satisfy one or more of the specified criteria.
Hum
an Resources Research Organization (H
umRRO
) 22

Table 9
Descriptive Statistics for Correction Officers and Jailers
Importance Frequency (%) Original Task # Relevance (%) M SD Range 1 2 3 4 5 6 7 M SD
1 99.32 4.86 0.40 3-5 1.41 0.00 0.70 0.70 5.63 7.04 84.5 6.68 0.94
2 97.26 4.43 0.82 2-5 1.46 0.73 8.03 19.7 24.1 28.5 17.5 5.20 1.33
3 95.24 4.67 0.56 3-5 0.74 1.47 4.41 5.88 27.2 27.9 32.4 5.71 1.25
4 91.03 4.02 1.03 1-5 6.92 19.2 23.8 18.5 20.0 6.92 4.62 3.65 1.55
5 97.28 4.56 0.69 2-5 0.72 5.04 10.8 24.5 30.9 15.8 12.2 4.76 1.36
6 86.30 4.47 0.79 2-5 3.33 2.50 5.00 26.7 25.8 10.0 26.7 5.06 1.55
7 97.28 4.47 0.76 2-5 1.43 1.43 7.14 5.71 34.3 21.4 28.6 5.49 1.35
8 90.34 3.77 0.91 2-5 0.79 1.57 5.51 7.87 44.9 37.0 2.36 5.15 1.01
Mean 94.26 4.41 0.75 --- 2.10 3.99 8.17 13.7 26.6 19.3 26.1 5.21 1.29 Note. N = 145–147 (M = 146.3).
Hum
an Resources Research Organization (H
umRRO
) 23

Table 10
Descriptive Statistics for Landscape Architects
Importance Frequency (%) Original Task # Relevance (%) M SD Range 1 2 3 4 5 6 7 M SD
1 100.0 4.68 0.55 3-5 0.00 1.89 20.8 9.43 39.6 15.1 13.2 4.85 1.34
2 98.15 4.44 0.70 2-5 0.00 3.77 26.4 26.4 22.6 9.43 11.3 4.42 1.38
3 98.15 4.10 0.81 2-5 0.00 20.8 45.3 26.4 5.66 0.00 1.85 3.25 0.98
4 100.0 4.41 0.75 2-5 0.00 3.70 11.1 27.8 29.6 14.8 13.0 4.80 1.31
Mean 99.08 4.41 0.71 --- 0.00 7.54 25.90 22.51 24.37 9.84 9.84 4.33 1.25 Note. N = 53–54 (M = 53.8).
Hum
an Resources Research Organization (H
umRRO
) 24

Table 11
Descriptive Statistics for Locksmiths and Safe Repairers
Importance Frequency (%) Original Task # Relevance (%) M SD Range 1 2 3 4 5 6 7 M SD
1 98.18 4.35 0.97 1-5 1.89 1.89 0.00 11.3 20.8 45.3 18.9 5.58 1.14
2 100.0 4.44 0.80 2-5 5.66 0.00 1.89 1.89 20.8 45.3 24.5 5.66 1.16
3 83.33 3.37 0.99 2-5 13.3 31.1 26.7 15.6 8.89 2.22 2.22 2.91 1.37
4 98.18 4.63 0.69 3-5 0.00 0.00 1.89 1.89 1.89 30.2 64.2 6.53 0.92
5 66.67 3.06 0.97 1-5 17.1 37.1 25.7 8.57 2.86 2.86 5.71 2.74 1.55
6 72.22 3.08 1.12 1-5 12.8 41.0 41.0 2.56 0.00 0.00 2.56 2.46 0.65
7 100.0 4.32 0.75 3-5 0.00 0.00 5.56 31.5 37.0 11.1 14.8 4.98 1.03
8 48.15 2.13 0.99 1-4 46.2 38.5 3.85 7.69 3.85 0.00 0.00 1.85 1.11
9 83.64 4.23 1.03 1-5 4.35 4.35 17.4 15.2 26.1 23.9 8.70 4.61 1.45
Mean 83.37 3.73 0.92 --- 11.26 17.10 13.78 10.69 13.58 17.88 15.73 4.15 1.15 Note. N = 54–55 (M = 54.4). Tasks in bold type do not satisfy one or more of the specified criteria.
Hum
an Resources Research Organization (H
umRRO
) 25

Table 12
Descriptive Statistics for Opticians
Importance Frequency (%) Original Task # Relevance (%) M SD Range 1 2 3 4 5 6 7 M SD
1 100.0 4.91 0.29 4-5 0.00 0.00 1.45 0.00 7.25 23.2 68.1 6.57 0.76
2 95.71 4.85 0.40 3-5 0.00 0.00 0.00 0.00 8.96 43.3 47.8 6.39 0.65
3 92.86 4.75 0.73 2-5 0.00 1.54 3.08 4.62 18.5 33.8 38.5 5.95 1.14
4 97.10 4.36 0.89 2-5 0.00 2.99 5.97 4.48 23.9 44.8 17.9 5.55 1.20
5 98.57 4.65 0.59 3-5 0.00 0.00 1.45 1.45 8.70 31.9 56.5 6.41 0.83
6 98.57 4.60 0.63 3-5 0.00 0.00 1.47 1.47 7.35 36.8 52.9 6.38 0.81
7 100.0 4.62 0.67 3-5 0.00 0.00 0.00 4.29 8.57 31.4 55.7 6.39 0.82
8 92.65 4.45 0.78 2-5 0.00 0.00 1.59 7.94 20.6 36.5 33.3 5.92 1.00
9 98.55 3.96 0.91 2-5 0.00 0.00 1.47 8.82 25.0 36.8 27.9 5.81 1.00
10 69.57 4.63 0.68 3-5 2.08 0.00 2.08 10.4 14.6 41.7 29.2 5.77 1.23
11 100.0 4.49 0.80 2-5 0.00 0.00 0.00 5.71 15.7 35.7 42.9 6.16 0.89
12 66.66 4.39 0.86 2-5 6.52 2.17 6.52 8.69 17.4 28.3 30.4 5.35 1.72
Mean 92.52 4.56 0.69 --- 0.72 0.56 2.09 4.82 14.7 35.4 41.8 6.05 1.00 Note. N = 68–70 (M = 69.4).
Hum
an Resources Research Organization (H
umRRO
) 26

Table 13
Descriptive Statistics for Social and Human Service Assistants
Importance Frequency (%) Original Task # Relevance (%) M SD Range 1 2 3 4 5 6 7 M SD 1 83.67 3.85 1.10 1-5 2.44 9.76 36.6 22.0 9.76 17.1 2.44 3.88 1.42 2 73.47 3.86 1.14 1-5 2.86 5.71 11.4 25.7 25.7 22.9 5.71 4.57 1.42 3 63.27 3.65 1.11 1-5 6.46 6.46 19.4 22.6 32.3 9.70 3.23 4.10 1.45 4 81.63 4.00 1.19 1-5 5.00 12.5 5.00 27.5 22.5 22.5 5.00 4.38 1.58 5 58.33 3.19 1.21 1-5 7.41 18.5 25.9 18.5 22.2 0.00 7.41 3.59 1.58 6 55.10 3.44 1.39 1-5 11.1 22.2 25.9 18.5 11.1 3.70 7.41 3.37 1.67 7 55.10 3.15 1.26 1-5 16.7 25.0 25.0 12.5 20.8 0.00 0.00 2.96 1.40 8 33.33 3.47 1.19 1-5 0.00 13.3 6.67 13.3 53.3 13.3 0.00 4.47 1.25 9 46.81 3.57 1.29 1-5 14.3 9.52 19.0 23.8 23.8 4.76 4.76 3.67 1.65 10 47.92 3.45 0.89 2-5 4.76 4.76 33.3 4.76 52.4 0.00 0.00 3.95 1.24 11 56.25 3.58 1.06 2-5 4.00 20.0 20.0 20.0 36.0 0.00 0.00 3.64 1.29 12 54.35 3.50 0.96 2-5 4.00 24.0 32.0 20.0 16.0 0.00 4.00 3.36 1.35 13 38.30 3.83 1.04 2-5 0.00 6.25 6.25 12.5 43.8 0.00 31.3 5.19 1.52 14 53.33 3.84 1.14 1-5 0.00 12.5 12.5 20.8 25.0 16.7 12.5 4.58 1.56 15 48.94 3.71 1.10 2-5 4.76 23.8 19.0 4.76 33.3 4.76 9.50 3.90 1.76 16 43.48 3.42 0.90 2-5 5.00 10.0 20.0 15.0 45.0 5.00 0.00 4.00 1.34 17 54.35 3.14 0.94 2-5 8.70 13.0 17.4 26.1 30.4 4.35 0.00 3.70 1.40 18 82.61 3.56 0.97 1-5 0.00 22.2 22.2 33.3 13.9 5.56 2.78 3.67 1.29 19 64.58 3.79 1.10 1-5 0.00 6.90 10.3 17.2 48.3 13.8 3.45 4.62 1.18 20 25.00 2.91 0.94 2-5 9.09 9.09 36.4 9.09 36.4 0.00 0.00 3.55 1.37 Mean 55.99 3.54 1.10 --- 5.33 13.77 20.21 18.40 30.10 7.21 4.97 3.96 1.43 Note. N = 46–49 (M = 47.6). Tasks in bold type do not satisfy one or more of the specified criteria.
Hum
an Resources Research Organization (H
umRRO
) 27

Human Resources Research Organization (HumRRO) 28
Appendix B
Instructions for Analyzing and Reporting Current Task Statements

Human Resources Research Organization (HumRRO) 29
Analyzing Current Task Statements There are two main steps in analyzing current task statements. First, a minimum of 15 incumbents must provide relevance (i.e., rated as not relevant) or importance ratings to be included in the database. Statements rated by 15 or more incumbents must then be classified into one of three categories of task statements: core tasks, Supple- mentary tasks, and non-relevant tasks. Below is a description of the tasks included in each category.
u Core Tasks. These are tasks that are critical to the occupation. The criteria for these tasks are: (a) relevance > 67% and (b) a mean importance rating > 3.0.3
u Supplementary Tasks. These are tasks that are less relevant and/or important to the
occupation. Two sets of tasks are included in this category: (a) tasks rated > 67% on relevance but < 3.0 on importance, and (b) tasks rated between 10% and 66% on relevance, regardless of mean importance rating.
u Non-relevant Tasks. These are tasks that are no longer relevant to the occupation of
interest. This category includes all tasks rated < 10% on relevance, regardless of mean importance rating. These tasks should not be included in the final task list.
For all task categories, the percent relevant should be calculated by dividing the number
of incumbents who rated the importance and/or frequency of the task by the number of raters who provided either or both of these pieces of information plus those who indicated that the task was not relevant to the occupation. For example, if 40 incumbents rated both the importance and frequency of a given task, and 10 incumbents indicated that the task was not relevant to the occupation, the percent relevance for this task would be 80% [40 / (40 + 10)]. The percent relevance would also be 80% if 30 incumbents rated the task on both importance and frequency, seven incumbents only rated the importance of the task, and three incumbents only rated the frequency with which the task is performed.
Reporting Current Task Statements
The following information should be reported for each task statement in all three categories of tasks. Within each category, tasks should be sorted in descending order of mean importance.
u Category to which the task belongs (e.g., core task) u Number of incumbents who provided task information. This is computed by adding
the number of incumbents who provided importance ratings to the number of incumbents who indicated that the task was not relevant to the occupation.
u Percent of incumbents who indicated that the task is relevant to the occupation u Mean importance for the task. u Percentage of incumbents who endorsed each of the seven frequency scale points
3 Mean importance is computed by using only importance ratings. If a task is rated as not relevant, that information is not incorporated into the computation of the mean. That is, “0” should not be assigned to a task rated as not relevant.

Human Resources Research Organization (HumRRO) 30
u Percentage of incumbent ratings in the following combined categories of frequency ratings:
a.) Rarely - once a year or less (1), more than once a year (2) b.) Occasionally - more than once a month (3), more than once a week (4) c.) Frequently - daily (5), several times a day (6), hourly or more (7)

Human Resources Research Organization (HumRRO) 31
Appendix C
Instructions for Analyzing and Reporting Write-in Task Statements

Human Resources Research Organization (HumRRO) 32
Analyzing Write-in Task Statements Step 1: Thoroughly review the on-line information about the occupation, including the definition,
snapshot, and current task list. Step 2: Once you have familiarized yourself with the occupation, make the following judgments
for each write-in statement:
a.) Determine whether the statement is a task or could be modified to describe a task. If the statement is not a task, justify your rating. Common explanations include:
§ This statement is indecipherable § This statement is too broad § This statement describes a GWA § This statement describes a KSAO § This statement describes a job requirement (e.g., must have a driver’s
license)
b.) If you think a statement is in fact a task, decide whether it is completely redundant with one or more current task statements. If it is, document the task(s) with which it overlaps (e.g., Current Task 8).
c.) Next, judge whether the statement is partially redundant with a current task
statement and document which one(s).
d.) Develop a short task statement (e.g., “conducts audits”) so that similar statements can be sorted and combined later in the process.
Step 3: Once all the statements have been evaluated, group similar partially redundant tasks and
similar unique tasks based on the abbreviated task statements created in Step 2e. This can be accomplished by sorting alphabetically the column of statements in the Excel spreadsheet.
Step 4: Finally, for unique and partially redundant task groups that include five or more
statements, write a new statement to be added to the emerging task list. When writing new task statements, ensure that the statement is in the same format as the tasks in the current list (e.g., began each statement with an action verb, made sure that the statement was at the appropriate level of specificity).
Reporting Write-in Task Statements
Two pieces of information should be reported for each emerging task. First, the type of
task should be identified. That is, tasks that are entirely unique from the current task list should be labeled a “new task,” and tasks that are a revised version of current task should be identified as an “update of a current task.” The second piece of information to be reported for each write-in task is the number of incumbents who recommended it.

Human Resources Research Organization (HumRRO) 33
Appendix D
Task Information to Report for the Eight Pretest Occupations

Landscape Architects - 22308 Detailed Frequency Ratings (% of incumbent responses)
1 2 3 4 5 6 7
Frequency Ratings Summary (% of
incumbent responses)
Original Task #
Task Category Task
Rat
ers
Rel
evan
ce
Mea
n
Imp
ort
ance
On
ce a
yea
r o
r le
ss
Mo
re th
an
on
ce a
yea
r
Mo
re th
an
on
ce a
mo
nth
Mo
re th
an
on
ce a
wee
k
Dai
ly
Sev
eral
tim
es
a d
ay
Ho
url
y o
r m
ore
Rar
ely
Occ
asio
nally
Freq
uent
ly
1 Core Prepares site plans, specifications, and cost estimates for land development, coordinating arrangement of existing and proposed land features and structures.
50 100.00 4.68 0.00 1.89 20.80 9.43 39.60 15.10 13.20 1.89 30.23 67.90
2 Core Compiles and analyzes data on conditions, such as location, drainage, and location of structures for environmental reports and landscaping plans.
51 98.15 4.44 0.00 3.77 26.40 26.40 22.60 9.43 11.30 3.77 52.80 43.33
4 Core Confers with clients, engineering personnel, and architects on overall program.
51 100.00 4.41 0.00 3.70 11.10 27.80 29.60 14.80 13.00 3.70 38.90 57.40
3 Core Inspects landscape work to ensure compliance with specifications, approve quality of materials and work, and advise client and construction personnel.
51 98.15 4.10 0.00 20.80 45.30 26.40 5.66 0.00 1.85 20.80 71.70 7.51
Emerging - New tasks
Attempts to develop new business by writing proposals, creating marketing materials, and meeting with potential clients.
6
Hum
an Resources Research Organization (H
umRRO
) 34

Locksmiths/Safe Repairers - 85923 Detailed Frequency Ratings (% of incumbent
responses)
1 2 3 4 5 6 7
Frequency Ratings Summary (% of
incumbent responses)
Original Task # Task Category Task
Rat
ers
Rel
evan
ce
Mea
n
Imp
ort
ance
On
ce a
yea
r o
r le
ss
Mo
re t
han
on
ce
a ye
ar
Mo
re t
han
on
ce
a m
on
th
Mo
re t
han
on
ce
a w
eek
Dai
ly
Sev
eral
tim
es a
d
ay
Ho
url
y o
r m
ore
Rar
ely
Occ
asio
nally
Freq
uent
ly
4 Core Cuts new or duplicate keys, using keycutting machine. 52 98.18 4.63 0.00 0.00 1.89 1.89 1.89 30.20 64.20 0.00 3.78 96.29
2 Core Inserts new or repaired tumblers into lock to change combination. 52 100.00 4.44 5.66 0.00 1.89 1.89 20.80 45.30 24.50 5.66 3.78 90.60
1 Core Disassembles mechanical or electrical locking devices and repairs or replaces worn tumblers, springs, and other parts, using hand tools.
53 98.18 4.35 1.89 1.89 0.00 11.30 20.80 45.30 18.90 3.78 11.30 85.00
7 Core Moves picklock in cylinder to open door locks without keys.
53 100.00 4.32 0.00 0.00 5.56 31.50 37.00 11.10 14.80 0.00 37.06 62.90
9 Core Keeps record of company locks and keys. 53 83.64 4.23 4.35 4.35 17.40 15.20 26.10 23.90 8.70 8.70 32.60 58.70
3 Core Repairs and adjusts safes, vault doors, and vault components, using hand tools, lathes, drill presses, and welding and acetylene cutting apparatus.
50 83.33 3.37 13.30 31.10 26.70 15.60 8.89 2.22 2.22 44.40 42.30 13.33
6 Core Opens safe locks by drilling. 52 72.22 3.08 12.80 41.00 41.00 2.56 0.00 0.00 2.56 53.80 43.56 2.56
5 Supple- mentary
Installs safes, vault doors, and deposit boxes according to blueprints, using equipment such as powered drills, taps, dies, truck crane, and dolly.
51 66.67 3.06 17.10 37.10 25.70 8.57 2.86 2.86 5.71 54.20 34.27 11.43
8 Supple- mentary
Removes interior and exterior finishes on safes and vaults and sprays on new finishes.
52 48.15 2.13 46.20 38.50 3.85 7.69 3.85 0.00 0.00 84.70 11.54 3.85
Emerging -
Updates current task 4
Cuts new or duplicate keys using impressioning, key code, or keycutting equipment.
14
Emerging - New task
Opens locked automobiles for customers.6
Hum
an Resources Research Organization (H
umRRO
) 35

Opticians - 32514 Detailed Frequency Ratings (% of incumbent responses)
1 2 3 4 5 6 7 Frequency Ratings Summary (% of
incumbent responses)
Original Task #
Task Category
Task Rat
ers
Rel
evan
ce
Mea
n
Imp
ort
ance
On
ce a
yea
r o
r le
ss
Mo
re th
an
on
ce a
yea
r
Mo
re th
an
on
ce a
mo
nth
Mo
re th
an
on
ce a
wee
k
Dai
ly
Sev
eral
tim
es
a d
ay
Ho
url
y o
r m
ore
Rar
ely
Occ
asio
nally
Freq
uent
ly
1 Core Measures client's bridge and eye size, temple length, vertex distance, pupillary distance, and optical centers of eyes, using measuring devices.
68 100 4.91 0.00 0.00 1.45 0.00 7.25 23.20 68.10 0.00 1.45 98.55
2 Core Prepares work order and instructions for grinding lenses and fabricating eyeglasses.
69 95.71 4.85 0.00 0.00 0.00 0.00 8.96 43.30 47.80 0.00 0.00 100.06
3 Core Verifies finished lenses are ground to specification.
69 92.86 4.75 0.00 1.54 3.08 4.62 18.50 33.80 38.50 1.54 7.70 90.80
5 Core Recommends specific lenses, lens coatings, and frames to suit client needs.
69 98.57 4.65 0.00 0.00 1.45 1.45 8.70 31.90 56.50 0.00 2.90 97.10
10 Core Fabricates lenses to prescription specifications.
67 69.57 4.63 2.08 0.00 2.08 10.40 14.60 41.70 29.20 2.08 12.48 85.50
7 Core Heats, shapes, or bends plastic or metal frames to adjust eyeglasses to fit client, using pliers and hands.
69 100 4.62 0.00 0.00 0.00 4.29 8.57 31.40 55.70 0.00 4.29 95.67
6 Core Assists client in selecting frames according to style and color, coordinating frames with facial and eye measurements and optical prescription.
69 98.57 4.60 0.00 0.00 1.47 1.47 7.35 36.80 52.90 0.00 2.94 97.05
11 Core Instructs clients in adapting to wearing and caring for eyeglasses.
68 100 4.49 0.00 0.00 0.00 5.71 15.70 35.70 42.90 0.00 5.71 94.30
8 Core Evaluates prescription in conjunction with client's vocational and avocational visual requirements.
67 92.65 4.45 0.00 0.00 1.59 7.94 20.60 36.50 33.30 0.00 9.53 90.40
Hum
an Resources Research Organization (H
umRRO
) 36
Opticians - 32514 Detailed Frequency Ratings (% of incumbent responses)
1 2 3 4 5 6 7 Frequency Ratings Summary (% of
incumbent responses)
Original Task #
Task Category
Task Rat
ers
Rel
evan
ce
Mea
n
Imp
ort
ance
On
ce a
yea
r o
r le
ss
Mo
re th
an
on
ce a
yea
r
Mo
re th
an
on
ce a
mo
nth
Mo
re th
an
on
ce a
wee
k
Dai
ly
Sev
eral
tim
es
a d
ay
Ho
url
y o
r m
ore
Rar
ely
Occ
asio
nally
Freq
uent
ly
4 Core Determines client's current lens prescription, when necessary, using lensometer or lens analyzer and client's eyeglasses.
68 97.1 4.36 0.00 2.99 5.97 4.48 23.90 44.80 17.90 2.99 10.45 86.60
9 Core Repairs damaged frames. 68 98.55 3.96 0.00 0.00 1.47 8.82 25.00 36.80 27.90 0.00 10.29 89.70
12 Supple- mentary
Grinds lens edges or applies coating to lenses.
67 66.66 4.39 6.52 2.17 6.52 8.69 17.40 28.30 30.40 8.69 15.21 76.10
Emerging - Updates
current task 11
Instructs clients in adapting to wearing and caring for eyeglasses and contact lenses.
15
Emerging -
New task
Collects and processes patient information, including prescriptions, payments, and insurance.
12
Emerging -
New task
Orders, returns, and processes lenses, frames, and other eye care products.
11
H
uman Resources Research O
rganization (Hum
RRO)
37

Social and Human Services Assistants - 27308 Detailed Frequency Ratings (% of incumbent responses)
1 2 3 4 5 6 7 Frequency Ratings Summary (% of
incumbent responses)
Original Task #
Task Category
Task
Rat
ers
Rel
evan
ce
Mea
n
Imp
ort
ance
On
ce a
yea
r o
r le
ss
Mo
re t
han
on
ce
a ye
ar
Mo
re t
han
on
ce
a m
on
th
Mo
re t
han
on
ce
a w
eek
Dai
ly
Sev
eral
tim
es a
d
ay
Ho
url
y o
r m
ore
Rar
ely
Occ
asio
nally
Freq
uent
ly
4 Core Provides information on and refers individuals to public or private agencies and community services for assistance.
48 81.63 4.00 5.00 12.50 5.00 27.50 22.50 22.50 5.00 17.50 32.50 50.00
2 Core Advises clients regarding food stamps, childcare, food, money management, sanitation, and housekeeping.
48 73.47 3.86 2.86 5.71 11.40 25.70 25.70 22.90 5.71 8.57 37.10 54.31
1 Core Visits individuals in homes or attends group meetings to provide information on agency services, requirements and procedures.
48 83.67 3.85 2.44 9.76 36.60 22.00 9.76 17.10 2.44 12.20 58.60 29.30
18 Core Submits to and reviews reports and problems with superior.
44 82.61 3.56 0.00 22.20 22.20 33.30 13.90 5.56 2.78 22.20 55.50 13.90
14 Supple- mentary
Transports and accompanies clients to shopping area and to appointments, using automobile.
46 53.33 3.84 0.00 12.50 12.50 20.80 25.00 16.7 12.5 12.50 33.30 25.00
13 Supple- mentary
Oversees day-to-day group activities of residents in institution.
47 38.30 3.83 0.00 6.25 6.25 12.50 43.80 0.00 31.30 6.25 18.75 75.10
19 Supple- mentary
Keeps records and prepares reports for owner or management concerning visits with clients.
45 64.58 3.79 0.00 6.90 10.30 17.20 48.30 13.8 3.45 6.90 27.50 48.30
15 Supple- mentary
Explains rules established by owner or management, such as sanitation and maintenance requirements, and parking regulations.
45 48.94 3.71 4.76 23.80 19.00 4.76 33.30 4.76 9.50 28.56 23.76 33.30
Hum
an Resources Research Organization (H
umRRO
) 38

Social and Human Services Assistants - 27308 Detailed Frequency Ratings (% of incumbent responses)
1 2 3 4 5 6 7 Frequency Ratings Summary (% of
incumbent responses)
Original Task #
Task Category
Task
Rat
ers
Rel
evan
ce
Mea
n
Imp
ort
ance
On
ce a
yea
r o
r le
ss
Mo
re t
han
on
ce
a ye
ar
Mo
re t
han
on
ce
a m
on
th
Mo
re t
han
on
ce
a w
eek
Dai
ly
Sev
eral
tim
es a
d
ay
Ho
url
y o
r m
ore
Rar
ely
Occ
asio
nally
Freq
uent
ly
3 Supple- mentary
Interviews individuals and family members to compile information on social, educational, criminal, institutional, or drug history.
49 63.27 3.65 6.46 6.46 19.40 22.60 32.30 9.70 3.23 12.92 42.00 45.23
11 Supple- mentary
Observes and discusses meal preparation and suggests alternate methods of food preparation.
45 56.25 3.58 4.00 20.00 20.00 20.00 36.00 0.00 0.00 24.00 40.00 36.00
9 Supple- mentary
Meets with youth groups to acquaint them with consequences of delinquent acts.
43 46.81 3.57 14.30 9.52 19.00 23.80 23.80 4.76 4.76 23.82 42.80 33.32
12 Supple- mentary
Consults with supervisor concerning programs for individual families.
43 54.35 3.50 4.00 24.00 32.00 20.00 16.00 0.00 4.00 28.00 52.00 20.00
8 Supple- mentary
Monitors free, Supple- mentary meal program to ensure cleanliness of facility and that eligibility guidelines are met for persons receiving meals.
47 33.33 3.47 0.00 13.30 6.67 13.30 53.30 13.30 0.00 13.30 19.97 66.60
10 Supple- mentary
Observes clients' food selections and recommends alternate economical and nutritional food choices.
45 47.92 3.45 4.76 4.76 33.30 4.76 52.40 0.00 0.00 9.52 38.06 52.40
6 Supple- mentary
Assists in locating housing for displaced individuals.
47 55.10 3.44 11.10 22.20 25.90 18.50 11.10 3.70 7.41 33.30 44.40 22.21
16 Supple- mentary
Demonstrates use and care of equipment for tenant use.
45 43.48 3.42 5.00 10.00 20.00 15.00 45.00 5.00 0.00 15.00 35.00 45.00
5 Supple- mentary
Assists clients with preparation of forms, such as tax or rent forms.
47 58.33 3.19 7.41 18.50 25.90 18.50 22.20 0.00 7.41 25.91 44.40 29.61
7 Supple- mentary
Assists in planning of food budget, utilizing charts and sample budgets.
48 55.10 3.15 16.70 25.00 25.00 12.50 20.80 0.00 0.00 41.70 37.50 20.80
Hum
an Resources Research Organization (H
umRRO
) 39
Social and Human Services Assistants - 27308 Detailed Frequency Ratings (% of incumbent responses)
1 2 3 4 5 6 7 Frequency Ratings Summary (% of
incumbent responses)
Original Task #
Task Category
Task
Rat
ers
Rel
evan
ce
Mea
n
Imp
ort
ance
On
ce a
yea
r o
r le
ss
Mo
re t
han
on
ce
a ye
ar
Mo
re t
han
on
ce
a m
on
th
Mo
re t
han
on
ce
a w
eek
Dai
ly
Sev
eral
tim
es a
d
ay
Ho
url
y o
r m
ore
Rar
ely
Occ
asio
nally
Freq
uent
ly
17 Supple- mentary
Informs tenants of facilities, such as laundries and playgrounds.
43 54.35 3.14 8.70 13.00 17.40 26.10 30.40 4.35 0.00 21.70 43.50 30.40
20 Supple- mentary
Cares for children in client's home during client's appointments.
47 25.00 2.91 9.09 9.09 36.40 9.09 36.40 0.00 0.00 18.18 45.49 36.40
Emerging -
New task
Trains and educates clients and members of the community, such as helping disabled clients learn to use adaptive technology.
12
Hum
an Resources Research Organization (H
umRRO
) 40