Embed Size (px)
Citation preview

© Transamerica Institute®, 2018
A Precarious Existence:How Today’s Retirees Are Financially Faring in Retirement
December 2018

• Welcome to the 2018 Transamerica Retirement Survey of Retirees
– About the Authors Page 3
– About Transamerica Center for Retirement Studies® Page 4
– About the Survey Page 5
– Retiree Survey Methodology Page 6
– Acknowledgements Page 7
• A Precarious Existence: How Today’s Retirees Are Financially Faring in Retirement
– Executive Summary Page 9
– Recommendations for Retirees Page 28
– Recommendations: Essential Design Features of a Modernized U.S. Retirement System Page 29
– Life in Retirement Page 31
– When and How Retirement Happened Page 42
– Current Financial Situation Page 52
– Looking Back on Financial Preparations for Retirement Page 75
– Living Arrangements in Retirement Page 83
– Long-Term Care and Legal Documents Page 89
• Appendix: A Demographic Portrait of Retirees Page 93
Table of Contents
2

Catherine Collinson serves as CEO and president of Transamerica Institute®, a nonprofit private foundation which includes
Transamerica Center for Retirement Studies®. She is a champion for Americans who are at risk of not achieving a financially
secure retirement. Catherine oversees all research, publications and outreach initiatives, including the Annual Transamerica
Retirement Survey. In 2015, Catherine was also named executive director of the Aegon Center for Longevity and Retirement.
With two decades of retirement services experience, Catherine has become a nationally recognized voice on retirement trends for
the industry. She has testified before Congress on matters related to employer-sponsored retirement plans among small
business, which featured the need to raise awareness of the Saver’s Credit among those who would benefit most from the
important tax credit.
In 2018, Catherine was named an Influencer in Aging by PBS’ Next Avenue. In 2016, she was honored with a Hero Award from
the Women’s Institute for a Secure Retirement (WISER) for her tireless efforts in helping improve retirement security among
women. Catherine serves on the Advisory Board of the Milken Institute’s Center for the Future of Aging. She co-hosts the
ClearPath: Your Roadmap to Health & Wealth radio show on Baltimore’s WYPR, an NPR news station.
Catherine is employed by Transamerica Corporation. Since joining the organization in 1995, she has held a number of positions
with responsibilities including in the incorporation of Transamerica Center for Retirement Studies as a nonprofit private
foundation in 2007 and its expansion into Transamerica Institute in 2013, as well as the creation of the Aegon Center for
Longevity and Retirement in 2015.
Patti Rowey serves as Vice President of Transamerica Institute. She is retirement and market trends expert and helps manage
and execute all research initiatives, including the Annual Transamerica Retirement Survey. Patti has more than 20 years of
retirement services experience, specializing in market research covering a broad range of stakeholders, including retirement plan
participants and sponsors, financial advisors and retirees. She is employed by Transamerica Corporation.
Heidi Cho is a Senior Research Content Analyst for Transamerica Institute. She began her career as an intern at Transamerica
Center for Retirement Studies in 2012. She joined the organization full-time in 2014 upon graduating from University of Southern
California. She is employed by Transamerica Corporation.
About the Authors
3

• Transamerica Center for Retirement Studies® (TCRS) is a division of Transamerica Institute® (The Institute),
a nonprofit, private foundation. TCRS is dedicated to educating the public on emerging trends surrounding
retirement security in the United States. Its research emphasizes employer-sponsored retirement plans,
including companies and their employees, retirees and the implications of legislative and regulatory
changes. For more information about TCRS, please refer to www.transamericacenter.org.
• The Institute is funded by contributions from Transamerica Life Insurance Company and its affiliates and
may receive funds from unaffiliated third parties.
• TCRS and its representatives cannot give ERISA, tax, investment or legal advice. This material is provided
for informational purposes only and should not be construed as ERISA, tax, investment or legal advice.
Interested parties must consult and rely solely upon their own independent advisors regarding their
particular situation and the concepts presented here.
• Although care has been taken in preparing this material and presenting it accurately, TCRS disclaims any
express or implied warranty as to the accuracy of any material contained herein and any liability with
respect to it.
About Transamerica Center for Retirement Studies®
4

• Since 1998, Transamerica Center for Retirement Studies® (TCRS) has conducted a national survey of U.S.
business employers and workers regarding their attitudes toward retirement. The overall goals for the study
are to illuminate emerging trends, promote awareness, and help educate the public. It has grown to be one
of the longest running and largest national surveys of its kind. This survey of Retirees is the second time
TCRS has conducted research among retirees; the first time was in 2015.
• The Harris Poll was commissioned to conduct the 2018 Transamerica Retirement Survey of Retirees for
TCRS. TCRS is not affiliated with The Harris Poll.
• The Harris Poll has been tracking public opinion, motivations and social sentiments in the U.S. since 1963.
It is now part of Harris Insights & Analytics, a global consulting and market research firm that delivers social
intelligence for transformational times. Its mission is to provide insights and advisory to help leaders make
the best decisions possible. To learn more, please visit www.theharrispoll.com.
About the Survey
5
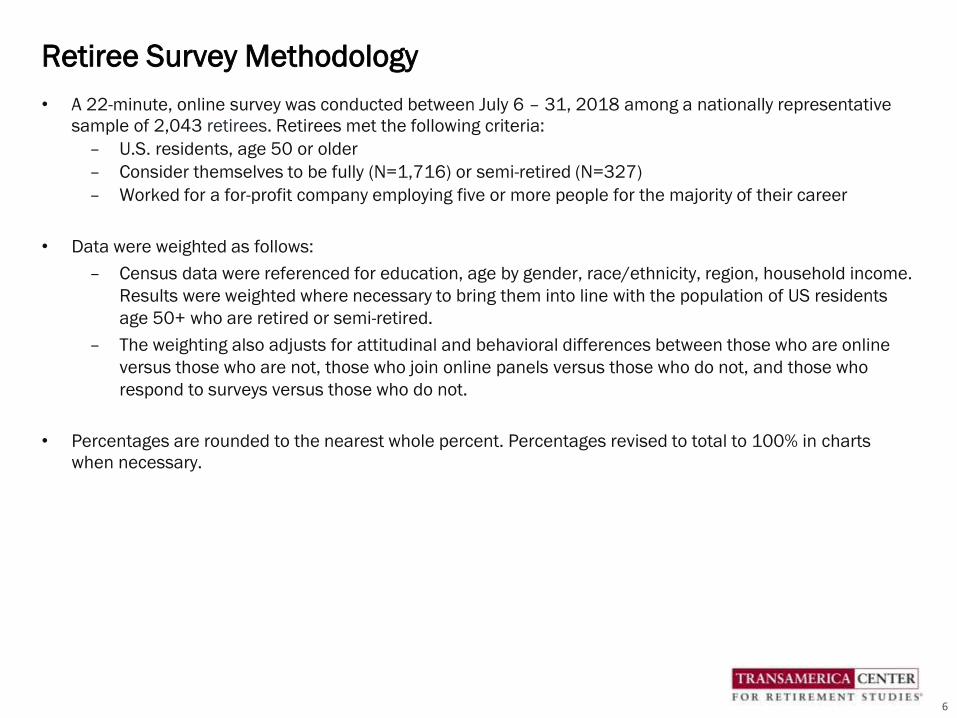
• A 22-minute, online survey was conducted between July 6 – 31, 2018 among a nationally representative
sample of 2,043 retirees. Retirees met the following criteria:
– U.S. residents, age 50 or older
– Consider themselves to be fully (N=1,716) or semi-retired (N=327)
– Worked for a for-profit company employing five or more people for the majority of their career
• Data were weighted as follows:
– Census data were referenced for education, age by gender, race/ethnicity, region, household income.
Results were weighted where necessary to bring them into line with the population of US residents
age 50+ who are retired or semi-retired.
– The weighting also adjusts for attitudinal and behavioral differences between those who are online
versus those who are not, those who join online panels versus those who do not, and those who
respond to surveys versus those who do not.
• Percentages are rounded to the nearest whole percent. Percentages revised to total to 100% in charts
when necessary.
Retiree Survey Methodology
6

Acknowledgements
Kent Callahan
Heidi Cho
Wonjoon Cho
Catherine Collinson
Jeanne de Cervens
Hector De La Torre
Phil Eckman
Steve Eichmann
Jaime Greco
Michelle Gosney
David Hopewell
David Krane
Joe Lee
Corey Ly
Mike Mansfield
Bryan Mayaen
Mark Mullin
Jay Orlandi
Maurice Perkins
Julie Quinlan
Jesus Robles
Gabe Rozenwasser
David Schultz
Laura Scully
Frank Sottosanti
Julie Tschida Brown
Ashlee Vogt
Patti Vogt Rowey
Steven Weinberg
Hank Williams
Chris Wells
Alex Wynaendts
7

A Precarious Existence:
How Today’s Retirees Are Financially Faring in Retirement
8

Today’s retirees are living a financially precarious existence. How did this happen?
Some could have been better at saving and planning, while others could have done
everything right and still find themselves facing a savings shortfall. When today’s
retirees started their working careers decades ago, the retirement landscape was
quite different and many assumptions about retirement funding have since
changed. Traditional defined benefit plans have all but disappeared amid the
proliferation of self-funded 401(k) and similar plans. Life expectancies have
increased, and now people have the potential of living longer than in any other time
in history. Although inflation rates have been low, housing and healthcare-related
costs have sky-rocketed. Government benefits, such as Social Security and
Medicare, are under severe financial strain and reforms are imminently needed.
Transamerica Center for Retirement Studies® conducted a survey in 2018 of more
than 2,000 retirees to assess how today’s retirees are doing. Retirees are still
relatively young at age 71 (median). A Precarious Existence: How Today’s Retirees
Are Financially Faring in Retirement, details the survey’s findings, identifies issues
and opportunities, and offers actionable insights for current and future retirees.
Executive Summary
9

Life in Retirement
Most retirees are enjoying life in retirement and are in good health. They are spending their time on a wide
variety of activities and, for the most part, are maintaining their standard of living. Many are taking steps to
protect their health (although they can do even more). Some are even planning to live to age 100 or older.
Nevertheless, retirees also have some well-founded retirement fears.
• Most Retirees Have a Positive Outlook on Life. Retirees are far more likely to cite positive attitudes and
experiences than negative. Most retirees agree that they “are generally happy people” (91 percent), “have
a close relationship with family and/or friends” (90 percent), and “are confident in their ability to manage
their finances” (88 percent). In contrast, relatively few retirees are finding that “everyday activities are
becoming difficult” (28 percent), “having trouble making ends meet” (26 percent), and “often feel anxious
and depressed” (20 percent).
• Four in Ten Retirees Indicate Enjoyment of Life Has Increased. Since entering retirement, 40 percent of
retirees indicate that their enjoyment of life has “increased,” 39 percent say it has “stayed the same.”
Nineteen percent of retirees say their enjoyment of life has “decreased” since they retired.
• Retirees Are Spending Their Time on a Variety of Activities. When asked how they are spending their time
in retirement, retirees cite a wide variety of activities, including spending more time with family and friends
(61 percent), pursuing hobbies (44 percent), and traveling (39 percent). Twenty-one percent are doing
volunteer work and 15 percent are taking care of their grandchildren. Seven percent of retirees are doing
some form of paid work such as pursuing an encore career (4 percent), continue working in the same field
(4 percent), and/or starting a business (1 percent).
• One in Four Retirees Have Spent Significant Time Caregiving. Since retiring, 25 percent of retirees have
dedicated a significant amount of their time serving as a caregiver to a family member or friend who needs
help taking care of themselves.
Executive Summary
10

Life in Retirement (cont.)
• Majority of Retirees Say Their Standard of Living Has Stayed the Same. Sixty-four percent of retirees
indicate their standard of living has “stayed the same” since they retired, while 25 percent say it has
“decreased.” Only nine percent say their standard of living has “increased” since they retired.
• Seven in Ten Retirees are in Good or Excellent Health. Among the retirees surveyed, 71 percent describe
their general health as “good” (58 percent) or “excellent” (13 percent). Twenty-five percent describe their
general health as “fair” and four percent as “poor.” Fifty-five percent of retirees indicate their general
health has “stayed the same” since retiring. Thirty-four percent indicate it has “declined.” Only nine percent
indicate their general health has “improved.”
• Few Retirees Surveyed Are Currently Receiving Long-Term Care. Only two percent of the retirees surveyed
are currently receiving long-term care to assist them with their daily activities.
• Retirees Are Taking Care of Their Health – But Can Do More. Almost all retirees (98 percent) are doing at
least one health-related activity on a consistent basis, with the five most cited activities being: seeking
medical attention when needed (82 percent), getting physicals and recommended health screenings (78
percent), maintaining a positive outlook (69 percent), getting plenty of rest (67 percent), and avoiding
harmful substances (e.g., cigarettes, alcohol, illicit drugs, etc.) (67 percent). Sixty-five percent of retirees
indicate they eat healthily and 56 percent exercise regularly.
• What Age Are You Planning to Live To? Many Are “Not Sure.” It is a bit uncomfortable question to ask
people how long they plan to live; however, it is an important question for financial planning. When asked
what age they are planning live to, more than half of retirees (52 percent) responded that they are “not
sure,” which is a reasonable answer given the nature of the question. Among retirees who provided a
specific age, the median age they are planning to live to is 90. Fourteen percent of retirees plan to live to
age 100 or older.
Executive Summary
11

Life in Retirement (cont.)
• Greatest Retirement Fears Include Health and Financial Issues. When asked about their greatest
retirement fears, retirees most frequently cite declining health that requires long-term care (47 percent)
and a reduction in or elimination of Social Security (47 percent). Losing their independence (38 percent)
and outliving their savings and investments (37 percent) are also often cited retirement fears.
Retirees are doing well, albeit with health- and financial-related fears. Some of their fears may be beyond their
control to solve, while others could be mitigated by proactively taking steps to address them.
Executive Summary
12

When and How Retirement Happened
Retirement is highly personal. People retire at different ages and for different reasons. For some, retirement
is the culmination of careful planning and preparation. For many others, retirement happens as a result of
unforeseen circumstances such as health issues or job loss. The survey findings illustrate the array of
circumstances in which people retire, whether they are continuing to work in retirement, and how they
transitioned into retirement.
• “What Prompted You to Decide That it Was Time to Retire?” This open-ended question in the survey
reveals the truly personal nature of retirees’ decisions to retire, ranging from employment-related
issues, ill-health, family responsibilities, to the financial ability to retire. Here are some of their
responses:
– When you're over or approaching 60, the prospects of continuing employment significantly dwindles by the days, not months or years. I just hoped I had planned well enough to allow me to continue to live close to what I was used to during my working years. I'm hanging in there with no complaints. – Man, age 70, retired at 63.
– My husband had taken a medical retirement and we wanted to do some traveling while he was still able to. – Woman, age 79, retired at 70.
– I was forced into retirement due to workforce reduction. – Man, age 73, retired at 70.
– I had worked from age 16 to age 71 and I said it is time to enjoy the income you earned over that time frame. – Man, age 75, retired at 71.
– My grandchildren needed a caregiver while their mom worked. – Woman, age 65, retired at 65.
– I was going to quit work due to being disabled, in the meantime my partner was diagnosed with stage 4 lung cancer which had metastasized to his brain now and he is on hospice as we speak. Everything we had planned went up in smoke. We had to use all or most of our savings to live. – Woman, age 57, retired at 48.
– My husband and I came into an inheritance that helped make that decision. – Man, age 71, retired at 65.
– I had to move back to Michigan from Florida and become a caregiver to my aging parents. – Man, age 69, retired at 62
Executive Summary
13
When and How Retirement Happened (cont.)
• Nine in Ten Retirees Are Fully Retired. Eighty-nine percent of retirees are fully retired and 11 percent
consider themselves semi-retired. Nine percent of retirees are currently working for pay, including five
percent who are employed part-time, two percent who are employed full-time, and two percent who are
self-employed. Two percent of retirees are unemployed but looking for work.
• More Than Half of the Fully Retired Did So Before Age 65. Among those who are fully retired, the median
retirement age is 63. More than half of the fully retired (56 percent) retired before age 65. Fourteen
percent retired at age 65. Twenty-seven percent retired after age 65, including 13 percent who retired
between ages 66 and 69, 12 percent who retired in their seventies, and two percent who fully retired at
age 80 or older. Four percent of the fully retired say they do not expect to ever stop working.
• Reasons for Working in Retirement Include Health and Financial. Among retirees who retired after age 65,
their rationales are evenly split between healthy aging-related reasons (66 percent) and financial-related
reasons (65 percent). The five most often cited specific reasons are: wanting the income (56 percent),
enjoying what they do (47 percent), being active (47 percent), keeping their brain alert (34 percent), and
having a sense of purpose (27 percent).
• Many Retirees Envisioned an Immediate vs. Gradual Transition Before entering retirement, 45 percent of
retirees envisioned they would immediately stop working once they reached a specific age (38 percent) or
amount of money (7 percent). One-in-five (21 percent) envisioned they would transition into retirement by
reducing work hours (14 percent) or working in a different capacity that would be less demanding and/or
bring greater personal satisfaction (7 percent). Fifteen percent envisioned they would continue working as
long as possible until they couldn’t work anymore, and 19 percent are not sure.
Executive Summary
14
When and How Retirement Happened (cont.)
• How Retirees’ Transition Into Retirement Actually Happened. When asked how their transition into
retirement actually happened, the proportion of retirees’ actions were similar to the way they envisioned
their retirement would take place (see page 47). Forty-six percent immediately stopped working when
they reached a specific age (39 percent) or amount of money (7 percent). Nineteen percent transitioned
into retirement either by reducing work hours (11 percent) or working in a less demanding capacity (8
percent). Seventeen percent continued/are continuing to work in retirement as long as possible until
they can/could no longer work anymore.
• Approximately One in Three Retired When They Had Planned. Approximately one in three retirees (35
percent) indicate they retired when they had planned to do so. More than half of retirees (56 percent)
retired sooner than they had planned. Nine percent retired later than planned.
• Reasons for Retiring Sooner Than Planned: Work and Ill-Health. Among the 56 percent of retirees who
retired sooner than planned, more than half (54 percent) cite employment-related reasons, including job
loss (24 percent), organizational changes at their place of employment (22 percent), unhappiness with
their job (15 percent), and/or took a retirement incentive or buyout (11 percent). Forty-seven percent
cite health and/or family-related reasons, including their own ill health (28 percent), family
responsibilities (15 percent), and/or their spouse/partner retired. Only 11 percent of retirees retired
sooner than planned because of financial ability, including they had saved enough and could afford to
retire (10 percent) and/or they received a financial windfall (1 percent).
Executive Summary
15

When and How Retirement Happened (cont.)
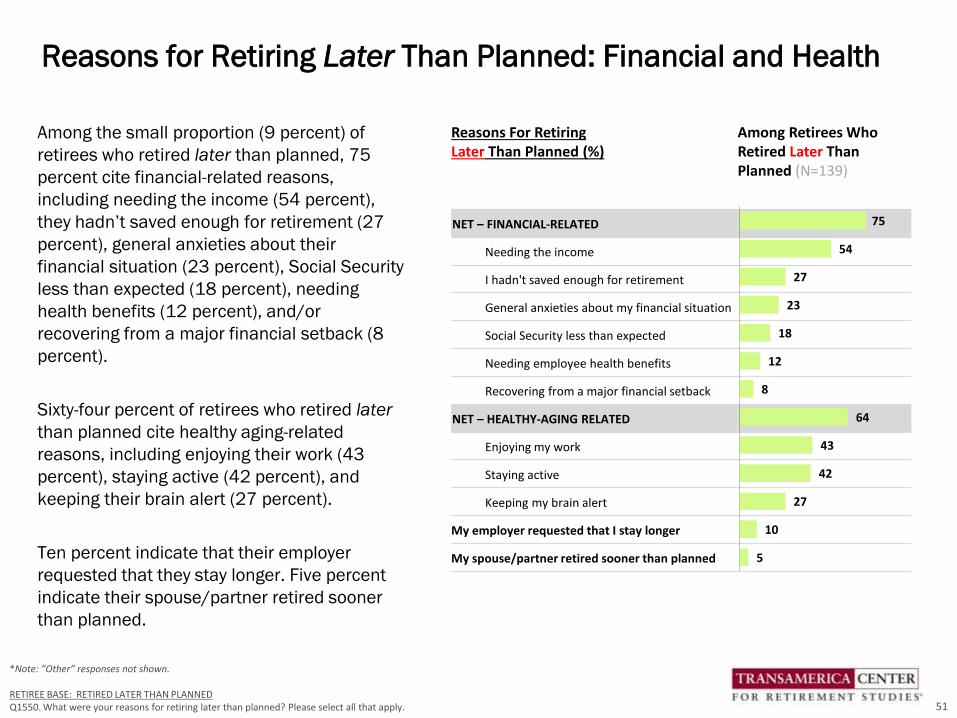
• Reasons for Retiring Later Than Planned: Financial and Health. Among the small proportion (9 percent)
of retirees who retired later than planned, 75 percent cite financial-related reasons, including needing
the income (54 percent), they hadn’t saved enough for retirement (27 percent), general anxieties about
their financial situation (23 percent), Social Security less than expected (18 percent), needing health
benefits (12 percent), and/or recovering from a major financial setback (8 percent). Sixty-four percent of
retirees who retired later than planned cite healthy aging-related reasons, including enjoying their work
(43 percent), staying active (42 percent), and keeping their brain alert (27 percent). Ten percent
indicate that their employer requested that they stay longer. Five percent indicate their spouse/partner
retired sooner than planned.
Retirees’ circumstances regarding when and how they retired exemplify common risks: employment issues,
ill-health, and financial need. They offer a cautionary tale for those currently in the workforce on the
importance of maintaining good health, financial planning, and competitive job skills. Retirees’ experiences
also underscore the need for careful planning including contingency plans if forced into retirement sooner
than expected.
Executive Summary
16

Current Financial Situation
Retirees are getting by financially – at least for the time being. However, there are clear indicators that many
are vulnerable and lack the financial resources needed to recover from a major setback or financial shock.
Some risk outliving their savings.
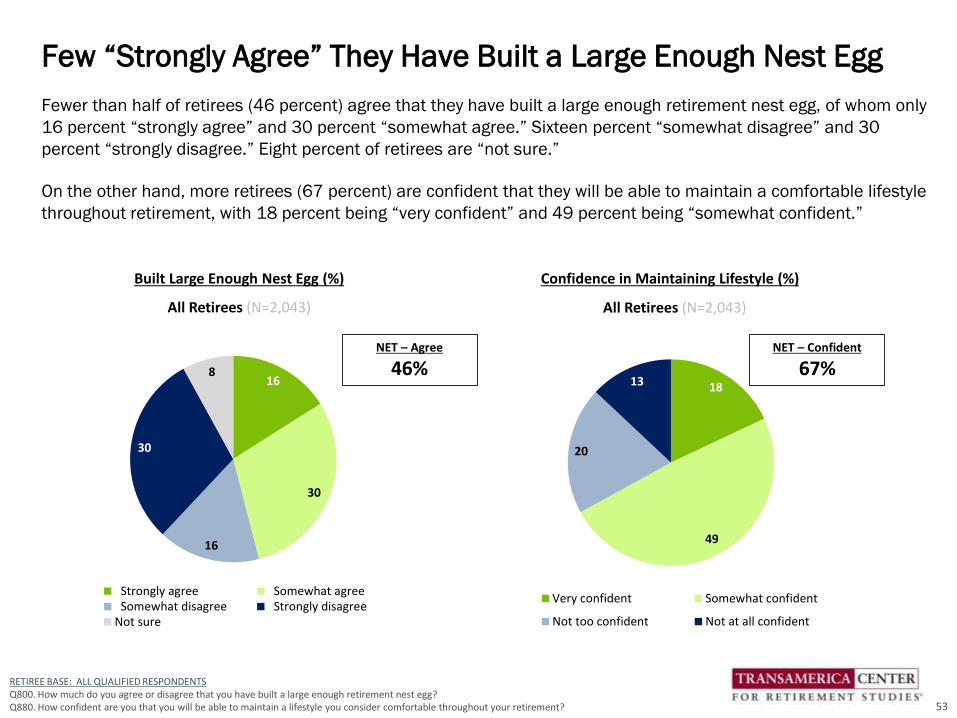
• Few “Strongly Agree” They Have Built a Large Enough Nest Egg. Fewer than half of retirees (46 percent)
agree that they have built a large enough retirement nest egg, of whom only 16 percent “strongly agree”
and 30 percent “somewhat agree.” Sixteen percent “somewhat disagree” and 30 percent “strongly
disagree.” Eight percent of retirees are “not sure.” On the other hand, more retirees (67 percent) are
confident that they will be able to maintain a comfortable lifestyle throughout retirement, with 18
percent being “very confident” and 49 percent being “somewhat confident.”
• Approximately One in Three Say Their Financial Situation Has Declined. Since entering retirement, 42
percent of retirees indicate that their personal financial situation has “stayed the same,” while
approximately one in three (36 percent) indicate it has “declined.” Only 20 percent of retirees say that
their personal financial situation has “improved.”
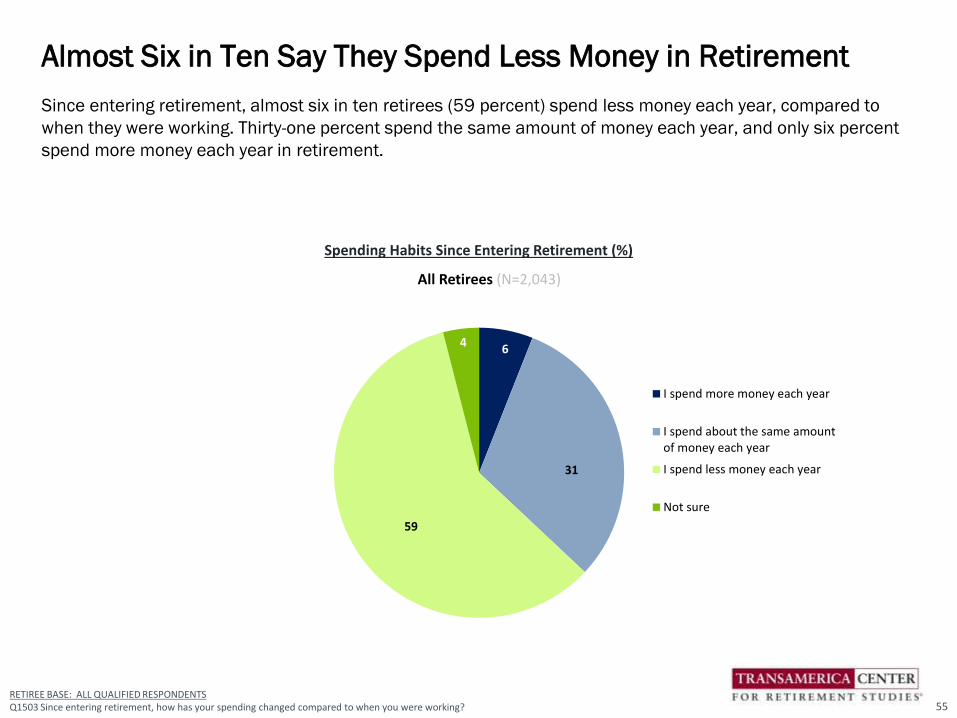
• Almost Six in Ten Say They Spend Less Money in Retirement. Since entering retirement, almost six in
ten retirees (59 percent) spend less money each year, compared to when they were working. Thirty-one
percent spend the same amount of money each year, and only six percent spend more money each year
in retirement.
• Four in Ten Cite Paying Off Debt as a Current Financial Priority. Retirees most frequently cite “just
getting by to cover basic living expenses” (39 percent) as a financial priority. Other frequently cited
priorities include “paying healthcare expenses” (34 percent), “paying off credit card debt” (29 percent),
“building emergency savings” (25 percent) and “continuing to save for retirement” (20 percent). An
alarming 40 percent of retirees cite paying off some form of debt as a current priority (e.g., credit card,
mortgage and/or other consumer debt).
Executive Summary
17

Current Financial Situation (cont.)
• Most Retirees Do Not Have Financial Dependents. Sixty percent of retirees do not support anyone
financially. Nine percent of retirees support their adult children aged 25 or older. Among those who are
married or living with their partner, 27 percent support their spouse/partner.
• Retirees Cite Diverse Sources of Income. Nearly all retirees (96 percent) receive income from Social
Security. The other most frequently cited sources of retirement income include other savings and
investments (42 percent), 401(k)/403(b)/IRAs (41 percent), and company-funded pension plans (35
percent). Relatively few retirees cite home equity (11 percent), paid work (8 percent), and inheritance (7
percent) as sources of income.
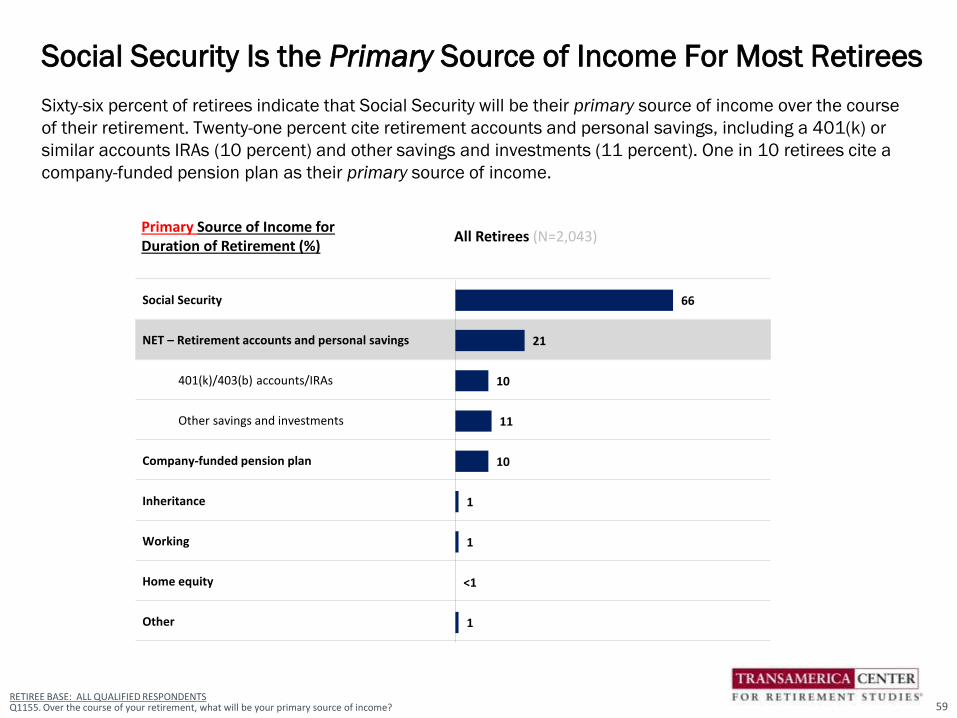
• Social Security Is the Primary Source of Income For Most Retirees. Sixty-six percent of retirees indicate
that Social Security will be their primary source of income over the course of their retirement. Twenty-
one percent cite retirement accounts and personal savings, including a 401(k) or similar accounts IRAs
(10 percent) and other savings and investments (11 percent). One in 10 retirees cite a company-funded
pension plan as their primary source of income.
• Nine in Ten Retirees Are Currently Receiving Social Security. The vast majority of retirees (90 percent)
are currently receiving income from Social Security benefits. Among them, the median age they started
receiving benefits was 62 – the earliest age that most workers can claim Social Security, albeit at a
permanently reduced amount of benefit. Depending on their year of birth, the age at which workers are
eligible to receive “full” benefits is between 65 and 67. The survey finds 29 percent of retirees started
receiving benefits between age 65 and 69. Only four percent started receiving benefits at age 70 or
older, with age 70 being when people are eligible to receive maximum monthly benefits.
• Only One in Ten Receive Financial Support. Ten percent of retirees receive some form of financial
support in retirement, including five percent from their children and four percent from a government
agency other than Social Security. The vast majority of retirees (89 percent) are not receiving financial
support.
Executive Summary
18

Current Financial Situation (cont.)
• Retirees Have a Variety of Savings and Investments. Retirees currently have a wide variety of savings and
investments, including checking accounts (82 percent), savings accounts (67 percent), and/or equity in
their primary residence (52 percent). Retirees are less likely to have retirement accounts such as IRAs (40
percent), annuities (22 percent), and 401(k), 403(b), or similar plans (21 percent).
• Spouse/Partner’s Retirement Savings. Among retirees who are married or living with their partner, 62
percent indicate that their spouse/partner saves or has saved in a retirement plan of his or her own.
• Familiarity with Spouse/Partner’s Retirement Plan and Savings. The majority of retirees who are married or
living with their partner are familiar with their spouse/partner’s retirement plan and savings (57 percent
“very familiar”; 27 percent “somewhat familiar”). Seven percent are “not too familiar” and nine percent are
“not at all familiar” with their spouse’s/partner’s retirement plan and savings.
• Many Retirees Have Limited Household Income. Retirees report an annual household income of $32,000
(estimated median). Twenty-five percent of retirees have a household income of less than $25,000, while
15 percent have an income of $100,000 or more.
• Retirees Have Limited Household Savings given the number of years they will be spending in retirement.
– Retirees have $75,000 (estimated median) in household savings (excluding home equity). Thirty-one percent have savings of less than $50,000, including nine percent who do not have any savings. Thirty-eight percent of retirees have savings of $100,000 or more.
– Retirees have $79,000 (estimated median) in home equity. Forty-one percent have home equity of $100,000 or more. Twenty-two percent do not have any home equity.
• Retirees’ Household Debt. Many retirees are still paying off household debt.
– Forty-five percent have non-mortgage debt (i.e., credit card debt, car loans, student loans, medical debt, etc.), including 28 percent who have between $1 and $10,000 and 17 percent with $10,000 or more. Among those who have non-mortgage debt, the estimated median is $4,000.
– Twenty-eight percent of retirees have mortgage debt (including any equity loans or lines of credit), including 19 percent who have between $1 and $100,000 and nine percent with $100,000 or more. Among those with mortgage debt, the estimated median is $52,000.
Executive Summary
19

Current Financial Situation (cont.)
• Retirees Have a Variety of Insurance Coverage. The five most commonly held types of insurance among
retirees are major medical insurance (84 percent), homeowner’s/renter’s insurance (75 percent),
prescription drug coverage insurance (74 percent), life insurance (50 percent), and dental insurance
(40 percent). Notably, only 12 percent of retirees currently have long-term care insurance.
• Most Retirees Have Health Insurance Through Medicare. Among retirees with major medical insurance,
Medicare is by far the most common provider of insurance: 63 percent are the primary insured on a
Medicare plan; 35 percent are the primary insured on Medicare Advantage; 12 percent are covered by
Medicare through their spouse/partner; and six percent are covered by Medicare Advantage through
their spouse/partner. Far fewer retirees have major medical insurance through a prior employer,
traditional insurance market, Medicaid, VA benefits, or other sources.
• Only Twelve Percent Have a Written Retirement Strategy. Fifty-four percent of retirees currently have a
retirement strategy – but only 12 percent have it in writing, while 42 percent have a plan but it is not
written. Many retirees (46 percent) do not currently have a retirement strategy.
• Many May Be Overlooking Important Factors in Their Strategies. Among retirees who currently have a
retirement strategy, 85 percent have factored Social Security and Medicare benefits into their strategy.
Most have included on-going living expenses (79 percent) and total savings and income needs (57
percent) into their strategies. Fewer than half have considered other critical factors into their plans (e.g.,
investment returns, ongoing healthcare costs, inflation, long-term care needs, tax planning, etc.). Only
nine percent have contingency plans for retiring sooner than expected and/or savings shortfalls.
Executive Summary
20

Current Financial Situation (cont.)
• Approximately One in Three Use a Professional Financial Advisor. Thirty-four percent of retirees currently
use a professional financial advisor. Among those who do, the majority use their advisors to make
retirement investment recommendations (77 percent). Relatively fewer use their advisors to calculate
retirement income needs (27 percent), develop strategies for spending down savings (27 percent), general
financial planning (23 percent), tax planning and preparation (22 percent), and/or inheritance and estate
planning (18 percent). Even fewer receive advice related to planning for long-term care and healthcare
expenses.
• Retirees Rely on a Variety of Sources About Saving and Investing. Retirees rely on a variety of sources of
information for managing their retirement savings and investments, with financial planners/brokers (32
percent) being the most frequently cited source. Relatively few cite friends/family (12 percent), print
newspapers and magazines (11 percent), financial websites (10 percent), or other sources. Forty-two
percent of retirees cite “none.”
• Almost Half Never Discuss Their Financial Situation With Others. Only five percent of retirees frequently
discuss retirement savings, investments, and their financial situation with their family and close friends.
Forty-nine percent of retirees occasionally discuss these topics and 46 percent never do so.
While the survey outlines the many ways in which retirees are financially vulnerable, it also reveals steps that
retirees can and should be taking to help improve their outcomes. These steps include careful planning,
seeking professional advice, if needed, and having an open dialogue with family and close friends.
Executive Summary
21

Looking Back on Financial Preparations for Retirement
In addition to shedding light on retirees’ current financial situation, the survey findings yield insights into their
retirement preparations during their working years, including what they did well and what they could have done
differently. These lessons learned can be very helpful for future generations of retirees in their own planning
efforts.
• Retirees Started Saving for Retirement at Age 40 – And Some Never Saved. Thirty-one percent of retirees
started saving before the age of 40, while 39 percent started saving in their forties or older. An alarming
30 percent of retirees indicate they did not save for retirement. Among retirees who saved for retirement,
they first started saving at age 40 (median).
• About Two-Thirds Participated in Workplace Retirement Plans. For the majority of their working careers, 68
percent of retirees participated in some form of employer-sponsored retirement benefits, including 49
percent who participated in a 401(k) or similar plan and 37 percent who participated in a company-funded
defined benefit plan. Thirty-two percent of retirees worked for employers that did not offer any retirement
benefits.
• Six in Ten Retirees Saved for Retirement Outside of Work. The majority of retirees (61 percent) saved for
retirement outside of work.
• Only One in Ten Had a Written Strategy Before Retiring. Fifty-four percent of retirees had a retirement
strategy before they retired. However, only 10 percent had a written plan, while 44 percent had a plan but
it was not written down. Forty-six percent did not have a retirement strategy.
• Two-thirds of retirees (66 percent) say their most recent employers did “nothing” to help pre-retirees
transition into retirement and 16 percent are “not sure” what their employers did. Among the 18 percent of
retirees whose employers helped pre-retirees, the most frequently cited offerings are financial counseling
about retirement (6 percent), seminars and education about transitioning into retirement (5 percent), the
ability to reduce work hours and shift from full- to part-time (5 percent), and accommodating flexible work
schedules and arrangements (5 percent).
Executive Summary
22

Looking Back on Financial Preparations for Retirement (cont.)
• Three in Ten Retirees (30 percent) Used a Financial Advisor Before Retiring to help them manage their
retirement savings or investments.
• Retirees’ Insights on How They Could Have Better Prepared. When looking back on their retirement
preparations, almost three in four retirees (73 percent) agree they wish they would have saved more and
on a consistent basis. About two-thirds did as much as they could to prepare for retirement (67 percent).
Almost as many retirees wish they had been more knowledgeable about retirement saving and investing
(64 percent). Many retirees also agree they waited too long to concern themselves with saving and
investing for retirement (50 percent) and that debt interfered with their ability to save as much as they
needed for a comfortable retirement (47 percent).
Most retirees saved for retirement during their working years and most participated in employer-sponsored
retirement plans – although it should be noted that some were never offered benefits and some never saved.
Among those who did save for retirement, many may not have saved enough to achieve a level of retirement
income that will support them throughout their lifetimes. In retrospect, most retirees could have been more
proactive about saving, investing, and planning when they were in the workforce. Nonetheless, some retirees
could have done everything right and still find themselves unprepared because the underlying assumptions
have changed (e.g., life expectancies, housing and healthcare costs, government benefits).
Executive Summary
23

Living Arrangements in Retirement
Retirees face new possibilities in terms of where they can choose to live because, in retirement, they are no
longer tethered to an employer or job location. While some retirees may want to start a new chapter by moving
to a new location, others may want to age in place. It is a matter of priorities – and it is a very personal decision.
• Retirees Cite a Variety of Important Criteria in Choosing Where to Live. When choosing where to live in
retirement, the five most often cited important criteria are: proximity to family and friends (53 percent),
affordable cost of living (53 percent), access to excellent healthcare and hospitals (41 percent), good
weather (35 percent), and low crime rate (30 percent).
• Almost Four in Ten Retirees Have Moved Since Retiring. Since entering retirement, almost four in 10
retirees (38 percent) have moved to a new home, while 62 percent have stayed in the home that they lived
in before retiring. Among those who moved, frequently cited reasons for doing so include reducing
expenses (34 percent), downsizing (33 percent), moving closer to family and friends (27 percent), moving
to a better climate (23 percent), and starting a new chapter in life (22 percent).
• Approximately Three in Four Retirees Own Their Homes. Approximately three in four retirees (76 percent)
own their homes, while 20 percent rent and three percent live with relatives or friends. Seventy-three
percent of retirees currently live in a single family home, while 19 percent live in a multi-unit apartment or
condo. Only four percent live in a retirement community.
• Most Retirees Live With Spouse/Partner or Alone. Fifty-six percent of retirees currently live with their
spouse/partner, while 31 percent live alone. Fourteen percent live in the same household with their
children, four percent with their grandchildren, and four percent with other relatives. Among retirees who
currently live with others who are not their spouse/partner, 68 percent indicate that the other person(s)
moved into their residence, while 17 percent moved into the other person’s residence, and 15 percent
indicate that they and the other person(s) all moved into a different residence.
Executive Summary
24
Living Arrangements in Retirement (cont.)
• Retirees Want to Remain in Their Own Home. The vast majority of retirees (89 percent) indicate remaining
in their own home as they get older is important to them, including 68 percent indicating it is “very
important” and 21 percent “somewhat important.” Only nine percent indicate that it is not important,
including six percent indicating “not too important” and three percent “not at all important.”
Some retirees have already moved or made changes to their living arrangements. Others may be considering a
change. Whether they realize it or not, the possibility of moving into an aging-friendly home or more affordable
location with better access to hospitals and healthcare does not necessarily mean giving up proximity to family
and friends. In the end, such a move may help save money while supporting retirees’ ability to age in place as
they grow old.
Executive Summary
25
Long-Term Care and Legal Documents
Many retirees are still relatively young; however, as they age their health may decline. In preparation, they
should be planning for long-term care and formally documenting their wishes. Unfortunately, many are not yet
doing so:
• Almost Half Plan to Rely on Family and Friends for Long-Term Care. Forty-nine percent of retirees plan to
rely on family and friends in the event their health declines and they need help with daily activities and/or
nursing care. Thirty percent plan to move to an assisted living community or nursing home. An alarming
one in four retirees (24 percent) do not have any plans for such care.
• Few Are “Very Confident” in Their Ability to Afford Long-Term Care. Fewer than half of retirees (45 percent)
are confident they will be able to afford long-term care, if needed, including 11 percent who are “very
confident” and 34 percent who are “somewhat confident.” Fifty-five percent of retirees are “not too
confident” (27 percent) or “not at all confident” (28 percent) in their ability to afford long-term care.
• Some Have Set Forth Legal Documentation. When asked about the types of legal documents they have set
forth in writing, a last will and testament (65 percent) is the most often cited, followed by power of attorney
for healthcare or medical proxy (45 percent), and advance directive or living will (45 percent). Thirty-nine
percent have a power of attorney to allow a designated individual to make financial decisions on their
behalf. Fewer than two in five retirees have funeral and burial arrangements (36 percent), a HIPAA waiver
(29 percent), or a trust (18 percent).
Many retirees may find themselves needing long-term care but lacking the financial resources to afford it. A
common scenario is that they will call upon their adult children and grandchildren to serve as caregivers, who
could be putting their own employment situation and future retirement at risk by taking on this responsibility.
Retirees who lack adequate financial resources could also put added strain on Medicaid and other support
services.
Executive Summary
26

As a nation, the United States is approaching critical crossroads where we need to be asking the right questions
to prepare our aging population for retirement. How will we respond to this generation and future generations
of retirees who are likely to be financially vulnerable and who may run out of savings? How do we ensure
affordable access to housing and healthcare? How do we ensure that government benefits remain sustainable?
What more can employers be doing to help workers prepare? How do we help people better prepare
themselves?
From a societal perspective, what can we do to strengthen the retirement system to help ensure that all
Americans can retire with dignity? Policymakers, industry, employers, academics, nonprofits, communities,
individuals and families must join together to innovate solutions. The sooner we take action, the sooner we can
achieve positive change.
Catherine Collinson
CEO & President
Transamerica Institute® and Transamerica Center for Retirement Studies®
Executive Summary
27

1. Set forth a written financial plan to help ensure that your savings last your lifetime. Factor in living expenses, debt repayment,
savings and investments, sources of guaranteed retirement, income, healthcare needs, insurance protections, investment
returns, inflation, taxes, the possible need for long-term care, and a potential legacy. Seek professional advice, if needed.
2. Keep saving as much as you can. Whether semi-retired or fully retired, strive to live within your means and set aside additional
savings.
3. Pay off debt and avoid taking on new debt, especially high-interest rate credit card or consumer debt. For those with mortgage
debt, determine the optimal approach for paying it off, considering your overall financial situation, the terms of the loan, and
the amount owed.
4. Consider an encore career or part-time work in retirement to bring additional income and opportunities to stay active and
involved.
5. Get savvy about Social Security. Learn how Social Security claiming strategies can help maximize long-term benefits.
6. Plan and budget for home modifications that will enable you to age in place. If modifications are cost prohibitive or infeasible,
consider other alternatives such as moving to a different home or a retirement community.
7. Confront the possibility of needing long-term care. Learn about types of available care, associated costs, and possible eligibility
for support services. Research and obtain long-term care insurance, if appropriate for your situation.
8. Identify and enlist a trusted loved one(s). Have frank conversations about your wishes and concerns, and build a common
understanding about the potential need for financial and/or caregiving support.
9. Put your affairs in order and establish legal documents, as needed, including a financial power of attorney, a power of attorney
for healthcare or medical proxy, a HIPAA waiver, an advance directive or living will, a last will and testament, funeral and burial
arrangements, and/or a trust.
10. Don’t become a victim of elder fraud. Be hypervigilant, learn about scams and how to avoid them, protect your identity, and
safeguard your assets.
11. Maintain social connections by staying involved with family, friends, and community.
12. Take good care of your health to promote well-being and enjoyment of life -- and potentially reduce healthcare-related costs.
Recommendations for Retirees
28

1. Sustainable Social Security benefits that serve as a meaningful source of guaranteed retirement income
and help avoid risk of poverty among retirees.
2. Universal access to retirement savings arrangements for employed workers and alternative arrangements
for the self-employed and those who are not employed due to parenting, caregiving, or other responsibilities.
3. Automatic savings and other applications of behavioral economics that make it easier and more convenient
for people to save and invest.
4. Guaranteed lifetime income solutions, in addition to Social Security benefits, that can help individuals
strategically plan how to manage their savings to avoid running out of money in retirement.
5. Financial education and literacy so individuals understand basic concepts and retirement-related products
and services. Individuals must be able to ask good questions and make informed decisions. Financial
literacy must be integrated into educational curriculums so that young people learn the basics of budgeting,
investing and managing their savings – skills that can serve them well for the rest of their lives.
6. Lifelong learning, longer working lives, and flexible retirement to help people stay economically active longer
and transition into retirement on their own terms – with adequate financial protections if they are no longer
able to work.
7. Accessible and affordable healthcare to promote healthy aging. Governments play a vital role in sponsoring
and/or overseeing healthcare systems. Employers should provide healthy work environments and consider
offering workplace wellness programs.
8. A positive view of aging that celebrates the value of older individuals and takes full advantage of the gift of
longevity – and retires ageism once and for all.
9. An age-friendly world in which people can “age in place” in their own homes and live in vibrant communities
designed for people of all ages to promote vitality and economic growth.
Source: The New Social Contract: A Blueprint for Retirement in the 21st Century, 2018. A collaboration among Aegon Center for Longevity and
Retirement and nonprofits Transamerica Center for Retirement Studies and Instituto de Longevidade Mongeral Aegon.
Recommendations: Essential Design Features of a Modernized U.S. Retirement System
29
Detailed Findings
A Precarious Existence:
How Today’s Retirees Are Faring in Retirement
30

Life in Retirement
31
RETIREE BASE: ALL QUALIFIED RESPONDENTSQ2780. How much do you agree or disagree with the following statements?
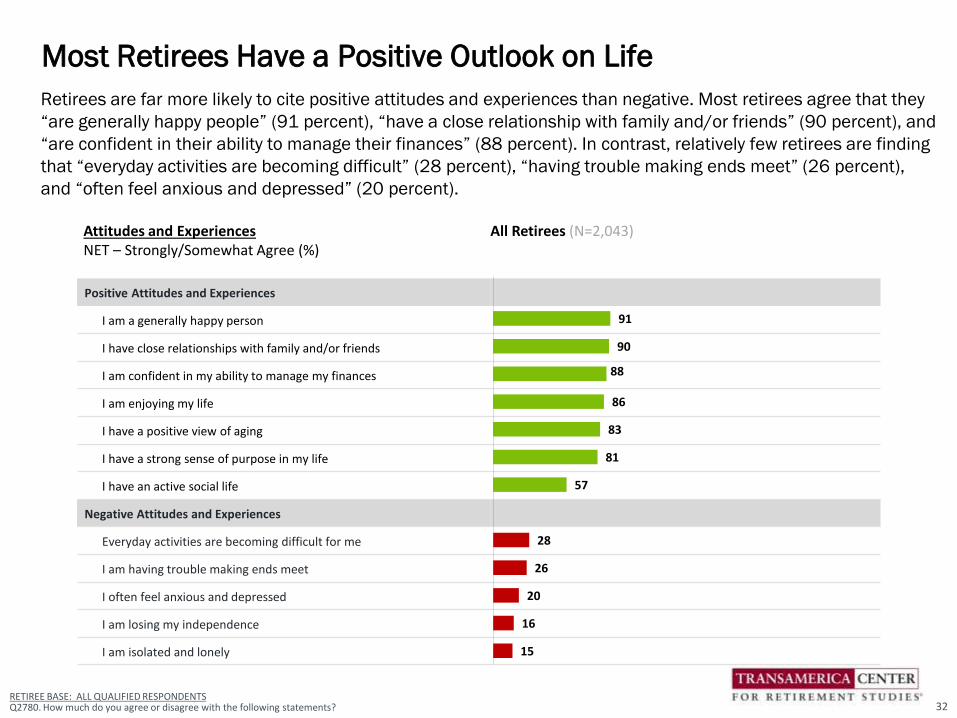
Retirees are far more likely to cite positive attitudes and experiences than negative. Most retirees agree that they
“are generally happy people” (91 percent), “have a close relationship with family and/or friends” (90 percent), and
“are confident in their ability to manage their finances” (88 percent). In contrast, relatively few retirees are finding
that “everyday activities are becoming difficult” (28 percent), “having trouble making ends meet” (26 percent),
and “often feel anxious and depressed” (20 percent).
Most Retirees Have a Positive Outlook on Life
Attitudes and ExperiencesNET – Strongly/Somewhat Agree (%)
All Retirees (N=2,043)
Positive Attitudes and Experiences
I am a generally happy person
I have close relationships with family and/or friends
I am confident in my ability to manage my finances
I am enjoying my life
I have a positive view of aging
I have a strong sense of purpose in my life
I have an active social life
Negative Attitudes and Experiences
Everyday activities are becoming difficult for me
I am having trouble making ends meet
I often feel anxious and depressed
I am losing my independence
I am isolated and lonely
91
90
88
86
83
81
57
28
26
20
16
15
32

Not Sure
All RetireesN=2,043
2
RETIREE BASE: ALL QUALIFIED RESPONDENTS
Q1500. Since entering retirement, has your enjoyment of life…?
Since entering retirement, 40 percent of retirees indicate that their enjoyment of life has “increased,” 39 percent
say it has “stayed the same.” Nineteen percent of retirees say their enjoyment of life has “decreased” since they
retired.
Four in Ten Retirees Indicate Enjoyment of Life Has Increased
Enjoyment of Life in Retirement (%)
Decreased Stayed the Same Increased
3919 40
33

When asked how they are spending their time in retirement, retirees cite a wide variety of activities, including
spending more time with family and friends (61 percent), pursuing hobbies (44 percent), and traveling (39
percent). Twenty-one percent are doing volunteer work and 15 percent are taking care of their grandchildren.
Seven percent of retirees are doing some form of paid work such as pursuing an encore career (4 percent),
continue working in the same field (4 percent), and/or starting a business (1 percent).
Retirees Are Spending Their Time on a Variety of Activities
RETIREE BASE: ALL QUALIFIED RESPONDENTSQ1419. Now that you are retired, how are you spending your time? Please select all that apply.
How Retirees Are Spending Their Time (%) All Retirees (N=2,043)
Spending more time with family and friends
Pursuing hobbies
Traveling
Doing volunteer work
Taking care of my grandchildren
Caregiving for a loved one
Pursuing an encore career (pursuing a new role, work, activity, or career)
Continue working in the same field
Starting a business
None of the above
61
44
39
21
15
9
4
4
1
8
*Note: ”Other” responses not shown
34
NET – Paid Work
7%

Since retiring, 25 percent of retirees have dedicated a significant amount of their time serving as a caregiver to
a family member or friend who needs help taking care of themselves.
One in Four Retirees Have Spent Significant Time Caregiving
RETIREE BASE: ALL QUALIFIED RESPONDENTSQ2755. Since retiring/entering semi-retirement, have you dedicated a significant amount of time serving as a caregiver to a family member or friend who need help taking care of themselves?
Dedicated a Significant Amount of Time in Retirement Serving as Caregiver to a Family Member or Friend Who Needs Help Taking Care of Themselves (%)
25
73
2
Yes
No
Not sure
All Retirees (N=2,043)
35

Not Sure
All RetireesN=2,043
2
Sixty-four percent of retirees indicate their standard of living has “stayed the same” since they retired, while 25
percent say it has “decreased.” Only nine percent say their standard of living has “increased” since they retired.
Majority of Retirees Say Their Standard of Living Has Stayed the Same
RETIREE BASE: ALL QUALIFIED RESPONDENTS
Q1505. Since entering retirement, has your standard of living …?
Change in Standard of Living in Retirement (%)
Decreased Stayed the Same Increased
6425 9
36
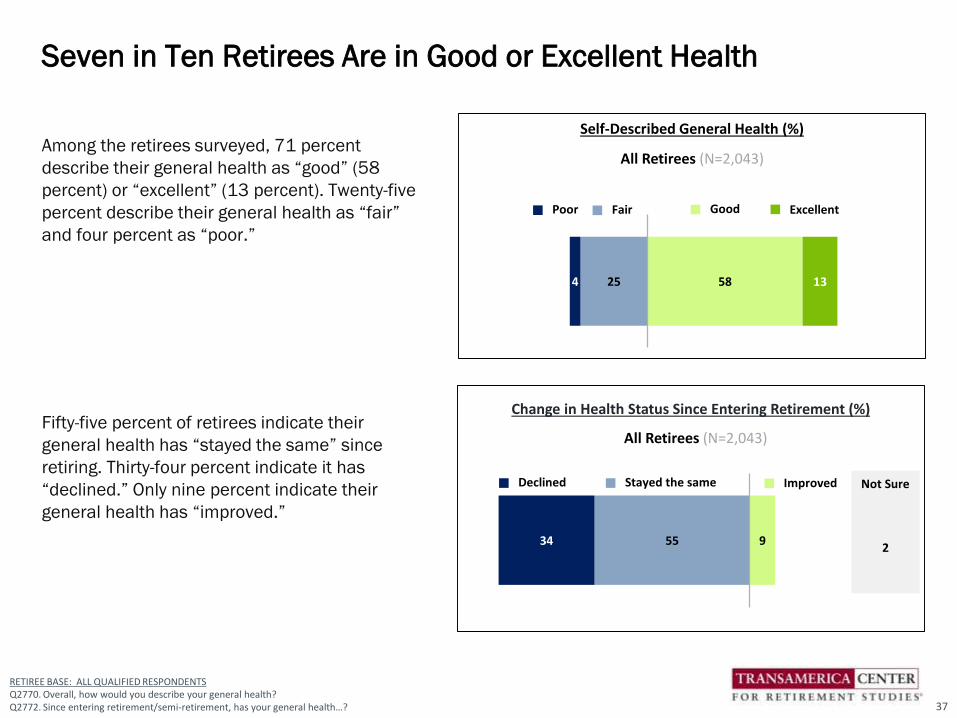
Among the retirees surveyed, 71 percent
describe their general health as “good” (58
percent) or “excellent” (13 percent). Twenty-five
percent describe their general health as “fair”
and four percent as “poor.”
Fifty-five percent of retirees indicate their
general health has “stayed the same” since
retiring. Thirty-four percent indicate it has
“declined.” Only nine percent indicate their
general health has “improved.”
Seven in Ten Retirees Are in Good or Excellent Health
RETIREE BASE: ALL QUALIFIED RESPONDENTSQ2770. Overall, how would you describe your general health?Q2772. Since entering retirement/semi-retirement, has your general health…? 37
Self-Described General Health (%)
254 58 13
Poor Fair Good Excellent
All Retirees (N=2,043)
Change in Health Status Since Entering Retirement (%)
All Retirees (N=2,043)
5534 9
Declined Stayed the same Improved Not Sure
2

Only two percent of the retirees surveyed are currently receiving long-term care to assist them with their daily
activities.
Few Retirees Surveyed Are Currently Receiving Long-Term Care
RETIREE BASE: ALL QUALIFIED RESPONDENTSQ2771. Are you currently receiving any long-term care to assist you with your daily activities?
2
97
1
Yes
No
Not sure
All Retirees (N=2,043)
Receiving Long-Term Care Assistance (%)
38

Almost all retirees (98 percent) are doing at least one health-related activity on a consistent basis, with the five
most cited activities being: seeking medical attention when needed (82 percent), getting physicals and
recommended health screenings (78 percent), maintaining a positive outlook (69 percent), getting plenty of
rest (67 percent), and avoiding harmful substances (e.g., cigarettes, alcohol, illicit drugs, etc.) (67 percent).
Sixty-five percent of retirees indicate they eat healthily and 56 percent exercise regularly. More than half (55
percent) do six or more of the activities listed.
Retirees Are Taking Care of Their Health – But Can Do More
39RETIREE BASE: ALL QUALIFIED RESPONDENTSQ1446. Which of the following health-related activities do you currently do on a consistent basis?
Health-Related Activities That Retirees Do on a Consistent Basis (%) All RetireesN=2,043
Seek medical attention when needed
Get routine physicals and recommended health screenings
Maintain a positive outlook
Get plenty of rest
Avoid harmful substances (e.g., cigarettes, alcohol, illicit drugs, etc.)
Eat healthily
Exercise regularly
Manage stress
Consider long-term health when making lifestyle decisions
Practice mindfulness and meditation
Other
Nothing
82
78
69
67
67
65
56
40
22
14
4
2
Number of Healthy Activities on a Consistent Basis (NET)
All Retirees
1+ Activities 98%
2+ Activities 95%
3+ Activities 90%
4+ Activities 82%
5+ Activities 70%
6+ Activities 55%
7+ Activities 39%
8+ Activities 22%
9+ Activities 10%
10+ Activities 3%

It is a bit uncomfortable question to ask people how long they plan to live; however, it is an important question
for financial planning. When asked what age they are planning live to, more than half of retirees (52 percent)
responded that they are “not sure,” which is a reasonable answer given the nature of the question. Among
retirees who provided a specific age, the median age they are planning to live to is 90. Fourteen percent of
retirees plan to live to age 100 or older.
What Age Are You Planning to Live To? Many Are “Not Sure”
RETIREE BASE: ALL QUALIFIED RESPONDENTSQ2785. What age are you planning to live to?
<1 1 2
14 17 14
52
Age <60 60-69 70-79 80-89 90-99 100+ Not Sure
All Retirees (N=2,043)
Median Age: 90
Planning to Live to Age (%)
40

When asked about their greatest retirement fears, retirees most frequently cite declining health that requires
long-term care (47 percent) and a reduction in or elimination of Social Security (47 percent). Losing their
independence (38 percent) and outliving their savings and investments (37 percent) are also often cited
retirement fears.
Greatest Retirement Fears Include Health and Financial Issues
Greatest Fears About Retirement (%) All Retirees (N=2,043)
Declining health that requires long-term care
Social Security will be reduced or cease to exist in the future
Losing my independence
Outliving my savings and investments
Cognitive decline, dementia, Alzheimer's disease
Lack of access to adequate and affordable healthcare
Not being able to meet the basic financial needs of my family
Feeling isolated and alone
Finding meaningful ways to spend time and stay involved
Being laid off - not being able to retire on my own terms*
Other
None of the above
47
47
38
37
33
26
23
15
13
1
3
13
*Note: Only asked among retirees who are semi-retired
RETIREE BASE: ALL QUALIFIED RESPONDENTSQ1421. Since entering retirement, what are your greatest fears? Please select all that apply. 41

When and How Retirement Happened
42

What Prompted You to Decide That it Was Time to Retire?
RETIREE BASE: ALL QUALIFIED RESPONDENTSQ1565. What prompted you to decide that it was time to retire?
“I had worked from age 16 to age 71 and I said it is time to enjoy
the income you earned over that time frame.”
Man, age 75, retired at 71.
“I was going to quit work due to being disabled, in the meantime my partner was
diagnosed with stage 4 lung cancer which had metastasized to his brain now and he is on
hospice as we speak. Everything we had planned went up in smoke. We had to use all
or most of our savings to live.” Woman, age 57, retired at 48.
“When you're over or approaching 60, the prospects of continuing employment
significantly dwindles by the days, not months or years. I just hoped I had planned well
enough to allow me to continue to live close to what I was used to during my working years.
I'm hanging in there with no complaints.” Man, age 70, retired at 63.
“My husband had taken a medical retirement and we wanted to do some
traveling while he was still able to.”Woman, age 79, retired at 70.
“My grandchildren needed a caregiver while
their mom worked.”Woman, age 65,
retired at 65.
“I had to move back to Michigan from Florida and become a
caregiver to my aging parents.”Man, age 69, retired at 62.
43
“I was forced into retirement due to
workforce reduction.” Man, age 73, retired at 70.
“My husband and I came into an inheritance that
helped make that decision.” Man, age 71, retired at 65.

Eighty-nine percent of retirees are fully retired and 11 percent consider themselves semi-retired. Nine percent
of retirees are currently working for pay, including five percent who are employed part-time, two percent who
are employed full-time, and two percent who are self-employed. Two percent of retirees are unemployed but
looking for work.
Nine in Ten Retirees Are Fully Retired
RETIREE BASE: ALL QUALIFIED RESPONDENTSQ1601A. Do you consider yourself to be…Q1600. Which of the following best describes your employment status?
Employment Status (%) All Retirees (N=2,043)
Employed full-time
Employed part-time
Self-employed
Not employed, but looking for work
Not employed and not looking for work
Homemaker
2
5
2
2
80
9
89
11
Fully retired Semi-retired
Do You Consider Yourself to Be… (%)
All Retirees (N=2,043)
44
NET – Currently Working For Pay
9%
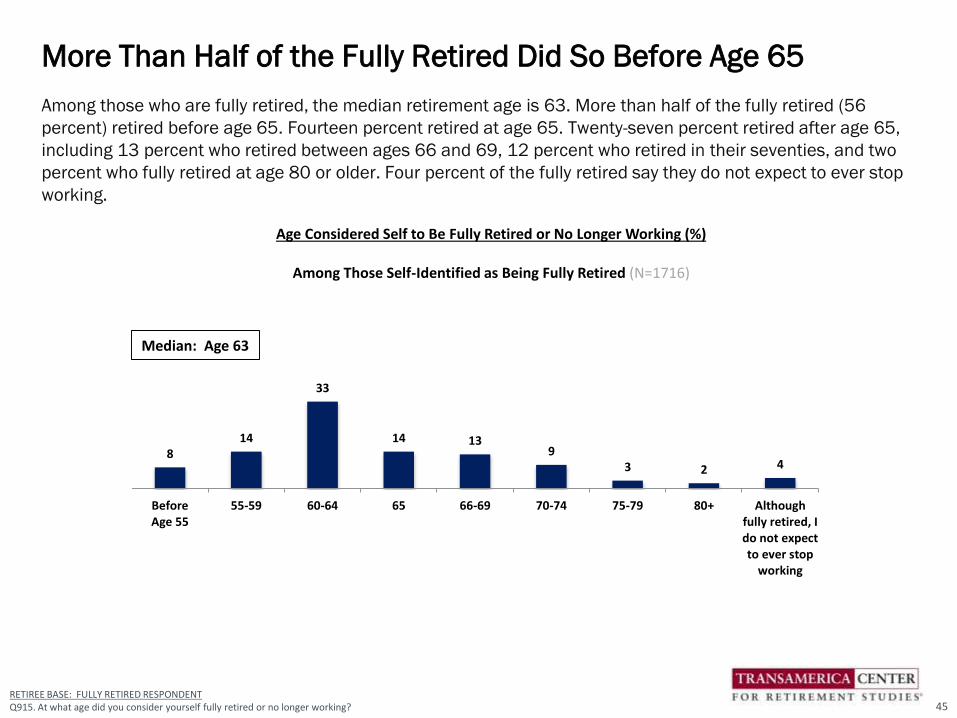
Among those who are fully retired, the median retirement age is 63. More than half of the fully retired (56
percent) retired before age 65. Fourteen percent retired at age 65. Twenty-seven percent retired after age 65,
including 13 percent who retired between ages 66 and 69, 12 percent who retired in their seventies, and two
percent who fully retired at age 80 or older. Four percent of the fully retired say they do not expect to ever stop
working.
More Than Half of the Fully Retired Did So Before Age 65
RETIREE BASE: FULLY RETIRED RESPONDENTQ915. At what age did you consider yourself fully retired or no longer working?
814
33
14 139
3 2 4
BeforeAge 55
55-59 60-64 65 66-69 70-74 75-79 80+ Althoughfully retired, Ido not expectto ever stop
working
Age Considered Self to Be Fully Retired or No Longer Working (%)
Among Those Self-Identified as Being Fully Retired (N=1716)
45
Median: Age 63

Reasons for Working in Retirement Include Health and Financial
46RETIREE BASE: RETIRED AFTER 65Q1530. What are your reason(s) for working in retirement or past age 65? Please select all that apply.
Reasons for Working in Retirement or Past Age 65 (%) Among Those Who Retired After Age 65N=316
NET – Healthy-aging related reasons
Enjoy what I do
Be active
Keep my brain alert
Have a sense of purpose
Maintain social connections
NET – Financial-related reasons
I want the income
Can't afford to retire
Concerned that Social Security will be less than expected
Need health benefits
Concerned that employer retirement benefits will be less than expected
Anxious about volatility in financial markets and investment performance
None of the above
66
47
47
34
27
19
65
56
24
21
12
4
3
21
Among retirees who retired after age 65, their rationales for doing so are evenly split between healthy aging-
related reasons (66 percent) and financial-related reasons (65 percent). The five most often cited specific
reasons are: wanting the income (56 percent), enjoying what they do (47 percent), being active (47 percent),
keeping their brain alert (34 percent), and having a sense of purpose (27 percent).

Before entering retirement, 45 percent of
retirees envisioned they would immediately
stop working once they reached a specific age
(38 percent) or amount of money (7 percent).
One-in-five (21 percent) envisioned they would
transition into retirement by reducing work
hours (14 percent) or working in a different
capacity that would be less demanding and/or
bring greater personal satisfaction (7 percent).
Fifteen percent envisioned they would
continue working as long as possible until they
couldn’t work any more, and 19 percent are
not sure.
Many Retirees Envisioned an Immediate vs. Gradual Transition
RETIREE BASE: ALL QUALIFIED RESPONDENTSQ1545. Before you started transitioning into retirement, how did you envision your transition would take place?
19
7
38
7
14
15
All Retirees
Continue working as long aspossible in current or similarposition until I can/ could not workany more
Transition into retirement byreducing work hours with moreleisure time to enjoy life
Transition into retirement byworking in a different capacity thatwould be less demanding and/orbrings greater personal satisfaction
Immediately stop working once Ireached a specific age and wouldbegin pursuing my retirementdreams
Immediately stop working once Isaved a specific amount of moneyand would begin pursuing myretirement dreams
Not sure
NET Transition
21%
NETImmediately Stop
45%
N=2,043
How did you envision transitioning into retirement? (%)
47

When asked how their transition into
retirement actually happened, the proportion
of retirees’ actions were similar to the way they
envisioned their retirement would take place
(see page 47). Forty-six percent immediately
stopped working when they reached a specific
age (39 percent) or amount of money (7
percent).
Nineteen percent transitioned into retirement
either by reducing work hours (11 percent) or
working in a less demanding capacity (8
percent).
Seventeen percent continued/are continuing
to work in retirement as long as possible until
they can/could no longer work anymore.
How Retirees’ Transition Into Retirement Actually Happened
RETIREE BASE: ALL QUALIFIED RESPONDENTSQ1546. How did your transition into retirement actually take place?
18
7
39
8
11
17
All Retirees
Continued working as long aspossible until I can/could no longerwork anymore
Continued working as long aspossible but with reduced workhours with more leisure time toenjoy life
Continued working as long aspossible in a different capacity thatwas less demanding and/or broughtgreater personal satisfaction
Immediately stopped working onceI reached a specific age and beganpursuing retirement dreams
Immediately stopped working onceI saved a specific amount of moneyand began pursuing retirementdreams
Not sure
NET Immediately Stopped
46%
NET Transitioned
19%
N=2,043
How did your transition into retirement actually take place? (%)
48

Approximately one in three retirees (35 percent) indicate they retired when they had planned to do so. More
than half of retirees (56 percent) retired sooner than they had planned. Nine percent retired later than planned.
Approximately One in Three Retired When They Had Planned
RETIREE BASE: ALL QUALIFIED RESPONDENTSQ1547. Did you enter into retirement/semi-retirement when you had planned?
Did you retire when you had planned? (%)All Retirees (N=2,043)
5635
9
I retired sooner than planned
I retired when planned
I retired later than planned
49

Among the 56 percent of retirees who
retired sooner than planned, more than half
(54 percent) cite employment-related
reasons, including job loss (24 percent),
organizational changes at their place of
employment (22 percent), unhappiness
with their job (15 percent), and/or took a
retirement incentive or buyout (11 percent).
Forty-seven percent cite health and/or
family-related reasons, including their own
ill health (28 percent), family
responsibilities (15 percent), and/or their
spouse/partner retired.
Only 11 percent of retirees retired sooner
than planned because of financial ability,
including they had saved enough and could
afford to retire (10 percent) and/or they
received a financial windfall (1 percent).
Reasons for Retiring Sooner Than Planned: Work and Ill-Health
RETIREE BASE: RETIRED SOONER THAN PLANNEDQ1548. What were your reasons for retiring sooner than planned? Please select all that apply.
*Note: ”Other” responses not shown.
Reasons for Retiring Sooner Than Planned (%)
Among Retirees Who Retired Sooner Than Planned (N=1,261)
NET – EMPLOYMENT-RELATED
I lost my job
Organizational changes at my place of employment
I was unhappy with my job
Took retirement incentive or buyout
NET – HEALTH/FAMILY
My own ill-health
Family responsibilities (e.g., becoming a caregiver)
My spouse/partner retired
NET – FINANCIAL-RELATED
I found that I had saved enough money and could afford to retire
I received a financial windfall (e.g., inheritance)
54
24
22
15
11
47
28
15
8
11
10
1
50
Among the small proportion (9 percent) of
retirees who retired later than planned, 75
percent cite financial-related reasons,
including needing the income (54 percent),
they hadn’t saved enough for retirement (27
percent), general anxieties about their
financial situation (23 percent), Social Security
less than expected (18 percent), needing
health benefits (12 percent), and/or
recovering from a major financial setback (8
percent).
Sixty-four percent of retirees who retired later
than planned cite healthy aging-related
reasons, including enjoying their work (43
percent), staying active (42 percent), and
keeping their brain alert (27 percent).
Ten percent indicate that their employer
requested that they stay longer. Five percent
indicate their spouse/partner retired sooner
than planned.
Reasons for Retiring Later Than Planned: Financial and Health
*Note: ”Other” responses not shown.
RETIREE BASE: RETIRED LATER THAN PLANNEDQ1550. What were your reasons for retiring later than planned? Please select all that apply.
Reasons For Retiring Later Than Planned (%)
Among Retirees Who Retired Later Than Planned (N=139)
NET – FINANCIAL-RELATED
Needing the income
I hadn't saved enough for retirement
General anxieties about my financial situation
Social Security less than expected
Needing employee health benefits
Recovering from a major financial setback
NET – HEALTHY-AGING RELATED
Enjoying my work
Staying active
Keeping my brain alert
My employer requested that I stay longer
My spouse/partner retired sooner than planned
75
54
27
23
18
12
8
64
43
42
27
10
5
51

Current Financial Situation
52
Fewer than half of retirees (46 percent) agree that they have built a large enough retirement nest egg, of whom only
16 percent “strongly agree” and 30 percent “somewhat agree.” Sixteen percent “somewhat disagree” and 30
percent “strongly disagree.” Eight percent of retirees are “not sure.”
On the other hand, more retirees (67 percent) are confident that they will be able to maintain a comfortable lifestyle
throughout retirement, with 18 percent being “very confident” and 49 percent being “somewhat confident.”
Few “Strongly Agree” They Have Built a Large Enough Nest Egg
RETIREE BASE: ALL QUALIFIED RESPONDENTSQ800. How much do you agree or disagree that you have built a large enough retirement nest egg?Q880. How confident are you that you will be able to maintain a lifestyle you consider comfortable throughout your retirement?
Confidence in Maintaining Lifestyle (%)
18
49
20
13
Very confident Somewhat confident
Not too confident Not at all confident
All Retirees (N=2,043)
NET – Confident
67%
Built Large Enough Nest Egg (%)
16
30
16
30
8
Strongly agree Somewhat agree Somewhat disagree Strongly disagreeNot sure
All Retirees (N=2,043)
NET – Agree
46%
53

Not Sure
All RetireesN=2,043
2
54RETIREE BASE: ALL QUALIFIED RESPONDENTS Q1510. Since entering retirement, has your personal financial situation improved, declined, or stayed the same?
Since entering retirement, 42 percent of retirees indicate that their personal financial situation has “stayed the
same,” while approximately one in three (36 percent) indicate it has “declined.” Only 20 percent of retirees say
that their personal financial situation has “improved.”
Approximately One in Three Say Financial Situation Has Declined
Personal Financial Situation Since Entering Retirement (%)
4236 20
Declined Stayed the Same Improved
54
Since entering retirement, almost six in ten retirees (59 percent) spend less money each year, compared to
when they were working. Thirty-one percent spend the same amount of money each year, and only six percent
spend more money each year in retirement.
Almost Six in Ten Say They Spend Less Money in Retirement
RETIREE BASE: ALL QUALIFIED RESPONDENTSQ1503 Since entering retirement, how has your spending changed compared to when you were working?
Spending Habits Since Entering Retirement (%)
6
31
59
4
I spend more money each year
I spend about the same amountof money each year
I spend less money each year
Not sure
All Retirees (N=2,043)
55

Retirees most frequently cite “just getting by to cover basic living expenses” (39 percent) as a financial priority.
Other frequently cited priorities include “paying healthcare expenses” (34 percent), “paying off credit card debt”
(29 percent), “building emergency savings” (25 percent) and “continuing to save for retirement” (20 percent).
An alarming 40 percent of retirees cite paying off some form of debt as a current priority (e.g., credit card,
mortgage and/or other consumer debt).
Four in Ten Cite Paying Off Debt as a Current Financial Priority
RETIREE BASE: ALL QUALIFIED RESPONDENTSQ2640. Which of the following are your financial priorities right now? Please select all that apply.
Current Financial Priorities (%) All Retirees (N=2,043)
Just getting by to cover basic living expense
Paying healthcare expenses
Paying off credit card debt
Building emergency savings
Continuing to save for retirement
Paying off mortgage
Creating an inheritance or financial legacy
Paying off other consumer debt
Paying long-term care expenses
Supporting children
Contributing to an education fund (for my children, grandchildren, or other)
Supporting grandchildren
Supporting parents
Other
39
34
29
25
20
17
16
11
7
5
4
4
1
12
56
NET – Paying off debt
40%

Financially Dependent on Retiree (%) All Retirees (N=2,043)
My spouse or partner*
My children under the age of 25
My adult children aged 25 or older
My grandchildren under the age of 25
My adult grandchildren aged 25 or older
My parents/Parents-in-law
Siblings or other relatives
Other
None of the above
Sixty percent of retirees do not support anyone financially. Nine percent of retirees support their adult children
aged 25 or older. Among those who are married or living with their partner, 27 percent support their
spouse/partner.
Most Retirees Do Not Have Financial Dependents
*Note: Only asked among retirees who have a spouse or partner.
RETIREE BASE: ALL QUALIFIED RESPONDENTS Q2760. Who of the following, if any, do you support financially? Please select all that apply
27
2
9
3
1
3
2
1
60
57
NET – Financially Dependent Children
11%
NET – Financially Dependent Grandchildren
4%

RETIREE BASE: ALL QUALIFIED RESPONDENTSQ1150. What are your current sources of income in retirement? Please select all that apply.
Nearly all retirees (96 percent) receive income from Social Security. The other most frequently cited sources of
retirement income include other savings and investments (42 percent), 401(k)/403(b)/IRAs (41 percent), and
company-funded pension plans (35 percent). Relatively few retirees cite home equity (11 percent), paid work (8
percent), and inheritance (7 percent) as sources of income.
Retirees Cite Diverse Sources of Income
Current Sources of Retirement Income (%) All Retirees (N=2,043)
Social Security
NET – Retirement accounts and personal savings
401(k)/403(b) accounts/IRAs
Other savings and investments
Company-funded pension plan
Home equity
Working
Inheritance
Other
96
60
41
42
35
11
8
7
6
58
RETIREE BASE: ALL QUALIFIED RESPONDENTSQ1155. Over the course of your retirement, what will be your primary source of income?
Sixty-six percent of retirees indicate that Social Security will be their primary source of income over the course
of their retirement. Twenty-one percent cite retirement accounts and personal savings, including a 401(k) or
similar accounts IRAs (10 percent) and other savings and investments (11 percent). One in 10 retirees cite a
company-funded pension plan as their primary source of income.
Social Security Is the Primary Source of Income For Most Retirees
Primary Source of Income for Duration of Retirement (%)
All Retirees (N=2,043)
Social Security
NET – Retirement accounts and personal savings
401(k)/403(b) accounts/IRAs
Other savings and investments
Company-funded pension plan
Inheritance
Working
Home equity
Other
66
21
10
11
10
1
1
<1
1
59
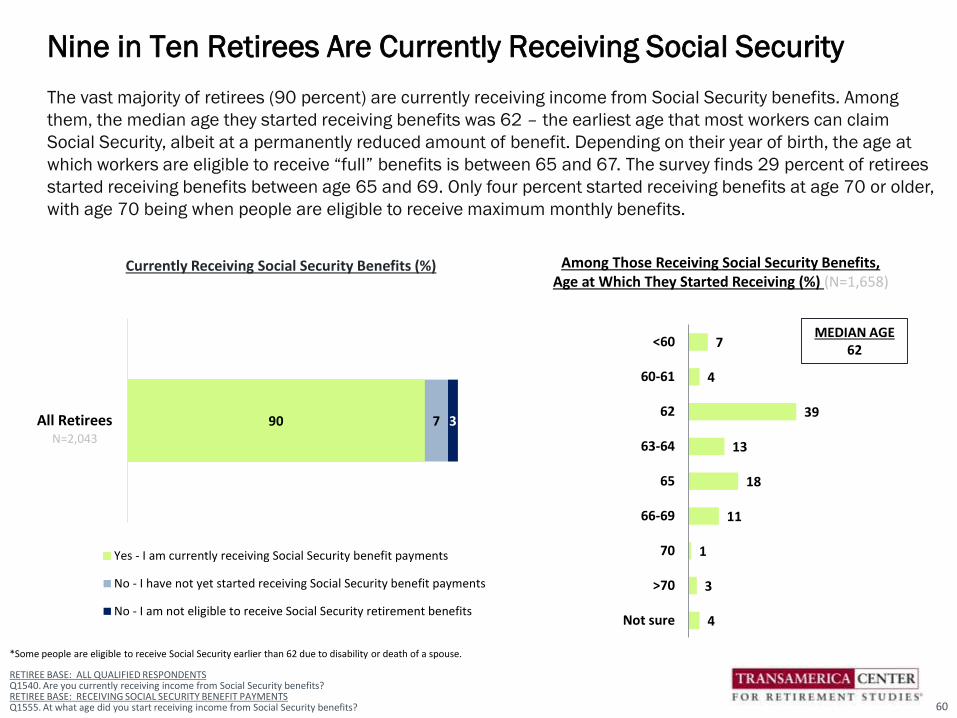
RETIREE BASE: ALL QUALIFIED RESPONDENTS Q1540. Are you currently receiving income from Social Security benefits?RETIREE BASE: RECEIVING SOCIAL SECURITY BENEFIT PAYMENTSQ1555. At what age did you start receiving income from Social Security benefits?
The vast majority of retirees (90 percent) are currently receiving income from Social Security benefits. Among
them, the median age they started receiving benefits was 62 – the earliest age that most workers can claim
Social Security, albeit at a permanently reduced amount of benefit. Depending on their year of birth, the age at
which workers are eligible to receive “full” benefits is between 65 and 67. The survey finds 29 percent of retirees
started receiving benefits between age 65 and 69. Only four percent started receiving benefits at age 70 or older,
with age 70 being when people are eligible to receive maximum monthly benefits.
Nine in Ten Retirees Are Currently Receiving Social Security
Currently Receiving Social Security Benefits (%)
7
4
39
13
18
11
1
3
4
<60
60-61
62
63-64
65
66-69
70
>70
Not sure
Among Those Receiving Social Security Benefits, Age at Which They Started Receiving (%) (N=1,658)
MEDIAN AGE62
90 7 3All Retirees
Yes - I am currently receiving Social Security benefit payments
No - I have not yet started receiving Social Security benefit payments
No - I am not eligible to receive Social Security retirement benefits
N=2,043
*Some people are eligible to receive Social Security earlier than 62 due to disability or death of a spouse.
60

RETIREE BASE: ALL QUALIFIED RESPONDENTSQ3505. Do you receive financial support from your family (other than your spouse/partner) or others in retirement? Please select all that apply.
Ten percent of retirees receive some form of financial support in retirement, including five percent from their
children and four percent from a government agency other than Social Security. The vast majority of retirees
(89 percent) are not receiving financial support.
Only One in Ten Receive Financial Support
Do You Receive Financial Support from Your Family (Other Than Your Spouse/Partner) or Others in Retirement? (%)
All Retirees (N=2,043)
NET – Yes, receive financial support
From my children
From a government agency other than Social Security (e.g., SNAP, housing voucher)
From other family members excluding my spouse/partner or children
From friends
From a faith-based organization
From a nonprofit organization (that is not faith-based)
No
Not sure
10
5
4
1
1
<1
<1
89
<1
61

Current Types of Savings and Investments (%) All Retirees (N=2,043)
Checking account
Savings account
Primary residence
Cash
IRA
Life insurance policy
Stocks
Mutual fund
Money market fund
Annuity
401(k), 403(b) or similar plan
CD
Bonds
Real estate investment other than primary residence
Exchange-traded fund (ETF)
Business
Other investments
I have no savings and investments
Retirees currently have a wide variety of savings and investments, including checking accounts (82 percent),
savings accounts (67 percent), and/or equity in their primary residence (52 percent). Retirees are less likely to
have retirement accounts such as IRAs (40 percent), annuities (22 percent), and 401(k), 403(b), or similar
plans (21 percent).
Retirees Have a Variety of Savings and Investments
82
67
52
49
40
38
31
25
23
22
21
18
14
9
6
1
3
9
RETIREE BASE: ALL QUALIFIED RESPONDENTSQ750. Now that you are retired/semi-retired, what types of savings and investments do you currently have? Please select all that apply. 62

RETIREE BASE: MARRIED/CIVIL UNION OR LIVING WITH PARTNERQ850. Does or did your spouse or partner put money into a retirement plan of his or her own?
Among retirees who are married or living with their partner, 62 percent indicate that their spouse/partner saves
or has saved in a retirement plan of his or her own.
Spouse/Partner’s Retirement Savings
Spouse/Partner Saves in a Retirement Plan (%)
6234
4
Yes
No
Not sure
Retirees Who Are Married or Living with Partner (N=1,212)
63

The majority of retirees who are married or living with their partner are familiar with their spouse/partner’s
retirement plan and savings (57 percent “very familiar”; 27 percent “somewhat familiar”). Seven percent are
“not too familiar” and nine percent are “not at all familiar” with their spouse’s/partner’s retirement plan and
savings.
Familiarity with Spouse/Partner’s Retirement Plan and Savings
RETIREE BASE: MARRIED/CIVIL UNION OR LIVING WITH PARTNERQ1520. How familiar are you with your spouse or partner’s retirement plan and savings?
Familiarity with Spouse/Partner’s Retirement Plan and Savings (%)
Retirees Who Are Married or Living with Partner (N=1,212)
57
27
7
9
Very familiar
Somewhat familiar
Not too familiar
Not at all familiar
NET – Familiar
84%
64
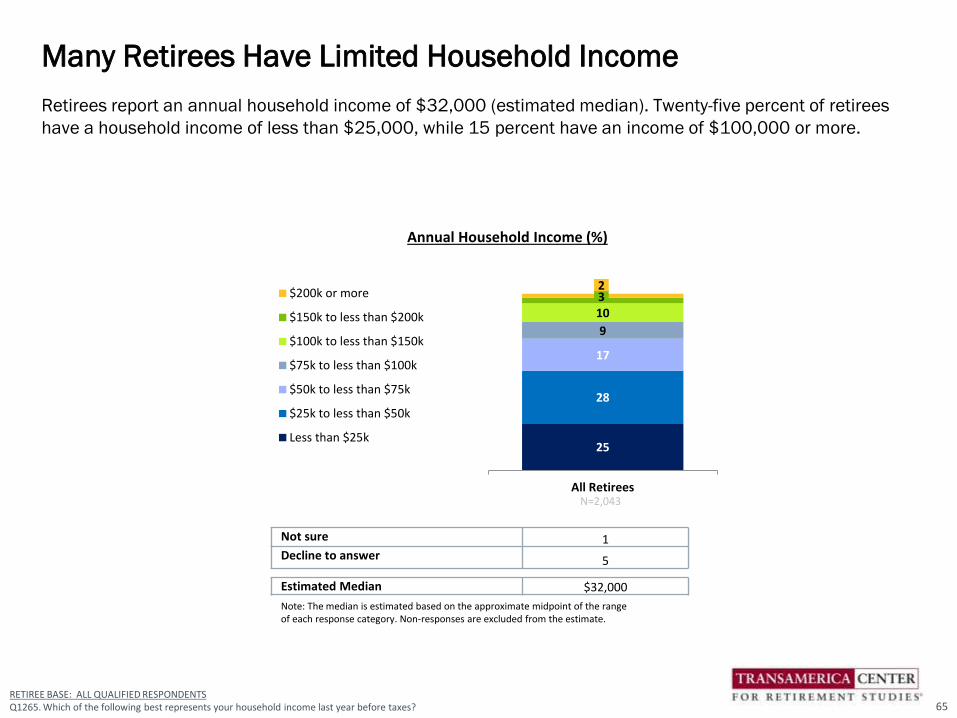
Retirees report an annual household income of $32,000 (estimated median). Twenty-five percent of retirees
have a household income of less than $25,000, while 15 percent have an income of $100,000 or more.
Many Retirees Have Limited Household Income
Not sure 1Decline to answer 5
Estimated Median $32,000
Note: The median is estimated based on the approximate midpoint of the range of each response category. Non-responses are excluded from the estimate.
Annual Household Income (%)
RETIREE BASE: ALL QUALIFIED RESPONDENTSQ1265. Which of the following best represents your household income last year before taxes?
N=2,043
25
28
17
9
1032
All Retirees
$200k or more
$150k to less than $200k
$100k to less than $150k
$75k to less than $100k
$50k to less than $75k
$25k to less than $50k
Less than $25k
65

Given the number of years they will be spending in retirement, retirees have limited household savings.
Retirees have $75,000 (estimated median) in household savings (excluding home equity). Thirty-one percent
have savings of less than $50,000, including nine percent who do not have any savings. Thirty-eight percent of
retirees have savings of $100,000 or more.
Retirees have $79,000 (estimated median) in home equity. Forty-one percent have home equity of $100,000
or more. Twenty-two percent do not have any home equity.
Many Retirees Have Limited Household Savings
Not sure 8 8Decline to answer 16 12
Estimated Median $75,000 $79,000
Note: The median is estimated based on the approximate midpoint of the range of each response category. Non-responses are excluded from the estimate.
RETIREE BASE: ALL QUALIFIED RESPONDENTSQ1310. Approximately how much money does your household currently have saved in the following?
Household savings excluding home equity (includes IRAs, 401(k)s, 403(b)s,
bank accounts, brokerage accounts, etc., and any other savings)
66
9
12
107
18
20
$500k or more
$100k to less than $500k
$50k to less than $100k
$5k to less than $50k
$1 to less than $5k
None 22
17
18
16
7 $500k or more
$250k to less than $500k
$100k to less than $250k
$1 to less than $100k
None
Home equity
Household Savings (%)All Retirees (N=2,043)

Many retirees are still paying off household debt.
Forty-five percent have non-mortgage debt (i.e., credit card debt, car loans, student loans, medical debt, etc.),
including 28 percent who have between $1 and $10,000 and 17 percent with $10,000 or more. Among those
who have non-mortgage debt, the estimated median is $4,000.
Twenty-eight percent of retirees have mortgage debt (including any equity loans or lines of credit), including 19
percent who have between $1 and $100,000 and nine percent with $100,000 or more. Among those with
mortgage debt, the estimated median is $52,000.
Retirees’ Household Debt
Not sure 4 4Decline to answer 8 8
Estimated Median(excluding “none” responses) $4,000 $52,000
Note: The median is estimated based on the approximate midpoint of the range of each response category. Non-responses are excluded from the estimate.
RETIREE BASE: ALL QUALIFIED RESPONDENTSQ1315. Approximately how much debt does your household currently have ?
Non-mortgage debt (including credit card debt, car loan(s), student loan(s),
medical debt, etc.)
67
43
19
9
1052
<1
$100k or more
$50k to less than $100k
$25k to less than $50k
$10k to less than $25k
$5k to less than $10k
$1 to less than $5k
None
60
21358
9
Mortgage debt (including any equity loans or lines of credit)
Household Debt (%)All Retirees N=2,043

The five most commonly held types of insurance among retirees are major medical insurance (84 percent),
homeowner’s/renter’s insurance (75 percent), prescription drug coverage insurance (74 percent), life
insurance (50 percent), and dental insurance (40 percent). Notably, only 12 percent of retirees currently have
long-term care insurance.
Retirees Have a Variety of Insurance Coverage
Current Types of Insurance (%) All Retirees (N=2,043)
Major medical insurance (including Medicare, Medicaid, other)
Homeowner's or renter's insurance
Prescription drug coverage
Life insurance
Dental insurance
Vision insurance
Medigap insurance
Liability or umbrella insurance
Long-term care insurance
Cancer insurance
Disability insurance
Critical illness insurance
Other
None of the above
84
75
74
50
40
35
18
16
12
4
3
3
4
3
RETIREE BASE: ALL QUALIFIED RESPONDENTSQ775. Which of the following types of insurance do you currently have? Please select all that apply. 68

Among retirees with major medical insurance, Medicare is by far the most common provider of insurance: 63
percent are the primary insured on a Medicare plan; 35 percent are the primary insured on Medicare
Advantage; 12 percent are covered by Medicare through their spouse/partner; and six percent are covered by
Medicare Advantage through their spouse/partner. Far fewer retirees have major medical insurance through a
prior employer, traditional insurance market, Medicaid, VA benefits, or other sources.
Most Retirees Have Health Insurance Through Medicare
RETIREE BASE: HAVE MAJOR MEDICAL INSURANCEQ780. Which of the following best describes your provider(s) of major medical insurance? Please select all that apply.
Major Medical Insurance Provider (%) Among Retirees Who Have Medical Insurance N=1,679; Married/Partner N=1,016
Medicare (A, B, C and/or D)
Medicare Advantage
Retiree health benefits from previous employer
Coverage from the traditional insurance market
Medicaid
VA benefits
Current employer coverage
Coverage from an Exchange
Tricare
COBRA benefits
Other
63
35
11
10
10
7
3
3
2
<1
3
12
6
8
4
1
3
9
2
3
1
6
I am the primary insured
My spouse/partner is the primary insured
69

RETIREE BASE: ALL QUALIFIED RESPONDENTSQ1165. Since retiring/semi-retiring, which of the following best describes your current retirement strategy?
Fifty-four percent of retirees currently have a retirement strategy – but only 12 percent have it in writing, while
42 percent have a plan but it is not written. Many retirees (46 percent) do not currently have a retirement
strategy.
Only Twelve Percent Have a Written Retirement Strategy
12
42
46
I have a written plan
I have a plan, but it is notwritten down
I do not have a plan
All Retirees (N=2,043)
NET – Have a Plan
54%
Current Retirement Strategy (%)
70

Among retirees who currently have a retirement strategy, 85 percent have factored Social Security and Medicare
benefits into their strategy. Most have included on-going living expenses (79 percent) and total savings and
income needs (57 percent) into their strategies. Fewer than half have considered other critical factors in their
plans (e.g., investment returns, ongoing healthcare costs, inflation, long-term care needs, tax planning, etc.). Only
nine percent have contingency plans for retiring sooner than expected and/or savings shortfalls.
Many May Be Overlooking Important Factors in Their Strategies
Components of Current Retirement Strategy (%) Among Retirees with a Written or Unwritten Retirement Strategy (N=1,188)
Social Security and Medicare benefits
Basic living expenses
Total retirement savings and income needs
Investment returns
A plan to help ensure my savings last throughout my retirement
Ongoing healthcare costs
Pursuing retirement dreams
Inflation
Long-term care needs
Tax planning
Estate planning
Paying off mortgage
Paying off non-mortgage debt
Contingency plans for retiring sooner than expected and/or savings shortfalls
Other
Not sure
85
79
57
49
46
45
31
27
26
24
23
23
18
9
4
3
RETIREE BASE: HAVE POST RETIREMENT/SEMI-RETIREMENT PLANQ1511. Which of the following did you factor into your current retirement strategy? Please select all that apply. 71

RETIREE BASE: ALL QUALIFIED RESPONDENTSQ860. Do you currently use a professional financial advisor?RETIREE BASE: USE FINANCIAL ADVISORQ870. What types of services do you currently use your professional financial advisor to perform? Please select all that apply.
Types of Services Financial Advisor Performs (%)
Make retirement investment recommendations such as mutual funds, annuities, stocks, bonds, etc.
Calculate retirement income needs
Develop strategies for spending down savings to ensure they last my lifetime
General financial planning (e.g., college funding, cash flow analysis, budgeting, etc.)
Tax planning and preparation
Inheritance and estate planning
Recommend retirement-related products including health, life, and long-term care insurance
Plan for possible assisted living and long-term care needs
Plan for healthcare expenses
Handle day-to-day finances (e.g., pay bills)
Some other services
Thirty-four percent of retirees currently use a professional financial advisor. Among those who do, the majority use
their advisors to make retirement investment recommendations (77 percent). Relatively fewer use their advisors to
calculate retirement income needs (27 percent), develop strategies for spending down savings (27 percent),
general financial planning (23 percent), tax planning and preparation (22 percent), and/or inheritance and estate
planning (18 percent). Even fewer receive advice related to planning for long-term care and healthcare expenses.
Approximately One in Three Use a Professional Financial Advisor
Currently Use a Professional Financial Advisor to Help Manage Retirement Savings or Investments
All Retirees (N=2,043)
Among Retirees Who Use a Professional Financial Advisor (N=775)
77
27
27
23
22
18
14
7
6
5
10
72
34
66
Yes No

Sources of Information (%) All Retirees (N=2,043)
NET – Professional Advisor
Financial Planner/Broker
Accountant
Insurance agent
Lawyer
NET – Digital
Financial websites (Yahoo Finance, Morningstar, etc.)
Retirement plan provider website
Retirement calculators
Online newspapers, magazines, and blogs
Social media (e.g., Facebook, Twitter, etc.)
NET – Print
Print newspapers and magazines
Plan provider printed material (e.g., brochures)
Friends/Family
Financial-related television shows
Employer
Other
None
38
32
8
4
3
21
10
8
8
7
1
15
11
5
12
5
3
5
42
RETIREE BASE: ALL QUALIFIED RESPONDENTS Q825. What sources of information do you rely on for managing your retirement savings and investments? Select all that apply.
Retirees rely on a variety of sources of information for managing their retirement savings and investments, with
financial planners/brokers (32 percent) being the most frequently cited source. Relatively few cite friends/family
(12 percent), print newspapers and magazines (11 percent), financial websites (10 percent), or other sources.
Forty-two percent of retirees cite “none.”
Retirees Rely on a Variety of Sources About Saving and Investing
73

Only five percent of retirees frequently discuss retirement savings, investments, and their financial situation
with their family and close friends. Forty-nine percent of retirees occasionally discuss these topics and 46
percent never do so.
Almost Half Never Discuss Their Financial Situation With Others
RETIREE BASE: ALL QUALIFIED RESPONDENTS Q1515. How frequently do you discuss your retirement savings, investments, and financial situation with family and close friends?
5
49
46
Frequently
Occasionally
Never
All Retirees (N=2,043)
NET – Frequently/ Occasionally
54%
Frequency of Retirement Discussion with Family and Friends (%)
74

75
Looking Back on Financial Preparations for Retirement

Thirty-one percent of retirees started saving before the age of 40, while 39 percent started saving in their
forties or older. An alarming 30 percent of retirees indicate they did not save for retirement. Among retirees
who saved for retirement, they first started saving at age 40 (median).
Retirees Started Saving at Age 40 – And Some Never Saved
RETIREE BASE: ALL QUALIFIED RESPONDENTSQ790. At what age did you first start saving for retirement?
2
12
1719
14
5
1
30
Age <20 20-29 30-39 40-49 50-59 60-69 70+ I did not savefor retirement
Age First Started Saving for Retirement (%)
All Retirees (N=2,043)
76
Median: Age 40

For the majority of their working careers, 68 percent of retirees participated in some form of employer-sponsored
retirement benefits, including 49 percent who participated in a 401(k) or similar plan and 37 percent who
participated in a company-funded defined benefit plan. Thirty-two percent of retirees worked for employers that
did not offer any retirement benefits.
About Two-Thirds Participated in Workplace Retirement Plans
Only responses >1% shownRETIREE BASE: ALL QUALIFIED RESPONDENTSQ1180. Which of the following retirement benefits at your employer(s) did you participate in for the majority of your working career? Please select all that apply.
Participation in Retirement Benefits for the Majority of Working Career (%)
All Retirees (N=2,043)
NET – EMPLOYEE-FUNDED PLAN
Employee-funded 401(k) plan
Other employee self-funded plan (e.g., SIMPLE, SEP)
NET – COMPANY-FUNDED DEFINED BENEFIT PLAN
Company-funded defined benefit pension plan
Company-funded cash balance plan
Other
None. My employer did not offer any retirement benefits.
49
47
3
37
35
4
<1
32
NET – Had Any Retirement Benefits
68%
77
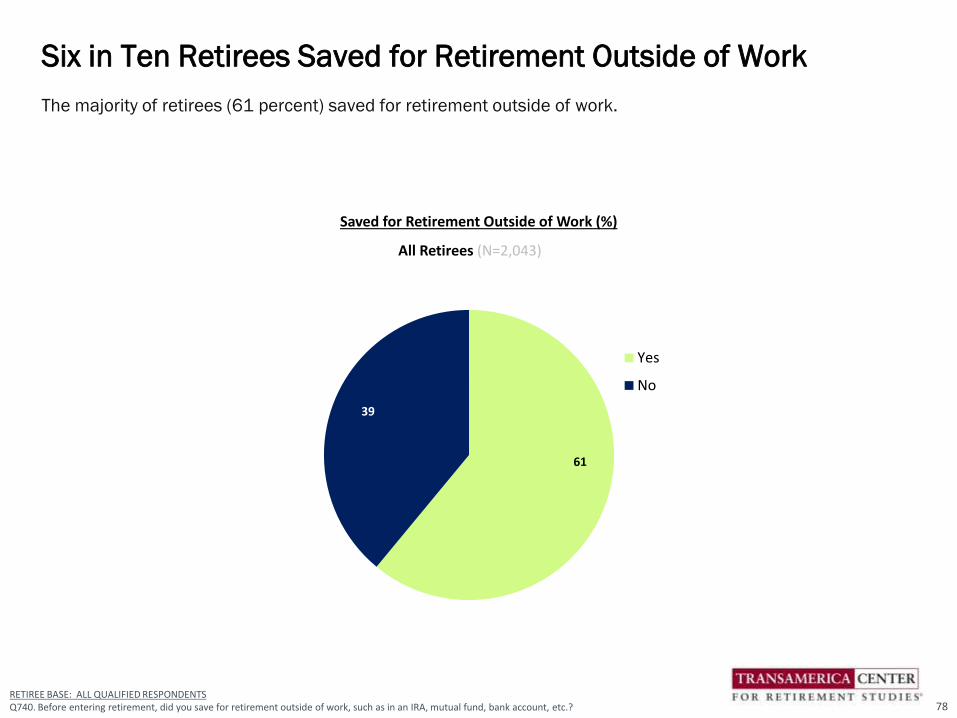
The majority of retirees (61 percent) saved for retirement outside of work.
Six in Ten Retirees Saved for Retirement Outside of Work
RETIREE BASE: ALL QUALIFIED RESPONDENTSQ740. Before entering retirement, did you save for retirement outside of work, such as in an IRA, mutual fund, bank account, etc.?
61
39
Yes
No
All Retirees (N=2,043)
Saved for Retirement Outside of Work (%)
78

RETIREE BASE: ALL QUALIFIED RESPONDENTSQ1160. Which of the following best describes your retirement strategy before retiring?
Fifty-four percent of retirees had a retirement strategy before they retired. However, only 10 percent had a
written plan, while 44 percent had a plan but it was not written down. Forty-six percent did not have a
retirement strategy.
Only One in Ten Had a Written Strategy Before Retiring
Retirement Strategy Before Retiring (%)
10
44
46
I had a written plan
I had a plan, but it was notwritten down
I did not have a plan
All Retirees (N=2,043)
NET – Had a Plan
54%
79

Two-thirds of retirees say their most recent employers did “nothing” to help pre-retirees transition into retirement and
16 percent are “not sure” what their employers did. Among the 18 percent of retirees whose employers helped pre-
retirees, the most frequently cited offerings are financial counseling about retirement (6 percent), seminars and
education about transitioning into retirement (5 percent), the ability to reduce work hours and shift from full- to part-
time (5 percent), and accommodating flexible work schedules and arrangements (5 percent).
Two-Thirds Say Their Employers Did “Nothing” to Help Transition
RETIREE BASE: ALL QUALIFIED RESPONDENTS Q1533. In which of the following ways, if any, does your current or most recent employer help its pre-retirees transition into retirement? Please select all that apply.
How Employers Helped Pre-Retirees Transition Into Retirement (%)
All Retirees (N=2,043)
Offers financial counselling about retirement
Provides seminars and education about transitioning into retirement
Enables employees to reduce work hours and shift from full-time to part-time
Accommodates flexible work schedules and arrangements
Encourages employees to participate in succession planning, training and mentoring
Offers retirement-oriented lifestyle and transition planning resources
Enables employees to take positions that are less stressful or demanding
Provides information about encore career opportunities
Other
Nothing
Not sure
6
5
5
5
4
3
2
1
2
66
16
80

Before retiring three in 10 retirees used a professional financial advisor to help them manage their retirement
savings or investments.
Three in Ten Used a Financial Advisor Before Retiring
RETIREE BASE: ALL QUALIFIED RESPONDENTSQ1521. Before retiring/semi-retiring, did you use a professional financial advisor to help manage your retirement savings or investments?
Before Retiring, Did You Use a Professional Financial Advisor to Help Manage Your Retirement Savings or Investments? (%)
30
70
Yes
No
All Retirees (N=2,043)
81

When looking back on their retirement preparations, almost three in four retirees (73 percent) agree they wish
they would have saved more and on a consistent basis. About two-thirds did as much as they could to prepare
for retirement (67 percent). Almost as many retirees wish they had been more knowledgeable about retirement
saving and investing (64 percent). Many retirees also agree they waited too long to concern themselves with
saving and investing for retirement (50 percent) and that debt interfered with their ability to save as much as
they needed for a comfortable retirement (47 percent).
Retirees’ Insights on How They Could Have Better Prepared
Looking Back on Retirement Preparations (%)
NET – Strongly/Somewhat AgreeAll Retirees (N=2,043)
I wish that I would have saved more and on a consistent basis
I did as much as I could to prepare for my retirement
I wish that I had been more knowledgeable about retirement saving and investing
I waited too long to concern myself with saving and investing for retirement
Debt interfered with my ability to save as much as I needed for a comfortable retirement
I would have liked more information and advice from my employer on how to reach my retirement goals
I should have relied more on outside experts to monitor and manage my retirement savings
RETIREE BASE: ALL QUALIFIED RESPONDENTSQ930. Reflecting on your working years before entering into retirement/semi-retirement, how much do you agree or disagree with each of the following statements?
73
67
64
50
47
44
34
82

83
Living Arrangements in Retirement
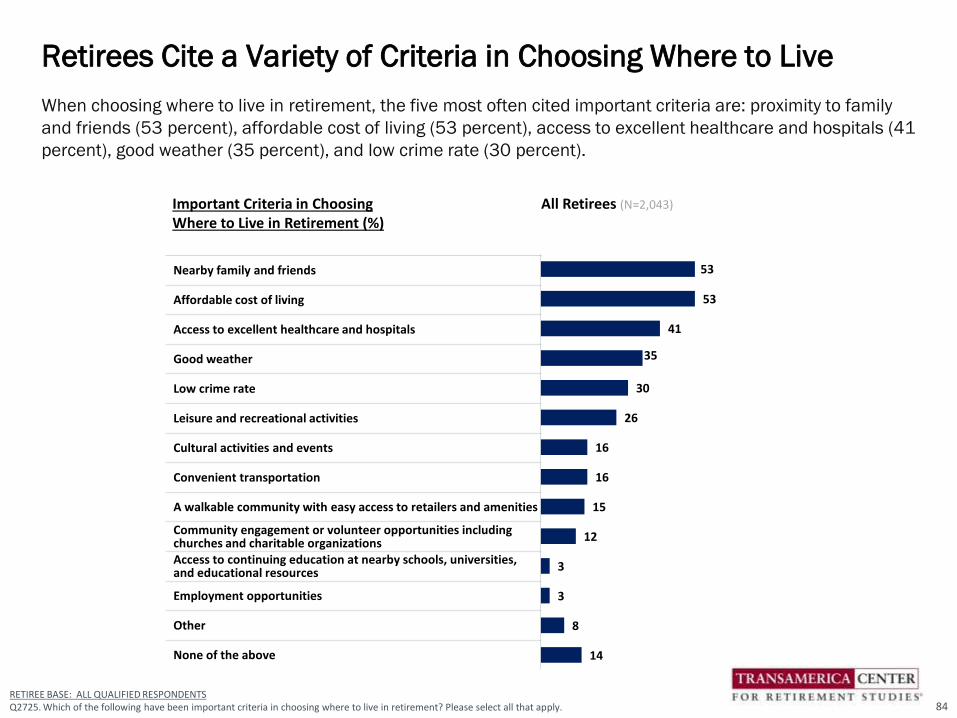
Important Criteria in Choosing Where to Live in Retirement (%)
All Retirees (N=2,043)
Nearby family and friends
Affordable cost of living
Access to excellent healthcare and hospitals
Good weather
Low crime rate
Leisure and recreational activities
Cultural activities and events
Convenient transportation
A walkable community with easy access to retailers and amenities
Community engagement or volunteer opportunities including churches and charitable organizationsAccess to continuing education at nearby schools, universities, and educational resources
Employment opportunities
Other
None of the above
When choosing where to live in retirement, the five most often cited important criteria are: proximity to family
and friends (53 percent), affordable cost of living (53 percent), access to excellent healthcare and hospitals (41
percent), good weather (35 percent), and low crime rate (30 percent).
Retirees Cite a Variety of Criteria in Choosing Where to Live
RETIREE BASE: ALL QUALIFIED RESPONDENTSQ2725. Which of the following have been important criteria in choosing where to live in retirement? Please select all that apply.
53
53
41
35
30
26
16
16
15
12
3
3
8
14
84

Reasons for Moving (%) Among Retirees Who Moved (N=735)
Reduced expenses
Downsized into a smaller home
Moved closer to family and friends
Moved to a better climate
Started a new chapter in life
No longer needed to live near work
Moved into a larger home
Became widowed
Got divorced or separated
Moved into an aging-friendly home
Got married or found a new partner
Needed care or assisted living
Other
Since entering retirement, almost four in 10 retirees (38 percent) have moved to a new home, while 62 percent
have stayed in the home that they lived in before retiring. Among those who moved, frequently cited reasons for
doing so include reducing expenses (34 percent), downsizing (33 percent), moving closer to family and friends (27
percent), moving to a better climate (23 percent), and starting a new chapter in life (22 percent).
Almost Four in Ten Retirees Have Moved Since Retiring
RETIREE BASE: ALL QUALIFIED RESPONDENTSQ2705. How have your living arrangements changed since entering retirement?RETIREE BASE: MOVED TO A NEW HOMEQ2708.What were your reasons for moving? Please select all that apply?
38
62
Moved to a new home
Stayed in the home I lived in before retiring
Living Arrangements in Retirement (%)
All Retirees (N=2,043)
34
33
27
23
22
13
9
8
7
7
4
2
11
85

Approximately three in four retirees (76 percent) own their homes, while 20 percent rent and three percent live
with relatives or friends.
Seventy-three percent of retirees currently live in a single family home, while 19 percent live in a multi-unit
apartment or condo. Only four percent live in a retirement community.
Approximately Three in Four Retirees Own Their Homes
RETIREE BASE: ALL QUALIFIED RESPONDENTSQ2712. Do you own or rent your home?Q2710. What type of home do you currently live in?
Type of Home Living in During Retirement (%)
73
19
44
Single family home
Multi-unit apartment orcondominium complex
Retirement community
Other
All Retirees (N=2,043)
13
20
76Own
Rent
Neither - I live withrelatives or friends
Other
Own vs. Rent Home (%)
All Retirees (N=2,043)
86

Fifty-six percent of retirees currently live with their spouse/partner, while 31 percent live alone. Fourteen
percent live in the same household with their children, four percent with their grandchildren, and four percent
with other relatives. Among retirees who currently live with others who are not their spouse/partner, 68 percent
indicate that the other person(s) moved into their residence, while 17 percent moved into the other person’s
residence, and 15 percent indicate that they and the other person(s) all moved into a different residence.
Most Retirees Live With Spouse/Partner or Alone
RETIREE BASE: ALL QUALIFIED RESPONDENTSQ2715. Who do you currently live with in your household? Please select all that apply.RETIREE BASE: CURRENTLY LIVING WITH OTHERS WHO ARE NOT SPOUSE/PARTNERQ2717. You mentioned you are currently living with others who are not a spouse or partner in your household. Did you move into their residence or did they move into your residence?
Who Do You Currently Live With in Your Household? (%)
All Retirees (N=2,043)
My spouse/partner
Alone
My children
My grandchildren
Other relatives
Friends or acquaintances
Other
56
31
14
4
4
1
<1
87
Did You Move Into Their Residence or Did They Move Into Your Residence? (%)
68
17
15
They moved into my residence
I moved into their residence
We all moved into a different residence
Among Retirees Who Are Currently Living With Others (Excluding Spouse or Partner) (N=366)

The vast majority of retirees (89 percent) indicate remaining in their own home as they get older is important to
them, including 68 percent indicating it is “very important” and 21 percent “somewhat important.” Only nine
percent indicate that it is not important, including six percent indicating “not too important” and three percent
“not at all important.”
Retirees Want to Remain in Their Own Home
RETIREE BASE: ALL QUALIFIED RESPONDENTSQ2709. How important is it to you to remain in your own home as you get older?
How Important Is It to You to Remain in Your Own Home as You Get Older? (%)
68
21
63 2
Very important
Somewhat important
Not too important
Not at all important
Not sure
All Retirees (N=2,043)
NET – Important
89%
88

89
Long-Term Care and Legal Documents

Forty-nine percent of retirees plan to rely on family and friends in the event their health declines and they need
help with daily activities and/or nursing care. Thirty percent plan to move to an assisted living community or
nursing home. An alarming one in four retirees (24 percent) do not have any plans for such care.
Almost Half Plan to Rely on Family and Friends for Long-Term Care
RETIREE BASE: NO NOT CURRENTLY RECEIVING LTCQ2775. If your health declines and you need help with daily activities and/or nursing care, what are your plans for receiving such care? Please select all that apply.
Types of Long-Term Care Assistance (%) Among Retirees Who Said They Are NotCurrently Receiving Long-Term Care (N=2,004)
NET – Rely on family and friends
Rely on my spouse to care for me
Rely on family members (other than my spouse/partner) to care for me
Rely on friends to care for me
NET – Assisted living / nursing home
Move to an assisted living community
Move to a nursing home (e.g., skilled nursing facility)
Use a professional, paid in-home caregiver
Seek reduced-fee services from a community organization
Other
I don't have any plans
49
30
26
3
30
25
11
19
11
4
24
90

Fewer than half of retirees (45 percent) are confident they will be able to afford long-term care, if needed,
including 11 percent who are “very confident” and 34 percent who are “somewhat confident.” Fifty-five percent
of retirees are “not too confident” (27 percent) or “not at all confident” (28 percent) in their ability to afford
long-term care.
Few Are “Very Confident” in Ability to Afford Long-Term Care
RETIREE BASE: ALL QUALIFIED RESPONDENTSQ2780B. How confident are you that you will be able to afford long-term care, if needed (e.g., an assisted living community; skilled nursing facility; professional, paid in-home caregiver)?
11
34
27
28
Very confident
Somewhat confident
Not too confident
Not at all confident
All Retirees (N=2,043)
NET – Confident
45%
Confidence in Ability to Afford Long-Term Care (e.g., an assisted living community; skilled nursing facility, paid in-home caregiver) (%)
91

When asked about the types of legal documents they have set forth in writing, a last will and testament (65
percent) is the most often cited, followed by power of attorney for healthcare or medical proxy (45 percent), and
advance directive or living will (45 percent). Thirty-nine percent have a power of attorney to allow a designated
individual to make financial decisions on their behalf. Fewer than two in five retirees have funeral and burial
arrangements (36 percent), a HIPAA waiver (29 percent), or a trust (18 percent).
Some Have Set Forth Legal Documentation
RETIREE BASE: ALL QUALIFIED RESPONDENTSQ1517. Which of the following have you set forth in writing? Please select all that apply.
Types of Legal Documentation in Place (%) All Retirees (N=2,043)
Last will and testament
Power of attorney or medical proxy to allow a designated individual(s) to make medical decisions on your behalf
Advance directive or living will instructing physicians and other medical personnel about end-of-life healthcare preferences and any care you wish to decline
Power of attorney to allow a designated individual (s) to make financial decisions on your behalf
Funeral and burial arrangements
HIPAA waiver to allow a designated individual(s) to speak to your physicians and insurance providers on your behalf
A trust
65
45
45
39
36
29
18
92
Appendix: A Demographic Portrait of Retirees
93

A Demographic Portrait of Retirees
All Retirees
AgeRetirement Type
N=2,04350-59N=308
60-64N=310
65-69N=712
70+N=713
FullyN=1,716
SemiN=327
Gender
Male 44% 40% 42% 46% 44% 43% 50%
Female 55% 60% 57% 54% 54% 56% 48%
Transgender <1% - <1% - - <1% -
Decline to answer 1% <1% 1% <1% 2% 1% 2%
Age
50 – 54 2% 31% - - - 1% 7%
55 – 59 4% 69% - - - 3% 13%
60 – 64 12% - 100% - - 11% 18%
65 – 69 23% - - 100% - 24% 21%
70 – 74 22% - - - 37% 22% 18%
75 – 79 18% - - - 30% 19% 6%
80+ 19% - - - 33% 20% 17%MEAN 71.7 55.8 62.4 67.1 77.0 72.2 67.8
MEDIAN 71 56 63 67 76 72 67
Ethnicity
White, non-Hispanic 80% 78% 79% 80% 81% 81% 74%
Hispanic 8% 7% 8% 8% 8% 8% 11%
African American 7% 8% 8% 8% 6% 7% 10%
Asian 3% 6% 3% 2% 4% 3% 5%
Other/Mixed race <1% 1% <1% <1% <1% <1% <1%
Prefer not to answer 1% - 2% 0% 1% 1% -
All Retirees
AgeRetirement Type
N=2,04350-59N=308
60-64N=310
65-69N=712
70+N=713
FullyN=1,716
SemiN=327
Level of Education
Less than high school graduate 2% <1% 3% 1% 3% 3% 0%
High school graduate 43% 40% 38% 39% 46% 44% 33%
Some college or trade school 30% 30% 32% 34% 28% 30% 32%
College graduate 17% 22% 19% 19% 15% 16% 24%
Some grad. school/grad. Degree 8% 8% 8% 7% 8% 7% 11%
Marital Status
Married 55% 57% 66% 57% 51% 56% 48%
Single, never married 7% 15% 10% 11% 4% 6% 14%
Divorced/widowed/separated 37% 26% 22% 30% 44% 37% 37%
Living with partner 1% 2% 2% 2% 1% 1% 1%
Type of Area Lived In
Urban area 22% 22% 20% 24% 22% 22% 21%
Suburban area 54% 53% 54% 53% 55% 54% 56%
Rural area 24% 25% 26% 23% 24% 24% 23%
94

A Demographic Portrait of Retirees, continuedAll
Retirees Age Retirement Status
N=2,04350-59N=308
60-64N=310
65-69N=712
70+N=713
FullyN=1,716
SemiN=327
Household Savings Excluding Home Equity
$0 9% 14% 10% 12% 8% 9% 10%
$1 to less than $5,000 12% 11% 10% 10% 14% 13% 9%
$5,000 to less than $10,000 3% 2% 4% 5% 2% 3% 3%
$10,000 to less than $25,000 3% 2% 2% 3% 3% 2% 6%
$25,000 to less than $50,000 4% 4% 4% 2% 5% 4% 3%
$50,000 to less than $100,000 7% 5% 6% 7% 8% 8% 4%
$100,000 to less than $250,000
9% 9% 11% 8% 9% 9% 11%
$250,000 or more 30% 34% 32% 31% 27% 29% 30%
Not sure 7% 7% 5% 6% 7% 7% 6%
Decline to answer 16% 12% 16% 16% 17% 16% 18%
MEDIAN ($000) 74.7 105.7 106.9 74.3 70 72.8 102.6
Home Equity
$0 22% 26% 18% 23% 22% 22% 24%
$1 to less than $5,0001% 1% 3% 1% 1% 2% 1%
$5,000 to less than $10,0001% 1% 1% 2% 1% 2% 1%
$10,000 to less than $25,000 1% 1% 3% 1% 1% 1% 2%
$25,000 to less than $50,000 4% 3% 3% 4% 4% 4% 4%
$50,000 to less than $100,000 8% 10% 13% 7% 8% 8% 15%$100,000 to less than $250,000
18% 16% 16% 19% 17% 18% 15%
$250,000 or more 23% 25% 19% 19% 24% 23% 22%
Not sure 9% 9% 9% 9% 8% 9% 4%
Decline to answer 13% 8% 15% 15% 14% 11% 12%
MEDIAN ($000) 79 74.3 67.8 75.6 84.7 82.3 64.6
All Retirees Age Retirement Status
N=2,04350-59N=308
60-64N=310
65-69N=712
70+N=713
FullyN=1,716
SemiN=327
HH Income
Less than $25,000 25% 23% 21% 25% 26% 26% 20%
$25,000 to less than $50,000 28% 20% 26% 22% 32% 28% 27%
$50,000 to less than $75,000 17% 16% 14% 18% 18% 18% 16%$75,000 to less than $100,000 9% 13% 12% 10% 8% 9% 11%
$100,000 to less than $150,000 10% 13% 17% 11% 7% 9% 12%
$150,000 or more 5% 11% 3% 7% 3% 4% 8%
Not sure 1% 1% 1% 2% 1% 1% -
Decline to answer 5% 3% 6% 5% 5% 5% 6%
MEDIAN ($000) 32.3 45.9 37.9 37.1 29.4 31.7 38.1
Occupation
Office/Administrative Support 22% 21% 21% 21% 24% 23% 18%
Managerial or business owner 14% 13% 11% 13% 15% 14% 16%
Production/Construction/Transportation
12% 15% 14% 17% 9% 12% 7%
Professional/Medical/Technical
9% 10% 14% 9% 8% 9% 10%
Sales 9% 12% 9% 8% 9% 9% 10%
Customer service 6% 7% 7% 6% 5% 6% 8%
Education/Training 1% 1% 1% 1% 2% 2% 1%
Some Other Occupation 26% 21% 24% 25% 27% 25% 30%
95

All Retirees Age
Retirement Status
N=2,04350-59N=308
60-64N=310
65-69N=712
70+N=713
FullyN=1,716
SemiN=327
Employment status
Employed full-time 2% 13% 1% 3% 0% 0% 12%
Employed part-time 5% 9% 4% 3% 5% 0% 40%
Self-employed 2% 2% 4% 2% 2% 0% 16%
Not employed, but looking for work 2% 5% 4% 2% 1% 1% 11%
Not employed and not looking for work 81% 56% 75% 84% 84% 90% 16%
Homemaker 9% 15% 11% 6% 9% 9% 6%
Been retired and then come out of retirement
Yes 15% 20% 11% 12% 16% 11% 44%
No 85% 80% 89% 88% 84% 89% 56%
A Demographic Portrait of Retirees, continuedAll
Retirees AgeRetirement
Status
N=2,04350-59N=308
60-64N=310
65-69N=712
70+N=713
FullyN=1,716
SemiN=327
Consider yourself
Fully retired 89% 61% 84% 89% 92% 100% -
Semi-retired 11% 39% 16% 11% 8% - 100%
None of the above 0% 0% 0% 0% 0% 0% 0%
Current professionI am working in my primary profession and career
31% 45% 16% 39% 26% 34% 30%
I have started a new profession and career since entering retirement
22% 25% 37% 23% 16% 28% 21%
I am working but do not consider it to be in either my primary profession or a new profession
40% 27% 29% 30% 52% 3% 43%
Other 8% 3% 19% 8% 6% 34% 6%
Company's Primary BusinessProfessional services 21% 20% 18% 22% 21% 20% 24%Manufacturing
20% 18% 23% 20% 20% 21% 14%
Service industries19% 24% 20% 18% 20% 19% 22%
Transportation/Comm./Utilities 10% 6% 15% 14% 8% 11% 9%Agriculture/Mining/Construction 3% 5% 1% 3% 4% 3% 8%
Some other type of business 26% 27% 23% 23% 28% 26% 24%
Number of Employees
5-499 (NET) 50% 48% 43% 45% 54% 49% 55%
5 to 24 19% 14% 16% 14% 23% 20% 16%
25 to 99 16% 17% 13% 15% 16% 15% 18%
100 to 499 15% 17% 14% 16% 15% 14% 20%
500+ (NET) 50% 52% 57% 55% 46% 51% 45%
500 to 999 9% 10% 8% 9% 10% 9% 13%
1,000 or more 41% 42% 49% 46% 36% 42% 32%MEAN 636 667 721 707 587 643 579MEDIAN 299 406 676 576 245 329 249 96