Embed Size (px)
Citation preview

Practical Assessment, Research, and Evaluation Practical Assessment, Research, and Evaluation
Volume 25 Article 7
2020
A Practical Comparison of Selected Methods of Evaluating A Practical Comparison of Selected Methods of Evaluating
Multiple-Choice Options through Classical Item Analysis Multiple-Choice Options through Classical Item Analysis
Wojciech Malec John Paul II Catholic University of Lublin
Małgorzata Krzeminska-Adamek Maria Curie-Skłodowska University
Follow this and additional works at: https://scholarworks.umass.edu/pare
Part of the Educational Assessment, Evaluation, and Research Commons, and the Modern Languages
Commons
Recommended Citation Recommended Citation Malec, Wojciech and Krzeminska-Adamek, Małgorzata (2020) "A Practical Comparison of Selected Methods of Evaluating Multiple-Choice Options through Classical Item Analysis," Practical Assessment, Research, and Evaluation: Vol. 25 , Article 7. Available at: https://scholarworks.umass.edu/pare/vol25/iss1/7
This Article is brought to you for free and open access by ScholarWorks@UMass Amherst. It has been accepted for inclusion in Practical Assessment, Research, and Evaluation by an authorized editor of ScholarWorks@UMass Amherst. For more information, please contact [email protected].

A peer-reviewed electronic journal.
Copyright is retained by the first or sole author, who grants right of first publication to Practical Assessment, Research & Evaluation. Permission is granted to distribute this article for nonprofit, educational purposes if it is copied in its entirety and the journal is credited. PARE has the right to authorize third party reproduction of this article in print, electronic and database forms.
Volume 25 Number 7, October 2020 ISSN 1531-7714
A Practical Comparison of Selected Methods of Evaluating Multiple-Choice Options through Classical Item Analysis
Wojciech Malec, John Paul II Catholic University of Lublin Małgorzata Krzemińska-Adamek, Maria Curie-Skłodowska University
The main objective of the article is to compare several methods of evaluating multiple-choice options through classical item analysis. The methods subjected to examination include the tabulation of choice distribution, the interpretation of trace lines, the point-biserial correlation, the categorical analysis of trace lines, and the investigation of choice means. The comparison was performed on the basis of a data set created at the pre-operational stage of developing a test of English as a foreign language for teenage learners. The main analysis of a pool of 910 multiple-choice pilot items was carried out in Excel, which was found to be a versatile tool allowing for the application of user-defined formulas and convenient manipulation of the data. It was found that the methods differed in terms of their stringency in rejecting malfunctioning items, with the chi-square test operating in the most rigorous manner. The study also revealed that some of the evaluation methods had a similar effect on item selection, which suggests that it may not be necessary to apply all of them to multiple-choice item analysis.
Introduction
This paper aims to present a comparison of selected methods of item analysis which can be used to assess the quality of multiple-choice test questions through scrutinizing option performance. Among these methods are the tabulation of choice distribution, the inspection of trace lines, the point-biserial correlation, the categorical analysis of trace lines (by means of the chi-square test), and the examination of choice means. All of the methods were applied in practice to evaluate a pool of items piloted for a multiple-choice test of English as a foreign language for teenage learners. The ultimate goal of the analysis was to select the best-performing items which were later used to create the final test forms (as reported in Krzemińska-Adamek & Malec, to appear). The test in question consisted of three sections corresponding to different knowledge areas: vocabulary, grammar, and language functions. As far as the functions of the test are concerned, it was meant to serve
placement, progress and diagnostic purposes, depending on the moment of administration.
Multiple-choice (MC) items overwhelmingly predominate over other item formats in terms of both research and application in the field of educational measurement at large (cf. Parkes & Zimmaro, 2016, p. 1). Also specifically in language testing, MC has been successfully used at all levels of proficiency in both classroom and large-scale contexts to test a number of different content types, such as reading (Alderson, 2000), listening (Buck, 2001), grammar (Purpura, 2004), vocabulary (Read, 2000), collocations (Bonk, 2001), as well as pragmatics (Hudson, Detmer, & Brown, 1995). Well-known language testing tools incorporating MC items include the Vocabulary Size Test (Nation & Beglar, 2007), Cambridge English exams, the Test of English as a Foreign Language (TOEFL), the Test of English for International Communication (TOEIC), the French-language proficiency test (TFI), to name but a few.
1
Malec and Krzeminska-Adamek: Multiple-choice testing: Distractor evaluation and item selection
Published by ScholarWorks@UMass Amherst, 2020

Page 2 Practical Assessment, Research & Evaluation, Vol 25 No 7 Malec & Krzemińska-Adamek, Evaluating MC Options
The popularity of MC should not be taken to imply that this item format is unanimously accepted as the most appropriate method of testing. On the contrary, it has engendered considerable controversy, mainly due to the fact that questions of this type are limited to measuring receptive knowledge. Other well-known weaknesses of MC items relate to lack of authenticity and the possibility of guessing the correct answer. Moreover, given that they expose students to wrong answers (i.e. incorrect options), such items may even contribute to misinformation (e.g., Roediger & Marsh, 2005). However, as pointed out by Ansley (1997), MC tests are often ‘seriously maligned’ (p. 276), and ‘the limitation with multiple choice items rests in the item’s author rather than in the nature of the item itself’ (p. 277). Assuming that MC items are developed appropriately, the issue that is of crucial interest is whether the constructs assessed by MC and other formats are fundamentally different (see also Holmes, 2016, Chapter 12). MC has been at the center of numerous investigations into method effects in language testing (e.g., Shohamy, 1984; Currie & Chiramanee, 2010). Despite rare evidence to the contrary (e.g., Ito, 2004), research mostly confirms that MC items are easier for the test takers compared to open-ended ones (In’nami & Koizumi, 2009), yet these two formats do not seem to differ significantly in terms of the construct being measured (Rodriguez, 2003). Accordingly, in many testing situations, the choice between MC and constructed-response tasks may depend principally on the relative convenience of administering and scoring the test. Perhaps the greatest advantage of MC, as well as of all other selected-response types, is that they can be easily and objectively scored.
The downside of MC items, on the other hand, is that they are more difficult to develop than open-ended tasks. The literature on educational measurement abounds with practical guidance on MC item writing (e.g., Haladyna & Downing, 1989; Haladyna, Downing, & Rodriguez, 2002; see also Fulcher, 2010, pp. 172-173, for guidelines which are especially relevant to language testing). For example, in constructing MC items, it is
1 It should be pointed out that most of the statistical methods discussed in this paper are in principle appropriate to norm-referenced measurement, as in the case of placement tests (see, e.g., Brown & Hudson, 2002, for methods of item analysis designed for criterion-referenced tests). It is also worthy of note that we have focused on methods which do not require any specialized statistical software, and all the necessary analyses can be easily conducted with the aid of Excel.
important to ensure that the information provided in the item stem is neither insufficient nor redundant for the purpose of selecting the correct answer, and that the item as a whole is not opinion-based or tricky. Furthermore, test takers should not be able to employ test-wiseness strategies to answer items correctly. In particular, MC item writers should avoid stem-option cues, grammatical cues, similar distractors, and item giveaway (see Allan, 1992, for details).
The major challenges posed by MC item construction relate to the writing of options (key and distractors). Typical item-writing guidelines suggest that the length of MC options should be about the same, and that students’ typical errors should be used when writing the distractors. Moreover, the distractors must be plausible, but plainly wrong, as opposed to the keyed response, which must be indubitably correct. Though intuitively obvious, the application of these rules in real life may present considerable difficulty. It is worth adding that although by increasing the number of options we can potentially make MC items more difficult, there is ample evidence to suggest that the optimal number is three (e.g., Landrum, Cashin, & Theis, 1993; Trevisan, Sax, & Michael, 1994; Bruno & Dirkzwager, 1995; Rodriguez, 2005; Haladyna, Rodriguez, & Stevens, 2019).
Multiple-choice item evaluation
Whereas the initial writing of MC items is an art and ‘[n]o single set of rules can ensure good test items’ (Cantor, 1987, p. 85), there are specific guidelines for evaluating existing items on the basis of item responses, such as those in Table 1. As can be seen in Table 1, rudimentary item analysis boils down to inspecting item difficulty and discrimination. However, there are more detailed evaluation procedures available specifically for MC items, some of which are reviewed in the following sections.1
The broad aim of MC item analysis is to determine which items exhibit the best quality in terms of option
2
Practical Assessment, Research, and Evaluation, Vol. 25 [2020], Art. 7
https://scholarworks.umass.edu/pare/vol25/iss1/7

Table 1. Guidelines for evaluating test items (adapted from Haladyna & Rodriguez, 2013, p. 350)
Type Difficulty Discrimination Comment1 .60 to .90 Above .15 Ideal item; moderate difficulty and high discrimination
2 .60 to .90 Below .15 Poor discrimination
3 Above .90 Disregard High performance item; usually not very discriminating
4 Below .60 Above .15 Difficult but very discriminating
5 Below .60 Below .15 Difficult and non-discriminating
6 Below .60 Below .15 Identical to type 5 except that one of the distractors has a pattern like type 1, which signifies a key error
performance. The evaluation consists mainly in inspecting item facility (IF), item discrimination (ID), and choice distribution (CD) patterns (a term used by Farhady, 2012, to refer to the frequency of occurrence of MC options) for each test item. IF can be calculated as the proportion of test takers who chose the correct answer. ID can be obtained by subtracting the IF for low scorers (e.g., lower 27% of all the test takers) from the IF for high scorers (upper 27% of all the test takers). An additional discrimination index is worth calculating, namely the point-biserial correlation coefficient (PBC), which is a more accurate estimate of the distinction between those test takers who selected the correct answer and those who selected one of the distractors (Brown, 1996, p. 178).
Tabulation of choice distribution
Several aspects of CD can be taken into account. Generally speaking, all of them amount to identifying items in which the keyed response is more attractive to high scorers than to low scorers, with the reverse being true in the case of the distractors (e.g., Bachman, 2004). Analysis of this kind is typically done by tabulating and examining the proportions of testees in the high, middle, and low groups who selected each option (Brown, 1996, 2012), as shown in Table 2.
By way of illustration, Option B in Item 1 is an example of a well-performing key (it was predominantly selected by testees from the high group). On the other hand, Option A in Item 2 may have been mistakenly keyed as the correct answer (it was more attractive to low scorers than to high scorers). As for the distractors in Table 2, while the performance of Option A in Item 1 is generally good (it was selected by a relatively large proportion of testees in the low group), Option B in Item 2 is closer to being the key than a distractor (it was
selected by as many as 80 per cent of all high scorers). Moreover, the last options (C) in both items definitely fall short of expectations: the one in Item 1 does not discriminate whatsoever (it is equally appealing to all the three score groups), whereas the one in Item 2 was so implausible that it hardly attracted any of the test takers (Item 2 is to all intents and purposes a binary-choice item rather than a multiple-choice one).
Trace lines
Another method of inspecting the distribution of option choices involves the use of trace lines, i.e. plots representing item responses (e.g., Haladyna, 2016). A trace line can be created for the key and for each of the distractors indicating the number or percentage of testees in several score groups who selected the given option. The score groups are determined on the basis of total test scores. Two such trace lines are illustrated in Figure 1 — one for the key of an item and another for a distractor. These trace lines are close to being ideal: the one for the key rises from low scorers to high scorers, whereas the one for a distractor has a downward slope and is almost a mirror-image of the trace line for the key. Generally speaking, multiple-choice item analysis comes down to the identification of items with ascending trace lines for the correct answers and descending trace lines for the distractors.
The unquestionable advantage of graphical representations of choice distribution is that they are easy to read and interpret. On the other hand, it is impossible to automate the selection of test items on the basis of this method as graph interpretation invariably calls for human judgement. Moreover, not all trace lines are as clear-cut and unambiguous as the ones in Figure 1, which means that there may be various borderline cases requiring precise criteria of acceptance or rejection.
Page 3Practical Assessment, Research & Evaluation, Vol 25 No 7 Malec & Krzemińska-Adamek, Evaluating MC Options
3
Malec and Krzeminska-Adamek: Multiple-choice testing: Distractor evaluation and item selection
Published by ScholarWorks@UMass Amherst, 2020

Page 4 Practical Assessment, Research & Evaluation, Vol 25 No 7 Malec & Krzemińska-Adamek, Evaluating MC Options
Table 2. Tabulation of choice distribution (an example)
Item Option Low Middle High
1
A .55 .45 .15
B* .15 .25 .55
C .30 .30 .30
2
A* .70 .35 .20
B .30 .60 .80
C .00 .05 .00
*Correct option
This may be a major problem with large data sets, when the analysis necessitates plotting out and interpreting a considerable number of trace lines. In such a case, it is more convenient to use numerical representations of option performance. Numerical data can be particularly helpful when the corresponding test items need to be quickly sorted (e.g., in Excel) from the most to the least efficient ones.
Figure 1. Trace lines for an effective key and distractor
Point-biserial correlation
For the evaluation of option performance, useful numerical values may be obtained through several statistical methods, for example the point-biserial correlation. Calculated separately for each of the options of a multiple-choice item (see, e.g., Carr, 2011, on using Excel for this purpose), the relevant coefficient indicates the degree of item and distractor discrimination. As a rule, positive and negative values of this statistic correspond to increasing and decreasing trace lines respectively. Thus, the point-biserial calculated for the correct answer (and, by the same token, for the item as a whole) is expected to be positive. When calculated for a distractor, by contrast, the correlation is supposed to be negative. A
correlation that is close to zero means that the option in question does not discriminate.
The problem with the traditional point-biserial, as pointed out by Attali and Fraenkel (2000), is that it is only appropriate when applied to an item as a whole, in which case the correlation compares the average performance of testees who answered correctly to the average performance of those who answered incorrectly (i.e. selected a distractor). When used to assess the discrimination of a distractor, however, this statistical method makes a comparison between testees who selected the given distractor and those who either answered correctly or selected one of the remaining distractors. To address this issue, a modified point-biserial correlation coefficient should be used, one which makes a comparison between distractor and correct choices (PBDC). This statistic can be calculated using the following formula (Attali & Fraenkel, 2000, p. 79):
𝑃𝐵𝐷𝐶 =𝑀𝐷 −𝑀𝐷𝐶
𝑆𝐷𝐶√𝑃𝐷𝑃𝐶
where MD is the mean total score for the testees who selected the distractor being analyzed, MDC is the mean total score for the testees who selected either the distractor or the correct answer, SDDC is the standard deviation of total scores for the testees who selected either the distractor or the correct answer, PD is the proportion of testees who selected the distractor, and PC is the proportion of testees who answered correctly. PBDC can be obtained in Excel using a three-step procedure which produces the same result as the above formula. In the first step, the data set is converted in such a way that all the correct choices are replaced with 0 and distractor choices with 1, as is done when calculating the traditional point-biserial for a distractor (Carr, 2011). In the second step, since we are interested
5
15
25
35
1 2 3 4 5
Freq
ue
ncy
Score Group
Key
Distractor
4
Practical Assessment, Research, and Evaluation, Vol. 25 [2020], Art. 7
https://scholarworks.umass.edu/pare/vol25/iss1/7

Page 5 Practical Assessment, Research & Evaluation, Vol 25 No 7 Malec & Krzemińska-Adamek, Evaluating MC Options
in only one specific distractor, all the values which correspond to distractors other than the one under analysis are replaced with blanks. Finally, the PEARSON function is used to compute the correlation between the converted item responses (with blanks) and the original total test scores.
Categorical analysis of the trace line
In addition to the point-biserial correlation, distractor evaluation can be conducted by means of the categorical analysis of the trace line (Haladyna, 2004; Haladyna & Rodriguez, 2013). This statistical method applies a chi-square test to the frequencies represented pictorially by the trace line. More precisely, the chi-square test is used to find out whether the observed frequencies are significantly different from a hypothetical situation in which they are equally distributed among all the categories, i.e. several score groups (see, e.g., Gravetter & Wallnau, 2013, for more on using the chi-square test for such purposes). A statistically significant result is an indication of a trace line that is not flat. For example, the values which form the basis of the trace lines in Figure 1 are provided in Table 3. The expected frequencies, which define a hypothetical distribution, are the same for each score group and have been calculated as the average of all the observed frequencies for an option (i.e. 100 in Table 3).In both cases in Table 3, the differences between expected and observed frequencies are statistically significant: χ2(4) = 11.09, p < .05 (for the key) and χ2(4) = 14.17, p < .01 (for the distractor). This method of analyzing option performance may involve using a combination of the COUNTIF and CHISQ.TEST functions in Excel.
A note on the chi-square test for an option
It is worth noting that the result of the chi-square test evidently depends on how the frequencies are obtained. Haladyna (2004, p. 227) as well as Haladyna and Rodriguez (2013, p. 355) use percentages in the contingency tables for the chi-square test. However, their approach represents but one of several possibilities. In fact, the observed frequency of option choices in each score group can be calculated for a given option in at least three different ways:
a) as the number of students who selected thisoption, or the number of times this option hasbeen chosen (N);
b) as the percentage of students in a given scoregroup who selected this option (PST);
c) as the percentage of option choices, i.e. of theoverall number of times this option has beenchosen, made by students in a given scoregroup (POC).
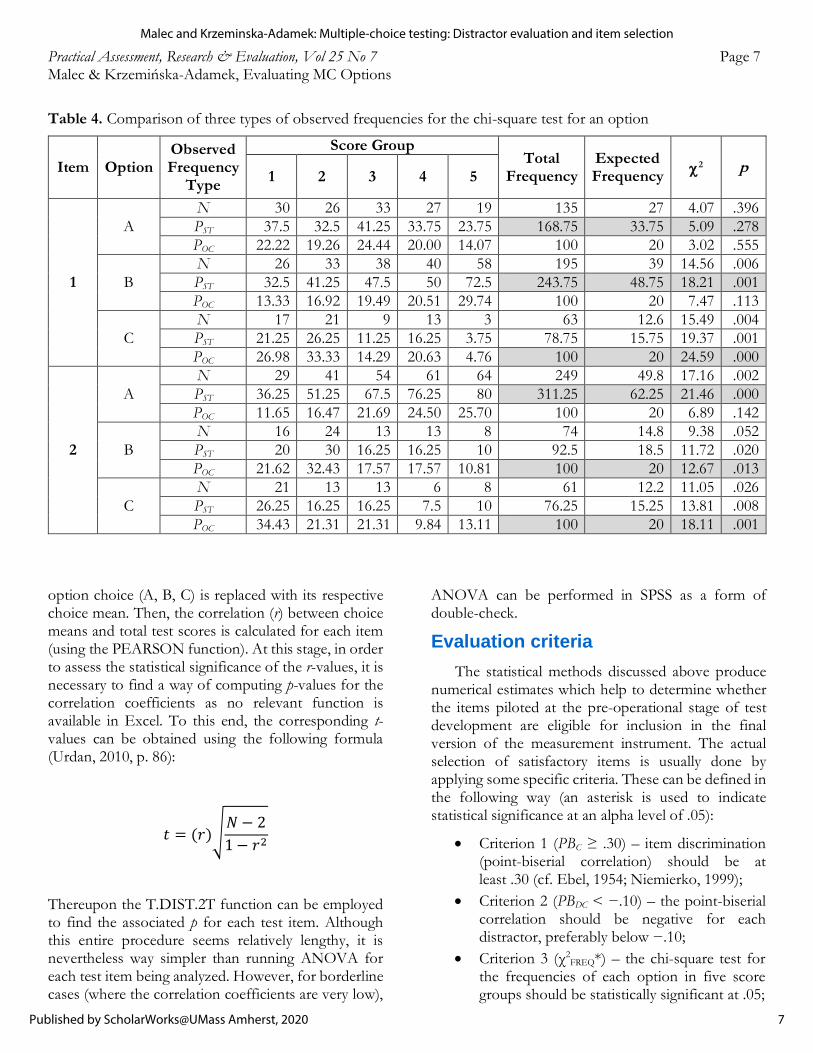
Interestingly, regardless of how the frequencies areobtained, their graphical representations appear to be identical when placed on different scales (see the three top graphs in Figure 2). However, when placed on one common scale, they are no longer congruent, one of them being almost flat (the bottom graph in Figure 2). Table 4 presents the options of two test items from the study by Krzemińska-Adamek and Malec (to appear), each with the three types of observed frequencies.
Table 3. Frequencies for a chi-square test for option performance
Score Group Frequency
SG1 SG2 SG3 SG4 SG5
Expected 20 20 20 20 20
Observed (key) 9 16 21 26 28
Observed (distractor) 33 24 17 14 12
5
Malec and Krzeminska-Adamek: Multiple-choice testing: Distractor evaluation and item selection
Published by ScholarWorks@UMass Amherst, 2020

Page 6 Practical Assessment, Research & Evaluation, Vol 25 No 7 Malec & Krzemińska-Adamek, Evaluating MC Options
Figure 2. Trace lines using three different frequency types (for Item 2, Option A, in Table 4)
Clearly, the result of the chi-square test depends on the type of observed frequency. The highest total frequencies correspond to the highest values of chi-square, and lowest associated p-values, shaded in Table 4. This is expected behavior, and, as pointed out byBurdess (2010, p. 146), using percentages instead of frequencies results in chi-squares which are either underestimated or overestimated. Consequently, although for the purpose of visual representations of option performance, in the form of trace lines, any type of observed frequency can be used, for the chi-square test only (raw) frequencies are appropriate.
Choice means
The final statistical approach to evaluating MC options discussed in this paper is the calculation of choice means (Haladyna, 2004; Haladyna & Rodriguez, 2013). A choice mean can be defined as the average total score obtained for all the testees who selected a
particular option. The correct answer is expected to have a considerably higher choice mean than any of the distractors. The statistical significance of the differences between all the choice means can be determined using either a one-way analysis of variance (ANOVA) or the Pearson correlation between total scores and choice means substituted for option choices. In the latter case, a statistically significant coefficient indicates a substantial difference between choice means. This method may be thought of ‘as an omnibus index of discrimination that includes the differential nature of distractors’ (Haladyna, 2004, p. 224).
The details of the procedure for analyzing choice means in Excel through the use of Pearson correlation coefficients can be found in Malec (2018, pp. 192-193). In short, choice means are first obtained using the AVERAGEIF function. In the next step, the test takers’ responses are transformed such that each
6
Practical Assessment, Research, and Evaluation, Vol. 25 [2020], Art. 7
https://scholarworks.umass.edu/pare/vol25/iss1/7
Page 7 Practical Assessment, Research & Evaluation, Vol 25 No 7 Malec & Krzemińska-Adamek, Evaluating MC Options
Table 4. Comparison of three types of observed frequencies for the chi-square test for an option
Item Option Observed Frequency
Type
Score Group Total
Frequency Expected Frequency
2 p 1 2 3 4 5
1
A
N 30 26 33 27 19 135 27 4.07 .396
PST 37.5 32.5 41.25 33.75 23.75 168.75 33.75 5.09 .278
POC 22.22 19.26 24.44 20.00 14.07 100 20 3.02 .555
B
N 26 33 38 40 58 195 39 14.56 .006
PST 32.5 41.25 47.5 50 72.5 243.75 48.75 18.21 .001
POC 13.33 16.92 19.49 20.51 29.74 100 20 7.47 .113
C
N 17 21 9 13 3 63 12.6 15.49 .004
PST 21.25 26.25 11.25 16.25 3.75 78.75 15.75 19.37 .001
POC 26.98 33.33 14.29 20.63 4.76 100 20 24.59 .000
2
A
N 29 41 54 61 64 249 49.8 17.16 .002
PST 36.25 51.25 67.5 76.25 80 311.25 62.25 21.46 .000
POC 11.65 16.47 21.69 24.50 25.70 100 20 6.89 .142
B
N 16 24 13 13 8 74 14.8 9.38 .052
PST 20 30 16.25 16.25 10 92.5 18.5 11.72 .020
POC 21.62 32.43 17.57 17.57 10.81 100 20 12.67 .013
C
N 21 13 13 6 8 61 12.2 11.05 .026
PST 26.25 16.25 16.25 7.5 10 76.25 15.25 13.81 .008
POC 34.43 21.31 21.31 9.84 13.11 100 20 18.11 .001
option choice (A, B, C) is replaced with its respective choice mean. Then, the correlation (r) between choice means and total test scores is calculated for each item (using the PEARSON function). At this stage, in order to assess the statistical significance of the r-values, it is necessary to find a way of computing p-values for the correlation coefficients as no relevant function is available in Excel. To this end, the corresponding t-values can be obtained using the following formula (Urdan, 2010, p. 86):
𝑡 = (𝑟)√𝑁 − 2
1− 𝑟2
Thereupon the T.DIST.2T function can be employed to find the associated p for each test item. Although this entire procedure seems relatively lengthy, it is nevertheless way simpler than running ANOVA for each test item being analyzed. However, for borderline cases (where the correlation coefficients are very low),
ANOVA can be performed in SPSS as a form of double-check.
Evaluation criteria
The statistical methods discussed above produce numerical estimates which help to determine whether the items piloted at the pre-operational stage of test development are eligible for inclusion in the final version of the measurement instrument. The actual selection of satisfactory items is usually done by applying some specific criteria. These can be defined in the following way (an asterisk is used to indicate statistical significance at an alpha level of .05):
• Criterion 1 (PBC ≥ .30) – item discrimination(point-biserial correlation) should be atleast .30 (cf. Ebel, 1954; Niemierko, 1999);
• Criterion 2 (PBDC < −.10) – the point-biserialcorrelation should be negative for eachdistractor, preferably below −.10;
• Criterion 3 (χ2FREQ*) – the chi-square test for
the frequencies of each option in five scoregroups should be statistically significant at .05;
7
Malec and Krzeminska-Adamek: Multiple-choice testing: Distractor evaluation and item selection
Published by ScholarWorks@UMass Amherst, 2020

Page 8 Practical Assessment, Research & Evaluation, Vol 25 No 7 Malec & Krzemińska-Adamek, Evaluating MC Options
• Criterion 4 (CMKEY − CMDIS > 5 & rCM TS*) –the choice mean of the key should be higherthan the choice means of the distractors by atleast 5 points AND the correlation betweenchoice means (substituted for option choices)and total scores should be statisticallysignificant at .05.
It is worth considering two additional (related) criteria, both of which are based on the tabulation of choice distribution. As pointed out by Haladyna and Rodriguez (2013, p. 355), statistical analyses do not necessarily reveal that an option is chosen too infrequently, and that it may be useful to set an arbitrary standard in this respect. Accordingly, since distractors are meant to appeal to weaker students, items may be required to have distractors which are selected by at least 10% of students in the lower group (lower 27% of all the test takers):
• Criterion 5 (DISLOW ≥ 10%)
By the same token, distractors are not supposed to appeal too much to students in the upper group (upper 27% of all the test takers). Therefore, items with a distractor selected by one third or more of high scorers may be deemed unsatisfactory:
• Criterion 6 (DISHIGH < 33⅓%)
The exact cut-off points provided in the above criteria may be subject to some variation, depending on the pilot sample size, the desired level of statistical power, as well as the stakes of the test. For example, an item discrimination of PBC = .25 may be perfectly acceptable for teacher-made tests (cf. Carr, 2011, p. 272).
Although each of the evaluation criteria rests on a sound theoretical basis, the question that arises is whether they are all equally rigorous in rejecting malfunctioning test items when applied to real data. In an attempt to answer this question, the next section compares the methods of MC item evaluation in terms of the number of items which (do not) meet the criteria defined above.
Practical application of the criteria
The evaluation criteria were applied to items piloted for a test of English as a foreign language (see Krzemińska-Adamek & Malec, to appear, for details). The main objective of the analyses was to select the
best-performing items (360) in terms of option performance from a total pool of 910 items (divided into 7 test forms of 130 items), to create three final tests, each consisting of 120 items. Each test followed the division into three sections: vocabulary, grammar and language functions. As far as the target language items are concerned, they were sampled from coursebooks used by students for whom the test was aimed. The coursebooks represented four different levels of proficiency: A1, A2, B1, B2.
The data for the analyses was collected from 2888 students (divided into 7 approximately equal groups of over 400 test takers) who shared the same characteristics as the target group (for whom the test was intended) in terms of age, amount of learning experience and level of proficiency in English. The groups of participants were assumed to be of roughly the same ability. The data collected in the course of test administration was additionally scrutinized for cases where participants displayed a tendency to choose the same answers throughout the test, apparently demonstrating a negative attitude to the test-taking event. When the number of answers A, B, or C submitted by a single test-taker exceeded 80% of all their responses, the scores from this participant were excluded from further analysis.
All the analyses were carried out in Excel. With the possibility of having user-defined formulas and conditional formatting, Excel is extremely flexible and very convenient for filtering out items which fail to meet a specific set of criteria. It is also easy to switch a given criterion on and off in order to see how many (and which) items do not satisfy it. In this way, the statistical methods can be compared to one another.
Analysis
When the evaluation criteria were applied to all the 910 items, as many as 574 items were rejected (and only 336 were accepted). The precise numbers of items which failed to meet the specific criteria are given in Figure 3.
The initial results of the analysis indicated that, when applied to real data, the preliminary evaluation criteria exhibited differential levels of stringency. However, the numbers in Figure 3 did not tell us anything about the unique contribution of each of the criteria. In other words, it was quite possible that, for example, among the 268 items rejected by the first
8
Practical Assessment, Research, and Evaluation, Vol. 25 [2020], Art. 7
https://scholarworks.umass.edu/pare/vol25/iss1/7

Page 9 Practical Assessment, Research & Evaluation, Vol 25 No 7 Malec & Krzemińska-Adamek, Evaluating MC Options
criterion there were some items which were also rejected by some other criteria. In order to ascertain whether the evaluation methods contributed to the overall number of rejections alone or in tandem, the data set was searched for items which did not fulfil a single criterion only. Table 5 summarizes the results of this stage of analysis. As can be seen, of the 574 unsatisfactory items, 273 were uniquely rejected by just one criterion, and the remaining 301 items did not satisfy multiple criteria.
Arguably the most interesting observation emerging from the numbers given in Table 5 is that the third criterion (chi-square test) stood in marked contrast to all the remaining ones. Its effect was so large as to render two of the criteria (PBDC and CM), to all intents and purposes, redundant. The peculiar strictness of the chi-square test as a selection criterion can be illustrated using an example from the data set analyzed. Specifically, Figure 4 shows two trace lines
for the incorrect options of one of the test items. These trace lines represent the following frequencies: 26, 24, 22, 16, 14 (Distractor 1) and 20, 19, 17, 14, 4 (Distractor 2). Both lines in Figure 4 look reasonably good for incorrect options as each of them has a noticeable downward slope. However, the results of the chi-square test (χ2(4) = 5.25, p = .262 for Distractor 1 and χ2(4) = 11.27, p = .024 for Distractor 2) indicated that only the second option was acceptable. By contrast, the point-biserial correlation coefficient was in either case sufficiently below the criterion level of −.10 (PBDC = −.31 for Distractor 1 and PBDC = −.34 for Distractor 2).
In view of the fact that the chi-square test was clearly too strict as a selection criterion, Krzemińska-Adamek and Malec (to appear) decided to remove it completely from the analysis. The number of items uniquely rejected by the remaining five criteria are given in Table 6.
Figure 3. Number of items rejected by the selection criteria
Table 5. Number of items uniquely rejected by the criteria
Criterion Total
PBC PBDC 2 CM DISLOW DISHIGH
Rejected items 11 0 248 0 10 4 273
9
Malec and Krzeminska-Adamek: Multiple-choice testing: Distractor evaluation and item selection
Published by ScholarWorks@UMass Amherst, 2020

Page 10 Practical Assessment, Research & Evaluation, Vol 25 No 7 Malec & Krzemińska-Adamek, Evaluating MC Options
Figure 4. Trace lines for two distractors from the study
Table 6. Number of items uniquely rejected by a set of five criteria
Criterion Total
PBC PBDC CM DISLOW DISHIGH
Rejected items 100 1 3 30 19 153
Table 7. Number of items uniquely rejected by the final evaluation criteria
Criterion Total
PBC PBDC DISLOW DISHIGH
Rejected items 73 27 25 19 144
Note: PBDC < −.15
In fact, two further modifications of the set of evaluation criteria may well be advisable. First, despite the removal of the chi-square test, the number of items uniquely rejected by PBDC and CM was still very low. On closer inspection, it became evident that these two criteria had a similar effect on the selection of acceptable items. Specifically, while 133 items failed PBDC and 139 items failed CM, as many as 129 items failed both criteria.
In light of this, the removal of one of these criteriashould not have a detrimental effect on item selection. Of these two criteria, PBDC is probably more worthy of retaining as its interpretation is analogous to that of PBC. The second modification that may be useful is to lower the threshold for PBDC to −.15, partly in order to compensate for the removal of the chi-square test as a selection criterion. This is supposed to ensure acceptable distractor
10
Practical Assessment, Research, and Evaluation, Vol. 25 [2020], Art. 7
https://scholarworks.umass.edu/pare/vol25/iss1/7

Page 11 Practical Assessment, Research & Evaluation, Vol 25 No 7 Malec & Krzemińska-Adamek, Evaluating MC Options
discrimination.2 The final evaluation criteria, with the number of items uniquely rejected by each, are presented in Table 7.
In the study by Krzemińska-Adamek and Malec (to appear), the application of the selection criteria given in Table 7 resulted in rejecting 345 items overall (201 items being rejected by multiple criteria), with 565 items remaining. The required 360 items were then selected for the final version of the test on the basis of item facility values.
General discussion and conclusions
The most elementary evaluation of the quality of MC questions involves inspecting their performance in terms of such indices as item facility and item discrimination. While this type of analysis is still widely applied in many assessment contexts, there are also other, more advanced procedures available, which allow the test developers to make more informed decisions regarding the treatment of malfunctioning items. The study reported in the present paper concentrated on comparing the effectiveness of those more detailed procedures of evaluating multiple-choice options (including the tabulation of choice distribution, the interpretation of trace lines, the point-biserial correlation, the categorical analysis of trace lines, and the investigation of choice means), and, as such, is believed to have provided valuable insights into practical issues related to pre-operational testing.
Concerning the specific observations made in the course of the study, the individual methods of MC analysis were found to be differentially useful depending on the testing situation. The analysis of trace lines, for example, which involves a considerable amount of visual inspection, can be successfully used in test development contexts featuring small data sets, or to provide the researcher or test designer with a preliminary appraisal of the performance of the options. In the case of larger data sets (such as those containing hundreds of test items), this method may be both ineffective and imprecise. In contrast, statistical methods can be considered more objective and
2 It should be noted that PBDC tends to be lower than the traditional point-biserial correlation for a distractor (PBD), as pointed out by Attali and Fraenkel (2000). Indeed, in the data set studied here, only 5 distractors (out of a total of 1820) had marginally higher PBDC than PBD. The remaining distractors had higher PBD and the average difference was .161. Thus, a PBDC above –.15 would roughly correspond to a positive PBD, which generally signals a lack of distractor discrimination.
unambiguous, as it is possible to set specific numerical criteria for rejecting or retaining the items, especially when the data set contains a considerable number of borderline cases. Furthermore, statistical methods can be implemented in, for example, Excel to facilitate the manipulation of the data in customized ways, including switching on and off various analysis options in order to compare and contrast their effects on the final results.
Secondly, the methods in question appeared to perform differently in terms of how rigorously they rejected the flawed items. The chi-square test was found to be the strictest method, and its application in the current study would have resulted in rejecting a considerable number of items, which were deemed well formed by the other methods. It can thus be concluded that the results of the chi-square test should be interpreted with caution, and that this specific method may not be particularly useful in contexts where small numbers of items are analyzed, bearing in mind the high rejection rate. A potentially useful observation was also made about the dependence of the results of the chi-square test on the type of observed frequency. Despite the fact that percentages tend to be commonly used in contingency tables, our study demonstrated that this may produce distorted (i.e. under- or over-estimated) chi-squares, and reliable results can only be obtained when raw frequencies are used.
As far as the point-biserial correlation is concerned, PBDC of Attali and Fraenkel (2000), comparing distractor and correct choices, was used in the study reported in this paper instead of a more traditional PBD, which is still often used (in language testing at least). The threshold for this statistic was lowered to −.15 to compensate for the removal of the chi-square method. It should be noted that the results of the point-biserial correlation coincided with those yielded by the investigation of choice means. From the point of view of test designer, this is a desirable situation in that convergent results obtained independently from two or more sources provide a
11
Malec and Krzeminska-Adamek: Multiple-choice testing: Distractor evaluation and item selection
Published by ScholarWorks@UMass Amherst, 2020

Page 12 Practical Assessment, Research & Evaluation, Vol 25 No 7 Malec & Krzemińska-Adamek, Evaluating MC Options
stronger rationale for rejecting or retaining test items. On the other hand, however, it is advisable that research studies be performed in the most parsimonious way possible, i.e. by employing as few instruments as necessary, with no negative influence on the final outcome. Bearing this in mind, if the contribution of any of the methods is particularly small, they may be considered redundant and removed from the analysis.
Finally, regardless of the number of methods used and the results they produce, it should also be remembered that quantitative analyses of items (including a scrutiny of MC option performance) should always be seen as secondary to qualitative analysis. This is to mean that the analysis of numerical data should be accompanied by a meticulous analysis of test content in search of problematic areas. The combined qualitative and quantitative analyses can guarantee that tests truly serve their designated purposes.
The study which is reported in this paper is not without its limitations. First, it focuses solely on methods of classical item analysis, to the exclusion of, for example, IRT. Second, the precise numerical values used as cut-points for rejecting or accepting MC items in our analysis may not apply equally well to other contexts, and should be reconsidered (or, for that matter, modified) in different testing situations. Thus, the points discussed in the theoretical part of the paper as well as the practical information reported in the study should be treated as guidelines rather than definitive, prescriptive rules.
Additionally, the items which underwent investigation in the current study contained three options. It can be speculated that if more options had been involved, the results of the above-described analyses would have been somewhat different. Quite obviously, the larger the number of MC options, the greater the probability of having malfunctioning distractors, as has been pointed out umpteen times in the literature.
The final limitation of the study is the fact that the 910 items under analysis were not all administered to the entire group of participants (2888), but each of the items was tested on a group of over 400 students. A larger group of participants taking the same tests could have resulted in obtaining even more reliable data. Despite this, however, it needs to be emphasized that
the entire group of students who participated in the study was rather homogeneous in terms of learning experience and educational background, hence the assumption that the students belonging to each of the seven groups that completed the seven test forms were characterized by the same level of foreign language ability.
All in all, we believe that the current investigation will encourage further studies in the field of pre-operational testing involving multiple-choice option evaluation. Moreover, the guidelines outlined in the theoretical part as well as the practical application of the statistical methods described in detail in the final part of the paper should be of use to both researchers, test designers and teachers engaged in the process of test development.
References
Alderson, J. C. (2000). Assessing Reading. Cambridge: Cambridge University Press.
Allan, A. (1992). Development and validation of a scale to measure test-wiseness in EFL/ESL reading test-takers. Language Testing, 9(2), 101–122.
Ansley, T. (1997). The role of standardized achievement tests in grades K-12. In G. D. Phye (Ed.), Handbook of Classroom Assessment: Learning, Achievement and Adjustment (pp. 265–285). San Diego, CA: Academic Press.
Attali, Y., & Fraenkel, T. (2000). The point-biserial as a discrimination index for distractors in multiple-choice items: Deficiencies in usage and an alternative. Journal of Educational Measurement, 37(1), 77–86.
Bachman, L. F. (2004). Statistical Analyses for Language Assessment. Cambridge: Cambridge University Press.
Bonk, W. J. (2001). Testing ESL learners’ knowledge of collocations. In T. Hudson & J. D. Brown (Eds.), A Focus on Language Test Development: Expanding the Language Proficiency Construct across a Variety of Tests (pp. 113–142). Honolulu: Second Language Teaching and Curriculum Center, University of Hawai’i at Mānoa.
Brown, J. D. (1996). Testing in Language Programs. Upper Saddle River, NJ: Prentice Hall Regents.
Brown, J. D. (2012). Classical test theory. In G. Fulcher & F. Davidson (Eds.), The Routledge Handbook of Language Testing (pp. 323–335). London and New York: Routledge.
12
Practical Assessment, Research, and Evaluation, Vol. 25 [2020], Art. 7
https://scholarworks.umass.edu/pare/vol25/iss1/7

Page 13 Practical Assessment, Research & Evaluation, Vol 25 No 7 Malec & Krzemińska-Adamek, Evaluating MC Options
Brown, J. D., & Hudson, T. (2002). Criterion-referenced Language Testing. Cambridge: Cambridge University Press.
Bruno, J. E., & Dirkzwager, A. (1995). Determining the optimal number of alternatives to a multiple-choice test item: An information theoretic perspective. Educational and Psychological Measurement, 55, 959–966.
Buck, G. (2001). Assessing Listening. Cambridge: Cambridge University Press.
Burdess, N. (2010). Starting Statistics: A Short, Clear Guide. London: SAGE.
Cantor, J. A. (1987). Developing multiple-choice test items. Training and Development Journal, 41(5), 85–88.
Carr, N. T. (2011). Designing and Analyzing Language Tests. Oxford: Oxford University Press.
Currie, M., & Chiramanee, T. (2010). The effect of the multiple-choice item format on the measurement of knowledge of language structure. Language Testing, 27(4), 471–491.
Ebel, R. L. (1954). Procedures for the analysis of classroom tests. Educational and Psychological Measurement, 14, 352–364.
Farhady, H. (2012). Principles of language assessment. In C. Coombe, P. Davidson, B. O’Sullivan, & S. Stoynoff (Eds.), The Cambridge Guide to Second Language Assessment (pp. 37–46). Cambridge: Cambridge University Press.
Fulcher, G. (2010). Practical Language Testing. London: Hodder Education.
Gravetter, F. J., & Wallnau, L. B. (2013). Statistics for the Behavioral Sciences (9th ed.). Belmont, CA: Wadsworth, Cengage Learning.
Haladyna, T. M. (2004). Developing and Validating Multiple-Choice Test Items (3rd ed.). Mahwah, NJ: Lawrence Erlbaum.
Haladyna, T. M. (2016). Item analysis for selected-response items. In S. Lane, M. R. Raymond, & T. M. Haladyna (Eds.), Handbook of Test Development (2nd ed., pp. 392–407). New York, NY: Routledge.
Haladyna, T. M., & Downing, S. M. (1989). A taxonomy of multiple-choice item-writing rules. Applied Measurement in Education, 1, 37–50.
Haladyna, T. M., Downing, S. M., & Rodriguez, M. C. (2002). A review of multiple-choice item-writing guidelines for classroom assessment. Applied Measurement in Education, 15, 309–334.
Haladyna, T. M., & Rodriguez, M. C. (2013). Developing and Validating Test Items. New York, NY: Routledge.
Haladyna, T. M., Rodriguez, M. C., & Stevens, C. (2019). Are multiple-choice items too fat? Applied Measurement in Education, 32(4), 350–364.
Holmes, J. D. (2016). Great Myths of Education and Learning. Hoboken, NJ: Wiley-Blackwell.
Hudson, T., Detmer, E., & Brown, J. D. (1995). Developing Prototypic Measures of Cross-cultural Pragmatics. Technical Report No. 7. Honolulu: Second Language Teaching and Curriculum Center, University of Hawai’i at Mānoa.
In’nami, Y., & Koizumi, R. (2009). A meta-analysis of test format effects on reading and listening test performance: Focus on multiple-choice and open-ended formats. Language Testing, 26(2), 219–244.
Ito, A. (2004). Two types of translation tests: Their reliability and validity. System, 32, 395–405.
Landrum, R. E., Cashin, J. R., & Theis, K. S. (1993). More evidence in favor of three-option multiple-choice tests. Educational and Psychological Measurement, 53, 771–778.
Malec, W. (2018). Developing Web-Based Language Tests. Lublin: Wydawnictwo KUL.
Nation, P., & Beglar, D. (2007). A vocabulary size test. The Language Teacher, 31(7), 9–13.
Niemierko, B. (1999). Pomiar wyników kształcenia. Warszawa: Wydawnictwa Szkolne i Pedagogiczne.
Parkes, J., & Zimmaro, D. (2016). Learning and Assessing with Multiple-Choice Questions in College Classrooms. New York, NY: Routledge.
Purpura, J. E. (2004). Assessing Grammar. Cambridge: Cambridge University Press.
Read, J. (2000). Assessing Vocabulary. Cambridge: Cambridge University Press.
Rodriguez, M. C. (2003). Construct equivalence of multiple-choice and constructed-response items: A random effects synthesis of correlations. Journal of Educational Measurement, 40(2), 163–184.
Rodriguez, M. C. (2005). Three options are optimal for multiple-choice items: A meta-analysis of 80 years of research. Educational Measurement: Issues and Practice, 24(2), 3–13.
Roediger, H. L., III, & Marsh, E. J. (2005). The positive and negative consequences of multiple-choice testing. Journal of Experimental Psychology: Learning, Memory & Cognition, 31(5), 1155–1159.
Shohamy, E. (1984). Does the testing method make a difference? The case of reading comprehension. Language Testing, 1, 147–170.
13
Malec and Krzeminska-Adamek: Multiple-choice testing: Distractor evaluation and item selection
Published by ScholarWorks@UMass Amherst, 2020

Page 14 Practical Assessment, Research & Evaluation, Vol 25 No 7 Malec & Krzemińska-Adamek, Evaluating MC Options
Trevisan, M. S., Sax, G., & Michael, W. B. (1994). Estimating the optimum number of options per item using an incremental option paradigm. Educational and Psychological Measurement, 54, 86–91.
Urdan, T. C. (2010). Statistics in Plain English (3rd ed.). New York, NY: Routledge.
Citation: Malec, W., and Krzemińska-Adamek, M. (2020). A practical comparison of selected methods of evaluating multiple-choice options through classical item analysis. Practical Assessment, Research & Evaluation, 25(7). Available online: https://scholarworks.umass.edu/pare/vol25/iss1/7/
Corresponding Author
Wojciech Malec Institute of Linguistics John Paul II Catholic University of Lublin Al. Racławickie 14, Lublin, Poland
email: wojciech.malec [at] kul.pl
14
Practical Assessment, Research, and Evaluation, Vol. 25 [2020], Art. 7
https://scholarworks.umass.edu/pare/vol25/iss1/7