Embed Size (px)
Citation preview

A portfolio approach to the development of differentiatedpurchasing strategiesGelderman, C.J.
DOI:10.6100/IR569453
Published: 01/01/2003
Document VersionPublisher’s PDF, also known as Version of Record (includes final page, issue and volume numbers)
Please check the document version of this publication:
• A submitted manuscript is the author's version of the article upon submission and before peer-review. There can be important differencesbetween the submitted version and the official published version of record. People interested in the research are advised to contact theauthor for the final version of the publication, or visit the DOI to the publisher's website.• The final author version and the galley proof are versions of the publication after peer review.• The final published version features the final layout of the paper including the volume, issue and page numbers.
Link to publication
General rightsCopyright and moral rights for the publications made accessible in the public portal are retained by the authors and/or other copyright ownersand it is a condition of accessing publications that users recognise and abide by the legal requirements associated with these rights.
• Users may download and print one copy of any publication from the public portal for the purpose of private study or research. • You may not further distribute the material or use it for any profit-making activity or commercial gain • You may freely distribute the URL identifying the publication in the public portal ?
Take down policyIf you believe that this document breaches copyright please contact us providing details, and we will remove access to the work immediatelyand investigate your claim.
Download date: 12. Jul. 2018

A Portfolio Approach to the Development of Differentiated Purchasing Strategies


A portfolio approach to the development of differentiated purchasing strategies
Cornelis Johannes Gelderman Eindhoven University of Technology
ISBN 90-386-1678-3 NUR 800 CIP-DATA LIBRARY TECHNISCHE UNIVERSITEIT EINDHOVEN Gelderman, Cornelis J. A portfolio approach to the development of differentiated purchasing strategies/ by Cornelis Johannes Gelderman. — Eindhoven: Technische Universiteit Eindhoven, 2003. — Proefschrift. — Key words: Purchasing/Purchasing strategy/Portfolio management/Supplier relations Printed by: Universiteits Drukkerij/Technische Universiteit Eindhoven Cover design: Paul Verspaget, UD/TU/e © 2003 C.J. Gelderman, Maastricht All rights reserved. No part of this publication may be reproduced, stored in or introduced into a retrieval system or transmitted, in any form, or by any means, electronic, mechanical, photocopying, recording or otherwise, without the prior permission of the author.

A Portfolio Approach to the Development of Differentiated Purchasing Strategies
Proefschrift
ter verkrijging van de graad van doctor aan de Technische Universiteit Eindhoven,
op gezag van de Rector Magnificus, prof.dr. R.A. van Santen, voor een commissie aangewezen door het College voor Promoties
in het openbaar te verdedigen op vrijdag 12 september 2003 om 16.00 uur
door
Cornelis Johannes Gelderman
geboren te Schiedam

Dit proefschrift is goedgekeurd door de promotoren:
prof.dr. A.J. van Weele en prof.dr. R.S.J. Tuninga

Contents
Acknowledgements 13 Chapter 1 Introduction to the study 15 1.1 Developments in purchasing management 15 1.2 Need for differentiation 18 1.3 The portfolio concept 20 1.4 From Pareto to Kraljic 22 1.5 Statement of the problem 25 1.6 Relevance of the stated problem 28 1.7 Methodology 29 1.8 Structure of the thesis 33 Chapter 2 Portfolio approaches in related disciplines 35 2.1 Investment theory: the roots of all portfolio management 35 2.1.1 The Markowitz model 35 2.1.2 Relevance for purchasing: what can we learn? 37 2.2 Portfolio models in strategic management 38
2.2.1 The BCG-approach 38 2.2.2 Assumptions, criticism and adoption 41 2.2.3 Other, multifactor portfolio models 43 2.2.4 Conclusions 46
2.3 Portfolio models in marketing management 48 2.3.1 New product portfolio models 48 2.3.2 Classifying products: from product
evaluation to product positioning 50 2.3.3 Classifying customers: from segmentation
to customer portfolios 52 2.3.4 Customer profitability models 54 2.3.5 Customer relationships models 57
2.3.6 Conclusions 59 2.4 Concluding remarks 61 Chapter 3 Portfolio approaches in purchasing management 63 3.1 The Kraljic portfolio approach 63 3.2 Discussion of the Kraljic approach 67
3.2.1 Dimensions 67 3.2.2 Categories 70 3.2.3 Strategic recommendations 71 3.2.4 Use issues 73

3.3 Elaboration of purchasing strategies for all categories 75 3.4 Supply positioning analysis 78 3.5 Cunningham’s interaction approach to portfolio analysis 82 3.6 The Olsen and Ellram approach 83
3.6.1 Description of the model 83 3.6.2 Discussion of Olsen and Ellram's model 86 3.7 Bensaou's specific investments approach 88
3.7.1 Description of the model 88 3.7.2 Discussion of Bensaou's model 91 3.8 Conclusions of the literature study: addressing
the research questions 93 3.8.1 Answers to the first research question:
differences and similarities 93 3.8.2 Elaboration of the second research question:
explaining the use of a portfolio approach 97 3.8.3 Elaboration of the third research question:
the practice of experienced professionals 103 3.8.4 Elaboration of the fifth research question:
power and dependence in the matri 104 Chapter 4 A power-dependence perspective 107 4.1 Rotating the Kraljic-matrix: new perspectives 107 4.2 Power and dependence in buyer-supplier relationships 110
4.2.1 Dependent: to be or not to be? 110 4.2.2 A resource perspective: RBV and RDT 113
4.2.3 Power: definitions and associations 115 4.2.4 Relative power and total interdependence 118 4.3 A mutual dependence-based purchasing portfolio model 120 4.4 Determinants of dependence 122 4.4.1 Conceptual studies to the determinants of dependence 123 4.4.2 Empirical studies to the determinants of dependence 126 4.4.3 Towards a conceptual model 128 4.5 Managing dependence 133 4.5.1 Resource dependence theory 133 4.5.2 Transaction cost theory 134 4.5.3 The Kraljic approach 135
4.5.4 Critical views on power-dependence strategies 137 4.5.5 Conclusions 140
4.6 Answers to and further elaboration of the fifth research question 141

Chapter 5 The cases studies 145 5.1 Methodology 145 5.2 DSM 148 5.2.1 Organization of purchasing 149 5.2.2 Purchasing and supply strategies 150 5.2.3 Purchasing portfolio analysis: dimensions,
measurement and use 153 5.2.4 Portfolio-based strategies 154 5.2.5 Conclusions 161 5.3 Akzo Nobel Coatings 162 5.3.1 Organization of purchasing 162 5.3.2 Purchasing and supply strategies 163 5.3.3 Purchasing portfolio analysis: dimensions,
measurement and use 164 5.3.4 Portfolio-based strategies 167 5.3.5 Conclusions 170 5.4 TE STRAKE - Engineering & Production 170 5.4.1 Organization of purchasing 171 5.4.2 Purchasing and supply strategies 172 5.4.3 Purchasing portfolio analysis: dimensions,
measurement and use 173 5.4.4 Portfolio-based strategies 175 5.4.5 Conclusions 177 5.5 Reactions to the dependence model 178 5.6 Answers to the third research question: comparison
of the case studies 180 5.6.1 Specific business context 181
5.6.2 Measurement and use 183 5.6.3 Strategic directions 187 5.7 Conclusions 194 Chapter 6 The survey 197 6.1 Introduction and objectives 197 6.2 The conceptual models 198 6.3 Relationship-dependence profiles: a condition-
seeking research strategy 200 6.4 Population and sample 202 6.5 Design and procedure 203 6.6 Measurement and operationalization 206
6.6.1 Variables and constructs in the use-model 207 6.6.2 Variables and constructs relating to buyer's
and supplier's dependence 208 6.6.3 Variables and constructs relating to other conditions 210
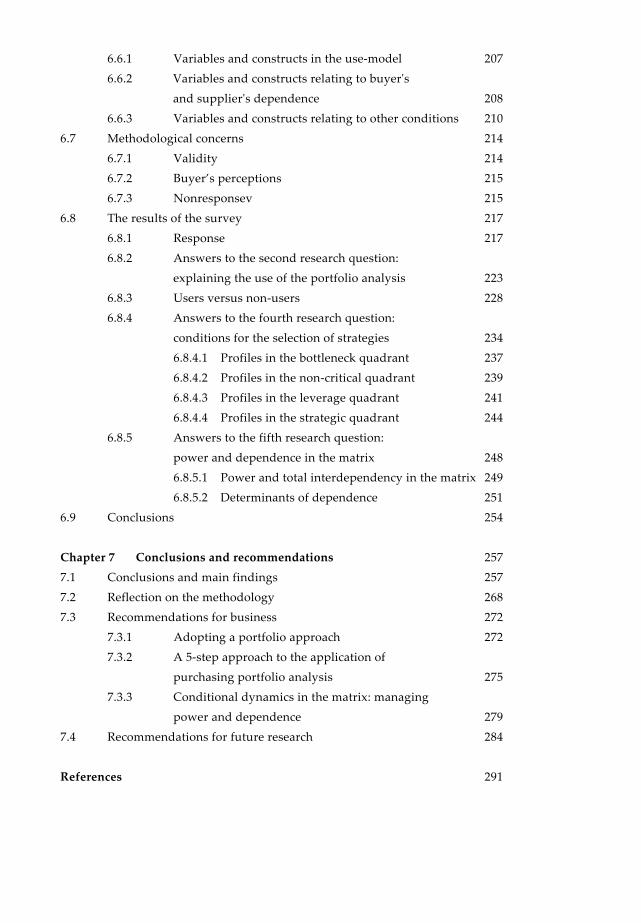
6.7 Methodological concerns 214 6.7.1 Validity 214 6.7.2 Buyer’s perceptions 215 6.7.3 Nonresponsev 215
6.8 The results of the survey 217 6.8.1 Response 217
6.8.2 Answers to the second research question: explaining the use of the portfolio analysis 223
6.8.3 Users versus non-users 228 6.8.4 Answers to the fourth research question:
conditions for the selection of strategies 234 6.8.4.1 Profiles in the bottleneck quadrant 237 6.8.4.2 Profiles in the non-critical quadrant 239 6.8.4.3 Profiles in the leverage quadrant 241 6.8.4.4 Profiles in the strategic quadrant 244
6.8.5 Answers to the fifth research question: power and dependence in the matrix 248
6.8.5.1 Power and total interdependency in the matrix 249 6.8.5.2 Determinants of dependence 251
6.9 Conclusions 254 Chapter 7 Conclusions and recommendations 257 7.1 Conclusions and main findings 257 7.2 Reflection on the methodology 268 7.3 Recommendations for business 272
7.3.1 Adopting a portfolio approach 272 7.3.2 A 5-step approach to the application of
purchasing portfolio analysis 275 7.3.3 Conditional dynamics in the matrix: managing
power and dependence 279 7.4 Recommendations for future research 284 References 291
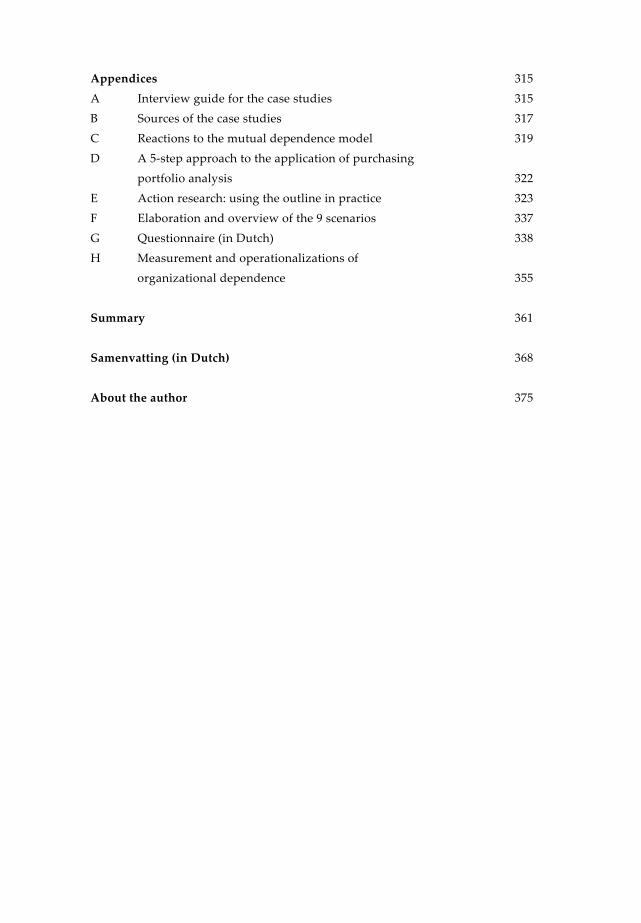
Appendices 315 A Interview guide for the case studies 315 B Sources of the case studies 317 C Reactions to the mutual dependence model 319 D A 5-step approach to the application of purchasing
portfolio analysis 322 E Action research: using the outline in practice 323 F Elaboration and overview of the 9 scenarios 337 G Questionnaire (in Dutch) 338 H Measurement and operationalizations of
organizational dependence 355 Summary 361 Samenvatting (in Dutch) 368 About the author 375


13
Acknowledgements
Over the past four years I have been in the fortunate position to conduct research in my favourite area: purchasing management. It was time for me to take the next step in my personal and intellectual development. I would like to thank everyone who has stimulated and supported me to initiate and complete this study. I wish to acknowledge the helpful contributions of many people and companies. First of all, I would like to thank professor Arjan van Weele for his indispensable encouragements and for his continuous inspiration. There is an old saying in negotiation: if you aim higher, you come out better. Behold, Arjan’s supervision in a nutshell. I enjoyed the freedom and responsibility he bestowed on me, to pursue the research my own way. In addition, Arjan acted as a gatekeeper, introducing me to many interesting purchasing academics and purchasing practitioners. I would like to thank Arjan for the many lessons and for his worldly wisdom. It was an honour and a privilege to be supervised by Arjan, one of the founding fathers of modern purchasing and supply chain management. Thank you, Arjan! Secondly, I wish to thank professor Ron Tuninga for expressing his confidence in me at the initial phase of the research project. During the project Ron was the ultimate stimulator, contributing his research expertise and infectious enthusiasm. Thank you, Ron! Also, I wish to thank professors Janjaap Semeijn and Martin Wetzels for their valuable contributions in the final stage of the research project. Furthermore, I would like to express my gratitude towards the research council (NRS) of the Dutch Association of Purchasing Management (NEVI) for their substantial support to this research project. In particular I would like to thank Arno de Schepper (chairman of NRS), Geert Brouwer (NRS), and Jan Willem van der Meer (chairman NEVI). A special thanks goes to Yvonne Peter and Ella Gelauf (both NEVI) for their aid and assistance in administering the initial and follow-up mailing. During the past four years many purchasing practitioners have invested valuable time and energy in sharing their experiences. I wish to thank Willem van Oppen (ex-DSM), Dick Bartelse (Akzo Nobel Coatings), and Wilfred van der Made (ex-Te Strake) for their roles as key informant in the case studies. The study to the practice of experienced practitioners would not have been possible without their friendly collaboration. Interviewing these purchasing experts has contributed significantly to my understanding of the possibilities of a portfolio approach in purchasing management. I have felt a deep

respect for these pioneers, their insights have proved to be invaluable for the entire research project. The survey procedure included a pilot test to pre-test the questionnaire by a limited number of respondents. I would like to thank the key informants of the pilot study for their efforts and friendly cooperation which contributed significantly to the success of the survey study: Marcel Roost (GTI), Edwin Noordman (ex-EMTEC), Fréderique van der Burg-van Baarle (DSM) and Bert van den Heuvel (Akzo Nobel). We have recognized that the questionnaire was extremely long, containing more than 175 questions. Therefore, I would like to thank all the respondents who were willing to complete my ‘absurd’ questionnaire. There are several fellow academics who supported me in various ways, providing inspiration, professional experience, and most of all friendship. In this respect I would like to thank Bé Albronda for his support in the early phases of the project, Luitzen de Boer for collaborating on our practitioner paper, Wim Braakman for his refreshing sense of perspective, Ivo de Loo and Frits Schreuder for their assistance with some of the statistical procedures, and Paul Ghijsen and Marjolein Caniëls for being the best colleagues one could ever wish for. A special mention to Søren Vammen, director of the Danish Purchasing & Logistics Forum, who invited me twice to submit a paper for publication in his journal. Thanks for your e-mail in which you asked me questions like ‘do you feel lucky – punk?’ In reply: yes, Søren, sometimes you have ‘made my day’. Sadly, it is not possible to share the excitement and the delight of taking my PhD with my parents, Cis and Wim. They would have been very proud of their son, as proud as parents could ever be. I thank them for their continuous support. Writing a dissertation is practically impossible without a supportive home base to fall back on. For that I am most grateful to my wife Catharina. She convinced me constantly that I was on the right track, making progress at a proper pace. And last but not least, I would like to thank Sander and Eline, our wonderful kids, for their infectious zest for life. Cees J. Gelderman Maastricht, April 2003
15
1 Introduction to the study
For long, purchasing was considered as a relatively unimportant clerical function in business. Not earlier than the latter half of the 20th century were there any indications that the importance of purchasing started to be recognized. Especially driven by the 1973 Oil crisis, top management started taking an interest in the importance of suppliers and supply management (e.g. Kraljic, 1983; Leenders and Fearon, 1993). Over the last 30 years, the role of purchasing has changed dramatically, from a clerical, administrative function into a strategic function that contributes to the competitive advantage of companies. This ‘revolution in purchasing’ has lead to tremendous changes in the scope, the impact and the responsibilities of purchasing management (Van Weele and Rozemeijer, 1996). Major developments in purchasing management all point at the importance of the management of supplier relationships. In accordance with an increased focus on relationship management, there is a growing acceptance and use of purchasing portfolio approaches, such as the Kraljic approach. Purchasing portfolio analysis had subsequently become “the dominant approach to what the profession regards as operational professionalism”, according to Cox (1997: 270). Boodie (1997) for instance reported a peak of 80% portfolio users in mass production companies. However, most publications on the portfolio approach are conceptual or anecdotal by nature. In contrast to an increased adoption, there is a lack of theoretical foundation and empirical evidence. This study addresses the gap between the lack of academic research into purchasing portfolio models and their growing adoption by practitioners.
1.1 Developments in purchasing management
A large body of research supports the idea that professional purchasing has changed in the last four decades. Several authors have forecasted and described changes for the purchasing role in companies. Reviewing all these contributions is beyond the scope of this introduction. There are studies to the history and evolution of: - the purchasing function (Syson, 1992; Monckza et al., 1998) - purchasing and supply management (Trent and Monckza, 1998) - strategic purchasing (Ellram and Carr, 1994) - purchasing positions (Pooley and Dunn, 1994). The act of purchasing can be considered as one of the oldest basic types of human behavior. Webster’s Third New International Dictionary (1993: 1844) defines ‘to purchase’ as “to get into one’s possession by paying money or its equivalent”. In a

16
business context, purchasing activities are indispensable for any company. However, it was not until the end of the Early Years of purchasing history (1850-1900) that Purchasing started to be organized as separate corporate functions (Monckza et al., 1998). For long purchasing was looked upon primarily as an administrative clerical function. The American Management Association for instance, recommended in 1931 that the model purchase department should address the following aspects: administration, ordering, payments, accounting, inspection, and salvage (Syson, 1992). Purchasing gained importance during times of scarcity in the Twentieth Century, emphasizing the need for obtaining the required materials. The purchasing function was seen as a part of the umbrella of materials management. The scope of purchasing activities was limited to meet the needs of the manufacturing function or other internal function for which it was buying. It was not the responsibility of purchasing to question those needs, forge long term relationships with suppliers, or to understand the needs of the end customer (Ellram, 1998). The field of purchasing has evolved significantly over the past 30 years. More and more it is expected that a purchasing department could and should contribute to a firm’s efficiency and competitiveness. Just-in-time management entered western industry, providing a completely new view on the role and management of suppliers. The need for flexibility and customization has promoted component and modular sourcing (Syson, 1992). The outsourcing trend, focussing on core activities and core competences, has added to the increasing importance of a competitive supply base management. Suppliers are considered as critical sources of product and process technology. The pressure to innovate, by including the latest technology in product designs, makes supplier contribution increasingly vital (Trent and Monczka, 1998). Tully (1995: 46) described “purchasing’s new muscle” in terms of leveraging buying power (centralized buying), but especially in terms of forming enduring partnerships with suppliers. A new type purchasers “show they can add millions to the bottom line”. In the nineties there is much support for the idea of shifting from a traditional antagonistic approach towards a more collaborative approach of suppliers (Matthyssens and Van den Bulte, 1994). Partnerships sourcing is said to be superior to adversarial competition, because it leads to long-term collaboration based on trust (MacBeth and Ferguson, 1994). Partnership Sourcing Ltd., the U.K. body explicitly promotes the idea of ‘partnership sourcing’: “…where customer and supplier develop such a close relationship that the two work together as partners. (…) Partnership sourcing will lead to a win-win situation, because both partners have an interest in each other’s success”. The management of relationships across the supply chain is increasingly being referred to as supply chain management (Lambert and Cooper, 2000). Supply chain analysis is closely related to network analysis, structuring inter-organizational relationships (Lazzarini et al., 2001). The emphasis on interorganizational relationships and their embeddedness in

A Portfolio Approach to the Development of Differentiated Purchasing Strategies
17
networks has its roots in the work of a group of mainly European researchers in the area of industrial marketing and purchasing, the IMP Group (Håkansson, 1982). Obviously, partnership sourcing is only one concept creating change in purchasing (McIvor and McHugh, 2000). Extensive change is also created by lean production (Womack et al., 1990), lean supply (Lamming, 1993), buyer-supplier process integration (Christopher et al., 1992), early supplier involvement (Håkansson and Erikkson, 1993), outsourcing (Quinn and Hilmer, 1994), supply base reduction (Homburg, 1995), total cost management (Ellram, 1996), supplier development (Hahn et al., 1990; Krause and Ellram, 1997), cross functional teams (Maltz and Ellram, 1999), supply base rationalization (Cousins, 1999), corporate advantage in purchasing (Rozemeijer, 2000), supply chain management (Lambert and Cooper, 2000), supply chain integration (Frohlich and Westbrook, 2001), and e-procurement (Neef, 2001; Essig and Arnold, 2001). Nowadays, there is a growing consensus that purchasing is an important contributor to a firm’s competitive advantage. Carter and Narasimhan (1996) posited that the purchasing function has a strategic impact on the firm, contributing to both the overall corporate performance and the performance of other functions. In their words: “Purchasing is indeed strategic”. An appropriate sourcing strategy can contribute significantly to profitability, market share, and technological innovation (Hartmann et al., 2001). According to Monczka et al. (1998) there are three major benefits that can be achieved by a stronger focus on purchasing: (1) cost savings, (2) impact on quality, and (3) contribution to technology development and improvement of product and process designs. Cost-reduction programs should result in cost reduction and/or cost avoidance (Ellram, 1998). In general, there will be more possibilities for cost reduction for companies with relatively high purchasing cost. In manufacturing industries the value of purchases is significantly higher than in the service sector (Ellram, 1998). In the automotive and electronic industries, typically between 60% and 80% of the product value has been outsourced to suppliers (Schary and Skjøtt-Larsen, 2001). Mol et al. (2001) documented the main trend in the Netherlands over the 1990’s to source more from external suppliers. While process-based industries increased external sourcing only slightly, the OEM industries, like electronics, vehicles and machinery, strongly increased their dependence on external suppliers. The rising share of purchasing cost indicates a natural area for potential cost savings. Purchasing has an important impact on quality too, since companies concentrate more on their core competences (Prahald and Hamel, 1990). Shortened life cycles and global competition are making business too complex and expensive for one firm to go it alone (Ellram, 1998). The need to concentrate on core competences has lead to an increased emphasis on outsourcing (Venkatesan, 1992), which at the same time increased the supplier’s influence on quality.
18
Managing supplier relations is increasingly considered as a strategically important activity for the firm (Mol, 2002). Moreover, the management of the supply chain has become one of the key issues for many companies. The increased need for buyer-supplier integration is provoked by end markets that require reduced development and delivery times. Caglinano et al. (2002) clearly distinguished two different dimensions of buyer-supplier integration: technological integration and operational integration. Technological integration refers to collaboration in designing and developing new products. Many firms realize that early supplier involvement in new product development is beneficial with regard to the costs and the quality of new products. Early supplier involvement can reduce development times, which can be crucial for getting to the market quickly. Consequently, more and more suppliers are becoming involved in their customer’s development projects (e.g. Wynstra and Ten Pierick, 2000). The supplier thus becomes a strategic resource in the design process. Operational integration instead refers to activities such as planning, production and delivery. There is a wide set of techniques that can be traced back to the principles of Just-In-Time management, obtaining operational and logistical integration between customers and suppliers (e.g. Lamming, 1993). In competitive end markets, companies are pressed for short and reliable production and delivery schedules (fulfillment), which implies the disposal of a lean and flexible supplier network. As a consequence of the reduced times allowed by end-markets there is an increased need for supply chain integration. The reduction of the number of suppliers can be necessary in light of the logistical complexity and customer’s demands. Purchasing should develop and maintain a world class supplier network, since a firm’s ability to compete on its end markets is considerably influenced by its suppliers’ capabilities (e.g. Hahn et al., 1990).) To conclude, purchasing’s new role is to contribute to supplier development and relationship management, identifying, developing and managing new and existing suppliers. Purchasers can focus their efforts on managing suppliers as opposed to placing orders and expediting (Lambert and Cooper, 2000). In theory there are many different types of buyer-supplier relationships. In practice companies need a variety of relationships, each providing its different benefits. Purchasing professionals should have the capacity to cope with a variety of relationships, to be handled in differentiated ways. Purchasing portfolio analysis is considered as a particularly useful tool, developing and selecting differentiated purchasing and supplier strategies.
1.2 Need for differentiation
Matthyssens and Van den Bulte (1994) observed a general shift in organizational buying behavior, from an antagonistic mode to a more co-operative mode. Since the nineties, long term collaborative relationships with suppliers are generally considered to be the (next) source of competitive advantage. Then again, there are critical remarks too,

A Portfolio Approach to the Development of Differentiated Purchasing Strategies
19
referring to the ‘myth of partnership’ (Van Weele, 2001: 164) and the ‘case against partnerships’ (Ramsay, 1996a:13). A partnership is the result of continuous effort on both sides, it is not a technique which can be adapted. This could explain the rather small number of really successful partnerships (Van Weele, 2001). Ramsay (1996a) suggested that partnerships are frequently only appropriate for a minority of a company’s purchases and that it is arguable that partnerships are only advisable for very large companies. Lamming (1993: 238) and Lamming and Harrison (2001: 597) have observed that in practice “the so-called partnership often relies on customer dominance”. Competitive relationships do not necessarily involve lower trust and adversarial behavior, according to Parker and Hartley (1997). ‘Competition’ may be more effective than ‘cooperation’ in many buyer-supplier relationships (Forker and Stannack, 2000). It can be argued that companies should pursue both competitive and cooperative strategies simultaneously (Cox, 1995; Lado et al.,1997; Parker and Hartley, 1997). The main point here is that a firm should develop long-term relationships with a relatively small group of key suppliers, not with all suppliers. Nowadays, there is a strong believe and a general consensus that world class purchasing includes building and sustaining strategic partnerships with superior suppliers. This conclusion is supported by a number of empirical studies comparing Japanese business practices to those of the rest of the world (see for instance Cusmano and Takeishi, 1991; Dyer and Ouchi, 1993; Helper and Sako, 1995). Dyer (1996) found empirical evidence for a positive relationship between interfirm specialization and performance in the Japanese and the American auto industry. A conclusion might be that Japanese firms manage their suppliers primarily by partnerships, in contrast with their American colleagues. Contrary to this belief, Bensaou (1999) empirically showed that in the auto industry Japanese firms conduct their business with a smaller ratio of strategic partnerships (19 percent) and make extensive use of market exchange (31 percent). Similarly, some 25 percent of U.S. automakers engage in market exchange, and another 25 percent have developed mutually committed relationships. Strategic partnerships create new value, however they are costly to develop, nurture and maintain. In addition they are risky, given the specialized investments they require. Moreover, benefits from a relationship could decrease over time. The relationship benefits may peak when both parties are working on new solutions, but diminish once the new solution has been put into place (Christopher and Jüttner, 2000). Companies need a variety of relationships, each providing its different benefits, where no general ‘best’ type of relationship exists (e.g. Young and Wilkinson, 1997; Gadde and Snehota, 2000). Axelsson et al. (2002) have stated that much of the debate in the area of purchasing and supply management has focused on two opposite purchasing approaches: transaction-oriented and relationship-oriented behavior. However, the authors emphasized that the two approaches are complementary: a firm can adopt different approaches for different suppliers. This underlines the proposition that
20
differentiation is needed in managing supplier relationships. Relationships require different mixes of cooperation and competition. From a supply chain perspective Hines et al. (2000) described seven types of value: customer responsiveness, timely supply, high quality goods and services, efficient operating processes, lower prices, impact on profit and highly innovative. The management of supplier relationships should be tailored to those values that are in line with the overall business value strategy (Treacy and Wiersema, 1993). The outcomes of relationships may range from cost savings through joint product development. Once the focus (output) is decided, the appropriate relationship can be developed (Cousins, 2002). Obviously, not all suppliers are to be dealt with in the same way. This places purchasing managers for the task of developing and executing a set of differentiated supplier strategies. The need for differentiated supplier strategies requires some sort of classification (Lilliecreutz and Ydreskog, 1999). Therefore, in advance a portfolio model for supplier relationships appears beforehand to be a useful tool. Effective purchasing and supply management requires the selection of strategies that are appropriate to the prevailing circumstances.
1.3 The portfolio concept
A portfolio refers to a collection of different but connected items. The items may be objects or subjects. In general, the portfolio concept focuses on the interdependencies among management decisions and emphasizes an integrated approach (Turnbull, 1990). The portfolio concept stresses the importance of the whole rather than the parts. It reflects the importance for balance in a collection of individual elements. As a consequence, it allows for differentiation and diversification, in our aim for balance and an optimal use of limited resources. The portfolio concept has its roots in financial investment in the 1950s. For business purposes, portfolio approaches have been developed for applications in investment theory, strategic management, marketing, and purchasing management. Nowadays, portfolio thinking, including different kinds of portfolios, is enjoying an increased popularity. For instance, Donaldson (2000) proposed an organizational portfolio theory which treats the organization as a portfolio of causes of organizational performance; Kirchhof et al. (2001) and Graves et al. (2000) discussed some models for the management of R&D portfolios; Archer and Ghasemzadeh (1999) discussed a framework for project portfolio selection, and McLagan (2000) promoted personal portfolio management, mixing and managing the outputs and competences of employees. When limited to more main stream practices, portfolio theory is essentially concerned with the collective returns from the use of assets together with their possible redistribution over various options at the discretion of management. How ‘assets’, ‘returns’ and ‘options’ are defined depends on the area of application (Yorke, 1984: 9). In this study we define a portfolio as:

A Portfolio Approach to the Development of Differentiated Purchasing Strategies
21
‘a collection of different items, objects or subjects that are connected to each other’ Portfolio methods are widely taught and widely used by consultants and decision makers. There is a broad consensus that portfolio models should be used with an understanding of their limitations and perhaps in combination with other tools (Olsen and Ellram, 1997). In much literature matrix portfolio methods are viewed as a useful starting point for (strategic) analysis. Still, many practitioners and researchers have strong reservations about the use of and the premises behind portfolio methods. They point out that there is a general lack of theoretical and empirical support for these techniques. Not many authors would go as far as Armstrong and Brodie (1994: 84) who concluded that: “Until contrary evidence is produced, we advise against using matrix methods under all circumstances.” On the contrary, there is a general feeling that portfolio methods form a useful tool for various management decisions. At this point we would like to stress that any criticism of a technique should not be that it simplifies but rather that it focuses on unimportant factors. After all, the logic for (portfolio) techniques is in the first place that it constitutes a tool for management so that complex problems can be simplified and solved in an acceptable way. Coate (1983) concluded that the usefulness of any strategy generated by a portfolio model, depends critically on the validity of the assumptions. Wensley (1994) posed two main questions for evaluating management tools: 1. To what extent is the approach based on assumptions which themselves are empirically valid? 2. To what extent does the approach help to improve the quality of decision-making? Portfolio approaches are used for management problems in various fields and disciplines. All portfolio models have their roots in investment theory. The work of Markowitz in the early 1950s is the origin of modern portfolio theory for investment purposes. Balancing the objectives of high yield and low risk, the portfolio approach focuses on the efficient allocation of limited resources. In the 1970s and 1980s a great number of portfolio models were developed in other areas of business administration, notably strategic management and marketing management. In business administration a portfolio approach is a way of looking at and dealing with (management) problems by focussing on a small number of important factors. The basic idea is the simplification of a complex problem. In this study we define a portfolio model as: ‘a tool that combines two or more dimensions into a set of heterogeneous categories for which different (strategic) recommendations are provided’.

22
Three basic elements are to be recognized in this definition: (1) dimensions, (2) categories, and (3) strategic recommendations. The use of portfolio model implies the classification of objects/subjects, usually presented in the form of a two dimensional matrix. The basic idea is that the positions of the units on the grid or in the matrix should determine the formulation of the most appropriate strategy (Yorke and Droussiotis, 1994). However, models and tools that do not provide guidance for management decisions are merely classification schemes, not portfolio models. In purchasing, classification tools can be seen as the predecessors of the actual portfolio models.
1.4 From Pareto to Kraljic
Organizations usually have to deal with a large number of products and a variety of suppliers, to be treated in different ways. For long, the ABC-analysis (or Pareto-analysis) was the only tool for differentiating between important and less important purchases. In a Pareto-curve items are classified according to the cumulative number of purchasing orders and their cumulative value. The A-category contains 20% of the numbers of orders, which typically accounts for 80% of the total value. The B-category, the next category of 30% of the items accounts for less than 20% of the spending. The remaining 50% of the items accounts for less than 2% of the total spend (C-category). The ABC-analysis is considered to be helpful in situations where the majority of purchase spend is caused by only a few material categories (Corsten, 1996). Another volume characteristic is the number of parts, which is especially important in discrete production. Instead of a volume-dimension, it is also possible to use the cumulative number of suppliers. This classification differentiates suppliers with significant spend from the mass of suppliers with only small purchase volume (Hartmann et al., 2001). The ABC-analysis concentrates on the financial value of items. It ignores the cost of poor quality (Burt, 1989), performance risk, social risk and other components (Hartmann et al., 2001). In addition, ABC analysis fails to discriminate between the methods which should be used to obtain different item categories (Steele and Court, 1996). The ABC-analysis does not provide strategic recommendations for the categories, but it provides information on the concentration of purchase spend. It is a classification tool, not a portfolio model. The commodity analysis is another example of a classification tool in purchasing. A commodity analysis divides the total purchasing volume in percentages for all combinations of ‘product groups’ and ‘principal users’. It reveals key users and the commodities that are most important to them (Bauer, 1977). Commodity analysis identifies critical procurement areas, it is helpful for setting priorities, and it provides recommendations with respect to the organization of purchasing (assignment of responsibilities and centralized or decentralized purchasing). Just as the ABC-analysis, the commodity analysis should be classified as a classification tool, since it does not

A Portfolio Approach to the Development of Differentiated Purchasing Strategies
23
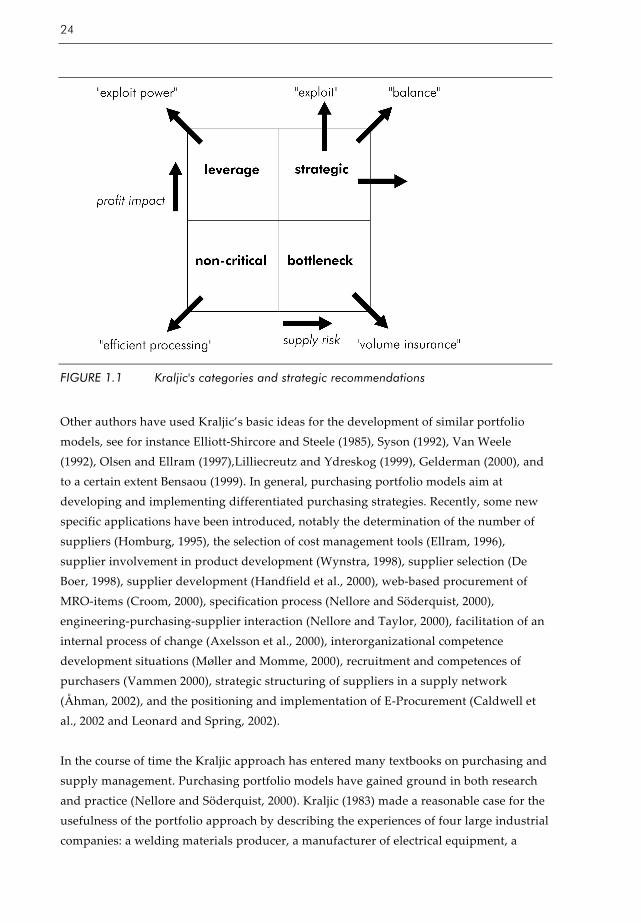
provide (differentiated) purchasing and supplier strategies. They are both examples of a spend analysis which is limited to the classification of items and suppliers according to their financial value. Kraljic (1977, 1983) introduced the first comprehensive portfolio approach for the use in purchasing and supply management. Some twenty years ago he advised managers to guard their firms against disastrous supply interruptions and to cope with changing economics and new technologies. His message was that ‘purchasing must become supply management’. In this context Kraljic (1977, 1983) developed a convenient portfolio approach for the determination of a comprehensive strategy for supply. Kraljic’s approach includes the construction of two portfolio matrices. The fist matrix engages a classification of products on the basis of two dimensions: profit impact and supply risk. Each variable has two possible values: ‘low’ and ‘high’. The result is a 2x2 matrix and a classification in four categories (see also figure 1.1): Categories Values Main tasks/strategies
strategic items
high on both dimensions diversify, balance, or exploit
bottleneck items
low profit impact, high supply risk volume assurance
leverage items
high profit impact, low supply risk exploitation of purchasing power
non-critical items
low on both dimensions efficient processing
A second matrix is used for the strategic items. This matrix shows the relative power position of the company in the corresponding supply markets. Three general purchasing strategies are determined, depending on the balance of power in the buyer/seller relationship: exploit (in case of buyer dominance), balance (in case of a balanced relationship), and diversify (in case of supplier dominance). Kraljic’s approach elaborates and focuses on the strategic items. For the other item categories Kraljic merely formulated a number of ‘main tasks’. Kempeners and Van Weele (1997) have emphasized that the upper-left area of the (first) Kraljic matrix refers to a buyer-dominated segment, while the lower-right area corresponds to a supplier-dominated segment. The balance of power obviously is a key issue for the classification of items in the Kraljic framework and for the selection of differentiated strategies.
24
FIGURE 1.1 Kraljic's categories and strategic recommendations
Other authors have used Kraljic’s basic ideas for the development of similar portfolio models, see for instance Elliott-Shircore and Steele (1985), Syson (1992), Van Weele (1992), Olsen and Ellram (1997),Lilliecreutz and Ydreskog (1999), Gelderman (2000), and to a certain extent Bensaou (1999). In general, purchasing portfolio models aim at developing and implementing differentiated purchasing strategies. Recently, some new specific applications have been introduced, notably the determination of the number of suppliers (Homburg, 1995), the selection of cost management tools (Ellram, 1996), supplier involvement in product development (Wynstra, 1998), supplier selection (De Boer, 1998), supplier development (Handfield et al., 2000), web-based procurement of MRO-items (Croom, 2000), specification process (Nellore and Söderquist, 2000), engineering-purchasing-supplier interaction (Nellore and Taylor, 2000), facilitation of an internal process of change (Axelsson et al., 2000), interorganizational competence development situations (Møller and Momme, 2000), recruitment and competences of purchasers (Vammen 2000), strategic structuring of suppliers in a supply network (Åhman, 2002), and the positioning and implementation of E-Procurement (Caldwell et al., 2002 and Leonard and Spring, 2002). In the course of time the Kraljic approach has entered many textbooks on purchasing and supply management. Purchasing portfolio models have gained ground in both research and practice (Nellore and Söderquist, 2000). Kraljic (1983) made a reasonable case for the usefulness of the portfolio approach by describing the experiences of four large industrial companies: a welding materials producer, a manufacturer of electrical equipment, a

A Portfolio Approach to the Development of Differentiated Purchasing Strategies
25
chemical company and a heavy-equipment maker. Now, many years later the purchasing portfolio approach is being used by several other large companies, such as Shell, Alcatel, Philips, DSM, and Siemens (e.g. Van Weele, 2000). Especially in Western Europe Kraljic has received large-scale recognition and has gained an increasing degree of adoption. Gradually Kraljic has gained acceptance in other countries, notably in the USA, Canada and Northern Europe. The Kraljic portfolio approach can be considered as an important breakthrough in the development of theory in the field of purchasing and supply management. Syson (1992) characterized it as a powerful tool, to be used for diagnostic and prescriptive purposes, and that goes far beyond the well-known, rather simplistic ABC-analysis. For long Kraljic’s model was the only available purchasing portfolio model. In the late nineties, portfolio models received more attention in professional and academic publications. In general there is a growing interest in the possibilities of portfolio models in purchasing and supply management.
1.5 Statement of the problem
We have observed a growing acceptance and utilization of purchasing portfolio models, especially Kraljic’s approach. However, some unanswered questions remain. For instance, the choice of dimensions is to a certain extent plausible, but it is not clear why these dimensions are appropriate and how they might be related to a more comprehensive theory. What might be the theoretical foundations supporting the choice of dimensions? In general, decisions based on portfolio models are proven to be sensitive to the choice of dimensions, factors, and weights. Day (1986) concluded that measurement is considered to be the Achilles’ heel for all portfolio models. What is exactly meant by ‘profit impact’ and ‘supply risk’? How could or should we measure them in practice? Theory does not provide prescriptions or procedures for measurement, leading Ramsay (1996a: 15) to conclude that these concepts are “actually made up of a number of nebulous concepts without operational dimensions”. Olsen and Ellram (1997) emphasized that the weighting of each factor is the most important part of the implementation process, but at the same time very subjective. The decision-makers must come to an agreement on the relative importance of each factor. Besides, what is the exact distinction between ‘a high’ and ‘a low’ supply risk? If we have problems discriminating between categories, than the classification of products will be arbitrary and so will be the provided recommendations. Homburg (1995) for instance concluded that recommendations should be applied with reserve, especially if a product is positioned near a demarcation line. De Boer (1997) suggested a fully customized approach: organizations should determine their own criteria as well as their own specific threshold values. But, perhaps more importantly, how do purchasing professionals handle such

26
issues in practice? In general, what could we learn from their experience? Little is known about the actual use of portfolio models in purchasing. Most publications are conceptual or anecdotal by nature. Leonard and Spring (2002) concluded that there is a need for research on the way in which managers actually use portfolio models, how they are operationalized in complex organizations, and on the political process within organizations where the classification takes place. More questions arise. How useful is a portfolio approach? What measures of success should be used in the evaluation of a purchasing portfolio approach? How many firms actually use portfolio techniques and for what reasons? Are they using the Kraljic approach or are other models used or developed in practice? Does the portfolio approach take into account the possible strategies and strategic intentions of the supplier? What company-specific factors will influence the management of the company’s relationships? Olsen and Ellram (1997) suggested that future research should include case studies to capture important aspects of the implementation process. To conclude, in contrast with the increased adoption of purchasing portfolio models, there are many unanswered questions. There is a lack of knowledge with respect to a number of issues, such as the actual use (frequency and implementation), theoretical foundations, empirical evidence and empirical testing. This brings us to the research objectives and the research questions. The objectives of this research project are to gain a better understanding of: - the theoretical and conceptual foundations of purchasing portfolio models, - the actual use of purchasing portfolio models in practice, and - how they could be used by purchasing professionals in order to pursue differentiated purchasing strategies. These research objectives imply a conceptual study of the various portfolio models in combination with an empirical study of practical experiences with portfolio approaches in purchasing. The research objectives are elaborated in five major research questions, which are: 1) What are the differences and similarities between the various purchasing portfolio models? Portfolio models are generally used for decisions with respect to the allocation of limited resources. These models are developed in various fields and disciplines, such as investment theory, strategic management and marketing management. This study also includes a discussion and a review of portfolio models in related business disciplines, drawing from areas with a longer experience in the use of such models.

A Portfolio Approach to the Development of Differentiated Purchasing Strategies
27
Kraljic (1983) introduced the first comprehensive portfolio approach in purchasing which is still the dominant approach in the profession. Since then, some variations of the Kraljic approach have been introduced, building more or less on the points of departure of the original model. This study will investigate the various portfolio models in purchasing, identifying differences and similarities. According to the three basic elements of any portfolio model, the portfolio approaches in purchasing will be discussed and evaluated on (1) dimensions, (2) categories, and (3) strategic recommendations. In addition, a comparison will be made on (4) use issues (acceptance and adoption). 2) Which factors would explain the utilization of the purchasing portfolio analysis? A number of sources has reported on the adoption and growing utilization of the portfolio analysis in practice (for instance Van Weele, 1997; Cox, 1997; Boodie, 1997, and more recently Kamann, 2000; and Lamming and Harrison, 2001). In advance it seems that the popularity of the portfolio tool has to do with the attractive visual display, the convenient classification of items and the face validity of the strategic recommendations. However, little is known about the actual use of the portfolio analysis, including number of users, use intensity, reasons for (non)use, perceived (dis)advantages, satisfaction and attributed results. The second research question of this study refers to possible explanations of the utilization of the portfolio analysis. Based on literature study a number of sub-questions will be formulated and elaborated. A use model will be specified, including variables to explain the actual use of a purchasing portfolio approach. The results of the survey will be used for quantifying variables and relationships, and for testing hypotheses. 3) How are portfolio models employed by experienced purchasing professionals? As stated earlier, little is known about the actual use of purchasing portfolio models. There are unanswered questions, addressing measurement issues and strategic issues. How do experienced professionals handle such issues in practice? What could we learn from their experience? These tentative questions will be elaborated and articulated during the research project, including theoretical and empirical findings. The literature study will not result in final answers to these questions, because most publications are conceptual or anecdotal by nature. Therefore, an exploratory field study is needed to address the gap between conceptual problems and practical solutions, identifying and describing advanced uses of a purchasing portfolio approach. 4) Under which conditions are the various portfolio-based strategies selected in purchasing management?

28
We would like to gain more insights in the possibilities for selecting and developing a set of differentiated purchasing strategies, based on a portfolio approach. Which factors would explain the selection of different strategic choices? Answering research question 3 will lead to an overview of portfolio-based strategies for purchasing management. The fourth research question is directed towards the conditions that produce the selection of a certain portfolio-based strategy. Under which conditions are the various strategies selected? The possibilities for selecting purchasing strategies are obviously limited by external conditions, for instance by conditions regarding mutual dependence and the power of balance. For the explanation of strategic choices we will focus on the determinants of (buyer and supplier) dependence and other relationship conditions, producing different strategic choices. 5) What is the role of power and dependence in the Kraljic approach? It can be argued that power and dependence are very important in understanding buyer/supplier relationships. However, the Kraljic approach does not explicitly deal with issues of power and dependence. Some of the recommendations obviously refer to the power structure (‘exploit power’), others do not. Some are aimed at reducing the dependence on suppliers (‘diversify’), others are not. In addition, the recommendations for the strategic items are largely determined by the balance of power, while it is not clear in what way the dimensions ‘profit impact’ and ‘supply risk’ are related to the relative power position of the buying company. At the same time Kraljic (1983: 112) posited that the general idea of the portfolio approach is to “minimize supply vulnerability and make the most of potential buying power”. To conclude, power and dependence do play a significant part in the Kraljic approach, although in an unclear way.
1.6 Relevance of the stated problem
In the last two decades there has been a strong development of professional purchasing in many organizations. Many new methods and concepts have been developed in the field of purchasing and supply chain management (Van Weele et al., 1998). Purchasing portfolio management is one of them. Organizations are increasingly using portfolio approaches in purchasing. Purchasing professionals tend to use the Kraljic portfolio model or similar approaches as a tool for classifying their products and for formulating differentiated purchasing strategies. As we have observed, little is known about the actual use of portfolio models in practice. Despite their weak theoretical and empirical foundations, portfolio models do lead to prescriptions or strategic recommendations. There are some unanswered questions with respect to the measurement of dimensions and factors, and the nature of strategic recommendations.
A Portfolio Approach to the Development of Differentiated Purchasing Strategies
29
This research project aims at a significant relevance for business as well as for science. With the results of this research project the management of companies should have a better understanding of the possibilities and limitations of purchasing portfolio approaches. Insights will be gained in the actual use in practice. Purchasing management tools, such as guidelines and checklists, can be derived from the results of the research project. Practitioners may benefit from this study, finding indications for a more advanced utilization of a portfolio approach in purchasing management. The popularity of portfolio approaches can be explained by their relative ease of use and the straightforward strategic recommendations with a high face validity. The strategic options all seem very logical. But, from a scientific point of view, the models, the choice of dimensions and the recommendations lack theoretical and empirical foundation. In general little research has been conducted with respect to purchasing portfolio models. In addition, most studies are conceptual by nature, pointing out different factors and approaches which are in affect variations of the original Kraljic-matrix. The lack of proven knowledge is problematic since portfolio models are increasingly adopted by purchasing practitioners. This research project attempts to respond to these omissions and give more insights into the usefulness and possibilities of purchasing portfolio models.
1.7 Methodology
Three major research methods are successively being used in this research project: an extensive literature study, a series of explorative case studies, and a large scale survey. The literature study covers three areas: portfolio models in related business disciplines (1), portfolio models in purchasing management (2), and power and dependence in buyer/supplier relationships (3). Each research method has its own characteristics and its own strong points, which make it more appropriate for answering certain types of research questions. Figure 1.2 provides an overview of these successive research steps.

30
FIGURE 1.2 Overview of the successive research steps
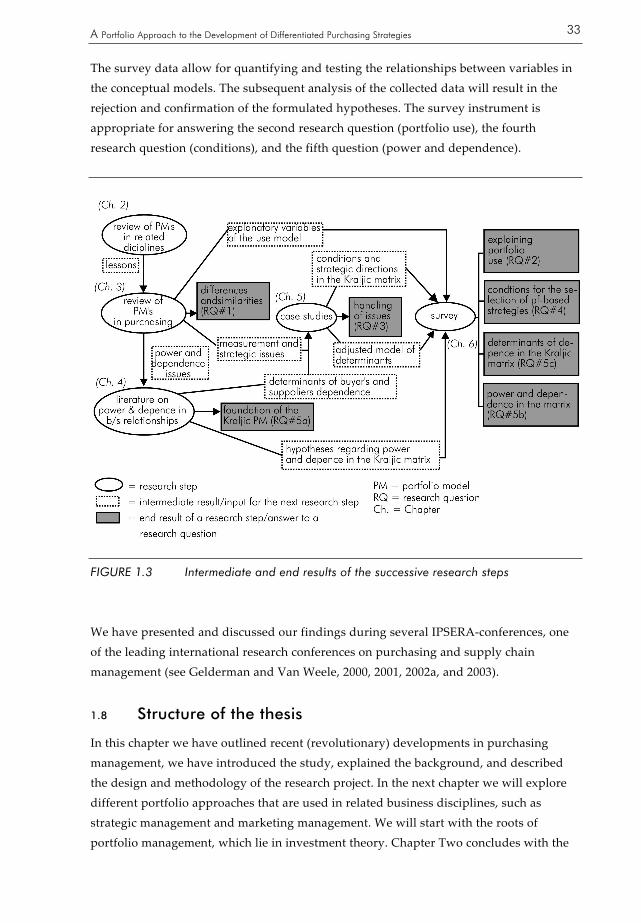
We will amplify on the three main research methods, describing and explaining the various research steps. In addition, we will clarify in more detail the relationships between the research steps. Obviously, the research steps are not arranged in a random order. Any output of a research step will result either in an answer to a research question or in a useful input for a next research step. Figure 1.3 provides a comprehensive view of the intermediate research results (input) and the end results (output) of the various research steps.
(a) Literature study
We have started the literature study with a review of portfolio models in related business areas, namely investment theory, strategic management, and marketing management. The main reason for starting with other areas than purchasing management was that we wanted to learn from disciplines with a longer tradition and experience in the use of such models. The lessons and insights should be valuable for the next step of the literature study: the review of portfolio models in purchasing management. This step will answer the first research question (‘similarities and differences’). The critical review of the portfolio models will result in an overview of the main issues and unanswered questions. Most prominently, measurement and strategic issues will be identified and used as input for the case studies. The case studies aim to reveal how experienced professionals handle these issues in practice, providing an answer to the third research question (‘handling of issues’). Additionally, we will explore the literature in search of factors and variables that might explain the use of a portfolio approach in purchasing. The variables enter a use

A Portfolio Approach to the Development of Differentiated Purchasing Strategies
31
model, to be quantified and tested by means of the survey data. During the research project we have stayed closely connected with state-of-the art literature. Since the start of the research project in 1998, we have observed a growing interest in purchasing portfolio management, which has resulted in a corresponding growth of academic and professional publications on this matter. Obviously, we have used the additional insights in the literature study. Our study of purchasing portfolio models induced us to go deeply into issues of power and dependence in buyer-supplier relationships. It was apparent that these issues are key elements for understanding the foundations and possibilities of a portfolio approach to the management of supplier relationships. Much has been written about power and dependence in business relations, although never related to the purchasing portfolio models. We have addressed this gap and formulated a number of hypotheses regarding the (expected) power and dependence structure in the Kraljic matrix. Additionally, we have looked for possible determinants of buyer’s dependence and determinants of supplier’s dependence. This has resulted in a preliminary model of determinants, which has been adjusted after consulting purchasing practitioners who were involved in our case studies.
(b) Case studies
Case studies will be used to identify and to describe advanced current practices with respect to purchasing portfolio models. The main purpose of the case studies is to answer the third research question, which refers to the employment of portfolio models by experienced purchasing professionals. How do they handle measurement issues and strategic issues? Which solutions have been developed in practice? It will become clear that portfolio analysis enables purchasing professionals to differentiate their purchasing strategies, not only between the item categories of a matrix, but also within each category. A further analysis of the case studies will result in an overview of portfolio-based strategies and the conditions under which they are selected in practice. This comprehensive model of strategic directions enables us to develop different scenarios, to be used in the survey study. The case study method is appropriate because of the limited research on the actual employment and possibilities of a portfolio approach in purchasing and supply management. Most publications are conceptual or anecdotical by nature. Additionally, this research step is of an explorative nature, aimed at identifying advanced practices, dealing with ‘how’ and ‘why’ questions. The sample consists of a selection of Dutch companies, restricted to production industries, where purchasing is by nature an important business area. We have selected three case companies mainly on their ongoing use of purchasing portfolio analysis. The cases were studied sequentially, one after another. Because we wanted to explore different possibilities of the portfolio approaches, we have included different levels of

32
analysis: the corporate level of a large company, the level of a multinational business unit with many plants all over the world, and the level of a business unit of a fairly small (single plant) company. The variety in levels enables us to reveal different kinds of practices, although we are aware of the limitations of this approach. The case studies are not supposed to give an exhaustive treatment of portfolio methods, and they do not allow for any statistical generalization. Respondents were interviewed (face-to-face) on the basis of a semi-structured questionnaire, allowing for elucidation, elaboration and clarification. The case studies entail the use of a key-informant method in combination with a snow-balling technique whereby the key informant is nominating other informants. Several rounds of interviews were conducted with the respondents, at each stage reporting back the tentative analysis and conclusions from earlier rounds, giving them the opportunity to check and recheck interim reports, to improve the match with the intended information, and to explore issues in more detail.
(c) Survey
In the third and last stage a survey will be conducted. Principally, the questionnaire is aimed at measuring the variables and relationships in the conceptual models, which are based on the insights from the literature study and the case studies: - the conditions for the selection of portfolio-based strategies, - the power and dependence structure in the Kraljic matrix, and - the determinants of buyer’s and supplier’s dependence in the Kraljic matrix. The survey method requires the development of scenarios which describe a number of situations in terms of the Kraljic dimension (profit impact and supply risk) and in terms of the selection of a corresponding specific (portfolio based) purchasing strategy. Respondents will be asked to assume the role of a purchasing expert in their own company where they are actually employed. The respondents are asked to evaluate a series of questions relating to the different scenarios. The design of the study can be characterized as a repeated measures design, because the same respondent participates in all conditions of the experiment. Different sources of knowledge and expertise are being used for the development of the questionnaire. The construction of items is largely based on literature review (operationalization) and on the insights gained from interviewing practitioners during the case studies. The first draft questionnaire will be discussed with a focus group of academics. The procedure includes a pilot study aimed at enhancing the reliability and the validity of the questionnaire. A small pre-test group will be asked to review the questionnaire for the clarification of questions, instructions, lay-out and other text elements. Finally, the questionnaires will be administered in three rounds to a large number of purchasing managers who are employed by manufacturing companies who are member of the Dutch Association of Purchasing Management (NEVI).
A Portfolio Approach to the Development of Differentiated Purchasing Strategies
33
The survey data allow for quantifying and testing the relationships between variables in the conceptual models. The subsequent analysis of the collected data will result in the rejection and confirmation of the formulated hypotheses. The survey instrument is appropriate for answering the second research question (portfolio use), the fourth research question (conditions), and the fifth question (power and dependence).
FIGURE 1.3 Intermediate and end results of the successive research steps
We have presented and discussed our findings during several IPSERA-conferences, one of the leading international research conferences on purchasing and supply chain management (see Gelderman and Van Weele, 2000, 2001, 2002a, and 2003).
1.8 Structure of the thesis
In this chapter we have outlined recent (revolutionary) developments in purchasing management, we have introduced the study, explained the background, and described the design and methodology of the research project. In the next chapter we will explore different portfolio approaches that are used in related business disciplines, such as strategic management and marketing management. We will start with the roots of portfolio management, which lie in investment theory. Chapter Two concludes with the

34
most important lessons and experiences, as background information for the investigation of purchasing portfolio models. In chapter Three we will review the main portfolio approaches in purchasing and supply management. Kraljic’s fundamental ideas and concepts appear to dominate the discipline. However, there are a number of problems and unanswered questions. Building on the findings and conclusions in chapter Four, we will develop some new perspectives on Kraljic’s original portfolio matrix. A theoretical foundation is found for Kraljic’s portfolio approach in the resource dependence theory (Pfeffer and Salancik, 1978). A new mutual based dependence model is introduced by adding a (resource) dependence-perspective to the original Kraljic matrix. Elaborating on ‘power and dependence’, we will explore the determinants of buyer’s and supplier’s dependence (Chapter Four). The field research part starts with Chapter Five which reports on the in-depth case studies. Measurement issues and strategic issues are addressed, providing insights into the various ways experienced professionals deal with a purchasing portfolio approach in practice. Chapter Six explains the design of the survey and summarizes the findings. In Chapter Seven we will present the main conclusions and recommendations of this study. We will reflect on the research project, providing suggestions for further research.
35
2 Portfolio-approaches in related disciplines
In this chapter we will discuss and review portfolio models which are developed in related disciplines, learning from areas with a longer tradition and experience in the use of such models. We will begin with the roots of all portfolio management: investment theory. Then we will review portfolio models for strategic management, developed in the early seventies. They have received a great deal of attention in strategic planning (Armstrong and Brodie, 1984). Therefore we expect to find a mass of experience with portfolio-approaches in strategic management. In this section we will look for valuable lessons and learning experiences for the use of portfolio analysis in purchasing management. Another point of interest is the role of purchasing in (corporate) portfolio models. If purchasing is of a strategic nature and is said to have a significant impact on the competitive position of companies, then obviously purchasing should be included in any corporate portfolio model. Finally, we will review marketing portfolio models which are of special interest to the central object of this study, being purchasing portfolio models. After all, both marketing and purchasing professionals are trying to manage exactly the same buyer/supplier relationships. A customer focus in marketing implies that marketing models are likely to pay much attention to the interests and positions of customers (the buying perspective).
2.1 Investment theory: the roots of all portfolio management
Portfolio theory has its roots in financial investment and the desire to balance the conflicting objectives of high yield and low risk (Yorke, 1984). In common parlance a ‘portfolio’ refers to stock, bonds and other financial investments. Webster’s Third New International Dictionary (1993: 1768) defines ‘portfolio’ as “the securities held by an investor or the commercial paper held by a bank or other financial house”. The work of Markowitz in the early 1950s is generally seen as the origin of modern portfolio theory for investment purposes. Further development from Markowitz’s portfolio theory gave rise to what is known as the Modern Portfolio Theory (Sharpe, 1963).
2.1.1 The Markowitz model
In the early 1950s the investment community talked about risk, but there was no specific measure for this key concept. Investors had to quantify ‘risk’ for investment decisions. Markowitz (1952) derived the expected rate of return for a portfolio of assets and an

36
expected risk measure. He showed that the variance of the rate of return was a useful measure of portfolio risk and he derived a formula for computing the variance of a portfolio. Markowitz showed that: - the expected rate of return of a portfolio is the weighted average of the expected return for the individual investments, and - the standard deviation of a portfolio is a function not only of the standard deviation for the individual investment, but also the covariance between the rates of return for all the pairs of assets in the portfolio. In a large portfolio, these covariance’s are the important factors. Markowitz’s formula not only indicated the importance of diversifying investments to reduce the total risk of a portfolio, but also showed how to diversify. The Markowitz model is based on several assumptions regarding investor behavior: - Investors consider each investment alternative as being presented by a probability distribution of expected returns over some holding period. - Investors maximize one-period expected utility, and their utility curves demonstrate diminishing marginal utility of wealth. - Investors estimate the risk of the portfolio on the basis of the variability of expected returns. - Investors base decisions solely on expected return and risk, so their utility curves are a function of expected return and the expected variance of returns only. - For a given risk level, investors prefer higher returns to lower returns. Similarly, for a given level of expected return, investors prefer less risk to more risk. (e.g. Reilly and Norton, 1999) Under these assumptions, a portfolio of assets is considered to be efficient if no other portfolio offers higher expected return with the same or lower risk, or lower risk with the same (or higher) expected return. Markowitz conclusion is that rational investors would (or should) want to select efficient portfolios, i.e. portfolios with a minimum of risk (variance) for a given expected return, or with a maximum expected return for a given risk (variance). Nowadays Markowitz formula is still being used as the basis for modern investment theory and investment practice. The consequences are far-reaching and provide much guidance for investment decisions. The most important implication is that diversification reduces variability and risk. The greatest payoff to diversification comes when stocks (or other assets) are negatively correlated (Brealy and Myers, 1996). When there is a perfect negative correlation (-1) between two assets, the overall variance of the portfolio is zero (0). This would be a risk-free portfolio (Reilly and Norton, 1999). Wise investors do not put all their money into just one stock. They want to reduce their risk by diversification. Investors should be interested in the effect that each stock has on the risk of the portfolio
A Portfolio Approach to the Development of Differentiated Purchasing Strategies
37
as a whole. It is therefore not decisive how risky an investment is, but what the impact will be on the risk of the entire portfolio. One of the simplest ways for an individual to diversify is to buy shares in a mutual fund which holds a diversified portfolio. Software programs, called ‘optimizers’, are used to determine ‘efficient portfolios’. Financial planners use information on past returns and manager performance, in addition to optimizers, to make recommendations to their clients (cf Reilly and Norton, 1999).
2.1.2 Relevance for purchasing: what can we learn?
Investment theory basically deals with the choice of investments between an infinite number of potential portfolios, resulting in a ‘yes’ or ‘no’ kind of recommendations. It is all about the composition of an investment portfolio by reducing risks and optimizing returns. In purchasing management however it is a matter of choice of strategies for a given number of items (usually products), resulting in a set of differentiated purchasing and supplier strategies. This means that there are important difference in scope and perspective. Another major difference regards the existence of another party and the factor of social interaction (Yorke, 1984). Here lies a sharp contrast with the application of portfolio theory to investment purposes and to purchasing purposes. There is always an unpredictable element in a purchasing context, due to the dynamics of business and human behavior. The risk-factor is of an other order. In the investment theory the variable ‘risk’ is measurable in a rather easy and unambiguous way, based on a mathematical formula. It is clear that such a formula does not exist for the determination of risk in a purchasing context. The main similarity however is that any portfolio approach focuses on the efficient allocation of limited resources. In a general sense this problem is relevant for investment decisions and for purchasing decisions. A general objective of Kraljic’s model is to minimize supply risk (Kraljic, 1983). Another similar characteristic refers to the trade-off between risks and rewards. For instance, there are benefits in spreading purchases among a number of suppliers. However, there is a trade-off involved. The net effect of dealing with a large number of suppliers, can be to shift the balance of power towards the seller rather than towards the buyer. Just as in the financial world, ‘risks’ and ‘rewards’ are closely linked. Buyers should therefore be aware of the balance between risk and return. Nicholson (1993) points out that buyers should ask themselves: - If the overall business risk increases due to a purchasing strategy, is that increased risk matched by an increased return or benefit? - If the buyer obtains an increased reward for the firm, has it been achieved by exposing the business to a higher level of risk? Smeltzer and Siferd (1998) argued that proactive purchasing management is concerned with risk management. It should mitigate risk and, at the same time, provide a higher return. To conclude, purchasing management has to deal with issues of ‘risks’ and

38
‘rewards’, albeit that the context of decision making is different in comparison to investment problems.
2.2 Portfolio models in strategic management
In seeking answers to questions of strategic planning for the diversified organization, management has a strong need for tools that assist in allocating resources among business units (or products). A number of portfolio models have been proposed for this purpose. First and best known is the Boston Consulting Group’s growth share matrix (Henderson, 1970, 1972, 1973). The model is widely used, even though it has received considerable criticism and there are some major limitations. Other multifactor models have been developed with the intention of overcoming some of the limitations of the BCG-approach. The portfolio models for strategic management are mainly developed to support resource allocation decisions among strategic business units (SBU’s). However, any portfolio analysis can be conducted at different levels of operation (Wind et al., 1983): - a portfolio of strategic business units at the corporate level, - a portfolio of product lines at the SBU-level, and - a portfolio of products at the product group level. In this section we will concentrate on the portfolio analysis at the corporate level. Portfolio models with respect to products lines and products will be discussed in section 2.3 when dealing with portfolio models in marketing management.
2.2.1 The BCG-approach
The BCG-model uses two key variables: relative market share and business growth. The positions of SBU’s can be portrayed in the growth-share matrix, that also shows the turnover for each SBU by the diameter of the circles. Figure 2.1a shows an example of a growth-share matrix that consists of eight SBU’s. The quadrants of the growth-share are connected with expected cash flow results: stars, problem children, cash cows and dogs (see figure 2.1b).

A Portfolio Approach to the Development of Differentiated Purchasing Strategies
39
FIGURE 2.1a An example of a growth-share matrix
FIGURE 2.1b Cach flows in a growth-share matrix

40
In the matrix the market growth is measured on a linear scale, the relative market share on a logarithmic scale. The growth rate variable is divided into high and low, usually at the level of the nominal GNP growth, which in those days was between the range of 10 to 12 percent. In the upper half of the matrix we would expect SBU’s with products that are positioned in the early phases of their product life cycle. For new products it is assumed that they need high expenses for which in turn relative small earnings are gained. The relative market share is determined by dividing the market share by the market share of the largest competitor, on the horizontal axis. A vertical cross hair is placed at a relative share of 1, which is the dividing line for a market leader position. Another line is often placed at a relative share of 1.5 on the grounds that dominance is not established unless the business is at least 50 percent larger than the closest competitor (Day, 1986). Being market leader has the advantage of moving faster on the experience curve. As a consequence, SBU’s with a higher relative market share, produce in a more efficient mode with lower average costs, and with relative high cash flows. The marks for both variables can be viewed as natural threshold values, this in contrast with most other portfolio models with more arbitrary cross hairs. A relative high market share implies relative high cash revenues. In contrast, to be competitive in fast growing markets the company needs relatively high cash expenditures. When market growth declines, stars can change into cash cows under the condition that no relative market share is lost. Problem children on the contrary need a great deal of investment. Cash cows finance the problem children so that they will eventually grow to be the future stars. Less potential problem children can be sold, terminated or harvested. The ‘cash flow’-concept plays a central role in the BCG-approach: in view of continuity every corporation needs to have continuous positive cash flows to finance new, promising activities and business units. Eventually this new business will replace the activities that are currently profitable. In terms of the BCG-approach this means that a well-balanced portfolio of SBU’s is necessarily for the survival of the corporation. On the basis of the growth-share matrix the following strategic recommendations are provided: 1. The strategic conclusion for dogs is to disinvest or withdraw. Earnings will be low and little or no profit will be made now and in the future. 2. The recommendation for stars is to invest for growth. There are good prospects for SBU’s with a relative high share in a growing market. 3. There is a potential for problem children, although there is a low market share. There could be possibilities to make stars out of them, but there is the risk that problem children degrade into dogs.

A Portfolio Approach to the Development of Differentiated Purchasing Strategies
41
4. The strategic implication of cash cows is to exploit their strong positions, but not to spend much money on them. The positive cash flows should be invested in stars and occasionally in problem children. Saunders (1997: 94) summarizes: “Milk the cows, invest in the stars, divest the dogs and analyze the problem children to determine whether they can be growing into stars or whether they will degenerate into dogs.” These recommendations show an emphasis on interdependence of elements within the portfolio-concept: managing the whole, rather than making separate allocation decisions for separate SBU’s.
2.2.2 Assumptions, criticism and adoption
The growth share matrix consists of two dimensions: market growth and relative market share. These dimensions were chosen because market growth served as a proxy for the need for cash, while relative market share was a proxy for profitability and cash generating ability. The relative market share is an indication for the company’s competitive position: its market share relative to its largest competitor in the same market. High relative market shares are assumed to be more profitable, especially if the experience curve applies. The experience curve effect states that as the accumulated experience of manufacturing doubles, total unit costs can decline by 20-30 percent. In effect, the greater the market share, the greater is the cost-saving accrued from the experience effect (Turnbull, 1990). The market growth-variable was chosen as a rough proxy for the product life cycle, because it is believed to have known and predictable consequences for cash requirements (Day, 1986). In a high-growth market, sales volume can more easily be maintained or increased, because of new users and new uses. However, in a static or declining market, shares can only be gained in a struggle with competitors. As a consequence, marketing costs are likely to be high. It is agreed that, although industry growth and relative market share are very important variables for strategic planning, the complexity of the business environment does not allow for simple recommendations. More factors should be incorporated in the strategic decision planning process. Morrison and Wensley (1991) suggested that the scope of the BCG matrix ignores other relevant strategic issues. In addition, the model uses data from the past with respect to current business units. It can be said that the BCG model is not designed to deal with the development of new business opportunities and may even inhibit creative thinking about these questions (Day, 1986). But there is more criticism. In the BCG-model dogs are undesirable business units: they should be disinvested or eliminated. This drastic recommendation seems to be not always the wise thing to do. Most markets are mature and show a relative low growth rate. Since there can only be one market leader per market, most strategic business units are ‘dogs’. In contrast with the

42
theory it is certainly possible that dogs are profitable business units, even in the long run. There is empirical evidence that ‘dogs’ perform much better than would be predicted by the BCG-model. Hambrick et al. (1982) empirically explored the performance of business units in the four cells of the matrix. The data used in this study were drawn form the Profit Impact of Marketing Strategies (PIMS) project. They found that ‘problem children’ had negative cash flows, ‘cash cows’ were net cash generators and the average ‘star’ generated as much cash as it spent, all according to the BCG-principles. The ‘dogs’ outperformed the expectations placed on them by BCG. Many ‘dogs’ earned higher profits than other categories in the growth-share. The main conclusion is that the results of this study do not support the BCG’s advice that ‘dogs’ should be harvested or liquidated. There are also questions on the validity of the fundamental assumptions of the BCG-model. Several studies (e.g. Jacobson and Aaker, 1985; Cook, 1985; Jacobson, 1988) have questioned the validity and generalizability of the market share-profitability relationship. It is claimed that there is little empirical evidence to support a causal relationship between market growth and profits. However, there are sources which express strong support for the assumed relationships. Buzzell et al. (1975) found a significant relationship of market share and return of investment: the greater the share, the greater the cash flow. Szymanski et al. (1993) performed a meta-analysis on 276 market-share profitability findings from 49 studies. They found that, on average, market share has a positive and significant effect on business profitability. In addition to the questions on the assumptions, there are difficulties in measurement of market growth and relative market shares. There are no natural market boundaries and undebatable market definitions. Different market definitions will produce different market leaders, different growth numbers, different matrices and different strategic recommendations. Wind et al. (1983) proved that decisions based on portfolio models are quite sensitive to the choice of the methods of measuring market share and market growth. According to Day (1986) the Achilles’ heel of the growth-share matrix is the measurement. If the share and the growth estimates are dubious, so are the interpretations and the recommendations. The BCG-approach is also based on two assumptions with respect to cash (balance): - there is a need for companies to achieve and maintain cash balance; - the interdependence among business units is limited to the generation and use of cash. The strategic recommendations of the BCG-matrix emphasize the balance of cash flows. Some business units have to supply cash so that other business units are able to sustain growth in the future. The underlying premise is that companies do not have possibilities
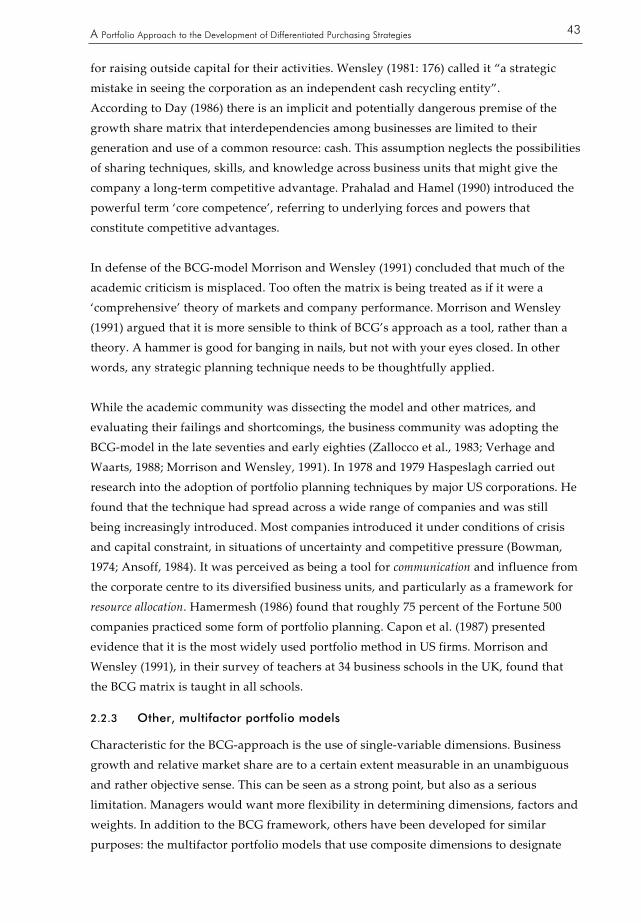
A Portfolio Approach to the Development of Differentiated Purchasing Strategies
43
for raising outside capital for their activities. Wensley (1981: 176) called it “a strategic mistake in seeing the corporation as an independent cash recycling entity”. According to Day (1986) there is an implicit and potentially dangerous premise of the growth share matrix that interdependencies among businesses are limited to their generation and use of a common resource: cash. This assumption neglects the possibilities of sharing techniques, skills, and knowledge across business units that might give the company a long-term competitive advantage. Prahalad and Hamel (1990) introduced the powerful term ‘core competence’, referring to underlying forces and powers that constitute competitive advantages. In defense of the BCG-model Morrison and Wensley (1991) concluded that much of the academic criticism is misplaced. Too often the matrix is being treated as if it were a ‘comprehensive’ theory of markets and company performance. Morrison and Wensley (1991) argued that it is more sensible to think of BCG’s approach as a tool, rather than a theory. A hammer is good for banging in nails, but not with your eyes closed. In other words, any strategic planning technique needs to be thoughtfully applied. While the academic community was dissecting the model and other matrices, and evaluating their failings and shortcomings, the business community was adopting the BCG-model in the late seventies and early eighties (Zallocco et al., 1983; Verhage and Waarts, 1988; Morrison and Wensley, 1991). In 1978 and 1979 Haspeslagh carried out research into the adoption of portfolio planning techniques by major US corporations. He found that the technique had spread across a wide range of companies and was still being increasingly introduced. Most companies introduced it under conditions of crisis and capital constraint, in situations of uncertainty and competitive pressure (Bowman, 1974; Ansoff, 1984). It was perceived as being a tool for communication and influence from the corporate centre to its diversified business units, and particularly as a framework for resource allocation. Hamermesh (1986) found that roughly 75 percent of the Fortune 500 companies practiced some form of portfolio planning. Capon et al. (1987) presented evidence that it is the most widely used portfolio method in US firms. Morrison and Wensley (1991), in their survey of teachers at 34 business schools in the UK, found that the BCG matrix is taught in all schools.
2.2.3 Other, multifactor portfolio models
Characteristic for the BCG-approach is the use of single-variable dimensions. Business growth and relative market share are to a certain extent measurable in an unambiguous and rather objective sense. This can be seen as a strong point, but also as a serious limitation. Managers would want more flexibility in determining dimensions, factors and weights. In addition to the BCG framework, others have been developed for similar purposes: the multifactor portfolio models that use composite dimensions to designate
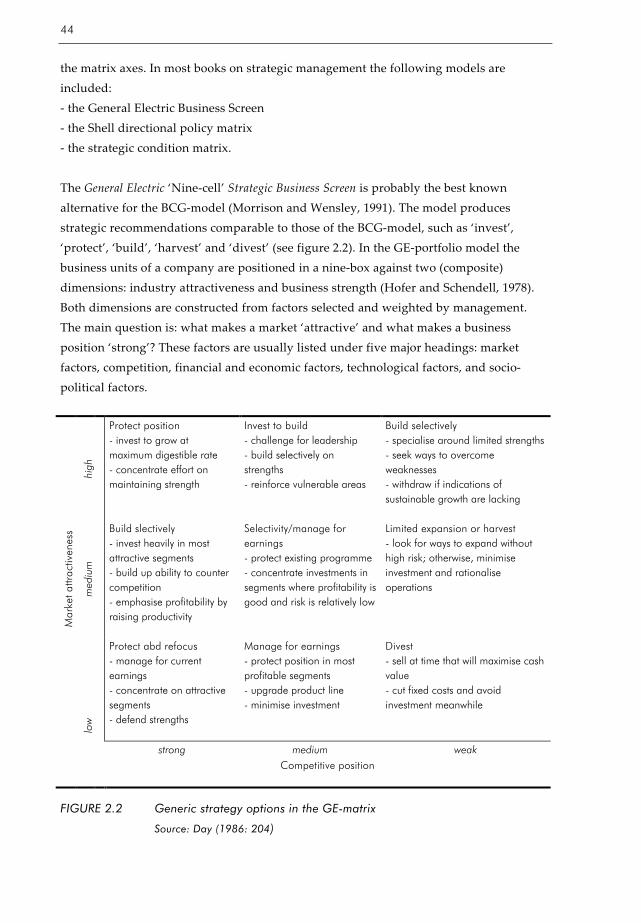
44
the matrix axes. In most books on strategic management the following models are included: - the General Electric Business Screen - the Shell directional policy matrix - the strategic condition matrix. The General Electric ‘Nine-cell’ Strategic Business Screen is probably the best known alternative for the BCG-model (Morrison and Wensley, 1991). The model produces strategic recommendations comparable to those of the BCG-model, such as ‘invest’, ‘protect’, ‘build’, ‘harvest’ and ‘divest’ (see figure 2.2). In the GE-portfolio model the business units of a company are positioned in a nine-box against two (composite) dimensions: industry attractiveness and business strength (Hofer and Schendell, 1978). Both dimensions are constructed from factors selected and weighted by management. The main question is: what makes a market ‘attractive’ and what makes a business position ‘strong’? These factors are usually listed under five major headings: market factors, competition, financial and economic factors, technological factors, and socio-political factors.
high
Protect position - invest to grow at maximum digestible rate - concentrate effort on maintaining strength
Invest to build - challenge for leadership - build selectively on strengths - reinforce vulnerable areas
Build selectively - specialise around limited strengths - seek ways to overcome weaknesses - withdraw if indications of sustainable growth are lacking
med
ium
Build slectively - invest heavily in most attractive segments - build up ability to counter competition - emphasise profitability by raising productivity
Selectivity/manage for earnings - protect existing programme - concentrate investments in segments where profitability is good and risk is relatively low
Limited expansion or harvest - look for ways to expand without high risk; otherwise, minimise investment and rationalise operations
Mar
ket a
ttrac
tiven
ess
low
Protect abd refocus - manage for current earnings - concentrate on attractive segments - defend strengths
Manage for earnings - protect position in most profitable segments - upgrade product line - minimise investment
Divest - sell at time that will maximise cash value - cut fixed costs and avoid investment meanwhile
strong medium weak
Competitive position
FIGURE 2.2 Generic strategy options in the GE-matrix
Source: Day (1986: 204)

A Portfolio Approach to the Development of Differentiated Purchasing Strategies
45
The Shell directional policy matrix has business sector prospects and the company’s competitive capabilities as two dimensions (Hughes, 1981). This portfolio model appears to be used infrequently in practice, although it is a potentially rich and valuable tool, according to McDonald (1990). The strategic condition matrix of AD Little Inc is a ‘business profile matrix’ that identifies stages of industry maturity and competitive position (Patel and Younger, 1978). Some less-known models and matrices are: BCG’s Growth/Gain Matrix (Abell and Hammond, 1979), the Competitive Advantage Matrix (Lockridge, 1981), Matrix for Market Definition (Day, 1981) and a 27 option Share/Strategy Matrix (Catry and Chevalier, 1974). We will not discuss these techniques here because we consider them to be variations on the original BCG portfolio method. For an overview and comparison of portfolio models for strategic planning, we refer to Wind and Mahajan (1981), Coate (1983) and Day (1986). We will focus on the limitations of the multifactor models, in comparison with the BCG-model. Unlike the BCG-approach, multifactor models rely heavily on managerial judgment to identify the relevant factors and determine their relative importance. Because of the subjective evaluations there is a distinct possibility that the outcome of a multifactor approach could simply be a tautological recommendation to ‘invest preferentially in those areas of greatest market attractiveness and strongest competitive position’ (Day, 1986). Wind and Mahajan (1981) have dealt with another problem that is endemic to any composite rating based on multiple factors. Two businesses can be assigned identical positions in the portfolio matrix, despite enormous differences in the underlying factors. The summed scores could still be the same, ignoring important differences and losing a great deal of useful information. The models share a number of important characteristics, approaching strategic problems in a comparable way. All models suggest variables that can be used to measure the business strength of each unit and other variables to estimate the attractiveness of the unit’s industry. Although the choice of weights is subjective, multifactor models can be considered a generalization of the BCG-model. The BCG weights relative market share and industry growth with 1, and all other variables with 0 (Coate, 1983). Multifactor models take a broader view of business strength and market attractiveness. However, the choice of factors and the weightings are based on managers’ subjective judgment, not specified by any objective procedure. In comparison with the BCG-model, theoretical and empirical support for the multifactor models is low (Hooley and Saunders, 1993). Figure 2.3 summarizes the main differences and similarities between the BCG-matrix and the GE-matrix, the latter as a representative for all multifactor models. In conclusion, there
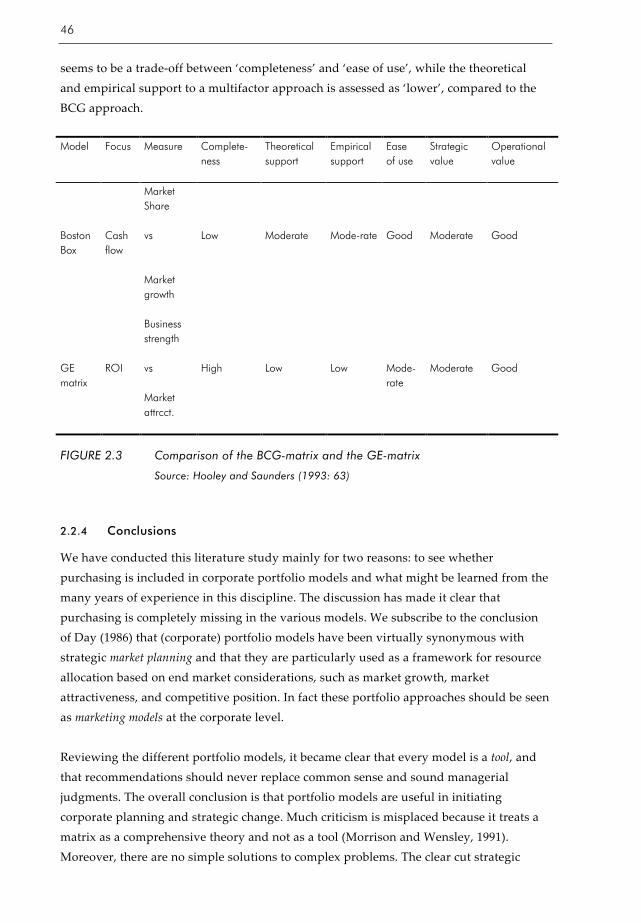
46
seems to be a trade-off between ‘completeness’ and ‘ease of use’, while the theoretical and empirical support to a multifactor approach is assessed as ‘lower’, compared to the BCG approach. Model Focus Measure Complete-
ness Theoretical support
Empirical support
Ease of use
Strategic value
Operational value
Market Share
Boston Box
Cash flow
vs Low Moderate Mode-rate Good Moderate Good
Market growth
Business strength
GE matrix
ROI vs
High Low Low Mode-rate
Moderate Good
Market attrcct.
FIGURE 2.3 Comparison of the BCG-matrix and the GE-matrix
Source: Hooley and Saunders (1993: 63)
2.2.4 Conclusions
We have conducted this literature study mainly for two reasons: to see whether purchasing is included in corporate portfolio models and what might be learned from the many years of experience in this discipline. The discussion has made it clear that purchasing is completely missing in the various models. We subscribe to the conclusion of Day (1986) that (corporate) portfolio models have been virtually synonymous with strategic market planning and that they are particularly used as a framework for resource allocation based on end market considerations, such as market growth, market attractiveness, and competitive position. In fact these portfolio approaches should be seen as marketing models at the corporate level. Reviewing the different portfolio models, it became clear that every model is a tool, and that recommendations should never replace common sense and sound managerial judgments. The overall conclusion is that portfolio models are useful in initiating corporate planning and strategic change. Much criticism is misplaced because it treats a matrix as a comprehensive theory and not as a tool (Morrison and Wensley, 1991). Moreover, there are no simple solutions to complex problems. The clear cut strategic
A Portfolio Approach to the Development of Differentiated Purchasing Strategies
47
recommendations for cash cows (‘milk’), stars (‘invest’) and dogs (‘divest’) should not simply be followed without additional considerations. Referring to the measurement issue, it was found that decisions based on portfolio models are proven to be quite sensitive to the choice of the methods of measuring variables and dimensions. For all portfolio models fundamental issues apply with respect to measurement and validation. Based on a comparative empirical study, Wind et al. (1983) concluded that the classification of any business into a specific portfolio position depends on four factors: - the operational definition of the dimensions used; - the rules used to divide a dimension into low and high categories; - the weighting of the variables constituting the composite dimensions that are used, and - the specific portfolio model used. Given these results the authors advised to avoid a single portfolio model. They further suggested the need to test sensitivity of the portfolio classification of businesses to various definitions, cut-off rules, weights, and models. Especially multifactor models using composite dimensions rely heavily on managerial judgement which is inherently subjective. The rapid adoption of the portfolio models is attributed to the appealing visual displays and the immediate comparisons and recommendations which it offered (Brown, 1991). On psychological grounds it fulfils a human desire for taxonomy, classifying a complex mix of different businesses. Furthermore, it is easy to grasp, uses catch terms and phrases which are easy to memorize and have a link to strategy (Hooley and Saunders, 1993). The customization of any portfolio model enhances the strategical thinking of decision-makers. The process of using might be more important than the derived classifications and recommendations. Despite all the known limitations and problems, there is a consensus that portfolio models can improve the corporate management’s ability to allocate resources across businesses. The BCG-matrix is the best known and probably the most frequently used portfolio model. It might be argued however, that multifactor models are to be preferred to the rigid BCG-approach. An important benefit is that the actual using and customizing of portfolio models will lead to a better understanding of the strategic issues at hand. The process of customizing and using the model are in itself a strategic thinking process (Wind and Mahajan, 1981). Portfolio models provide a structure for analysis that facilitates the communication and sharing of judgments and assumptions about strategic issues (Day, 1986). Haspeslagh (1982) reported a sizable to dramatic improvement in corporate management’s understanding of individual businesses, by using portfolio models. Olsen and Ellram (1997) emphasized that the process of categorizing the items is even more important than the classification itself. During the process of categorizing, the decision-makers have to discuss inconsistencies among themselves and agree on the importance of the different elements of the portfolio.
48
2.3 Portfolio models in marketing management
For marketing management we found three kinds of portfolio approaches: 1. models for the selection of R&D projects for new product development, 2. models for classifying products, and 3. models for classifying customers. The main issues that will be addressed in this section, are: - Which portfolio models are developed for marketing management? - What are the results of empirical studies to the use of marketing portfolio models? - How is the buyer’s perspective included in these models?
2.3.1 New product portfolio models
The prioritization of new products or R&D projects is said to be vital to successful business performance (Roussel et al., 1991; Matheson et al., 1994). Technology choices determine what the business will be in the next years. Obviously, the sales of today come from investment decisions of the past. Firms should decide on the allocation of resources, how to spend scarce engineering, R&D and operations resources. New product portfolio management focuses on project selection, and on which new products or development projects are to be chosen from the many opportunities firm usually have. The basic issue of new product or R&D project portfolio models has much resemblance to the issues raised in selecting a financial portfolio of investments. The main concern in both cases is the allocation of scarce resources and the selection of elements (investments and R&D projects) in a balanced portfolio. It is not about finding recommendations in terms of differentiation in strategies. Portfolio models plot new products (that do not even exist) on a map and allocate resources to these (Cooper et al., 1998). Literature study resulted in the following new product portfolio models (cf. Cooper et al., 1999): - Financial models In case of financial models projects are judged and rank-ordered on the basis of financial criteria, such as net present value, internal rate of return, and payback time (Matheson et al., 1994). There are also probabilistic financial models, which include Monte Carlo Simulation and decision trees (Cooper et al., 1998). Faulkner (1996) described a method that uses the options pricing theory concepts in the R&D valuation process. This method treats each stage of the new product project much like purchasing an option on a future investment.

A Portfolio Approach to the Development of Differentiated Purchasing Strategies
49
- Strategic approaches Here the selection of the portfolio of projects is largely driven by the strategy of the business. The strategy decides the split of resources across different categories to create strategic buckets. To make sure the portfolio is consistent with business strategy, strategic buckets are designated by top management, and funds are allocated to each bucket based on strategic considerations. An example is Allied Signal that uses three buckets, platform projects, new products, and minor projects, and separately manages a portfolio within each bucket (Cooper et al., 2000). - Mapping approaches or bubble diagrams These are essentially extensions of the BCG- and the GE-model. In new product mapping models, various parameters are plotted against each other in a bubble diagram format, such as ‘reward’ versus ‘profitability’ or ‘ease of undertaking’ versus ‘project attractiveness’ (Matheson et al., 1994; Roussel et al., 1991). - Scoring models and checklists Projects are rated and scored on a variety of qualitative questions. The questions or items often capture drivers of new product success, such as product advantage, market attractiveness, synergy with the base business, and familiarity (Hall and Nauda, 1990; Roussel et al., 1991; Yorke and Droussiotis, 1994). Cooper et al. (1999) observed that there is very little evidence regarding the transfer of these models and techniques into management practice, or whether these approaches had positive results. Matheson et al. (1994) reported on a benchmarking study that was undertaken in order to learn how industry leaders make strategic R&D decisions and integrate technology with strategic objectives. The study revealed that there is much room for improvement in the quality of strategic R&D decisions (organizational learning). Cooper et al. (1999, 2000) performed an extensive study of portfolio management in industry. The study reported the portfolio practices and performance of 200 (large) U.S. companies, active in product development in North America. It appeared that almost every business in the survey used multiple methods or techniques for portfolio management. These techniques, in order of popularity, are as follows: financial methods (77%), business strategy methods (65%), bubble diagrams (41%), scoring models (38%), and checklists (21%). The performance of the various methods was assessed on the basis of three performance metrics: project value, number of projects, and time to market. Strategic methods, along with scoring approaches, produced the best portfolios. Financial methods resulted in the poorest performance results.
50
2.3.2 Classifying products: from product evaluation to product positioning
The development of a strategy for the product line should be an important part of every company’s marketing planning activities. The product portfolio of a company is more than the sum of the individual products. There are always interactions and interdependencies in an assortment of products. Kotler (1971) described a quantitative approach for measuring interactions and interdependencies of products in an assortment. He distinguished three kinds of interactions: - product interaction in which the marketing mix for each product influences sales and or cost of the other products; - sales covariance in which major environmental forces, such as seasonal or cyclical demand, cause two or more products to move in the same way; - risk covariance in which the returns on different products are subject to uncertainty and the measures of uncertainty are intercorrelated. Kotler (1971) adopted the original Markowitz (1952) portfolio model for the case of selecting an optimal product mix in terms of an ‘efficient portfolio set’. Under the assumptions that: - the average rate of return on each product can be estimated, - the variance of these returns can be estimated, - the covariance of return for each pair of products can be estimated, - the mean and variance of return are constant for the planning horizon, - the company can define a return-risk indifferent curve, management is able to choose an efficient subset of products that produces the highest expected return with a given variance, or that produces a given expected return with the lowest variance. This mathematical approach deals with a basic marketing problem: which products should the company have in its product line? However, the adaptation of the investment theory has merely conceptual value rather than practical use and it presents a specific way of thinking about choice problems. Due to the strict assumptions, this portfolio approach is not applicable in practice. In the early sixties several attempts were made to use product sales or the stages in the product life cycle as a guideline for marketing strategy (see for example Mickwitz, 1959). Marvin (1972) drew attention to the need for dynamic product portfolio management. He recommended that each product of a company should be positioned both to its own life cycle and the objectives of the product portfolios (product lines). However, much severe criticism has been passed on the product life cycle (Cox, 1967;Polli and Cook, 1969; Dhalla and Yuspeh, 1976; Wood, 1990). A major problem is that the recommended strategies are given with little concern for the product’s profitability, its market share position and other relevant factors. In the product life cycle-model, ‘time’ is the only
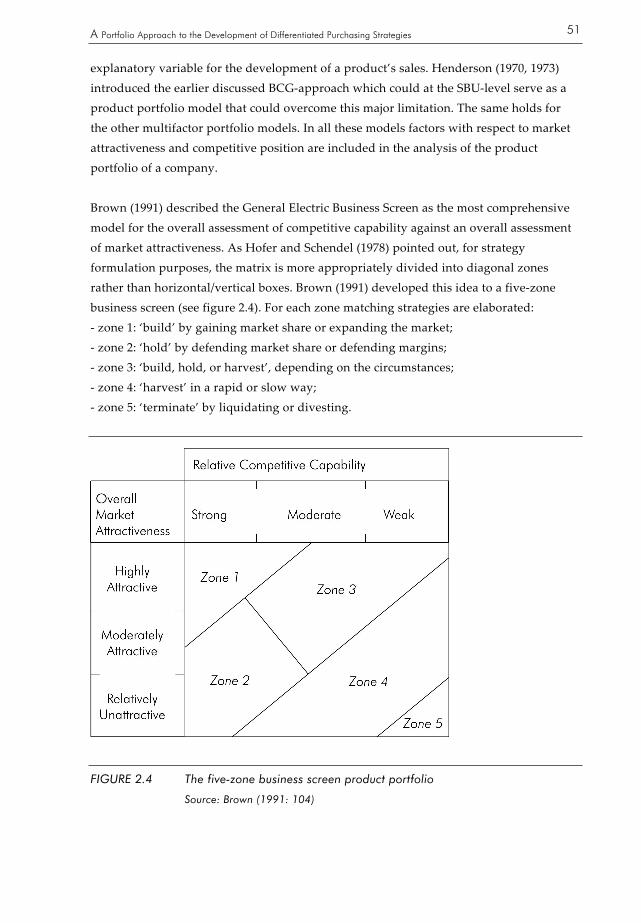
A Portfolio Approach to the Development of Differentiated Purchasing Strategies
51
explanatory variable for the development of a product’s sales. Henderson (1970, 1973) introduced the earlier discussed BCG-approach which could at the SBU-level serve as a product portfolio model that could overcome this major limitation. The same holds for the other multifactor portfolio models. In all these models factors with respect to market attractiveness and competitive position are included in the analysis of the product portfolio of a company. Brown (1991) described the General Electric Business Screen as the most comprehensive model for the overall assessment of competitive capability against an overall assessment of market attractiveness. As Hofer and Schendel (1978) pointed out, for strategy formulation purposes, the matrix is more appropriately divided into diagonal zones rather than horizontal/vertical boxes. Brown (1991) developed this idea to a five-zone business screen (see figure 2.4). For each zone matching strategies are elaborated: - zone 1: ‘build’ by gaining market share or expanding the market; - zone 2: ‘hold’ by defending market share or defending margins; - zone 3: ‘build, hold, or harvest’, depending on the circumstances; - zone 4: ‘harvest’ in a rapid or slow way; - zone 5: ‘terminate’ by liquidating or divesting.
FIGURE 2.4 The five-zone business screen product portfolio
Source: Brown (1991: 104)
52
In marketing the eighties were the period of the rise of ‘positioning’ theory. While segmentation identifies (homogeneous) groups of potential customers, positioning studies show how these customers perceive the competing products. Ries and Trout (1981) made clear that a product’s position is the way the product is defined by customers on important attributes: the place the product occupies in customer’s minds relative to competing products. Positioning shifted the emphasis of marketing theory from the product to ‘the battle for your mind’. The number of products, affiliated with a brand and the variance in quality among those products represent two basic properties of a brand portfolio (Dacin and Smith, 1994). Adding products to a brand (brand extension) is believed to weaken that brand. A brand becomes diluted by offering extensions. However, extensions of existing product lines have accounted for over 90% of the new consumer packaged goods offered every year (DelVecchio, 2000). If there is an acceptable fit between a brand and the extension category, then it might be very beneficial to capitalize on the brands’ risk reducing capabilities. Positioning has obtained a central role within most textbooks on marketing management, providing a bridge between the company and its target customers, describing how the product differs from competing products (Hooley and Saunders, 1993). The positioning of a product can be seen as an interplay of three major factors: market segmentation, the competitive advantage, and the competitors’ offerings. The targeting of customers determines where a firm shall compete; the competitive advantage determines how it shall compete, in light of course of the competitors’ offerings. Product or product line decisions should be taken in line with these strategic marketing factors. In the nineties, the emphasis shifted again, but this time from classifying products to classifying customers.
2.3.3 Classifying customers: from segmentation to customer portfolios
The problem of classifying and dealing with different groups of (potential) customers is one of the oldest and still one of the most important issues in marketing management: marketing segmentation. Frederick (1934) used this fundamental marketing concept in one of the earliest textbooks on marketing. Yet, it was not until the 1950s and 1960s that more detailed research papers on this subject began to appear. Consumer marketing was the first and main area of application of the new principles of market segmentation. Because consumer marketing often had to deal with large numbers of (potential) customers, a system of market segmentation with differentiated strategies and approaches for the ‘segmented’ groups appeared to be very useful. For long, an individual approach of customers was not feasible in the case of large consumer markets. Nowadays, by means of modern technology and new management methods, there are more possibilities for creating variety and customization through flexibility and quick responsiveness (Pine, 1993): mass customization. By combining the principles of mass production and individual

A Portfolio Approach to the Development of Differentiated Purchasing Strategies
53
consumption, the ultimate in market segmentation is achieved: one-to-one marketing (Peppers and Rogers, 2001). In business markets it has always been clear that some customers are more important than other customers. They are usually called ‘accounts’ or ‘key customers’. For analyzing the customer data base and for strategy development, the portfolio approaches are known as account or (key) customer portfolio analysis. Fiocca (1982) introduced an account portfolio analysis as a two-step classification, tailored to industrial companies. The first step is aimed at identifying key accounts, based on an assessment of the strategic importance and the difficulty of managing the account. The output of the first step is a matrix on which the industrial seller can decide which accounts need special attention and, as a consequence, deserve a more in-depth analysis. The latter is performed in the second step. Each key account is analyzed on the following two dimensions: - customer’s business attractiveness, and - the strength of the buyer/seller relationship. The result is a matrix with much resemblance to the GE-matrix. The position in the 3x3 matrix is connected with the marketing strategy (improve, hold, or withdrawal) and the profitability. A similar approach is described by Homburg and Daum (1997) who also presented a two-step customer portfolio model. Their first matrix is built up by a ‘customer attractiveness’-dimension and a ‘business position’-dimension. A second customer analysis is suggested aimed at identifying and enhancing the profitability of different customer groups. A problem area is indicated for customers with a relative low willingness to pay for relative high costs to serve. The best customers, from the marketing point of view, are so called ‘passive customers’ who do not mind to pay much money in combination with low costs to serve. In the remaining of this chapter we will focus on the main types of customer portfolio models. An examination of the various dimensions used in customer portfolio analysis highlights the different approaches. Considering the dimensions and the purpose of the various customer portfolio approaches, roughly two types can be distinguished with corresponding main focuses: 1. profitability, balancing cost and (potential) revenues of different customers; 2. relationship, emphasizing various aspects of buyer/seller relationships. Figure 2.5 provides an overview and a comparison of customer portfolio approaches in (business) marketing, including the identification of the main focus. The list is arranged in a chronological order.
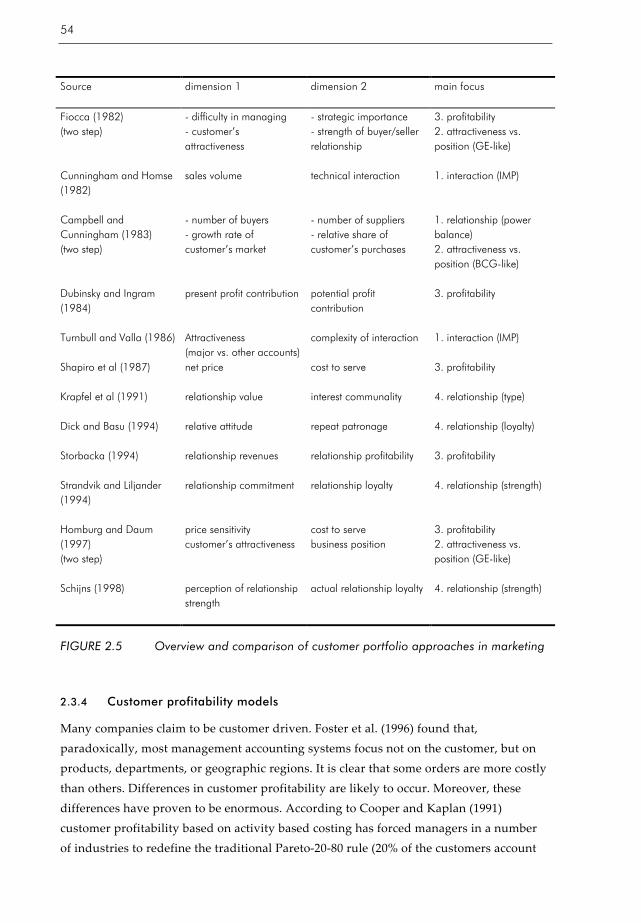
54
Source
dimension 1 dimension 2 main focus
Fiocca (1982) (two step)
- difficulty in managing - customer’s attractiveness
- strategic importance - strength of buyer/seller relationship
3. profitability 2. attractiveness vs. position (GE-like)
Cunningham and Homse (1982)
sales volume technical interaction 1. interaction (IMP)
Campbell and Cunningham (1983) (two step)
- number of buyers - growth rate of customer’s market
- number of suppliers - relative share of customer’s purchases
1. relationship (power balance) 2. attractiveness vs. position (BCG-like)
Dubinsky and Ingram (1984)
present profit contribution potential profit contribution
3. profitability
Turnbull and Valla (1986) Attractiveness (major vs. other accounts)
complexity of interaction 1. interaction (IMP)
Shapiro et al (1987)
net price cost to serve 3. profitability
Krapfel et al (1991)
relationship value interest communality 4. relationship (type)
Dick and Basu (1994)
relative attitude repeat patronage 4. relationship (loyalty)
Storbacka (1994)
relationship revenues relationship profitability 3. profitability
Strandvik and Liljander (1994)
relationship commitment relationship loyalty 4. relationship (strength)
Homburg and Daum (1997) (two step)
price sensitivity customer’s attractiveness
cost to serve business position
3. profitability 2. attractiveness vs. position (GE-like)
Schijns (1998)
perception of relationship strength
actual relationship loyalty 4. relationship (strength)
FIGURE 2.5 Overview and comparison of customer portfolio approaches in marketing
2.3.4 Customer profitability models
Many companies claim to be customer driven. Foster et al. (1996) found that, paradoxically, most management accounting systems focus not on the customer, but on products, departments, or geographic regions. It is clear that some orders are more costly than others. Differences in customer profitability are likely to occur. Moreover, these differences have proven to be enormous. According to Cooper and Kaplan (1991) customer profitability based on activity based costing has forced managers in a number of industries to redefine the traditional Pareto-20-80 rule (20% of the customers account

A Portfolio Approach to the Development of Differentiated Purchasing Strategies
55
for 80% of the profitability) with a 20-225 rule. Here 20% of the customers account for 225% of the profitability, which indicates that some customers are very unprofitable. The focus therefore should not be on sales, but on profitability. The basic idea of any customer profitability analysis is that the supplier should seek to assign all revenues and all costs to individual accounts. Revenue differences may arise from a variety of sources, such as differences in prices, in selling volume levels, or in price discounts. Foster en Gupta (1994) distinguished four types of costs: transaction specific costs, customer specific costs, customer group costs, and marketing support cost. Many costs of servicing customers are shared amongst several customers. It is quite a problem how to allocate these overhead and other indirect costs to individual customers. Dubinsky and Ingram (1984) presented a customer portfolio based on present profit contribution and potential profit contribution of customers. Their portfolio consists of four quadrants in which customers can be classified. The customers with a low present profit contribution are classified as: - ‘undesirable accounts’ with low potential profitability, or as: - ‘undeveloped accounts with a high potential profitability. On the other hand, customers with a high present profit contribution are labelled as: - ‘desirable accounts’ in case of high potential profitability, or as: - ‘developed accounts’ in case of low potential profitability. The positions in the matrix are not static. Sales personnel should take action, trying to move customers to a desired position. This customer portfolio approach is presented as a tool which allows sales managers to analyze their present customer base. Moreover, the tool suggests actions to effect a desired customer base. According to Shapiro et al. (1987) it is useful to think of customers in terms of two dimensions: - net price realized, and - cost to serve. Price differences are usually well-known. However, the cost of serving customers and filling orders can vary significantly too. Four types of costs were used to define the cost to serve: presales costs, production costs, distribution costs, and post-sale service costs. Marketing managers often assume that price-sensitive customers will accept lower quality and lower service, while demanding customers are likely to pay more for a better total product. However, these assumptions are rarely fully met. Shapiro et al. (1987) claimed that in a wide variety of situations, they consistently observed a lack of correlation between price and the cost to serve. This claim is confirmed by the results of the Turnbull and Zolkiewski (1997)-study. The classification matrix of Shapiro et al. (1987) is much quoted in the literature concerning customer profitability.
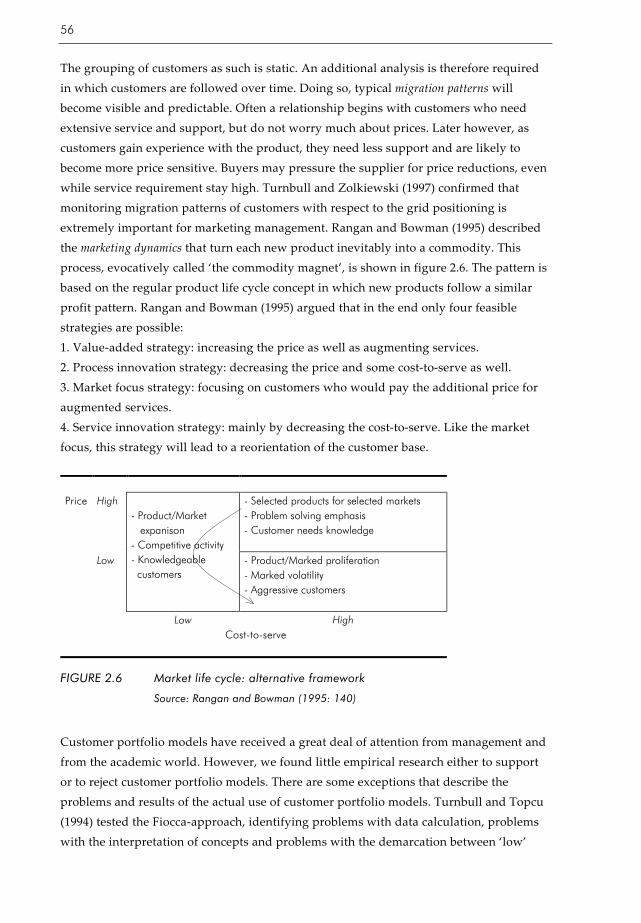
56
The grouping of customers as such is static. An additional analysis is therefore required in which customers are followed over time. Doing so, typical migration patterns will become visible and predictable. Often a relationship begins with customers who need extensive service and support, but do not worry much about prices. Later however, as customers gain experience with the product, they need less support and are likely to become more price sensitive. Buyers may pressure the supplier for price reductions, even while service requirement stay high. Turnbull and Zolkiewski (1997) confirmed that monitoring migration patterns of customers with respect to the grid positioning is extremely important for marketing management. Rangan and Bowman (1995) described the marketing dynamics that turn each new product inevitably into a commodity. This process, evocatively called ‘the commodity magnet’, is shown in figure 2.6. The pattern is based on the regular product life cycle concept in which new products follow a similar profit pattern. Rangan and Bowman (1995) argued that in the end only four feasible strategies are possible: 1. Value-added strategy: increasing the price as well as augmenting services. 2. Process innovation strategy: decreasing the price and some cost-to-serve as well. 3. Market focus strategy: focusing on customers who would pay the additional price for augmented services. 4. Service innovation strategy: mainly by decreasing the cost-to-serve. Like the market focus, this strategy will lead to a reorientation of the customer base.
High - Selected products for selected markets - Problem solving emphasis - Customer needs knowledge
Price
Low
- Product/Market expanison - Competitive activity - Knowledgeable customers
- Product/Marked proliferation - Marked volatility - Aggressive customers
Low High Cost-to-serve
FIGURE 2.6 Market life cycle: alternative framework
Source: Rangan and Bowman (1995: 140)
Customer portfolio models have received a great deal of attention from management and from the academic world. However, we found little empirical research either to support or to reject customer portfolio models. There are some exceptions that describe the problems and results of the actual use of customer portfolio models. Turnbull and Topcu (1994) tested the Fiocca-approach, identifying problems with data calculation, problems with the interpretation of concepts and problems with the demarcation between ‘low’

A Portfolio Approach to the Development of Differentiated Purchasing Strategies
57
and ‘high’ values. Yorke and Droussiotis (1994) also undertook an empirical study to test the Fiocca-matrix. They reported subjective elements in the model, which could cause problems when actually undertaking the analysis. Turnbull and Zolkiewski (1997) decided to test Shapiro et al.’s (1987) theories relating to gross margin dispersion. The research seems to validate Shapiro et al.’s (1987) findings on the wide range of profit dispersions and the applicability of their customer classification matrix. The observations suggested that the migration of customers over time is more complex than has been suggested by Shapiro et al. (1987). Zolkiewski and Turnbull (2001) conclude that the concept of relationship portfolios provides both scope for academic investigations and managerial prescriptions, especially as an aid for strategic decision making. However, there are some common limitations to customer portfolio models: - the difficulty in collecting the appropriate data an d the time it takes; - the achievement of year-on-year consistency of data; - the exact meaning of the axes (there is a reasonable amount of variability in the suggested means of customer profitability and cost-to serve; moreover, there are different interpretations of ‘difficulty in managing an account’); - in business-to-business markets there is often a lack of accurate market data such as percentage of market share by various firms, implying that some of the axes can not be readily calculated. - the demarcation problem: it is not defined what value represent ‘low’ and ‘high’ cost to serve, which makes it arbitrary to position customers in a matrix.
2.3.5 Customer relationships models
Since the early eighties much academic attention has been paid to relationships in marketing. Developments in information and communication technology have made it possible to communicate and interact more directly with individual customers. This ‘relationship marketing’ focuses on attracting, developing and retaining long-term customer relationships (Berry and Parasuraman, 1991). According to some marketing scientists, like Grönroos (1990, 1994), Gummesson (1987) and Webster (1992), there is a contrast to transactional marketing with a supposed focus on discrete transactions. Although a case can be made against the difference between relationship marketing and transactional marketing (see for instance Gelderman and Tuninga, 1998), it is clear that the renewed attention on relationships in marketing has lead to the development of customer portfolio matrices, based on various aspects of customer relationships. Some of them are inspired by the body of thought of the IMP-group (International Marketing and Purchasing). The objective of the IMP research group was a better understanding of the nature of buyer/seller relationships in industrial markets. The well-known interaction approach to marketing and purchasing emerged form this research, emphasizing the active roll of both buyer and seller (Håkansson, 1982). As exponents of the IMP-group, Cunningham and Homse (1983) presented a customer portfolio analysis which focuses
58
upon the nature of the interactive relationship between supplier and customer companies. They combined two evaluation criteria: the sales volume and the (expected) benefits from technical co-operation. The result is a classification into four categories. The management of customer relationships involves the planning and handling of personal contacts between staff in the supplier company and their counterparts in the customer companies. Therefore, resource constraints must be taken into account. What kind of interaction and attention should be rendered to the various customers? Krapfel et al. (1991) constructed a relationship matrix based on two dimensions: interest commonality and relationship value. When the goals of the buyer and the goals of the seller are compatible, interest commonality is high, and vice versa. High interest commonality is believed to lead to a more co-operative attitude, and vice versa. The relationship value embodies the factors from which dependence on a specific customer relationship flows. In their relationship type matrix four possibilities are described: 1. partner - a relationship having high economic value coupled with high goal compatibility 2. friend - a relationship with low current economic value, but high interest commonality 3. rival - the current economic value of the relationship is high, but a strategic choice has been made to pursue self gain, because interest commonality is low 4. acquaintance - an exchange partner with low current economic value and low interest commonality. The authors concluded that the relationship management style should be varied according to the perceptions of power and interest commonality. In contrast with all other customer portfolio models, the relationship matrix explicitly includes the interests of the buying companies. This approach in marketing is obviously to be the exception to the rule. One of the main tasks in (consumer) marketing is often viewed in terms of customers’ loyalty toward the products or services of a company. Generally speaking, loyalty has a behavior dimension (i.e. repeat purchases) and a perception dimension (i.e. attitude). Taking this as the starting point, Dick and Basu (1994) distinguish four different forms of customer loyalty, based on the relative attitude and the repeat patronage. Strandvik and Liljander (1994) dealt with a comparable question, namely of measuring relationship strength. They proposed a multidimensional measure consisting of relationship commitment and relationship loyalty. The research of Schijns (1998) was also aimed at the measurement of the strength of relationships between consumers and organizations. After the example of Krapfel et al. (1991) customers were categorized as friends, acquaintances, sympathizers, or functionalists. The buying behavior and the attitude of customers are obviously significant aspects of customer relationships, though especially from a marketing perspective, not from a

A Portfolio Approach to the Development of Differentiated Purchasing Strategies
59
purchasing perspective. Relationship strength and customer loyalty are typical examples of marketing performance measures that contrast with direct customer profitability measures. Most studies on relationship models are conceptual by nature. We found a small number of empirical studies, illustrating the possibilities of relationship models in practice. Strandvik and Liljander (1994) performed a small-scale study which resulted in a classification of customers according to their loyalty and commitment to the bank. Turnbull and Zolkiewski (1997) tested the Krapfel et al. (1991) matrix. As the studied relationships were either repeat or follow-on purchases, all customers were positioned in two of the four quadrants in the matrix: partner and friend. Therefore, the scope of the study was rather limited as well. Schijns (1998) presented the results of his empirical study which was aimed at measuring the strength of relationships between consumers and organizations. Members of two organizations were approached, which resulted in more than 1,200 respondents. It was found that customer relationships could be classified and monitored by means of a relationship perception/relationship loyalty matrix. Section 2.3.4 listed some common problems with customer portfolio models: data problems, the meaning of dimensions, and demarcation problems. Obviously, these problems apply to the relationship models as well. In addition, there is no substantial empirical evidence on the adoption and effectiveness of relationship models. The empirical studies merely confirmed the possibility to segment a database of customers into the segments of a portfolio matrix. These studies illustrated some conceptual and measurement problems as well.
2.3.6 Conclusions
In this section we have identified and described the most common portfolio models in marketing management. These models were classified into three groups: models for new products or R&D projects, product (line) portfolio models, and customer portfolio models. The last group was subdivided in models with a profitability focus and models with a relationship focus. We began this study of marketing portfolio models with the proposition that they would be of special interest for purchasing, considering the fact that a buyer and a supplier represent both sides of the same business relationship. Regrettably, to a large extent this proposition has to be rejected. Product portfolio models are limited to the issue of resource allocation: which projects should be invested in and which products are expected to produce economic value? These models show much resemblance to those for selecting a financial portfolio of investments, with no significant role for trading partners. In addition, there are many marketing portfolio models preoccupied with customer profitability, balancing costs and financial benefits (e.g. Fiocca, 1982; Shapiro et al., 1987; and Homburg and Daum, 1997). The customer input is mainly limited to cost related issues such as ‘cost to serve’, ‘price sensitivity’ and

60
‘difficulty in managing’. Surprisingly, the purchasing perspective was seldom found in customer relationship models as well. As an exception should be mentioned the Krapfel et al. (1991) relationship matrix which explicitly includes interest commonality between trading partners: the level to which the goals of the seller and the buyer are compatible. A positive relationship was assumed between interest commonality and the likelihood of co-operative attitudes and behaviors. We have found many different customer portfolio models in the field of marketing management. By taking a closer look, they all seem to deal with the same question of how to allocate different amounts resources to different types of customers. Examples of these varying resources are attention, investment, service, technical support and interaction. Of course, these kinds of allocations decisions are to be justified by an economic criterion, i.e. profitability. Most models asses the relative importance of customers, one way or another, in order to justify choices to be made by marketing management with respect to the allocation of resources. Customer portfolio models are heavily concerned with profitability of individual customers. From a purchasing perspective, it is striking that none of the customer portfolio models explicitly include a dimension or factor with respect to purchasing and supply strategies of buying organizations. Marketing is supposed to be customer orientated. However, most management accounting systems do not focus on customers, but on products, departments, or geographic regions (Foster et al., 1996). Perhaps due to difficulties and costs of gathering data on individual customers, many companies do not dispose of the necessary information that is needed to use a profitability model. In contrast with the increasing number of customer portfolio models, it seems that they are not widely adopted. With a few exceptions, customer portfolio models are not investigated by means of empirical study. Most authors introduce new models or versions of existing portfolio models. Customer relationship models do not always reveal their theoretical assumptions. Customer portfolio models are rarely tested on their assumptions and effectiveness. This applies especially for the customer relationship models. The scope of most studies is rather limited, including a relatively small number of respondents. We have found a small number of empirical studies to the use and effectiveness of customer profitability models as well. The studies revealed the following problems and limitations: - practical problems with data calculation and the categorization of customers (Turnbull and Tupcu, 1994); - subjective elements in the Fiocca-model (Yorke and Drioussiotis, 1994); - the arbitrary definition of ‘high’ and ‘low’ cost to serve (Turnbull and Zolkiewski, 1997).

A Portfolio Approach to the Development of Differentiated Purchasing Strategies
61
To conclude, there are common issues to the implementation of customer portfolio models, including the time taken to collect the appropriate data, the interpretation of dimensions and concepts, and demarcation problems.
2.4 Concluding remarks
The main purpose of the literature study to portfolio models in related disciplines, was to learn from areas with a longer experience than purchasing management. In this concluding section we will list the main ‘lessons’ that we have learned from other disciplines.
Investment theory
- There are many differences in scope and perspective between investment portfolio management and purchasing portfolio management (items, measurement, recommendations, market dynamics and human behavior). - Purchasing managers should be aware of the trade-off between risks and returns (an increase in risk for instance should be matched by a higher reward for the company).
Strategic management
- Every portfolio model for strategic management is a tool, not a comprehensive theory. - Recommendations derived from portfolio analysis should not be followed without additional considerations and managerial judgment. - Classifications are sensitive to the choice of dimensions, variables and weights (specification) and the rule to divide a dimension into a ‘low’ and a ‘high’ category (demarcation). - The customization of a portfolio model leads to a better understanding of the strategic issues at hand, it provides a structure for analysis and facilitates the communication and sharing of judgments and assessments.
Marketing management
- Product portfolio models are limited to the issue of resource allocation with no significant role for trading partners. - Customer portfolio models are preoccupied with customer profitability, again with no significant role for trading partners. - When using a portfolio model, one has to deal with some common problems and issues: difficulties of collecting appropriate data, the interpretation and operationalization of dimensions, and the (arbitrary) demarcation between ‘high’ and ‘low’ categories. With these insights in mind, we will start the next part of our literature study which is devoted to the review of portfolio approaches in purchasing management.


A Portfolio Approach to the Development of Differentiated Purchasing Strategies
63
3 Portfolio approaches in purchasing management
In this chapter we will discuss the main portfolio approaches in purchasing and supply management. In chapter 1 we have posited that a portfolio model is a tool that combines two or more dimensions into a set of heterogeneous categories for which different (strategic) recommendations are provided. Classification tools, like the ABC-analysis, fall outside the scope of this definition. According to the three basic elements of any portfolio model, the portfolio approaches in purchasing will be discussed and evaluated on (1) dimensions, (2), categories, and (3) strategic recommendations. Because we are interested in issues like the general purpose, the reported acceptance and adoption, empirical support for effectiveness, and more general possibilities of a portfolio approach in purchasing, we will also pay attention to (4) use issues. At the end of this chapter we will return to the problem statement of this study, connecting the findings and conclusions of the literature study to the research questions. This will result in the answers to some of the research questions and to the more elaborated and articulated (sub)questions, suitable for further research in the case studies and the survey.
3.1 The Kraljic portfolio approach
In the 1983 Purchasing Conference in Copenhagen, Kraljic, director in the Düsseldorf office of McKinsey Company, presented a new and promising instrument for the determination of a set of differentiated purchasing strategies and a policy for the more fundamental restructuring of the portfolio as a whole. The Harvard Business Review published his seminal paper “Purchasing must become supply management”, which pointed at the need for companies to progress toward more effective supply management, accompanied by a practical portfolio tool for ‘shaping the supply strategy’. By now the HBR-1983 contribution has probably become the most cited and referred to article in the field of purchasing and supply (chain) management. It is noted that Kraljic (1977) presented exactly the same concepts and ideas much earlier, albeit in a German business journal (‘Beschaffung aktuell’) that did not get much attention in the international business and academic community. In a recent interview Kraljic explained that the matrix was developed for Basf in the early seventies (approximately 1973, 1974), within the context of a large cash management

64
project. Purchasing management was just one of the involved business functions. As a McKinsey consultant he was asked to develop a new tool for purchasing, similar to the recently introduced marketing matrices, e.g. BCG matrix (Gelderman and Van Haaster, 2002). Kraljic (1983) proposed a four-stage approach as a framework for ‘shaping the supply strategy’: 1. Classify all the purchased materials or components in terms of profit impact and supply risk. 2. Analyze the supply market for these materials. 3. Determine the overall strategic supply position. 4. Develop materials strategies and actions plans.
Phase 1: classification
On the basis of two dimensions Kraljic (1983) classified all materials and components: profit impact and supply risk. The profit impact of a given item can be defined in terms of the volume purchased, percentage of total cost, or impact on product quality or business growth. Supply risk is a more complex composite dimension. It is assessed in terms of availability, number of suppliers, competitive demand, make-or-buy opportunities, and storage risks and substitution possibilities. Each dimension has two possible values: ‘low’ and ‘high’. The result is a 2x2 matrix and a classification in four categories: - strategic items (high on both dimensions) - bottleneck items (low profit impact, high supply risk) - leverage items (high profit impact, low supply risk) - non-critical items (low on both dimensions). Each of the four categories requires a distinctive approach, in proportion to the strategic implications. Kraljic identified main tasks, the required information and the decision level in organizations for each category, see figure 3.1.

A Portfolio Approach to the Development of Differentiated Purchasing Strategies
65
Procurement focus
Main tasks Required information Decision level
Strategic items
- Accurate demand forecasting - Detailed market research - Development of long-term supply relationships - Make-or-buy decisions - Contract staggering. - Risk analysis. - Contingency planning - Logistics, inventory and vendor control
- Highly detailed market data - Long-term supply and demand trend information - Good competitive intelligence - Industry cost curves
Toplevel (e.g. vice president purchasing)
Bottleneck items
- Volume insurance (at costs premium if necessary) - Control of vendors - Security of inventories - Backup plans
- Medium-term supply demand analysis - Very good market data - Inventory costs - Maintenance plans
Higher level (e.g. department heads).
Leverage items
- Exploitation of full purchasing power - Vendor selection - Product substitution -Targeted pricing strategies/negotiation - Contract/spot purchasing mix - Order volume optimization
- Good market data - Short to medium term demand planning - Accurate vendor data - Price/transport rate of forecasts
Medium level (e.g. chief buyer)
Noncritical items
- Product standardization - Order volume monitoring/ optimization - Efficient processing - Inventory optimization
- Good market overview - Short-term demand forecast - Economic quantity inventory levels
Lower buyer (e.g. buyers)
FIGURE 3.1 Classifying purchasing materials requirements
Source: Kraljic (1983: 112)
Non-critical items require efficient processing, product standardization, order volume and inventory optimization. Leverage items allow the buying company to exploit its full purchasing power, for instance by tough negotiating, target pricing and product substitution. Bottleneck items on the other hand cause a lot of problems and risks. Volume assurance, vendor control, security of inventories and backup plans are recommended. Finally, the strategic items for which a main task in terms of ‘developing long-term supply relationships’ attracts attention. For the strategic items additional analytic techniques, including market analysis, risk analysis, price forecasting, computer simulation and optimization models, might be used.

66
However, in the following three phases the Kraljic approach concentrates on the items identified as strategic in the classification-phase.
Phase 2: market analysis
In phase 2 the strengths of the suppliers are weighted against the company’s own strength as a customer. The following criteria are just examples of possible factors, no list will be equally applicable to every industry, said Kraljic (1993: 113). Indicators for the ‘supplier strength’ Indicators for the ‘company strength’ - market size versus supplier capacity - purchasing volume versus capacity of main units - market growth versus capacity growth - demand growth versus capacity growth - capacity utilization or bottleneck risk - capacity utilization of main units - competitive structure - market share vis-à-vis main competition - ROI and/or ROC - profitability of main end products - cost and price structure - cost and price structure - break-even stability - cost of non-delivery - uniqueness of product and technological - own production capability or integration depth
stability - entry barrier (capital and know-how - entry cost for new sources versus cost of own requirements) production - logistics situation - logistics
Phase 3: strategic positioning
After analyzing the market, where the company weighs the bargaining power of its suppliers against its own strength, the company positions the strategic items in a purchasing portfolio matrix. The matrix shows the relative position of the company and the advised overall purchasing strategy. It depends on the relative power position if a company should choose for an aggressive strategy (‘exploit’), for a defensive strategy (‘diversify’) or for a well-balanced strategy (‘balance’); see figure 3.2. Company strength
High
exploit exploit balance
medium exploit
balance diversify
Low
balance diversify diversify
low medium High Supply market strength
FIGURE 3.2 The purchasing portfolio matrix
Source: Kraljic (1983: 114)

A Portfolio Approach to the Development of Differentiated Purchasing Strategies
67
Phase 4: action plans
Each of the three strategic thrusts has distinctive implications for the individual elements of the purchasing strategy, such as volume, price, supplier selection, material substitution, inventory policy, and so on. Facing a dominant supplier the company must go on the defence. It may have to increase spending on market research or supplier relations, or even consider backward integration. In short, the company may want to generate and use new supply options. The company could consolidate its supply position by concentrating fragmented volumes in a single supplier, accept high prices, and cover the full volume requirements through supply contracts. To reduce the long-term risk of dependence on a single source, however, the company should also search for alternative suppliers or materials, or even consider backward integration (‘diversify’). When bargaining from weakness the company may have to offer long-term contracts and accept higher prices in order to ensure an adequate supply. On the other hand, if the buying company is stronger than the suppliers, it can bargain and act from a position of strength. The company could press for preferential treatment. It can spread volume over several suppliers, exploit price advantages, increase spot purchases, and reduce inventory levels. To conclude, with no dominant party at hand, a well-balanced intermediate strategy is advised. In phase 4 the company should explore a range of supply scenarios. The end result should be a set of documented strategies for critical purchasing materials that specify the timing of and criteria for future action.
3.2 Discussion of the Kraljic approach
In this section the Kraljic approach will be discussed and evaluated, focussed on: - dimensions, - categories, - strategic recommendations, - and use issues.
3.2.1 Dimensions
(a) Theoretical foundation
A general accepted view on the purchasing function is that it should prevent disruptions in production and other activities. Some authors describe the general objectives of purchasing and supply management in terms of ‘the five rights’: professional purchasing should achieve the acquisition of materials: of the right quality, from the right supplier, in the right quantity, at the right time, and at the right price (Dobler and Burt, 1996). The ‘right supply’, the right time, and the right place refer to logistic aspects of supply management. Products should be bought for the ‘right price’, which refers to commercial and financial aspects of purchasing. An attractive feature of the Kraljic portfolio approach

68
is that it encompasses two key variables with respect to these key aspects: ‘profit impact’ is linked to commercial requirements, ‘supply risk’ is (among others) related to logistic issues. However, it is not clear why these particular dimensions are selected for use in Kraljic’s portfolio approach. We have to conclude that Kraljic’s article does not provide any reference to a theoretical foundation or comprehensive perspective. In his article Kraljic offers a basic tool for purchasing management, albeit it without any reference to literature or documented evidence. The tool is developed for practical use. The combination of the two dimensions is intended to “minimize supply vulnerability and make the most of potential buying power” (Kraljic, 1983: 112). Kraljic’s article does not provide any reference to literature, other research or a theoretical foundation. In a recent interview Kraljic acknowledged that the selection of dimensions was based on discussions with purchasing professionals, in search of ‘things that really matter in purchasing’. Basically, a matter of common sense (Gelderman and Van Haaster, 2002). This confirms the idea that there is no clear reference to a comprehensive theory to make a reasonable case for using ‘profit impact’ and ‘supply risk’. This lack of background needs to be further investigated to provide a theoretical foundation to the Kraljic matrix.
(b) Measurement issues
In general, decisions based on portfolio models are proven to be sensitive to the choice of dimensions, factors, and weights. There is a demarcation problem with respect to the measurement of key variables. What is the exact distinction between ‘a high’ and ‘a low’ supply risk? Homburg (1995) and Heege (1981) concluded that the classification of products is therefore rather arbitrary. Olsen and Ellram (1997) emphasized that the weighting of each factor is the most important part of the implementation process, but at the same time very subjective. The decision-makers must come to an agreement on the relative importance of each factor. De Boer (1997) suggested a fully customized approach: organizations should determine their own criteria as well as their own specific threshold values. It is as yet unclear how this determination process should or could take place. To make things worse, what is exactly meant by ‘profit impact’ and ‘supply risk’? These concepts are actually made up of a number of “nebulous concepts without operational dimensions”, as formulated by Ramsay (1996a: 15). Nellore and Söderquist (2000) pointed out that there is a risk that the variables used in portfolio analysis might not be accurate proxies for the dimensions they are supposed to measure. Day (1986) concluded that measurement is considered to be the Achilles’ heel for all portfolio models.
(c) Interdependencies
Olsen and Ellram (1997) observed that the literature on buyer-supplier relationships tends to focus on a single relationship or type of relationship, ignoring or downplaying the important interdependencies between relationships and the important task of allocating scarce resources between relationships. The authors have interpreted this fact
A Portfolio Approach to the Development of Differentiated Purchasing Strategies
69
as a need for the development and use of portfolio models for the management of supplier relationships. Dubois and Pedersen (2002) agreed that the concept of interdependence between relationships is seldom discussed, especially in portfolio models. When the concept is brought up, it has to do with the costs of dealing with different supplier relationships (e.g. Olsen and Ellram, 1997) or with the relationship specific investments of both parties (e.g. Bensaou, 1999). Interdependencies are being discussed in relation to the issue of the optimization of scarce resources (resource allocation). From their IMP-network perspective Dubois and Pedersen (2002: 40) pointed at “other kinds of interdependence among supplier relationships or in relation to other parties in the network context of the buying and the supplying firm, of which the relationship is a part”. Heege (1981) stated that the value of portfolio methods is limited because these models are not appropriate for the development of strategies for a whole set of products, but rather for individual products (aggregation issue). According to Homburg (1995) the most important weakness of portfolio models is the disregard for interdependencies, for connections between products in the matrix (“Systemzusammenhangs”). For each category recommendations are provided in isolation of the recommendations for other categories. For that matter, comparable criticism has been registered with regard to marketing portfolio models which tend to focus on product level decisions as well. Product portfolio models in marketing are said not to recognize possible interdependencies on customer levels, and in particular the fact that customers buy or could buy different products from the same company (cross selling). In general, the portfolio concept stresses the importance of the whole rather than the parts, where it should focus on the interdependencies among management decisions (Turnbull, 1990). However, the alleged lack of attention for interdependencies in purchasing portfolio models can be connected with the ascribed rigor of the application of the strategic recommendations. Some authors hold a rather deterministic view on these recommendations, neglecting the necessity of a customized approach and neglecting the necessity of a reflective and critical attitude of the portfolio user. In other words, no portfolio model should be used or seen as a deterministic model from which rather mathematical strategies or strategic recommendation can be deduced. The issues and questions with respect to portfolio-based recommendations are posited and elaborated in section 3.2.3. In advance, it is clear that portfolio use in purchasing should include attention for the supplier’s side and for the nature of and the connection between (differentiated) actions and strategies.
(d) Confusion over the first matrix-dimensions
Many authors refer to the Kraljic approach as being a single portfolio matrix, based on the dimensions ‘strategic importance’ (or just ‘importance’) and ‘complexity of the supply market’, see for instance Kamann (2000a), Olsen and Ellram (1997), and Lilliecreutz and
70
Ydreskog (1999). It should be noted that Kraljic himself is partly responsible for this confusion over the names of the dimensions. Before introducing the portfolio approach, Kraljic (1983: 111) presented a figure in a matrix format (“Exhibit 1”) that uses ‘importance of purchasing’ and ‘complexity of supply market’ as axes. However, this figure is not a part of the portfolio approach, it does not classify product categories, nor does it provide strategic recommendations. The name of the picture clarifies the purpose of the matrix: ‘stages of purchasing sophistication’. There are four stages: (1) purchasing management, (2) materials management, (3) sourcing management, and (4) supply management. Kraljic (1983: 110) argued that the greater the uncertainty and the vulnerability, the more important supply management becomes. Facing unimportant purchases in not complex supply markets, a less sophisticated procurement focus will do.
3.2.2 Categories
(a) The focus on one category
Kraljic is concerned about disastrous supply disruptions of vital materials. From this perspective it is logical that Kralic should focus on strategic items with a high profit impact and a high supply risk. The second matrix only applies to the strategic items. For the other categories a list is provided merely of main tasks, the required information and the advised decision level. The conclusion is that these categories are rather disregarded. However, in practice the picture will be completed by thinking through possible plans and strategies for bottleneck, leverage and non-critical items. In the next section we will present an elaboration of strategies for all categories, derived from Van Weele (1992, 1994). As will be concluded, other portfolio models in purchasing management make intensive use of Kraljic basic ideas. They too, can be seen as elaborations of the original Kraljic model.
(b) The role of power and dependence
It is generally agreed that the role of power and relative dependence is important in understanding exchange relationships. However, the Kraljic approach does not explicitly deal with issues of power and dependence. Some of the strategic recommendations obviously refer to the prevailing power structure (‘exploit power’), others do not. In the first matrix it is not clear in what way ‘profit impact’ and ‘supply risk’ are related to the relative power position of the buying company. There is no unambiguous relationship between the two dimensions and issues of power and dependence. Presumably, the buyer is more powerful than the supplier in the case of leverage items, while the opposite might be true for bottleneck items. In the second matrix, for the strategic item categories, the role of power is more clearly: a buyer-supplier relationship can be balanced, buyer-dominated or supplier-dominated. The Kraljic approach deals in a rather implicit way with issues of power and dependence. The application implies dealing with two matrices without being clear about the role of power and dependence.
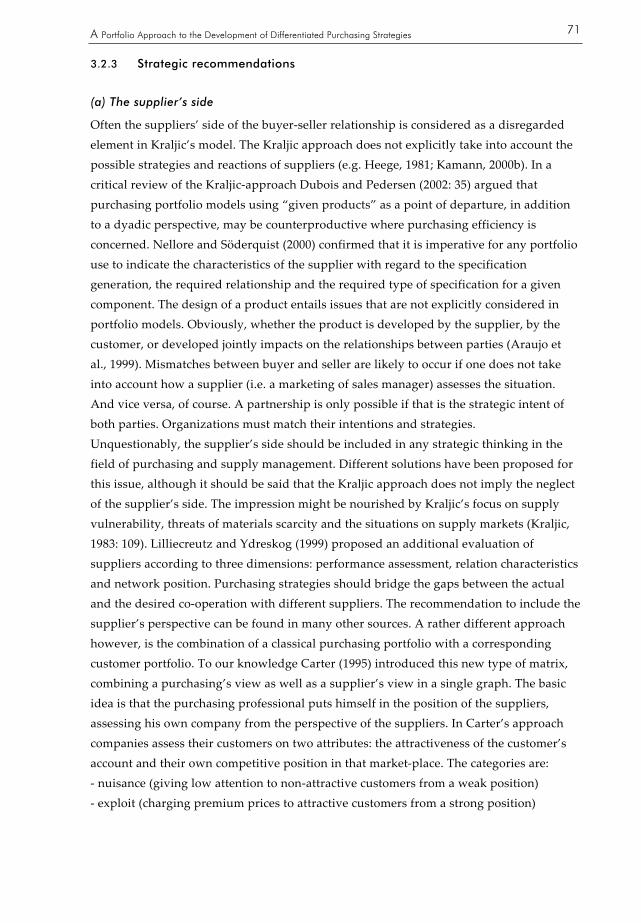
A Portfolio Approach to the Development of Differentiated Purchasing Strategies
71
3.2.3 Strategic recommendations
(a) The supplier’s side
Often the suppliers’ side of the buyer-seller relationship is considered as a disregarded element in Kraljic’s model. The Kraljic approach does not explicitly take into account the possible strategies and reactions of suppliers (e.g. Heege, 1981; Kamann, 2000b). In a critical review of the Kraljic-approach Dubois and Pedersen (2002: 35) argued that purchasing portfolio models using “given products” as a point of departure, in addition to a dyadic perspective, may be counterproductive where purchasing efficiency is concerned. Nellore and Söderquist (2000) confirmed that it is imperative for any portfolio use to indicate the characteristics of the supplier with regard to the specification generation, the required relationship and the required type of specification for a given component. The design of a product entails issues that are not explicitly considered in portfolio models. Obviously, whether the product is developed by the supplier, by the customer, or developed jointly impacts on the relationships between parties (Araujo et al., 1999). Mismatches between buyer and seller are likely to occur if one does not take into account how a supplier (i.e. a marketing of sales manager) assesses the situation. And vice versa, of course. A partnership is only possible if that is the strategic intent of both parties. Organizations must match their intentions and strategies. Unquestionably, the supplier’s side should be included in any strategic thinking in the field of purchasing and supply management. Different solutions have been proposed for this issue, although it should be said that the Kraljic approach does not imply the neglect of the supplier’s side. The impression might be nourished by Kraljic’s focus on supply vulnerability, threats of materials scarcity and the situations on supply markets (Kraljic, 1983: 109). Lilliecreutz and Ydreskog (1999) proposed an additional evaluation of suppliers according to three dimensions: performance assessment, relation characteristics and network position. Purchasing strategies should bridge the gaps between the actual and the desired co-operation with different suppliers. The recommendation to include the supplier’s perspective can be found in many other sources. A rather different approach however, is the combination of a classical purchasing portfolio with a corresponding customer portfolio. To our knowledge Carter (1995) introduced this new type of matrix, combining a purchasing’s view as well as a supplier’s view in a single graph. The basic idea is that the purchasing professional puts himself in the position of the suppliers, assessing his own company from the perspective of the suppliers. In Carter’s approach companies assess their customers on two attributes: the attractiveness of the customer’s account and their own competitive position in that market-place. The categories are: - nuisance (giving low attention to non-attractive customers from a weak position) - exploit (charging premium prices to attractive customers from a strong position)
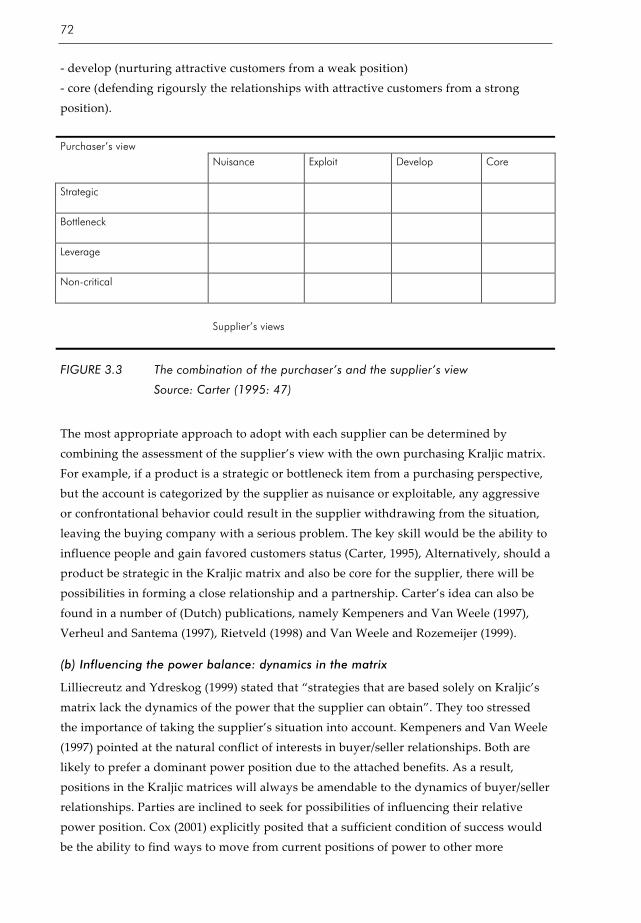
72
- develop (nurturing attractive customers from a weak position) - core (defending rigoursly the relationships with attractive customers from a strong position). Purchaser’s view Nuisance
Exploit Develop Core
Strategic
Bottleneck
Leverage
Non-critical
Supplier’s views
FIGURE 3.3 The combination of the purchaser’s and the supplier’s view
Source: Carter (1995: 47)
The most appropriate approach to adopt with each supplier can be determined by combining the assessment of the supplier’s view with the own purchasing Kraljic matrix. For example, if a product is a strategic or bottleneck item from a purchasing perspective, but the account is categorized by the supplier as nuisance or exploitable, any aggressive or confrontational behavior could result in the supplier withdrawing from the situation, leaving the buying company with a serious problem. The key skill would be the ability to influence people and gain favored customers status (Carter, 1995), Alternatively, should a product be strategic in the Kraljic matrix and also be core for the supplier, there will be possibilities in forming a close relationship and a partnership. Carter’s idea can also be found in a number of (Dutch) publications, namely Kempeners and Van Weele (1997), Verheul and Santema (1997), Rietveld (1998) and Van Weele and Rozemeijer (1999).
(b) Influencing the power balance: dynamics in the matrix
Lilliecreutz and Ydreskog (1999) stated that “strategies that are based solely on Kraljic’s matrix lack the dynamics of the power that the supplier can obtain”. They too stressed the importance of taking the supplier’s situation into account. Kempeners and Van Weele (1997) pointed at the natural conflict of interests in buyer/seller relationships. Both are likely to prefer a dominant power position due to the attached benefits. As a result, positions in the Kraljic matrices will always be amendable to the dynamics of buyer/seller relationships. Parties are inclined to seek for possibilities of influencing their relative power position. Cox (2001) explicitly posited that a sufficient condition of success would be the ability to find ways to move from current positions of power to other more

A Portfolio Approach to the Development of Differentiated Purchasing Strategies
73
favorable positions. The Kraljic framework however, does not provide guidelines for movements within the matrix. Under which conditions is it advisable and feasible to pursue movements in the (first) matrix? How should those movements be accomplished? There is no explicit connection between the strategic recommendations in the (first) Kraljic matrix, prevailing business conditions, purchasing goals and purchasing strategies.
(c) The nature of the strategic recommendations
Some argue that portfolio models are not designed to deal with proactive thinking about new opportunities (Day, 1986; Cox, 1997). Portfolio analysis is said to provide merely guidance for operation action. The methodology describes what is, it does not provide us with any proactive thinking about what can, or should be done to change the existing reality of power (Cox, 1997). For this matter, we only partly subscribe to this firm conclusion. In the first matrix the recommendations are quite reactive by nature. They react and adapt to the prevailing structure of power in buyer-supplier relationships. It is not clear if and how other positions in the matrix are to be pursued through the implementation of the recommended ‘main tasks’. However, the second matrix - for the strategic items - is especially designed to develop counterstrategies vis-à-vis key suppliers (Kraljic, 1983). By plotting the buying strengths against the strengths of the supply market, three basic power positions are identified and associated with three different supplier strategies: balance, exploit, and diversify. This ‘reverse marketing’-approach intends to identify areas of opportunity or vulnerability, assess supply risks, and derive basic strategic thrusts. It should be noted however, that the strategies are rather generic by nature, providing only rough indications for the most appropriate supplier strategies. Discussing Kraljic and purchasing portfolio models, most publications are limited to the first matrix with the well-known categories: strategic, leverage, non-critical and bottleneck. It might be assumed that all strategic products are to be managed by means of (strategic) partnerships. Looking at the second matrix, we must conclude that this was certainly not Kraljic’s intention.
3.2.4 Use issues
(a) General purpose
The introduction of the Kraljic portfolio approach can be considered as a major breakthrough in the development of professional purchasing. The method is an important step beyond the relative simple ABC-analysis. The Kraljic approach filled the gap between the developing practice and the lagging theory in the field of purchasing. The portfolio approach is a useful tool with diagnostic and prognostic powers. It provided a comprehensive view of the large number of items that companies usually buy. The general idea of the Kraljic approach is to “minimize supply vulnerability and make
74
the most of potential buying power” (Kraljic, 1983: 112). By categorizing these items, sensible guidelines are derived for the management of supplier relationships. It can be concluded that Kraljic’s approach represents the most important single diagnostic and prescriptive tool available to purchasing and supply management (Syson, 1992). However, others find the Kraljic approach counterproductive, providing recommendations either to exploit power (if the customer is in power), or to avoid risk associated with the supplier exercising power (Dubois and Pedersen, 2002). Some argue that the complexity of business decisions does not allow for simple recommendations. How could one deduce strategies from a portfolio analysis that is based on just two basic dimensions? (Heege, 1981). However, a technique should not be criticized because it simplifies, but rather because it focuses on unimportant factors. After all, the logic for portfolio techniques is in the first place a tool for management so that complex problems can be simplified and solved in an acceptable way. The strength of any portfolio model is that it breaks down a complex situation to its basic dimensions.
(b) Possibilities for customization
An important benefit is that the actual using and customizing of a portfolio model will lead to a better understanding of the strategic issues at hand. The process of customizing and using a portfolio model is in itself a strategic thinking process (Wind and Mahajan, 1981). During this process the decision makers have to discuss inconsistencies among themselves and agree on different elements of the portfolio (Olsen and Ellram, 1997). Portfolio models provide a structure for analysis that facilitates the communication and sharing of judgements and assumptions about strategic issues (Day, 1986). Kraljic’s portfolio approach allows for sufficient customization. Kraljic introduced matrices and dimensions that are described in general terms, allowing for customized use. The dimensions ‘profit impact’ and ‘supply risk’ (in the first matrix) can be defined in different ways. For the second matrix, exemplary lists of possible factors are provided, to be adapted to individual requirements and wishes. Kraljic (1983: 113) clearly stated that “no list of evaluation criteria is equally applicable to every industry”.
(c) Acceptance and adoption
Kraljic (1983) made a reasonable case for the usefulness of the portfolio approach by describing the experiences of four large industrial companies: a welding materials producer, a maker of electrical equipment, a chemical company and a heavy-equipment maker. The adoption of the portfolio analysis has been a rather gradual process. In the eighties the Kraljic matrix received hardly any attention, with some notable exceptions: Heege (1981) in Germany, Elliott-Shircore and Steele (1985) in Great Britain, and Van Weele (1988) in the Netherlands. It might be expected that the speed of adoption will be rather low. Even in the early nineties Homburg (1995) suggested that purchasing portfolio models are not very popular with purchasing (“Beschaffungsportfolios erfreuen sich, unseres Wissens, noch keiner sehr großen Beliebtheit”). Not until the late nineties

A Portfolio Approach to the Development of Differentiated Purchasing Strategies
75
many more publications refer to a portfolio approach in purchasing, indicating higher levels of acceptance and adoption. Now, many years after its introduction, the purchasing portfolio approach is being used by several other large companies, for instance Shell, Alcatel, Philips en Siemens (Van Weele, 2000), DSM (Louwers et al., 1999) and Océ van der Grinten (Wynstra, 1998). In a survey of Dutch companies Boodie (1997) found that 44% of the responding purchasing managers said that they used Kraljic for formulating purchasing strategies. A peak of 80% was found for industrial companies that operate on a mass production basis. Kamann (2000a) estimated that 20% of the Dutch companies uses a portfolio method for the management of their supplier base. Lamming and Harrison (2001) stated that Kraljic’s matrix remains the foundation of purchasing strategy for many organizations across sectors. In the course of time the Kraljic approach has entered a lot of textbooks on purchasing and supply management. Especially in Western Europe Kraljic has received large-scale recognition and has gained an increasing degree of adoption. Gradually Kraljic has gained acceptance in other countries, notably in the USA, Canada and Northern Europe.
3.3 Elaboration of purchasing strategies for all categories
Kraljic uses the classification (in strategic, bottleneck, leverage and non-critical items) for the following purposes: 1. identifying main tasks, the required information and the decision level in organizations per category; 2. identifying strategic items for which the next three phases (of market analysis, strategic positioning and action plans) are completed. Kraljic’s approach concentrates on strategic items without paying much attention to strategic aspects of the other product categories. It is therefore remarkable that nowadays the majority of practitioners and tutors are unfamiliar with Kraljic’s second matrix. Discussing Kraljic and purchasing portfolio models, most publications are limited to the first matrix. There are authors who have elaborated the ‘main tasks’ for bottleneck, non-critical and leverage items into strategic recommendations: one overall purchasing strategy for each cell/ category. These elaborations are usually limited to the construction of one matrix. See for instance Van Weele (1992, 1994), Syson (1992), and Elliott-Shircore and Steele (1985). It is recognized that these portfolio models are variations on and refinements of the original first Kraljic matrix. We will address this issue later in this chapter. In this section we present a typical elaboration of Kraljic’s first matrix, adapted from Van Weele (1992, 1994). In line with ‘the main tasks’, Van Weele and other authors, identified four general purchasing strategies for the corresponding categories: - partnerships for strategic products - assurance of supply for bottleneck products
76
- exploitation of power for leverage products (‘divide and rule’) - systems contracting for non-critical products. As a rule, strategic products together with the leverage products make up 80% of total turnover. This means that minor changes in price levels or other developments in the supplier market will have an immediate impact on the end product’s cost price. Strategic products represent a considerable value to the organization in terms of a large impact on profit and a high supply risk. Examples are engines and gearboxes for automobile manufactures, turbines for the chemical industry and bottling equipment for breweries. Sometimes strategic products can only be bought from one supplier (single source). Since the organization experiences significant supply risk, it will strive for a partnership relationship with suppliers of these products. Close and lasting cooperation with suppliers must lead to improvements in product quality, delivery reliability, lead times, product development, product design, and cost reduction. By intensifying the relationship with suppliers the company tries to reduce its supply risk to a minimum, while actively pursuing cost reduction at the same time. Discussing Kraljic and purchasing portfolio models, most publications are limited to the first matrix with the well known categories: strategic, leverage, non-critical and bottleneck. It might be assumed that all strategic products are to be managed by means of (strategic) partnerships. Looking at the second matrix, we must conclude that this would be in variance with Kraljic’s intention. In later work Van Weele (1997) included the issue of power and dominance in buyer-supplier relationships, distinguishing three possibilities in the strategic quadrant: a buyer dominated segment, a supplier dominated segment and a balanced relationship. Bottleneck products have less influence on the financial results, but they are vulnerable in regard to their supply. Suppliers have a dominant power position. The purchasing strategy is therefore primarily focussed on assurance of supply, if necessary even at additional cost. Keeping extra stocks of the materials concerned or developing consigned stock agreements with suppliers are examples of this strategy. To determine the most important bottlenecks and their consequences a risk analysis should be employed. Contingency planning might be a possibility for dealing with unexpected bad situations. In general measures should be taken that will lead to a more balanced relationship with the suppliers of these products. In terms of the Kraljic matrix this means moving from the unfavourable ‘bottleneck product’-quadrant toward positions with less supply risk and/or less financial impact. The purchasing strategy would imply the search for alternative products and services. Supplier development would be a suitable purchasing strategy in pursuit of a less dependent buying position.
A Portfolio Approach to the Development of Differentiated Purchasing Strategies
77
In general leverage products can be obtained from various suppliers. These products represent a relatively large share of the end product’s cost price in combination with a relatively low supply risk. As a consequence, purchasing has interesting possibilities for negotiating. Small percentages of cost savings involve large sums of money. At the same time the supply risk is minimal. These characteristics justify an aggressive approach to the supply market. A purchasing strategy based on the principles of competitive bidding can be pursued. Since suppliers and products are interchangeable, there is no need for long-term supply contracts. In general, a coordinated purchasing approach in the form of a centrally negotiated umbrella agreement with preferred suppliers is appropriate here. Using departments in the organization can place call-off orders as an administrative formality. This strategy is also suited for more costly non-production areas. The buying power is actively used as a means for getting better deals with interchangeable suppliers. Non-critical products usually have a small value per unit and there are many alternative suppliers. From a purchasing point of view, these items produce only few technical or commercial problems. As a rule routine products require 80% of the purchasing department’s time, while they often represent less than 20% of the purchasing turnover. The administrative work should be organized in a very efficient way. The handling of these products requires a purchasing strategy aimed at reducing the logistic and administrative complexity. Systems contracting is generally advised as the way of doing business with suppliers of routine products. Of course, on a short-term basis, there is no need for long-term supply contracts. The main idea is to enhance purchasing power by standardization and bundling of purchasing requirements. Relevant for the purchasing strategy in case of routine products are: - standardizing the product assortment to reduce product variety; - systems contracts for groups of suppliers (for instance MRO items), instead of buying a few products from one supplier; - (as a consequence) reducing the number of suppliers; - delegating the ordering function to user departments; - reducing the number of invoices. In addition to the systems-supported strategies, some companies have introduced the purchasing card. For small single transactions purchasing cards are very cost-effective, for they would relatively cost a fortune in paperwork and time when dealt with by the purchasing department. Other possibilities for non-production are consortium buying and the use of trading houses. Syson (1992) discussed a very comparable elaboration of strategies, based on the original Kraljic model. More interesting is the operationalization suggested with respect to the measurement of the basic dimensions. The number of suppliers who are able and willing to supply a specific item, is interpreted as a reflection of the supplier risk and the relative
78
strength of suppliers. The value of a purchased item has a relative significance. It is relative to: (1) the total value of purchases (the percentage of buyers total purchase) and, (2) the degree of importance attached to any particular sum by the seller (the percentage of suppliers total sale). These key indices constitute a measure for the company’s strength in any particular buyer/seller relationship. Very similar to the first Kraljic matrix is the supply strategy square, developed by Hadeler and Evans (1994). The basic dimensions for positioning the product categories are the product’s complexity and the product’s value potential. Products that are not very complex and have little value potential should be bought with simple contracts. The key is to find an efficient and dependable supplier and negotiate a blanket order agreement. For expensive non-technical products it is worth the effort of searching the globe for best deals. By means of global trading companies can use their opportunities for corporate leveraging. On the other end of the spectrum, complex technical items that do not make up a big part of one’s spending, would require an entirely different approach. Here, close relationships are more important than a worldwide search for best buys. It is critical to get suppliers who are innovative and willing to work with the company, to identify new applications, better solutions and substitute products. Strategic products require strategic partnerships. The company needs close long-term working relationships with these suppliers.
3.4 Supply positioning analysis
The portfolio approach of Elliott-Shircore and Steele (1985) starts with the listing of all the goods and services which are purchased by an organization. These items are plotted in a two-dimensional chart in which the X axis represents the profit/value potential of the item (or category) and the Y axis represents supply exposure/vulnerability. The result is a procurement positioning overview, as shown in figure 3.4. Recognizing the appropriate category enables the determination of the resource and effort that should be allotted and the basic approaches and methods that should be adopted. The procurement positioning overview is now better known as the supply positioning analysis, a concept introduced by Steele and Court (1996: 55).
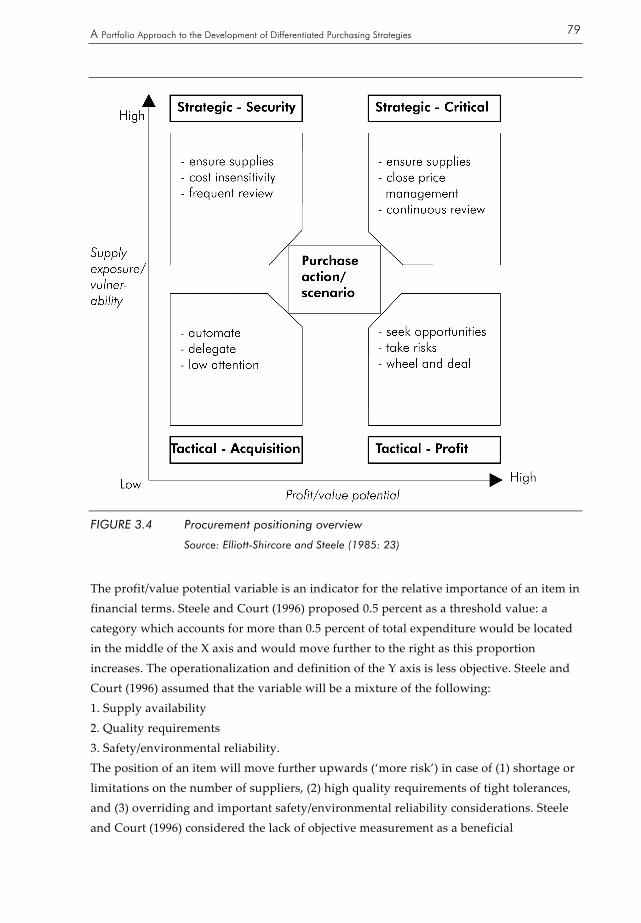
A Portfolio Approach to the Development of Differentiated Purchasing Strategies
79
FIGURE 3.4 Procurement positioning overview
Source: Elliott-Shircore and Steele (1985: 23)
The profit/value potential variable is an indicator for the relative importance of an item in financial terms. Steele and Court (1996) proposed 0.5 percent as a threshold value: a category which accounts for more than 0.5 percent of total expenditure would be located in the middle of the X axis and would move further to the right as this proportion increases. The operationalization and definition of the Y axis is less objective. Steele and Court (1996) assumed that the variable will be a mixture of the following: 1. Supply availability 2. Quality requirements 3. Safety/environmental reliability. The position of an item will move further upwards (‘more risk’) in case of (1) shortage or limitations on the number of suppliers, (2) high quality requirements of tight tolerances, and (3) overriding and important safety/environmental reliability considerations. Steele and Court (1996) considered the lack of objective measurement as a beneficial
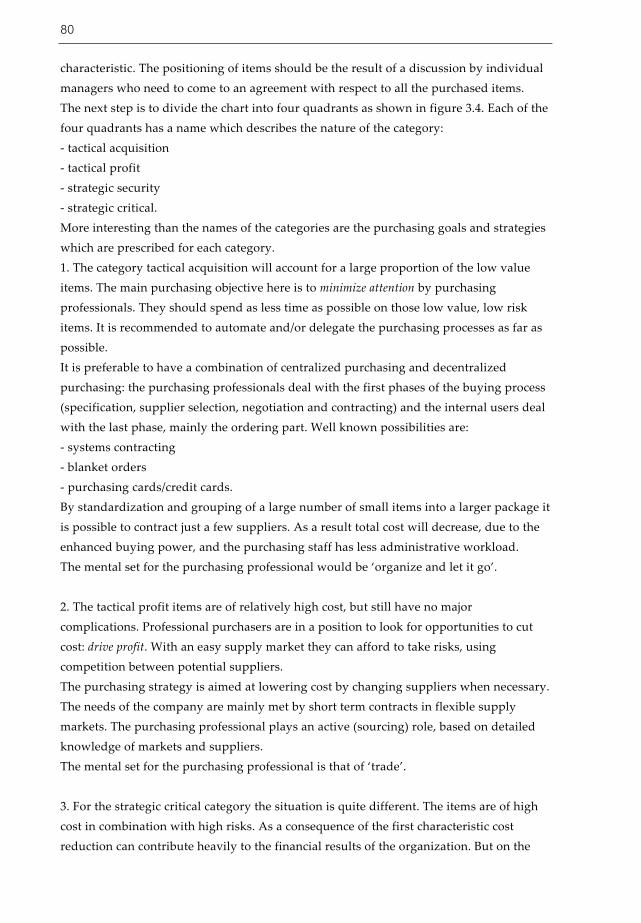
80
characteristic. The positioning of items should be the result of a discussion by individual managers who need to come to an agreement with respect to all the purchased items. The next step is to divide the chart into four quadrants as shown in figure 3.4. Each of the four quadrants has a name which describes the nature of the category: - tactical acquisition - tactical profit - strategic security - strategic critical. More interesting than the names of the categories are the purchasing goals and strategies which are prescribed for each category. 1. The category tactical acquisition will account for a large proportion of the low value items. The main purchasing objective here is to minimize attention by purchasing professionals. They should spend as less time as possible on those low value, low risk items. It is recommended to automate and/or delegate the purchasing processes as far as possible. It is preferable to have a combination of centralized purchasing and decentralized purchasing: the purchasing professionals deal with the first phases of the buying process (specification, supplier selection, negotiation and contracting) and the internal users deal with the last phase, mainly the ordering part. Well known possibilities are: - systems contracting - blanket orders - purchasing cards/credit cards. By standardization and grouping of a large number of small items into a larger package it is possible to contract just a few suppliers. As a result total cost will decrease, due to the enhanced buying power, and the purchasing staff has less administrative workload. The mental set for the purchasing professional would be ‘organize and let it go’. 2. The tactical profit items are of relatively high cost, but still have no major complications. Professional purchasers are in a position to look for opportunities to cut cost: drive profit. With an easy supply market they can afford to take risks, using competition between potential suppliers. The purchasing strategy is aimed at lowering cost by changing suppliers when necessary. The needs of the company are mainly met by short term contracts in flexible supply markets. The purchasing professional plays an active (sourcing) role, based on detailed knowledge of markets and suppliers. The mental set for the purchasing professional is that of ‘trade’. 3. For the strategic critical category the situation is quite different. The items are of high cost in combination with high risks. As a consequence of the first characteristic cost reduction can contribute heavily to the financial results of the organization. But on the

A Portfolio Approach to the Development of Differentiated Purchasing Strategies
81
other hand it will be essential to ensure availability of supply. Professional purchasers need to spend much time and energy in managing suppliers. This category requires the highest level of buying skills. Possible strategic actions would be: finding new suppliers (supplier development), overcoming some of the special considerations which prevent the use of competition, and ensuring that existing suppliers are capable of meeting future demands. Buyers will need to obtain detailed information on individual suppliers and be seeking to develop them to mutual advantage. In the strategic critical category we would expect to find strategic partnerships, such as co-makership. The mental set for the purchasing professional would be ‘checking and searching’. 4. The strategic security items are also critical to the success of the organization. Therefore, the major goal would be: ensure supply. Cost considerations come in the second place. We would expect to see a decrease in the sensitivity to price. Still, purchasing professionals should be aware of increasing cost, i.e. moving to the right in the positioning analysis and becoming ‘strategical critical’. The assurance of supply can be provided by long-term contracts, for instance with the use of indices and formulae to fix prices. Another way of ensuring supply would be to hold buffer stocks or to agree that suppliers will do so. The mental set for the purchasing professional is ‘reduce the problem’.
Discussion
It is quite obvious that there is a striking resemblance with the Kraljic approach and the elaborations such as those by Van Weele (1994) and Syson (1992). Elliott-Shircore and Steele (1985) used (practically) the same dimensions and provided (practically) identical recommendations for the same four categories. A ‘difference’ would be that in the supply positioning analysis the four categories have other names. In conclusion, there are no principal differences with Kraljic’s approach. There are some publications that refer to the supply positioning analysis, using labels such as ‘tactical acquisition’ and ‘strategic critical’. The literature search resulted in just a few documented examples of the application of portfolio techniques in purchasing and supply management. Carter (1997) described the practical application of the supply positioning analysis at SGX Corporation, a conglomerate with five major strategic business units. SGX wanted to make better use of the likely advantages as a result of combining purchasing and supply possibilities across SBU’s. For all products, the positions in the matrix and the strategic actions were identified, emphasizing the special possibilities of joint SBU-buying. Examples are: corporate blanket purchase orders with large national distributors (tactical acquisition), joint safety stocks and assisting each other with urgent requirements (strategic security), world wide commodity analysis and competitive bidding (tactical profit), and to manage certain key suppliers on a group

82
basis (strategic critical). Carter (1997) concluded that this portfolio approach proved to be a powerful tool for coordinating the sourcing patterns of the various strategic business units. Another application of the supply positioning analysis is provided by Croom (2000), illustrating how MRO items could benefit from the implementation of e-procurement. As a direct consequence of the advantages of e-procurement, MRT items may switch from ‘tactical acquisition’ to ‘tactical profit’ or even ‘strategic critical’. Improved information transparency makes it possible to adopt a more ‘strategic’ procurement approach.
3.5 Cunningham’s interaction approach to portfolio analysis
In the context of the IMP-research Cunningham (1982) presented an ‘interaction approach to purchasing strategy’. For the formulation of purchasing strategy Cunningham advocated three basic phases: an analysis of the purchasing environment, the setting of purchasing objectives and the choice of alternative purchasing strategies for their achievement. An important part of the environmental analysis is the analysis of supplier relationships which consists of a portfolio analysis, a supplier performance analysis, and a purchasing power analysis. Cunningham (1982) advocated a portfolio analysis of the suppliers currently used, and also desired by a company. The main idea is that the supplier base should be a balanced portfolio. Various criteria can be used to determine (un)balance in the portfolio of supplier relationships. Referring to the concept of a balanced portfolio of financial investments, Cunningham advanced the thesis that it is beneficial to have relationships with different types of suppliers. Two examples are given to support his view. (1) The spread of suppliers across different countries reduces the risks of movements in currency exchange rates and inflation. (2) Having suppliers at different stages of development, or of varying sizes, is beneficial because each category of suppliers requires a different level of resource commitment for effective interaction. Each of them may bring different types of benefits, for instance one supplier serves as a source of technical innovation, one for non-standard items, and another for low cost supply. According to Cunningham (1982) the achievement of a balanced portfolio of supplier relationships is an important purchasing objective, in addition to the fundamental purchasing objectives with respect to the assurance of (long term) supply in an efficient way. Suppliers are or should be selected on the basis of the benefits which can be obtained by the company. Therefore the portfolio analysis of supplier relationships must be related to the key purchasing objectives and the key strategies to achieve them. Cunningham identifies four key purchasing objectives:

A Portfolio Approach to the Development of Differentiated Purchasing Strategies
83
1. Security of supply - to stabilize supply inputs and prices over time or to avoid over-dependence on a single source of supply. 2. Matching with appropriate supplies - to ensure that suppliers have desired characteristics for long-term relationships and will be able to meet specifications and price requirements. 3. Controlling relationships - to achieve satisfactory results, such as developing increased power over the supplier, closer collaboration, etc. 4. Cost saving and stimulating competition - to achieve greater cost efficiency in purchasing. A wide range of actions can be identified to achieve these broad strategic objectives.
Conclusion
The most remarkable point in Cunningham’s interaction approach to portfolio analysis is that it is very deviating from the mainstream portfolio approaches. No clear differences are made between supplier categories and the approach does not include a classification of items or suppliers. As a consequence no strategic recommendations can be given with respect to the issue of differentiated supplier strategies. Cunningham just made the point that different suppliers can provide for different benefits and that a balanced portfolio of suppliers is important. The conclusion is that Cunningham’s interaction approach does not meet the basic requirements of a purchasing portfolio approach.
3.6 The Olsen and Ellram approach
Olsen and Ellram (1997) suggested a portfolio approach for managing supplier relationships. Based on a literature review and the critique of portfolio models in general, a three-step approach is recommended.
3.6.1 Description of the model
The first step in the portfolio analysis is to categorize the company’s purchases according to the strategic importance of the purchase and the difficulty of managing the purchase situation. A list of nine factors influencing the strategic importance of a purchase is provided. A distinction is made in competence, economic and image factors. In total, six illustrative factors are listed, influencing the difficulty of managing the purchase situation. A distinction is made between product characteristics, supply market characteristics and environmental characteristics. Due to the relative large number of possible factors, the weighting of factors on their perceived importance is a vital, but very complex part of the portfolio analysis. The dimensions make up a portfolio model with four categories that have the same names as the categories in the (first) Kraljic matrix: strategic, bottleneck, leverage and non-critical items. Normative guidelines are provided on how to manage the relationships associated with each of the four categories.
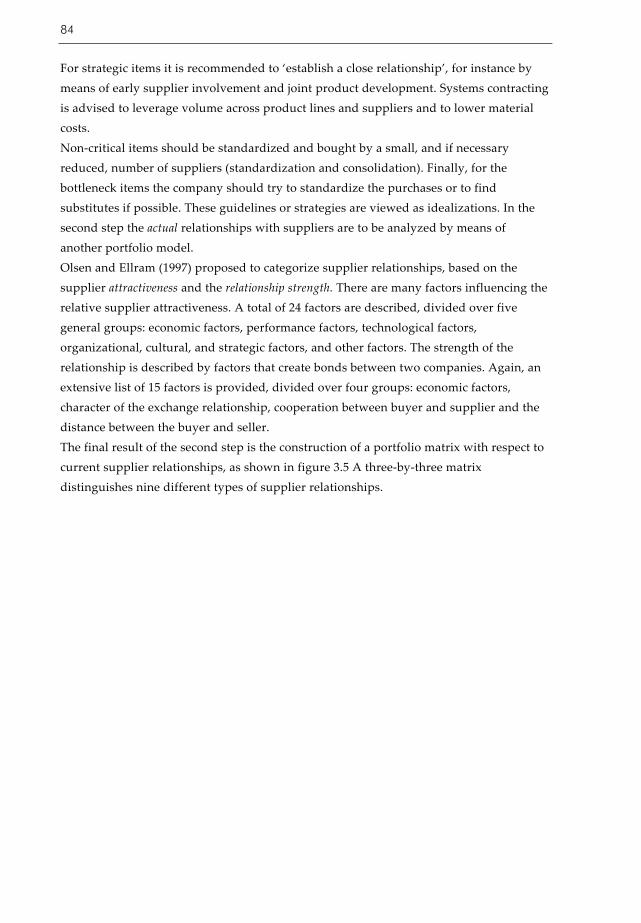
84
For strategic items it is recommended to ‘establish a close relationship’, for instance by means of early supplier involvement and joint product development. Systems contracting is advised to leverage volume across product lines and suppliers and to lower material costs. Non-critical items should be standardized and bought by a small, and if necessary reduced, number of suppliers (standardization and consolidation). Finally, for the bottleneck items the company should try to standardize the purchases or to find substitutes if possible. These guidelines or strategies are viewed as idealizations. In the second step the actual relationships with suppliers are to be analyzed by means of another portfolio model. Olsen and Ellram (1997) proposed to categorize supplier relationships, based on the supplier attractiveness and the relationship strength. There are many factors influencing the relative supplier attractiveness. A total of 24 factors are described, divided over five general groups: economic factors, performance factors, technological factors, organizational, cultural, and strategic factors, and other factors. The strength of the relationship is described by factors that create bonds between two companies. Again, an extensive list of 15 factors is provided, divided over four groups: economic factors, character of the exchange relationship, cooperation between buyer and supplier and the distance between the buyer and seller. The final result of the second step is the construction of a portfolio matrix with respect to current supplier relationships, as shown in figure 3.5 A three-by-three matrix distinguishes nine different types of supplier relationships.

A Portfolio Approach to the Development of Differentiated Purchasing Strategies
85
FIGURE 3.5 Analysis of supplier relationships
Source: Olsen and Ellram (1997: 107)
In the third step action plans are developed for moving from current to ideal supplier relationships. The last step is meant to be the link between the previous steps, by comparing the results of the corresponding analyses. The cells in figure 3.5 are described in three groups. Based on the categorization of the associated purchase(s) in the first matrix, examples of possible strategies for relationships are provided. Cell 1, cell 2, and cell 4 include relationships with a high or moderate supplier attractiveness and a low or average relationship strength. A number of different strategies are recommended, based on the classifications of purchases in the first matrix. In case of strategic items it is very important to strengthen the relationship and to keep a loyal supplier. A relationship can be strengthened by enhancing the communication, providing more volume, or involving the supplier in product development. If the item is a non-critical or leverage purchase, the company could consider to strengthen the relationship without allocating considerable resources to the relationship. For instance, by giving the supplier more volume. Action plans for these purposes require long-term resource allocation, because it takes time to build relationships. Cell 3, cell 5, and cell 6 contain relationships where the supplier has a moderate or high relative attractiveness and the relationship is relatively strong. For all types of items, a strategy is recommended that would include the reallocation of resources in order to
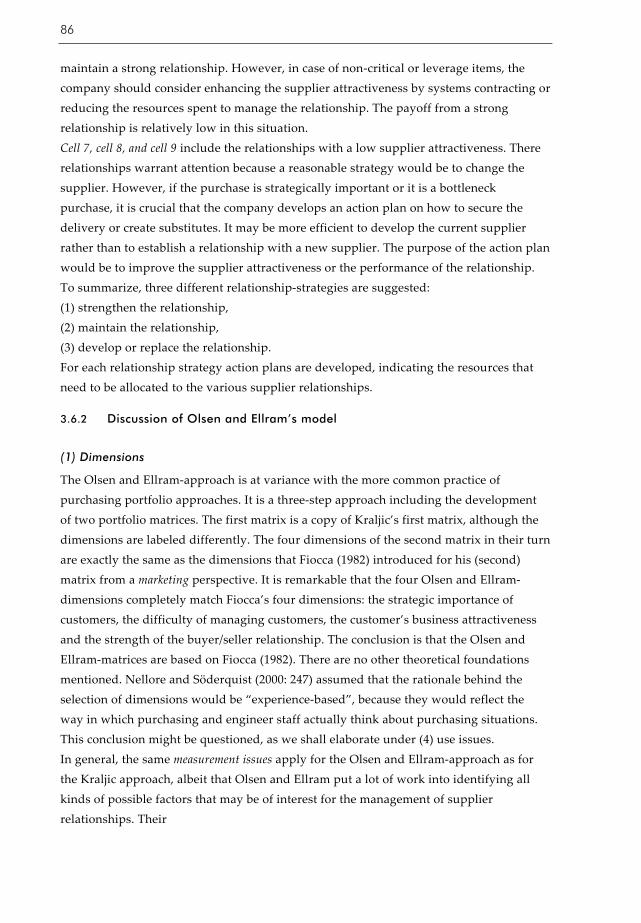
86
maintain a strong relationship. However, in case of non-critical or leverage items, the company should consider enhancing the supplier attractiveness by systems contracting or reducing the resources spent to manage the relationship. The payoff from a strong relationship is relatively low in this situation. Cell 7, cell 8, and cell 9 include the relationships with a low supplier attractiveness. There relationships warrant attention because a reasonable strategy would be to change the supplier. However, if the purchase is strategically important or it is a bottleneck purchase, it is crucial that the company develops an action plan on how to secure the delivery or create substitutes. It may be more efficient to develop the current supplier rather than to establish a relationship with a new supplier. The purpose of the action plan would be to improve the supplier attractiveness or the performance of the relationship. To summarize, three different relationship-strategies are suggested: (1) strengthen the relationship, (2) maintain the relationship, (3) develop or replace the relationship. For each relationship strategy action plans are developed, indicating the resources that need to be allocated to the various supplier relationships.
3.6.2 Discussion of Olsen and Ellram’s model
(1) Dimensions
The Olsen and Ellram-approach is at variance with the more common practice of purchasing portfolio approaches. It is a three-step approach including the development of two portfolio matrices. The first matrix is a copy of Kraljic’s first matrix, although the dimensions are labeled differently. The four dimensions of the second matrix in their turn are exactly the same as the dimensions that Fiocca (1982) introduced for his (second) matrix from a marketing perspective. It is remarkable that the four Olsen and Ellram-dimensions completely match Fiocca’s four dimensions: the strategic importance of customers, the difficulty of managing customers, the customer’s business attractiveness and the strength of the buyer/seller relationship. The conclusion is that the Olsen and Ellram-matrices are based on Fiocca (1982). There are no other theoretical foundations mentioned. Nellore and Söderquist (2000: 247) assumed that the rationale behind the selection of dimensions would be “experience-based”, because they would reflect the way in which purchasing and engineer staff actually think about purchasing situations. This conclusion might be questioned, as we shall elaborate under (4) use issues. In general, the same measurement issues apply for the Olsen and Ellram-approach as for the Kraljic approach, albeit that Olsen and Ellram put a lot of work into identifying all kinds of possible factors that may be of interest for the management of supplier relationships. Their
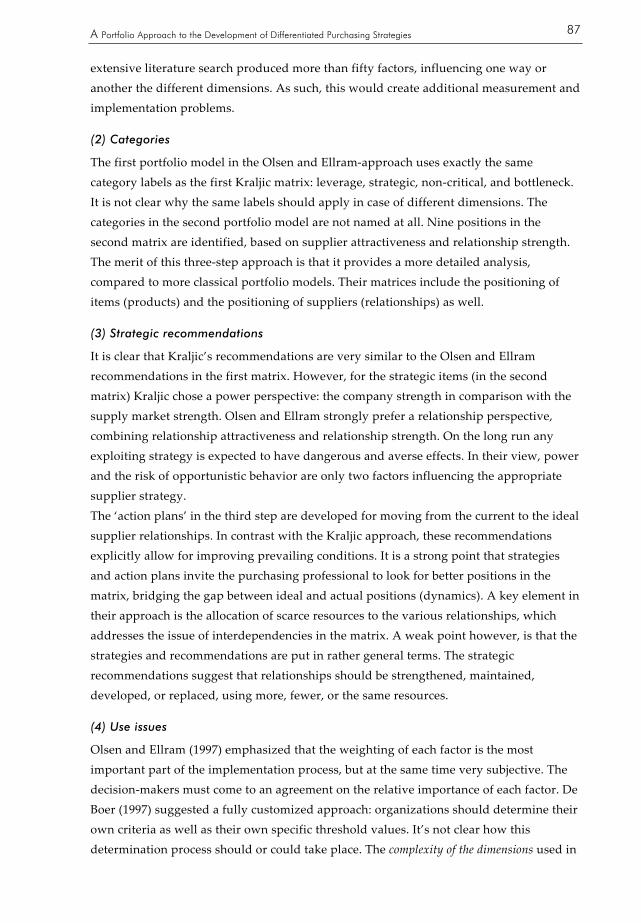
A Portfolio Approach to the Development of Differentiated Purchasing Strategies
87
extensive literature search produced more than fifty factors, influencing one way or another the different dimensions. As such, this would create additional measurement and implementation problems.
(2) Categories
The first portfolio model in the Olsen and Ellram-approach uses exactly the same category labels as the first Kraljic matrix: leverage, strategic, non-critical, and bottleneck. It is not clear why the same labels should apply in case of different dimensions. The categories in the second portfolio model are not named at all. Nine positions in the second matrix are identified, based on supplier attractiveness and relationship strength. The merit of this three-step approach is that it provides a more detailed analysis, compared to more classical portfolio models. Their matrices include the positioning of items (products) and the positioning of suppliers (relationships) as well.
(3) Strategic recommendations
It is clear that Kraljic’s recommendations are very similar to the Olsen and Ellram recommendations in the first matrix. However, for the strategic items (in the second matrix) Kraljic chose a power perspective: the company strength in comparison with the supply market strength. Olsen and Ellram strongly prefer a relationship perspective, combining relationship attractiveness and relationship strength. On the long run any exploiting strategy is expected to have dangerous and averse effects. In their view, power and the risk of opportunistic behavior are only two factors influencing the appropriate supplier strategy. The ‘action plans’ in the third step are developed for moving from the current to the ideal supplier relationships. In contrast with the Kraljic approach, these recommendations explicitly allow for improving prevailing conditions. It is a strong point that strategies and action plans invite the purchasing professional to look for better positions in the matrix, bridging the gap between ideal and actual positions (dynamics). A key element in their approach is the allocation of scarce resources to the various relationships, which addresses the issue of interdependencies in the matrix. A weak point however, is that the strategies and recommendations are put in rather general terms. The strategic recommendations suggest that relationships should be strengthened, maintained, developed, or replaced, using more, fewer, or the same resources.
(4) Use issues
Olsen and Ellram (1997) emphasized that the weighting of each factor is the most important part of the implementation process, but at the same time very subjective. The decision-makers must come to an agreement on the relative importance of each factor. De Boer (1997) suggested a fully customized approach: organizations should determine their own criteria as well as their own specific threshold values. It’s not clear how this determination process should or could take place. The complexity of the dimensions used in

88
the portfolio models ‘could be a problem’ in the implementation phase, as concluded by the authors themselves. This would be an understatement, considering the vast number of factors and the unclear methodology of weighting and scoring factors. This is perhaps why Olsen and Ellram concluded that it is important that decision-makers in the company discuss all the important factors and decide for themselves which factors should be used in their specific case. They could decide that not every factor has to be included. As a result, factors will vary from company to company. It is suggested that the process of categorizing items and the process of achieving consensus might be more important than the classification matrices. Møller and Momme (2000) found in a case study at Bang & Olufsen that the Olsen and Ellram-approach was rejected because it gave room for arguments and disagreement on factors and variables and it could potentially fuel an internal political debate between parties with interest in supplier relationships. The model did not provide sufficient guidance for practical use. As all the other purchasing portfolio approaches, the Olsen and Ellram-approach lacks substantial empirical support. Olsen and Ellram (1997) suggest that future research should include an extensive empirical testing of the usefulness of the portfolio approach and the normative strategic suggestions.
3.7 Bensaou’s specific investments approach
As part of a broader research project on supplier relationships Bensaou (1999) administered a survey questionnaire to Japanese and U.S. automobile manufacturers. The purpose of the study was to answer two questions: (1) which relational design should a firm choose under different external conditions?, and (2) what is the appropriate way to manage each different type of relationship?
3.7.1 Description of the model
In the design of a portfolio model, it is common practice to start with the determination of the dimensions, based on theoretical and practical insights. Bensaou however, did not operate in this manner. Searching for patterns within the data, it was found that the level of specific investments made by either partner significantly correlated with practices commonly associated with strategic partnerships, such as long-term relationships, mutual trust, and cooperation. Specific investments are investments that are difficult or expensive to transfer to another relationship. Buyer’s specific investments include tangible investments in buildings, tooling and equipment dedicated to the supplier or in products and processes customized to the components procured from the supplier. Intangible investments refer to investments in people or in time and effort spent learning the supplier’s business practices and routines. Supplier’s specific investments include plant or warehouse location and

A Portfolio Approach to the Development of Differentiated Purchasing Strategies
89
specialized facilities and dies. Intangible investments include sending guest engineers and developing information systems compatible with the buyer’s proprietary database or electronic data interchange protocols. Bensaou (1999) classified buyer-supplier relationships into four generic categories, using buyer’s and supplier’s specific investments as dimensions: - strategic partnership (high mutual specific investments), - market exchange (low mutual specific investments), - captive buyer (high buyer’s specific investments, low supplier’s specific investments), and - captive supplier (low buyer’s specific investments, high supplier’s specific investments). On the basis of these classification, no strategic recommendations were formulated. Bensaou (1999) followed another, an empirical approach to this issue. In search for strategic recommendations three dimensions of ‘relationship performance’ were considered (Bensaou and Venkatraman, 1995): (1) supplier rating index assessed by the manufacturer’s team of engineers of ten dimensions, e.g., development time, delivery performance, quality performance, price competitiveness, contribution to lowering cost, engineering capabilities, (2) perceived satisfaction with the relationship along seven criteria, e.g., the quality, amount and accuracy of the information exchanged, and (3) level of buffers between the two firms, i.e., average level of inventory kept by the assembler, by the supplier, shipment increments and average quality levels. Then each cell was split into high-performing and low-performing relationships. Variables were identified that displayed a difference between the two performance subgroups. Three types of variables were found: - information-sharing practices - characteristics of the boundary spanner’s job - the social climate and process characteristics. The management profiles describe per category the richness of information exchanged, the amount of time spent with supplier’s staff, the frequency and character of (mutual) visits, the relationship climate, the reputation of the supplier, and the involvement in design and cooperation. Figure 3.6 shows the advised ‘management profiles’ for each type of buyer-supplier relationship.
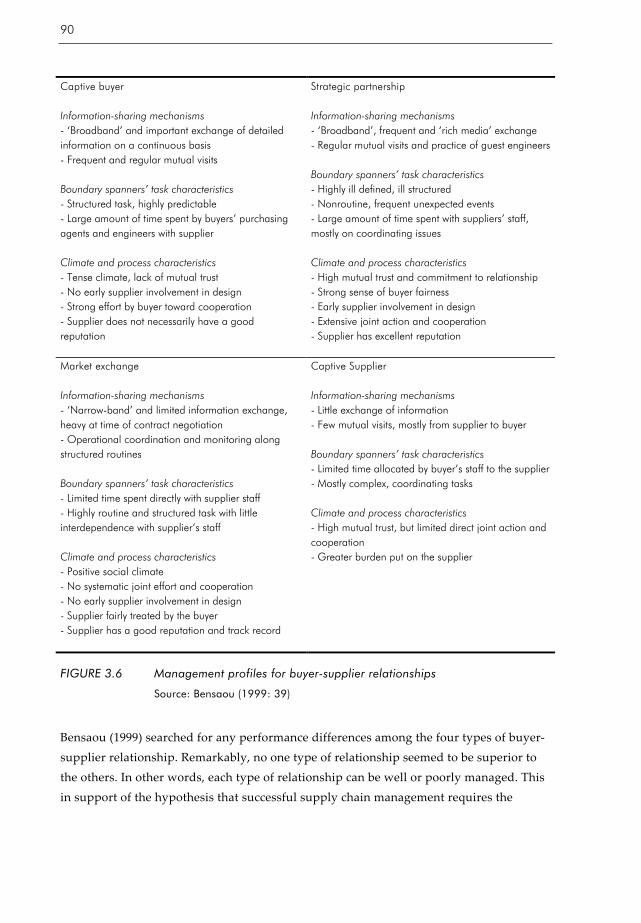
90
Captive buyer Information-sharing mechanisms - ‘Broadband’ and important exchange of detailed information on a continuous basis - Frequent and regular mutual visits Boundary spanners’ task characteristics - Structured task, highly predictable - Large amount of time spent by buyers’ purchasing agents and engineers with supplier Climate and process characteristics - Tense climate, lack of mutual trust - No early supplier involvement in design - Strong effort by buyer toward cooperation - Supplier does not necessarily have a good reputation
Strategic partnership Information-sharing mechanisms - ‘Broadband’, frequent and ‘rich media’ exchange - Regular mutual visits and practice of guest engineers Boundary spanners’ task characteristics - Highly ill defined, ill structured - Nonroutine, frequent unexpected events - Large amount of time spent with suppliers’ staff, mostly on coordinating issues Climate and process characteristics - High mutual trust and commitment to relationship - Strong sense of buyer fairness - Early supplier involvement in design - Extensive joint action and cooperation - Supplier has excellent reputation
Market exchange Information-sharing mechanisms - ‘Narrow-band’ and limited information exchange, heavy at time of contract negotiation - Operational coordination and monitoring along structured routines Boundary spanners’ task characteristics - Limited time spent directly with supplier staff - Highly routine and structured task with little interdependence with supplier’s staff Climate and process characteristics - Positive social climate - No systematic joint effort and cooperation - No early supplier involvement in design - Supplier fairly treated by the buyer - Supplier has a good reputation and track record
Captive Supplier Information-sharing mechanisms - Little exchange of information - Few mutual visits, mostly from supplier to buyer Boundary spanners’ task characteristics - Limited time allocated by buyer’s staff to the supplier - Mostly complex, coordinating tasks Climate and process characteristics - High mutual trust, but limited direct joint action and cooperation - Greater burden put on the supplier
FIGURE 3.6 Management profiles for buyer-supplier relationships
Source: Bensaou (1999: 39)
Bensaou (1999) searched for any performance differences among the four types of buyer-supplier relationship. Remarkably, no one type of relationship seemed to be superior to the others. In other words, each type of relationship can be well or poorly managed. This in support of the hypothesis that successful supply chain management requires the
A Portfolio Approach to the Development of Differentiated Purchasing Strategies
91
effective and efficient management of a portfolio of relationships. Bensaou (1999) concluded that good practice means, first, properly balancing a portfolio of relationships adapted to product and market conditions, second, managing each type of relationship effectively.
3.7.2 Discussion of Bensaou’s model
(1) Dimensions
A very strong point of Bensaou’s model is that it is based on empirical research, albeit in just one industry (automotive). The two dimensions - buyer’s and supplier’s specific investments - were uncovered by an exploratory analysis of the data. The rationale for using these criteria was their identification as discriminating factors for clustering the categories of supplier relationships in a sample of almost 450 purchasing situations. This clearly is a solid rationale in terms of empirical validity (Nellore and Söderquist, 2000). In addition, there is a theoretical foundation as well. The concept of ‘specific investments’ is derived from the transaction cost theory (Williamson, 1975). Transaction-specific investments have an important role in the transactions cost theory in determinating the level of transaction costs. The basic assumption of the transactions cost theory is that the choice of an optimal coordinating mechanism will depend on the level of transaction costs relative to internal coordination costs (Williamson, 1985). It is posited that transaction-specific investments determine largely the choice of the optimal coordinating mechanism: markets or hierarchies. When asset specific investments are made, they must be safeguarded against opportunism (Heide and John, 1988). Under conditions of high asset specificity, the transaction cost theory predicts and prescribes moving away from market transactions (markets) toward vertically integrated relationships (hierarchies).
(2) Categories
The four types of buyer-supplier relationships are clearly connected with relative power positions. The ‘captive’ buyer depends heavily on the supplier and is obviously less powerful. The reverse holds true for the ‘captive’ supplier. The ‘strategic partnership’ and the ‘market exchange’ categories reflect a balanced situation. Power implicitly plays an important role in Bensaou’s model. However, the dimensions do not correspond unambiguously with the balance of power. Indeed, the buyer’s and the supplier’s specific investments are important aspects, but there are other, neglected determinants to any relative power position. The balance of power is by definition not just determined by the ratio of buyer’s specific investments and supplier’s specific investments. If we take a close look at these four categories, it seems that Bensaou’s classification is in accordance with Kraljic’s first matrix.
92
- strategic partnerships (balanced power, high mutual specific investments) refers to ‘strategic’ - market exchange (balanced power, low mutual specific investments) refers to ‘non-critical’ - captive buyer (supplier dominated) refers to ‘bottleneck’ - captive supplier (buyer dominated) refers to ‘leverage’.
(3) Strategic recommendations
Bensaou’s portfolio model is richer in content than the other portfolio models because it includes relationships performance and management profiles for the various supplier relationships. High performing and low performing relationships were considered for the discovery of appropriate management profiles for each relationship type in the portfolio (‘contextual profile’). Again, empirical findings were used as a foundation for the content of the relationship portfolio matrix. Less satisfactory is the nature of the managerial recommendations in Bensaou’s approach. Bensaou’s approach results in a description of the current state between buyer and supplier. A prominent conclusion is that no one type of relationship is superior to the others: each type can be well or poorly managed. The implication is that the buying firm should adapt to prevailing circumstances, of course in the best possible manner. For instance, if a relationship is supplier-dominated, then the management profile concerned does not provide guidelines for achieving a better position. The managerial recommendations do not allow for any strategic switch from one type of relationship to another. In other words, the model is reactive by nature. Purchasing management is implicitly supposed to reconcile itself to prevailing conditions. Bensaou introduced and used measures of ‘relationship performance’ in terms of an average of overall supplier ratings and perceived satisfaction mainly with the information exchanged. There are questions with respect to the measurement of ‘relationship performance’. How should we evaluate the construct validity of the ‘relationship performance’ concept? The construct validity refers to the correctness of the operational measures for the concept being studied (Yin, 1994). Does the construct measure what it is supposed to measure? In addition, there is a question of internal validity (Yin, 1994): is a causal relationship established? Do certain conditions with respect to the ‘managerial profiles’ actually lead to different ‘relationship performances’? Or is it merely a matter of statistical correlation? The recommended management profiles seem to reflect behavior that is statistically connected with ‘high performing’ relationships. No causal model is provided to explain and improve ‘relationship performance’. Apparently, an explorative and descriptive study is stretched to causal and normative propositions.

A Portfolio Approach to the Development of Differentiated Purchasing Strategies
93
(4) Use issues
Bensaou’s study categorized and listed a large number of relationships in the automotive industry. The model is based on empirical research. However, it is not actually used as a portfolio model for purchasing and supply management. The identified categories refer to four basic types of buyer/supplier relationships. The strategic recommendations however, would have to be adjusted into a more pro-active, dynamic use. As far as we know, there are no publications that report on applications of Bensaou’s model. The possibilities for practical applications however are promising.
3.8 Conclusions of the literature study: addressing the research questions
In this last section the results of the literature study will be connected with the research questions of this study. Based on the conclusions of the literature study, subsection 3.8.1 will answer the first research question that refers to differences and similarities between the various purchasing portfolio models. In the subsections 3.8.2 and 3.8.3 the second and third research questions will be addressed. The analysis of the literature will provide the basis for the elaboration of the research questions into a number of more articulated sub-questions.
3.8.1 Answers to the first research question: differences and similarities
The first research question of this study refers to the comparison of purchasing portfolio models: “What are differences and similarities between the various purchasing portfolio models?” (1) We agree with Nellore and Sörderquist (2000) who contended that all portfolio approaches basically use the same three steps: the analysis of products and their classification in a matrix, the analysis of required supplier relationships to deliver the products (objectives), and the development of action plans in order to bridge the gap between current and required supplier relationships (strategies). Our literature suggests that no substantial differences are to be found in the general approach of the various portfolio models in purchasing. In this section we will substantiate this conclusion which constitutes the answer to the first research question. In chapter 1 we have indicated that the comparison will concentrate on three core elements of portfolio models: (1) dimensions, (2), categories, and (3) strategic recommendations. In addition, a comparison has been made on (4) use issues (acceptance and adoption). Beginning with acceptance and adoption, it is clear that Kraljic (1977, 1983) introduced the first comprehensive portfolio approach for purchasing and supply management. Many other authors have used Kraljic’s basic ideas for the development of

94
similar models. For instance Elliott-Shircore and Steel (1985) merely changed the labels in their supply positioning analysis. Van Weele (1992, 1997) and Syson (1992) elaborated Kraljic’s work, especially with respect to the strategic recommendations for the leverage, the non-critical and the bottleneck category. These contributions are a useful supplement to the 1983-article, because the original Kraljic approach is very much focussed on the strategic category. By now, probably a minority of practitioners is familiar with the second matrix: company strength versus supply market strength for the positioning of strategic items. It is fair to conclude that in common parlance the ‘Kraljic approach’ is fully equated with the original first Kraljic matrix, which was not presented as a ‘matrix’ anyway, but as a table (‘exhibit II’): ‘classifying purchasing materials requirements’. The categories were labeled as the ‘procurement focus’, for which the main tasks, the required information and the decision level were specified (Kraljic, 1983: 112). Kraljic (1983) provided the first comprehensive portfolio approach for purchasing and supply management. Many years after the introduction there is a reasonable amount of evidence that Kraljic’s basic ideas and concepts represent the dominant approach in the profession. On a large scale purchasing professionals and academics have adopted Kraljic’s basic ideas and methodology. The (first) Kraljic-matrix has become the standard in the field of purchasing portfolio models. Kraljic’s terminology is generally accepted and has become the standard for scientists and practitioners. This however does not apply for the other portfolio models, which are hardly known and used in practice. Therefore, Kraljic’s approach will be used as point of departure in the following discussion and evaluation of other approaches. The Kraljic-model will serve as a natural reference point.
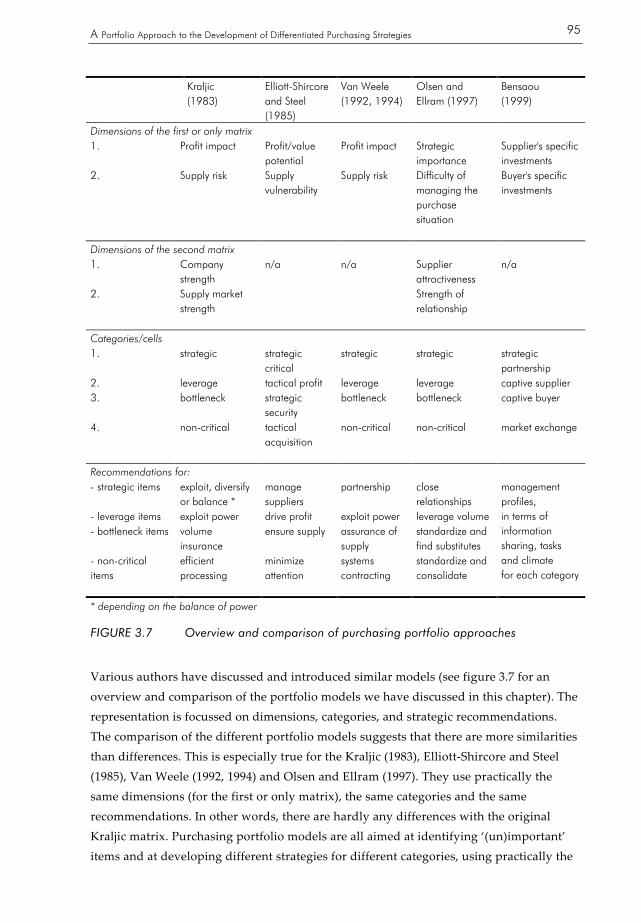
A Portfolio Approach to the Development of Differentiated Purchasing Strategies
95
Kraljic
(1983) Elliott-Shircore and Steel (1985)
Van Weele (1992, 1994)
Olsen and Ellram (1997)
Bensaou (1999)
Dimensions of the first or only matrix 1. Profit impact Profit/value
potential Profit impact Strategic
importance Supplier's specific investments
2. Supply risk Supply vulnerability
Supply risk Difficulty of managing the purchase situation
Buyer's specific investments
Dimensions of the second matrix 1. Company
strength n/a n/a Supplier
attractiveness n/a
2. Supply market strength
Strength of relationship
Categories/cells 1. strategic strategic
critical strategic strategic strategic
partnership 2. leverage tactical profit leverage leverage captive supplier 3. bottleneck strategic
security bottleneck bottleneck captive buyer
4. non-critical tactical acquisition
non-critical non-critical market exchange
Recommendations for: - strategic items exploit, diversify
or balance * manage suppliers
partnership close relationships
- leverage items exploit power drive profit exploit power leverage volume - bottleneck items volume
insurance ensure supply assurance of
supply standardize and find substitutes
- non-critical items
efficient processing
minimize attention
systems contracting
standardize and consolidate
management profiles, in terms of information sharing, tasks and climate for each category
* depending on the balance of power
FIGURE 3.7 Overview and comparison of purchasing portfolio approaches
Various authors have discussed and introduced similar models (see figure 3.7 for an overview and comparison of the portfolio models we have discussed in this chapter). The representation is focussed on dimensions, categories, and strategic recommendations. The comparison of the different portfolio models suggests that there are more similarities than differences. This is especially true for the Kraljic (1983), Elliott-Shircore and Steel (1985), Van Weele (1992, 1994) and Olsen and Ellram (1997). They use practically the same dimensions (for the first or only matrix), the same categories and the same recommendations. In other words, there are hardly any differences with the original Kraljic matrix. Purchasing portfolio models are all aimed at identifying ‘(un)important’ items and at developing different strategies for different categories, using practically the
96
same dimensions, categories and strategic recommendations. The figure does not show the additional strategic recommendations that Olsen and Ellram (1997) have provided for their second and final matrix, although they might be simply classified as ‘manage the intensity of the supplier relationship by allocating scarce resources’. The Olsen and Ellram-approach could be seen as a relative outsider. Nevertheless it is to a large extent based on Kraljic’s work. Being more complex and less transparent for purchasing managers, the Olsen and Ellram-approach will not be widely applied. Bensaou (1999) is the real outsider, with more differences than similarities in comparison with the Kraljic approach, see figure 3.8. Bensaou’s recommendations are put in the form of advised management profiles, matching different buyer-supplier relationships. The Kraljic strategies are formulated in terms of general guidelines, referring to the possibilities at hand. Because of differences in scope, the strategic recommendations of the approaches are to a large extent incompatible and incomparable. The role of power in Kraljic is quite explicit for the strategic items, judged from the recommended purchasing strategies: exploit, diversify and balance. For the other categories it is less clear how issues of power are handled. Here is a glaring contrast with Bensaou’s approach that is quite explicit about the role of power and dependence, distinguishing the categories in the matrix. Consider for instance the ‘captive buyer’ and the ‘captive supplier’ cells. However, the balance of power is not explicitly accounted for in the managerial recommendations, which merely adapt to prevailing conditions. In addition, the dimensions do not correspond unambiguously to power in buyer-supplier relationships. In conclusion, both approaches have their own strong points. However, these issues need elaboration and study in more detail, which will be done in the next chapter.
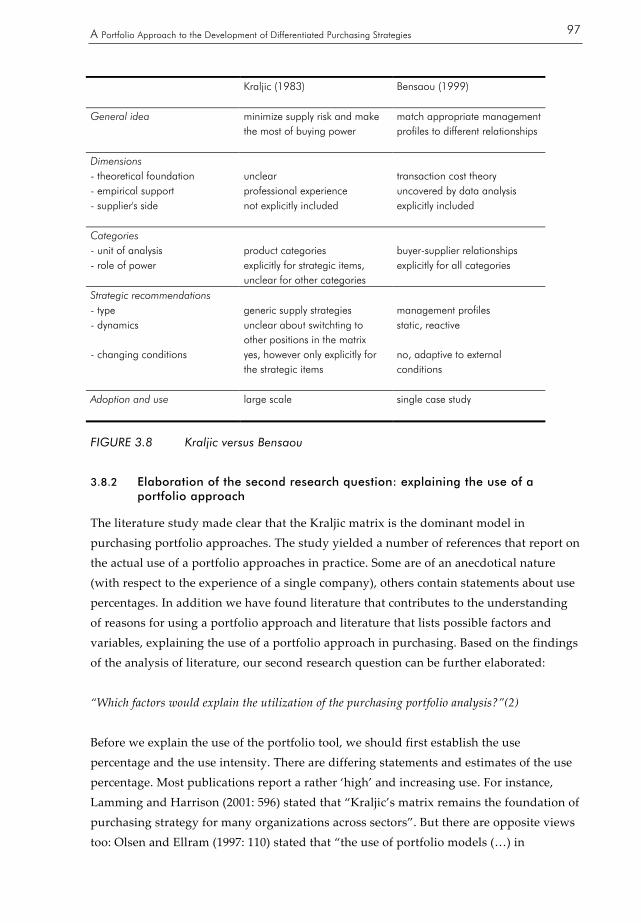
A Portfolio Approach to the Development of Differentiated Purchasing Strategies
97
Kraljic (1983)
Bensaou (1999)
General idea minimize supply risk and make the most of buying power
match appropriate management profiles to different relationships
Dimensions - theoretical foundation unclear transaction cost theory - empirical support professional experience uncovered by data analysis - supplier's side not explicitly included
explicitly included
Categories - unit of analysis product categories buyer-supplier relationships - role of power explicitly for strategic items,
unclear for other categories explicitly for all categories
Strategic recommendations - type generic supply strategies management profiles - dynamics unclear about switchting to
other positions in the matrix static, reactive
- changing conditions yes, however only explicitly for the strategic items
no, adaptive to external conditions
Adoption and use large scale
single case study
FIGURE 3.8 Kraljic versus Bensaou
3.8.2 Elaboration of the second research question: explaining the use of a portfolio approach
The literature study made clear that the Kraljic matrix is the dominant model in purchasing portfolio approaches. The study yielded a number of references that report on the actual use of a portfolio approaches in practice. Some are of an anecdotical nature (with respect to the experience of a single company), others contain statements about use percentages. In addition we have found literature that contributes to the understanding of reasons for using a portfolio approach and literature that lists possible factors and variables, explaining the use of a portfolio approach in purchasing. Based on the findings of the analysis of literature, our second research question can be further elaborated: “Which factors would explain the utilization of the purchasing portfolio analysis?”(2) Before we explain the use of the portfolio tool, we should first establish the use percentage and the use intensity. There are differing statements and estimates of the use percentage. Most publications report a rather ‘high’ and increasing use. For instance, Lamming and Harrison (2001: 596) stated that “Kraljic’s matrix remains the foundation of purchasing strategy for many organizations across sectors”. But there are opposite views too: Olsen and Ellram (1997: 110) stated that “the use of portfolio models (…) in
98
purchasing has been very limited” and Christopher and Jüttner (2000: 120) found “few companies following the advice to apply portfolio techniques to classify relationships, but instead classifying relationships in the form of a simple hierarchy (of preferred suppliers – 2nd tier suppliers – 3rd tier suppliers – potential newcomers)”. Most publications do not report concrete numbers on portfolio models, although there are a few exceptions. In a survey of 126 Dutch companies Boodie (1997) found that 44% of the responding purchasing managers said that they used Kraljic for formulating purchasing strategies. A peak of 80% was found for industrial companies that operate on a mass production basis. In contrast, Kamann (2000a) estimated that 20% of the Dutch companies uses a portfolio method for the management of their supplier base. Besides ‘use percentage’, the ‘use intensity’ is an interesting variable too. Reasons enough for the following research question:
Research question (2a)
How many firms actually use a purchasing portfolio approach? In addition, in more detail the study will investigate specific reasons for using the portfolio in purchasing and the extent to which these reasons can be found in practice:
Research question (2b)
Why is the purchasing portfolio approach being used in practice?
Research question (2c)
Why are other professionals not using a portfolio approach in purchasing? The use of the portfolio could be associated with other use-related factors, such as satisfaction with portfolio use and the applied measurement method for the positioning of items in a matrix. Obviously, the decision to use the portfolio tool in practice will be motivated by the expected benefits and results. In general, in the case of a management tool, the question of effectiveness naturally arises. On the bottom-line managers want to know: ‘does it work?’ and ‘what are the results?’ and perhaps ‘what are the cost reductions?’ Performance measurement in general is a difficult problem in management studies. Many attempts have been made to capture performance with mixed results. This led Venkatraman and Ramanujam (1986: 801) to suggest that the treatment of performance in research settings is perhaps “one of the thorniest issues confronting the academic community”. Over the past years many performance management systems and key performance indicators have become popular. However, reporting purchasing cost savings and supplier performance measures is in most cases not sufficient to get the buy-in from the top (Van Weele, 2002). Traditional management accounting focuses on prices and costs, which seems to fit in well with a transactional approach to purchasing
A Portfolio Approach to the Development of Differentiated Purchasing Strategies
99
(Axelsson, et al., 2002). In a more relational approach to purchasing other measures have to be used, capturing inter-organizational processes and other accountable contributions of purchasing to the competitive position of the firm. This means that the selection of performance measures for the purchasing function is a critical but not an unambiguous task. A major problem in relating strategy to performance is that many factors intervene the process (Venkatraman and Ramanujam, 1986), causing the independent variable (strategy) to have a less significant or non-causal relation with the dependent variable (performance). For intermediary activities it is therefore better to look for intermediary measures of success or performance (Mol, 2002). This points at the issue of accountability. Van Weele (1984) emphasized that purchasing performance measurement should only be established in those areas in which a buyer can be held responsible. The same line of reasoning applies for the performance measurement of the portfolio approach: only those areas should be included for which the tool can be held responsible. Discussing the effectiveness of portfolio analysis, we should return to the source. Kraljic (1983) proposed a four-stage approach as a framework for ‘shaping the supply strategy’: classification (first matrix), market analysis, strategic positioning (second matrix for strategic items) and action plans. For this matter one should remember that this approach is focussed on the items in the strategic category. Other authors have elaborated the strategic recommendations for the other categories. Kraljic (1983: 112) posited that in order “to minimize their supply vulnerability and make the most of their potential buying power”, a number of companies have ‘successfully used the four-stage approach’. However, the issues of how to determine these effects (measurability) and how to attribute the outcomes of the portfolio analysis to these effects (accountability), are not addressed and therefore not solved. Supply vulnerability and buying power are at best overall performance measures for purchasing. The literature study suggested that the portfolio analysis can be used for diagnostic and prescriptive purposes, although the strategic recommendations are rather generic and non-specific by nature. The diagnostic powers are related to the additional insights that are gained, using the portfolio tool. The prognostic powers however are limited and the portfolio should therefore not be used in a prescriptive way. Portfolio analysis enables purchasing professionals to develop differentiated purchasing and supplier strategies. Keeping in mind the necessary condition of accountability, it is concluded that the effectiveness of a portfolio approach should be assessed in terms of direct accountable impact, operationalized to the extent that users: - experience additional understanding of current purchasing problems and possibilities (1), and - develop differentiated strategies for their purchasing and supplier management (2).
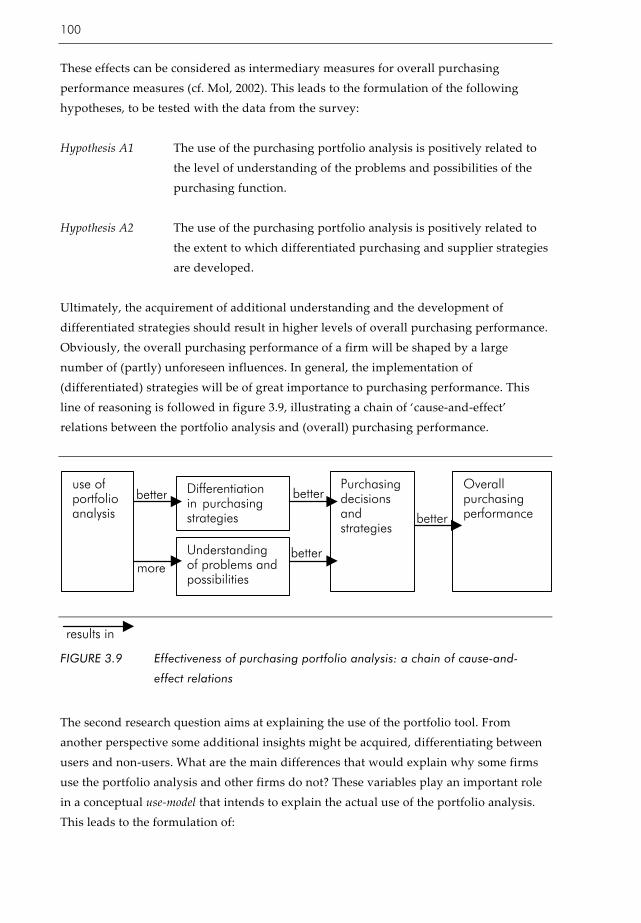
100
These effects can be considered as intermediary measures for overall purchasing performance measures (cf. Mol, 2002). This leads to the formulation of the following hypotheses, to be tested with the data from the survey: Hypothesis A1 The use of the purchasing portfolio analysis is positively related to
the level of understanding of the problems and possibilities of the purchasing function.
Hypothesis A2 The use of the purchasing portfolio analysis is positively related to
the extent to which differentiated purchasing and supplier strategies are developed.
Ultimately, the acquirement of additional understanding and the development of differentiated strategies should result in higher levels of overall purchasing performance. Obviously, the overall purchasing performance of a firm will be shaped by a large number of (partly) unforeseen influences. In general, the implementation of (differentiated) strategies will be of great importance to purchasing performance. This line of reasoning is followed in figure 3.9, illustrating a chain of ‘cause-and-effect’ relations between the portfolio analysis and (overall) purchasing performance.
FIGURE 3.9 Effectiveness of purchasing portfolio analysis: a chain of cause-and-
effect relations
The second research question aims at explaining the use of the portfolio tool. From another perspective some additional insights might be acquired, differentiating between users and non-users. What are the main differences that would explain why some firms use the portfolio analysis and other firms do not? These variables play an important role in a conceptual use-model that intends to explain the actual use of the portfolio analysis. This leads to the formulation of:
better
better
better
more
better use of portfolio analysis
Understanding of problems and possibilities
Purchasing decisions and strategies
Overall purchasing performance
results in
Differentiation in purchasing strategies

A Portfolio Approach to the Development of Differentiated Purchasing Strategies
101
Research question (2d):
What are the differences between users and non-users of a purchasing portfolio approach? For the construction of the use-model, literature has been studied in search for variables that might explain the use of a portfolio approach in purchasing. The literature study did find some factors and enablers that can be used as explanatory variables in the use-model. Five (groups of) variables were found (see figure 3.10). Based on the literature study, the company size, the share of purchasing, the position of the purchasing department, purchaser’s professionalism, and the orientation of purchasing have been identified as explanatory variables. In his survey Boodie (1997) found a positive relationship between company size and portfolio use. Less than 10% of the smallest firms used the purchasing portfolio, while the largest companies (with more than 5,000 employees) show a use percentage of 85%. In addition a positive relation was suggested between the use of portfolio models and the percentage of total purchase cost: purchasing share. Clauwaert (1993) posited as well that the portfolio analysis is being used especially by companies with relatively high purchasing shares, since these companies rely substantially on their supply markets. Van Weele et al. (1998) pointed at the maturity of the purchasing function within companies for a possible explanation of the adoption of a portfolio approach. This is in line with another finding of the Boodie-study, that organizations with high scores on World Class Purchasing-variables use a portfolio approach for their purchasing policies (Boodie, 1997). Therefore, the maturity of the purchasing function might be a key variable for gaining insights in the use and effectiveness of a portfolio approach in purchasing. For the operationalization of ‘purchasing maturity’ the results of Rozememeijer’ study will be used. Rozemeijer (2000: 170, 232-233) identified ‘position of purchasing’, ‘purchasing’s professionalism’, and ‘purchasing orientation’ as the main factors, constituting the construct variable ‘purchasing maturity’. Obviously, there are large differences between companies, considering the orientation of the purchasing function. In addition, different aspects of ‘orientation’ can be distinguished. We could look at the extent to which purchasing is oriented towards collaboration with suppliers, towards tough negotiations with suppliers in pursuit of the lowest prices, or at the extent to which the work of purchasing professionals is related to clerical duties and operational activities.

102
FIGURE 3.10 Conceptual model, explaining the use of a purchasing portfolio approach
The conceptual model allows for the formulation of the following hypotheses: Hypothesis A3 The company size of users will be larger than the company size of
non-users of the purchasing portfolio analysis . Hypothesis A4 The purchasing share of users will be higher than the purchasing
share of non-users of the purchasing portfolio analysis. Hypothesis A5 The position of purchasing is better at companies where the
purchasing portfolio analysis is used, than at non-using companies. Hypothesis A6 The professionalism of purchasing is higher at companies where the
purchasing portfolio analysis is used, than at non-using companies. Hypothesis A7a The users of the purchasing portfolio analysis will be more
orientated towards collaboration with suppliers than non-users. Hypothesis A7b The users of the purchasing portfolio analysis will be less orientated
towards tough negotiations with suppliers than non-users, in pursuit of the lowest prices.
Hypothesis A7c The users of the purchasing portfolio analysis will be less involved
with clerical and operational activities than non-users. These hypotheses too will be tested with the data that will be gathered in the survey.
portfolio use position of purchasing
share of purchasing
purchasing’s professionalism
company size
orientation of purchasing

A Portfolio Approach to the Development of Differentiated Purchasing Strategies
103
3.8.3 Elaboration of the third research question: the practice of experienced professionals
In contrast with a growing use and adoption of purchasing portfolio approaches, we have established that there is a lack of empirical research to provide insights into practical problems and solutions when using a purchasing portfolio approach. In general, little is known about the actual use of portfolio models in purchasing management. Publications do not reveal how purchasing professionals handle measurement issues, which strategic recommendations are considered, adapted or neglected, which circumstances are of particular interest for the development and selection of differentiated strategies, what are specific purposes, goals and results of the use of any purchasing portfolio model. These issues relate to the third research question that is formulated as: “How are portfolio models employed by experienced purchasing professionals?” (3) The literature study has provided the insights necessary to articulate and elaborate this research question. Obviously, we did not find answers to the question of how portfolio models are actually used in practice. We did find a number of unanswered questions with respect to measurement issues and the way strategic issues are handled in practice. Wind et al. (1983) proved that decisions based on portfolio models are quite sensitive to operational definitions, the rules to divide dimensions into low and high categories, and the weighting of the variables constituting composite dimensions. Portfolio models in general provide a structure for analysis and stimulate strategic thinking. Our analysis of literature did not reveal how decisions are actually made if they are based on portfolio analysis. Which strategies are recommended and under which conditions? This means that in addition to measurement issues, there are unsolved strategic issues, referring to the recommendations that are provided for the different categories and to the conditions under which these recommendations are valid. The field research of this study will address these measurements and strategic issues. The two dimensions of the Kraljic matrix can be considered as composite dimensions, consisting of various factors. Kraljic suggested a number of factors that could be relevant for the ‘measurement’ of these dimensions, but he provided no guidelines or measurement rules for the combination of these underlying factors, assessing positions in the matrix. Olsen and Ellram (1997) emphasized that the weighting of each factor forms the most important part of the implementation process, but that it is at the same time very subjective. This leads to the following sub-question:

104
Research question (3a):
Considering the unclear guidelines and the unanswered questions with respect to the measurement of (composite) dimensions and the weighting of factors in the use of a purchasing portfolio approach, how are these issues handled to the satisfaction of experienced purchasing professionals? Kraljic’s strategic recommendations for the categories are usually summarized into four simple concepts: ‘efficient processing’, ‘exploit power’, ‘strategic partnership’ and ‘volume assurance’. At first sight these are quite logical and sound recommendations. However, if we take a closer look at the nature of these strategic recommendations, we must conclude that these strategies are rather generic by nature, providing only rough indications for the most appropriate supplier strategies. They merely react and adapt to prevailing circumstances, taking the current power and dependence structure for granted. Most likely, purchasing professionals will always look for possibilities to move to different and better positions in the matrix. It is not clear if and how other positions in the matrix are to be pursued through the implementation of a recommended purchasing strategy. This leads to the following sub-questions:
Research question (3b):
What kind of specific strategies of purchasing and supply are based on Kraljic’s portfolio matrix?
Research question (3c):
What kind of movements are considered in the Kraljic matrix in terms of current positions, future positions (goals) and means (strategies)? Literature does not reveal how a purchasing portfolio approach could or should be used in practice. The case studies are aimed at shedding light on these matters.
3.8.4 Elaboration of the fifth research question: power and dependence in the matrix
We have argued that power and dependence are very important in understanding buyer/supplier relationships. Earlier we have concluded that the Kraljic matrix has become the dominant approach in the discipline. In combination with the fact that the Kraljic approach is not explicit on issues of power and dependence, we have formulated the fifth and last research question: “ What is the role of power and dependence in the Kraljic approach?” (5)
A Portfolio Approach to the Development of Differentiated Purchasing Strategies
105
In his seminal article Kraljic (1983) introduced a very useful tool for purchasing management, albeit without any reference to literature or comprehensive theory. Why are ‘profit impact’ and ‘supply risk’ the most appropriate dimensions? To what extent are the strategic recommendations aimed at using or influencing the relative power position of the buying company? This lack of theoretical background calls for further investigation. Kraljic (1983: 112) posited that the general idea of the portfolio approach is to “minimize supply vulnerability”(dependence) and “make the most of potential buying power” (power). Obviously, there are clues that point at the role of power and dependence, which are basic constructs in Resource Dependence Theory (Pfeffer and Salancik, 1978). This leads us to the following sub-question:
Research question (5a):
Are the foundations of the Kraljic approach to be found in Resource Dependence Theory? In the next chapter, we will have a closer look at Kraljic’s matrix, answering this sub-question. Also we will elaborate the overall research question with respect to power and dependence, which will produce additional (sub)research questions


107
4 A power-dependence perspective
We have found that the Kraljic matrix has become the dominant approach in purchasing portfolio analysis. The choice of dimensions seems plausible, the framework has proved to be useful, the strategic recommendations make sense, which has resulted in a large scale acceptance and adoption. However, we have concluded that there are unanswered questions with respect to the theoretical foundations that support the selected dimensions and the provided recommendations. In this chapter we will make a reasonable case for a connection between the Kraljic matrix and the resource dependence theory. In addition, we will elaborate on new perspectives and insights to be gained from a power-dependence perspective on the basic portfolio approach, which includes the formulation of additional research questions.
4.1 Rotating the Kraljic-matrix: new perspectives
The starting point for the next analysis is that we need more understanding of the foundations of the Kraljic approach. We will take a closer look at the two basic dimensions: profit impact and supply risk. The leverage quadrant is usually considered to be the most favorable in the matrix, because of recommended ‘exploitation of full purchasing power’. In other words, the combination of a high profit impact and a low supply risk enhances the relative power position of the buyer. This means that the upper-left area in the Kraljic model points at a buyer-dominated segment. In contrast, a lower profit impact and a higher supply risk worsens the buyer’s position, but improves the relative power of the supplier. In that case a supplier-dominated area is at hand. We can bring these insights into the Kraljic matrix, by drawing a diagonal that runs from southeast to northwest, representing a power-axis. Figure 4.1a shows the Kraljic model with an emphasis on the power-factor. Kempeners and Van Weele (1997) introduced a comparable figure, splitting the matrix in a ‘buyer dominated’ area and a ‘supplier dominated’ area. In between there is a neutral territory where parties are expected to have a power balance. If one party is dominated by the other, than the strategy could be directed at a movement in the matrix towards a more favorable position.

108
profit impact high
low high supply risk
FIGURE 4.1a A power-axis in the Kraljic model
We can enrich the matrix even more by bringing another axis into the representation, that is at right angle to the power-axis. The combination of a high profit impact and a high supply risk implies that we are dealing with strategic items and critical supplier relationships. A low profit impact and a low supply risk are indications for not-important items. The new axis seems to have a logical connection with ‘importance’, one of the key concepts of the resource dependence theory (RDT). In the RDT the ‘importance of a resource’ is a crucial factor, determining organizational dependence. Subsequently, there are two factors to the importance of any resource exchange: the relative magnitude of the exchange and the criticality of the resource (Pfeffer and Salancik, 1978). These factors correspond with the two dimensions of the Kraljic matrix. ‘Profit impact’ can be seen as equivalent to ‘magnitude’ while ‘supply risk’ comes close to ‘criticality’. Therefore, we could say that the combination of profit impact and supply risk determines the importance of an item in the matrix. The importance-variable is hereby positively correlated with profit impact and with supply risk. We can illustrate this relationship in the Kraljic matrix by drawing a diagonal that runs from southwest to northeast, representing an importance-axis (see figure 4.1b). The axis has a compensatory property: a low profit impact can be compensated by a high supply risk, so that the item is still classified as ‘important’ (and vice versa). What we have actually done, is to rotate the original matrix,
power axis
buyer dominance
supplier dominance
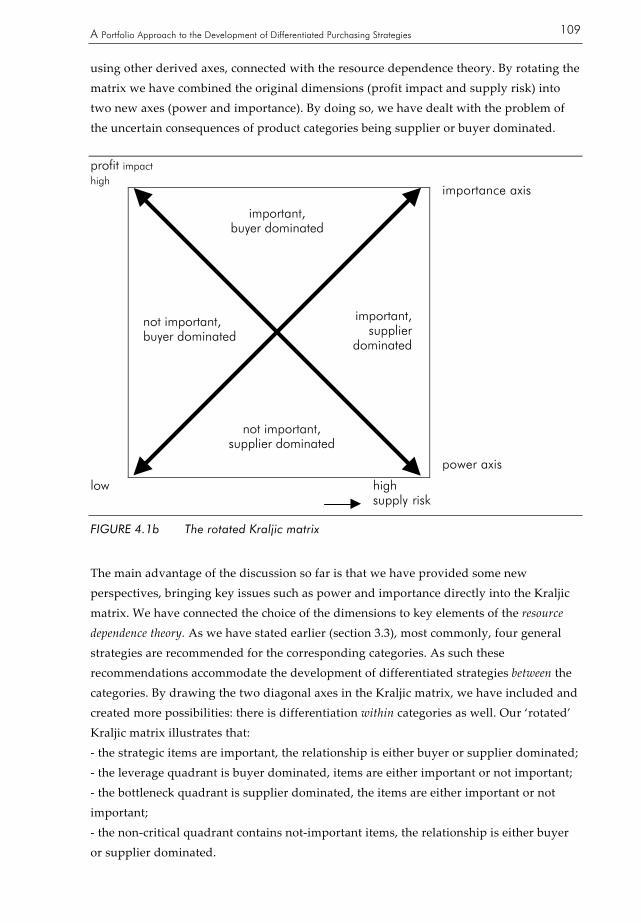
A Portfolio Approach to the Development of Differentiated Purchasing Strategies
109
using other derived axes, connected with the resource dependence theory. By rotating the matrix we have combined the original dimensions (profit impact and supply risk) into two new axes (power and importance). By doing so, we have dealt with the problem of the uncertain consequences of product categories being supplier or buyer dominated. profit impact high
low high supply risk
FIGURE 4.1b The rotated Kraljic matrix
The main advantage of the discussion so far is that we have provided some new perspectives, bringing key issues such as power and importance directly into the Kraljic matrix. We have connected the choice of the dimensions to key elements of the resource dependence theory. As we have stated earlier (section 3.3), most commonly, four general strategies are recommended for the corresponding categories. As such these recommendations accommodate the development of differentiated strategies between the categories. By drawing the two diagonal axes in the Kraljic matrix, we have included and created more possibilities: there is differentiation within categories as well. Our ‘rotated’ Kraljic matrix illustrates that: - the strategic items are important, the relationship is either buyer or supplier dominated; - the leverage quadrant is buyer dominated, items are either important or not important; - the bottleneck quadrant is supplier dominated, the items are either important or not important; - the non-critical quadrant contains not-important items, the relationship is either buyer or supplier dominated.
not important, buyer dominated
power axis
important, buyer dominated
importance axis
not important, supplier dominated
important,supplier
dominated
110
By recognizing differentiated purchasing strategies within the categories, we avoid over-simplistic and deterministic views on purchasing portfolio management. The interpretation of the four quadrants is improved in the rotated Kraljic matrix. The quadrants in this matrix differ with respect to the newly constructed dimensions ‘power’ (or dominance) and ‘importance’. The power-perspective plays a significant role in the process of selecting purchasing and supplier strategies. For instance, non-powerful companies might prefer relationships with multiple sources for reasons of vulnerability, while larger, more powerful companies are able to make an optimal use of single sources for important products. A reasonable instance for this proposition is given by Baatz (1999), in a case study comparing the procurement of a small and a large manufacturer in the American ‘white goods’-sector. The large manufacturer followed a strategy of developing long-term relationships with a small number of main suppliers, offering more stability and a share of the growth. These relationships require high levels of trust. For the small company sole sourcing was not an option. The company preferred to maintain relationships with multiple sources. In this study the difference in supplier strategy was directly related to and largely explained by differences in relative power. Although the rotated matrix provides additional insights and possibilities, there are limitations and drawbacks. The rotated matrix contains no area of balanced power in a buyer-supplier relationship. This is a problem, since many believe that the most stable relationships are balanced with respect to the power issue. This means that a new segment should be recognized in the matrix, broadening the importance-axis into a power balanced area. A more serious problem is the rather limited conception of ‘power’ and ‘dependence’ being determined by supply risk and profit impact. Therefore, in the next section we will elaborate on the issues of ‘power’ and ‘dependence’ in buyer-supplier relationships.
4.2 Power and dependence in buyer-supplier relationships
Power and dependence are generally considered as important concepts for the understanding of buyer-supplier relationships. Traditionally they are used in marketing and organizational studies and, though to a lesser extent, in purchasing studies. Especially in the nineties, the attention was obviously shifted towards partnering and collaborative relationships, which implied the refraining from power use. More recently there has been a renewed interest in a power-dependence perspective.
4.2.1 Dependent: to be or not to be?
Organizations are by nature dependent on their environment for the supply of needed resources of various kinds. Purchasing and supply management are concerned with resources from suppliers at the input side of the production processes. Just by relying on the goods and services of a supplier, a certain degree of dependency is a fact. One could
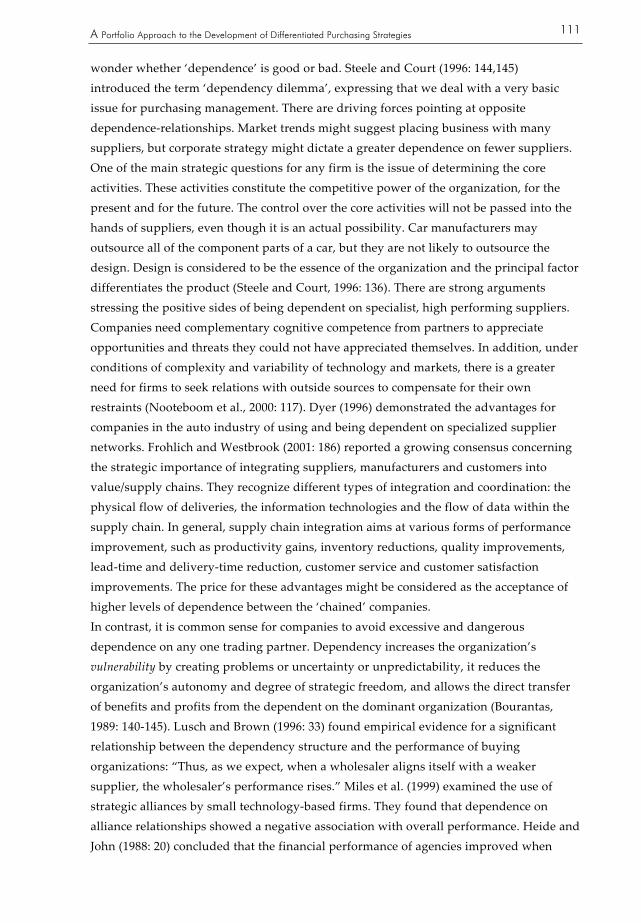
A Portfolio Approach to the Development of Differentiated Purchasing Strategies
111
wonder whether ‘dependence’ is good or bad. Steele and Court (1996: 144,145) introduced the term ‘dependency dilemma’, expressing that we deal with a very basic issue for purchasing management. There are driving forces pointing at opposite dependence-relationships. Market trends might suggest placing business with many suppliers, but corporate strategy might dictate a greater dependence on fewer suppliers. One of the main strategic questions for any firm is the issue of determining the core activities. These activities constitute the competitive power of the organization, for the present and for the future. The control over the core activities will not be passed into the hands of suppliers, even though it is an actual possibility. Car manufacturers may outsource all of the component parts of a car, but they are not likely to outsource the design. Design is considered to be the essence of the organization and the principal factor differentiates the product (Steele and Court, 1996: 136). There are strong arguments stressing the positive sides of being dependent on specialist, high performing suppliers. Companies need complementary cognitive competence from partners to appreciate opportunities and threats they could not have appreciated themselves. In addition, under conditions of complexity and variability of technology and markets, there is a greater need for firms to seek relations with outside sources to compensate for their own restraints (Nooteboom et al., 2000: 117). Dyer (1996) demonstrated the advantages for companies in the auto industry of using and being dependent on specialized supplier networks. Frohlich and Westbrook (2001: 186) reported a growing consensus concerning the strategic importance of integrating suppliers, manufacturers and customers into value/supply chains. They recognize different types of integration and coordination: the physical flow of deliveries, the information technologies and the flow of data within the supply chain. In general, supply chain integration aims at various forms of performance improvement, such as productivity gains, inventory reductions, quality improvements, lead-time and delivery-time reduction, customer service and customer satisfaction improvements. The price for these advantages might be considered as the acceptance of higher levels of dependence between the ‘chained’ companies. In contrast, it is common sense for companies to avoid excessive and dangerous dependence on any one trading partner. Dependency increases the organization’s vulnerability by creating problems or uncertainty or unpredictability, it reduces the organization’s autonomy and degree of strategic freedom, and allows the direct transfer of benefits and profits from the dependent on the dominant organization (Bourantas, 1989: 140-145). Lusch and Brown (1996: 33) found empirical evidence for a significant relationship between the dependency structure and the performance of buying organizations: “Thus, as we expect, when a wholesaler aligns itself with a weaker supplier, the wholesaler’s performance rises.” Miles et al. (1999) examined the use of strategic alliances by small technology-based firms. They found that dependence on alliance relationships showed a negative association with overall performance. Heide and John (1988: 20) concluded that the financial performance of agencies improved when
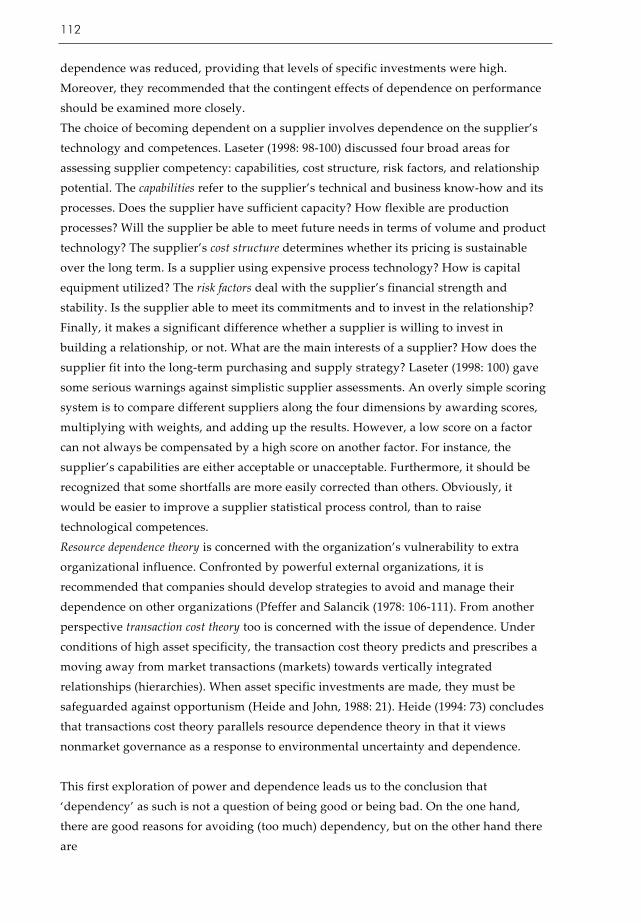
112
dependence was reduced, providing that levels of specific investments were high. Moreover, they recommended that the contingent effects of dependence on performance should be examined more closely. The choice of becoming dependent on a supplier involves dependence on the supplier’s technology and competences. Laseter (1998: 98-100) discussed four broad areas for assessing supplier competency: capabilities, cost structure, risk factors, and relationship potential. The capabilities refer to the supplier’s technical and business know-how and its processes. Does the supplier have sufficient capacity? How flexible are production processes? Will the supplier be able to meet future needs in terms of volume and product technology? The supplier’s cost structure determines whether its pricing is sustainable over the long term. Is a supplier using expensive process technology? How is capital equipment utilized? The risk factors deal with the supplier’s financial strength and stability. Is the supplier able to meet its commitments and to invest in the relationship? Finally, it makes a significant difference whether a supplier is willing to invest in building a relationship, or not. What are the main interests of a supplier? How does the supplier fit into the long-term purchasing and supply strategy? Laseter (1998: 100) gave some serious warnings against simplistic supplier assessments. An overly simple scoring system is to compare different suppliers along the four dimensions by awarding scores, multiplying with weights, and adding up the results. However, a low score on a factor can not always be compensated by a high score on another factor. For instance, the supplier’s capabilities are either acceptable or unacceptable. Furthermore, it should be recognized that some shortfalls are more easily corrected than others. Obviously, it would be easier to improve a supplier statistical process control, than to raise technological competences. Resource dependence theory is concerned with the organization’s vulnerability to extra organizational influence. Confronted by powerful external organizations, it is recommended that companies should develop strategies to avoid and manage their dependence on other organizations (Pfeffer and Salancik (1978: 106-111). From another perspective transaction cost theory too is concerned with the issue of dependence. Under conditions of high asset specificity, the transaction cost theory predicts and prescribes a moving away from market transactions (markets) towards vertically integrated relationships (hierarchies). When asset specific investments are made, they must be safeguarded against opportunism (Heide and John, 1988: 21). Heide (1994: 73) concludes that transactions cost theory parallels resource dependence theory in that it views nonmarket governance as a response to environmental uncertainty and dependence. This first exploration of power and dependence leads us to the conclusion that ‘dependency’ as such is not a question of being good or being bad. On the one hand, there are good reasons for avoiding (too much) dependency, but on the other hand there are

A Portfolio Approach to the Development of Differentiated Purchasing Strategies
113
equally good reasons for being dependent on suppliers. As Young and Wilkonson (1997: 56) observed, within buyer-supplier relationships there is a tension caused by the desire to remain independent and at the same time to depend on others to achieve common ends. In the next section additional insights will be gained from two streams of ‘resource’ theories.
4.2.2 A resource perspective: RBV and RDT
Within the field of strategic management there is a school that provides for a resource-based view (RBV) of the firm. Porter (1980) saw the linking of the firm to its environment as the root of competitive advantage. Industry structure was to be analyzed by the famous five forces-model to determine the extent of competition and the profit potential. Companies should adapt to their environment and they should position themselves according to these forces. By means of this ‘outside-in’ approach Porter paid homage to a capabilities analysis within the firm (McKiernan, 1997: 793). Throughout the 1980s a steady flow of criticism kept on going, especially with respect to the restrictive mutual exclusivity of its generic strategies. This meant that the attention switched to the analysis of the firms’ resource base, searching for what could lead to a competitive advantage. This approach is commonly known as ‘inside-out’. The resource-based view has a long history. Conventional economics focused on traditional resources, like land, labor and capital (Marshall, 1890). Their quantitative models were based on the principles of diminishing returns to scale. These models however have serious problems with the qualitative interactions of human effort and experience, which are believed to provide unique advantages. In this line of thinking Prahalad and Hamel (1990) argued that the real sources of competitive advantage lie in the management’s ability to consolidate corporate-wide skills into competences that empower business units to adapt quickly to changing opportunities. Their concept of core competences underlined the notion and the importance of internal resources. Competitive advantage is built on a unique bundle of skills and competences that are very difficult to imitate. The competitive advantages are ‘sustainable’ in the sense that they depend on a continuous development of key resources. It is noted that the resource-based view of the firm restricts itself mainly to internal resources. A modern variant of the resource-based view of the firm is provided by Hunt and Morgan (1996: 108-109), presenting their resource-advantage theory of competition. In this theory logic relationships are posited between ‘resources’ and ‘market position’, and between ‘market position’ and ‘financial performance’. A superior financial performance is believed to result from occupying marketplace positions of competitive advantage. So, competition is a constant struggle for comparative advantage in resources that will yield favorable marketplace positions. Relevant resources are considered to be: the societal

114
resources on which firms draw, the societal institutions that frame the ‘rules of the game’, the actions of competitors, the behavior of consumers, and public policy decisions. Proponents of the resource-based view have argued that firms who are able to accumulate resources and capabilities that are valuable and scarce will achieve an advantage over competing firms (Barney, 1991; Dierickx and Cool, 1989). In order for a firm’s resources to provide competitive advantage, four criteria must be attributable to the resources (Barney, 1991): (1) value – the resource must be valuable to the firm; (2) rareness – the resource must be unique or rare among a firm’s current and potential competitors; (3) imperfect imitability – the resource must be imperfectly imitable; (4) non-substitutability – the resource cannot be substituted with another resource by competing firms. Some authors in the RBV literature share the view that purchasing activities have little or no significant role to play in strategic issues. Firms can not ‘purchase’ a sustainable competitive advantage on open markets, because many inputs are freely tradable (Barney, 1991: 117 and Dierickx and Cool, 1989: 1505). Ramsay (2001: 260,261) concluded that it is extremely difficult, and will tend to be the exception rather than the rule, for Purchasing to generate and protect competitive advantage. From his perspective, Purchasing could (only) identify and develop unknown suppliers, enclose known suppliers, and buy in a hard-to-imitate manner. Other views on purchasing and supply management emphasize the possibilities of relationships with suppliers for the development of competitive advantages. Carter and Narasimhan (1996: 24-25) performed an empirical study to purchasing’s role in and impact on corporate performance. They concluded that the single most important finding of this study was that purchasing can have a significant impact on competitive position, profitability, and market share. Moreover, the purchasing function should be viewed as a key component of firm competitiveness. Mol (2002: 262) found that firms indeed obtained competitive advantage by managing supplier relations. The study confirmed a positive effect of managing co-operative relations on the economic and the strategic performance of firms. Specialized supplier networks are more generally considered as an important source of competitive advantage; see for instance Dyer (1996) who supported this proposition with empirical evidence from the auto industry. It is agreed that the improvement of the product development process and the access to innovative technology are of paramount importance (see for instance Håkansson and Erikkson, 1993; Morgan and Garnsey, 1994; Calabrese, 2000). In some cases, the buyer and supplier form a strategic alliance. This alliance can be a source of competitive advantage, through idiosyncratic complementary resource combinations between firms (Knudsen, 2002). The embeddedness of the firm’s relational assets make it difficult for competitors to imitate (Lorenzoni and Lipparini, 1999). Dyer and Singh (1998: 661) stated that idiosyncratic interfirm linkages with
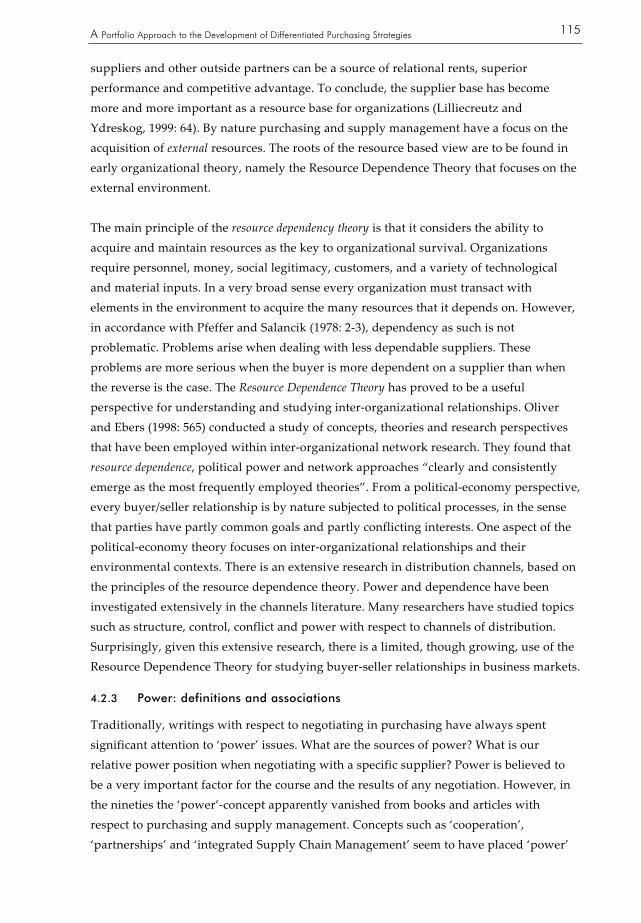
A Portfolio Approach to the Development of Differentiated Purchasing Strategies
115
suppliers and other outside partners can be a source of relational rents, superior performance and competitive advantage. To conclude, the supplier base has become more and more important as a resource base for organizations (Lilliecreutz and Ydreskog, 1999: 64). By nature purchasing and supply management have a focus on the acquisition of external resources. The roots of the resource based view are to be found in early organizational theory, namely the Resource Dependence Theory that focuses on the external environment. The main principle of the resource dependency theory is that it considers the ability to acquire and maintain resources as the key to organizational survival. Organizations require personnel, money, social legitimacy, customers, and a variety of technological and material inputs. In a very broad sense every organization must transact with elements in the environment to acquire the many resources that it depends on. However, in accordance with Pfeffer and Salancik (1978: 2-3), dependency as such is not problematic. Problems arise when dealing with less dependable suppliers. These problems are more serious when the buyer is more dependent on a supplier than when the reverse is the case. The Resource Dependence Theory has proved to be a useful perspective for understanding and studying inter-organizational relationships. Oliver and Ebers (1998: 565) conducted a study of concepts, theories and research perspectives that have been employed within inter-organizational network research. They found that resource dependence, political power and network approaches “clearly and consistently emerge as the most frequently employed theories”. From a political-economy perspective, every buyer/seller relationship is by nature subjected to political processes, in the sense that parties have partly common goals and partly conflicting interests. One aspect of the political-economy theory focuses on inter-organizational relationships and their environmental contexts. There is an extensive research in distribution channels, based on the principles of the resource dependence theory. Power and dependence have been investigated extensively in the channels literature. Many researchers have studied topics such as structure, control, conflict and power with respect to channels of distribution. Surprisingly, given this extensive research, there is a limited, though growing, use of the Resource Dependence Theory for studying buyer-seller relationships in business markets.
4.2.3 Power: definitions and associations
Traditionally, writings with respect to negotiating in purchasing have always spent significant attention to ‘power’ issues. What are the sources of power? What is our relative power position when negotiating with a specific supplier? Power is believed to be a very important factor for the course and the results of any negotiation. However, in the nineties the ‘power’-concept apparently vanished from books and articles with respect to purchasing and supply management. Concepts such as ‘cooperation’, ‘partnerships’ and ‘integrated Supply Chain Management’ seem to have placed ‘power’

116
in the background. More recently there is a renewed interest in the power perspective in procurement and supply management (e.g. Laseter, 1998; Gelderman and Van Weele, 2000; Cox, 2001). The special Spring 2001-issue of The Journal of Supply Chain Management was dedicated to ‘the power perspective in procurement and supply management’. In that issue Cox (2001: 9) posited: “(…) it is surprising that the intuitive understanding (…) that all buyer and supplier relationships operate in an environment of relative buyer and supplier power, appears to have been lost by many practitioners and their advisors.” This statement is in accordance with Gelderman and Van Weele (2000) who put forward similar statements. Handfield and Bechtel (2002) concluded that the perception of dependence is generally considered as an important dimension of any buyer-seller relationship. Keep et al. (1998) examined the history of business-to-business relationships. They found that in each investigated case dependence asymmetry was an important force that influenced relationship development. Faria and Wensley (2002: 607-609) discovered (much to their surprise) in an empirical study to buyer-supplier relationships “the substantial expressions of power use and conflict by interactive partners in every narrative”. The researchers contrasted the central importance of power, politics and negotiation with “the fetishing and alienating representation of (…) managerial practices by much of the SCM literature.” We must conclude that ‘power’ and ‘dependence’ are important concepts for the understanding of buyer-seller relationships. Power has an ideological tinge and produces negative associations, according to Pfeffer (1981) who recognized that power is a topic that makes people uncomfortable. Using power is often seen as unethical and counterproductive. The Kraljic approach is criticized for its strategic recommendations that entail the exploitation of a power advantage position. The exploitation of power is viewed as dangerous because market condition change rapidly (Olsen and Ellram, 1997), or because it endangers and obscures the potential for enhancing productivity and innovativeness in industrial networks (Dubois and Pedersen, 2002). However, this should not mean that power and dependence are unimportant. Our study aims to describe and explain certain aspects of purchasing and supply management. It can not be denied that power and dependence do exist in business relationships. Ignoring these issues will not make them less important for understanding buyer-seller relationships. In fact, it would be counterproductive to take a normative perspective, denouncing and condemning factors that exist and are important in the everyday reality of purchasing professionals. It should be noted that an unbalanced relationship does not automatically involve the actual use or misuse of power. There is an important difference between the possession of power and the use of power. The distribution of power determines the potential influence, the actual influence depends on the extent to which the power is used (Arndt, 1983). As Pfeffer (1981: 7) put it: “Power is a property of the system at rest.” The
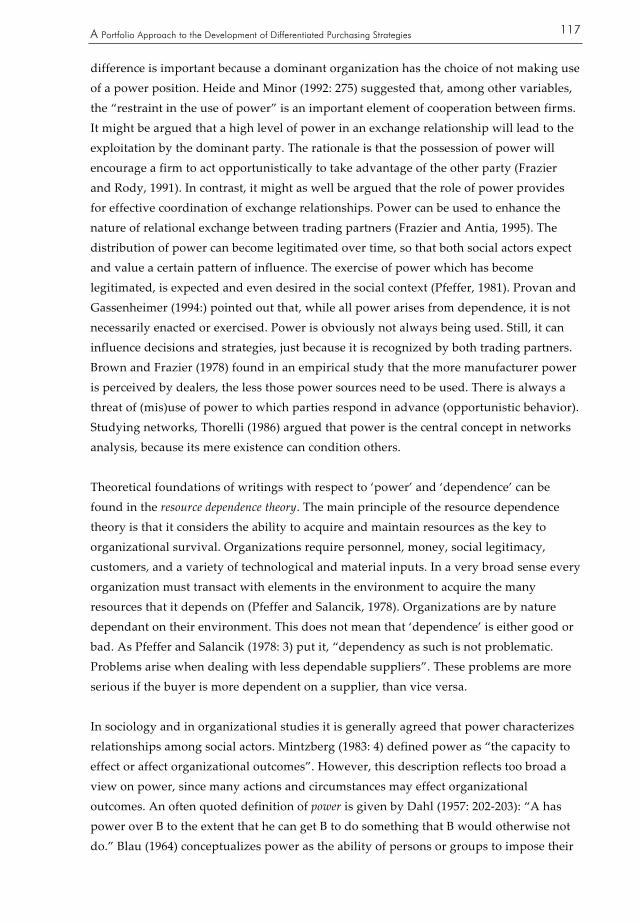
A Portfolio Approach to the Development of Differentiated Purchasing Strategies
117
difference is important because a dominant organization has the choice of not making use of a power position. Heide and Minor (1992: 275) suggested that, among other variables, the “restraint in the use of power” is an important element of cooperation between firms. It might be argued that a high level of power in an exchange relationship will lead to the exploitation by the dominant party. The rationale is that the possession of power will encourage a firm to act opportunistically to take advantage of the other party (Frazier and Rody, 1991). In contrast, it might as well be argued that the role of power provides for effective coordination of exchange relationships. Power can be used to enhance the nature of relational exchange between trading partners (Frazier and Antia, 1995). The distribution of power can become legitimated over time, so that both social actors expect and value a certain pattern of influence. The exercise of power which has become legitimated, is expected and even desired in the social context (Pfeffer, 1981). Provan and Gassenheimer (1994:) pointed out that, while all power arises from dependence, it is not necessarily enacted or exercised. Power is obviously not always being used. Still, it can influence decisions and strategies, just because it is recognized by both trading partners. Brown and Frazier (1978) found in an empirical study that the more manufacturer power is perceived by dealers, the less those power sources need to be used. There is always a threat of (mis)use of power to which parties respond in advance (opportunistic behavior). Studying networks, Thorelli (1986) argued that power is the central concept in networks analysis, because its mere existence can condition others. Theoretical foundations of writings with respect to ‘power’ and ‘dependence’ can be found in the resource dependence theory. The main principle of the resource dependence theory is that it considers the ability to acquire and maintain resources as the key to organizational survival. Organizations require personnel, money, social legitimacy, customers, and a variety of technological and material inputs. In a very broad sense every organization must transact with elements in the environment to acquire the many resources that it depends on (Pfeffer and Salancik, 1978). Organizations are by nature dependant on their environment. This does not mean that ‘dependence’ is either good or bad. As Pfeffer and Salancik (1978: 3) put it, “dependency as such is not problematic. Problems arise when dealing with less dependable suppliers”. These problems are more serious if the buyer is more dependent on a supplier, than vice versa. In sociology and in organizational studies it is generally agreed that power characterizes relationships among social actors. Mintzberg (1983: 4) defined power as “the capacity to effect or affect organizational outcomes”. However, this description reflects too broad a view on power, since many actions and circumstances may effect organizational outcomes. An often quoted definition of power is given by Dahl (1957: 202-203): “A has power over B to the extent that he can get B to do something that B would otherwise not do.” Blau (1964) conceptualizes power as the ability of persons or groups to impose their
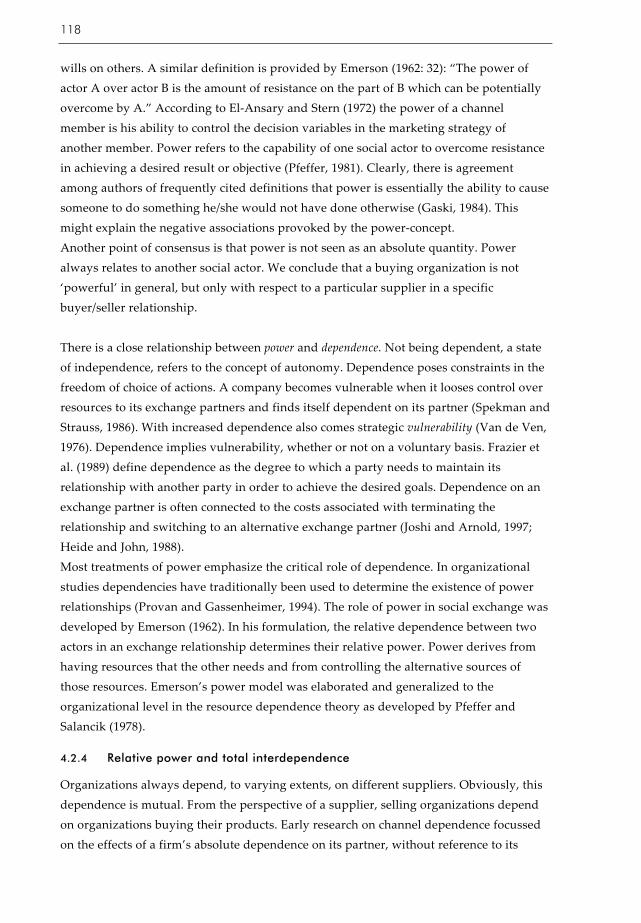
118
wills on others. A similar definition is provided by Emerson (1962: 32): “The power of actor A over actor B is the amount of resistance on the part of B which can be potentially overcome by A.” According to El-Ansary and Stern (1972) the power of a channel member is his ability to control the decision variables in the marketing strategy of another member. Power refers to the capability of one social actor to overcome resistance in achieving a desired result or objective (Pfeffer, 1981). Clearly, there is agreement among authors of frequently cited definitions that power is essentially the ability to cause someone to do something he/she would not have done otherwise (Gaski, 1984). This might explain the negative associations provoked by the power-concept. Another point of consensus is that power is not seen as an absolute quantity. Power always relates to another social actor. We conclude that a buying organization is not ‘powerful’ in general, but only with respect to a particular supplier in a specific buyer/seller relationship. There is a close relationship between power and dependence. Not being dependent, a state of independence, refers to the concept of autonomy. Dependence poses constraints in the freedom of choice of actions. A company becomes vulnerable when it looses control over resources to its exchange partners and finds itself dependent on its partner (Spekman and Strauss, 1986). With increased dependence also comes strategic vulnerability (Van de Ven, 1976). Dependence implies vulnerability, whether or not on a voluntary basis. Frazier et al. (1989) define dependence as the degree to which a party needs to maintain its relationship with another party in order to achieve the desired goals. Dependence on an exchange partner is often connected to the costs associated with terminating the relationship and switching to an alternative exchange partner (Joshi and Arnold, 1997; Heide and John, 1988). Most treatments of power emphasize the critical role of dependence. In organizational studies dependencies have traditionally been used to determine the existence of power relationships (Provan and Gassenheimer, 1994). The role of power in social exchange was developed by Emerson (1962). In his formulation, the relative dependence between two actors in an exchange relationship determines their relative power. Power derives from having resources that the other needs and from controlling the alternative sources of those resources. Emerson’s power model was elaborated and generalized to the organizational level in the resource dependence theory as developed by Pfeffer and Salancik (1978).
4.2.4 Relative power and total interdependence
Organizations always depend, to varying extents, on different suppliers. Obviously, this dependence is mutual. From the perspective of a supplier, selling organizations depend on organizations buying their products. Early research on channel dependence focussed on the effects of a firm’s absolute dependence on its partner, without reference to its

A Portfolio Approach to the Development of Differentiated Purchasing Strategies
119
partner’s dependence (e.g. El-Ansary and Stern, 1972). More recent studies however have incorporated both firms’ dependence (Buchanan, 1992; Kumar et al. 1995; Geyskens et al., 1996). An appealing and well-known definition states that the relative power of an organization over another is the result of the net dependence of the one on the other. If A depends on B more than B depends on A, then B has power over A (Pfeffer, 1981). The relative power can be defined as “the dependence of one party compared to the dependence of the other party” (Bacharach and Lawler, 1981: 65). Dickson (1983) acknowledged that the power of one party over another is a function of relative dependence. Anderson and Narus (1990) used the term relative dependence, referring to the difference between a firm’s dependence on its partner and its partner firm’s dependence on the working partnership. The primary consequence of relative dependence was indicated as power. In asymmetric relationships, the less dependent partner dominates the exchange. Buchanan (1992) conceptualized these power-dependence imbalances as the differences in the value buyers and sellers place on their relationships. Kumar et al. (1995) defined interdependence asymmetry as the difference between the level of dependence of the two partners on one another. Symmetrical interdependence exists when parties are equally dependent on each other. Tuten and Urban (2001) recognized that the balance of power can be aligned through the mutual dependence of supplier and buyer. All these contributions and conceptualizations can be traced to Pfeffer’s (1981: 99) viewpoint that: the relative power of one social actor over another is the result of the net dependence of the one on the other. In this study we will subscribe to the definition that the relative power in a buyer-supplier relationships is the difference between the dependence of the two parties on one another. From the buyer’s perspective, his relative power is measured as the difference between the supplier’s dependence and the buyer’s dependence. Various researchers have argued that a comprehensive view of the interdependence of a dyadic relationship should include both interdependence asymmetry (in our definition: relative power or net dependence) and total interdependence (or total power), e.g. Bacharach and Lawler, 1981; Gundlach and Cadotte, 1994; Kumar et al., 1995, Frazier and Antia, 1995; Geyskens et al., 1996. The total interdependence refers to the intensity of a relationship. A high level of total interdependence is an indicator for a strong, cooperative long-term relationship in which both parties have invested. Mutual trust and mutual commitment will characterize those relationships. If both sides possess large amounts of potential power, there is less likelihood of either trying to convert their potential power, due to the risk of retaliation (Ramsay, 1996b). Geyskens et al. 1996)

120
found strong evidence that total interdependence enhances both affective and calculative commitment. In this study we subscribe to the definition of Geyskens et al. (1996: 306) who posited that: the value of total interdependence of a relationship refers to the sum of each firm’s dependence on its partner. The Dwyer et al. (1987) model of relationship development highlights the process of gradual expansion of interdependence between buyer and seller. To arrive at a high level of total interdependence, partners must go through a number of relationship development phases in which they both continually invest in the relationship (Anderson and Weitz, 1992). To conclude, the interdependence of a relationship is reflected by the magnitude (total interdependence) and the symmetry of dependence (net dependence) between parties. Based on these insights, an interesting line of approach would be a portfolio matrix based on the mutual dependence in buyer-supplier relationships. We will elaborate this point in the next section.
4.3 A mutual dependence-based purchasing portfolio model
In this section we will discuss a number of classification and portfolio models that have a focus on mutual dependence in buyer-supplier relationships. We will demonstrate that there is a perfect match with the four positions in the Kraljic matrix, referring to different kinds of mutual dependence. It is concluded that the Kraljic matrix is a special case of a more general mutual dependence-based portfolio model. In the eighties there were some early writings, referring to the concept of mutual dependence to capture different possibilities of buyer-supplier relationships. To examine the interdependency between manufacturers and distributors, Dickson (1983) developed a channel dependence matrix. Each cell in the matrix represents the market share of a particular manufacturer-distributor combination. The matrix shows the subdivision of a manufacturer’s market share over distributors. Vice versa, the subdivision of the market share of a distributor by manufacturers is shown as well. The magnitude and the dispersion of the different shares is a strong indication for the positional power of subsequent channel members. Scott and Westbrook (1991) proposed a comparable model, which they labeled as the customer/supplier dependence grid. As dimensions they identified: - the percentage of a customer’s purchases which come from a supplier, and - the percentage of a supplier’s sales which go to a customer. Framed in the exchange theory (Thibaut and Kelley, 1959), Anderson and Narus (1984) developed a model based on the buyer’s and the supplier’s motivational investment in a relationship. By highlighting the mutual motivational investments of parties, a map of

A Portfolio Approach to the Development of Differentiated Purchasing Strategies
121
exchange possibilities was drawn, identifying four different kinds of relationships: a buyer’s market, a supplier’s market, the bilateral maintained relationship, and the discrete exchange/spot contracts (Dwyer et al., 1987). In essence, mutual dependence is the key for classifying relationships in these early models. Campbell and Cunningham (1983) too proposed a typology of buyer-supplier relationships which is based on mutual dependence: (a) independent relationships, (b) interdependent relationships, and (c) dependent relationships. Campbell (1985) attributed these relationships to the interplay of interaction strategies (competitive, cooperative, and command), and to a variety of other factors, such as the number of buyers and the number of suppliers in a market, the share the buyer takes of the supplier’s output, the buyer’s need for the supplier’s skills, the level of specialized can be found in Bensaou (1999: buyer’s and supplier’s specific investments) and Cox (2001: attributes of buyer and supplier power). Instead of using concepts such as motivational investments or market share, some authors proposed to use buyer’s dependence and supplier’s dependence for the classification of relationships. Blenkhorn and MacKenzie (1994) and Kumar (1996) made a distinction between ‘low’ dependence and ‘high’ dependence with respect to both the buyer’s dependence and the supplier’s dependence. Frazier and Antia (1995) proposed a typology for classifying relationships on the basis of interdependence and environmental uncertainty. They made a distinction between three levels of interdependence: low interdependence (balanced), unbalanced exchange, and high interdependence (balanced). In the case of a mutual dependence, power is in balance. In conclusion, there are four possible combinations of dependence: - high mutual dependence (balanced power) - low mutual dependence (balanced power) - high supplier’s dependence, low buyer’s dependence (buyer dominated) - low supplier’s dependence, high buyer’s dependence (supplier dominated). This classification is in accordance with the empirical findings of Bensaou (1999) who segmented buyer-supplier relationships into four generic cells: strategic partnerships (balanced power, high mutual specific investments), market exchange (balanced power, low mutual specific investments), captive buyer (supplier dominated), and captive supplier (buyer dominated). If we take a closer look at these four basic power-positions, we must conclude that the Kraljic matrix in essence refers to the same four positions. Implicitly, the Kraljic categories match the four power-dependence combinations. Using our theoretical starting point that the relative power of the buyer is the difference between the supplier’s dependence and the buyer’s dependence, we can introduce a mutual dependence matrix. This model uses ‘supplier dependence’ and ‘buyer dependence’ as the basic dimensions. Figure 4.2 visualizes this matrix, which is made by adding Kraljic’s item categories to the mutual dependence matrix (Gelderman, 2000). The generic categories correspond in a logical way to the four power-positions in the matrix:

122
- strategic items: balanced power based on a high level of interdependence (mutual dependence) - non-critical items: balanced power based on a low level of interdependence (mutual dependence) - leverage items: buyer dominated based on the net dependence (a positive difference between supplier’s and buyer’s dependence) - bottleneck items: supplier dominated based on the net dependence (a negative difference between supplier’s and buyer’s dependence).
In conclusion, we might say that Kraljic’s matrix is a special case of a more general mutual dependence-based model, where both models are expressions of a power-dependence perspective on purchasing portfolio models. To summarize, we have demonstrated that the categories in the Kraljic matrix correspond to four basic mutual dependence positions or power positions. It can be assumed that this has contributed to the generic applicability of the Kraljic matrix and the adoption of the Kraljic approach. Since we have established a close link with ‘dependence’, it is important to know what determines organizational dependence. In other words: what are determinants of dependence? supplier’s dependence high
leverage: buyer dominance
strategic: interdependent
non-critical: independent
bottleneck: supplier dominance
low high buyer’s dependence
FIGURE 4.2 Mutual dependence-based purchasing portfolio model
4.4 Determinants of dependence
In this section we will discuss possible determinants and antecedents of organizational dependence, especially the determinants that constitute buyer-supplier dependence. The discussion includes conceptual and empirical studies to the determinants of dependence. The results of this analysis will be used in the mutual dependence-based portfolio model.

A Portfolio Approach to the Development of Differentiated Purchasing Strategies
123
4.4.1 Conceptual studies to the determinants of dependence
Literature study resulted in many conceivable factors and variables that contribute to the level of organizational dependence. In this section we will limit ourselves to the main conceptual studies in this area, as summarized in figure 4.3. source perspective:
dependence of a(n) determinants of dependence
Emerson (1962) social actor 1. motivational investment in goals mediated by the other 2. availability of those goals outside the relation with this social actor
El-Ansary and Stern (1972)
channel member
1. percentage of a channel member’s business 2. commitment to another member (relative importance) 3. difficulty in replacing another member (cost and effort)
Thompson (1967) organization 1. need for resource/performance 2. ability of others to provide the same resource/performance
Jacobs (1974) organization 1. essentiality of the item 2. availability from other sources
Pfeffer and Salancik (1978)
social actor 1. importance of the resource: magnitude and criticality 2. discretion over the resource 3. number of alternative sources
Campbell and Cunningham (1983)
buyer supplier
1. number of suppliers 2. share of buyer’s requirements purchased from the supplier 3. need for supplier’s skills 1. number of buyers 2. share of supplier’s output taken by the buyer 3. customized product that requires a special investment
Mintzberg (1983) organization
1. essentiality 2. substitutability 3. concentration
Bourantas (1989)
organization 1. importance of the resource a) relative magnitude b) functional criticality c) strategic cruciality 2. substitutability of the source a) existence of other sources b) cost of substitution 3. discretion over the resource
FIGURE 4.3 Conceptual studies to the determinants of organizational dependence
A much quoted general definition of (social) dependence is provided by Emerson (1962: 32) who wrote: “The dependence of actor A upon actor B is (1) directly proportional to A’s motivational investment in goals mediated by B, and (2) inversely proportional to the

124
availability of those goals outside of the A-B relationship.” At a closer look it states that dependence is determined in essence by two factors: the need for a resource and the availability of alternative sources. Other conceptions of interorganizational dependence identified very comparable determinants. Most closely to Emerson’s definition is Thompson (1967) who focussed on an organization’s needs for resources and the presence of other resource providers. Jacobs (1974) introduced the concepts of essentiality and substitutability from economic theory. He pointed at the question whether A can do without B (essentiality of a resource) or whether other sources are available (substitutability of the resource). Dependence of an organization is thus directly proportional to essentiality of resources controlled by the other organization and inversely proportional to the availability of these resources from alternate sources. Departing from Jacobs (1974), Mintzberg (1983) argued that the dispersion and collaboration of buyers (or suppliers) could influence the possible impact on the behavior of the supplying organization (or buying organization). Therefore he posited that there are three key factors that lead to dependency (or power relationships): essentiality, substitutability and concentration. According to Pfeffer and Salancik (1978) three factors are critical in determining the dependence of one organization on another: 1. the importance of the resource; 2. the extent to which the interest group has discretion over the resource allocation and use; 3. the concentration of resource control, in other words, whether the organization has access to the resource from additional sources. These three factors all have a positive correlation with organizational dependence. The dependence on a resource will increase, when the importance of the resource grows, when the discretion enhances, and/or when the concentration of resource control increases. In addition, the importance of a resource is determined by two variables: the relative magnitude of the resource and the criticality of the resource. The second determinant of dependence is the extent of discretion over the allocation and the use of a resource. For an organization to be dependent on a supplier, the resource should be controlled by this supplier. The most actual forms of discretion are: ownership of the resource, control of access to the resource, control of the resource’s use, and the ability to establish rules regulating the possession, allocation, and use of the resource (Bourantas, 1989). Patents of suppliers are a well-known factor to the determination of buyer’s dependence. Suppliers might possess a concession or license which provides them special rights (for instance drilling for oil in the Middle East). The third determinant is concentration of resource control. The dependence on another organization also derives from the concentration of the resource control, or the extent to which input or output transactions are made by relatively few, or only one, significant organizations. However, it is not the number of trading partners that is the critical variable, but whether the

A Portfolio Approach to the Development of Differentiated Purchasing Strategies
125
organization has access to the resource from additional sources (Pfeffer and Salancik, 1978). The availability of alternative sources or resources is generally recognized as an important factor to organizational dependence. Next to the existence of other sources, the cost incurred by substitution (switching cost) is another factor to determine the substitutability of source (Bourantas, 1989). El-Ansary and Stern (1972) are well known pioneers in the field of measuring power and dependence in a channel context. El-Ansary and Stern (1972) viewed dependency as a function of: 1. the percentage of a channel member’s business which he contracts with another member and the size of the contribution which that business makes to his profits; 2. the commitment of a channel member to another member in terms of the relative importance of the latter’s marketing policies of him; 3. the difficulty in effort and cost faced by a channel member in attempting to replace another member as a source of supply or as a customer. Compared to the conceptualizations of Emerson (1962) and Pfeffer and Salancik (1978), we must conclude that principally no additional issues are raised, even within a channel context. The only specific term is the reference to ‘marketing policies’, which can be connected to their focus on channel leader and control. A channel leader can impose his marketing policy on other organizations within the distribution channel. In line with this, their conception of power in a given channel is “the ability to control the decisions variables in the marketing strategy of another member” (El-Ansary and Stern, 1972: 400, 422). The same conclusion can be drawn assessing the determinants of buyer’s and supplier’s dependence that were identified by Campbell and Cunningham (1983). They identified the number of buyers/suppliers, the share in each other’s business and a third determinant that refers to forms of criticality (buyer: need for the supplier’s skills; supplier: customized product that requires a specific investment). In conclusion, the common findings of these conceptual studies is that dependence is a function of: - the importance of the resource and - the substitutability of the source. It is noted that these factors are very much in line with Emerson’s (1962) original conceptualization of (organizational) dependence. The availability of alternative sources however, is replaced by the concept of substitutability which covers the availability issue as well as the cost incurred when replacing a trading partner (switching cost). In addition, the importance of the resource is determined by relative magnitude and criticality. To gain a more solid basis for a mutual dependence model, we will add an analysis of empirical studies to the determinants of dependence.

126
4.4.2 Empirical studies to the determinants of dependence
The main question to be answered in this section is: what variables have proved to have a statistically significant influence on the (level of) organizational dependence? Traditionally, the dependence-construct has had a prominent role in channels research. However, our literature review shows that there is only a very limited number of empirical studies, devoted to the explanation of organizational dependence. We are inclined to conclude that insignificant attention has been paid to the actual gathering of empirical evidence on the determinants of dependence. In contrast, most empirical studies that involve ‘dependence’-issues select organizational dependence as an explanatory variable. In the last 30 years a variety of phenomenons has been explained by organizational dependence, including: - power and control (El-Ansary and Stern, 1972; Etgar, 1976; Brown et al., 1983; Frazier et al., 1989; Anderson and Narus, 1990; Buvik and Halskau, 2001), - affective and calculative commitment (Provan and Gassenheimer, 1994; Geyskens, 1996; De Jong and Nooteboom, 2000; Kim, 2001), - performance and satisfaction (Heide and John, 1988; Buchanan, 1992; Gassenheimer and Ramsay, 1994; Lusch and Brown, 1996; Miles et al. 1999; Buvik and Reve, 2001) - cooperation and competition (Sriram et al., 1992; Young and Wilkinson, 1997) - governance and contracting (Heide, 1994; Frazier and Anita, 1995; Lusch and Brown, 1996) - opportunistic behavior (Provan and Skinner, 1989; Nooteboom et al., 1997; Joshi and Arnold, 1997; Nooteboom et al., 2000) - relationship development (Keep et al., 1998) - transaction costs (Sriram et al., 1992) - innovative activities (Kamath and Liker, 1990) - integration and adaptation (Hallén et al., 1991; Johnson, 1999) - trust and supply chain responsiveness (Handfield and Bechtel, 2002). This not-exhaustive list of phenomenons, explained by organizational dependence, confirms the earlier notion that dependence is a key construct for understanding buyer-supplier relationships.

A Portfolio Approach to the Development of Differentiated Purchasing Strategies
127
source
perspective: dependence of a
determinants of dependence empirical results: significance at p < .05
Sriram, Krapfel and Spekman (1992)
buyer 1. transaction importance 2. specific investments made by suppliers
positive negative
Ganesan (1994)
retailer 1. environmental uncertainty a) volatility b) diversity 2. buyer’s transaction specific investments 3. supplier’s transaction specific investments
n.s.*
negative positive positive
Berger, Noorderhaven and Nooteboom (1995)
supplier 1. asset specificity 2. sales to buyer as % of total sales 3. knowledge exchange 4. goodwill trust 5. network embeddedness 6. legal safeguarding 7. competence trust 8. relationship duration 9. growth of sales to buyer 10. buyer dependency
positive positive negative negative
n.s.* n.s.* n.s.* n.s.* n.s.* n.s.*
Dant and Gundlach (1998)
franchisee 1. environmental uncertainty 2. relationship performance 3. relationship duration 4. specific investments (multi-unit ownership)
negative positive
n.s.* positive
Nooteboom, De Jong, Vossen, Helper and Sako (2000)
buyer supplier
1. supplier’s value to the buyer 2. alternative suppliers 3. habituation between partners 1. customer’s value to the supplier 2. alternative buyers 3. habituation between partners 4. dedicated investments
positive negative positive positive
n.s.* positive positive
* n.s. = not significant
FIGURE 4.4 Empirical studies to the determinants of organizational dependence
Figure 4.4 summarizes the results of the empirical studies that have been found on the determinants of organizational dependence. Next we will compare and analyse the determinants with a statistically significant impact on dependence, although there are

128
differences in scope, perspective and design of the studies. In line with the main conclusion regarding the conceptual studies, it is also concluded that in all empirical studies two common elements arise: 1. substitutability, and 2. importance. In all empirical studies the first component has a positive impact on dependence and the second component has a negative impact, in line with prior expectations. The substitutability can be subdivided in the level of specific investments and the availability of alternative sources. The importance of a resource is operationalized in various ways, such as ‘transaction importance’, ‘share of business’, ‘relationship performance’ and ‘value to the other’. These operationalizations allow for the use of ‘importance’ as collective noun, without losing critical information. The remaining variables that are selected in the empirical studies can not be clustered in a similar, unambiguous way. They include single-used relationship characteristics, such as ‘goodwill trust’, ‘knowledge exchange’ and ‘habituation’. However, due to the limited number of empirical studies, no decisive answers were found concerning the statistically significance of the determinants of dependence. We did find some tentative empirical evidence that ‘importance’ and ‘substitutability’ have a significant impact on dependence, confirming the main finding of our analysis of the conceptual studies. These basic components will be elaborated into a tentative model of organizational dependence, in a buyer-supplier context.
4.4.3 Towards a conceptual model
In our tentative conceptual model of the determinants of organizational dependence, importance is conceptually composed of: - the financial magnitude of the exchanged resources, and - the criticality of the resources. The substitutability encloses two elements too: - the availability of alternative sources - the switching cost, incurred when replacing a trading partner.

A Portfolio Approach to the Development of Differentiated Purchasing Strategies
129
FIGURE 4.5 Tentative model of the determinants of organizational dependence
(1) Financial magnitude
The relative magnitude of a resource has a positive impact with the importance of that resource (Pfeffer and Salancik, 1978). In a buyer-supplier context the magnitude of a resource refers to the financial magnitude of the transaction. The financial magnitude of a resource is measurable by assessing the proportion of total inputs (buyer’s dependence) or the proportion of total outputs (supplier’s dependence) accounted for by the exchange. In general: the larger the share, the greater the importance of the resource and the higher the dependence on the other organization. The money value of purchases made from a specific supplier can be divided by the organization’s total purchases. Another possibility is dividing the purchases from a supplier by total spending in the product category. This means that the relative magnitude of a resource obtained from a supplier could be measured, assessing the proportion of total purchases or the proportion of a product category (Bourantas, 1989). The value of these indices range between 0 and 1.
(2) Criticality
The criticality of a resource refers to the functioning of an organization. Criticality captures the ability of the organization to continue functioning in the absence of the resource. A resource may be critical to the organization even though it represents a small proportion of the total input. In terms of the Kraljic matrix, this reflects the basic notion of bottleneck items. Next to this (functional) criticality Bourantas (1989) introduced the factor strategic cruciality that corresponds with a broader idea of resource importance: the resource’s contribution to the organizational’s critical success factors, distinctive competences or competitive advantages.
+
+
+
-
financial magnitude
resource criticality
availability of alternative sources
switching costs
organizational dependence
130
Dependence may be produced by an organization’s capabilities in performing vital functions within a supply chain. Influence can be based on critical expertise and specialized knowledge. In general, the greater the degree in which a buyer relies on the critical expertise of a supplier, the higher the buyer’s dependence will be (Wilemon, 1971) The reverse is also true. When a component is critical to the performance and competitive advantage of an end product, the performance of the supplier is critical as well for the functioning of the organization (Bello et al., 1999). The relationship with suppliers of critical components is preferably based on close, integrated partnerships, not on traditional arm’s-length agreements (Slade, 1993). Increased dependency can be the effect of increased collaboration and supplier involvement in product development (Wynstra, 1998). Just-In-Time purchasing requires reliable suppliers that are willing and able to comply to stringent delivery and quality requirements (Handfield, 1993). Interdependence is the likely result of increased coordination and synchronization of product and supply in a JIT regime. We conclude that criticality can mean different things, although a common characteristic is the indispensability of a resource, in view of the ability of the organization to continue functioning in the absence of that resource. From a buyer’s perspective criticality refers to the need for the resources of a supplier. An interrupted supply of a highly critical input would produce significant problems to the functioning of the buying organization. From a supplier’s perspective critical outputs are more profitable, embody the supplier’s core technical and/or market competences, and strategically position the supplier in key markets (cf Krapfel et al., 1991). Buyers that consume more critical outputs of a supplier are more highly valued, resulting in a higher level of supplier’s dependence.
(3) Availability of alternatives
Access to the resources from additional sources is always key to organizational dependence. Organizations will be more dependent on their trading partners, whenever it is more difficult to acquire resources from others. Buyers and suppliers should be aware of the number of alternative parties that are available at a given moment. In economic theory the number of buyers and suppliers is key to the assessment of market structures. If an organization faces a monopolist that controls a certain resource, then the dependency involved is hard to master. Where there is just one available supplier, that supplier will have great power. In contrast, commodity markets will not produce much dependence on the side of the buyers, but will be problematic for the large numbers of interchangeable suppliers. Where there are many suppliers, so that each controls a miniscule fraction of the market, single suppliers will probably be powerless. Finally, where there are a small number of suppliers, so that each controls a large proportion of the market, then each supplier can be expected to have oligopolistic power (Jacobs, 1974).
A Portfolio Approach to the Development of Differentiated Purchasing Strategies
131
In the eighties and nineties it is observed that purchasing practice has been changing from the traditional arm’s length relationships with suppliers to closer, more cooperative relationships (e.g. Dwyer et al., 1987 and Swift, 1995). Management concepts such as Just-In-Time management and Supply Chain Management have promoted a general tendency to work more closely with a limited number of suppliers. These new approaches to purchasing management have logically resulted in reduced supplier bases, more single sourcing and higher levels of dependence on smaller numbers of suppliers. In many cases first-tier suppliers have no liberty in selecting suppliers or products, because they are pointed out by the customer, the OEM that dominates the supply chain. Once a component is used, the OEM is reluctant to change the design or select different components or suppliers. Many large companies therefore specify which suppliers are to be used by their first-tier suppliers, mainly because particular critical components have to fit with other critical components (Johnsen et al., 2000). The dependence on a supplier obviously decreases when new suppliers enter the market. The most common advice to avoid dependence on a single supplier would be to contract two or three suppliers (dual or multiple sourcing). Despite early supplier involvement, large manufactures in Japan still maintain relations with other suppliers, enabling a double check and upholding a threat of potential shift (Harryson, 1995). Nicholson (1993) advised purchasing managers to act like risk managers when it came to longer-term supply strategies. Regarding the issue of ‘alternatives’, purchasing managers should ask themselves questions such as ‘Are alternatives available?’ and ‘If not, could they be made available, e.g. by encouraging or assisting other suppliers to develop alternatives, by the buying firm developing its own alternatives or by changing the current product?’ With respect to the substitutability Bourantas (1989) suggested that, besides the number of alternative suppliers, the cost that would arise from substituting one source for another should be included. This brings us to the fourth determinant of dependence: the switching cost.
(4) Switching cost
The concept of switching cost refers to the difficulties or costs connected with changing a firm’s current trading partner. Benito et al. (1999) consider two connected types of switching costs: - break-off costs that form a barrier to ending old business relationships, and - set-up costs that form a barrier to engage in new business relationships. Replacing an existing supplier with another can produce huge non-recurring expenses. In the transaction cost theory these costs are ascribed to the transaction-specific investments (Williamson, 1975). Transaction-specific investments can not be used for alternative purposes without additional costs: switching costs. According to the transaction cost theory, switching costs largely determine the choice of the optimal coordinating

132
mechanism: markets or hierarchies. Asset specificity refers to “the degree to which an asset can be redeployed to alternative uses and by alternative users without the sacrifice of productive value” (Williamson, 1989: 142). Many transactions require the use of specific assets. In general, the more specific the asset, the harder it is to deploy for alternatives uses, if the relationship should be terminated. Jackson (1985) discussed switching costs as a key to understanding organizational buying behavior. Industrial organizations invest in their relationship with a supplier through some combination of money, people, lasting assets, and procedures. Money is directly invested to pay for the purchases, especially capital goods (equipment and systems). Sometimes other lasting assets are bought to use the new product. In addition, people are hired or trained to work. From the seller’s point of view, it might be tempting to make it as difficult and expensive as possible for buyers to switch to another supplier. Examples of such (marketing) tactics are to lock-in the buyer to a particular system, to create strong links (physical distribution, electronic links), to stimulate personal contacts, to provide ‘free’ supply of software (Nicholson, 1993). Both buying and supplying organizations invest in the relationship with their trading partner. The development and production of dedicated equipment assigned exclusively to one customer, increases the switching costs and the supplier’s dependence. In the automotive industry suppliers even build dedicated plants literally next door to their customer’s assembly plant to enable just-in-time delivery. On the other hand, buying organizations also face relation specific investments, making significant investments in suppliers. For instance, 40 to 50 Honda purchasing professionals work full-time on-site with suppliers as part of their unique supplier development program, presenting a major investment by Honda (Laseter, 1998). The issue of switching costs will be particularly important in collaborative, long-term buyer-supplier relationships. In order to take full advantage of an ongoing relationship, companies gradually adapt their resources and routines to the specific needs of that relationship (Benito et al., 1999). This is likely to result in (mutual) exit barriers, high switching costs and therefore a high level of interdependence. To summarize, in this study we have selected four determinants of organizational dependence on grounds of compelling logic and relevancy. Analysis of conceptual and empirical studies have resulted in the following basic predictor variables: financial magnitude, criticality, availability of alternative partners and switching cost. In the case studies this conceptualization will be compared to the practical insights of purchasing practitioners, allowing for adaptation in our tentative model of dependence.

A Portfolio Approach to the Development of Differentiated Purchasing Strategies
133
4.5 Managing dependence
In this section we will discuss two main theoretical paradigms to clarify and explain the role of ‘dependence’ in buyer-supplier relations: resource dependence theory and transaction cost theory. Both theories describe and prescribe ways and strategies for ‘managing organizational dependence’. In addition, in line with the scope of this study, connections will be made with the purchasing portfolio approach.
4.5.1 Resource dependence theory
In general, resource dependence theory characterizes the links among organizations as a set of power relations based on the exchange of resources (Ulrich and Barny, 1984). Organizations are assumed to change their dependence relationships by minimizing their own dependence and by maximizing the dependence of other organizations on themselves (Jacobs, 1974; Pfeffer, 1981). To obtain favorable exchange conditions, companies should be engaged in avoiding, managing and balancing their dependence on other organizations. Emerson (1962) presented three generic strategies to be applicable for a company A which strives to improve its dependence position with company B: (1) cultivate other sources than B, (2) increase the importance of the exchange for B, (3) decrease the importance of the exchange for A. Pfeffer and Salancik (1978) discussed a number of business strategies to reduce or avoid dependence, which are usually not within reach of purchasing management and purchasing departments. They include: initiate mergers and vertical integration, alter the purpose and structure of the organization, develop substitutable resources, diversify into different lines of business, eliminate the concentration of control through antitrust suits and the acquisition of countervailing control. In line with these overall business strategies, many Japanese firms have taken an equity-approach to manage the threat of suppliers. They have purchased a substantial equity position in their critical suppliers who on their turn have purchased an equity position in their critical customers (Barney, 1996). These cross-equity relations tend to be very stable and form the basis of cooperate relations (Ouchi, 1984; Harryson, 1995). In line with resource dependence theory there are a number of more operational ways in which organizations could manage their dependence on suppliers. A distinction can be made between: 1. methods that reduce or even eliminate dependence and 2. methods that help limit the negative effects of dependence. Strategies in the first category can be linked to the various determinants of dependence. By changing the ‘value’ of such a determinant, the level of dependence will be directly changed too. Examples would be to find or to develop other suppliers for the same input (availability of alternative suppliers), to implement standardization programs (reduce switching cost), or to spread business over multiple sources (financial magnitude).

134
Methods in the second category do not reduce the dependence on the exchange relationship. They do not eliminate the organization’s vulnerability, because they do not remove the basic sources of dependence. Examples are keeping excessive stocks to survive periods of uncertainty, instability and scarcity, using contract negotiations to acquire countervailing legal power, and the socialization of executives or the development of norms and values which will restrict the exercise of interorganizational influence (Pfeffer and Salancik, 1978; Bourantas, 1989). To conclude, resource dependence theory is very concerned with the issue of avoiding and reducing dependence on other organizations. Various ways and strategies are proposed for reducing and avoiding external dependence. However, it should be added that resource dependence theory places dependence problems in perspective. Pfeffer and Salancik (1978: 3) concluded that “the fact that organizations are dependent on their environment does not, in itself, make their existence problematic. Problems arise not merely because organizations are dependent, but because the environment is not dependable.” Buyers therefore will be challenged with problems of dependence, especially when dealing with suppliers who are perceived as less dependable. These problems are more serious if the buyer is more dependent on a supplier.
4.5.2 Transaction cost theory
Transaction cost theory focuses on how an organization should organize its boundary-spanning activities so as to minimize the sum of its production and transaction costs. From an economic perspective, it is assumed that the most efficient relationship will prevail for any given transaction configuration. In his early writings Williamson (1975, 1985) identified markets and hierarchies as the two modes of governance. Under conditions where transactions are characterized by non-specific investments and the availability of alternative trading partners market governance (e.g. spot contracts) will prevail. Under market governance both buyer and supplier can move with relative ease among exchange partners. One could argue that in terms of the Kraljic matrix, market governance refers to the non-critical quadrant. As transactions are more characterized by relationship specific investments and exchange partners become more interdependent, the cost of strict market contracting becomes inexpensive and inefficient (Spekman and Strauss, 1986). Moreover, the more powerful partner is likely to be motivated to behave in a self-serving opportunistic manner. From this perspective, transaction cost theory explains why an organization would choose to internalize the production of components, even though its production costs might be higher than those offered by a specialized firm (Barringer and Harrison, 2000). The basic choice is a make-or-buy issue, resulting in either ‘make’ (hierarchical governance) or ‘buy’ (market governance). In later writings, Williamson (1991) acknowledged additional interorganizational forms, such as a joint

A Portfolio Approach to the Development of Differentiated Purchasing Strategies
135
venture or a network structure. The make-or-buy decision is expanded to make, buy, or partner. In general, such bilateral governance is characterized by information sharing and joint long-term planning. It aims at reducing costs of market governance, while allowing the partners to remain flexible which is often lost in vertical integration (Buzzell, 1983). The fundamental prediction of transaction cost theory is that when transaction specific investments are made, they must be safeguarded against opportunism. Protection is achieved by moving away from an arm’s length market relationship toward a vertically, integrated relationship (bureaucratic control). This traditional safeguard is obviously not always feasible or desirable. A theoretical extension of the transaction cost theory is offered by Stinchcombe (1985), who argued that safeguards can be obtained also by explicit contractual agreements. Administrative control can also be inserted in such agreements. Buvik and Reve (2001) for instance, found empirical evidence for the relationship between unilaterally deployed specific assets and the level of formalized contracting. In contrast, Achrol and Gundlach (1999) found that legal contracts are largely ineffective in mitigating opportunism. In addition, contractual safeguards will not be possible if the party with specific assets at risk is much smaller than the other party and has less bargaining power (Heide and John, 1988). Despite the opportunities of even the most elaborate contracts as safeguards, contracts are constrained in their ability to ‘presentiate’ or foresee and account for future contingencies (Macneil, 1980). There is evidence and appealing logic for the conclusion that the use of explicit contracts is associated with perceptions of distrust and low commitment (Jap and Ganesan, 2000). The absence of mutual commitment is obviously not a condition that encourages and stimulates joint development programs. This leads us to the conclusion that the classical solutions of transaction cost theory are generally insufficient to solve the safeguarding problem of relation-specific investments.
4.5.3 The Kraljic approach
In this section we will look at the Kraljic portfolio approach from a dependence perspective. Figure 4.6 summarizes the generic recommendations that are provided for the quadrants of the matrix. In addition, columns are added for the main objectives to be pursued by the strategic recommendations and for their intended and expected impact on the power-dependence relationships with suppliers. From a dependence perspective we might conclude that the recommendations for the bottleneck items and for the non-critical items have no significant impact on the buyers’ and supplier’s dependence. ‘Volume insurance’ and ‘efficient processing’ are adaptive methods, aimed at other objectives than changing the prevailing power-dependence relationships with suppliers. The recommendations handle problems that are a consequence of the matrix position: the negative effects of a shortage of supplies and the negative effects on the operational purchasing costs.
136
Quite a different picture is found in the leverage and strategic quadrant, where either the buyer’s dependence or the supplier’s dependence is increased, or both. In other words, the provided recommendations are aimed at changing the relative power position towards suppliers. Buyers are advised to pro-actively use possibilities, especially in light of the existing relationships with suppliers, attributed in terms of relative ‘dominance’. The exploitation of purchasing power will expand the buyer’s dominance in the relationship even more. In cases of supplier’s dominance more restraint actions are recommended, such as ‘find material substitutes’ and ‘accept higher prices or long-term obligations to prevent shortages of supply’. Finally, in case of power balance, a rather adaptive strategy is recommended to match and to develop the existing (long-term) relationship with the supplier in the strategic quadrant. We conclude that there are definitely elements of ‘managing organizational dependence’ to be found in Kraljic’s basic recommendations. Obviously, power-influencing strategies are pursued in practice, based on a portfolio approach to the development of purchasing strategies. In the empirical part of this study we will elaborate on the various portfolio-based strategies that are recognized in practice and the conditions that allow or promote the selection of these strategies. In the next section however, we will first reflect on other views on the issues of power and dependence, offering critical perspectives on the selection and use of ‘dependence reducing strategies’ in buyer-supplier relationships.
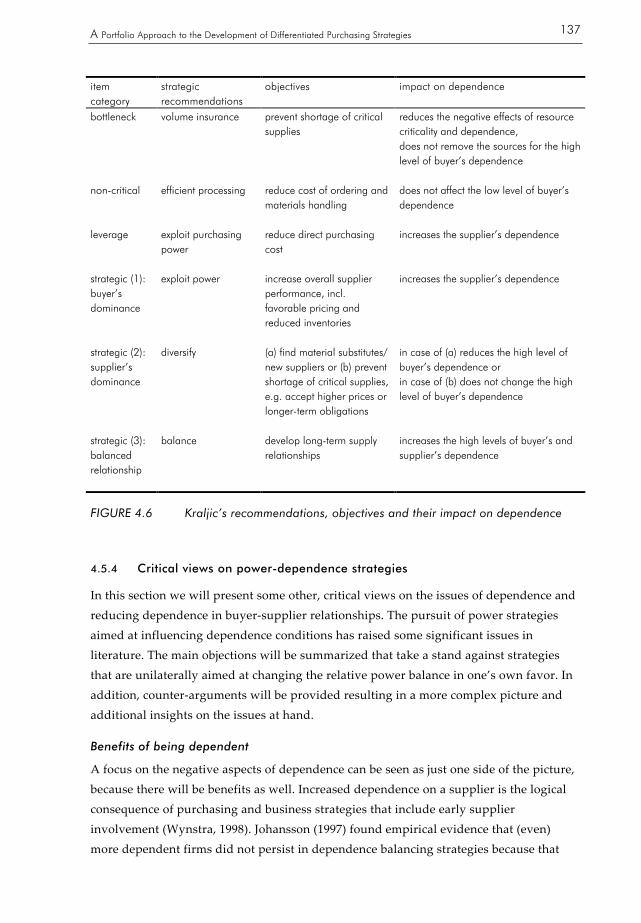
A Portfolio Approach to the Development of Differentiated Purchasing Strategies
137
item category
strategic recommendations
objectives impact on dependence
bottleneck volume insurance prevent shortage of critical supplies
reduces the negative effects of resource criticality and dependence, does not remove the sources for the high level of buyer’s dependence
non-critical efficient processing reduce cost of ordering and materials handling
does not affect the low level of buyer’s dependence
leverage
exploit purchasing power
reduce direct purchasing cost
increases the supplier’s dependence
strategic (1): buyer’s dominance
exploit power
increase overall supplier performance, incl. favorable pricing and reduced inventories
increases the supplier’s dependence
strategic (2): supplier’s dominance
diversify
(a) find material substitutes/ new suppliers or (b) prevent shortage of critical supplies, e.g. accept higher prices or longer-term obligations
in case of (a) reduces the high level of buyer’s dependence or in case of (b) does not change the high level of buyer’s dependence
strategic (3): balanced relationship
balance
develop long-term supply relationships
increases the high levels of buyer’s and supplier’s dependence
FIGURE 4.6 Kraljic’s recommendations, objectives and their impact on dependence
4.5.4 Critical views on power-dependence strategies
In this section we will present some other, critical views on the issues of dependence and reducing dependence in buyer-supplier relationships. The pursuit of power strategies aimed at influencing dependence conditions has raised some significant issues in literature. The main objections will be summarized that take a stand against strategies that are unilaterally aimed at changing the relative power balance in one’s own favor. In addition, counter-arguments will be provided resulting in a more complex picture and additional insights on the issues at hand.
Benefits of being dependent
A focus on the negative aspects of dependence can be seen as just one side of the picture, because there will be benefits as well. Increased dependence on a supplier is the logical consequence of purchasing and business strategies that include early supplier involvement (Wynstra, 1998). Johansson (1997) found empirical evidence that (even) more dependent firms did not persist in dependence balancing strategies because that

138
would jeopardize the privileges that are not attainable in a less asymmetrical structure. Nooteboom et al. (2000) concluded that under greater uncertainty (technology and markets), there is a greater need for firms to seek relations with sources to compensate their own cognitive and technological constraints. At the same time, they acknowledged the fact that this consequence does not solve hold-up problems. However, by engaging in specific investments one may develop a unique competence value for the partner, which makes him dependent. If this is the case, the hold-up risk is effectively neutralized. The authors found empirical evidence for this causal loop, which was labeled as the loop of self-interested commitment: specific investments increase dependence on the other party, but can also serve to increase one’s value to the partner, which makes him dependent and reduces the incentive towards opportunism. Comment: the fact that there are benefits and returns attached to dependence raised the expectation that there will be risks as well. Moreover, there should be a positive relation between risks and (expected) returns, like in any investment decision. The notion of ‘balance’ can also be found in the loop of self-interested commitment: an increased dependence is not problematic under the condition that the other party becomes more dependent as well.
Relational norms
We have concluded that the classical recommendations of transaction theory offer no final solutions to the issues of unilateral dependence and the connected safeguard problems. In addition to transaction theory, there is a more sociological perspective that believes that a richer understanding of interfirm organization is available through studying the embeddedness of economic actors (Granovetter, 1985). The development of relational norms is generally considered as an alternative way for safeguarding specific investments. Developing closer ties with exchange partners will reduce opportunistic behavior. Heide and John (1990) found that suppliers who have invested specific assets in a manufacturer, established close ties with that manufacturer by means of joint action and expectations of continuity. In a related study, Heide and John (1992) demonstrated that relational norms (i.e. flexibility, information exchange, and solidarity) were present in buyer-supplier relationships and enabled buyers to protect their investments by gaining control over supplier decision making, thus reducing the hazards of opportunism. Comment: in contrast to the proposition that buyers could consider the existence of relational norms as safeguards, it can be argued that buyers have not removed or handled the sources of their dependence on suppliers, which means that they remain vulnerable to the (opportunistic) behavior of suppliers. In addition, it can be argued that opportunistic, self-interest-seeking behavior might not be perceived to be a problem but rather part of normal practice of doing business (cf. Cox, 1996). Companies assume that also their partners are and should be loyal to their own

A Portfolio Approach to the Development of Differentiated Purchasing Strategies
139
interests. Trading partners are able to develop a set of relational norms in which ‘opportunism’ is not perceived to be inappropriate, but rather sound business practice (Young and Wilkinson, 1997). In other words, certain kinds of opportunistic competitive behavior are in fact part of the relational norms between companies. A related issue is the exact meaning of opportunism which might have given rise to misunderstandings. In transaction cost theory opportunism is defined as “self interest seeking with guile” (Williamson, 1975: 6). Opportunism is often conceptualized in behavioral terms such as ‘deceitful withholding of information’ and ‘failing to keep promises’ (John, 1984). These behaviors should not be confused with normal business practice based on implicitly shared (relational) norms, such as hard bargaining, demonstrating competitive behavior, entering into necessary confrontations and constructive conflicts (Young and Wilkinson, 1997). In general, companies should be engaged in self-interest-seeking behavior, however without guile.
Counterproductive power strategies
The use of power-dependence influencing strategies is often viewed as counterproductive. Johansson (1997) pointed at several more subtle strategies to be used as alternatives to the more overt and explicit power strategies. The exploitation of power is considered dangerous because market conditions change rapidly (Olsen and Ellram, 1997) or because it endangers and obscures the potential for enhancing productivity and innovativeness in industrial networks (Dubois and Pedersen, 2002). Stannack (1996: 56) concluded that purchasing needs to use a new range of power strategies in order to create improvements in supply chain performance. He added that the traditional tool (money) is not appropriate for the intended behavioral change of suppliers: “money can buy compliance, it cannot buy commitment and the flexibility, innovation and responsiveness that commitment can bring.” Comment: there is a large number of publications that express a believe in the superior advantages of ‘trust’ in buyer-seller relationships (for instance Morgan and Hunt, 1994; Kumar, 1996; Doney and Cannon, 1997; Smith and Barclay, 1997 and Garbarino and Johnson, 1999). Laseter (1998: 93) sharply criticized ‘popular literature’ that suggests that ‘trust’ is the key to effective relationships. He stated: “But simply preaching trust as a new gospel is unworkable at best and definitely naïve. To build relationships on a more solid footing, a translation of trust is suggested into actions requiring: mutual dependence, goal congruence, and knowledge of competency.” The key issue here is not the presence of power or the exercise of power as such. Earlier we have emphasized that power can be used in a positive way, providing for effective coordination of exchange relationships. Power can be used to enhance the nature of relational exchange between trading partners (Frazier and Antia, 1995). The distribution of power can become legitimated over time, so that both social actors expect and value a certain pattern of influence. The exercise of power which has become legitimated, is expected and even

140
desired in the social context (Pfeffer, 1981). As we have seen earlier, various kinds of power-influencing strategies are likely to be within the accepted boundaries of the relational norms in many buyer-supplier relationships
Network approach
Stannack (1996) expressed his concern about the fact that exchange theories of power rest upon individual transactions and fail to take into account transactions which are embedded in networks. Anderson et al. (1994), for instance, have demonstrated that networks have a significant effect upon dyadic interactions. The industrial network approach strongly suggest that firms will have an interest in preserving an overall network stability. Håkansson (1989) emphasized technology development within networks, driven the firm’s pursuit of their own self-interests. If relationships are not stable enough, the firms will not take the risk of making further commitments. This implies that regardless of the power and dependence distribution, there is a limit to how far a firm will be prepared to go in pursuing its self-interest and strengthen its own position at the expense of others. Jarillo (1988) argued that networks are more efficient than markets or hierarchies, because they tend to minimize transactions costs for participating firms. Moreover, opportunism is minimized through mutual trust and the desire to remain in the network. Comment: it is recognized that the industrial network approach demonstrates an optimistic view on collaboration within networks, where its main focus is on cooperative aspects buyer-supplier relationships (Johansson, 1997). After many years of double-digit growth, in 2001 a number of industries suffered from severe downturns (e.g. semi-conductor, telecom). Several companies tried to pass their problems down the supply chain. Some failed, others succeeded. Not until then, companies had to discover in a painful way the real value of all their ‘partnerships’. Obviously, many firms suffered from the seamy side of supply chain integration and asymmetrical dependence structures. From a power-dependence perspective this will not come as a surprise. Moreover, resource dependence theory would predict that companies who suffered most are the less powerful and more dependent links of the supply chain.
4.5.5 Conclusions
We have reviewed resource dependence theory, transaction cost theory and Kraljic’s portfolio model for their approaches to and ways of ‘managing dependence’. A common characteristic of these perspectives is their focus on avoiding and reducing the organization’s dependence. A useful distinction can be made between: (1) methods that aim to reduce the dependence on another organization and (2) methods that limit the negative effects of dependence but do not remove or reduce the sources of dependence. In addition, counter-arguments were provided too, indicating that there are risks attached to ‘being dependent’, but that it also brings in returns. No simple answers were found to

A Portfolio Approach to the Development of Differentiated Purchasing Strategies
141
the complex issue of dependency in buyer-supplier relationships. Like in all investment decisions, risks and returns should be fully considered and balanced. Undoubtedly, there is no one best way of managing supplier relationships, and there is no best way of ‘managing dependence’. Purchasing managers are challenged by the task of developing differentiated purchasing and supplier strategies as a response to varying circumstances and situations. Obviously, the Kraljic approach has much to offer. In line with the scope of this study, after extensive literature study, we will next investigate the possibilities of the portfolio approach in practice.
4.6 Answers to and further elaboration of the fifth research question
The review of literature has confirmed that power and dependence should be recognized as significant concepts for the understanding of any buyer-supplier relationship. Only recently, there has been a renewed interest in the issues of power and dependence in purchasing and supply management (see for instance Cox, 2001). In this chapter we have elaborated on issues of power and dependence in buyer-supplier relationships, with a special focus on relevance for the purchasing portfolio approach. Analysis of literature has brought the answer to research question 5a which states: “Are the foundations of the Kraljic approach to be found in Resource Dependence Theory?” We have analyzed the dimensions of the Kraljic matrix, connecting them with the resource dependence theory where a theoretical framework was found for the choice of the dimensions (Pfeffer and Salancik, 1978). In addition, we have argued that the categories in the Kraljic matrix correspond to four basic power-and-dependence positions: - strategic: balanced power, interdependent - non-critical: balanced power, independent - leverage: buyer dominated - bottleneck: supplier dominated. Finally, we have reviewed Kraljic’s strategic recommendations from a power-dependence perspective. An overview was provided of the main objectives to be pursued by the strategic recommendations and their impact on the power-dependence relationships with suppliers. The findings suggest that the element of ‘managing dependence’ is definitely to be found in Kraljic’s recommendations. Dubois and Pedersen (2002) have acknowledged that Kraljic’s portfolio approach is based on power-dependence balancing issues, as concluded earlier by Gelderman and Van Weele (2000). In conclusion, we have made a reasonable case that the resource dependence theory should indeed be considered as the (implicitly applied) theoretical foundation for the Kraljic portfolio approach.

142
In addition, we have concluded that a comprehensive view of the dyadic nature of buyer-supplier relationships should include the assessment of: (1) the difference between buyer’s and supplier’s dependence (net dependence) which corresponds with the relative power between parties; (2) the sum of buyer’s and supplier’s dependence (total interdependence) which indicates the mutual dependence and the intensity of the relationship between parties. These concepts can be applied to the Kraljic matrix, which leads to the following research question (5b): “What are the levels of power and (total) interdependence in the categories of the Kraljic matrix?” In other words, what will we find if we describe the categories in terms of their total interdependence (low, medium, high) and their net dependence (positive or negative)? Based on our analysis of the Kraljic matrix and the four categories, we will posit a number of prior expectations. If BD = buyer’s dependence, and SD = supplier’s dependence then we are expecting - supplier dominance and a moderate level of interdependence in the bottleneck quadrant: BD > SD (BD + SD) is medium - a power balance and a low level of interdependence in the non-critical quadrant: BD = SD (BD + SD) is low - buyer dominance and a moderate level of interdependence in the leverage quadrant: BD < SD (BD + SD) is medium - a power balance and a high level of interdependence in the strategic quadrant: BD = SD (BD + SD) is high We will compare these theoretical propositions with the survey data. The results of this analysis will contribute to our understanding of power and dependence in buyer/supplier relationships in general and in the Kraljic matrix in particular.

A Portfolio Approach to the Development of Differentiated Purchasing Strategies
143
The further study of power and dependence in this chapter has lead us to an explorative study of the determinants of organizational dependence. The results provide the basis for research question 5c: “What are the determinants of buyers’ dependence in the categories of the Kraljic matrix? Idem for supplier’s dependence.” Literature suggested that organizational dependence is a function of the importance of the exchanged resources and the substitutability of the source. Analysis of various conceptual and empirical studies to the determinants of dependence has resulted in a tentative model where dependence is explained by four variables: - financial magnitude, - resource criticality, - availability of alternative sources and - switching cost. In the case studies this conceptualization will be propounded to purchasing practitioners, which allows for adaptation of the model and for the formulation of hypotheses. The assumed impact of the variables on dependence will be statistically tested by means of the survey data. The results of this analysis should be of significant relevance to purchasing practitioners: only if one is clear about the determinants of and their impact on a certain dependence position in a Kraljic category, will it be possible to reflect on purchasing and supplier strategies aimed at changing that position


145
5 The cases studies
In contrast with a growing use and adoption, there is a lack of insight-providing empirical research. Publications do not reveal how purchasing professionals handle dimensions and measurement issues, which strategic recommendations are considered, adapted or neglected, which circumstances are of particular interest for the development and selection of differentiated strategies. They do not reveal what the specific purposes, goals and results are of the use of any purchasing portfolio model. The case studies address this gap. Additionally, reactions are gathered on the conceptual mutual-dependence model that was introduced in the former chapter.
5.1 Methodology
In general, little is known about the actual use of portfolio models in purchasing management. The main objective of the case studies is to identify and to describe advanced current practices with respect to purchasing portfolio models. The case studies are aimed at answering the third major research question: “How are portfolio models employed by experienced purchasing professionals?” In chapter 4 we have elaborated this question into a set of articulated research questions, to be answered in the case studies: 3a) Considering the unclear guidelines and the unanswered questions with respect to the measurement of (composite) dimensions and the weighting of factors in the use of a purchasing portfolio approach, how are these issues handled to the satisfaction of experienced purchasing professionals?
3b) What kind of specific strategies of purchasing and supply are based on Kraljic’s portfolio matrix?
3c) What kind of movements are considered in the Kraljic matrix, in terms of current positions, future positions (goals) and means (strategies)?
These research questions address issues with respect to the measurement of dimensions and with respect to the strategic recommendations (purchasing strategies).

146
The case study method was chosen for a number of reasons (Yin, 1994; Miles and Huberman, 1994). First, there is limited research on the actual use and possibilities of a portfolio approach in purchasing and supply management. Publications are conceptual or anecdotical by nature. Since we wanted to identify and describe advanced practices, the case study method was a logical choice. In general, the case study method is advised when the phenomenon of interest is not well understood. Remenyi et al. (1998) pointed at a more focused view, i.e. that most case studies in business and management try to illuminate a decision, or a set of decisions: why they were taken, how they were implemented, and with what result. Second, case study research is preferable when the research focuses mainly on ‘how’ and ‘why’ questions. We wanted to gain insights in the use and the possibilities of a portfolio approach, exploring and identifying the advanced practices of an experienced company. The questions in our research deal with exploratory issues, rather than frequency or incidence. Third, a case study research has a distinct advantage when these questions are being asked about a contemporary set of events over which the investigator has little or no control. Three in-depth case studies were conducted, involving three industrial firms in the Netherlands. The case companies were selected and asked to participate in the research, based on their experience with the use of a purchasing portfolio approach. For our research we only included firms who have had more than four years of experience in purchasing portfolio analysis and who are at present making intensive and significant use of the portfolio approach. This selective, non-random sample is in line with the exploratory nature of the research questions at hand. Purposive sampling enables the researcher to use judgement to select cases that are most suited for answering the research questions (Saunders et al., 2000). This form of sample is often used when working with small samples and when one wishes to select cases that are particularly informative (Neuman, 1997). Obviously, the composition of the sample is not made with the intention to be statistically representative of a population. The cases were studied sequentially, one after another. Because we wanted to explore different possibilities of the portfolio approaches, different units of analysis were included. There are important differences in the companies with respect to the level of analysis. The first case study dealt with the use of a portfolio approach on the corporate level of the company. The portfolio approach then is aimed at gaining synergy and leverage across business units. The second case study is positioned at the level of a large multinational business unit with many plants all over the world. The third case study focuses on a business unit of a fairly small industrial company. The variety in levels should reveal different kinds of practices, according to specific circumstances and objectives. We are aware of the limitations of this approach and it is not intended to give an exhaustive treatment of portfolio methods in purchasing and supply management. Although case studies may deal with rather unique situations, their

A Portfolio Approach to the Development of Differentiated Purchasing Strategies
147
results and conclusions can be compared. Comparison of cases may lead to the formulation of theoretical conjectures (Remenyi, 1998). We will conclude this chapter with a comparative analysis of the three case studies. Ultimately, the comparative analysis has resulted in: - a modification of our conceptual model of buyer’s and supplier’s dependence (determinants), - a description and overview of solutions to the measurement issues, and - the development of a conceptual model of strategic directions in the matrix (strategic issues). Respondents were interviewed on the basis of a semi-structured questionnaire, allowing for elucidation, elaboration and clarification. The use of a semi-structured interview is in line with the nature of the exploratory research objectives. The interview guide can be found in Appendix A. Data were collected primarily through interviews and secondary resources, such as Internet web sites, annual reports, internal reports, and purchasing plans. Altogether 26 interviews were conducted with 15 informants. The case studies entailed the use of a key-informant method, interviewing a limited selected number of participants. The informants were chosen not on a random basis, but because they were considered to have specialized knowledge of and experience with the use of purchasing portfolio models (judgement sample). This approach is appropriate for exploratory studies. In all case studies the first key-informants were high-placed purchasing officers. In the DSM case study, the director purchasing services was used as the first key-informant, in the Akzo Nobel Coatings case study it was the purchasing vice president of a business unit, and in the TE STRAKE case study we started with the strategic buyer of the company. This approach can be justified by the fact that we needed a clear overview of the entire purchasing operation and that we needed an entry to other respondents within the companies. The other informants were chosen through a snowballing technique whereby the first informant nominated other key-informants. These informants were all chosen for their specialized knowledge of and experience with the use of portfolio models in real-life purchasing, notably business unit managers, purchasing managers and senior buyers (see appendix B, Sources of the case studies). We wanted to include and account for possible differences in experience and views, related to different perspectives and positions within the companies. In-depth semi-structured interviews were conducted by means of face-to-face contact. Several rounds of interviews were conducted with the respondents and as we reported back the tentative analysis and conclusions from earlier rounds, we provided them with the opportunity:

148
- to check and recheck interim reports, - to improve the match with the intended information, and - to explore issues in more detail. The quality of the methodology for an exploratory case study should be judged on the basis of construct validity, reliability and external validity (Yin, 1994). The construct validity refers to the measures for the concepts being studied. To avoid the problems related to the subjectivity of data, multiple sources of evidence were being used (triangulation purposes). Additional and contextual information was found in written documentary material, such as operational manuals, purchasing plans and websites. Different types of informants were interviewed from a central purchasing perspective and from a decentral purchasing perspective. The interviews were conducted by two researchers to enhance interpretation and understanding of the gathered information. The reliability refers to the possibility of repeating the study with the same results. To enhance the reliability of the case study, the reader is referred to the interview guide in Appendix A. The external validity refers to the domain to which a study’s findings can be generalized. Obviously, this case study does not allow for any statistical generalization. The case study aims to generate a particular set of results to some broader theory (theoretical generalization). This theory concerns the relationship between conditions, goals and purchasing strategies within the context of a portfolio approach. An analytical generalization, however should be based on replications of the findings (cf Yin, 1994).
5.2 DSM
DSM is an integrated international group of companies that is active worldwide in the field of chemicals, biotechnical products and plastics. In addition, DSM is engaged in the exploration and the extraction of oil and natural gas. The group has annual sales of approximately NLG 14 billion, is divided into 16 business groups that are subsequently subdivided into business units, and employs about 23,000 people (half of them based in the Netherlands) at more than 200 sites worldwide. DSM has a large number of companies in Europe, the Americas, Asia and Australia. DSM’s head office is in Heerlen, the Netherlands. DSM’s activities are organized in business groups corresponding to the product/market combinations. The company’s principal products are intermediates and ingredients for the pharmaceutical and food industries, performance materials (like engineering plastics, resins and synthetic rubbers) for the automotive and electronic industries and polymers as well as industrial chemicals for a wide range of manufacturing industries. DSM is the global market leader for several products, including anti-infectives, caprolactam, melamine and EPDM rubber. The company’s strategic focus is on those businesses in which it already has leading positions internationally or has the capability to secure such positions. Its top priority

A Portfolio Approach to the Development of Differentiated Purchasing Strategies
149
growth area is the supply of the life science industries. DSM is ‘a sizeable customer’ with a EUR 4.95 billion purchase spend which corresponds with 70% of total turnover. The main purchasing categories are: - chemicals and raw materials (EUR 2.41 billion), - facility good and services (EUR 0.36 billion), - information and communication technology (EUR 0.23 billion), - physical distribution (EUR 0.82 billion), and - technical goods and services (EUR 1.13 billion).
5.2.1 Organization of purchasing
DSM is a diversified company with a strong decentralized structure. To a large extent, the ‘empowered’ business groups/units are autonomous, although they obviously have to give account to the Managing Board of Directors. Business groups and business units have their own, decentralized purchase departments and employ their purchasing professionals. However, some years ago it was felt that DSM as a company did not fully exploit the possibilities of coordinated sourcing (‘waste of diversity’). Centralized purchasing was not an option, because that would be in contradiction with the principles of empowered groups/units. The solution was found in a service unit: DMS Purchasing Services, which was set up in 1994. An important objective was the achievement of purchasing synergy and leverage, across business groups/units. Purchasing Services employs about 130 people, 100 of which are purchasers. DSM Purchasing Services operates as a business-owned cooperation with the task of generating optimum purchasing values for its owners, the business groups and the business units. This is accomplished in close concert and cooperation with the BG’s/BU’s. DSM Purchasing Services is supervised by the BG’s Policy Board, a cooperation of the 16 business groups. The BG’s Policy Board are able to enforce synergy. For instance, if there are differences of opinion with respect to the purchasing strategy of a raw material, the policy board can arrange settlements for the parties involved. There might be a conflict of interests with respect to the joint sourcing strategy of a raw material, for example. For business group A it might be a non-critical product, while the item is of strategic importance to business groups B and C. If the joint purchasing strategy is at the loss of group A, then this business group is compensated, through the agency of the policy board. The main objectives of DSM Purchasing Services are: - to function as a center of purchasing excellence, - to structure company-wide purchase coordination systems, - to carry out purchasing and related activities for the BG/BU’s and - to act as functional leader in the sourcing field (development of tools, competences and methodologies) on behalf of the BG/BU’s.

150
Decentralized purchasing departments work closely together with DSM Purchasing Services. There is an on-line system available for the purpose of purchasing planning that provides a DSM-case bank of ‘best practices’ for similar situations. Purchasing Services attaches great importance to building and sharing of purchasing know-how, experience and expertise. Obviously there is an area of tension between DSM Purchasing Services and the Business groups/units. The purchase marketing plans are prepared by DSM Purchasing Services. However, all plans have to be approved by the business groups/units involved. DSM Purchasing Services has no kind of formal power. Purchasing Services is not a central purchasing department. The cooperation with the Business units/groups is on a voluntary basis. Plans and proposals of Purchasing Services can always be overruled by business group/unit managers in case of disagreement. The department has to rely on expert and convincing power. Purchasing has changed over time from a production oriented scope to a process and market oriented scope. Since 1996 DSM Purchasing Services has actively promoted the professional development of the purchasing function. An important tool is ‘management development’. High potential sales and marketing specialists were selected for purchasing positions. In 2000 Purchasing Services had about 100 professional employees (management developers, academics and BG Hirees). The role of purchasing has developed from a traditionally supporting role to production planning into an important business function interrelated and contributory to other key business processes. In terms of the maturity of the purchase function, DSM Purchasing Services claims a strong organizational development from a relatively ‘laggard’ role in the early nineties to that of an ‘innovator’ in the new millennium. A top priority for Purchasing Services is the large scale implementation of e-procurement as a strategic response to the new purchasing opportunities of the Internet. The “Concern Strategy Dialogue” of 1998 has identified manufacturing, selling and sourcing as the three primary processes. This indicates that purchasing and supply management are considered to be very important for DSM. As a general rule, it is compulsory that every business plan has to deal with purchasing and supply management. The quarterly purchasing reports on behalf of the Board of Directors are another illustration of the agreed importance of purchasing.
5.2.2 Purchasing and supply strategies
DSM Purchasing Services promotes a company-wide purchasing practice, aimed more at longer-term ‘value’ than at short-term oriented ‘savings’. Optimal purchasing value is harvested in a sequential fashion leading through the areas of leverage, system and design. A basic principle in DSM’s purchasing practice holds that price is always important. Not all purchases are eligible for value optimization. In such cases a strategy of maximum
A Portfolio Approach to the Development of Differentiated Purchasing Strategies
151
leverage and pricing pressure is preferred. However, the greater part of DSM’s purchases is believed to be eligible for the value option. In this option optimal leverage is exerted to the supply base and a selection of suppliers takes place. As pricing pressure is exerted, these suppliers will look for other opportunities to compete beyond the mere price i.e. by efforts to enter the value chain of DSM, moving from price competition to value added competition. The idea is to provoke a change of perspective for suppliers by means of pricing pressure as a necessary point of departure. Selection criteria are suppliers’ capabilities to transgress from the traditional suppliers role to that of partners in system- and design cooperation. Obviously there is and there should be a strong connection between the purchasing strategy and the business strategy. For a good understanding of DMS’s purchasing practice a reference should be made to the main product/market combinations. The company’s principal products are intermediates and ingredients for the pharmaceutical and food industries, performance materials for the automotive and electronic industries and polymers as well as industrial chemicals for a wide range of manufacturing industries. DSM operates in a number of global markets where price and cost are always key success factors. A very basic principle in DSM’s purchasing practice holds that price performance is always important, also in strategic buyer/supplier relationships. In the yearly Concern Strategy Dialogue decisions are made on the agreed strategic options for the various business groups. For the chosen business strategies accompanying decisions are made on, what are considered, the key success factors for each business group/unit. Any purchase marketing plan is aimed at a fit between the supply market conditions and these key success factors. Availability is critical for a large number of materials and commodities. In addition, DSM faces strong price fluctuations for these products in world supply markets. To make things more complicated, increases in prices do not necessarily correspond to the prices DSM is able to charge for end products. These are important factors, affecting profitability and continuity. In essence, for these materials and commodities, DMS’s purchasing focuses on the matching of purchase prices and selling prices, resulting in a reasonable profit margin. To a manufacturer in the process industry, disruptions in production are disastrous. Safety and environment are important too. Other key factors are the assurance of supply and the buffing of price fluctuations. Every purchase marketing plan aims at identifying and exploiting the link between supply markets and business group-specific key success factors. These plans are all developed on the basis of the purchasing portfolio approach. Connecting purchasing strategy to business strategy implies an understanding of: - the supply industry - the strategic intent of suppliers - DMS’s position versus the supply industry.

152
The development of any purchasing (marketing) plan requires supply industry analysis, supplier cost (price) analysis, internal analysis, product classification (Kraljic), assessment, objectives and strategies, and a purchase action plan. The Porter framework is used to describe and analyze the way an industry behaves. The supply industry analysis is performed from a purchasing perspective. For the classification of products DSM uses a Kraljic purchasing approach. Next, the performance and attractiveness of (potential) suppliers are assessed. How do they meet DSM’s needs? An important question is: what is the position of DSM as a customer? How attractive is DSM (as a customer) within a particular segment? Answers are given from the point of view of the marketing manager of one of the suppliers. This approach is labeled as ‘mirror image thinking’. In accordance with Kraljic’s approach (second matrix) the supplier strength and the DSM strength are weighted to assess the balance of (bargaining) power. On the basis of a thorough assessment it is decided whether a supplier is qualified for a partnership. Such assessment implies the identification of: - the performance criteria (qualifiers), - the ranking of potential suppliers on these criteria, and - the suppliers with discriminating scores on important criteria (differentiators). A sample list of performance criteria is: cost (and price) competitiveness, technical support and developments, security of supply, commitment, capability to produce, safety, and information exchange. Purchasing strategy and purchasing objectives have to refer to the identified key buying-factors, for example, security of supply, low system cost, and access to technological developments. A real strategic partnership should always involve design optimization. Technology based partnerships are very valuable to DSM. However, DSM Purchasing Services is critical of so-called ‘strategic partnerships’: “Successful partnerships are rare”. Partnerships involve much time, commitment and investments. In some cases there are locked-in situations where DSM is forced into a ‘partnership’. These ‘partnerships’ do not involve much mutual commitment. The capabilities and performance of the supplier do not match those that are expected by DSM. Obviously, there is much incentive to change these unfavorable conditions. Finally, based on objectives, strategic options and choices are identified and evaluated. The procedures and basic steps for developing purchasing strategies and purchasing (action) plans, are described in the internal Guide to Purchasing Marketing Planning. From 1996 through 1999 approximately 50 purchase marketing plans were developed, 35 of which exceeded the boundaries of individual business units. Half of the plans were made for the category ‘chemicals and raw materials’ which corresponds with the share of this product category in the total purchase spend. The portfolio approach is believed to be applicable to all product categories that present a substantial value potential (earning potential).

A Portfolio Approach to the Development of Differentiated Purchasing Strategies
153
5.2.3 Purchasing portfolio analysis: dimensions, measurement and use
For the purchasing portfolio analysis a Kraljic-like approach is being used with comparable dimensions for the classification of products: 1. the strategic importance of purchase 2. the supply risk. The importance of a purchase is assessed in terms of: - value added by product line, - the percentage of purchased products as part of total cost and - the impact on the company’s profitability. The ‘importance’-dimension is therefore quite similar to Kraljic’s original ‘profit impact’. Supply risk is measured by supply scarcity factors, such as - state of the art technology, - complexity of the supply market, - materials substitution, - barriers to entry, - logistics, - monopoly/oligopoly conditions. The supply risk-dimension is adapted to the specific circumstances of DSM, dealing with technical, complex products and supply markets. Examples of the different product items purchased by DSM are: - bottleneck items: peroxides, catalysts, additives, enzymes and chartering; - non-critical items: process aids, voice and data, containers and office supplies; - leverage items: IT, travel, temporary labor and polypropylene; - strategic items: complex IT projects, glass fiber, gas/naphtha and aromatics. The purchasing portfolio analysis is viewed as an important tool for developing purchasing strategies. Purchasing planning is a continuous activity, taking results and changing circumstances into account. Immediate causes for portfolio analysis are to be found in acute changing market conditions, particularly in changing conditions in marketing and sales (market driven). Purchasing portfolio analysis is not considered as the absolute truth in purchasing strategy. It is a tool that aims at starting and guiding strategic discussions with business group management. There are no calculating rules to decide whether the importance of a purchase is ‘high’ or ‘low’. The same holds true for the complexity of supply markets. The philosophy of DSM Purchasing Services is that the Kraljic matrix should serve as a framework for an in-depth discussion with representatives from the business units involved. Preferably cross functional teams should decide and substantiate their points of view with respect to the position of purchases in the matrix. The drawback of this method is that the validation of measures is not possible. However, there is no belief in a quantitative approach for measuring values of the dimensions: “It is better to be roughly
154
right, than exactly wrong.” This does not imply that the use of the matrix is a complete subjective matter. Points of view have to be substantiated by facts and figures with respect to underlying factors and variables. Actual purchasing practices and strategies are compared with the strategic recommendations: strategic items require partnerships, leverage items are interchangeable, non-critical items require efficient buying and, in case of bottleneck, security of supply is recommended. Differences between actual and recommended practices are discussed. Views and plans are ‘challenged’, which functions as an internal warranty of quality. The main purpose of the portfolio analysis is that it forces management into a critical evaluation of supply markets, suppliers, purchase practices, and the relationship between purchasing and business strategy. Long-term savings are expected from the use of a portfolio approach, albeit that the ‘real’ savings should be attributed to development and the implementation of purchasing and supply strategies. In the last four years an estimated sum of EUR 113.45 million has been accounted to a more integrated purchasing approach. The portfolio analysis is an important tool, especially for discussing, visualizing and illustrating the possibilities of professional purchasing and supply management. In the course of time, the purchasing portfolio approach has contributed to the awareness of purchasing possibilities and the professionalizing of purchasing within the business units/groups.
5.2.4 Portfolio-based strategies
For the choice of (differentiated) purchasing strategies a combination is developed between the Kraljic portfolio analysis and a sequential approach, identifying possibilities from price leverage to system optimization and ultimately, design optimization. In some cases price and efficiency are the only possibilities for purchasing leverage. In other, more preferable cases more interesting forms of leverage are possible. The next level implies system optimization, entering suppliers in DSM’s supply chain. Suppliers become supply chain partners when they co-ordinate their work with DSM’s production requirements. These supply chain partners are labeled as ‘partners of convenience’ to distinguish them from ‘real’ strategic partners who actually contribute to DSM’s design optimization. This constitutes the final level of the sequential approach. The combination of the Kraljic portfolio analysis and this sequential approach is very important in understanding DSM’s strategic purchasing practice and the movements in the Kraljic matrix. The general strategic recommendations, as provided by Kraljic, are elaborated in view of the specific circumstances and conditions at hand. A main principle of DSM is that the non-critical and the bottleneck cells should be as empty as possible. Obviously leverage and strategic items are preferred to non-critical and bottleneck items. DSM is always looking for possibilities to move to other, better positions in the matrix. However, moving
A Portfolio Approach to the Development of Differentiated Purchasing Strategies
155
to a more preferable position in the matrix is not always within the bounds of possibility. In those cases the cell position remains the same. The in-depth interviews identified the most common strategic switches from one category to another. The most common strategic changes were identified and in each case the four generic positions in the (first) Kraljic-matrix were used as points of departure. In a general sense, the pursued movements in the matrix usually show a clockwise pattern. From bottleneck to non-critical, from non-critical to leverage, from leverage to strategic. We have found conditions that lead to the choice of the different purchasing strategies and the new positions in the matrix.
(a) Conditions and strategies for bottleneck items
For the category ‘bottleneck items’ different purchasing strategies are pursued, corresponding to different conditions (see figure 5.1). In general terms, DMS aims at increasing buying power and/or developing new opportunities for bottleneck items, reducing the dependence on a supplier to an acceptable level. A very important issue concerns the question whether standardization of purchasing requirements is possible or not. If standardization is not possible, then in case of processed materials a capacity deal (1) is explored, concentrating purchases to an approved supplier. A better deal is made by concentrating regular supply to one supplier (‘outsourcing’), involving no core competence. Very often, it is a matter of ‘make-or-buy’ certain processed materials. A ‘better’ bottleneck-position is pursued by means of a capacity deal, reducing supply risk on the one hand and increasing profit impact on the other hand. Other possibilities in the bottleneck quadrant are: keeping stocks, Internet buying, widening of specifications, getting access to alternative sources, adapting technology, risk analysis in combination with contingency planning. The motto is: “stay in the corner and make the best of it”. More rigorous is the switch from ‘bottleneck’ to ‘leverage’. Especially MRO-items are eligible for such a drastic move. Business units/groups have to agree to standardization and pooling (2) of their purchasing requirements. Some purchased products are bottleneck items, due to a degree of over specification. In a technical environment there is a natural drive for over specification, because technical specialists tend to settle only for ‘the best’. Obviously this results in financial non attractive deals. A related problem is the incompatibility of equipment and MRO-items, due to the fact that business units/groups work with their own specifications. This prevents the use of buying leverage by standardization and pooling of requirements. In these cases DSM Purchasing Services sets up a team of experts to investigate possibilities of standardization, following the principle of ‘fit-for-use’. The idea is to make the end-product less complex: decomplex (3a). What specifications are really necessary to fit the needs of the business units/groups involved? “Delete the waste of diversity” serves as the

156
leading device. The team chooses the best fitting standards, making the specifications more generic. This allows for pooling (3b) of requirements across units/groups. There are more purchasing and supply possibilities in case of a ‘decomplexed’ product and, obviously, by pooling purchases the buying power is considerably increased. In special cases, DSM considers joint buying with other companies, for instance in a consortium structure. To conclude, in a two-step process, buying leverage is established, provoking a switch from ‘bottleneck’ to ‘leverage’ in the portfolio matrix. Leenders and Fearon (1993) came to the same conclusion, when they describe ‘standardization’ and ‘simplification’ as two of the most effective procurement concepts for improving value.
leverage (2)
strategic
(3b) (3a) non-critical
(1) bottleneck
current position
condition 1 standardization?
condition 2: overspecification?
main products purchasing strategy
new position (goals)
bottleneck not possible no processed materials
capacity deal (1)
'better bottleneck'
bottleneck possible no MRO-items
pooling (2) leverage
bottleneck possible yes equipment, MRO-items
decomplex (3a) and pooling (3b)
non-critical, leverage
FIGURE 5.1 Conditions, purchasing strategies and goals for bottleneck items

A Portfolio Approach to the Development of Differentiated Purchasing Strategies
157
(b) Conditions and strategies for non-critical items
The main products in the non-critical category are office supplies and services. The question with these non-production orientated purchases is whether standardization and pooling are valid options or not. The product category ‘travelling’ is an example for which pooling (1) is a logical option. A framework agreement (master contract) with a preferred supplier is a contractual possibility. These arrangements are nowadays replaced by some form of e-procurement. Almost the entire purchasing procedure can be completed by some sort of catalogue buying. E-procurement is obviously the most modern and efficient version of catalogue buying. E-procurement is only feasible when it is possible to standardize and pool the purchasing requirements, preferably those of several (if not all) business groups/units. However, sometimes pooling is not an option, because the product is in some respect unique or business units/groups make a reasonable case for not pooling their purchases. In that case, the product category remains ‘non-critical’. Non-critical products are purchased on a transactional basis (market exchange, non-relational elements). The purchase card (2) is a useful tool for individual non-important orders. In a technical environment there is a natural tendency for wanting ‘the best there is’. Engineers usually prefer a technical tour de force, neglecting advantages of pooling and standardization. In terms of the Kraljic matrix, from time to time there are unwanted counter movements from ‘non-critical’ to ‘bottleneck’ positions. Over-specification condemns a business unit/group to a specific supplier, accompanied by high cost and a high level of dependence. Caused by the organizational structure and the position of DSM Purchasing Services these counter-movements are not always avoidable. Business units and business groups have the last word, although an appeal is possible to the BG’s Policy Board. A refusal to cooperate can be overruled, when the company interest exceeds the interest of an individual business group.

158
leverage (1)
strategic
(2) non-critical
bottleneck
current position
condition 1 standardization and pooling ?
main products purchasing strategy new position (goals)
Non-critical possible office supplies, services
pooling (1) leverage
Non-critical not possible office supplies, services
purchasing card (2) ‘better’ non-critical
FIGURE 5.2 Conditions, purchasing strategies and goals for non-critical items
(c) Conditions and strategies for leverage items
DSM clearly distinguishes ‘strategic partnerships’ and ‘partnerships of convenience’ (see figure 5.3). The assessment of the supplier should indicate what kind of partnership is possible and desirable. The assessment implies the identification of the key buying criteria and the performance of the supplier on these criteria. A switch from the leverage to the strategic position in the matrix might be sensible when the supplier has the proper capabilities for co-design, in view of the qualifying and differentiating factors (performance criteria). The move from ‘leverage’ to ‘strategic’ is only feasible in case of a limited number of suppliers with the required capabilities and intentions. The switch from the leverage to the strategic category might imply supplier development. There should be a reasonable amount of trust in the dependability of the supplier and in the
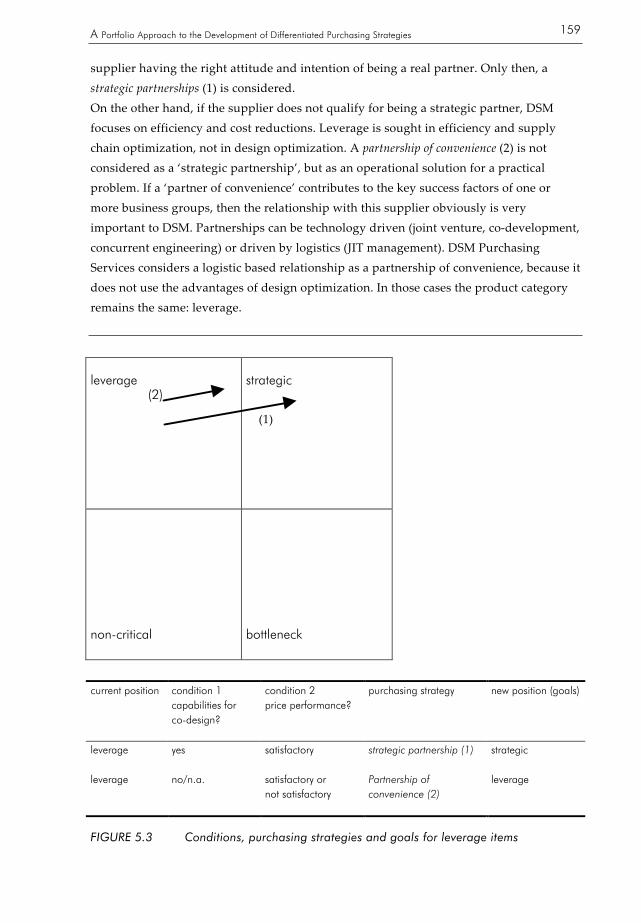
A Portfolio Approach to the Development of Differentiated Purchasing Strategies
159
supplier having the right attitude and intention of being a real partner. Only then, a strategic partnerships (1) is considered. On the other hand, if the supplier does not qualify for being a strategic partner, DSM focuses on efficiency and cost reductions. Leverage is sought in efficiency and supply chain optimization, not in design optimization. A partnership of convenience (2) is not considered as a ‘strategic partnership’, but as an operational solution for a practical problem. If a ‘partner of convenience’ contributes to the key success factors of one or more business groups, then the relationship with this supplier obviously is very important to DSM. Partnerships can be technology driven (joint venture, co-development, concurrent engineering) or driven by logistics (JIT management). DSM Purchasing Services considers a logistic based relationship as a partnership of convenience, because it does not use the advantages of design optimization. In those cases the product category remains the same: leverage.
leverage (2)
strategic (1)
non-critical
bottleneck
current position
condition 1 capabilities for co-design?
condition 2 price performance?
purchasing strategy new position (goals)
leverage yes satisfactory
strategic partnership (1) strategic
leverage no/n.a. satisfactory or not satisfactory
Partnership of convenience (2)
leverage
FIGURE 5.3 Conditions, purchasing strategies and goals for leverage items

160
(d) Conditions and strategies for strategic items
Successful strategic partnerships are rare. In the course of time partnerships may become unsatisfactory. A position in the ‘strategic’ category means a high mutual dependence. In some cases the firm is locked in a partnership, from sheer necessity. For instance, because of an oligopolistic or monopolistic market situation. The development of new suppliers would solve this locked-in situation. Another non-desirable possibility is that the supplier does not really want to be involved in co-development. As a result, design optimization is not achieved. There is always a chance that a partnership evolves into an indolent, relaxed relationship. Strategic partners should be world-class suppliers, alert and high performing, not only in a technical but also in an economical sense. This means that strategic partners should meet external benchmarks with a more than satisfactory price performance. In case of these not-optimal ‘partnerships’ with underachievement with respect to the performance in co-design, a strategy of decomplex and supplier development (1) is pursued. By making the product less complex, alternative solutions get within reach. If necessary, new suppliers are developed. Essentially, DSM uses the natural drive to make itself less dependent on the non-dependable supplier.
leverage (1)
strategic (2)
non-critical
bottleneck

A Portfolio Approach to the Development of Differentiated Purchasing Strategies
161
current position
condition 1 price performance?
Condition 2 performance in co-design?
purchasing strategy new position (goals)
strategic not satisfactory not satisfactory
decomplex and supplier development (1)
leverage
strategic satisfactory satisfactory
strategic partnership (2) strategic
FIGURE 5.4 Conditions, purchasing strategies and goals for strategic items
Sometimes a DSM business group/unit does not behave like a ‘partner’. Based on the importance of the purchase for the supplier, an actual strategy of ‘leverage’ and the use of bargaining power is actually followed. This mismatch, detected by the portfolio analysis, causes unnecessary problems in buyer-supplier relationships.
5.2.5 Conclusions
DSM is an divisionalized industrial company that is experienced with the use of the Kraljic portfolio approach. The main objective of the DSM-case study was to identify and describe an advanced practice in the use of a purchasing portfolio approach. The case study was conducted at the corporate level, in other words, across the business units. The study has provided some new perspectives on the Kraljic portfolio approach, dealing with two major problem areas: (1) measurement issues, and (2) the nature of the strategic recommendations. Kraljic’s approach does not provide measurement rules for the assessment of positions in the matrix. The users have to decide on important measurement issues. Some feel that all classifications are highly subjective and therefore arbitrary by nature. At DSM however, this drawback is considered as an attractive benefit. Managers are ‘forced’ to participate in an open, strategic thinking process, where the portfolio model provides a useful framework for communication and discussion. The Kraljic approach allows for the needed customization to this matter. The in-depth interviews also provided answers to research questions with respect to the portfolio-based purchasing strategies, their content, goals and conditions. Based on the results of the case study, we have identified and described: - the main portfolio-based movements within the matrix (goals and strategies); - the specific conditions for these different purchasing goals and strategies. These findings may serve as an illustration of the possibilities of an advanced use of Kraljic’s portfolio model (Gelderman and Van Weele, 2002b). Kraljic’s strategic recommendations are elaborated to more practical normative guidelines, based on prevailing circumstances (conditions) and related goals. It is concluded that the Kraljic
162
approach provides a practical framework, allowing for sufficient customizing and elaborating purchasing strategies. Kraljic’s purchasing portfolio approach seems to be very useful for (industrial) companies that are divided into a large number of business units. It facilitates the development and implementation of specific portfolio-based purchasing strategies aimed at leverage and synergy across business groups/units. For DSM, the Kraljic portfolio approach has proved to be a powerful tool for: - discussing, visualizing and illustrating the possibilities of the development of differentiated purchasing strategies, and - coordinating the purchasing strategies of the various business groups/units.
5.3 Akzo Nobel Coatings
Akzo Nobel is made up of three business areas: Pharma, Chemicals and Coatings. This case-study focuses on Decorative Coatings, an important business unit of the business area Akzo Nobel Coatings. In more than 30 countries comparable portfolio analyses are performed for the different sub-business units (area business units). These national organizations understand their own local markets almost anywhere in the world, which guarantees expert service close at hand. Akzo Nobel Coatings is among the world leaders in the development of advanced new coatings. Production is provided by 130 plants, all over the world. Akzo Nobel Coatings has a registered sales of EUR 5.6 billion, Decorative Coatings accounts for EUR 1.8 billion in 1999, which corresponds to a 32% share of total sales in Coatings. The most important product category is raw materials, the vital ingredients of coatings. The main ingredients are binders, pigments, extenders, additives and solvents. In financial terms, spendings on raw materials constitute a substantial share of total sales. Other categories are more or less non-recurring investments and all kinds of services and supplies. The central purchasing department is responsible for the procurement of non-production related products. This case study is restricted to the procurement of raw materials for Decorative Coatings, because this business unit is experienced in the use of a purchasing portfolio approach.
5.3.1 Organization of purchasing
Akzo Nobel is a very decentralized company that operates on a world wide scale. For the procurement of raw materials, Akzo Nobel Coatings faces the challenge of finding balance between global contracting and local opportunities. For certain components the world market is very concentrated: 5 or 6 suppliers sell and produce 80% of the total world volume. For the buying of raw materials three buying systems are being used: - lead buying (20%), - main buying (60%), and - local buying (20%).

A Portfolio Approach to the Development of Differentiated Purchasing Strategies
163
Certain raw materials are needed in different plants, all over the world, and can be delivered by local suppliers. For all business units within Coatings, a lead buying system is being utilized, in pursuit of savings and synergy. A lead buyer has the responsibility to develop and implement the overall purchasing strategy for a certain raw material. The lead buyer draws up the central contract, negotiates prices and has control over volumes that are bought from different local suppliers. Users in sub-business units can be asked to switch to another supplier. The lead buyer needs to prove that the best purchasing strategy is chosen. The main buying systems operates on the business unit level. A main buyer is responsible for the procurement of a product (group), within a business unit. A business unit can appoint its own main buyer who cooperates with the main buyer(s) of other business unit(s). The system of lead buyers and main buyers demands the support of a computer system that records all purchasing requirements of all business units. For other product categories the purchasing responsibility is assumed by local plant units. Local buyers deal with local suppliers. The computer system also supports local buyers, by giving access to purchasing information with respect to all commodities bought within Coatings.
5.3.2 Purchasing and supply strategies
An important starting point for the purchasing and supply strategy with respect to raw materials, is that suppliers should guarantee low cost. Akzo Nobel Coatings does not demand the lowest prices, but prices that are lower than the ones that are paid by their competitors. Akzo Nobel Coatings operates from a ‘lower’ and ‘later’- principle: - Akzo Nobel Coatings wants prices that are lower than the prices paid by competitors, and - in case of price-increase Akzo Nobel Coatings wants to endure that rise at a later point in time. Another point of interest is the dependence on suppliers (buyer’s dependence). The business unit is feeling hesitant about being dependent on suppliers. ‘Dependence costs money’, is the general conviction. Strategic partnerships are rarely an option. As a buyer of ingredients, it is felt that they are by definition too small to be engaged in strategic partnerships. The business is in this respect not comparable to the automotive where strategic alliances with suppliers are more common. Purchasing strategies are based on the results and the conclusions of the portfolio analysis. For the development of purchasing strategies it is very important to include marketing positions and business strategies of Akzo Nobel Coatings as a supplier of goods. It is very important to create a logical fit between purchasing strategies and marketing strategies. As a supplier, Akzo Nobel Coatings faces basically two possible market situations, either a niche market or a commodity market.

164
In a commodity market, Akzo Nobel Coatings has to deal with low margins and large quantities in aggressive, competitive markets. Specifications are general, resulting in flexibility in switching from one supplier to another. Contracts are on a short term basis, price negotiations are tough, and the logistic demands on the suppliers are high. The same holds for Akzo Nobel Coatings as a manufacturer and seller of products. In a niche market, Akzo Nobel Coatings operates with relatively high margins. The delivery times and high quality are important selling points. As a result, these are important criteria for suppliers too. High product quality in end markets require high quality ingredients. In return, high margins in end markets allow for expensive raw materials. Akzo Nobel Coatings is engaged in close relationships with (preferred) suppliers. Switching cost are relatively high. Purchasing’s job is to maintain the required quality. In collaboration with suppliers, considerable savings can be gained. The R&D department will be involved in product improvement and will be guarding the distinguishing position in comparison with competing manufacturers. If two products are located in the same quadrant of the purchasing portfolio matrix, it is not concluded beforehand that the same purchasing strategy is advised. It all depends on the situation in the corresponding end markets: is it a niche market or a commodity market? The selection of suppliers should be based on portfolio analysis. Crucial is the question: “What is the added value of this supplier to our company?” The criteria for the most important suppliers are set. These preferred suppliers should perform in the areas of product quality, reliability of delivery, price, technical capabilities, and general management. In return, Akzo Nobel Coatings enters commission agreements, based on quantity rebates. Preferred suppliers should have production facilities in several countries, near Akzo’s plants. Only the suppliers that meet all criteria are preferred suppliers. It is very important to know what criteria to use (selection) and how to measure them (operationalization).
5.3.3 Purchasing portfolio analysis: dimensions, measurement and use
For every plant portfolio analyses are performed on a yearly basis. Targets can be connected to product groups within and across the quadrants of the portfolio matrix. For instance: - a certain product should be moved from the strategic quadrant to the leverage quadrant; - the number of items in the right quadrants (strategic and bottleneck) should be reduced by 5%; - the value of all leverage and non-critical purchases should be at a minimum of 65%. Akzo Nobel Coatings works with price indices for raw materials. Every year purchasing plans are developed, including specific goals for specific product categories. Targets and

A Portfolio Approach to the Development of Differentiated Purchasing Strategies
165
goals are formulated in terms of these indices. A very important benchmark concerns prices that are being paid by competitors, although it is very difficult to get a hold on that information. The matrices of the different area/country business units are not combined to one joint purchasing portfolio matrix. An ingredient of coating A might easily be replaced by another, while the same ingredient in coating B can not be replaced by any other ingredient. There is a diversity of significance of the same ingredient for different coatings. The portfolio matrix is completed on the level of individual plants. Given the fact that local situations are incomparable with respect to the chemical composition of coatings, portfolio matrices can not be joined. Coordinated sourcing is organized by the lead buying system and the main buying system. The portfolio analysis is considered as a very important tool for the development of purchasing strategies, differentiated to products and suppliers. The portfolio analysis is being used to indicate the importance of a raw material and its suppliers, and to order the purchasing value. This results in a clear picture of the own strengths and weaknesses in purchasing markets. The main purpose of the portfolio approach is to detect products or productgroups that cause problems and risks of dependence: bottleneck and strategic items. Considering the vast number of items that are being bought, it is imperative to use a portfolio-tool. Otherwise, it would be impossible to gain a clear insight into the problems and possibilities of the product portfolio. The results of the portfolio analysis points at the problems and products that need to be tackled, and to what priority. It focuses on the goals and directions of purchasing strategies, and the efforts of R&D-departments in their search for alternative solutions. In addition, the purchasing portfolio provides valuable insights in the balance of power. It is of critical importance to recognize and formulate questions with respect to negotiation possibilities. Which party dominates the relationship? Is there a problem, facing a dominant supplier? If so, what is the problem? Do we want to deal with one or more suppliers? What would be the advantage of being a dominant party? What goals would be in reach? Obviously, there is the question “what are the possibilities of purchasing for influencing the balance of power?” Akzo Nobel Coatings uses a customized version of the Kraljic portfolio approach. All raw materials are categorized into four cells, based on: - the number of suppliers, and - the value of purchases. To be precise, the number of suppliers is defined as “the number of suppliers that are actually used in the last year for the same item”. There is an important difference with

166
the size of the supply base, the potential number of suppliers, which is per definition larger than the number of actual suppliers. A scale is used that runs from ‘large’ to ‘small’. More specific, the demarcation line between ‘large’ and ‘small’ is drawn by assessing the dependence on the supplier at hand. In general, the number of one or two suppliers is considered to be ‘small’. Apart from that, a larger number of suppliers could create dependence too, in case of mutual agreement and collusion. The number of suppliers is seen as an operationalization of the original Kraljic-dimension ‘supply risk’. The value of purchases is measured in money, reflecting the price and the volume (use) of a raw material. The demarcation line between ‘high’ and ‘low’ is based on a 80-20 rule. This means that the upper half of the matrix contains all purchases that add up to 80% of the total purchase value, while the lower half of the matrix holds the remaining 20%. Any portfolio is to be used from the perspective of the individual users. The implication is that the demarcation line is drawn from the user’s perspective. The value of purchases is a relative concept, to be considered from the individual perspective of the local plant concerned. The reason is that the portfolio matrix is and should be relevant only to the users. This means for instance that the procurement of 5,000 tons for a small plant A might be positioned as a ‘high value of purchases’, while 30,000 tons of the same commodity for a larger plant B is to be seen as a ‘low value of purchases’. Otherwise, plant A would only have positions in the lower regions of the matrix. The completion of the matrix can not be carried out by the purchasing department. This should be done in close concert with the technical and chemical experts (R&D). In addition, users have information regarding annual use figures, whereas the financial management could provide information regarding the total value. It is critical that the portfolio analysis is understood, accepted and supported by all employees of the plant. Figure 5.5 shows an example of a portfolio matrix, as might be found in a local organization of Decorative Coatings. What can we learn and conclude from the information in the portfolio matrix? - Apparently, the strategic category contains 60% of the value of all purchases. This can be interpreted as a very high dependence on suppliers, which can only be justified in case of niche markets for the end products. In a niche markets, products are characterized by much added value, a high quality and price level, and a drive for new products. For commodity markets, there would be a misfit of the actual and expected segmentation in the portfolio matrix. In case of end products for commodity markets, the strategic quadrant would have to be much smaller. - In addition, the figure shows a large number of items with a relatively low value. This implies much administrative work for purchasers. A possible objective could be to lower the number of bottleneck and non-critical items.

A Portfolio Approach to the Development of Differentiated Purchasing Strategies
167
value of purchases high
leverage no. of items: 15 percentage: 20%
strategic no. of items: 25 percentage: 60%
no. of items: 40 percentage: 5% non-critical
no. of items: 240 percentage: 15% bottleneck
large small number of suppliers
FIGURE 5.5 Example of a raw materials-portfolio
5.3.4 Portfolio-based strategies
Based on the situations and conditions on the marketing and sales side, purchasing strategies are focussed on handling costs and strategic vulnerability (dependence on suppliers). Targets are determined for each product category in each quadrant, dealing with these issues. Purchasing strategies in general are aimed at adapting and improving conditions, not so much at changing positions in the portfolio matrix. However, sometimes movements are possible and desirable in the matrix. The main movement in the matrix is from strategic to leverage; other switches are rare. The point of action is the number of suppliers. Sometimes it is possible to enlarge the number of suppliers, in particular by means of an active strategy of supplier development. The value of purchases is usually not compliant to intervention, because of the fixed prescribed composition of coatings. In practice, there are practically no chosen movements from the left half to the right half of the matrix. In other words, purchasing strategies are generally not aimed at reducing the number of suppliers. For raw materials a general rule holds that it is always better to deal with two or three suppliers, then to deal with a single supplier. The reason is that any supplier reduction increases dependence which lead to a vulnerability for price raises. For reasons of flexibility, Akzo Nobel Coatings stresses the importance of maintaining good relationships with potential suppliers that are not currently contracted. They can provide useful information to be used in negotiation processes. Moreover, these suppliers may provide alternative arrangements in cases of emergency or problems with the current suppliers. Working with a limited number of suppliers is preferably
Low

168
combined with the possibility to fall back on alternative suppliers (flexibility). It is recognized that there is a huge difference between having a sole supplier of choice and a sole supplier of necessity (cf. Nicholson, 1993). There is an area of tension between purchasing and marketing departments. Product and marketing managers are always looking for possibilities to differentiate products, whereas purchasing managers are always looking for possibilities to simplify and standardize products. The demands of marketing and customers limit the number of possibilities for purchasing in their natural propensity for controlling and reducing cost.
(a) Bottleneck items
For bottleneck items there are concerns and questions with respect to the assurance of supply. After all, there is just one available supplier for a certain ingredient. The buying strategy is a forced single sourcing. Generally speaking, negotiating for lower and the lowest prices is not the main focus of purchasing. Because of the company’s vulnerability, suppliers of bottleneck items must have contingency plans and emergency stocks. In the contract there is a clause inserted that compels the supplier to report an intended termination of production. Otherwise, costly safety stocks would be inevitable. A search for alternatives only takes place in exceptional cases, because the costs of testing are several times higher than the expected results. This means that high levels of risk and dependency have to be accepted to a certain degree. A consignment system is a practical solution for some bottleneck items. The supplier is responsible for the continuous availability of certain raw materials that are stocked at the sites of Akzo Nobel Coatings. Payments are based on actual use, not based on deliveries, which means that financial risks are taken by the supplier, not by the buyer. It is the supplier’s responsibility to replenish the stock when and if necessary.
(b) Non-critical items
Non-critical items represent a low value of purchases. The added value is low and the supply risk is small, because of the large number of suppliers and/or alternative products. The strategy here is aimed at minimizing the cost of preparing and placing purchase orders. Possible options are standardization of procedures, combining of orders and invoices, and e-procurement. These measures reduce administrative costs and the time-consuming handling of orders to a minimum. On another decision level, possibilities of outsourcing are to be considered, meaning that parts of the purchasing process might be outsourced. A possibility would be the contracting of a large international distributor. Another option to consider is to ask a supplier of a leverage or a strategic product to supply a certain non-critical item as well. The same holds for bottleneck items.

A Portfolio Approach to the Development of Differentiated Purchasing Strategies
169
(c) Leverage items
Suppliers in the leverage quadrant manufacture ingredients for which alternative products exist, or for which alternative solutions can be found through a simple adaptation of the method of preparation. In many cases there is an added value to the products, for instance just-in-time delivery, consignment stocks, or the delivery in a special format or packaging. These special features should save production costs. Supplier selection is often based on the added value in these areas. Obviously, purchasing is an interesting ‘partner’ for suppliers. The purchasing department is alert, looking for suppliers that offer more added value and/or that charge lower prices. Purchasing is continuously monitoring the supplier performance and is taking action when a supplier deviates from the agreement. A leverage position however, does not mean that the buyer is the dominant party. The value of purchases is relatively high from the perspective of the buying company, not from the supplier’s perspective. Units are usually too small to dominate even leverage relationships. On an occasional basis, the relationship with a supplier can be transformed from leverage to strategic. This is only an option if a partnership is expected to add to the competitive advantages of the firm in end markets. A chosen strategy of increasing the dependence on a supplier is limited to special circumstances, that is, if the cooperation with a supplier will result in a new or better product, providing a competitive advantage to the business unit. A partnership is always on a temporary basis, because after a couple of years the innovation is diffused and the search for alternatives recommences.
(d) Strategic items
Too often, the supplier is the dominant party in the buyer-supplier relationship. In practice it is very hard to come to an agreement on the needed requirements. In those cases, Akzo Nobel Coatings has no choice but to accept that a supplier does not add the required value. The supplier has a strong position when negotiating the quality, the size of packaging, the moment of delivery, and so on. However, exceptions do exist. For instance, if Akzo Nobel Coatings is the major account for a supplier, then there is naturally room for negotiating a better deal. Another possibility would be that Akzo Nobel Coatings is considered an important customer for reasons of image and charisma. A position in the strategic quadrant is not preferred, because of the risks and disadvantages of being dependent on a single supplier. Sometimes the number of suppliers can be enlarged by means of supplier development. Strategic partnerships are rarely an option, because the business unit is too small and the risks are too high. Strategic partnerships are only pursued if there is a competitive advantage in end markets to be gained in a buyer-supplier relationship. These partnerships are always on a temporary basis.

170
5.3.5 Conclusions
The Akzo Nobel Coatings case study reveals some new insights in the possibilities of a purchasing portfolio approach at the business unit-level. It is probably a rare example of a business unit where the portfolio technique is fully integrated in the daily practice of purchasing and supply management. Purchasing goals and purchasing strategies are clearly connected to the results of the different portfolio matrices. Every plant completes a portfolio matrix in a similar way, providing an overview of the purchasing operations at a business unit level and providing insights in local plant situations. The main purpose of the portfolio analysis is to detect and to cope with the risk of being too dependent on suppliers. It provides the basis of purchasing planning and the development of differentiated purchasing strategies. For the evaluation of a completed portfolio matrix, it is imperative to have information on the marketing positions in the connected end markets. For instance, in case of a commodity end market, it is not acceptable to have a filled-in strategic quadrant. This means that there is a clear relationship between the purchasing strategy and the marketing strategy, catalyzed by the use of the portfolio model. On the level of individual plants, the strategic recommendations are aimed at reducing risk and dependence on suppliers. Strategic partnerships with suppliers are rare and always temporary. In special cases, whenever possible, it is recommended to increase the number of suppliers, for instance by means of supplier development. In more usual cases, the dependence on suppliers is handled by means of contingency plans and by keeping safety stocks. Measurement issues are dealt with in an interesting and remarkable way. The number of suppliers and the value of purchases are selected as basic dimensions. This choice has a main advantage over many other operationalizations of the Kraljic-dimensions. The value of each variable is made measurable in an objective manner. The values are not measured in terms of perceptions or other proximities of variables. Portfolio matrices are therefore better comparable, both in time as in comparison to other plants. In addition, the demarcation problem too is handled in a very practical way. On the basis of a set of clear rules, it is decided in which category a product is to be placed.
5.4 TE STRAKE - Engineering & Production
The business units of TE STRAKE operate in close cooperation with customers, involved in the manufacture of machinery for various sectors of the electronics industry, textile machinery industry, printing industry, agricultural industry, optical media and automotive industry.

A Portfolio Approach to the Development of Differentiated Purchasing Strategies
171
TE STRAKE, located in the Netherlands, is a company specialized in the development and production of serial products in the field of mechatronics motion controlled systems, the combination of mechanical and electronic technologies. In addition, TE STRAKE is involved in the surface treatment of metals for the automobile industry. TE STRAKE concentrates on narrow market segments, the application of complex technologies, and a relatively small number of customers per segment. Approximately 80% of the turnover is generated by 15 customers. In 1999, the company enjoyed a turnover of EUR 52 million, the operating result being EUR 4.2 million and the net income amounting to EUR 2.7 million. The share of purchases has risen to 68%, which is interpreted as a substantial increase in flexibility. TE STRAKE has 300 employees. TE STRAKE is made up of three business units: Engineering & Production, Weaving Technology, and Corrosion Protection. This case study focuses on the business unit Engineering & Production, for reasons concerning experience in the use of a purchasing portfolio approach. With a 75% share in turnover, Engineering & Production is the largest business unit of TE STRAKE. Engineering & Production is an applicated system supplier in the true sense of the word, with a very strong customer focus. Engineering & Production acts as a first tier supplier in a limited number of OEM-markets. Support is being offered throughout the entire trajectory of product development and production. Engineering & Production is able to take over management and realization of whole segments of complete high complex mechatronical modules, units or machines. This is usually in medium-sized series, from 20 to 7,000 units per year. Engineering & Production’s expertise is called in especially when a combination of fine mechanics, electronics and pneumatics is concerned.
5.4.1 Organization of purchasing
Being a main supplier, Engineering & Production aims at a position of applicated systems supplier, emphasizing that the business unit wants to be a partner in the sequence of next-generation products and systems. Overall, TE STRAKE is focussed on a very small number of customers. However, there is mutual dependence, because the machinery manufacturers are on their turn very dependent on the expertise and products of TE STRAKE. An overall objective of the company is to reduce associated risks of dependence. This is attempted by aiming at customers in different industries who are using the same specialization, namely mechatronic motion controlled systems. The company positions itself as ‘your competent outsourcing partner’. The business strategy is based on creating added value for customers, close cooperation and long term relationships with key customers. Engineering & Productions has a long term relationship with 4 large, major customers. In addition there is a limited number of smaller customers with a potential development of becoming a major customer. That is why they are labeled as ‘Potentials’. The organization
172
of purchasing is completely in line with the overall organization of the business units. Production and purchasing are managed in customer focus teams, that are dedicated to these major customers. A customer focus team consists of representatives of the following business functions: marketing and sales, logistics, assembly, planning, engineering, purchasing, and quality management. Purchasing objectives are formulated on the customer level, specified for major individual customers. There are purchasing and supply targets per customer in the areas of cost and cost reduction, product quality, reliability of delivery, lead times, flexibility, and risk management. The dominating customer focus on purchasing practice however should not imply the negligence of synergy across customer focus teams. Engineering & Production employs a strategic purchasing function and some senior buyers, specialized in electronical and mechanical parts and components. Non-production related products are procured on a central level. In terms of maturity, purchasing is developing from an administrative function into a more pro-active function that directly contributes to the competitive position of the firm. A fairly new computer system supports all purchasing activities.
5.4.2 Purchasing and supply strategies
More and more customers demand very short lead times, presenting complex logistical challenges for TE STRAKE. In addition, cost effectiveness is important too. Market conditions are changing, for which supply chain management is helpful. Recently, the concept of demand chain management has been introduced. Demand chain management aims at supply solutions that enables the company to react quickly and in an inexpensive way to changing demands of customers. This implies the disposition of a lean and flexible network of suppliers. The management of the supply base implies the development and maintenance of long term relationships with a set of preferred suppliers. These long standing relationships have evolved in a period of many years. Technologically advanced suppliers are treated as strategic partners. However, there is always a field of tension between being a partner and imposing (needed) cost reductions. Because of changing economic conditions, TE STRAKE faces the need for continuous cost efficiency. It is difficult to press for lower prices when dealing with strategic partners. Sometimes TE STRAKE has to comply to the specific demands of a major customer. These demands concern not only the specifications of products to be bought by TE STRAKE, but also the selection of suppliers. In these circumstances TE STRAKE is obliged to enter into forced ‘partnerships’.

A Portfolio Approach to the Development of Differentiated Purchasing Strategies
173
An important starting point for TE STRAKE’s purchasing and supply strategy, is the involvement of specialized suppliers in development projects. Purchasing faces the important objective of developing and maintaining of long-term relationships with technologically advanced suppliers. Open cost calculations and the exchange of technical information are indispensable for these relationships that thrive on commitment and trust. TE STRAKE feels that it has to be engaged in different kinds of relationships, reflecting the overall business strategy. TE STRAKE’s purchasing and supply strategies have to support the business strategy. The most important starting points are the demands and requirements of the major customers. Being a main supplier for knowledge intensive industries, TE STRAKE addresses complex technological and logistical issues.
5.4.3 Purchasing portfolio analysis: dimensions, measurement and use
The main purpose of the portfolio approach is to gain valuable insights in the profit impact and the supply risks, connected with the procurement of products that build the end product for major customers. The results of the portfolio analysis are used for: - managing the supply base; - anticipating changes; - visualizing problems and bottlenecks; - assessing risks. Supplier strategies are developed and modified, based on the results of the portfolio analysis. TE STRAKE uses the Kraljic portfolio approach on the level of major customers. All products that are purchased for and used in the end product, manufactured for a major customer, are categorized into four cells. The dimensions are: - the profit impact, and - the supply risk. The profit impact of each product is determined by two factors: 1. the share of the product value in the price of the end product, and 2. the sensitivity to fluctuations of exchange rates. The supply risk of each product is determined by four factors: 1. the level of availability (scarcity, number of alternative suppliers); 2. lead times (suppliers who need long order lead times, frustrate the required flexibility); 3. the switching costs (efforts, required to switch to another supplier); 4. the demands of the customer (sometimes customers list the second tier suppliers that have to be contracted).
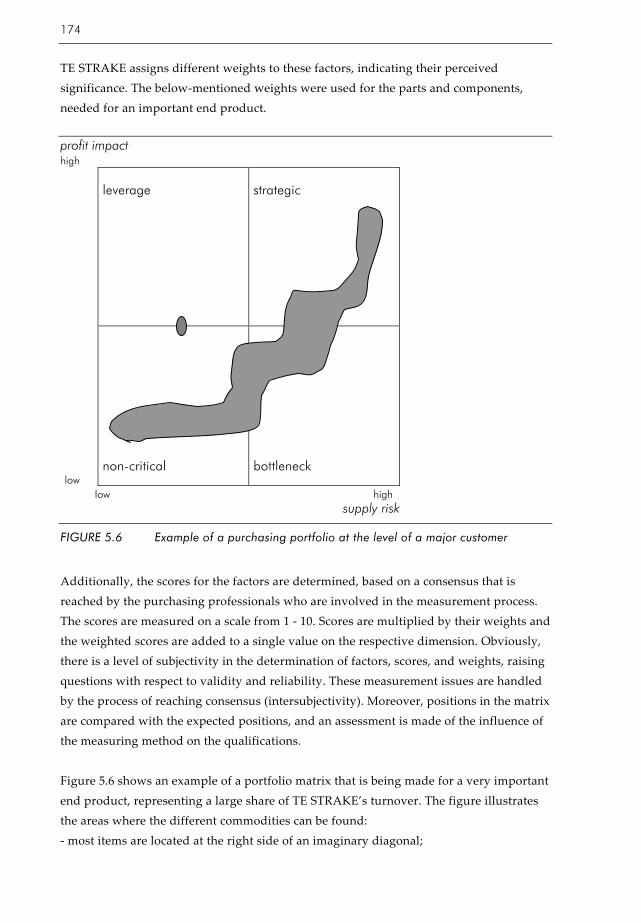
174
TE STRAKE assigns different weights to these factors, indicating their perceived significance. The below-mentioned weights were used for the parts and components, needed for an important end product. profit impact high
leverage
strategic
non-critical
bottleneck
low high supply risk
FIGURE 5.6 Example of a purchasing portfolio at the level of a major customer
Additionally, the scores for the factors are determined, based on a consensus that is reached by the purchasing professionals who are involved in the measurement process. The scores are measured on a scale from 1 - 10. Scores are multiplied by their weights and the weighted scores are added to a single value on the respective dimension. Obviously, there is a level of subjectivity in the determination of factors, scores, and weights, raising questions with respect to validity and reliability. These measurement issues are handled by the process of reaching consensus (intersubjectivity). Moreover, positions in the matrix are compared with the expected positions, and an assessment is made of the influence of the measuring method on the qualifications. Figure 5.6 shows an example of a portfolio matrix that is being made for a very important end product, representing a large share of TE STRAKE’s turnover. The figure illustrates the areas where the different commodities can be found: - most items are located at the right side of an imaginary diagonal;
low
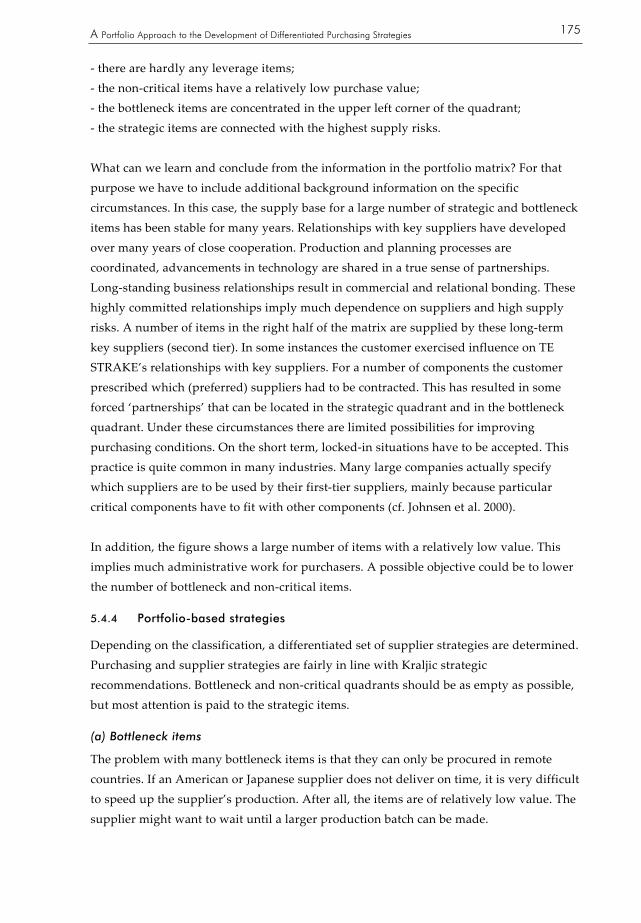
A Portfolio Approach to the Development of Differentiated Purchasing Strategies
175
- there are hardly any leverage items; - the non-critical items have a relatively low purchase value; - the bottleneck items are concentrated in the upper left corner of the quadrant; - the strategic items are connected with the highest supply risks. What can we learn and conclude from the information in the portfolio matrix? For that purpose we have to include additional background information on the specific circumstances. In this case, the supply base for a large number of strategic and bottleneck items has been stable for many years. Relationships with key suppliers have developed over many years of close cooperation. Production and planning processes are coordinated, advancements in technology are shared in a true sense of partnerships. Long-standing business relationships result in commercial and relational bonding. These highly committed relationships imply much dependence on suppliers and high supply risks. A number of items in the right half of the matrix are supplied by these long-term key suppliers (second tier). In some instances the customer exercised influence on TE STRAKE’s relationships with key suppliers. For a number of components the customer prescribed which (preferred) suppliers had to be contracted. This has resulted in some forced ‘partnerships’ that can be located in the strategic quadrant and in the bottleneck quadrant. Under these circumstances there are limited possibilities for improving purchasing conditions. On the short term, locked-in situations have to be accepted. This practice is quite common in many industries. Many large companies actually specify which suppliers are to be used by their first-tier suppliers, mainly because particular critical components have to fit with other components (cf. Johnsen et al. 2000). In addition, the figure shows a large number of items with a relatively low value. This implies much administrative work for purchasers. A possible objective could be to lower the number of bottleneck and non-critical items.
5.4.4 Portfolio-based strategies
Depending on the classification, a differentiated set of supplier strategies are determined. Purchasing and supplier strategies are fairly in line with Kraljic strategic recommendations. Bottleneck and non-critical quadrants should be as empty as possible, but most attention is paid to the strategic items.
(a) Bottleneck items
The problem with many bottleneck items is that they can only be procured in remote countries. If an American or Japanese supplier does not deliver on time, it is very difficult to speed up the supplier’s production. After all, the items are of relatively low value. The supplier might want to wait until a larger production batch can be made.

176
The usual approaches when dealing with bottleneck problems are entering into long term contracts, keeping large stocks, and accepting consignment systems. However, sometimes it is possible to pool the requirements and reach a better position in the matrix, in the direction of the leverage quadrant. For instance, products that can be grouped as ‘springs’ and ‘pieces of sheet iron work’, are usually located in the non-critical quadrant or round the borderline of the bottleneck and the non-critical quadrant. Contracts for these products have been awarded to preferred suppliers. The objective is the assurance of supply and the reduction of administrative work load.
(b) Non-critical items
As a rule of thumb, 80% of the buying efforts are spent on non-critical items. The focus is always on reducing the number of suppliers, diminishing the administrative work load and facilitating logistical processes. Whenever possible, leverage is pursued by clustering goods and services. The recommended strategy is to cluster items into groups that are procured at a single source. Obviously, this strategy enhances the buying power of the firm.
(c) Leverage items
For leverage items an approach of competitive bidding is recommended. Suppliers are interchangeable and the supply risk is low. As a rule, no long-term contracts are closed. Buying criteria are formulated in terms of prices, delivery, and quality. However, it appears that not in every end product leverage items are being used.
(d) Strategic items
Different strategic options are possible for the strategic items, depending on specific conditions and circumstances. In case of problems and unsatisfactory performance of a supplier, corrective actions are attempted. Improvements are explored, in close cooperation with the supplier. Targets are being set or reset. But in essence, the idea of being together in the same value chain is put forward, convincing the supplier of a mutual interest. However, if the supplier does not succeed in improving his performance, the relationship has to be broken off. More in general, supplier development is important in case of poor supplier performance and in case of unacceptable supply risks. Sometimes there is a much more adversarial relationship in case of a locked-in ‘partnership’ that is imposed by a major customer. Commitment is low and suppliers are in the comfortable position of being irreplaceable. TE STRAKE has limited possibilities of influencing the behavior and attitude of these suppliers. Convincing the customer of other possibilities might be an option, but only for the long term. Generally however, technologically advanced suppliers are very important for TE STRAKE’s business strategy in its condition of applicated system supplier. Based on open cost calculation, long-term relationships are pursued. These relationships are characterized by mutual commitment. To reduce supply risks, TE STRAKE invests in

A Portfolio Approach to the Development of Differentiated Purchasing Strategies
177
supplier relationships. On the other hand the firm pays attention to contractual issues in order to avoid problems. These preferred key suppliers are very important, because they contribute heavily to the success of the firm.
5.4.5 Conclusions
Being a first tier supplier in a selected number of OEM-markets, TE STRAKE’s business unit Engineering & Production operates in close cooperation with major customers. The necessary involvement of specialized suppliers is in line with the organizational structure of customer focus teams. Purchasing needs to develop and maintain long-term relationships with technologically advanced suppliers. Obviously, not all suppliers are partners, meaning that TE STRAKE is engaged in different kinds of relationships. TE STRAKE is aware of the consequences of its position as a first tier supplier in the supply chain of a small number of industrial manufactures. The strong customer focus is of decisive importance to purchasing and supply strategies. The portfolio analysis is conducted on the level of major customers. All products that are purchased for and used in a specific end product, are categorized into the four Kraljic-cells. The level of analysis emphasizes the strong customer focus and the relationship with the overall business strategy. A point of special interest is the development and creation of purchasing synergy across customer focus teams. The portfolio approach has proven its worth for TE STRAKE. The results of portfolio analysis are used for the development and adjustment of differentiated purchasing and supply strategies. In most situations the standard Kraljic recommendations are followed. Interesting are the different kinds of partnerships with suppliers in the strategic quadrant. In an ideal context mutually committed relationships are maintained with innovative, reliable key suppliers who contribute heavily to the firm’s success. It can be very difficult to pass on the high demands of the customer to these long term partners, especially in the field of logistics (short lead times) and prices (low costs). A related challenge is the handling of key suppliers that are prescribed by the customer. In all cases the advantages of tight relationships with specialized suppliers imply a high level of dependence on these suppliers. In terms of the Kraljic portfolio, much items have to be located in the bottleneck and the strategic quadrant. The basic Kraljic-dimensions are used: profit impact and supply risk. The values of these dimensions are determined through an arithmetic method of weighted scores. This includes successively the determination of factors, weights, and scores. For all measurement issues consensus has to be reached, in pursuit of intersubjectivity and validity. The results of the TE STRAKE-case study show that the portfolio approach is and can be used on the level of a major customer, focussing on all the items that are procured for the production of complex customized modules and machines.
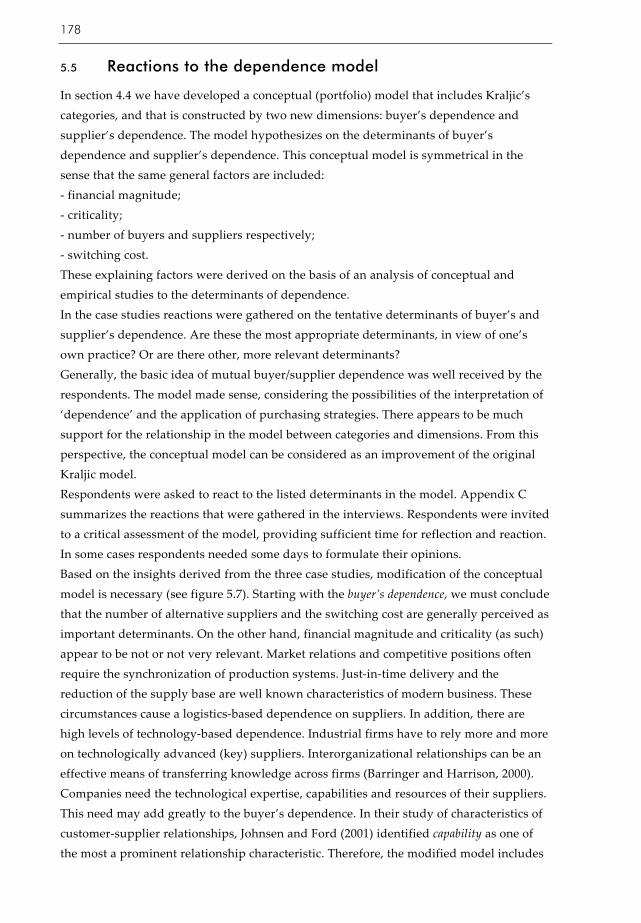
178
5.5 Reactions to the dependence model
In section 4.4 we have developed a conceptual (portfolio) model that includes Kraljic’s categories, and that is constructed by two new dimensions: buyer’s dependence and supplier’s dependence. The model hypothesizes on the determinants of buyer’s dependence and supplier’s dependence. This conceptual model is symmetrical in the sense that the same general factors are included: - financial magnitude; - criticality; - number of buyers and suppliers respectively; - switching cost. These explaining factors were derived on the basis of an analysis of conceptual and empirical studies to the determinants of dependence. In the case studies reactions were gathered on the tentative determinants of buyer’s and supplier’s dependence. Are these the most appropriate determinants, in view of one’s own practice? Or are there other, more relevant determinants? Generally, the basic idea of mutual buyer/supplier dependence was well received by the respondents. The model made sense, considering the possibilities of the interpretation of ‘dependence’ and the application of purchasing strategies. There appears to be much support for the relationship in the model between categories and dimensions. From this perspective, the conceptual model can be considered as an improvement of the original Kraljic model. Respondents were asked to react to the listed determinants in the model. Appendix C summarizes the reactions that were gathered in the interviews. Respondents were invited to a critical assessment of the model, providing sufficient time for reflection and reaction. In some cases respondents needed some days to formulate their opinions. Based on the insights derived from the three case studies, modification of the conceptual model is necessary (see figure 5.7). Starting with the buyer’s dependence, we must conclude that the number of alternative suppliers and the switching cost are generally perceived as important determinants. On the other hand, financial magnitude and criticality (as such) appear to be not or not very relevant. Market relations and competitive positions often require the synchronization of production systems. Just-in-time delivery and the reduction of the supply base are well known characteristics of modern business. These circumstances cause a logistics-based dependence on suppliers. In addition, there are high levels of technology-based dependence. Industrial firms have to rely more and more on technologically advanced (key) suppliers. Interorganizational relationships can be an effective means of transferring knowledge across firms (Barringer and Harrison, 2000). Companies need the technological expertise, capabilities and resources of their suppliers. This need may add greatly to the buyer’s dependence. In their study of characteristics of customer-supplier relationships, Johnsen and Ford (2001) identified capability as one of the most a prominent relationship characteristic. Therefore, the modified model includes

A Portfolio Approach to the Development of Differentiated Purchasing Strategies
179
logistical indispensability as well as the need for the technological expertise of suppliers as determinants of the buyer’s dependence. Respondents report high levels of supplier’s dependence, mainly due to the financial magnitude of transactions. Basically, the financial magnitude of purchases should be assessed from the supplier’s position, not the buyer’s position. For the supplier’s dependence it is important to know what the share is of a supplier’s output taken by a particular buyer. The number of alternative buyers and the switching cost are considered to be important determinants as well. Criticality has to be redefined as a need for the buyer’s technological expertise. In some cases suppliers need the technological input of the buying firm and require a transfer of know-how. The modified model is shown in figure 5.7
FIGURE 5.7 Modified conceptual model of buyer’s and supplier’s dependence
Based on the assumed relations between variables and dependence, it is possible to formulate eight hypotheses.
financial magnitude
alternative buyers
switching cost
technological expertise
supplier's dependence leverage
non- critical
strategic
bottleneck
buyer's dependence
logistical indispensability
technological expertise
alternative suppliers
switching cost
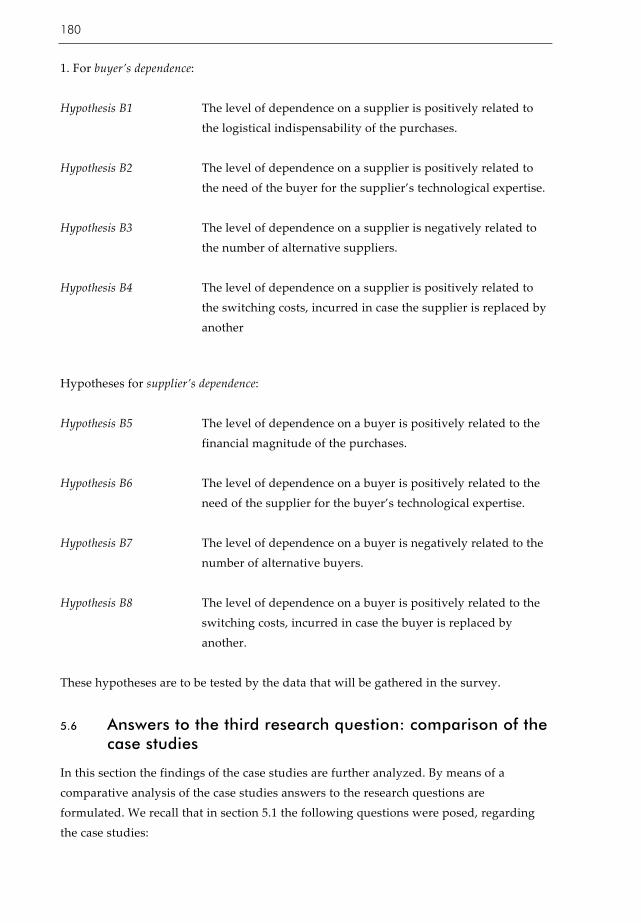
180
1. For buyer’s dependence: Hypothesis B1 The level of dependence on a supplier is positively related to
the logistical indispensability of the purchases. Hypothesis B2 The level of dependence on a supplier is positively related to
the need of the buyer for the supplier’s technological expertise. Hypothesis B3 The level of dependence on a supplier is negatively related to
the number of alternative suppliers. Hypothesis B4 The level of dependence on a supplier is positively related to
the switching costs, incurred in case the supplier is replaced by another
Hypotheses for supplier’s dependence: Hypothesis B5 The level of dependence on a buyer is positively related to the
financial magnitude of the purchases. Hypothesis B6 The level of dependence on a buyer is positively related to the
need of the supplier for the buyer’s technological expertise. Hypothesis B7 The level of dependence on a buyer is negatively related to the
number of alternative buyers. Hypothesis B8 The level of dependence on a buyer is positively related to the
switching costs, incurred in case the buyer is replaced by another.
These hypotheses are to be tested by the data that will be gathered in the survey.
5.6 Answers to the third research question: comparison of the case studies
In this section the findings of the case studies are further analyzed. By means of a comparative analysis of the case studies answers to the research questions are formulated. We recall that in section 5.1 the following questions were posed, regarding the case studies:
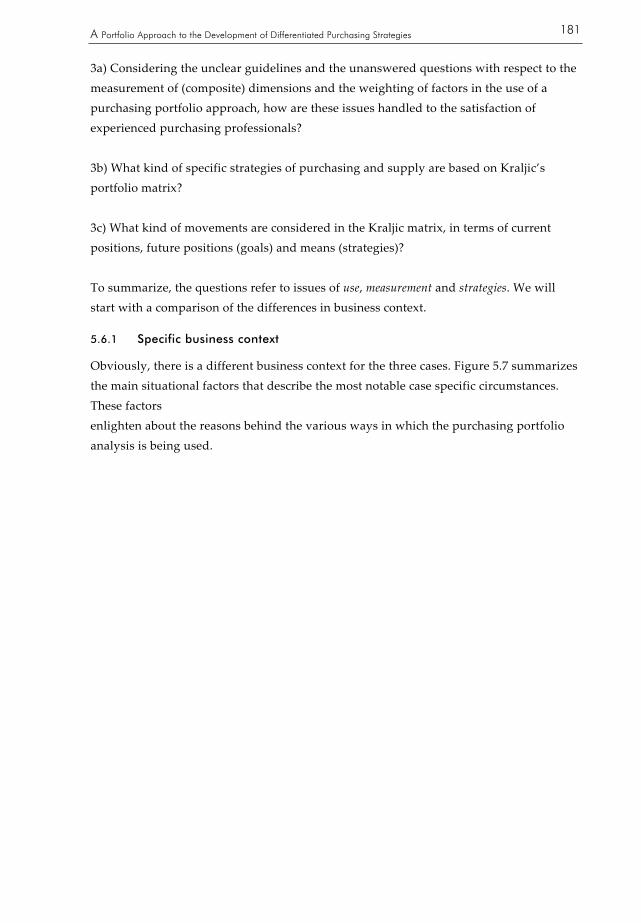
A Portfolio Approach to the Development of Differentiated Purchasing Strategies
181
3a) Considering the unclear guidelines and the unanswered questions with respect to the measurement of (composite) dimensions and the weighting of factors in the use of a purchasing portfolio approach, how are these issues handled to the satisfaction of experienced purchasing professionals? 3b) What kind of specific strategies of purchasing and supply are based on Kraljic’s portfolio matrix? 3c) What kind of movements are considered in the Kraljic matrix, in terms of current positions, future positions (goals) and means (strategies)? To summarize, the questions refer to issues of use, measurement and strategies. We will start with a comparison of the differences in business context.
5.6.1 Specific business context
Obviously, there is a different business context for the three cases. Figure 5.7 summarizes the main situational factors that describe the most notable case specific circumstances. These factors enlighten about the reasons behind the various ways in which the purchasing portfolio analysis is being used.
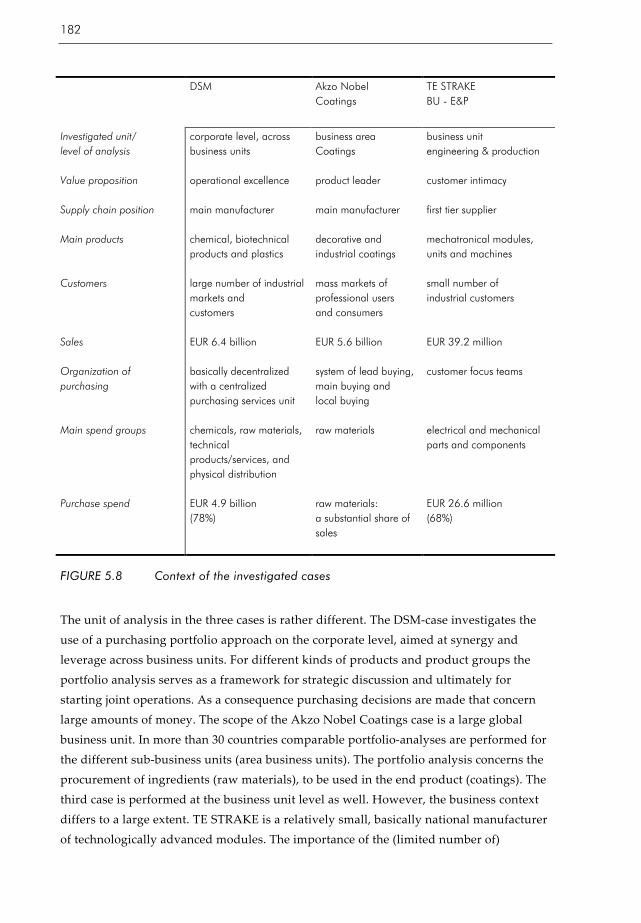
182
DSM Akzo Nobel
Coatings
TE STRAKE BU - E&P
Investigated unit/ level of analysis Value proposition Supply chain position Main products Customers Sales Organization of purchasing Main spend groups Purchase spend
corporate level, across business units operational excellence main manufacturer chemical, biotechnical products and plastics large number of industrial markets and customers EUR 6.4 billion basically decentralized with a centralized purchasing services unit chemicals, raw materials, technical products/services, and physical distribution EUR 4.9 billion (78%)
business area Coatings product leader main manufacturer decorative and industrial coatings mass markets of professional users and consumers EUR 5.6 billion system of lead buying, main buying and local buying raw materials raw materials: a substantial share of sales
business unit engineering & production customer intimacy first tier supplier mechatronical modules, units and machines small number of industrial customers EUR 39.2 million customer focus teams electrical and mechanical parts and components EUR 26.6 million (68%)
FIGURE 5.8 Context of the investigated cases
The unit of analysis in the three cases is rather different. The DSM-case investigates the use of a purchasing portfolio approach on the corporate level, aimed at synergy and leverage across business units. For different kinds of products and product groups the portfolio analysis serves as a framework for strategic discussion and ultimately for starting joint operations. As a consequence purchasing decisions are made that concern large amounts of money. The scope of the Akzo Nobel Coatings case is a large global business unit. In more than 30 countries comparable portfolio-analyses are performed for the different sub-business units (area business units). The portfolio analysis concerns the procurement of ingredients (raw materials), to be used in the end product (coatings). The third case is performed at the business unit level as well. However, the business context differs to a large extent. TE STRAKE is a relatively small, basically national manufacturer of technologically advanced modules. The importance of the (limited number of)

A Portfolio Approach to the Development of Differentiated Purchasing Strategies
183
customers is omnipresent. As a first tier supplier the portfolio analysis is performed on the level of the customer: all products that are used for a specific customer are positioned in the matrix. From the various scopes of the case studies it can be concluded that a purchasing portfolio approach can be applicated on many different levels of aggregation. The generic nature of the Kraljic approach allows for customization, implying that users have to make all kinds of decisions, implementing the portfolio analysis. We have concluded that measurement issues and strategic issues are handled in different ways. Some of the differences can be explained by differences of scale, scope and organizational level. We can better understand the content and the directions of the portfolio-based strategies, if we take a look at differences in supply chain position and value proposition. In terms of Treacy and Wiersema (1993) DSM aims at operational excellence, Akzo Nobel Coatings wants to be a product leader, and TE STRAKE’s strategy is based on customer intimacy. The conditions on end markets, the requirements of customers, and the overall business strategy are very important circumstances for the selection of purchasing and supplier strategies.
5.6.2 Measurement and use
In the case studies purchasing professionals were interviewed on their experience with and views on the application of the purchasing portfolio analysis. It was clear that they faced common problems and that they had to answer the same questions. Based on their experience, an outline is made for the application of purchasing portfolio analysis, covering the main decisions and choices (see Appendix D: Outline for the application of purchasing portfolio analysis). Practitioners who want to applicate the portfolio analysis have to answer some basic questions of scope and design: - what will be positioned? - what will be the level of aggregation? - for what (organizational) unit will the analysis be performed? The case studies illustrate that many choices have to be made. In our cases products were positioned in the matrix. From other sources it is known that suppliers or supplier relationships are sometimes positioned in the matrix (for instance Van Weele, 2000; Åhman, 2002). The portfolio analysis might be restricted to certain types of products, for instance raw materials (Akzo Nobel Coatings), logistical services, or non-product related products. The level of aggregation refers to the question whether individual items, or smaller or broader product groups will be positioned in the matrix. What is the unit of analysis? The positioning of individual items usually implies that data are needed on thousands of items, some of which will be very similar and many of which will be of very low value. On the other hand, a high level of aggregation will reduce the usefulness of the analysis.

184
For instance, if all components are grouped into a single category ‘components’, then it will not be possible to determine the level of supply risk and to select an overall purchasing and supplier strategy. In general, the level of aggregation should be linked to the level on which it is useful to select (differentiated) purchasing strategies. This means that major or unique purchases should always be classified individually, while other purchases could be classified by commodity groups or type of buy. If there are important individual items within a commodity group with significant other values on the two dimensions of the matrix, those should be broken up and analyzed separately (conform Ellram, 1996). Another question relates to the organizational unit of analysis. The investigated portfolio approaches in the case studies were all connected to different organizational units: the corporate level (DSM), the level of area business units (Akzo Nobel Coatings), and the level of a major customer (TE STRAKE). Other options are conceivable. To conclude, the purchasing portfolio analysis allows for very different modes of application. There is an infinite number of possibilities, combining choices with respect to products/product types, levels of aggregation, and organizational units. Choices of design are important for the scope of the strategic recommendations and the specific portfolio-based strategie that can be selected. The case studies illustrate difference in use intensity, occasion, and purpose. It can be concluded that there is always an advocate of the technique, introducing and supporting the portfolio analysis. In the case studies, these ‘product champions’ were the highest purchasing professionals in the organization. Figure 5.9 summarizes some of the most significant characteristics of the investigated portfolio approaches, examining use issues and measurement issues.

A Portfolio Approach to the Development of Differentiated Purchasing Strategies
185
Use issues
DSM Akzo Nobel Coatings
TE STRAKE BU - E&P
Frequency, occasion Main advocate and project manager Main purpose Measurement issues Dimensions Determination of factors Measurement of factors Determination of weights Aggregation of subscores
irregularly, in response to changes director purchasing services to identify and to develop synergy and leverage across BU's 1 strategic importance 2 supply risk during the analysis, basically unlimited consensus based implicitly, during the analysis consensus based
regularly, fully integrated with daily practice purchasing vice president of each BU to detect and to cope with supplier dependence 1 value of purchases 2 number of suppliers in advance, factors are dimensions objective n.a. n.a.
incidentally, on major customer level strategic buyer of the business unit to assess risk and to identify possiblities 1 profit impact 2 supply risk in advance, limited number consensus based explicitly, in advance arithmetic (additive model)
FIGURE 5.9 Characteristics of the purchasing portfolio approaches
When using the portfolio approach, it is imperative to recognize that the positioning of items does not complete the portfolio analysis. In all case studies, the positioning of items in the quadrants (the measurement) was followed by a process of reviewing the positions in the matrix and a process of reflection on the consequences. Whatever method is selected, there are always subjective choices, limitations and elements that influence the actual positioning in the matrix. On closer consideration, questions have to be answered for each position that is found in the matrix: - why is an item/product positioned in this specific spot? - is the found position in line with previous expectations? - are positions unintentionally and wrongfully influenced by the measurement method? - are therefore re-adjustments necessary? In other words, after the matrix is filled, users reflect on the results. If necessary, manual adjustments are made. In-depth discussions on the positions in the matrix are considered
186
as the most important phase of the analysis. Strategic discussions provide deeper insights and may lead more easily to consensus-based decisions. It is felt by the users that the Kraljic framework facilitates these important discussions to a large extent. Additionally, a reflection on the consequences is needed. How are the positions in the matrix to be viewed and assessed? Leading questions are: - what is the actual meaning of the different positions in the matrix? - what is the interpretation of the results? - are there any points of intervention? which risks are (un)acceptable? In section 5.1, the first research question refers to measurement problems, associated with the use of a portfolio approach: how do experienced professionals handle issues with respect to the measurement of dimensions and factors? We will now try to answer this question, describing the solutions developed and used by different professionals. The case studies identified three kinds of different approaches to the measurement issues, connected to every purchasing portfolio analysis: - DSM uses a ‘consensus-based’ method, - Akzo Nobel Coatings uses a ‘one-by-one’ method, - TE STRAKE uses a’ weighted factor score’ method. The ‘consensus-based’ method is predominantly based on a process of reasoning and discussing. The reaching of consensus is very important when choices are made with respect to the measurement of variables and factors, and ultimately for the positioning of items/products in the matrix. Advocates of this approach regard this as a very attractive feature of the portfolio analysis that is being used. Profound open discussions about purchasing issues are considered as the most critical part of strategy development. Differences of opinions become very clear, allowing for a true strategic discussion. As a rule, points of view always have to be substantiated by facts. DSM has used this method for years. Users are content with the flexibility and possibilities of this consensus-based approach. Quite a different approach is the ‘one-by-one’ method that is used by Akzo Nobel Coatings. Just one key variable is selected per dimension. Variables should meet high requirements: - they are measurable in an objective way; - they are excellent proximities for ‘profit impact’ and ‘supply risk’. The financial value of items comes very close to the profit impact; the supply risk is usually operationalized by the number of (alternative) suppliers. As a result, positions in the matrix can be determined in a rather quick and unambiguous way. A related benefit is that it is possible to compare matrices, because they are all based on a rather objective measurement method. In addition, the method allows for identifying to what extent products can shift to another quadrant. For instance, suppose product A is a raw material

A Portfolio Approach to the Development of Differentiated Purchasing Strategies
187
that is only available from one mine in the world, owned by one supplier. Suppose product B is a raw material of which the buying company requires its specifications to meet extremely high quality elements. Obviously, products A and B will both be positioned in the strategic quadrant. While product A can hardly be shifted, product B could be moved towards the leverage quadrant, provided that its specification are less strictly defined, opening the market to more suppliers. In other words, additional background information is needed on products, markets and suppliers, so that opportunities or threats are not neglected. TE STRAKE uses a ‘weighted factor score’ method that includes a number of factors for each dimension. The method allows for a completely customized approach, deciding on factors, weights and (usually) scores. Total scores per dimension are calculated in an additive model through the multiplication of scores and weights. The sub scores are added to a single value. It is assumed that a lower score on a factor can be compensated by a higher score on another factor. The user of an additive model should ask himself if this is an acceptable line of reasoning. For instance, if there is just a single supplier delivering a certain product, then there is a maximal dependence on this supplier. Would it be possible for the resulting supply risk to be compensated by other factors? Other disadvantages of the weighted method are: - depending on the level of aggregation, it could be necessary to dispose of a large number of quantitative data that are rarely available in a purchasing information system; - working with constituent factors, the overall picture can be hard to see, especially when dealing with large numbers of factors and weights. On the other hand, there is a major advantage, recognized by the users of the weighted factor method. The portfolio analysis can be fully customized, according to one’s own views and requirements. Preferably, all the relevant factors are included in the analysis.
5.6.3 Strategic directions
The investigated cases made clear that the development of portfolio-based strategies requires additional information. In all case studies it was found that the following factors were included: - the (relationship with the) overall business strategy, - the situations on supply markets, and - the performance, capacities and intentions of (individual) suppliers. The business strategy of TE STRAKE focuses on technological innovations, as first tier supplier. Purchasing and supply have to connect with these basic principles, partnering key suppliers for early involvement in product development and product improvement.
188
The basic points of departure of TE STRAKE are for instance rather different from the ones at DSM, a firm that operates from an operational excellence perspective, always looking for cost reductions and efficiency. The marketing requirements on end markets are clearly translated by Akzo Nobel Coatings in guidelines for the development of purchasing strategies. Commodity markets are distinguished from niche markets, which affects the selection of purchasing objectives and strategies to a considerable extent. Obviously, the purchasing professional will take into account the situations on specific supply markets and the assessments of individual suppliers. Items with high supply risks will be treated differently, according to the reliability, the performance, the competences, and the intentions of the connected suppliers.

A Portfolio Approach to the Development of Differentiated Purchasing Strategies
189
DSM Akzo Nobel Coatings
TE STRAKE BU - E&P
Connection between purchasing strategies and business strategy Portfolio based objectives Strategies and conditions for bottleneck items Strategies and conditions for non-critical items Strategies and conditions for leverage items Strategies and conditions for strategic items
meet the key success factors of the BU's 1. item-level 2. category-level 3. matrix-level S1 pooling C standardization S2 decomplex and pooling C1 standardization C2 overspecification S2 purchase card C standardization and pooling are impossible S1 pooling C standardization and pooling are possible S1 partners of convenience C1 no co-design S2 strategic partners C1 co-design C2 price performance S1 strategic partners C1 co-design C2 price performance S2 decomplex and supplier development C failing in co-design and/or price performance
match the situations in end markets (commodity vs niche) 1. item-level 2. category-level 3. matrix-level S1 forced single sourcing (consignment, stocks) C one available supplier S2 supplier development C right cost-benefit ratio S1 minimalize order cost C low value items with low supply risk S2 cross sourcing C availability of supplier S1 maximize added value C many alternatives S2 partnership (rare) C competitive advantage S1 accept suppliers' terms C dominant supplier S2 partnership (rare) C competitive advantage S3 supplier development (rare) C right cost-benefit ratio
meet the demands and requirements of major customers 1. item-level S1 contracts, stocks, consignment C high, unavoidable dependence on suppliers S2 pooling C grouping of items S1 separate ordering C pooling is not possible S2 single sourcing C pooling is possible S1 competitive bidding C interchangeable suppliers S1 strategic partnership C1 technologically advanced suppliers C2 mutual trust and exchange of information S2 supplier management C low performance S3 accept the terms C locked-in-relationship
Si = strategic response I Cj = condition j
FIGURE 5.10 The handling of strategic issues in the investigated cases

190
The second research question that we wanted to answer in the case studies refers to the different kind of purchasing strategies, based on a portfolio approach. Figure 5.10 shows the handling of strategic issues that are observed in the three cases. Portfolio-based strategies should be connected to portfolio-based objectives. The research revealed three levels of portfolio-based objectives: - the item-level, - the category-level, and - the matrix-level. In all of the three investigated cases, objectives were formulated at the item-level. For individual items statements were made, regarding the optimal positions in the matrix. Sometimes these objectives imply a movement in the matrix, in other instances it is decided to hold a certain position. We will come back to this later. On a category-level, objectives can be formulated for the four quadrants. For instance, DSM wants to empty the non-critical category as much as possible. Akzo Nobel Coatings employs very detailed measurable objectives for the categories in the matrix. For example: - reduce the number of items in the bottleneck quadrant by 5%, and - increase the value of all leverage items by 50%. Finally, it is possible to make statements at the level of the whole matrix. In general terms, DSM prefers a matrix that is filled in a particular way: - the bottleneck and non-critical categories should be as empty as possible, by means of standardization and pooling of requirements; - the leverage category should be filled with ‘partners of convenience’, meeting key success factors of business units (always price and logistics); - the strategic category should be filled with ‘strategic partners’, with the proper capabilities for co-design; - in addition, even for strategic items DSM rejects positions at the right side of the quadrant, implying high levels of dependence and high levels of supply risk. Akzo Nobel Coatings uses an even more sophisticated system of developing portfolio-based objectives. For each business unit the whole matrix is assessed, mainly based on the situations on their end markets. For instance, niche markets require high-quality ingredients. A logical consequence is that the strategic quadrant will be filled with a relatively large number of key suppliers, with whom close relationships are maintained. Figure 5.10 has summarized the most common strategies and conditions that were found in the case studies. This brings us to the question of how to find common ground between those different kind of strategies and conditions. At first sight they are incomparable. If we take a closer look and take up a higher level of abstraction, there are some striking similarities, despite the differences in the level of the investigated cases. Conditions

A Portfolio Approach to the Development of Differentiated Purchasing Strategies
191
usually refer to (im)possibilities to reduce the dependence on a supplier and to (im)possibilities to increase buying power. We will come back to these issues later on. The third research question explicitly refers to possibilities of moving in the matrix. Figure 5.10 provides an overview of portfolio-based strategies, albeit a rather unclear one. The case studies revealed that, additionally to Kraljic’s theory, experienced practitioners were very much aware of the different choices within each quadrant. Based on the interviews and the overview of selected strategies, we concluded that for each category two different kinds of strategic directions can be distinguished: 1. actions to pursue other positions in the matrix, and 2. actions to hold the same positions in the matrix. Holding on to a position implicitly means that current circumstances are taken for granted. We have observed that a position in the matrix can be accepted for different reasons, sometimes referring to a positive, sometimes to a negative choice. There might be a preference for a position because a firm is convinced that it is the best position for a certain item. In other cases a position might be accepted, because there are no realistic possibilities for change. The first type of strategies are of a more active, radical nature. When possible and desirable, other positions in the matrix are identified and pursued. This dichotomy between ‘holding position’ and ‘moving to another position’ has laid the foundation of the conceptual model of strategic directions in the matrix, as is visualized in figure 5.11. We will illustrate and amplify on the dichotomy for each product category. These matters will be examined more closely in the survey.

192
Leverage items strategic items Leverage items strategic items (1) = holding the same position (2) = moving to another position
FIGURE 5.11 Conceptual model of strategic directions for all categories
If we take a look at the bottleneck and the strategic quadrant at the right side of the matrix, those movements are pursued that reduce the supply risk. In terms of the matrix, this means a movement to the left. Non-critical items are moved upwards, leverage positions could be exchanged for strategic positions. We will elaborate on the strategic directions that can be identified in the conceptual model.
Bottleneck items
(1) holding the position: “keep safety stocks” If no other options are possible, then the category remains the same. Common responses to unfavorable bottleneck-positions are: keeping (extra) stocks, consignment systems and long term contracting. (2) moving to another position: “decomplex the product and find a new supplier”
(1)
(2)
(1)
(2)
(1)
(2)
(1)
(2)
A Portfolio Approach to the Development of Differentiated Purchasing Strategies
193
Bottleneck items are by definition of low value and of high risk. It should be interesting enough, especially from an economic point of view, to look for alternatives. The most common alternatives refer to the product (broadening specifications/decomplex) or to the supplier (searching, managing and developing suppliers). These measures must lead to a lower level of supply risk and a lower level of the dependence on a supplier.
Non-critical items
(1) holding the position: “individual ordering” Whenever it is not possible to pool the purchasing requirements, the only remaining option is some type of individual ordering, for instance by means of a purchase card. (2) moving to another position: “pooling of requirements” Preferably, non-critical items are put together in large quantities, increasing the buying power of the firm. If necessary, a process of standardization is pursued. The strategic direction is toward the leverage quadrant.
Leverage items
(1) holding the position: “maintaining a partnership of convenience” The generally preferred leverage position can be used for a rather aggressive supplier management. Competitive bidding and short term contracts are feasible options to exploit the leverage position. The dominant power position allows for a command strategy. In one of the investigated cases leverage suppliers are adequately referred to as ‘partners of convenience’. (2) moving to another position: “developing a strategic partnership” Exceptionally, the leverage position is abandoned in search for a more strategic partnership with a supplier. A cooperative strategy is only pursued if the supplier involved is willing and capable of contributing to the competitive advantage of the firm. Such a new role is only feasible for technologically advanced suppliers. The case studies revealed that the move from ‘leverage’ to ‘strategic’ should be considered as an exception to the rule.
Strategic items
(1a) holding the position: “maintaining a strategic partnership” Long term relationships with key suppliers should always contribute to the competitive advantage of the firm, as we have underlined. Relationships that include mutual trust, mutual commitment and an open exchange of information are rare. A successful partnership can be very valuable for both parties.
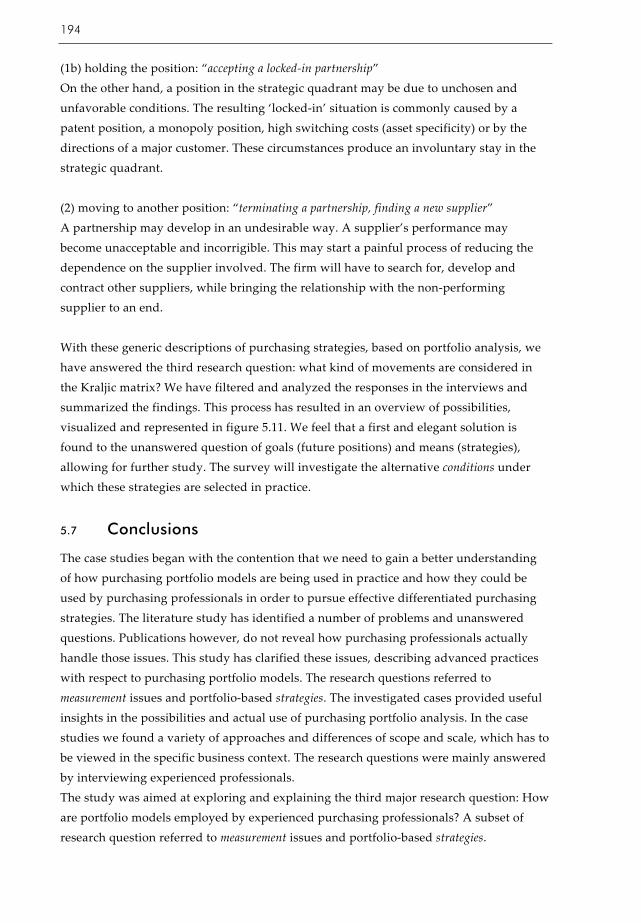
194
(1b) holding the position: “accepting a locked-in partnership” On the other hand, a position in the strategic quadrant may be due to unchosen and unfavorable conditions. The resulting ‘locked-in’ situation is commonly caused by a patent position, a monopoly position, high switching costs (asset specificity) or by the directions of a major customer. These circumstances produce an involuntary stay in the strategic quadrant. (2) moving to another position: “terminating a partnership, finding a new supplier” A partnership may develop in an undesirable way. A supplier’s performance may become unacceptable and incorrigible. This may start a painful process of reducing the dependence on the supplier involved. The firm will have to search for, develop and contract other suppliers, while bringing the relationship with the non-performing supplier to an end. With these generic descriptions of purchasing strategies, based on portfolio analysis, we have answered the third research question: what kind of movements are considered in the Kraljic matrix? We have filtered and analyzed the responses in the interviews and summarized the findings. This process has resulted in an overview of possibilities, visualized and represented in figure 5.11. We feel that a first and elegant solution is found to the unanswered question of goals (future positions) and means (strategies), allowing for further study. The survey will investigate the alternative conditions under which these strategies are selected in practice.
5.7 Conclusions
The case studies began with the contention that we need to gain a better understanding of how purchasing portfolio models are being used in practice and how they could be used by purchasing professionals in order to pursue effective differentiated purchasing strategies. The literature study has identified a number of problems and unanswered questions. Publications however, do not reveal how purchasing professionals actually handle those issues. This study has clarified these issues, describing advanced practices with respect to purchasing portfolio models. The research questions referred to measurement issues and portfolio-based strategies. The investigated cases provided useful insights in the possibilities and actual use of purchasing portfolio analysis. In the case studies we found a variety of approaches and differences of scope and scale, which has to be viewed in the specific business context. The research questions were mainly answered by interviewing experienced professionals. The study was aimed at exploring and explaining the third major research question: How are portfolio models employed by experienced purchasing professionals? A subset of research question referred to measurement issues and portfolio-based strategies.

A Portfolio Approach to the Development of Differentiated Purchasing Strategies
195
The case studies revealed three rather distinctive methods of measuring variables and weighting factors: (1) consensus method (2) one-by-one method (1 factor per dimension) (3) weighted factor score method. Each method satisfies the needs and expectations of the different users. The reason for this can be found in the additional steps that have to be taken in the portfolio analysis (see Appendix D). Before strategic actions are determined, it is imperative to complete a further process of interpreting and reflecting on the results. The positioning of items in the matrix should be considered as the starting point of portfolio analysis, definitely not the finishing point. After the matrix is filled, it is imperative that users reflect on the results. If necessary, manual adjustments should be made. In-depth discussions on the positions in the matrix are considered as the most important phase of the analysis. Strategic discussions provide deeper insights and may lead more easily to consensus-based decisions. It is felt by the users that the Kraljic framework facilitates these important discussions to a large extent. Some argue that the complexity of business decisions does not allow for simple recommendations. How could one deduce strategies from a portfolio analysis that is based on just two basic dimensions (e.g. Dubois and Pedersen, 2002)? Actually, the answer is simple: one cannot! In addition to the various factors that constitute the two dimensions of any matrix, it was found that experienced portfolio users always included additional information on: - the overall business strategy (related situations on end markets), - the specific situations on supply markets and - the capacities and the intentions and competences of individual suppliers. The selection of portfolio-based strategies was explored as well. Based on the case studies, a conceptual model of strategic directions has been presented, providing insights and overview of the main strategic choices for the categories in the matrix. In addition to Kraljic’s strategic recommendations, different kinds of strategic responses were identified and described for each category. A dichotomy was identified between: - strategies to hold a position (1) and - strategies to move to another position (2). At the right side of the matrix (in the bottleneck and the strategic areas) movements are pursued in order to reduce a high level of supply risk. In terms of the matrix, this means moving to the left. Non-critical items are preferably moved upwards, exceptionally leverage positions are exchanged for strategic positions. These are the most common movements within the matrix.

196
From the buyer’s perspective a new classification of partnerships was found, related to the portfolio matrix: - partners of convenience, located in the leverage quadrant, where relationships are dominated by the buyer; - strategic partnerships, located somewhere in the middle of the leverage and strategic quadrant, further characterized as balanced relationships based on a high level of mutual dependence; - locked-in ‘partnerships’, located at the right side of the strategic quadrant, where relationships are dominated by suppliers, who are indispensable for the buyer. Based on the case studies, a conceptual model of strategic directions is presented, providing insights and overview of the main strategic directions for the categories in the matrix. Variables and relations in this model will be quantified and tested with the data that will be gathered with the survey.

197
6 The survey
This research project includes a literature study, case studies and a survey. The literature study has answered questions regarding the various portfolio models in purchasing, identifying differences and similarities. The case studies have addressed questions and problems with respect to the actual use of portfolio models by experienced purchasing professionals, referring to important issues such as the measurement and weighting of factors and the selection of portfolio-based purchasing strategies. In this chapter we will report on the design and the results of a survey among purchasing professionals.
6.1 Introduction and objectives
To a large extent, the survey is aimed at answering the second, the fourth and the fifth major research questions: Which factors would explain the utilization of the purchasing portfolio analysis? and Under which conditions are the various portfolio-based strategies pursued in purchasing management? and What is the role of power and dependence in the Kraljic approach? Based on our analysis of literature, a use model was developed, identifying factors that would explain the use of the portfolio analysis. Also the model includes the direct accountable impact of portfolio use. The sub-questions aim to quantify the relationships with the central use-variable. In addition other sub-questions refer to the number of users and differences between users and non-users. In the case studies we have identified what kind of purchasing strategies can be based on a portfolio approach. Tentative insights are gathered with respect to conditions and circumstances, leading to certain strategic choices. The possibilities for selecting purchasing strategies are obviously limited by external conditions. The survey is aimed at identifying and quantifying these conditions which will result in additional insights for understanding and explaining the selected strategies in

198
different situations. A specific set of conditions will be referred to as a relationship-dependence profile, which will include the determinants of buyer’s dependence and the determinants of supplier’s dependence. In addition, other factors will complete the profiles. Based on literature and case studies we have developed: - a conceptual model for the use of a purchasing portfolio approach; - a conceptual model of strategic directions for all categories in the Kraljic matrix; - a conceptual model of determinants of buyer’s and supplier’s dependence. This survey is intended to: - measure variables and quantify the relationships between variables in the conceptual models, - test the hypotheses that have been formulated.
6.2 The conceptual models
The use-model identifies variables in order to explain the use of purchasing portfolio analysis in companies (see chapter 3). Based on the literature study, five groups of variables have been identified as independent explanatory variables: company size, share of purchasing, position of the purchasing department, purchasing’s professionalism and orientation of purchasing. The position, the professionalism and the orientation of purchasing are constructs, which will be elaborated in section 6.6, which deals with issues of measurement and operationalization. In chapter 3 we have formulated a set of hypotheses for the (positive and negative) relationships between the explanatory variables and portfolio use. Subsequently, the use is expected to have a positive impact on the understanding of the overall purchasing situation in companies, and on the development of differentiated purchasing strategies. These hypotheses will be tested too with the data of the survey. The conceptual model of strategic directions is based on a comparative analysis of the case studies. Altogether, 9 scenarios are described, identifying different strategic directions (actions), and the circumstances that accompany these purchasing strategies (see Appendix F: “Elaboration and overview of the 9 scenarios”). A dichotomy of strategic directions was found, distinguishing two different kinds of strategic directions for each category: 1. actions to pursue other positions in the matrix, and 2. actions to hold the same positions in the matrix. Holding on to a position implicitly means that current circumstances are taken for granted, or have to be taken for granted. We have observed that a position in the matrix can be accepted for different reasons, sometimes referring to a positive, sometimes to a negative choice. A position might be preferred because a firm is convinced that it is the best position for a certain item. In other cases a position might be accepted, because there

A Portfolio Approach to the Development of Differentiated Purchasing Strategies
199
are no realistic possibilities for change. The first type of strategies are of a more active, radical nature. When possible and desirable, other positions in the matrix are identified and pursued. The dichotomy for each category is elaborated in a limited set of purchase situations. Each scenario contains a description of: - the selected portfolio-based purchasing strategy, - Kraljic’s dimensions (profit impact and supply risk), and - additional specific circumstances for the selection of the purchasing strategy. This means that in the conceptual model, the selection of a (portfolio-based) purchasing strategy is connected to these factors. Therefore, each purchasing situation (scenario) combines a (portfolio-based) purchasing strategy, a position in the matrix (values on the Kraljic dimensions, ‘treatment variables’), and a set of specific circumstances. In this study we will introduce and use the concept of relationship-dependence profile, as an instrument to measure the values and impact of conditions that accompany a scenario. A relationship-dependence profile should include a limited number of key factors appropriate to characterize different types of buyer-supplier relationships. Based on former literature study and based on the results of the case studies, four main groups are set to form a relationships-dependence profile: - determinants of buyer’s dependence, - determinants of supplier’s dependence, - relationship characteristics: trust and commitment, - the nature of specifications (product customization, possibilities for standardization). A combination of these factors will be addressed to as a relationship-dependence profile. Obviously, different profiles are expected in different buyer-supplier exchange relationships. Purchasing strategies are considered as responses to different situations. From the buyer’s perspective the recurring question is: ‘what kind of relationship is possible and/or desirable with a specific supplier?’ In the upper half of the matrix, based on the case studies, a clear distinction can be made between: - partners of convenience, located in the leverage quadrant where relationships are dominated by the buyer; - strategic partnerships, located somewhere in the middle of the leverage and strategic quadrant, further characterized as balanced relationships based on a high level of mutual dependence; - locked-in ‘partnerships’, located at the right side of the strategic quadrant, where relationships are dominated by suppliers, who are indispensable for the buyer. In the lower half of the matrix strategic responses are related to the nature of specifications. Based on a literature study, it is expected that the occurrence of different types of buyer-supplier relationships can be explained by some key constructs and variables. Besides factors relating to buyer’s and supplier’s dependence, the survey includes

200
operationalizations of product customization, possibilities for standardization, trust and commitment that are connected to relationships with suppliers. The prominent role of power and dependence in buyer-supplier relationships has directed the literature study to the determinants of organizational dependence. Analysis of literature has resulted in a tentative model of buyer’s and supplier’s dependence. This model is presented to all respondents in the case studies. The reactions to the tentative model are incorporated in the modified model of buyer’s and supplier’s dependence. To gain more insights in the selection of portfolio-based strategies, the scenarios will be further analyzed and described by the quantification of conditions in the profiles. Quantification of buyer’s and supplier’s dependence for the different purchasing situations (scenarios) allows for: - the identification of specific dependence profiles, describing and explaining differences between strategic choices and circumstances in the portfolio matrix; - the explanation of buyer’s dependence and the explanation of supplier’s dependence, in other words the testing of hypotheses with respect to the impact of the determinants on the buyer’s and the supplier’s dependence.
6.3 Relationship-dependence profiles: a condition-seeking research strategy
Consequentially we have identified two different types of portfolio-based strategies in each quadrant of the matrix; in case of strategic items we found three strategic responses. It is possible to conceptually explain the selection of a strategy in a quadrant by pointing at differences in corresponding relationship-dependence profiles. Each portfolio-based strategy constitutes a unique fingerprint that is expected to be significantly different from all other profiles, but most importantly, from the profile that belongs to the other strategy in the same matrix category. Otherwise, the preference for strategy A to strategy B in a quadrant can not be attributed to the explanatory variables. This means that a set of hypotheses can be formulated with respect to the different relationship-dependence profiles. The hypotheses focus on the question whether or not there are significant differences between two relationship-dependence profiles in the same category. The found differences will be used for a better understanding of the selection of different strategies under different conditions in the same quadrant.
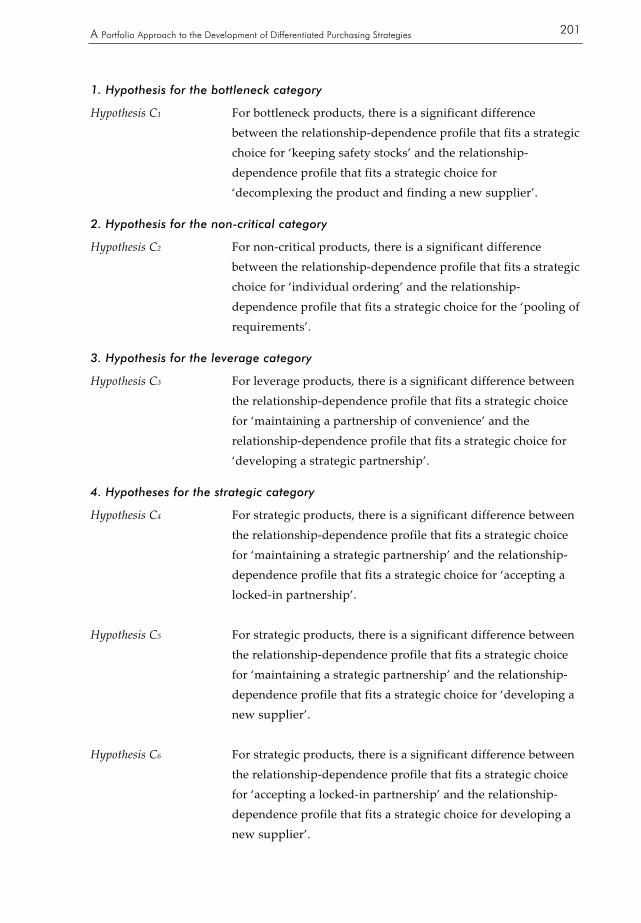
A Portfolio Approach to the Development of Differentiated Purchasing Strategies
201
1. Hypothesis for the bottleneck category
Hypothesis C1 For bottleneck products, there is a significant difference between the relationship-dependence profile that fits a strategic choice for ‘keeping safety stocks’ and the relationship-dependence profile that fits a strategic choice for ‘decomplexing the product and finding a new supplier’.
2. Hypothesis for the non-critical category
Hypothesis C2 For non-critical products, there is a significant difference between the relationship-dependence profile that fits a strategic choice for ‘individual ordering’ and the relationship-dependence profile that fits a strategic choice for the ‘pooling of requirements’.
3. Hypothesis for the leverage category
Hypothesis C3 For leverage products, there is a significant difference between the relationship-dependence profile that fits a strategic choice for ‘maintaining a partnership of convenience’ and the relationship-dependence profile that fits a strategic choice for ‘developing a strategic partnership’.
4. Hypotheses for the strategic category
Hypothesis C4 For strategic products, there is a significant difference between the relationship-dependence profile that fits a strategic choice for ‘maintaining a strategic partnership’ and the relationship-dependence profile that fits a strategic choice for ‘accepting a locked-in partnership’.
Hypothesis C5 For strategic products, there is a significant difference between
the relationship-dependence profile that fits a strategic choice for ‘maintaining a strategic partnership’ and the relationship-dependence profile that fits a strategic choice for ‘developing a new supplier’.
Hypothesis C6 For strategic products, there is a significant difference between
the relationship-dependence profile that fits a strategic choice for ‘accepting a locked-in partnership’ and the relationship-dependence profile that fits a strategic choice for developing a new supplier’.

202
In addition to the testing of the 6 hypotheses C1 to C6 ,we will take a closer look at the composition of the relationship-dependence profiles. The quantification of variables allows for analyzing the differences in more detail, on a lower level of abstraction, namely the level of the dependent variables. Pairwise comparisons of variables between profiles will be used in our search for conditions under which the various purchasing strategies are selected. With this we propose to discover which of the many conditions are indeed necessary or sufficient to produce a certain result, namely the selection of a certain portfolio-based strategy. The aim of this part of our study is therefore not to answer questions like “Does strategy Si occur?” or “How often is strategy Si being selected?” In contrast, we follow a condition-seeking research strategy which answers questions of the form “Under which conditions strategy Si will be selected?” The results are of the form “Strategy Si is selected if conditions C1, C2 and C3 are met”. In other words, the answers must specify conditions under which a given result is obtained (Greenwald et al., 1986). In section 6.5 we will elaborate on the design of the study and the implications of the data analysis.
6.4 Population and sample
The population for the sample consists of Dutch manufacturing companies. The study is limited to industry for several reasons. In most companies the share of purchasing is relatively high, putting purchasing and supply management on the strategic agenda. Purchasing is always important, purchasing strategies are likely to be developed, and purchasing professionals are likely to be knowledgeable about the selected strategies and reasons accompanying those strategies. Furthermore, limiting the study to industrial companies increases the chance of gathering comparable data that can be combined, and the chance of finding significant relations between variables. The target respondents for the survey are purchasing professionals within manufacturing companies. Purchasing professionals are in the best position to answer the questions of this survey, because of their experience, expertise and insights with respect to the use of purchasing portfolio models and the development of differentiated purchasing strategies. Questionnaires are administered to 1,153 individuals, mostly purchasing managers, from companies who are member of the Dutch Association of Purchasing Management (NEVI). The companies are all manufacturing companies. Manufacturing can be defined as the physical or chemical transformation of materials or components into new products, in accordance with the United Nations Classifications Registry (http://esa.un.org/unsd/cr/registry/regcs.asp?Cl=2&Lg=1&Co=D). Excluded are companies that are in the business of agriculture, construction, wholesale,

A Portfolio Approach to the Development of Differentiated Purchasing Strategies
203
retail, and (public and private) services. The NEVI-industry database consists of the following categories: - electro technical industry - metal products industry (metallurgical) - chemical industry - machine industry - wood, furniture and paper industry - metal basic industry - means of transport industry - building materials, glass and pottery - instrument or optical industry - textile and clothing industry - graphic industry - petroleum and coal processing industry - other industry.
6.5 Design and procedure
In accordance with the research objectives, a written questionnaire has been used, gathering information from a relatively large number of respondents. The survey procedure included four mailings, in chronological order: 1. the pilot study (pre-test): the questionnaire has been sent to a limited number of respondents, 2. the initial mail-out: administering the actual survey to the selected respondents (sample), 3. the follow-up mailing: a replacement questionnaire has been sent to all non-respondents, 4. an electronic mailing: a replacement questionnaire has been sent to all non-respondents with known e-mail addresses. Different sources of knowledge and expertise have been used to develop the questionnaire. Principally, the questionnaire is aimed at measuring the variables and relationships in the conceptual models. These models are based on the insights from the literature study and the case studies. Furthermore, the construction of items is largely based on literature review (operationalization). This has resulted in a first draft questionnaire, that was discussed with a focus group of academics. Finally, the modified questionnaire was pre-tested by a small number of individuals from four industrial companies (GTI, EMTEC, DSM, and Akzo Nobel). The pre-test group were asked to review the survey primarily for the clarification of scenarios, the questions and the time required to complete the survey. Pre-testing provided the opportunity to improve the questionnaire, and to enhance its reliability and validity.
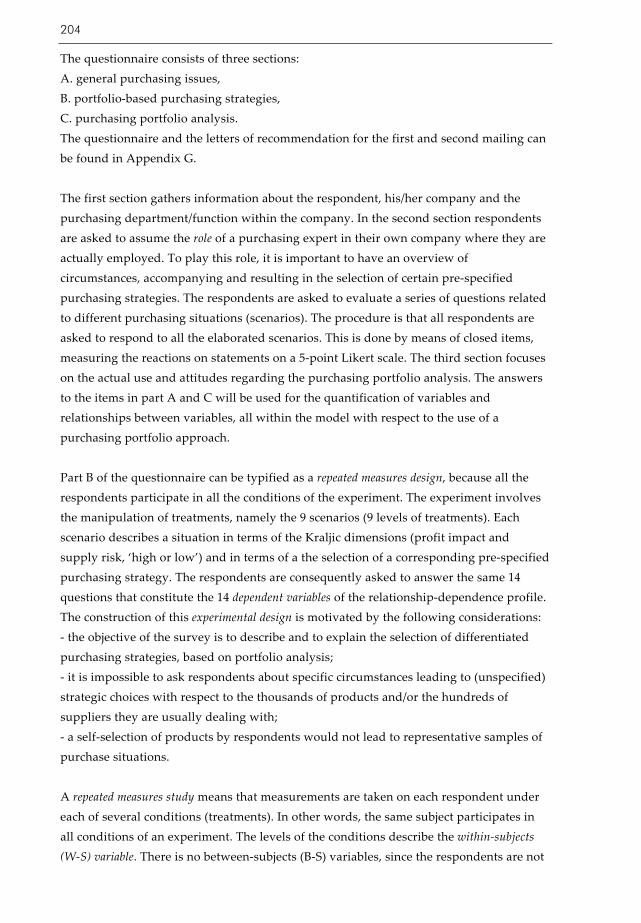
204
The questionnaire consists of three sections: A. general purchasing issues, B. portfolio-based purchasing strategies, C. purchasing portfolio analysis. The questionnaire and the letters of recommendation for the first and second mailing can be found in Appendix G. The first section gathers information about the respondent, his/her company and the purchasing department/function within the company. In the second section respondents are asked to assume the role of a purchasing expert in their own company where they are actually employed. To play this role, it is important to have an overview of circumstances, accompanying and resulting in the selection of certain pre-specified purchasing strategies. The respondents are asked to evaluate a series of questions related to different purchasing situations (scenarios). The procedure is that all respondents are asked to respond to all the elaborated scenarios. This is done by means of closed items, measuring the reactions on statements on a 5-point Likert scale. The third section focuses on the actual use and attitudes regarding the purchasing portfolio analysis. The answers to the items in part A and C will be used for the quantification of variables and relationships between variables, all within the model with respect to the use of a purchasing portfolio approach. Part B of the questionnaire can be typified as a repeated measures design, because all the respondents participate in all the conditions of the experiment. The experiment involves the manipulation of treatments, namely the 9 scenarios (9 levels of treatments). Each scenario describes a situation in terms of the Kraljic dimensions (profit impact and supply risk, ‘high or low’) and in terms of a the selection of a corresponding pre-specified purchasing strategy. The respondents are consequently asked to answer the same 14 questions that constitute the 14 dependent variables of the relationship-dependence profile. The construction of this experimental design is motivated by the following considerations: - the objective of the survey is to describe and to explain the selection of differentiated purchasing strategies, based on portfolio analysis; - it is impossible to ask respondents about specific circumstances leading to (unspecified) strategic choices with respect to the thousands of products and/or the hundreds of suppliers they are usually dealing with; - a self-selection of products by respondents would not lead to representative samples of purchase situations. A repeated measures study means that measurements are taken on each respondent under each of several conditions (treatments). In other words, the same subject participates in all conditions of an experiment. The levels of the conditions describe the within-subjects (W-S) variable. There is no between-subjects (B-S) variables, since the respondents are not

A Portfolio Approach to the Development of Differentiated Purchasing Strategies
205
classified into groups. The design can be further characterized by the fact that there are multiple dependent variables. A repeated measures design has a distinct advantage over other experimental designs. The main reason for within-group variability is that there are individual differences among the respondents. Even though the subjects receive the same treatment, their scores on the dependent variable(s) can differ considerably, because of differences on relevant background variables, such as I.Q., education, motivation, etc. A common solution in experimental designs is through block on such variables, which means that subjects are blocked into (more) homogenous groups. In a repeated measures design, blocking is carried to its extreme, by blocking on each subject. Variability among the subjects to individual differences is removed from the error term, which makes the design more powerful than randomized designs, where subjects are randomly assigned to different treatments (Stevens, 2001). However, there is a disadvantage. The accuracy of the F-test depends upon the assumption that scores in different conditions are independent. Obviously, when repeated measures are taken, the independence-of-observations assumption is violated. The scores taken under different scenarios are likely to be related, because they come from the same respondents. A conventional F-test will lack accuracy and an additional assumption is required: the assumption of sphericity, which states that the level of dependence between experimental conditions is (roughly) equal. The correlation between scores on the dependent variable in our study for scenario #1 and #2 should be about the same as the correlation between scenario #5 and #6, or #7 and #8, etc. Beforehand, this will be very unlikely. If the assumption of sphericity is violated, appropriate measures are necessary. Tabachnick and Fidell (2001) suggest the use of one of the significance tests, which are adjusted for violation of the assumption, such as Greenhouse-Geisser (G-G) or Huynh-Feldt (H-F) with adjusted significance levels. Significance tests for repeated measures and (M)ANOVA are based on the assumptions of multivariate normality. Normality requires that the sampling distributions of means of the various dependent variables at each level of the W-S variables are normally distributed (Weinfurt, 2000). In our study normality is not likely to produce problems. Generally speaking, repeated measures analysis is considered robust to violations of the normality assumptions (Stevens, 2001). This means that the Type I and Type II error rates for the F test are significantly distorted only when the distribution of the data is an extreme deviation from normal (Weinfurt, 2000). Moreover, the central limit theorem suggests that the sampling distribution of means approaches normality (even when raw scores do not) in case of large samples (Tabachnick and Fidell, 2001). As will be elaborated later, the number of cases in our study exceeds the number of ‘20 cases in the smallest’ cells, which should ensure robustness.

206
By comparing two profiles of corresponding scenarios in the same quadrant, we aim to search for statistically significant differences between profiles. However, a series of independent t-tests will not do, because we are dealing with a repeated measures design. The option Estimated Marginal Means (EMMEANS) will be used for the multiple comparisons within the GLM-repeated measures SPSS-procedure. As with the overall F test for a W-S effect, post hoc analyses are vulnerable to the violation of the sphericity assumption. When sphericity is violated, the Bonferroni method is considered to be generally the most robust of the available techniques especially in terms of power and control of the Type I error rate (Field, 2000). By applying a Boneferroni correction to each test, one controls the family wise Type I error (Tabachnick and Fidell, 2001). In our study we will use the Bonferroni adjustment when testing for differences of variables between profiles. In his comment on multiple comparison procedures with repeated measures, Howell (2002) stresses that the test statistic itself is not the issue, because the basic underlying statistic is the t-test for the different procedures. The different tests, such as a standard contrast, a Bonferroni test, a Tukey test, and a Scheffé test, all result in the same t-value. The only difference is the critical value required for significance. The Bonferroni test uses a t-test, but then evaluates that t at alpha = .05/c, where c is the number of comparisons and .05 is the desired alpha. When dealing with 84 comparisons (6 pairs of scenarios x 14 dependent variables), the critical p-value has to be adjusted to: .05/84 = .0006 Because of the relatively large number of comparison, the correction in our study will be rather severe. If we could select a limited number of comparisons on the basis of theory, the correction would obviously have been less severe. However, we have to use post hoc procedures, including a large number of multiple comparisons, since we do not have a set of a priori comparisons. Therefore, an explorative investigation will be conducted, in search for statistical differences between profiles. The found differences will be traced back to the variables that constitute a profile (e.g. factors relating to dependence and other conditions).
6.6 Measurement and operationalization
The operationalization of a concept translates the conceptual definition into measurable terms. An operationalization specifies what the researcher must do in order to measure the construct concerned. In this study, for some constructs it is not very complicated to define and measure them (for instance ‘purchasing share’). However, most of the constructs in the conceptual models are abstractions, posing researchers for more difficult choices and dilemma’s. In those cases, special attention is paid to the insights and operationalizations that are used in other empirical and conceptual studies.
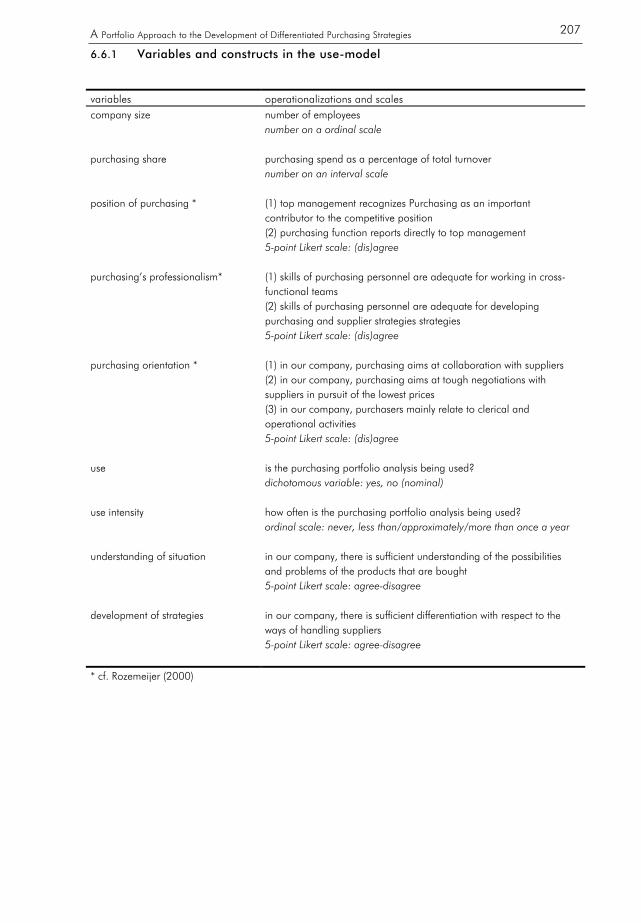
A Portfolio Approach to the Development of Differentiated Purchasing Strategies
207
6.6.1 Variables and constructs in the use-model
variables operationalizations and scales company size number of employees
number on a ordinal scale
purchasing share purchasing spend as a percentage of total turnover number on an interval scale
position of purchasing * (1) top management recognizes Purchasing as an important contributor to the competitive position (2) purchasing function reports directly to top management 5-point Likert scale: (dis)agree
purchasing’s professionalism* (1) skills of purchasing personnel are adequate for working in cross-functional teams (2) skills of purchasing personnel are adequate for developing purchasing and supplier strategies strategies 5-point Likert scale: (dis)agree
purchasing orientation * (1) in our company, purchasing aims at collaboration with suppliers (2) in our company, purchasing aims at tough negotiations with suppliers in pursuit of the lowest prices (3) in our company, purchasers mainly relate to clerical and operational activities 5-point Likert scale: (dis)agree
use is the purchasing portfolio analysis being used? dichotomous variable: yes, no (nominal)
use intensity how often is the purchasing portfolio analysis being used? ordinal scale: never, less than/approximately/more than once a year
understanding of situation in our company, there is sufficient understanding of the possibilities and problems of the products that are bought 5-point Likert scale: agree-disagree
development of strategies in our company, there is sufficient differentiation with respect to the ways of handling suppliers 5-point Likert scale: agree-disagree
* cf. Rozemeijer (2000)

208
Rozemeijer (2000: 170, 232-233) identified ‘position of purchasing’, ‘purchasing’s professionalism’, and ‘purchasing orientation’ as the main factors, constituting the construct variable ‘purchasing maturity’. His study indicated additional factors to explain a company’s purchasing maturity. However, these factors are not included in our conceptualization of ‘maturity’, because they are tailored to the specific objectives of Rozemeijer’s study: creating corporate advantage in purchasing. The factors refer to differences between purchasing departments of fairly autonomous business units.
6.6.2 Variables and constructs relating to buyer’s and supplier’s dependence
Preparing the survey, an extensive literature search is conducted to the measurement of ‘organizational dependence’. Points of interest and study were: - the perspective (‘whose dependence?’); - measurement method: directly (by means of a single item or a proxy measure) or indirectly (by means of multiple items); - measuring perceptions or other approaches; - the formulation of questions and items; - the number of items (in case of multiple items) - the scales (open/closed items, Likert scales, 5- or 7 point scales). The results are summarized in the appendix H, “Measurement and operationalizations of organizational dependence”. The main conclusions are: - there is much diversity in perspective; - ‘dependence’ as a construct is being measured indirectly (via multiple items and questions) and directly (by means of a single items or by means of a proxy measure); - all studies employ (subjective) perceptions from the perspective of one trading partner; - in most studies ‘organizational dependence’ is used as an explanatory variable, rather than a variable that is to be explained by a set of independent variables; - ‘vulnerability’ and ‘replaceability’ seem to be recurring terms, looking for the core of the dependence-construct. How important is a trading partner to the other? How important are the ‘resources’ involved? Are there alternative buyers/suppliers? What are the consequences of terminating a relationships (switching cost)? In the literature study we have used some basic thoughts of the resource-dependence theory. However, when implemented in a purchasing context, we have deviated from the original work. Pfeffer and Salancik (1978: 51) made a firm statement with respect to the relationship between the three acknowledged dimensions of dependence: “A resource that is not important to the organization cannot create a situation of dependence, regardless of how concentrated control over the resource is. Also, regardless of how important the resource is, unless it is controlled by relatively few organizations, the focal organization will not be particularly dependent on any of them.” In their view every dimension constitutes a necessary, but by itself insufficient condition for producing

A Portfolio Approach to the Development of Differentiated Purchasing Strategies
209
‘dependence’, and when one is absent, an organization will be not be ‘particularly dependent’. We have chosen for a somewhat different approach. We have considered dependence not as a dichotomous variable (‘dependent’ versus ‘independent’), but as a continuous variable, allowing for different degrees of dependence. Furthermore, we have not proposed an operationalization of the ‘dependence’-concept by measuring the determinants of that dependence. Some argue that it seems good to view dependence as a multidimensional construct, allowing for closer examination of each of its determinants (Heide and John, 1988). A reason would be that the different aspects of dependence do not necessarily covary, or have the same effect on outcome variables. To grasp the overall meaning and implication of ‘dependence’, many researchers propose and prefer a multiple-items construct, capturing all relevant dimensions. The degree of dependence is usually assessed by combining values of relevant items/variables into one constructed item. This seems a reasonable approach, since dependence is by nature determined by several factors and variables, and it is consistent with a general feeling that it is possible to consider ‘degrees of dependence’. Moreover, it leaves the possibility open for a compensatory decision rule: a low score on a certain variable can be compensated by a high score on another variable. However reasonable this approach might be, in our study we have selected another approach, conform to Noordewier et al. (1990) and Berger et al. (1995), for example. In our study we propose to measure ‘dependence’ as a single item construct. This means that respondents are directly asked to assess the buyer’s dependence on a supplier and the supplier’s dependence on the buyer. In addition, determinants of dependence are measured in a direct way. The results of the case studies indicated that expert respondents do not have any problems in assessing dependence, when asked directly. For purchasing professionals ‘dependence’ is a concept that is easily understood and that plays a prominent role in the development of purchasing strategies. Based on these empirical experiences, we do not expect to encounter any major validity problems to this respect. Purchasing professionals are able to assess dependence-situations. However, to avoid related validity problems, respondents will indicate the level to which they recognize different (dependence) situations. The determinants of dependence are based on literature study and interviews in the case studies. The different single dependence-items in other studies coincide to a large extent with the determinants in our study. By measuring and using the determinants separately, it is possible to find out which of the variables has a significant influence on buyer’s dependence and supplier’s dependence. In addition, these various impacts will be calculated for the 9 different scenarios, allowing for an in-depth analysis of organizational dependence. The results will constitute corresponding dependence profiles that are related to

210
the portfolio-based purchasing strategies, which matches the core of the overall research project. If a multiple-item approach had been selected, important information would have been lost. variables operationalizations and scales buyer’s dependence * the buyer is dependent on the supplier
logistical indispensability reliability of delivery of the product is important for an uninterrupted flow of
manufacturing
need for supplier’s technological expertise **
the buyer needs the technological expertise of the supplier
alternative suppliers the product can be bought from other suppliers
switching costs for buyer *** replacing the supplier, the buyer will incur high switching cost
supplier’s dependence * the supplier is dependent on the buyer
financial magnitude **** the buyer is an important customer for the supplier, considering the volume of trade
need for buyer’s technological expertise **
the supplier needs the technological expertise of the buyer
alternative buyers the product of the supplier can be sold to other customers
switching costs for supplier *** the supplier will incur high switching cost, replacing the buyer by other buyers
All variables are measured on a 5-point Likert scale (agree - disagree). * cf. Noordewier, John and Nevin (1990) and Berger, Noorderhaven and Nooteboom (1995) ** cf. ‘need for supplier’s skills’, as used by Campbell and Cunningham (1983) and ‘knowledge
exchange’, as used by Berger, Noorderhaven and Nooteboom (1995) *** cf. ‘difficulty and cost in replacing a partner’, as used by El-Ansary and Stern (1972), Etgar (1976),
Brown, Lusch and Muehling (1983), Heide and John (1988), Sriram, Krapfel and Spekman (1992), Lusch and Brown (1996), Dant and Gundlach (1998)
**** cf ‘share of supplier’s output taken by the buyer’, as used by Campbell and Cunningham (1983); in contrast to Kraljic’s conceptualization, ‘financial magnitude’ should refer to the supplier’s position, not the buyer’s position, because the variable is considered here as a determinant of supplier’s dependence
6.6.3 Variables and constructs relating to other conditions
We have stated earlier that a number of factors is considered to be important, explaining differences in the selection of purchasing strategies. We have identified ‘product customization’, ‘commitment’ and ‘trust’ as key constructs, explaining the selection of different purchasing strategies. Product customization indicates the level of adaptation that is made by the supplier. Trust is seen as a prerequisite for the development of a fruitful relationship. Successful relationships require commitment and trust. Literature on

A Portfolio Approach to the Development of Differentiated Purchasing Strategies
211
partnership, cooperation and buyer-supplier relationships reports extensively on trust and commitment. Therefore, it is possible to use and adopt existing conceptualizations and operationalizations of constructs. Product customization refers to adaptations that are especially made by a supplier to serve the needs of a specific, important customer (Hallén et al., 1991). This product specification dimension is frequently used in the automotive industry, where a limited number of suppliers deliver highly customized products (Dyer, 1996; Dyer and Chu, 2000). The level of product customization indicates the supplier’s willingness to invest in the relationship (Hartmann et al., 2001). On the other hand it shows the willingness or the need of the buying company to rely on a single source (Morgan and Hunt, 1994). We operationalize product customization as the level to which product specifications are tailored to the specific needs and wants of the buyer. Commitment and trust have been identified as essential prerequisites for building and developing customer-supplier relationships (De Ruyter et al., 2001). Successful relationships require commitment and trust (Morgan and Hunt, 1994). The concept of trust is central in understanding the development of interorganizational relationships. Trust is generally considered as a necessary ingredient for the development of long-term buyer-supplier relationships (Ganesan, 1994). Research suggests that trust in supplier-buyer relationships is an important source of competitive advantage. Dyer and Chu (2000) concluded that trust (1) lowers transaction costs (Sako, 1992; Barney and Hansen, 1994; Dyer, 1996), (2) leads to superior information sharing routines, and (3) facilitates investments in relationship assets (Asanuma, 1989; Dyer, 1996). Zaheer et al. (1998) found that trust is an important determinant of supplier performance, examining trust from both buyer and supplier perspective. There is much support for the importance of trust in building and sustaining buyer-supplier relationships. At the same time, trust is a diffuse concept, defined in different ways (Schary and Skjøtt-Larsen, 2001). Blomqvist (1997: 271) points at “the many faces of trust”, referring to the various dimensions and levels of trust, and to the many disciplines that incorporate the concept of trust (social psychology, philosophy, economics, contract law, and marketing). Blois (1999) examined this lack of clarity in the conceptualization of trust. Trust can be seen as a necessary condition for accepting high levels of dependence. Zand (1972: 230) defined ‘trust’ as the conscious regulation of one’s dependence on another: “ (…) one who does not trust will try to minimize his dependence on others.” Ganesan (1994) predicted that firms with high dependence will seek constantly to escape from this dependence. However, with trust, things will be different. Trust is necessary for the perception of a fair division of the pie of resources in the future. The need for trust will be high in situations that are perceived as risky. When trust is high, monitoring costs go down, the number of safeguards that need to be put in place to prevent opportunism can be reduced, and governance becomes less of a salient issue (Barringer and Harrison,

212
2000). The development of trust over time is an area of ongoing interest and research (Nooteboom et al., 1997). The connotations of trust and dependability may seem quite congruent. However, trust and dependability are not interchangeable, because they do not have identical meanings. As Kumar (1996) appropriately remarked, a partner that promises to punish and always follows through, is dependable, but is not a company in which one places trust. Trust refers to the willingness to rely on exchange partners in whom one has confidence (Moorman et al. 1992). Basically, the most important aspect of trust is a positive belief, an affective sentiment about an exchange partner. Morgan and Hunt (1994: 23) conceptualized trust as existing when one party has confidence in an exchange partner’s reliability and integrity. This definition parallels that of Anderson and Narus (1990), Moorman et al. (1993) and Ganesan (1994). Some include trust as risk-taking behavior or a willingness to engage in such behavior (e.g. McAllister, 1995). To be clear, we have limited the conceptualization of ‘trust’ to a cognitive expectation, an affective sentiment, and we have excluded behavioral intentions and trusting behaviors. Trust results from the belief that the other party is reliable and has high integrity. Sako (1992) underscored that trust refers to an expectation that a trading partner behaves in a predictable and acceptable manner. Since ‘predictability’ exists for different reasons, different types of trust should be distinguished. In fact, we have identified two different dimensions of trust: ‘reliability’ and ‘integrity’. Reliability and credibility refer to the extent to which an exchange partner has the required expertise to perform the job effectively (Ganesan, 1994). This dimension focuses on the expectancy that the partner’s word or statement can be relied on (Doney and Cannon, 1997). This type of trust is referred to as competence trust: the ability of an exchange partner to perform according to agreements (Nooteboom, 1996). Competence implies that a partner has the required technical capabilities, skills and know-how (Blomqvist, 1997). Another type of trust is goodwill trust, which refers to the integrity and benevolence of parties. Some propose that the true meaning of trust implies a ‘leap of faith’: parties believe that each is interested in the other’s welfare and that neither will act without considering the action’s impact on the other (Kumar, 1996: 95). Goodwill trust reflects the belief that one’s partner is interested in the other’s welfare and will not take actions which will negatively impact the firm (Anderson and Narus, 1990; Geyskens et al., 1996). A similar conception is confidence trust, which refers to the confidence that the other party in the exchange relationship will not exploit its vulnerabilities (Dyer and Chu, 2000). Goodwill or confidence trust is not based upon contracts or sanctions, but rather on non-contractual mechanisms. To conclude, we have operationalized goodwill trust as the belief that the supplier will not misuse his position and actually takes the buyer’s interests into consideration. The willingness to accept dependence will be higher in case of goodwill trust, than in case of competence trust. The contractual trust referred to by Sako (1992) has been omitted. In conformity with Blomqvist (1997), contract is seen as an alternative or additional means of coordination, but not as another form or dimension of trust.

A Portfolio Approach to the Development of Differentiated Purchasing Strategies
213
Commitment too has emerged in literature as a critically important element in business relationships. Moorman et al. (1992: 316) defined commitment as an enduring desire to maintain a valued relationship. This corresponds with the belief that relationship commitment only exists when the relationship is considered important (Morgan and Hunt, 1994). Although different conceptualizations exist, commitment has typically been defined as the intention of an exchange partner to continue a relationship (Anderson and Weitz, 1989; Dwyer et al., 1987).Geyskens et al. (1996) underscored that different motivations can underlie this intention, and thus various types of commitment. Of these, affective commitment and calculative commitment appear most frequently and also seem to be the most relevant (cf. Mathieu and Zajac, 1990; Kumar et al., 1994; Geyskens et al., 1996; De Ruyter et al., 2001). An affective committed partner desires to continue its relationship because it likes the partner and enjoys the partnership (Geyskens et al., 1996). Affective commitment expresses the extent to which a party likes to maintain a relationship with another party. This kind of commitment is based on a general positive feeling towards the exchange partner. In this study we conceptualize ‘affective commitment’ according to De Ruyter et al. (2001: 286) as the level to which “it is pleasant working with our supplier, that is why we stay with our supplier”. Calculative commitment, in contrast, is the extent to which an exchange partner perceives the need to maintain a relationship. The relationship results from a ‘cold’ calculation of costs and benefits (Geyskens et al., 1996). Therefore, calculative commitment refers to a negative motivation for continuing a relationship. In line with De Rutyer et al. (2001: 286) we conceptualize ‘calculative commitment’ as the level to which “there is just too much time, energy, and expense involved in terminating our relationship with this supplier.”
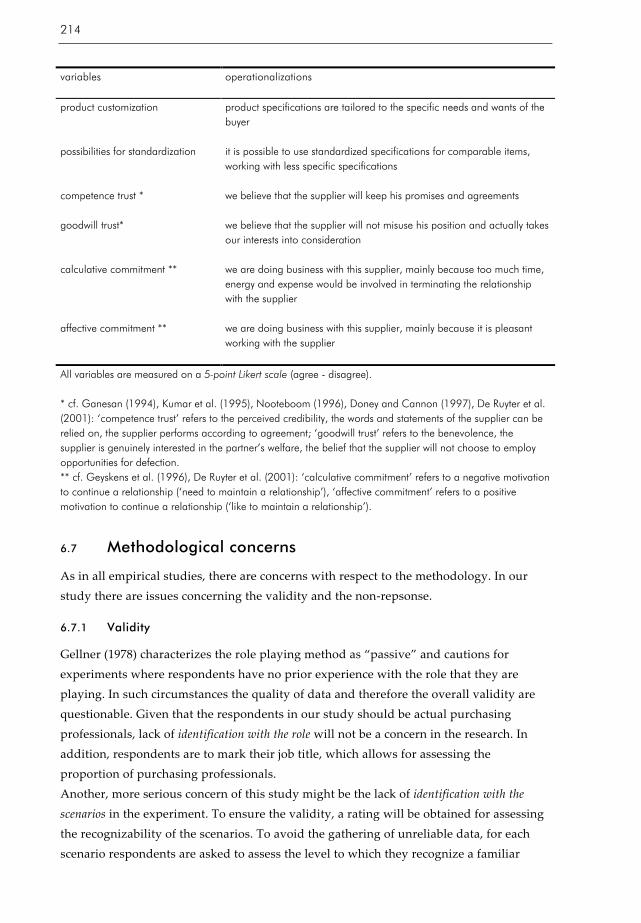
214
variables
operationalizations
product customization product specifications are tailored to the specific needs and wants of the buyer
possibilities for standardization it is possible to use standardized specifications for comparable items, working with less specific specifications
competence trust * we believe that the supplier will keep his promises and agreements
goodwill trust* we believe that the supplier will not misuse his position and actually takes our interests into consideration
calculative commitment ** we are doing business with this supplier, mainly because too much time, energy and expense would be involved in terminating the relationship with the supplier
affective commitment ** we are doing business with this supplier, mainly because it is pleasant working with the supplier
All variables are measured on a 5-point Likert scale (agree - disagree). * cf. Ganesan (1994), Kumar et al. (1995), Nooteboom (1996), Doney and Cannon (1997), De Ruyter et al. (2001): ‘competence trust’ refers to the perceived credibility, the words and statements of the supplier can be relied on, the supplier performs according to agreement; ‘goodwill trust’ refers to the benevolence, the supplier is genuinely interested in the partner’s welfare, the belief that the supplier will not choose to employ opportunities for defection. ** cf. Geyskens et al. (1996), De Ruyter et al. (2001): ‘calculative commitment’ refers to a negative motivation to continue a relationship (‘need to maintain a relationship’), ‘affective commitment’ refers to a positive motivation to continue a relationship (‘like to maintain a relationship’).
6.7 Methodological concerns
As in all empirical studies, there are concerns with respect to the methodology. In our study there are issues concerning the validity and the non-repsonse.
6.7.1 Validity
Gellner (1978) characterizes the role playing method as “passive” and cautions for experiments where respondents have no prior experience with the role that they are playing. In such circumstances the quality of data and therefore the overall validity are questionable. Given that the respondents in our study should be actual purchasing professionals, lack of identification with the role will not be a concern in the research. In addition, respondents are to mark their job title, which allows for assessing the proportion of purchasing professionals. Another, more serious concern of this study might be the lack of identification with the scenarios in the experiment. To ensure the validity, a rating will be obtained for assessing the recognizability of the scenarios. To avoid the gathering of unreliable data, for each scenario respondents are asked to assess the level to which they recognize a familiar
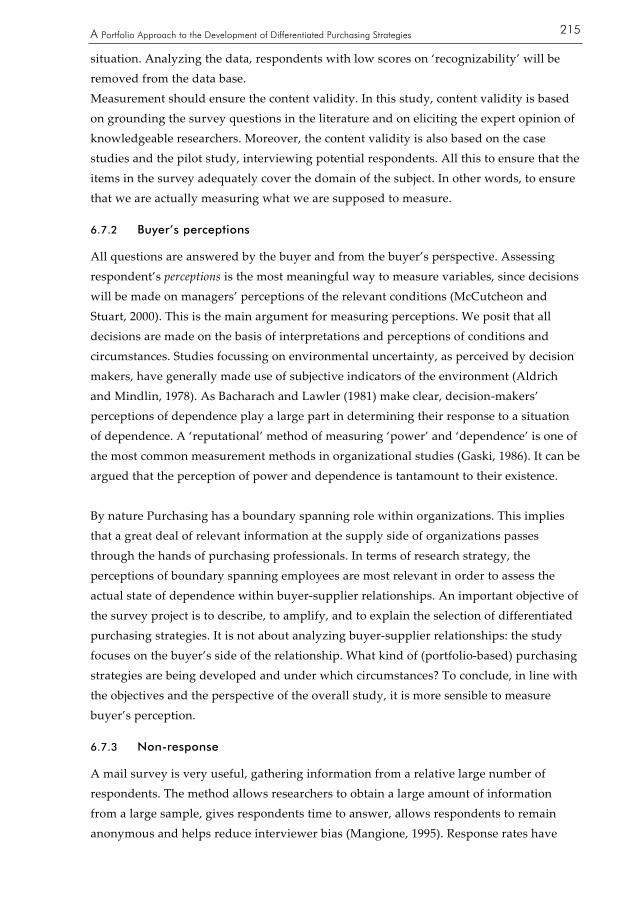
A Portfolio Approach to the Development of Differentiated Purchasing Strategies
215
situation. Analyzing the data, respondents with low scores on ‘recognizability’ will be removed from the data base. Measurement should ensure the content validity. In this study, content validity is based on grounding the survey questions in the literature and on eliciting the expert opinion of knowledgeable researchers. Moreover, the content validity is also based on the case studies and the pilot study, interviewing potential respondents. All this to ensure that the items in the survey adequately cover the domain of the subject. In other words, to ensure that we are actually measuring what we are supposed to measure.
6.7.2 Buyer’s perceptions
All questions are answered by the buyer and from the buyer’s perspective. Assessing respondent’s perceptions is the most meaningful way to measure variables, since decisions will be made on managers’ perceptions of the relevant conditions (McCutcheon and Stuart, 2000). This is the main argument for measuring perceptions. We posit that all decisions are made on the basis of interpretations and perceptions of conditions and circumstances. Studies focussing on environmental uncertainty, as perceived by decision makers, have generally made use of subjective indicators of the environment (Aldrich and Mindlin, 1978). As Bacharach and Lawler (1981) make clear, decision-makers’ perceptions of dependence play a large part in determining their response to a situation of dependence. A ‘reputational’ method of measuring ‘power’ and ‘dependence’ is one of the most common measurement methods in organizational studies (Gaski, 1986). It can be argued that the perception of power and dependence is tantamount to their existence. By nature Purchasing has a boundary spanning role within organizations. This implies that a great deal of relevant information at the supply side of organizations passes through the hands of purchasing professionals. In terms of research strategy, the perceptions of boundary spanning employees are most relevant in order to assess the actual state of dependence within buyer-supplier relationships. An important objective of the survey project is to describe, to amplify, and to explain the selection of differentiated purchasing strategies. It is not about analyzing buyer-supplier relationships: the study focuses on the buyer’s side of the relationship. What kind of (portfolio-based) purchasing strategies are being developed and under which circumstances? To conclude, in line with the objectives and the perspective of the overall study, it is more sensible to measure buyer’s perception.
6.7.3 Non-response
A mail survey is very useful, gathering information from a relative large number of respondents. The method allows researchers to obtain a large amount of information from a large sample, gives respondents time to answer, allows respondents to remain anonymous and helps reduce interviewer bias (Mangione, 1995). Response rates have
216
become one of the primary yardsticks for judging successful survey research. Frohlich (2002) concluded that response rates are important for three main reasons: 1. When the percentage of non-respondents is high, there is real risk that the data will be biased. 2. Many statistical tests require a suitable number of cases. 3. High response rates indirectly reflect the relevance and rigor of the study. Respondents are more likely to return a questionnaire if they perceive that the study is important and warrants cooperation. Business researchers are always concerned with the issue of non-response. Erdogan and Baker (2002) concluded that the most threatening issue for researchers conducting mail surveys is non-response. In general, the response rate depends on the motivation of the recipient to answer the questionnaire and to send it back. Literature review suggests support for prior notification, anonymity, university sponsorship, stamped return envelope, incentives, and follow-up questionnaires (see for instance Jobber and O’Reilly (1996) who reviewed a number of techniques in postal surveys that could raise response rates). Other factors, such as appeals, handwritten postscripts, personalization and cover letters, were found to be ineffective. Erdogan and Baker (2002) found in an experimental design of a mail survey, that the ‘original replacement condition’ was the most effective follow-up technique (compared to: a photocopy replacement, a follow-up post card, and a follow-up letter). Greer et al. (2000) studied the respondents’ willingness to respond to a questionnaire in a business context. The results indicate that the content of the study is the most important factor in stimulating response participation, followed by survey sponsorship and postage paid reply envelopes. Pre-notification and follow-up are considered the least important factors. It is advised that researchers pay attention to the format of the questions and the length of the questionnaire. Obviously, shorter questionnaires are likely to produce better response rates than longer ones, especially because the questionnaires will be completed during company time. It is recognized that the questionnaire is relatively long, containing more than 175 questions. The pilot test provided information on the actual time needed to complete the questionnaire: an average of 35 minutes. As a result of the pilot study, corrective actions were undertaken, to resolve unclarities and to reduce the time needed for the completion of the questionnaire. In general, the following measures were taken, aimed at reducing non-response: - University sponsorship was emphasized. - For the initial mailing, a letter of recommendation was added, written by the president of the NEVI (the Dutch Association for Purchasing). The follow-up mailing was completed with a letter of recommendation that was signed by the researchers, emphasizing academic relevance and including a university logo. Both letters contained sincere and direct requests for help and cooperation. In addition, the letters of recommendation emphasized

A Portfolio Approach to the Development of Differentiated Purchasing Strategies
217
that the objective of the research was to investigate and explain the selection of purchasing and supplier strategies. The letters deliberately did not reveal that one of the objectives was to determine the use frequency and the use intensity of the portfolio tool, because that might deter non-users from completing the questionnaire. Also, the questions about the portfolio approach were deliberately put at the end of the questionnaire, to avoid that people might decide not to respond, because they do not use a portfolio approach. - A summary of results was offered to the respondents, reporting on the main conclusions of the study. - The first 200 respondents are entitled to a free copy of a book on purchasing management (‘Samenwerkend Ondernemen’). - Business reply envelopes were used (freepost). - The questionnaire was pre-tested to improve readability, question order and to improve ambiguous questions. - The format and lay out of the questionnaire were aimed at reducing the number of pages. The questionnaire was printed on both sides of the paper, which reduced the total number to 4 pages. - Six weeks after the initial mail-out a replacement questionnaire was mailed to all non-respondents (follow-up mailing). - Four weeks after the follow-up mailing remaining respondents received an e-mail, asking them for the third and last time to participate in the survey. A replacement questionnaire was added as an attachment. Even though pre-notification is likely to affect the response rate positively, in this study respondents were not pre-notified because of time and financial constraints.
6.8 Results
After an extensive analysis of response and non-response, we will present the results of the survey study. Consistently, we will focus on answering the research questions.
6.8.1 Response
In this research, the response rate is defined as the percentage of total usable questionnaires returned by respondents (Wiseman and Billington, 1984). A total number of 248 reactions were received of which 10 could not be used, because the questionnaires were not completed. If at least 90% of the questionnaire was completed, a response was seen as valid. This means that the total valid response of the survey is 238 to be used for analysis. The sample consisted of 1,153 companies, resulting in a response rate of: 238 / 1,153 = 20,6%. Chronologically, the following stages were undertaken, as shown in figure 6.1.

218
Week in 2002 Activity
Results 10 (March) first round of survey sent out by regular mail
121 valid responses
16 (April) second round of surveys sent out by regular mail to remaining respondents
109 valid responses
20 (May) third round of surveys sent out by e-mail to remaining respondents with known addresses
8 valid responses
22 (May) Mail box closed
n = 238
FIGURE 6.1 Chronological overview of survey activities and results
More than 100 respondents contributed to the first and the second round of surveys. The majority of respondents were collected by means of the postal mailings. In contrast, the response to the electronic mailing was low, much lower than expected. An explanation might be that the electronic mailing was the third and last attempt to get cooperation. In addition, a number of purchasing professionals might object to unsolicited e-mail (or ‘spam’). This objection to unsolicited e-mail had been observed in other studies (Boyer et al., 2002). A total number of 276 e-mails resulted in 8 valid responses (2.9%). In his research Mol (2002) used the same NEVI industry database. He indicated that the database should be updated, because a relatively large number of firms no longer resided at the given address. Illustrative for our study is the percentage of e-mails that turned out to be ‘undeliverable’: 21%. Fifteen reactions gave some insight in reasons for not participating in the study: 12 indicated to have ‘no time’, 3 indicated that they did not practice a purchasing function. Low response rates are typical of industrial mail surveys and 20-30% response rates are considered to be good in Europe (Erdogan and Baker, 2002). Given the enormous length of the questionnaire (8 pages, 175 questions), the response rate should be considered as rather high. For instance, Frohlich (2002) analyzed 233 Operations Management research papers that were published over the last 12 years. Most frequently found was an average rate of 20% (mode), and an arithmetic mean of 32%. He concluded that a survey should not contain more than 125 items. Yu and Cooper (1983) found that a questionnaire length of 40-50 items delivered the highest average response rate. If a survey is under 4 or 5 pages, then resistance will be lower and the response rates tend to be higher. Obviously, these conditions were not met in the present case. Without doubt, the resistance of respondents was considerably lowered by the free offers that were made. Over 78% of the respondents were interested in the book on purchasing management and 86% indicated that they would
A Portfolio Approach to the Development of Differentiated Purchasing Strategies
219
like to receive a summary of the main findings. It can be expected that all the other measures have contributed to the response rate, albeit on a lower level of influence (sponsorship, letters of recommendation, appeals, pre-paid postage, formatting, lay-out). Some 30% of the respondents bear ‘Director Purchasing’ as their job title. The other purchasing professionals accounted for almost 60% of the respondents. They were classified according to the NEVI-clustering (Wesselink et al., 2001): purchasing managers, (senior) buyers and purchasing assistants. Remaining respondents were managers of logistics, supply chain managers and a small group of ‘others’ (see figure 6.2). Based on their job titles, the respondents can be considered as being well-informed about the purchasing operation in their companies. Job title Frequency Valid percent Director Purchasing 70 30
Purchasing Manager 79 33
Senior Buyer 23 10
Purchasing Assistant 37 16
Manager of Logistics 10 4
Supply Chain Manager 4 2
Other 12 5
Total 235 100
FIGURE 6.2 Jobtitle of respondents
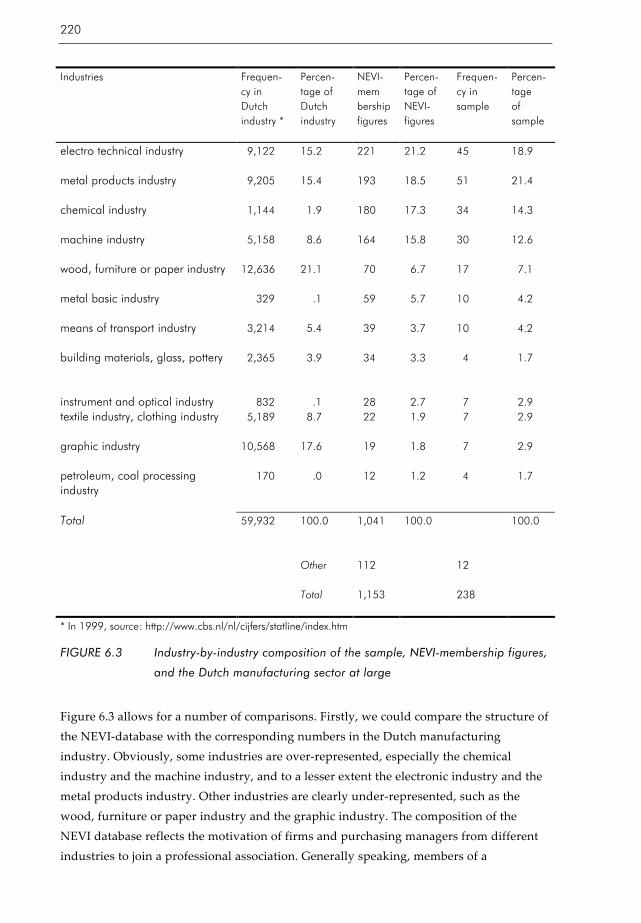
220
Industries Frequen-
cy in Dutch industry *
Percen- tage of Dutch industry
NEVI- mem bership figures
Percen- tage of NEVI- figures
Frequen-cy in sample
Percen-tage of sample
electro technical industry
9,122 15.2 221 21.2 45 18.9
metal products industry
9,205 15.4 193 18.5 51 21.4
chemical industry
1,144 1.9 180 17.3 34 14.3
machine industry
5,158 8.6 164 15.8 30 12.6
wood, furniture or paper industry
12,636 21.1 70 6.7 17 7.1
metal basic industry
329 .1 59 5.7 10 4.2
means of transport industry
3,214 5.4 39 3.7 10 4.2
building materials, glass, pottery
2,365 3.9 34 3.3 4 1.7
instrument and optical industry 832 .1 28 2.7 7 2.9 textile industry, clothing industry
5,189 8.7 22 1.9 7 2.9
graphic industry
10,568 17.6 19 1.8 7 2.9
petroleum, coal processing industry
170 .0 12 1.2 4 1.7
Total 59,932 100.0 1,041 100.0 100.0
Other
112 12
Total
1,153 238
* In 1999, source: http://www.cbs.nl/nl/cijfers/statline/index.htm
FIGURE 6.3 Industry-by-industry composition of the sample, NEVI-membership figures,
and the Dutch manufacturing sector at large
Figure 6.3 allows for a number of comparisons. Firstly, we could compare the structure of the NEVI-database with the corresponding numbers in the Dutch manufacturing industry. Obviously, some industries are over-represented, especially the chemical industry and the machine industry, and to a lesser extent the electronic industry and the metal products industry. Other industries are clearly under-represented, such as the wood, furniture or paper industry and the graphic industry. The composition of the NEVI database reflects the motivation of firms and purchasing managers from different industries to join a professional association. Generally speaking, members of a

A Portfolio Approach to the Development of Differentiated Purchasing Strategies
221
purchasing organization tend to be larger firms and firms that purchase more. This proposition was confirmed by Mol (2002) who analyzed the NEVI-database and concluded that NEVI-members are generally much larger and more purchasing intensive. Secondly, another comparison is of importance, addressing the issue of the representativeness of the sample. Considering the different types of industry, it is concluded that the sample is quite representative for the structure of the sample frame (NEVI-database). As a consequence, the sample contains some under- and over-represented industries. However, the composition of the sample is to a large extend representative for the NEVI-database. The same holds true for company size, operationalized as the number of employees. A firm with fewer than 100 employees is categorized as a SME (small and medium sized enterprise). In the sample 28.6% of the companies are SME’s, the larger companies account for the remaining 71.4%. In Dutch industry however, the proportion between SME’s and larger companies is 96.7% and 3.3% (CBS statistics, 1999). This picture confirms to the fact that larger companies are more inclined to join a professional association than smaller companies. We will take this into account, when interpreting the data, for instance with respect to the number of portfolio users. We have recognized the risks and limitations of non-response. If persons who respond differ substantially from those who do not, the results do not directly allow one to say how the entire sample would have responded (generalization). In this study a number of measures have been taken in order to protect against non-response. Obviously, non-response is an issue in this study. One way of dealing with non-response is the comparison of results with known values for the population. This is what we have done so far, comparing sample characteristics with known CBS statistics (namely, industry type and company size). Another approach to the non-response problem is to estimate non-response bias. Armstrong and Overton (1977) have introduced an extrapolation method in which the data are classified into a first category of returned questionnaires (first-wave, early respondents) and a second category of returned questionnaires (second-wave, late respondents). To establish the presence of non-response, first-wave respondents are compared with second-wave respondents on relevant variables. The most common type of extrapolation is carried over successive waves of a questionnaire. ‘Wave’ refers to the response generated by a certain stimulus, for instance sending a questionnaire by mail. Persons who respond in a later wave are expected to be similar to non-respondents (Armstrong and Overton, 1977). In this study the non-response issue is addressed by comparing 121 first-wave respondents to 109 second-wave respondents. For a large number of variables we have tested whether there are statistical significant differences between the first and second wave. Chi-square tests were used for the background variables and the use-variables

222
which were measured on a nominal or ordinal scale. At the .05 level of significance, no differences were found in:- job position, - company size, - turnover, - use, and - use intensity. A chi-square test for the ‘type of industry’ variable was not permitted, due to the presence of 12 cells that have an expected count of less than 5. However, we could roughly say that the frequency distributions displays no important differences (see figure 6.4). The small differences in the (absolute) frequencies give the impression of uniformity. In relative terms the second wave contains more firms from the metal products industry and fewer firms from the textile and clothing industry. Industries
absolute frequencies relative frequencies
first wave
second wave
first wave
second wave
electro technical industry 24
18 19.8 16.6
metal products industry 22
26 18.2 25.7
chemical industry 17
17 14.0 15.6
machine industry 14
15 11.6 13.8
wood, furniture or paper industry 11
6 9.1 5.5
metal basic industry 4
6 3.3 5.5
means of transport industry 5
5 4.1 4.6
building materials, glass, pottery 2
2 1.7 1.8
instrument and optical industry 5
2 4.1 1.8
textile industry, clothing industry 6
1 5.0 .9
graphic industry 3
2 2.5 1.8
petroleum, coal processing industry 1
3 .8 2.8
other industry 7
4 5.8 3.7
Total 121
109 100.0 100.0
FIGURE 6.4 Distribution of absolute and relative frequencies of the type of industries `
for the first and second wave of respondents

A Portfolio Approach to the Development of Differentiated Purchasing Strategies
223
Subsequently a series of t-tests were done for a large number of variables that are measured on an interval or ratio scale. First, we examined the variables that are connected with the use of the portfolio analysis, with an exception for the variable ‘company size’ (see above). At the .05 level of significance, no differences were found in all of the explanatory variables: - purchasing share - the position of purchasing (two items) - purchasing’s professionalism (two items) - orientation of purchasing (three items). The same conclusion can be drawn for the variables which are operationalized to measure the impact of portfolio use (e.g. the understanding of problems and possibilities of purchasing and the development of differentiated strategies). Second, a series of t-tests were used for the variables that are connected to the 9 scenarios. There are 17 variables in the questionnaire for each scenario, resulting in a total number of 153 variables. It was found that 92.2% of these variables showed no significant differences between the first and the second-wave group. This means that there are statistical significant differences in merely 12 out of the total number of 153 variables. On closer consideration 6 of these 12 variables are related to scenario 7 which refers to maintaining a good relationship with an excellent supplier in the strategic quadrant. The data indicate that the second-wave respondents especially estimated the buyer’s dependence to be lower than the first-wave respondents: an average of 4.06 versus 4.36 (on a 5-point Likert scale). This could explain the differences in some other variables which are most likely related to the perceived buyer’s dependence (i.e. logistical indispensability of the supplier, the need for the supplier’s technological expertise, the level of product customization and the possibilities for standardization). In conclusion, not many statistically significant differences were found between the first wave and the second wave of respondents. This conclusion is valid for nearly all variables: 4 background variables, 13 variables related to portfolio use and 141 (of 153) variables that are associated with the 9 purchasing scenarios. On the assumptions that late respondents are similar to non-respondents, this leads to the important conclusion that the study does not suffer from non-response bias.
6.8.2 Explaining the use of the portfolio analysis: the second research question
In this section we will present the answers on the research questions with respect to the second core issue of this study: “Which factors would explain the utilization of the purchasing portfolio analysis?” At the end of chapter 3 we derived four research sub-questions and a number of hypotheses, relating to the use of a portfolio approach by purchasing professionals.
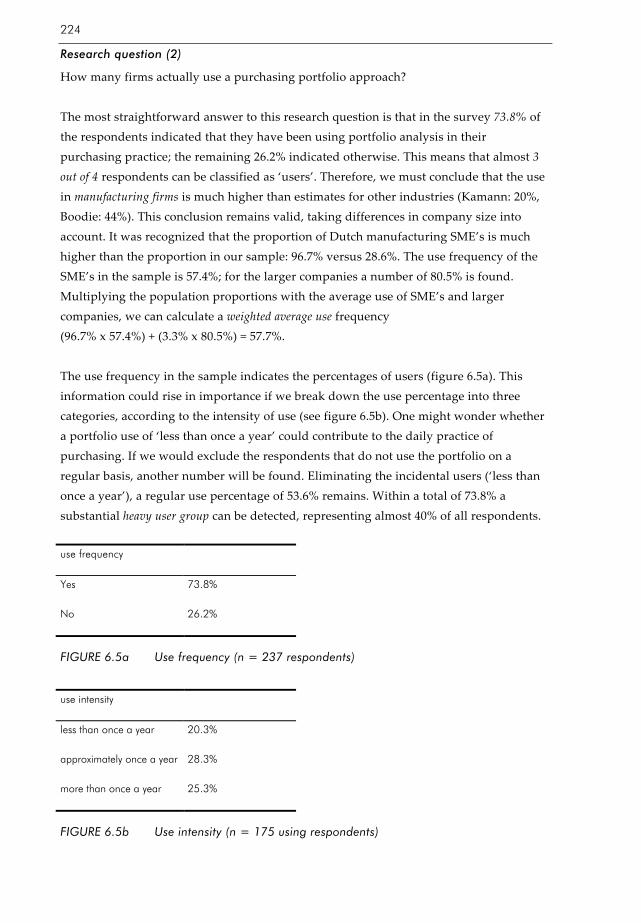
224
Research question (2)
How many firms actually use a purchasing portfolio approach? The most straightforward answer to this research question is that in the survey 73.8% of the respondents indicated that they have been using portfolio analysis in their purchasing practice; the remaining 26.2% indicated otherwise. This means that almost 3 out of 4 respondents can be classified as ‘users’. Therefore, we must conclude that the use in manufacturing firms is much higher than estimates for other industries (Kamann: 20%, Boodie: 44%). This conclusion remains valid, taking differences in company size into account. It was recognized that the proportion of Dutch manufacturing SME’s is much higher than the proportion in our sample: 96.7% versus 28.6%. The use frequency of the SME’s in the sample is 57.4%; for the larger companies a number of 80.5% is found. Multiplying the population proportions with the average use of SME’s and larger companies, we can calculate a weighted average use frequency (96.7% x 57.4%) + (3.3% x 80.5%) = 57.7%. The use frequency in the sample indicates the percentages of users (figure 6.5a). This information could rise in importance if we break down the use percentage into three categories, according to the intensity of use (see figure 6.5b). One might wonder whether a portfolio use of ‘less than once a year’ could contribute to the daily practice of purchasing. If we would exclude the respondents that do not use the portfolio on a regular basis, another number will be found. Eliminating the incidental users (‘less than once a year’), a regular use percentage of 53.6% remains. Within a total of 73.8% a substantial heavy user group can be detected, representing almost 40% of all respondents. use frequency
Yes
73.8%
No
26.2%
FIGURE 6.5a Use frequency (n = 237 respondents)
use intensity
less than once a year
20.3%
approximately once a year
28.3%
more than once a year
25.3%
FIGURE 6.5b Use intensity (n = 175 using respondents)

A Portfolio Approach to the Development of Differentiated Purchasing Strategies
225
The second sub-question related to reasons for use:
Research question (2b)
Why is the purchasing portfolio approach being used in practice? The users were asked what the most important reasons would be for using the portfolio approach. Respondents were allowed to mark more than one of the prespecified reasons. According to the users, portfolio analysis contributes to: - the insights into suppliers and products: 58.3% - purchasing cost savings: 38.9% - the identification of problems and possibilities in purchasing: 50.3% - the information for the development of differentiated purchasing strategies: 70.9% These findings seem to confirm, albeit to a limited extent, that the core purpose of portfolio analysis is the development of differentiated purchasing and supplier strategies. What is more is that the reason ‘development of differentiated strategies’ was seldom combined with other reasons. It could be interpreted that the development-reason refers to a separate category of respondents who value and emphasize this core purpose. Summarizing the findings in order of frequency, the following reasons were directly marked for the use of the purchasing portfolio approach: 1. the development of differentiated strategies 2. the gaining of additional insights and knowledge 3. the realisation of cost savings. Following on the reasons for portfolio use, the satisfaction of users has been determined. From the case studies it became clear that three different measurement methods were being used in practice. Most handbooks and papers on the portfolio do not reveal how the positions in the matrix could or should be determined. Sometimes a weighted factor score method is assumed, which allows for a large number of factors to be dealt with in a customized way. However, in our study it was found that the weighted factor score is the least frequently-used measurement method. Kamann (2000a) assumed that practitioners ‘often’ use ‘the number of suppliers’ on the horizontal axis and ‘financial value’ on the vertical axis. This corresponds to, what we have labeled, as the 1-by-1 method. Although this method is quite ‘often’ used, it is not the most frequently-used method. Almost half of the respondents preferred the consensus method. The following picture can be drawn: - consensus method 47.7% - 1-by-1 method 28.2% - weighted factor scores 11.5% - other method 12.6%. Users of another method, generally indicated that they used a combination of two or more methods, for instance, adding a consensus element in the 1-by-1 method.

226
In addition, users were to a great extent satisfied with their portfolio use, scoring an average of 4.0 on a 5-point scale. This comes as no surprise because if professionals were not satisfied they would not be using the portfolio tool. It is more remarkable that between the three methods no statistically significant differences in satisfaction were found. This finding tempts us to conclude that the measurement method has no significant impact on the perceived satisfaction. In other words, apparently it does not matter which method is being selected. In a way, all the foregoing is related to the impact and results of portfolio use. Chapter 3 unfolded a line of reasoning, addressing the question ‘what could be expected from portfolio use?’ The discussion has led to the formulation of two hypotheses, positing that the use of the purchasing portfolio is positively related (A1) to the level of understanding of the problems and possibilities of the purchasing function and (A2) to the extent to which differentiated purchasing and supplier strategies are developed. To test these hypotheses, two (independent sample) t-tests were run, with ‘use’ as grouping variable (see figure 6.6). For both performance variables, the figure shows that the mean scores of the users are higher than the mean scores of the non-users. Moreover, the differences are both statistically significant at the p<0.05 level. This means a confirmation of the two hypotheses: portfolio users report higher levels of understanding and higher levels of differentiation in strategies. user’s mean
score
non-user’s mean score
t-value P-value
understanding of problems and possibilities
3.63 3.28 2.24 .026
differentiated purchasing and supplier strategies
3.44 2.87 3.35 .001
FIGURE 6.6 Results of the t-tests for the direct impact of portfolio use
To conclude, comparing the average scores of users and non-users, statistically significant differences were found at the p<0.05 level, therefore indicating that the portfolio technique ‘delivers’ what it is supposed to: - it adds to the understanding of purchasing problems and possibilities, and - it assists the purchasing professional in developing differentiated purchasing strategies. This means that we can accept hypotheses A1 and A2 which assumed a positive relationship between the use of the purchasing portfolio analysis and the two impact variables. With these conclusions, we have answered the 2b-research question. From our analysis it becomes clear that there are good reasons for using the purchasing portfolio analysis in

A Portfolio Approach to the Development of Differentiated Purchasing Strategies
227
practice. However, there are professionals who have reasons for not using the portfolio. The non-users were asked what the most important reasons would be for their point of view. Respondents were allowed to mark more than one of the pre-specified reasons. A distinction can be made between company-internal reasons and the perceived limitations of the portfolio analysis:
Company-internal reasons:
- takes too much time 39% - absence of required knowledge 27% - unwillingness of purchasing director 3% The case studies pointed at the importance of (top) management support for the adoption of portfolio analysis. The results of the survey indicate that a possible negative attitude of the purchasing director does not impede the adoption of the portfolio in practice. Only 3% of the non-users made reference to the unwillingness of their purchasing director. However, this figure should be interpreted with some prudence, because it is not clear whether the other non-respondents (a) do not perceive ‘unwillingness’ or (b) are not aware of their director’s opinions on this matter. Another cautionary note should be added. Professionals who claim that the use of the portfolio analysis takes too much time, might not be able to provide a reasonable assessment of the required time, due to a lack of first-hand experience. In addition, another reason for caution might be that a lack of time in some cases should be interpreted as ‘has no priority’ or as ‘lack of knowledge’. However, restricting ourselves to the numbers, the conclusions are inevitable: lack of time and lack of knowledge are perceived as the most important company-specific reasons for not using the portfolio. Boodie (1997) assumed that larger companies would probably employ higher educated purchasers, in comparison with smaller companies. The result of this difference would logically be that smaller companies are less capable of using the portfolio analysis. However, this assumption can not be confirmed by our study. We found no relationship between company size and the lack of knowledge, as a reason for non-use of the portfolio.
Perceived limitations of the portfolio analysis:
- produces unusable results 15% - includes not enough factors 11% - too simple for complex decisions 16% Taking a closer look at the limitations, it turned out that 31% of all non-users have marked one or more of the possible motivations for their non-use. To conclude, answering the 2c-research question (‘why not?’), the main reasons for not using the portfolio refer to a lack of time and/or knowledge (company-specific) and to the perceived limitations of the tool.

228
6.8.3 Users versus non-users
Based on literature study a number of variables and factors were found, to describe and explain the differences between users and non-users. In this section, we will address research question 2d: What are the differences between users and non-users of a purchasing portfolio approach? First, we ran a number of statistical tests to determine whether the differences are statistically significant. The variable ‘company size’ is measured on an ordinal scale, therefore a chi-square test is used. Independent sample t-tests are used for the other explanatory variables. In each case the differences are tested separately. Second, to gain further insights in the matter, we ran a logistic regression analysis with ‘use’ as the (dichotomous) outcome variable and a number of continuous and categorical predictor variables. The company size has been operationalized by the number of employees, measured on an ordinal scale. This variable has five categories, the first of which coincides with the official CBS-definition of SME’s (less than 100 employees). In addition and in agreement with the foregoing, a recoded variable is constructed: a dichotomous variable that classifies companies either as SME’s or as larger companies. Both variables are used in the chi-square analysis, to detect differences between the use and the non-use group. In both cases the value Pearson chi-square was statistically significant at the .000 level, indicating significant differences (see figure 6.7). The conclusion is: the distribution of respondents on ‘company size’ is disproportionate to the ratio between users and non-users in the sample. More specific, we accept hypothesis A3 which stated that ‘the company size of users will be larger than the company size of non-users of the purchasing portfolio analysis’. The positive relationship between company size and portfolio use is in line with Boodie’s findings in his 1997-study. Larger companies are more likely to deal with a larger number of products, more suppliers and more complex purchasing situations. Management tools, such as the portfolio analysis, will soon be beneficial.

A Portfolio Approach to the Development of Differentiated Purchasing Strategies
229
Value
degrees of freedom P-value
company size on a 5-category ordinal scale
Pearson chi-square
23.794 4 < .001
contingency coefficient
.302 < .001
company size: SME-larger companies
Pearson chi-square
13.419 1 < .001
contingency coefficient
.231 < .001
N of valid cases
237
FIGURE 6.7 Results of the chi-square tests: company size x use
The explanatory variables were subjected to a number of successive t-tests, summarized in figure 6.8. The direction of the differences between user’s and non-user’s mean scores on the explanatory variables are fully in line with the prior expectations. However, not all differences proved to be statistically significant. We found no significant differences for three variables: - the extent to which purchasing reports to the top management (position of purchasing) - the extent to which purchasing aims at collaboration with suppliers (orientation) - the extent to which purchasing aims at tough negotiations with suppliers in pursuit of the lowest prices (orientation). This means that two hypotheses that correspond with ‘orientation of purchasing’ have to be rejected: collaboration and negotiation/lowest prices (A7a and A7b). At this point the results are inconclusive with respect to hypothesis A5 which claims that ‘the position of purchasing is better at companies where the purchasing portfolio analysis is used, than at non-using companies’. We did not find significant differences between users and non-users on the variable ‘reports to top management’. On the other hand, we did find significant differences for the other explanatory variables in the use model. This means that we found a confirmation for the corresponding hypotheses that can not be denied: - A4: purchasing share of users will be higher than the purchasing share of non-users of the purchasing portfolio analysis, - A6: the professionalism of purchasing is higher at companies where the purchasing portfolio analysis is used, than at non-using companies and - A7c: the users of the purchasing portfolio analysis will be less involved with clerical and operational activities than non-users.

230
In addition, more users reported that purchasing contributes to the competitive position of the firm than non-user. Apparently, there are significant differences with respect to this element of the ‘position of purchasing’-construct. user’s mean
score non-user’s mean score
mean difference
t-value P-value
purchasing share 54.9 48.8 6.1 2.20 .029
contributes to competitive position
3.83 3.42 .41 2.64 .009
reports to top management *
4.03 3.66 .37 * 1.74 .083
skills for cross functional teams
3.64 3.18 .46 3.23 .001
skills for developing strategies
3.57 3.19 .38 2.86 .005
orientation on collaboration *
3.63 3.48 .15 * 1.14 .254
orientation on negotiation and lowest prices *
3.11 3.31 - .19 * - 1.31 .192
orientation on clerical and operational activities
2.76 3.18 - .41 - 2.53 .012
* not significant at p<0.05
FIGURE 6.8 Results of the t-tests for the differences between users and non-users
(n=236)
On the whole the results of the tests confirm our prior expectations and hypotheses. Users of the portfolio are employed with larger companies and have to deal with higher purchasing shares. All in comparison with non-users. We presented the respondents with a number of propositions that refer to the position of purchasing in the company, the professionalism of purchasing and the orientation of purchasing. Comparing the results, it was found that users of the portfolio reported that they: - contribute more to the competitive position of their company - have more skills in working in cross functional teams and in developing purchasing and supplier strategies - are less involved in clerical and operational activities. In other words, the user group distinguishes itself in a positive way from the non-user group. Their position is better, regarding their contribution to the competitive position of the company. Their professionalism is related to important attributes, namely the skills of professional purchasers to work in cross-functional teams and to develop strategies. Therefore, it is not surprising that these professionals are not (heavily) engaged in clerical activities and day-to-day routine work.

A Portfolio Approach to the Development of Differentiated Purchasing Strategies
231
With the separate tests we determined what the significant differences are between users and non-users. In addition a logistic regression analysis was run, which is multiple regression but with an outcome variable that is a categorical dichotomy and predictor variables that are continuous or categorical. With logistic regression we can predict to which of two categories (users and non-users) a respondent is likely to belong, given certain other information. The analysis can be used to establish which variables are influential in predicting the correct category. Answers can be found to the question: which variables are appropriate for predicting whether a respondent (purchasing professional) will use the portfolio approach or not? The selected method of conducting the logistic regression is Backward Stepwise. This method starts with all predictors included. The computer then tests whether any of the predictors can be removed from the model without having a substantial effect on the fit of the model. The selection of this stepwise method is advised when used in situations in which no previous research exits and in situations where one merely wishes to find a model to fit the data. These conditions apply to our situation. The main results of the logistic regression are shown in figure 6.9. A number of variables were left out of the final equation. Their inclusion would not significantly affect the predictive power of the model. The following variables were taken out (in order of removal): - orientation on clerical and operational activities - purchasing reports to top management - orientation on collaboration with suppliers - skills for working in cross functional teams - orientation on tough negotiation and lowest prices.

232
main statistics
chi-square df P-value
omnibus test of model coefficients 25.208
4 < .001
Nagelkerke R square
.226
correctly predicted group membership
78.5%
variables in the equation coefficients: Exp(B)
df Wald statistic: chi-square
P-value
company size
2.423 1 4.085 .043
purchasing share
1.026 1 4.364 .037
contributes to competitive position
1.567 1 4.581 .032
skills for developing strategies
1.811 1 5.497 .019
constant
.031 1 7.439 .006
FIGURE 6.9 Results of the logistic regression with ‘use’ as dichotomous outcome
variable
The final model includes only variables with a significant contribution to the explanation and prediction of the outcome variable. The crucial statistic is the Wald statistic which has a chi-square distribution which tells us whether the coefficients for the predictors are significantly different from zero. Even more crucial to the interpretation of the results are the values of the coefficients Exp (B). The value of Exp (B) is an indicator of the change in odds resulting from a unit change in the corresponding predictor variable. If the value is greater than 1 then it indicates that as the predictor increases, the odds of the outcome occurring (user or non user) increase. The higher the value of Exp (B), the larger the contribution to the prediction of the outcome variable. Conversely, a value less than 1 indicates that as the predictor increases, the odds of the outcome occurring decreases. The remaining variables in the model are, in ascending order of impact on the outcome variable: 1. purchasing share 2. contribution to competitive position 3. skills for developing strategies 4. company size (dichotomous variable). For a further assessment of the results, the main statistics have to be evaluated. The Nagelkerke R-square of 226 points at a relatively low percentage of explained variance. The fit of the model is therefore rather limited. The predicted group membership is a specific result of logistic regression, indicating the overall accuracy of the model. The predicted
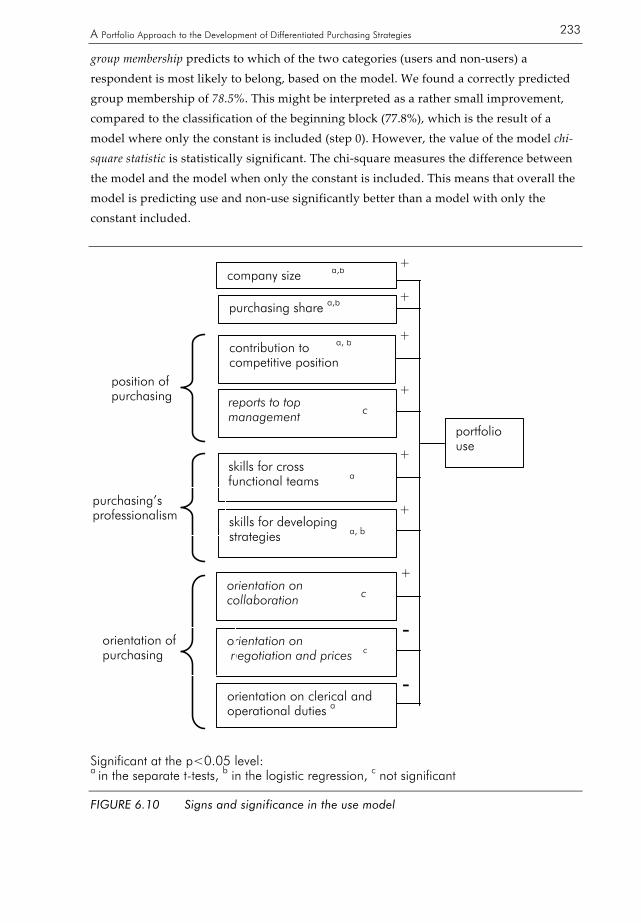
A Portfolio Approach to the Development of Differentiated Purchasing Strategies
233
group membership predicts to which of the two categories (users and non-users) a respondent is most likely to belong, based on the model. We found a correctly predicted group membership of 78.5%. This might be interpreted as a rather small improvement, compared to the classification of the beginning block (77.8%), which is the result of a model where only the constant is included (step 0). However, the value of the model chi-square statistic is statistically significant. The chi-square measures the difference between the model and the model when only the constant is included. This means that overall the model is predicting use and non-use significantly better than a model with only the constant included.
Significant at the p<0.05 level: a in the separate t-tests, b in the logistic regression, c not significant
FIGURE 6.10 Signs and significance in the use model
portfolio use
contribution to a, b competitive position
purchasing share a,b
company size a,b
orientation on collaboration c
position of purchasing
orientation on negotiation and prices c
skills for developing strategies a, b
reports to top management c
skills for cross functional teams a
orientation on clerical and operational duties a
purchasing’s professionalism
orientation of purchasing
+
-
+
+
+
+
+
+
-

234
To conclude, the statistical tests for the separate variables have resulted in a list of 6 variables that make a significant difference between users and non-users. In addition, the logistic regression resulted in a smaller list of 4 variables, predicting use and non-use as outcome variables. These results underscore the most important conclusions of this section: users contrast sharply with non-users of the portfolio approach for their scores on a number of variables (see figure 6.10). Company size and purchasing share are of a more general nature; other variables make the distinction in favor of using purchasing professionals who contribute more to the competitive position of the company and have more skills for the development of purchasing and supplier strategies.
6.8.4 Answers to the fourth research question: conditions for the selection of strategies
In section 6.7. we have raised the issue of validity. Respondents were asked to assume the role of a purchasing expert in their own company and to evaluate questions relating to different purchasing scenarios. To avoid respondent bias, due to a lack of recognition of scenarios, a total number of 22 respondents are removed from the database. These respondents scored an average recognition of lower than 3 on a 5-point Likert scale, resulting in an effective response of 216 respondents. By excluding respondents with relatively low recognition of the scenarios, the validity is enhanced. Obviously a small number of 22 does not allow for extensive analysis. On the face of it, there is a near resemblance between the characteristics of the non-recognition group and the other respondents. For instance, the proportions of use and use intensity of portfolio analysis are quite similar to the frequencies found in the overall analysis. From the total of 22 companies, 8 are SME’s and 14 are larger companies. A 36.4% of SME compares too the 28.6% of all SME-respondents. Apart from that, we found no significant differences between the recognition scores of users and non-users of the portfolio analysis. By comparing two relationship dependence profiles of two purchasing scenarios in the same quadrant, it is possible to test whether these profiles differ significantly. In section 6.3 we have formulated 6 hypotheses, concerning differences between the relationship-dependence profiles in the matrix. The pairwise comparisons of relationship profiles indicated that all differences are significant at the p<0.05 level, using the adjusted significance levels of the Greenhouse-Geisser test and the Huynh-Feldt test. This means that the hypotheses C1 until C6 are confirmed by our study: there are statistically significant differences between the profiles that fit alternative strategic choices in the same portfolio quadrant.

A Portfolio Approach to the Development of Differentiated Purchasing Strategies
235
In the following sections we will formulate the answers to the fourth research question: under which conditions are the various portfolio-based strategies pursued in purchasing management? For each quadrant we will look for relatively high and relatively low scores on variables that therefore shape the corresponding relationship-dependence profiles. Subsequently, the variables in the profiles will be further analyzed, indicating which variables attribute to the overall difference between the relationship-dependence profiles. The differences between profiles on this variable-level will be used to explain the selection of strategies. Figure 6.11 provides an overview of the means and the standard deviations of the 14 dependent variables in the 9 scenarios. Due to the missing values a number of 171 cases could be used for the pairwise comparisons of variables.
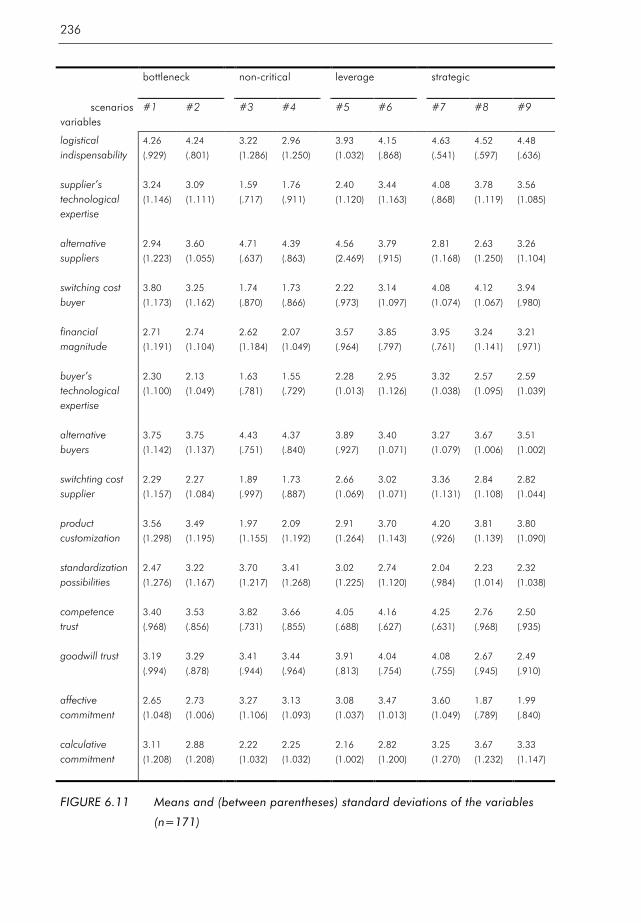
236
bottleneck non-critical leverage strategic
scenarios
variables #1 #2 #3 #4 #5 #6 #7 #8 #9
logistical indispensability
4.26
(.929)
4.24
(.801)
3.22
(1.286)
2.96
(1.250)
3.93
(1.032)
4.15
(.868)
4.63
(.541)
4.52
(.597)
4.48
(.636)
supplier’s technological expertise
3.24
(1.146)
3.09
(1.111)
1.59
(.717)
1.76
(.911)
2.40
(1.120)
3.44
(1.163)
4.08
(.868)
3.78
(1.119)
3.56
(1.085)
alternative suppliers
2.94
(1.223)
3.60
(1.055)
4.71
(.637)
4.39
(.863)
4.56
(2.469)
3.79
(.915)
2.81
(1.168)
2.63
(1.250)
3.26
(1.104)
switching cost buyer
3.80
(1.173)
3.25
(1.162)
1.74
(.870)
1.73
(.866)
2.22
(.973)
3.14
(1.097)
4.08
(1.074)
4.12
(1.067)
3.94
(.980)
financial magnitude
2.71
(1.191)
2.74
(1.104)
2.62
(1.184)
2.07
(1.049)
3.57
(.964)
3.85
(.797)
3.95
(.761)
3.24
(1.141)
3.21
(.971)
buyer’s technological expertise
2.30
(1.100)
2.13
(1.049)
1.63
(.781)
1.55
(.729)
2.28
(1.013)
2.95
(1.126)
3.32
(1.038)
2.57
(1.095)
2.59
(1.039)
alternative buyers
3.75
(1.142)
3.75
(1.137)
4.43
(.751)
4.37
(.840)
3.89
(.927)
3.40
(1.071)
3.27
(1.079)
3.67
(1.006)
3.51
(1.002)
switchting cost supplier
2.29
(1.157)
2.27
(1.084)
1.89
(.997)
1.73
(.887)
2.66
(1.069)
3.02
(1.071)
3.36
(1.131)
2.84
(1.108)
2.82
(1.044)
product customization
3.56
(1.298)
3.49
(1.195)
1.97
(1.155)
2.09
(1.192)
2.91
(1.264)
3.70
(1.143)
4.20
(.926)
3.81
(1.139)
3.80
(1.090)
standardization possibilities
2.47
(1.276)
3.22
(1.167)
3.70
(1.217)
3.41
(1.268)
3.02
(1.225)
2.74
(1.120)
2.04
(.984)
2.23
(1.014)
2.32
(1.038)
competence trust
3.40
(.968)
3.53
(.856)
3.82
(.731)
3.66
(.855)
4.05
(.688)
4.16
(.627)
4.25
(.631)
2.76
(.968)
2.50
(.935)
goodwill trust 3.19
(.994)
3.29
(.878)
3.41
(.944)
3.44
(.964)
3.91
(.813)
4.04
(.754)
4.08
(.755)
2.67
(.945)
2.49
(.910)
affective commitment
2.65
(1.048)
2.73
(1.006)
3.27
(1.106)
3.13
(1.093)
3.08
(1.037)
3.47
(1.013)
3.60
(1.049)
1.87
(.789)
1.99
(.840)
calculative commitment
3.11
(1.208)
2.88
(1.208)
2.22
(1.032)
2.25
(1.032)
2.16
(1.002)
2.82
(1.200)
3.25
(1.270)
3.67
(1.232)
3.33
(1.147)
FIGURE 6.11 Means and (between parentheses) standard deviations of the variables
(n=171)

A Portfolio Approach to the Development of Differentiated Purchasing Strategies
237
6.8.4.1 Profiles in the bottleneck quadrant
In the bottleneck quadrant the logistical indispensability is very high, considering the absolute values (4.26 and 4.24). Apparently, the supply risk and the bottleneck positions are caused by logistical dependencies. The poor power position of the buyer is further enhanced by the large number of alternative buyers and the relatively low switching cost for the supplier. Buyers and suppliers have a limited need for each other’s technological expertise. In descending order, the following significant differences (p <0.05) were found in the bottleneck quadrant: possibilities for standardization - .75 alternative suppliers -. 66 switching cost buyer +. 55 Mean differences are calculated as (#1) – (#2). Scenario #1 = keep safety stocks Scenario #2 = find other solutions: decomplex the product, if necessary find new supplier

238
low medium high 1 2 3 4 5
mean difference (#1) – (#2)
1a logistical indispensability
-.02
1b supplier’s technological expertise
.15
1c alternative suppliers
-.66
1d switching cost buyer
.55
2a financial magnitude
-.03
2b buyer’s technological expertise
.07
2c alternative buyers
.00
2d switching cost supplier
.02
3a product customization
.07
3b standardization possibilities
-.75
4a competence trust
-.13
4b goodwill trust
-.10
4c affective commitment
-.08
4d calculative commitment
-.10
Scenario #1 = keep safety stocks Scenario #2 = find other solutions: decomplex the product, if necessary with new supplier
multivariate test of significance: F-value = 6.04, P-value < .001
FIGURE 6.12a Relationship-dependence profiles in the bottleneck quadrant

A Portfolio Approach to the Development of Differentiated Purchasing Strategies
239
Analysis of differences shows that the possibilities for standardization and the availability of alternative suppliers are the most salient differences between the two scenarios. The significant lower level of switching cost in scenario #2 indicates that the buying company has made less relationship-specific investments, resulting in lower barriers for making the switch to a routine position in the matrix. Not surprisingly, the buyer would consider a strategic move to the routine quadrant if he experiences less dependence on the supplier. What is remarkable is that none of the other 11 factors in the relationship-dependence profiles show any significant differences. For instance, trust and commitment have no bearing on the decision-making process. Key parts are played by a very limited number of factors (see figure 6.12a.)
Main implication
In general the switch from ‘bottleneck’ into ‘routine’ in the matrix is desirable, but not always possible (scenario #2). Such a strategic move is only an option if the conditions concerning the possibilities for standardization and the availability of alternative suppliers are satisfied. Consequently, the switch is associated with lower switching cost for the buyer.
6.8.4.2 Profiles in the non-critical quadrant
In general we found a relatively high number of alternative suppliers in the non-critical quadrant, in fact for both scenarios. From the supplier’s perspective the alternative number of buyers is also high. Buyers and suppliers do not need each other’s technical expertise for non-critical items. For both partners relatively low switching costs were found, indicating a market exchange relationship (cf Bensaou, 1999). Considering the specifications it is clear that the product customization is of a low level, with relatively many possibilities for standardization. This conclusion holds for both scenarios (see figure 6.12b). Pooling of requirements offers more possibilities and implies lower costs and more efficiency for relatively low value items. However, within organizations there might be good reasons for the individual ordering of certain items. Alternatively, there might be ineffective barriers to purchasing efficiency. In descending order, the following significant differences (p <0.05) were found in the non-critical quadrant: financial magnitude +. 55 alternative suppliers +. 32 Mean differences are calculated as (#3) – (#4). Scenario #3 = pooling of requirements Scenario #4 = individual ordering

240
low medium high 1 2 3 4 5
mean difference (#3) – (#4)
1a logistical indispensability
.26
1b supplier’s technological expertise
-.17
1c alternative suppliers
.32
1d switching cost buyer
.01
2a financial magnitude
.55
2b buyer’s technological expertise
.08
2c alternative buyers
.06
2d switching cost supplier
.16
3a product customization
-.12
3b standardization possibilities
.31
4a competence trust
.16
4b goodwill trust
-.03
4c affective commitment
.14
4d calculative commitment
-.03
Scenario #3 = pooling of requirements Scenario #4 = individual ordering multivariate test of significance: F-value = 4.01, P-value < .001
FIGURE 6.12b Relationship-dependence profiles in the non-critical quadrant

A Portfolio Approach to the Development of Differentiated Purchasing Strategies
241
The results of the study clearly point at the importance of differences in the financial magnitude of the product. The key factor, discriminating between a pooling strategy and a strategy of individual ordering, turns out to be the financial magnitude of the transactions for the supplier. In addition differences were found in the availability of alternative suppliers and the connected level of the buyer’s dependence. The other 12 factors in the profiles do not seem to contribute significantly to the selection of strategic choices in the routine quadrant.
Main implication
From a purchasing point of view pooling of requirements (scenario #3) is preferable to individual ordering (scenario #4). However, the switch towards the leverage quadrant is only feasible if there is a sufficient volume of trade (financial magnitude) from the supplier’s perspective and an ample availability of alternative suppliers.
6.8.4.3 Profiles in the leverage quadrant
Perhaps surprisingly, the logistical indispensability of leverage products turns out to be rather high. These products are obviously important for an undisturbed production flow. This finding is underscored by the relatively high levels of trust (competence and goodwill trust). However, the buyer’s dependence is still low, caused by a large number of alternative suppliers, accompanied by a low level of switching cost. The buying company typically has not invested much in its relationships with leverage suppliers. It was clear in advance that we could expect many differences, comparing scenario #5 (maintaining a convenience partnership) and scenario #6 (developing a strategic partnership). This is confirmed in our study: there are far more differences than similarities in relationship profiles. Exceptions are competence trust and goodwill trust, which do not attribute to the overall difference between the two profiles. The average scores on these variables are relatively high for both scenarios (4 on a 5-point scale). Trust is equally important in the leverage quadrant, probably due to the logistical indispensability. Although the switching costs are low, a leverage position does not imply that the qualities and competences of the selected supplier are unimportant. Both scenarios show comparable high levels of logistical indispensability and financial magnitude. In descending order, the following significant differences (p <0.05) were found in the leverage quadrant: supplier’s technological expertise -. 104 switching cost buyer - .92 product customization - .78 alternative suppliers +. 77 buyer’s technological expertise -. 67

242
calculative commitment -. 67 alternative buyers +. 49 affective commitment -. 39 switching cost supplier -. 36 financial magnitude -. 28 Mean differences are calculated as (#5) – (#6). Scenario #5 = maintaining a partnership of convenience Scenario #6 = development towards a strategic partnership

A Portfolio Approach to the Development of Differentiated Purchasing Strategies
243
low medium high
1 2 3 4 5
mean difference (#5 – #6)
1a logistical indispensability
-.22
1b supplier’s technological expertise
-1.04
1c alternative suppliers
.77
1d switching cost buyer
-.92
2a financial magnitude
-.28
2b buyer’s technological expertise
-.67
2c alternative buyers
.49
2d switching cost supplier
-.36
3a product customization
-.79
3b standardization possibilities
.28
4a competence trust
-.11
4b goodwill trust
-.1
4c affective commitment
-.39
4d calculative commitment
-.70
Scenario #5 = maintaining a partnership of convenience Scenario #6 = development towards a strategic partnership
multivariate test of significance: F-value = 9.65, P-value < .001
FIGURE 6.12c Relationship-dependence profiles in the leverage quadrant
244
The main question in the leverage quadrant is: when do we want to maintain a convenience partnership and when do we want to develop the relationship into a strategic partnership? Focussing on the largest differences, it is found that the needed supplier’s technological expertise is significantly higher in scenario #6, in combination with higher switching costs for the buyer. The availability of alternative suppliers is high, but not as high as in scenario #5. The choice of entering a strategic partnership is stimulated by the fact that the buyer’s dependence is already rather high. However, the supplier’s dependence is higher as well in scenario #6. Therefore, before entering in a real strategic partnership there should (already) be a power balance, which is expressed by comparable levels of buyer’s and supplier’s dependence. This supports the proposition that, from the buyer’s perspective, there is trade-off: a higher dependence is only acceptable if the supplier’s commitment is also high, supplying technological expertise and a customized product.
Main implication
A stay in the leverage quadrant is usually considered as the most preferable position in the matrix. Therefore, the switch to the strategic quadrant is likely to be the exception to the rule. The main condition for engaging in a partnership with a supplier is related to already higher levels of supplier’s dependence and especially buyer’s dependence. In addition, there is more (affective and calculative) commitment towards the future partner.
6.8.4.4 Profiles in the strategic quadrant
The three scenarios in the strategic quadrant all indicated a very high buyer’s dependence. All constituting variables contribute to this dependence situation for the buyer: - high logistical indispensability, - high need of supplier’s technical expertise, - low number of alternative suppliers, and - high level of switching costs. In addition, product customization is relatively high, with relatively few possibilities for standardizations in all three scenarios. In contrast, more differences between the relationship-dependence profiles were found for the determinants of supplier’s dependence and the variables in the ‘trust and commitment’-cluster (see figure 6.12d).

A Portfolio Approach to the Development of Differentiated Purchasing Strategies
245
low medium high
1 2 3 4 5
mean diff. #7 - #8
mean diff. #7- #9
mean diff. #8 - #9
1a logistical indispensability
.11
.15
.04
1b supplier’s technological expertise
.30
.52
.22
1c alternative suppliers
.18
-.45
-.63
1d switching cost buyer
-.04
.14
.18
2a financial magnitude
.71
.74
.03
2b buyer’s technological expertise
.75
.73
-.02
2c alternative buyers
-.40
-.24
.16
2d switching cost supplier
.52
.54
.02
3a product customization
.39
.40
.01
3b standardization possibilities
-.19
-.28
.09
4a competence trust
1.49
1.75
.26
4b goodwill trust
1.41
1.59
.18
4c affective commitment
1.73
1.61
-.12
4d calculative commitment
-.42
-.08
.34
Scenario #7 = maintaining a strategic partnership; Scenario #8 = accepting a locked-in partnership; Scenario #9 = finding a new supplier multivariate tests of significance: F-value = 29.28, P-value < .001 (#7 vs. #8), F-value = 35.71, P-value< .001 (#7 vs. #9), F-value = 5.25, P-value< .001 (#8 vs. #9)
FIGURE 6.12d Relationship-dependence profiles in the strategic quadrant

246
Comparing scenario #7 (strategic partnership) with scenario #8 (locked-in ‘partnership’), the largest differences were found in trust and commitment. In comparison with other situations, extreme differences were revealed. Beforehand, we might have expected that the main differences would refer to differences in buyer’s dependence and/or supplier’s dependence. Nonetheless, affective commitment, competence and goodwill trust clearly exceed these clusters of explaining variables. On a lower level of importance, we have found significant differences in the supplier’s dependence between a strategic partnership and a locked-in partnership, indicating that a strategic partnership requires investments and commitments from the supplier’s side. In comparison, it is perceived that suppliers in a strategic partnership experience a higher financial magnitude, higher switching cost, a small number of alternative buyers and a higher need for the buyer’s technical expertise. In contrast, hardly any significant differences were found in the buyer’s dependence. In both scenarios, we found a relatively high dependence of the buyer on the supplier. In descending order, the following significant differences (p <0.05) were found, between scenario #7 and scenario #8: affective commitment + 1.73 competence trust + 1.49 goodwill trust + 1.41 buyer’s technological expertise + .75 financial magnitude +. 71 switching cost supplier +. 52 calculative commitment - .42 product customization + .40 alternative buyers - .39 supplier’s technological expertise +.29 Mean differences are calculated as (#7) – (#8). Scenario #7 = maintaining a strategic partnership Scenario #8 = accepting a locked-in partnership Broadly speaking, we have come to similar conclusions for the comparison of #7 (strategic partnership) with scenario #9 (finding a new supplier). An exception has to be made for the lower level of buyer’s dependence in case of scenario #9, which is associated with differences in the need for the supplier’s expertise and the availability of alternative suppliers, all compared to scenario #7. Evidently, the main point of discrimination is the

A Portfolio Approach to the Development of Differentiated Purchasing Strategies
247
difference between a satisfactory and an unsatisfactory relationship, as in scenario #8 and scenario #9. The quality of a true partnership is expressed by much higher average scores on: - goodwill trust: the supplier does not misuse his position and actually takes our interests into consideration. - competence trust: the supplier keeps his promises and agreements - affective commitment: we are doing business with this supplier, mainly because it is pleasant working with the supplier Unsatisfactory relationships with suppliers in the strategic quadrant are associated with ‘partners’ who are less dependent on the buying company, compared to satisfactory relationships (from the buyer’s perspective). In descending order, the following significant differences (p <0.05) were found, between scenario #7 and scenario #9: competence trust + 1.74 affective commitment + 1.61 goodwill trust + 1.60 financial magnitude +. 74 buyer’s technological expertise + .73 switching cost supplier +. 54 supplier’s technological expertise +. 52 alternative suppliers - .45 product customization + .41 possibilities for standardization - .28 Mean differences are calculated as (#7) – (#9). Scenario #7 = maintaining a strategic partnership Scenario #9 = terminating partnership, finding a new supplier
Main implication
From the buyer’s perspective, satisfactory partnerships in the strategic quadrant are distinguished from unsatisfactory ‘partnerships’ by higher levels of supplier’s dependence, trust and commitment. Finally, comparing scenario #8 (locked-in ‘partnership’) with scenario #9 (finding a new supplier), we found that the corresponding profiles have many points in common. In fact, there are far more similarities than differences. Close collaboration is out of the question, in both scenarios. Affective commitment is extremely low, indicating that the relationship is not based on a spirit of cooperation: it is not pleasant working with the supplier. On the other hand, switching costs are high. A main difference between the two profiles is

248
the availability of alternative suppliers which is much higher in case of scenario #9 where an unsatisfactory business partner is replaced by a new supplier. The availability of alternatives in scenario #9 results in a lower level of buyer’s dependence. For scenario #8 the average score on calculative commitment is relatively high: terminating the relationship would take too much time, energy, and expense. Perhaps surprisingly, there is no significant difference between the switching costs of the buyer, which are relatively high, in both scenarios. Finally, terminating a partnership, as in scenario #9, is associated with a lower level of competence trust. The following significant differences (p <0.05) were found, between scenario #8 and scenario #9: alternative suppliers - .63 calculative commitment + .34 competence trust + .26 Mean differences are calculated as (#8) – (#9). Scenario #8 = accepting a locked-in partnership Scenario #9 = terminating partnership, finding a new supplier.
Main implication
If a purchasing manager decides to terminate an unsatisfactory ‘partnership’ and find a new supplier, beforehand he has a favorable judgement on the availability of alternative suppliers. Accepting a locked-in situation (scenario #8) is accompanied by a higher level of calculative commitment, whereas terminating a partnership (scenario #9) is associated with a lower level of competence trust.
6.8.5 Answers to the fifth research question: power and dependence in the matrix
Based on the case studies, 9 scenarios were developed that all focus on the selection of a purchasing strategy, albeit under different conditions. There are fixed treatment variables (the positions in the Kraljic matrix) and other variables that allow for the measurement of a large number of conditions (relationship-dependence profiles). In this section we will focus on the buyer’s dependence and the supplier’s dependence for the 9 different scenarios. First, we will analyze the mean scores on buyer’s and supplier’s dependence in the Kraljic matrix. In addition we will analyze the net dependence between them, thus providing a measure for the balance of power. The results will be compared to prior expectations. Secondly, a multiple regression analysis is conducted to explain the level of buyer’s dependence from the four determinants of buyer’s dependence. The same analysis is conducted for the supplier’s dependence in the nine scenarios.

A Portfolio Approach to the Development of Differentiated Purchasing Strategies
249
6.8.5.1 Power and total interdependency in the matrix
In this section the answers will be presented to research question 5b: “What are the levels of power and (total) interdependence in the categories of the Kraljic matrix?” Our analysis of literature in chapter 4 has resulted in the conclusion that the Kraljic categories correspond to four basic power positions: - asymmetrical relationships in the bottleneck and leverage quadrants, and - balanced relationships in the non-critical and strategic quadrants. The survey data make it possible to compare these theoretical propositions with the empirical findings, from the buyer’s perspective (see figure 6.13). scenario
supplier’s dependence (1) *
buyer’s dependence (2) *
net dependence (1) – (2) **
inter- dependence (1) + (2) ***
#1 safety stocks
2.09 3.93 - 1.84 6.02 bottleneck quadrant
#2 decomplex product
2.20 3.42 - 1.22 5.62
#3 pooling
2.01 1.49 + .52 3.50 non-critical quadrant
#4 individual ordering
1.86 1.67 + .19 3.53
#5 partner of convenience
2.77 1.94 + .83 4.71 leverage quadrant
#6 develop partnership
3.04 2.98 + .06 6.02
#7 maintain partnership
3.25 4.22 - 0.97 7.47
#8 accept locked-in
2.44 4.31 - 1.91 6.75
strategic quadrant
#9 terminate partnership
2.53 3.87 - 1.34 6.40
* supplier’s and buyer’s dependence are measured on a 5-point Likert scale ** the difference between supplier’s and buyer’s dependence is put on a scale from –4 (maximum supplier’s
dominance) to + 4 (maximum buyer’s dominance) *** the total interdependence between buyer and supplier is put on a scale from +2 (minimum
interdependence) to + 10 (maximum interdependence)
FIGURE 6.13 Power and dependence in the matrix
Figure 6.13 shows the average supplier’s dependence and the average buyer’s dependence in the nine scenarios (measured on a 5-point Likert scale). The average scores of the buyer’s dependence are perfectly in accordance with our prior expectations: a high dependence on the right-side of the matrix (bottleneck and strategic quadrant), a low dependence on the left-side of the matrix (non-critical and leverage). However, this

250
conclusion can not be drawn for the supplier’s dependence. On average, the dependence of the supplier is only in accordance with the expected values in the bottleneck and the non-critical: relatively low. Remarkably, the supplier’s dependence in the leverage quadrant is much lower than we might have expected in advance: medium scores (2.8 and 3.0 on a 5-point scale). The same conclusion holds for the strategic quadrant, where the supplier’s dependence is medium in satisfactory partnerships (#7) and low in unsatisfactory relationships (#8 en #9). Especially scenario #7 is in deviance with priori expectations: we would have expected to find more balanced power-dependence relationships. From a buyer’s perspective this has resulted in some striking conclusions for the issue of power and dependence in the portfolio matrix: satisfactory partnerships are dominated by the supplier. Obviously, once a buyer has entered a partnership this results in a disproportionate raise in the dependence of the buyer on the supplying partner. We have defined the relative power position of the buyer as the net dependence: the difference between the supplier’s dependence and the buyer’s dependence (see the second last column of figure 6.13). According to the calculating method, the difference between supplier’s and buyer’s dependence is put on a scale from –4 (maximum supplier’s dominance) to + 4 (maximum buyer’s dominance. In our study it is found that buyer-supplier relationships are dominated by the supplier in the bottleneck quadrant and in all of the scenarios in the strategic quadrants. In contrast, the buyer is dominant in the non-critical and the leverage quadrants. In between a balance between buyer and supplier is attained. A move from leverage to strategic, as in scenario #6, is indicative of a balanced situation. Additional t-tests showed that in most of the scenarios the differences between supplier’s and buyer’s dependence were statistically significant with exceptions for scenario #6 with equal mutual dependence. The differences between the theoretical and the found balances of power are outlined in figure 6.13. The buyer dominance in the non-critical quadrant seems to be caused by slightly lower switching costs for the buyer and by a slightly higher availability of alternative trading partners, both in comparison with the supplier. The unexpected supplier dominance in case of the satisfactory partnerships (as in scenario #7) can be traced back to extremely high levels of logistical indispensability for the buyer. In addition, the buyer perceives that he: - has more need for the supplier’s technological expertise than vice versa, and - faces higher switching costs than the suppliers, and - has fewer alternative trading partners than the supplier. We have compared scenario #7, which reflects a longer-lasting partnership, with scenario #6 which corresponds to the beginning of such a partnership. From the buyer’s perspective the development of a strategic partnership with a supplier typically means that the buyer’s
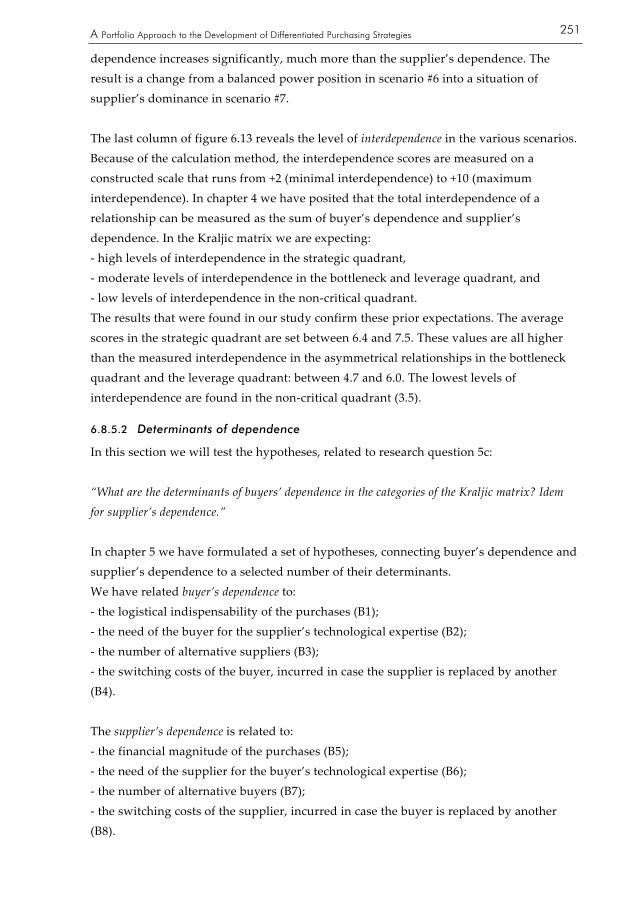
A Portfolio Approach to the Development of Differentiated Purchasing Strategies
251
dependence increases significantly, much more than the supplier’s dependence. The result is a change from a balanced power position in scenario #6 into a situation of supplier’s dominance in scenario #7. The last column of figure 6.13 reveals the level of interdependence in the various scenarios. Because of the calculation method, the interdependence scores are measured on a constructed scale that runs from +2 (minimal interdependence) to +10 (maximum interdependence). In chapter 4 we have posited that the total interdependence of a relationship can be measured as the sum of buyer’s dependence and supplier’s dependence. In the Kraljic matrix we are expecting: - high levels of interdependence in the strategic quadrant, - moderate levels of interdependence in the bottleneck and leverage quadrant, and - low levels of interdependence in the non-critical quadrant. The results that were found in our study confirm these prior expectations. The average scores in the strategic quadrant are set between 6.4 and 7.5. These values are all higher than the measured interdependence in the asymmetrical relationships in the bottleneck quadrant and the leverage quadrant: between 4.7 and 6.0. The lowest levels of interdependence are found in the non-critical quadrant (3.5).
6.8.5.2 Determinants of dependence
In this section we will test the hypotheses, related to research question 5c: “What are the determinants of buyers’ dependence in the categories of the Kraljic matrix? Idem for supplier’s dependence.” In chapter 5 we have formulated a set of hypotheses, connecting buyer’s dependence and supplier’s dependence to a selected number of their determinants. We have related buyer’s dependence to: - the logistical indispensability of the purchases (B1); - the need of the buyer for the supplier’s technological expertise (B2); - the number of alternative suppliers (B3); - the switching costs of the buyer, incurred in case the supplier is replaced by another (B4). The supplier’s dependence is related to: - the financial magnitude of the purchases (B5); - the need of the supplier for the buyer’s technological expertise (B6); - the number of alternative buyers (B7); - the switching costs of the supplier, incurred in case the buyer is replaced by another (B8).
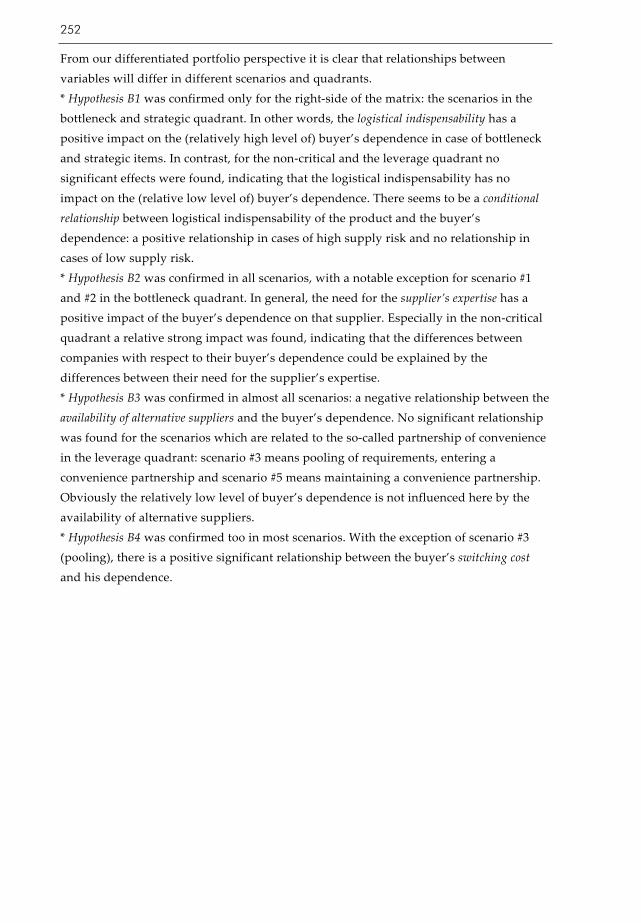
252
From our differentiated portfolio perspective it is clear that relationships between variables will differ in different scenarios and quadrants. * Hypothesis B1 was confirmed only for the right-side of the matrix: the scenarios in the bottleneck and strategic quadrant. In other words, the logistical indispensability has a positive impact on the (relatively high level of) buyer’s dependence in case of bottleneck and strategic items. In contrast, for the non-critical and the leverage quadrant no significant effects were found, indicating that the logistical indispensability has no impact on the (relative low level of) buyer’s dependence. There seems to be a conditional relationship between logistical indispensability of the product and the buyer’s dependence: a positive relationship in cases of high supply risk and no relationship in cases of low supply risk. * Hypothesis B2 was confirmed in all scenarios, with a notable exception for scenario #1 and #2 in the bottleneck quadrant. In general, the need for the supplier’s expertise has a positive impact of the buyer’s dependence on that supplier. Especially in the non-critical quadrant a relative strong impact was found, indicating that the differences between companies with respect to their buyer’s dependence could be explained by the differences between their need for the supplier’s expertise. * Hypothesis B3 was confirmed in almost all scenarios: a negative relationship between the availability of alternative suppliers and the buyer’s dependence. No significant relationship was found for the scenarios which are related to the so-called partnership of convenience in the leverage quadrant: scenario #3 means pooling of requirements, entering a convenience partnership and scenario #5 means maintaining a convenience partnership. Obviously the relatively low level of buyer’s dependence is not influenced here by the availability of alternative suppliers. * Hypothesis B4 was confirmed too in most scenarios. With the exception of scenario #3 (pooling), there is a positive significant relationship between the buyer’s switching cost and his dependence.
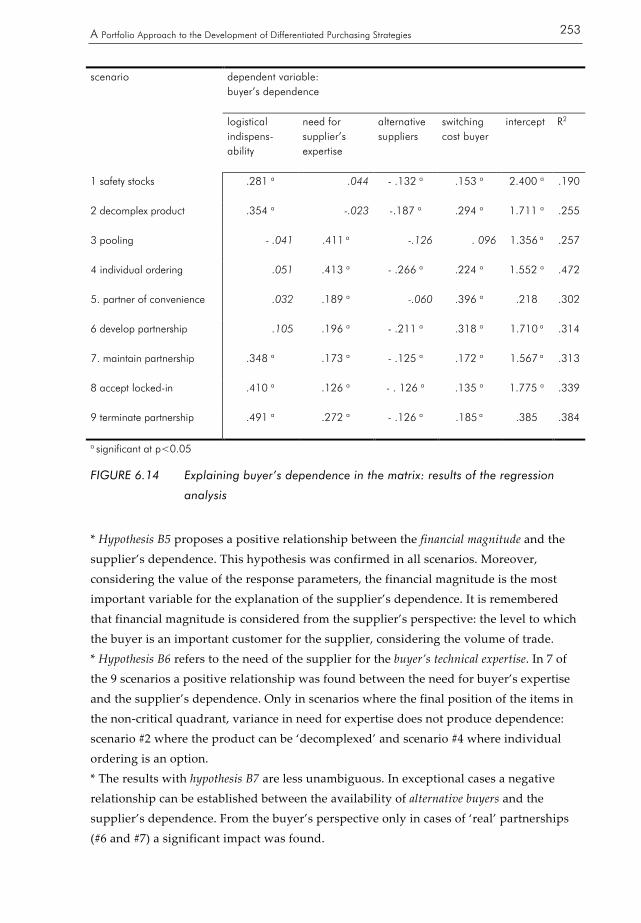
A Portfolio Approach to the Development of Differentiated Purchasing Strategies
253
scenario dependent variable:
buyer’s dependence
logistical indispens-ability
need for supplier’s expertise
alternative suppliers
switching cost buyer
intercept R2
1 safety stocks
.281 a .044 - .132 a .153 a 2.400 a .190
2 decomplex product
.354 a -.023 -.187 a .294 a 1.711 a .255
3 pooling
- .041 .411 a -.126 . 096 1.356 a .257 4 individual ordering .051 .413 a - .266 a .224 a 1.552 a .472 5. partner of convenience .032 .189 a -.060 .396 a .218 .302
6 develop partnership
.105 .196 a - .211 a .318 a 1.710 a .314 7. maintain partnership .348 a .173 a - .125 a .172 a 1.567 a .313
8 accept locked-in
.410 a .126 a - . 126 a .135 a 1.775 a .339
9 terminate partnership
.491 a .272 a - .126 a .185 a .385 .384
a significant at p<0.05
FIGURE 6.14 Explaining buyer’s dependence in the matrix: results of the regression
analysis
* Hypothesis B5 proposes a positive relationship between the financial magnitude and the supplier’s dependence. This hypothesis was confirmed in all scenarios. Moreover, considering the value of the response parameters, the financial magnitude is the most important variable for the explanation of the supplier’s dependence. It is remembered that financial magnitude is considered from the supplier’s perspective: the level to which the buyer is an important customer for the supplier, considering the volume of trade. * Hypothesis B6 refers to the need of the supplier for the buyer’s technical expertise. In 7 of the 9 scenarios a positive relationship was found between the need for buyer’s expertise and the supplier’s dependence. Only in scenarios where the final position of the items in the non-critical quadrant, variance in need for expertise does not produce dependence: scenario #2 where the product can be ‘decomplexed’ and scenario #4 where individual ordering is an option. * The results with hypothesis B7 are less unambiguous. In exceptional cases a negative relationship can be established between the availability of alternative buyers and the supplier’s dependence. From the buyer’s perspective only in cases of ‘real’ partnerships (#6 and #7) a significant impact was found.
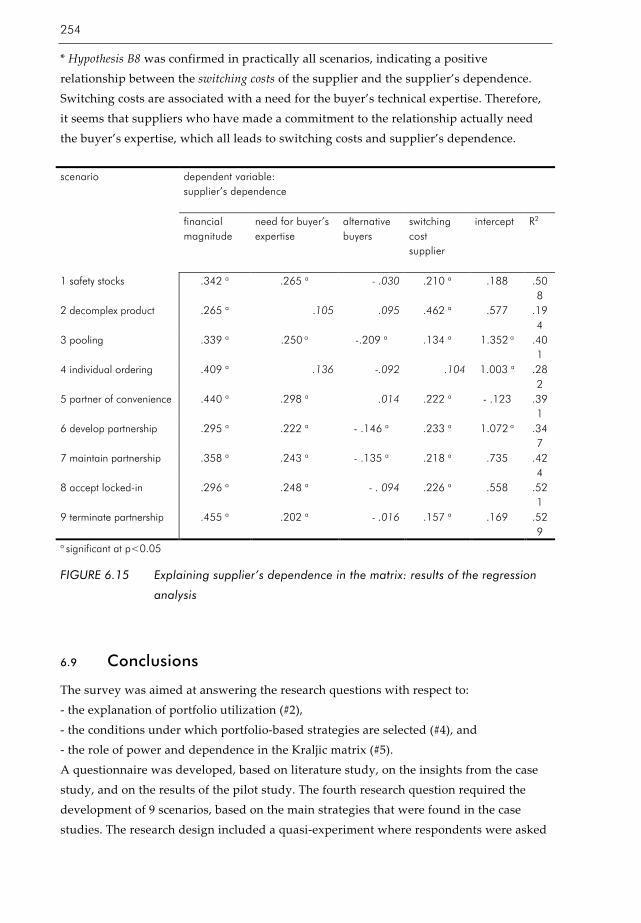
254
* Hypothesis B8 was confirmed in practically all scenarios, indicating a positive relationship between the switching costs of the supplier and the supplier’s dependence. Switching costs are associated with a need for the buyer’s technical expertise. Therefore, it seems that suppliers who have made a commitment to the relationship actually need the buyer’s expertise, which all leads to switching costs and supplier’s dependence. scenario dependent variable:
supplier’s dependence
financial magnitude
need for buyer’s expertise
alternative buyers
switching cost supplier
intercept R2
1 safety stocks
.342 a .265 a - .030 .210 a .188 .508
2 decomplex product
.265 a .105 .095 .462 a .577 .194
3 pooling
.339 a .250 a -.209 a .134 a 1.352 a .401
4 individual ordering
.409 a .136 -.092 .104 1.003 a .282
5 partner of convenience
.440 a .298 a .014 .222 a - .123 .391
6 develop partnership
.295 a .222 a - .146 a .233 a 1.072 a .347
7 maintain partnership
.358 a .243 a - .135 a .218 a .735 .424
8 accept locked-in
.296 a .248 a - . 094 .226 a .558 .521
9 terminate partnership
.455 a .202 a - .016 .157 a .169 .529
a significant at p<0.05
FIGURE 6.15 Explaining supplier’s dependence in the matrix: results of the regression
analysis
6.9 Conclusions
The survey was aimed at answering the research questions with respect to: - the explanation of portfolio utilization (#2), - the conditions under which portfolio-based strategies are selected (#4), and - the role of power and dependence in the Kraljic matrix (#5). A questionnaire was developed, based on literature study, on the insights from the case study, and on the results of the pilot study. The fourth research question required the development of 9 scenarios, based on the main strategies that were found in the case studies. The research design included a quasi-experiment where respondents were asked
A Portfolio Approach to the Development of Differentiated Purchasing Strategies
255
to evaluate a series of questions for the scenarios, relating to the conditions that constitute a relationship-dependence profile. Answering more than 175 questions is likely to produce non-response problems. However, the special measures turned out to be rather effective, resulting in a response rate of 20.6% (n=238). Additional statistical analysis indicated that the study does not suffer from non-response bias. With respect to the explanation of the use of the purchasing portfolio tool, the most important findings are: - Portfolio analysis delivers what it is supposed to: provide additional understanding of problems and possibilities of purchasing and provide assistance in the process of developing differentiated purchasing strategies. - Users contrast in a positive way with non-users of the portfolio, especially on their purchasing’s professionalism (skills) and their contributions to the competitive position of the company. In addition it was found that the portfolio was relatively more used by larger companies with higher purchasing shares. With respect to the conditions-research question, statistical tests revealed the significant differences between the relationship-dependence profiles of the scenarios. The analysis of differences was conducted at the quadrant-level within the Kraljic matrix. A pair-wise comparison of profiles was used in our search for conditions under which the various purchasing strategies are selected. The main findings of this condition-seeking research strategy are: - A move from the bottleneck quadrant to the non-critical quadrant is only an option if the conditions are satisfied, concerning the possibilities for standardization and the availability of alternative suppliers. - A move from the non-critical quadrant to the leverage quadrant is only feasible if there is a sufficient volume of trade, as perceived by the supplier (financial magnitude) and an ample availability of alternative suppliers. - In the leverage quadrant: the main condition for engaging in a partnership with a supplier is related to already higher levels of supplier’s dependence and especially buyer’s dependence. In addition, there is more commitment towards the future partner. - Satisfactory partnerships in the strategic quadrant are distinguished from unsatisfactory ‘partnerships’ by higher levels of supplier’s dependence, trust and commitment. - An unsatisfactory ‘partnership’ in the strategic quadrant will be terminated, if the buyer is convinced that there are relatively more alternative suppliers. Accepting a locked-in situation (scenario #8) is accompanied by a higher level of calculative commitment, terminating a partnership (scenario #9) is associated with a lower level of competence trust.

256
Next we have analyzed the issue of power-and-dependence in the portfolio matrix. We have calculated interdependencies and the power positions of the buyer in the Kraljic categories and we have compared them with prior theoretical expectations. Most remarkable was the observed supplier dominance in case of all of the 3 scenarios in the strategic quadrant. The results may shed a different light on the buyer’s view on issues of power and dependence: even satisfactory partnerships are dominated by the supplier. The observed buyer dominance in the non-critical quadrant seemed to be caused by slightly lower switching costs for the buyer and by a slightly higher availability of alternative trading partners, both in comparison with the supplier. We found an expected supplier dominance in the bottleneck quadrant, and an expected buyer dominance in the leverage quadrant. The observed levels of total interdependence were completely in accordance with prior expectations: ‘highest’ in the strategic quadrant, ‘moderate’ in the bottleneck and leverage quadrant, and ‘lowest’ in the non-critical quadrant. Finally, we have explained the buyer’s dependence and the supplier’s dependence from a limited number of explanatory variables (‘determinants of dependence’). We have established different conditional relationships in categories of the Kraljic matrix for most of the explanatory variables: - A conditional relationship between the logistical indispensability of a product and the buyer’s dependence: a positive relationship in cases of high supply risk (on the right side of the matrix) and no relationship in cases of low supply risk (on the left side of the matrix). - A conditional relationship between the need for the supplier’s expertise and the buyer’s dependence: no relationship in case of bottleneck items and a positive relationship in case of non-critical, leverage and strategic items. - For practically all scenarios it was found that both the availability of alternative suppliers and the switching costs of the buyer have a significant impact on the buyer’s dependence. - A positive relationship between the financial magnitude and the supplier’s dependence in all scenarios. - There is a positive relationship between the need for the buyer’s technical expertise and the supplier’s dependence, except for non-critical items for which no impact was established. - For practically all scenarios it was found that both the availability of alternative buyers and the switching costs of the supplier have a significant impact on the supplier’s dependence.
257
7 Conclusions and recommendations
In this final chapter we will present the main conclusions, by summarizing the answers to the research questions of this research project. In addition, recommendations will be made for practitioners and for academics. The recommendations for business are intended to provide guidance for the application of a purchasing portfolio approach. Researchers with an interest in buyer-supplier relationships may benefit from the insights and the experiences of this research project. The chapter is completed by some suggestions for further research.
7.1 Conclusions and main findings
Kraljic published his seminal paper in 1983, introducing a comprehensive portfolio model for purchasing management. Although other models have been developed, Kraljic’s approach subsequently became the dominant approach in the profession. This study started with the observation that there is a striking contrast between the growing use and acceptance of purchasing portfolio models and research into the actual use of such models. Most publications are conceptual or anecdotal by nature. In addition there are unanswered questions with respect to the theoretical foundations of the Kraljic approach. The main objective of this research project is to gain a better understanding of: - the theoretical and conceptual foundations of purchasing portfolio models, - the actual use of purchasing portfolio models in practice, and - how they could be used by purchasing professionals in order to pursue differentiated purchasing strategies. In line with these objectives, we have posed five main research questions: 1. What are the differences and similarities of the various purchasing portfolio models? 2. Which factors would explain the utilization of the purchasing portfolio analysis? 3. How are portfolio models employed by experienced purchasing professionals? 4. Under which conditions are the various portfolio-based strategies selected in purchasing management? 5. What is the role of power and dependence in the Kraljic approach? In order to answer these questions, we have combined three research methods: a literature study, a series of explorative case studies and a large scale survey among purchasing professionals at industrial companies in The Netherlands, successively. The methods were used in a complementary way. The results of the literature study were used in the case studies and in the survey, findings of the case studies were input for the
258
design of the survey and the questionnaire. Each research method has its own characteristics and its own strong points, which makes it more appropriate for answering certain types of research questions. In this section we will present the main conclusions of this research project, organized according to the research questions.
Research question 1
What are the differences and similarities of the various purchasing portfolio models? The comparison of portfolio models has concentrated on the following four elements: (1) dimensions, (2), categories, (3) strategic recommendations, and (4) acceptance and adoption of the various models. The analysis of literature made clear that Kraljic (1977, 1983) introduced the first comprehensive portfolio approach for purchasing and supply management. Many years after the introduction, a reasonable amount of evidence can be found that Kraljic’s basic ideas and concepts represent the dominant approach in the profession. Other authors have used Kraljic’s basic ideas for the development of rather similar models. Some changed the labels of categories (e.g. Elliott-Shircore and Steel, 1985), some adapted the dimensions (e.g. Hadeler and Evans, 1994; Olsen and Ellram, 1997), others elaborated on the recommendations for the leverage, the non-critical and the bottleneck category (Van Weele, 1992; Syson, 1992). The comparison of the various portfolio models has shown that there are more similarities than differences. Most approaches use practically the same dimensions as the Kraljic matrix, the same categories and the same recommendations.

A Portfolio Approach to the Development of Differentiated Purchasing Strategies
259
FIGURE 7.1 Kraljic’s categories and strategic recommendations
Kraljic’s approach includes the construction of a portfolio matrix that classifies products on the basis of two dimensions: profit impact and supply risk (‘low’ and ‘high’). The result is a 2x2 matrix and a classification in four categories: bottleneck, non-critical, leverage and strategic items. Each of the four categories requires a distinctive approach towards suppliers (see figure 7.1). Non-critical items require efficient processing, product standardization, order volume and inventory optimization. Leverage items allow the buying company to exploit its full purchasing power, for instance through tendering, target pricing and product substitution. Bottleneck items cause significant problems and risks which should be handled by volume insurance, vendor control, security of inventories and backup plans. A further analysis of the strategic items is recommended. We agree with Nellore and Söderquist (2000) who contended that all purchasing portfolio approaches basically use the same three steps: the analysis of products and their classification in a matrix (diagnosis), the analysis of required supplier relationships to deliver the products (objectives), and the development of action plans in order to bridge the gap between current and required supplier relationships (strategies). In addition, the analysis of literature has indicated that no significant differences have been found in the general approach of the various portfolio models in purchasing. The Kraljic matrix is the dominant approach in the profession.
260
Research question 2
Which factors would explain the utilization of the purchasing portfolio analysis? A number of sources reported on the growing use of the portfolio analysis in practice (e.g. Lamming and Harrison, 2001; Van Weele, 2000; Kamann, 2000a; Boodie, 1997), while other publications claim that the opposite is true (e.g. Christopher and Jüttner, 2000; Olsen and Ellram, 1997). Most of these claims do not refer to concrete numbers of portfolio users in practice. The survey resulted in facts and figures about the actual utilization of the portfolio analysis. It was found that 73.8% of the respondents are using portfolio analysis in their purchasing practice. Taking differences in company size into account (SME’s versus larger companies), we calculated a weighted average use frequency of almost 60% for manufacturing companies in The Netherlands. Based on literature study five groups of variables were found, to describe and explain the differences between users and non-users of a portfolio approach: the company size, the share of purchasing, the position of the purchasing, the professionalism of purchasing, and the orientation of purchasing. These variables entered a use model. The results indicated that the portfolio was relatively more used by larger companies with higher purchasing shares. Statistical analysis proved that users contrast sharply and positively with non-users of the portfolio approach, especially on their: - purchasing’s professionalism (skills), and - their contributions to the competitive position of the company. The results underscored our main conclusion that portfolio use is positively related with the maturity of purchasing within companies, expressed by the position and the professionalism of the purchasing function. Reasons for not using the portfolio were found to be a lack of knowledge, a lack of time as well as perceptions on the limitations of the tool. We have investigated and quantified the direct accountable impact of portfolio use, operationalized as to what extent users: - experience additional understanding of current purchasing problems and possibilities (1), and - develop differentiated strategies for their purchasing and supplier management (2). These effects are considered as intermediary measures for overall purchasing performance measures. Analysis confirmed that the portfolio technique ‘delivers’ what it is supposed to: it significantly adds to the understanding of situations (diagnostic purpose), and it assists the process of developing strategies (prescriptive purpose).

A Portfolio Approach to the Development of Differentiated Purchasing Strategies
261
Research question 3
How are portfolio models employed by experienced purchasing professionals? The research project began with the contention that little is known about the actual process of using purchasing portfolio models. The literature study identified a number of problems and unanswered questions, referring to the measurement of variables, the disregard for the supplier’s side, the selection of strategies based on two dimensions, the limited and deterministic character of the strategic recommendations, and the absence of explicit movements within the matrix. The critique of the Kraljic approach however does not include the experience of practitioners. How do experienced professionals handle such issues in practice? What could we learn from their experience? The case studies addressed the gap between conceptual problems and practical solutions, identifying and describing advanced uses of a purchasing portfolio approach. Explorative case studies revealed the way in which experienced practitioners handle the main measurement issues and strategic issues in practice. The investigated cases provided useful insights in the possibilities and actual use of purchasing portfolio analysis. In the case studies we found a variety of approaches and differences of scope and scale, which have to be viewed in the specific business context. The cases studies revealed three distinctive methods of measuring variables and weighting factors: (1) consensus method (2) one-by-one method (3) weighted factor score method. Each method satisfies the needs and expectations of the different users. The reason for this can be found in the additional steps that have to be taken in the portfolio analysis. Before strategic actions are determined, it is imperative to complete a further process of interpreting and reflecting on the results. The positioning of items in the matrix should be considered as the starting point of portfolio analysis, definitely not the finishing point. It is imperative that users reflect on the results. If necessary, manual adjustments should be made. In-depth discussions on the positions in the matrix are considered as the most important phase of the analysis. Strategic discussions provide deeper insights and may lead more easily to consensus-based decisions. It is felt by the users that the Kraljic framework facilitates these important discussions to a large extent. Some argue that the complexity of business decisions does not allow for simple recommendations. How could one deduce strategies from a portfolio analysis that is based on just two basic dimensions (e.g. Dubois and Pedersen, 2002: 40)? Actually, the answer is simple: one cannot. In addition to the various factors that constitute the two
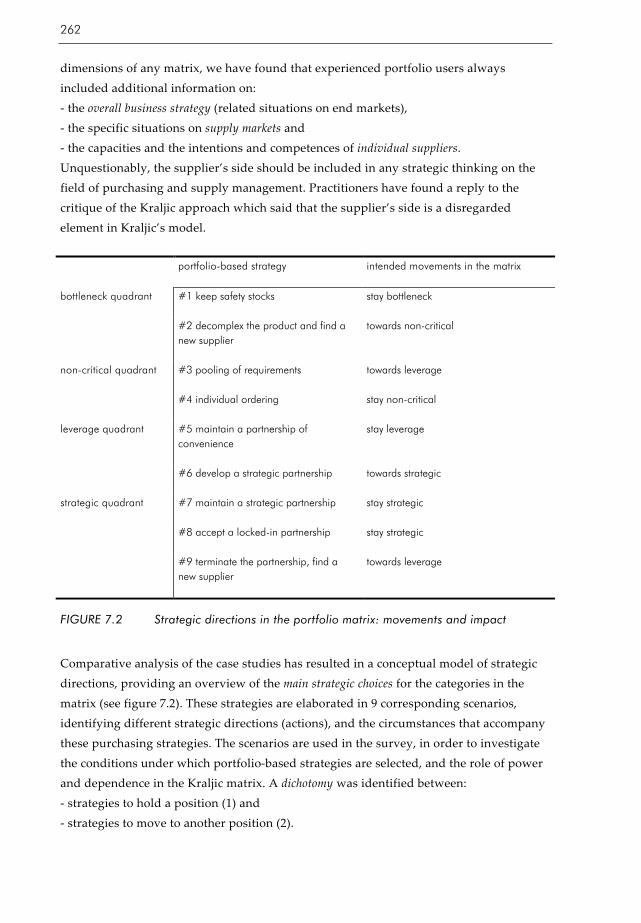
262
dimensions of any matrix, we have found that experienced portfolio users always included additional information on: - the overall business strategy (related situations on end markets), - the specific situations on supply markets and - the capacities and the intentions and competences of individual suppliers. Unquestionably, the supplier’s side should be included in any strategic thinking on the field of purchasing and supply management. Practitioners have found a reply to the critique of the Kraljic approach which said that the supplier’s side is a disregarded element in Kraljic’s model. portfolio-based strategy
intended movements in the matrix
#1 keep safety stocks
stay bottleneck bottleneck quadrant
#2 decomplex the product and find a new supplier
towards non-critical
#3 pooling of requirements
towards leverage non-critical quadrant
#4 individual ordering
stay non-critical
#5 maintain a partnership of convenience
stay leverage leverage quadrant
#6 develop a strategic partnership
towards strategic
#7 maintain a strategic partnership
stay strategic
#8 accept a locked-in partnership
stay strategic
strategic quadrant
#9 terminate the partnership, find a new supplier
towards leverage
FIGURE 7.2 Strategic directions in the portfolio matrix: movements and impact
Comparative analysis of the case studies has resulted in a conceptual model of strategic directions, providing an overview of the main strategic choices for the categories in the matrix (see figure 7.2). These strategies are elaborated in 9 corresponding scenarios, identifying different strategic directions (actions), and the circumstances that accompany these purchasing strategies. The scenarios are used in the survey, in order to investigate the conditions under which portfolio-based strategies are selected, and the role of power and dependence in the Kraljic matrix. A dichotomy was identified between: - strategies to hold a position (1) and - strategies to move to another position (2).

A Portfolio Approach to the Development of Differentiated Purchasing Strategies
263
At the right side of the matrix (in the bottleneck and the strategic areas) movements are pursued in order to reduce a high level of supply risk. In terms of the matrix, this means moving to the left. Non-critical items are preferably moved upwards and exceptionally leverage positions are exchanged for strategic positions. These are the most common movements within the matrix. From the buyer’s perspective a new classification of partnerships was found, related to the portfolio matrix: - partners of convenience, located in the leverage quadrant, where relationships are dominated by the buyer; - strategic partnerships, located somewhere in the middle of the leverage and strategic quadrant, further characterized as balanced relationships based on a high level of mutual dependence; - locked-in ‘partnerships’, located at the right side of the strategic quadrant, where relationships are dominated by suppliers, who are indispensable for the buyer.
Research question 4
Under which conditions are the various portfolio-based strategies selected in purchasing management? The possibilities for selecting purchasing strategies are obviously limited by external conditions. The questionnaire included an elaboration of the 9 purchase situations in scenarios. Each scenario contains a description of: - the selected portfolio-based purchasing strategy, - Kraljic’s dimensions (profit impact and supply risk), and - additional specific conditions for the selection of the purchasing strategy. In this study we have introduced and used the concept of relationship-dependence profile, as an instrument to measure the values and impact of conditions that accompany a scenario. A relationship-dependence profile includes a limited number of key factors appropriate to characterize different types of buyer-supplier relationships. Based on literature study and based on the results of the case studies, four main groups are set to form a relationship-dependence profile: - determinants of buyer’s dependence (logistical indispensability, need for the supplier’s technological expertise, availability of alternative suppliers, switching cost for the buyer); - determinants of supplier’s dependence (financial magnitude, need for the buyer’s technological expertise, availability of alternative buyers, switching cost for the supplier); - relationship characteristics: trust and commitment (competence trust, goodwill trust, affective commitment, calculative commitment) - the nature of specifications (product customization, possibilities for standardization). A combination of these factors is addressed to as a relationship-dependence profile.
264
By comparing the relationship dependence profiles of two scenarios in the same quadrant, it was possible to test whether these profiles differ significantly. Pairwise comparison of relationship profiles showed that all differences are significant at the p<0.05 level. In other words: there are statistically significant differences between the profiles that fit alternative strategic choices in the same portfolio quadrant. In addition, an explorative investigation was conducted, in search for statistically differences between profiles in each quadrant. Differences were traced back to the variables that constitute a profile. This condition-seeking research strategy resulted in an overview of conditions under which the various purchasing strategies are selected. The main findings are: - in the bottleneck quadrant: a strategic move to the non-critical quadrant is only an option if the conditions are satisfied, concerning the possibilities for standardization and the availability of alternative suppliers. - in the non-critical quadrant: the switch towards the leverage quadrant is only feasible if there is a sufficient volume of trade, as perceived by the supplier (financial magnitude) and an ample availability of alternative suppliers. - in the leverage quadrant: the main conditions for engaging in a partnership with a supplier are related to already higher levels of supplier’s dependence and especially of buyer’s dependence. In addition, there is more commitment towards the future partner. - in the strategic quadrant (1): satisfactory partnerships in the strategic quadrant are distinguished from unsatisfactory ‘partnerships’ by higher levels of supplier’s dependence, trust and commitment. - in the strategic quadrant (2): if it is decided that an unsatisfactory ‘partnership’ should be terminated and that a new supplier should be found, beforehand the buyer has a favorable judgement on the availability of alternative suppliers. Accepting a locked-in situation is accompanied by a higher level of calculative commitment; terminating a partnership is associated with a lower level of competence trust.
Research question 5
What is the role of power and dependence in the Kraljic approach? Literature study confirmed that power and dependence are very important in understanding buyer/supplier relationships. There are indications that power and dependence are important as well in the Kraljic approach, considering some of the recommendations and the general idea of the portfolio approach: “to minimize supply vulnerability and make the most of potential buying power” (Kraljic, 1983, 112). An in-
A Portfolio Approach to the Development of Differentiated Purchasing Strategies
265
depth analysis of the Kraljic approach, the dimensions and the recommendations, has provided a new perspective on the Kraljic matrix, making a reasonable case that the resource dependence theory should be considered as the (implicitly applied) theoretical foundation for the Kraljic portfolio approach. The literature study made clear that a comprehensive view of the dyadic nature of buyer-supplier relationships should include the assessment of: (1) the difference between buyer’s and supplier’s dependence (net dependence) which corresponds with the relative power between parties; (2) the sum of buyer’s and supplier’s dependence (total interdependence) which indicates the intensity and development phase of the relationship between parties. We have applied these key concepts to the Kraljic matrix, comparing theoretical expectations with the empirical findings (see figure 7.3). Most remarkable is the observed supplier dominance in case of all of the 3 scenarios in the strategic quadrant. Especially the unexpected dominance in the satisfactory partnerships, from the buyer’s perspective. The results have shed a different light on the buyer’s view on issues of power and dependence: even satisfactory partnerships are dominated by the supplier. Obviously, once a buyer has entered a partnership this results in a disproportionate raise in the dependence of the buyer on the supplying partner. We have explained this finding by extremely high levels of logistical indispensability for the buyer. In addition, the buyer perceives that he: - has more need for the supplier’s technological expertise than vice versa, and - faces higher switching costs than the suppliers, and - has fewer alternative trading partners than the supplier The buyer dominance in the non-critical quadrant seemed to be caused by slightly lower switching costs for the buyer and by a slightly higher number of alternative trading partners, both in comparison with the supplier. The observed levels of total interdependence were completely in accordance with prior expectations.
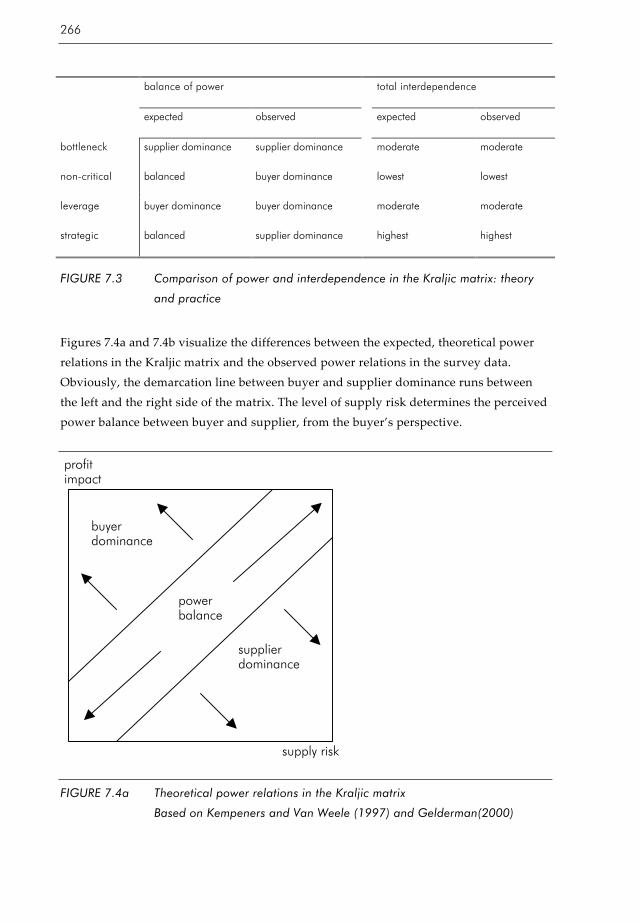
266
balance of power
total interdependence
expected observed
expected observed
bottleneck supplier dominance supplier dominance
moderate moderate
non-critical balanced buyer dominance
lowest lowest
leverage buyer dominance buyer dominance
moderate moderate
strategic balanced supplier dominance
highest highest
FIGURE 7.3 Comparison of power and interdependence in the Kraljic matrix: theory
and practice
Figures 7.4a and 7.4b visualize the differences between the expected, theoretical power relations in the Kraljic matrix and the observed power relations in the survey data. Obviously, the demarcation line between buyer and supplier dominance runs between the left and the right side of the matrix. The level of supply risk determines the perceived power balance between buyer and supplier, from the buyer’s perspective.
FIGURE 7.4a Theoretical power relations in the Kraljic matrix
Based on Kempeners and Van Weele (1997) and Gelderman(2000)
buyer dominance
supplier dominance
power balance
profit impact
supply risk

A Portfolio Approach to the Development of Differentiated Purchasing Strategies
267
FIGURE 7.4b Observed power relations in the Kraljic matrix
In this research project we have elaborated on the determinants of organizational dependence. Analysis of literature suggested that organizational dependence is a function of the importance of the exchanged resources and the substitutability of the source. Analysis of various conceptual and empirical studies to the determinants of dependence has laid the foundation for a tentative model, which was adapted and improved by the reactions and comments of purchasing practitioners (case studies). The literature review revealed that most empirical studies, involving ‘dependence’-issues, selected organizational dependence as an explanatory variable. In contrast a very limited number of empirical studies was devoted to the explanation of organizational dependence. In addition, no studies were found that made a distinction between different types of buyer-supplier relationships, let alone that a distinction was made between the categories in a purchasing portfolio approach. The results of our study therefore have tapped new sources of knowledge, explaining the buyer’s dependence (and the supplier’s dependence) in the different portfolio categories. In line with the portfolio perspective in this study, we have found different relationships and different determinants for different categories. This means there are conditional relationships for most of the explanatory variables. Findings of interest are: - there is a conditional relationship between the logistical indispensability of a product and the buyer’s dependence: a positive relationship in cases of high supply risk (at the right side of the matrix) and no relationship in cases of low levels of supply risk (at the left side of the matrix);
buyer dominance
power balance
profit impact
supply risk
supplier dominance

268
- there is a conditional relationship between the need for the supplier’s expertise and the buyer’s dependence: no relationship in case of bottleneck items and a positive relationship in case of non-critical, leverage and strategic items; - for practically all scenarios it was found that the availability of alternative suppliers and the switching costs of the buyer have both a significant impact on the buyer’s dependence; - a positive relationship between the financial magnitude and the supplier’s dependence in all scenarios; - there is a positive relationship between the need for the buyer’s technical expertise and the supplier’s dependence, except for non-critical items for which no impact was established; - for practically all scenarios it was found that both the availability of alternative buyers and the switching costs of the supplier have a significant impact on the supplier’s dependence.
7.2 Reflection on the methodology
In every study decisions have to be made regarding the methodology. In this section we will reflect on some of these decisions and we will discuss the major limitations of this research. In addition we will share some insights that we have acquired on some specific research issues.
(1) Limitations of the study
All companies in this study are located in the Netherlands and they are manufacturing companies. These limitations imply that the results may not be transferable to other countries and other branches. A replication of our study could reveal similarities and differences, indicating whether or not we can generalize from our findings. Another significant limitation of this study is that we have focussed on the buyer’s perspective. Obviously, dyadic data would present a richer picture, although there would be almost insurmountable problems identifying the perceptions of corresponding suppliers. More importantly, we have made a deliberate and argued choice for the buyer’s side. The limitation to the buyer’s perspective is justified by the main object of our research project, to describe and explain the selection of purchasing and supplier strategies by means of a (purchasing) portfolio approach. This does not mean that the supplier’s side is neglected in this study. On the contrary, it means that we have included the buyer’s perceptions regarding the supplier’s side. Assessing buyer’s perceptions is the most meaningful way to measure variables, since purchasing decisions are actually made on buyer’s perceptions of the relevant conditions. To conclude, in line with the objectives and the perspective of the overall study, it was most sensible to measure perceptions from the buyer’s perspective. In this study we have combined three methods: an extensive literature study, a series of in-depth case studies and a large scale survey among purchasing professionals. We are convinced that such a combination of methods is necessary for any in-depth study of

A Portfolio Approach to the Development of Differentiated Purchasing Strategies
269
research topics in the field of business administration. Although the combination of methods has proved to be very useful, there are limitations. The use of any research method implies dealing with the usual limitations. Case studies are not suitable for testing propositions and hypotheses, whereas survey studies do not allow for exploring and identifying advanced business practices. These general limitations should not pose problems since each research method is aimed at the specific objectives and research questions at hand. Beyond the general limitations, there are some specific limiting factors. The findings of the case studies are based on a rather limited number of three cases. We have captured the portfolio application in the context of three different companies: the corporate level, the level of a multinational business unit and the level of a fairly small company. Additional research in different types of companies could reveal other and similar advanced purchasing portfolio practices. The comparison with other companies could identify differences, to be explained by company specific-factors, such as company size, organizational structure, technology, customers, network position, and organizational culture. The survey among purchasing practitioners yielded a satisfactory response rate of 20.6% (n = 238). Statistical analysis indicated that the survey data did not suffer from non-response bias. However, due to the composition of the NEVI-database, large firms were over-represented in the sample in comparison with the proportion of SME’s. The design of the questionnaire was characterized by the use of scenarios. The external validity of experimental designs are usually problematic because of the artificial manipulations of variables and situations. Although this was also true for our design, we have made an effort to reduce the problems of validity, by basing the scenarios on the empirical findings of the previous case studies and by testing and improving them in a pilot study. However, there is no evidence in the study with which to test whether there is respondent’s bias in the answers that can be ascribed to different interpretations of the scenarios. In addition, respondents might be inclined to produce ‘socially desirable’ perceptions, building a logically consistent picture which may not coincide with reality. This limitation however is usually associated with the use of a survey methodology, assessing respondent’s perceptions.
(2) A scenario method versus a key supplier perspective
The unit of analysis in purchasing research, using a survey method, is usually the buying company or a purchasing professional. In many studies respondents are asked to answer questions that refer to their ‘suppliers’ in general. Obviously, it might not always be appropriate to ask for the ‘average relations with all suppliers’. Alternatively respondents are often asked to express their opinions and views on their relationship with a single (type of) supplier. In our view, most empirical studies in purchasing are limited to questions that relate to the major or the largest supplier. Instructions for
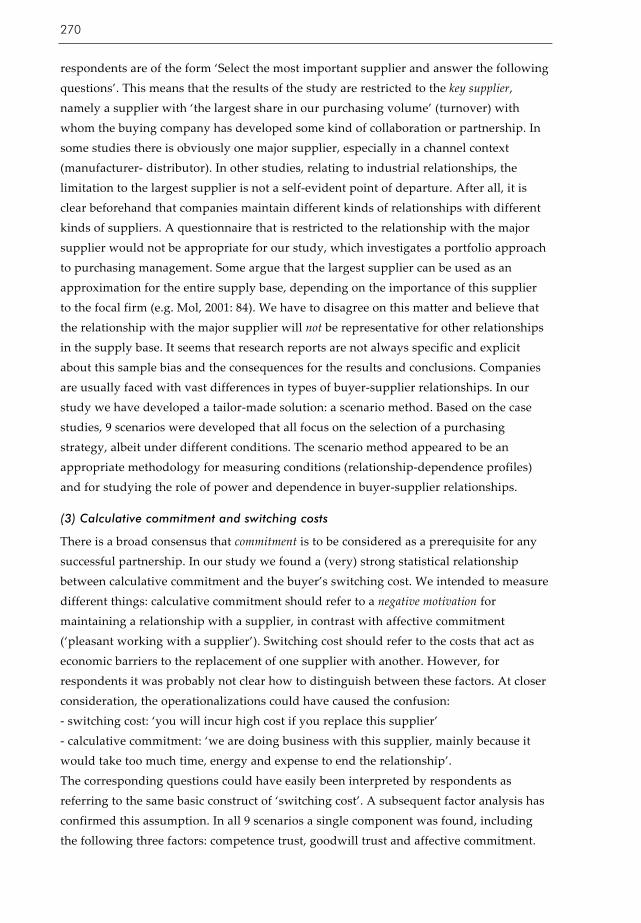
270
respondents are of the form ‘Select the most important supplier and answer the following questions’. This means that the results of the study are restricted to the key supplier, namely a supplier with ‘the largest share in our purchasing volume’ (turnover) with whom the buying company has developed some kind of collaboration or partnership. In some studies there is obviously one major supplier, especially in a channel context (manufacturer- distributor). In other studies, relating to industrial relationships, the limitation to the largest supplier is not a self-evident point of departure. After all, it is clear beforehand that companies maintain different kinds of relationships with different kinds of suppliers. A questionnaire that is restricted to the relationship with the major supplier would not be appropriate for our study, which investigates a portfolio approach to purchasing management. Some argue that the largest supplier can be used as an approximation for the entire supply base, depending on the importance of this supplier to the focal firm (e.g. Mol, 2001: 84). We have to disagree on this matter and believe that the relationship with the major supplier will not be representative for other relationships in the supply base. It seems that research reports are not always specific and explicit about this sample bias and the consequences for the results and conclusions. Companies are usually faced with vast differences in types of buyer-supplier relationships. In our study we have developed a tailor-made solution: a scenario method. Based on the case studies, 9 scenarios were developed that all focus on the selection of a purchasing strategy, albeit under different conditions. The scenario method appeared to be an appropriate methodology for measuring conditions (relationship-dependence profiles) and for studying the role of power and dependence in buyer-supplier relationships.
(3) Calculative commitment and switching costs
There is a broad consensus that commitment is to be considered as a prerequisite for any successful partnership. In our study we found a (very) strong statistical relationship between calculative commitment and the buyer’s switching cost. We intended to measure different things: calculative commitment should refer to a negative motivation for maintaining a relationship with a supplier, in contrast with affective commitment (‘pleasant working with a supplier’). Switching cost should refer to the costs that act as economic barriers to the replacement of one supplier with another. However, for respondents it was probably not clear how to distinguish between these factors. At closer consideration, the operationalizations could have caused the confusion: - switching cost: ‘you will incur high cost if you replace this supplier’ - calculative commitment: ‘we are doing business with this supplier, mainly because it would take too much time, energy and expense to end the relationship’. The corresponding questions could have easily been interpreted by respondents as referring to the same basic construct of ‘switching cost’. A subsequent factor analysis has confirmed this assumption. In all 9 scenarios a single component was found, including the following three factors: competence trust, goodwill trust and affective commitment.
A Portfolio Approach to the Development of Differentiated Purchasing Strategies
271
Consistently, calculative commitment showed low factor loadings on this ‘commitment and trust’-component and high factor loadings on the components that include ‘switching cost buyer’. We propose to use a continuum that runs from ‘compliance’ to ‘commitment’. The values of this relationship-motivation variable reflect the willingness to be engaged in a trading relationship. Compliance captures the unwilling dimension of behavioral shifts, while commitment is viewed as the willing dimension (affective commitment).
(4) Professionalism and orientation of purchasing
We have identified the maturity of the purchasing function as a key variable for gaining insights in the utilization and effectiveness of a portfolio approach in purchasing. To a large extent we have used the operationalization of Rozemeijer (2000) who identified ‘position of purchasing’, ‘purchasing’s professionalism’, and ‘purchasing orientation’ as the main factors, constituting the construct variable ‘purchasing maturity’. In our study purchasing’s professionalism has been measured by two items, referring to the skills of purchasing personnel for working in cross-functional teams and for developing purchasing and supplier strategies. Three dimensions of ‘orientation’ have been distinguished: collaboration with suppliers (1), tough negotiations in pursuit of the lowest prices (2), and the engagement of purchasers in clerical duties and operational activities (3). To gain more insight in the structure of the explaining variables, an additional factor analysis was conducted. The results are shown in figure 7.5, based on a principal component analysis (extraction method) and a varimax rotation (rotation method). The shaded cells show relatively high factor loadings (> .60). Three components remained, explaining 66.8% of total variance. The first component highly corresponds to the two variables that are selected to operationalize the ‘position of purchasing’-construct. The second component corresponds to two elements of the ‘orientation’-construct: orientation on collaboration and orientation on negotiation and lowest prices. As expected, they are negatively correlated. These findings are very much in line with our prior expectations. For the third component however, the matter is different. This component clearly includes the two ‘skills’-variables, but in addition there is a strong negative relationship with the last orientation-variable, the variable that refers to clerical and operational activities. Obviously, especially an orientation on these inferior purchasing activities is negatively associated with the extent to which purchasing professionals in a company dispose of substantial skills for working in cross-functional teams and for developing purchasing and supplier strategies. To conclude, the findings of the factor analysis largely confirmed prior expectations, but an exception has to be made for the clerical orientation-variable which is not connected to the other two orientation-items. Instead, a clerical orientation is (negatively) connected to the professional skills of purchasers (professionalism). This means that an orientation on these inferior purchasing activities is negatively associated with the extent to the level of professionalism of purchasers. In our

272
view, the professionalism of purchasing is reflected by the skills of purchasers and their (negative) orientation towards and engagement in clerical activities. Future research could profit from this suggestion.
Components
1
2 3
contributes to competitive position
.80 .00 .14
reports to top management
.81 .00 .11
skills for cross functional teams
.22 .00 .86
skills for developing strategies
.15 .00 .83
orientation on clerical and operational activities
.00 .20 -.66
orientation on collaboration
.33 -.71 .15
orientation on negotiation and lowest prices
.25 .82 .00
FIGURE 7.5 Factor analysis for 7 explanatory variables: the rotated component matrix
7.3 Recommendations for business
In this section we will present recommendations for (potential) users of a purchasing portfolio approach. Practitioners might benefit from a 5-step approach that is developed mainly with insights from observations and interviews of the case studies. We have observed that in the course of time the Kraljic approach has entered many textbooks on purchasing and supply management. Strikingly, (intended) practitioners will search in vain for practical guidelines that might help them to introduce and apply this purchasing portfolio approach. Most publications do not address the main issues and how the portfolio analysis could or should be used in practice. This section aims to address this gap, identifying issues and providing answers and solutions.
7.3.1 Adopting a portfolio approach
Undoubtedly non-users will have their reasons for not using a portfolio approach. Our research indicated that the main reasons for not using the portfolio refer to a lack of time and/or knowledge and to the perceived limitations of the tool. A lack of time is a matter of priority, a lack of knowledge can be set to rights, while the perceived limitations should be weighed against the attributed benefits. As we have concluded earlier the portfolio technique ‘delivers’ what it is supposed to: it adds to the understanding of purchasing
A Portfolio Approach to the Development of Differentiated Purchasing Strategies
273
situations (diagnostic purpose), and it assists the process of developing differentiated purchasing strategies (prescriptive purpose). That is why we would break a lance for a purchasing portfolio approach, especially considering the positive experiences from users and the resulting impact. In every case-company a champion was found who supported the portfolio analysis. These ‘product champions’ were the highest purchasing professionals in the organization. It should be noted that performing a portfolio analysis involves team work. The views of colleagues from different fields of expertise should be added to the more functional purchasing perspective. For a designer ‘replaceability’ might be important, while the production manager might focus on ‘risk of failure’. For reasons of support and implementation a cross functional team is required, with representatives from all relevant departments and specialist fields. Considerable time and energy will have to be spent in the preparation phase, getting the organization ‘ready for action’. Top management will have to be convinced of the project, but also (line) managers from other departments. Some practitioners get off on the wrong foot when they try to implement Kraljic’s portfolio approach for the very first time. They underestimate the preparation phase and the choices that have to be made, when implementing a purchasing portfolio approach. When applying the portfolio approach for the first time, it is recommended to start with a relatively simple design and a relatively small scope. For successful further adoption, the first experience should be positive and should result in a (predictable) success. Within easy reach are results in the non-critical category, where bundling of items is possible and where a switch toward the leverage category is possible. In our experience, companies without much purchasing sophistication are usually faced with a non-critical quadrant ‘packed’ with low value items that are ordered individually from a large number of suppliers. Another option would be to identify the largest uncovered supply risks and try to find a solution. It is not unusual for companies not to have contracts for some of their main strategic products. Based on the successes of a pilot project, management may be excited about the further possibilities. In the long term, a successful application of the portfolio approach is only possible when it is actually supported by the highest executive officer that is responsible for purchasing. Anyone who wishes to get going with the portfolio analysis, is confronted with a number of practical problems and decisions. A first issue is the level of aggregation: whether individual items, or smaller or broader product groups will be positioned in the matrix. What is the unit of analysis? A decision has to be made at the very start of any portfolio project. The purchasing portfolio analysis allows for very different modes of application. Depending on the objectives, conditions and available time and resources, the following considerations might be helpful, when deciding on aggregation issues:
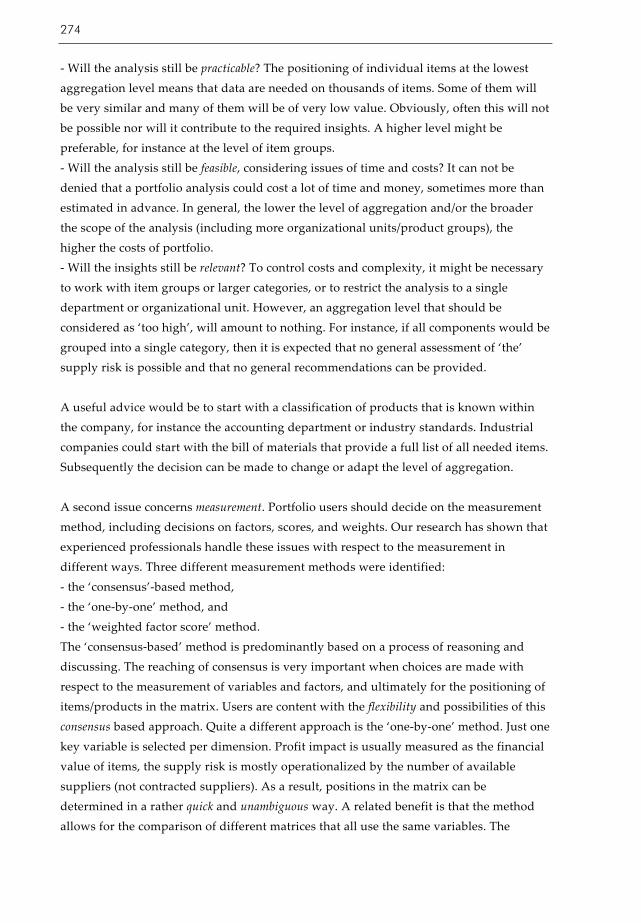
274
- Will the analysis still be practicable? The positioning of individual items at the lowest aggregation level means that data are needed on thousands of items. Some of them will be very similar and many of them will be of very low value. Obviously, often this will not be possible nor will it contribute to the required insights. A higher level might be preferable, for instance at the level of item groups. - Will the analysis still be feasible, considering issues of time and costs? It can not be denied that a portfolio analysis could cost a lot of time and money, sometimes more than estimated in advance. In general, the lower the level of aggregation and/or the broader the scope of the analysis (including more organizational units/product groups), the higher the costs of portfolio. - Will the insights still be relevant? To control costs and complexity, it might be necessary to work with item groups or larger categories, or to restrict the analysis to a single department or organizational unit. However, an aggregation level that should be considered as ‘too high’, will amount to nothing. For instance, if all components would be grouped into a single category, then it is expected that no general assessment of ‘the’ supply risk is possible and that no general recommendations can be provided. A useful advice would be to start with a classification of products that is known within the company, for instance the accounting department or industry standards. Industrial companies could start with the bill of materials that provide a full list of all needed items. Subsequently the decision can be made to change or adapt the level of aggregation. A second issue concerns measurement. Portfolio users should decide on the measurement method, including decisions on factors, scores, and weights. Our research has shown that experienced professionals handle these issues with respect to the measurement in different ways. Three different measurement methods were identified: - the ‘consensus’-based method, - the ‘one-by-one’ method, and - the ‘weighted factor score’ method. The ‘consensus-based’ method is predominantly based on a process of reasoning and discussing. The reaching of consensus is very important when choices are made with respect to the measurement of variables and factors, and ultimately for the positioning of items/products in the matrix. Users are content with the flexibility and possibilities of this consensus based approach. Quite a different approach is the ‘one-by-one’ method. Just one key variable is selected per dimension. Profit impact is usually measured as the financial value of items, the supply risk is mostly operationalized by the number of available suppliers (not contracted suppliers). As a result, positions in the matrix can be determined in a rather quick and unambiguous way. A related benefit is that the method allows for the comparison of different matrices that all use the same variables. The

A Portfolio Approach to the Development of Differentiated Purchasing Strategies
275
‘weighted factor score’ method is well-known and allows for a completely customized approach, when deciding on factors, weights, and (usually) scores. The decision on the measurement method can be based on the following selection criteria, that are derived from the specific advantages and disadvantages of the methods: - the required objectiveness (high?, then 1-to-1) - number of key factors (high?, then consensus or weighted factors) - available time (‘no’ time?, then consensus or 1-to-1) - needed customization and flexibility (high?, then weighted factors) The positioning of items in the matrix should be considered as the starting point of portfolio analysis, definitely not the finishing point. It is imperative that users reflect on the results. If necessary, manual adjustments should be made. We consider in-depth discussions on the positions in the matrix as the most important aspect of the analysis. To our view the Kraljic framework facilitates these important discussions to a large extent. To conclude, adopting a portfolio approach could work as a catalyst for change within the company. The Kraljic matrix provides a practical framework for the non-purchasing specialist, when analyzing and discussing purchasing issues. We have found that the utilization of a portfolio approach is associated with higher levels of purchasing’s professionalism (development of skills and competences) and in a better position of purchasing within the company (recognition, status, contribution to the overall competitive position). The portfolio project could put purchasing higher on the company’s strategic agenda, clarifying the problems and possibilities of purchasing and supplier management.
7.3.2 A 5-step approach to the application of purchasing portfolio analysis
In this section we will introduce and describe an outline for the application of the portfolio analysis. It consists of 5 successive steps and the main questions and issues that have to be addressed (see figure 7.6).

276
FIGURE 7.6 A 5-step approach to portfolio analysis
Ad 1 The preparation
The complete process of the portfolio analysis could take quite some time. Therefore it is imperative to start with an adequate preparation. For reasons of support and implementation a cross-functional team is required, with representatives from all relevant departments and specialist fields. Considerable time and energy will have to be spent in the preparation phase, getting the organization ‘ready for action’. Top management will have to be convinced of the project, but also (line) managers from other departments. The first step requires the formation of a team and a clear description of its mission. The preparation phase is completed when the following questions are answered: - What is the objective of the analysis? - What information is available and/or needed? - What are the limiting conditions in terms of time and money? - Who will participate in the team?
Ad 2 Design and filling in the matrix
The next step is designing and filling in the matrix. In designing the matrix the main issues are the level of aggregation, the selection of dimensions, variables and their operationalizations, and the measurement method. In determining the level of aggregation, there is a wide range of possibilities. This can vary from individual components to complete assemblies or even suppliers. The first option might result in the positioning of thousands of components, which will lead to an unworkable situation. As
1. Preparation
2. Design and filling in the matrix
3. Interpretation of results
4. Strategic actions
5. Evaluation and follow-up

A Portfolio Approach to the Development of Differentiated Purchasing Strategies
277
a rule, the grouping of items will be necessary, but without an unacceptable loss of information and relevance. The level of aggregation should be linked to the level on which it is useful to select (differentiated) purchasing strategies. This means that major or unique purchases should always be classified individually, while other purchases should be classified by commodity groups or type of buy. If there are important individual items within a commodity group with significant other values on the two dimensions of the matrix, those should be taken out and analyzed separately. To conclude, there should be a balance between relevance and practicability, when deciding on the level of aggregation. The dimensions ‘profit impact’ and ‘supply risk’ can be interpreted in many different ways. What are the constituting factors? Kraljic stated the following factors: For profit impact: - Purchase volume - Percentage of total purchase value - Impact on product quality - Impact on market growth For supply risk: - Availability/scarcity of the product - Number of available suppliers - Substitution possibilities - Possibilities to switch between make or buy - Risk of transport and storage. However, as recognized by Kraljic, these lists are not exhaustive. Other factors could be relevant for both dimensions. Within the project team consensus should be found concerning the used variables and the way these variables are measured. To avoid misunderstanding and unproductive discussions later on, the team has to come to an agreement on the factors that constitute profit impact and supply risk. To get a first impression of the supply risk, one could always consider the number of (alternative) suppliers and the ease of switching to another supplier. To get a first impression of profit impact, one could look at the purchase value of the products (price x volume). From these points of departure the team should come to a tailor-made solution. In addition the team should decide on the measurement method, as discussed in section 7.3.1.
Ad 3 Interpretation of the results
Non-experienced portfolio users might underestimate the interpretation of a filled-in matrix. They might be in the supposition that the strategic actions can be derived from the matrix in a rather deterministic way: ‘if bottleneck, than strategy X’. We have
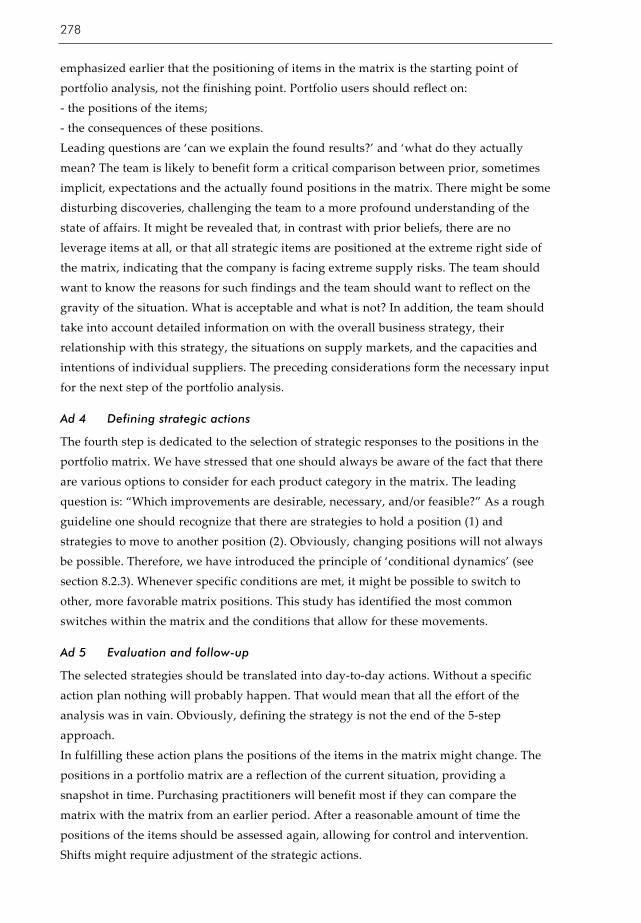
278
emphasized earlier that the positioning of items in the matrix is the starting point of portfolio analysis, not the finishing point. Portfolio users should reflect on: - the positions of the items; - the consequences of these positions. Leading questions are ‘can we explain the found results?’ and ‘what do they actually mean? The team is likely to benefit form a critical comparison between prior, sometimes implicit, expectations and the actually found positions in the matrix. There might be some disturbing discoveries, challenging the team to a more profound understanding of the state of affairs. It might be revealed that, in contrast with prior beliefs, there are no leverage items at all, or that all strategic items are positioned at the extreme right side of the matrix, indicating that the company is facing extreme supply risks. The team should want to know the reasons for such findings and the team should want to reflect on the gravity of the situation. What is acceptable and what is not? In addition, the team should take into account detailed information on with the overall business strategy, their relationship with this strategy, the situations on supply markets, and the capacities and intentions of individual suppliers. The preceding considerations form the necessary input for the next step of the portfolio analysis.
Ad 4 Defining strategic actions
The fourth step is dedicated to the selection of strategic responses to the positions in the portfolio matrix. We have stressed that one should always be aware of the fact that there are various options to consider for each product category in the matrix. The leading question is: “Which improvements are desirable, necessary, and/or feasible?” As a rough guideline one should recognize that there are strategies to hold a position (1) and strategies to move to another position (2). Obviously, changing positions will not always be possible. Therefore, we have introduced the principle of ‘conditional dynamics’ (see section 8.2.3). Whenever specific conditions are met, it might be possible to switch to other, more favorable matrix positions. This study has identified the most common switches within the matrix and the conditions that allow for these movements.
Ad 5 Evaluation and follow-up
The selected strategies should be translated into day-to-day actions. Without a specific action plan nothing will probably happen. That would mean that all the effort of the analysis was in vain. Obviously, defining the strategy is not the end of the 5-step approach. In fulfilling these action plans the positions of the items in the matrix might change. The positions in a portfolio matrix are a reflection of the current situation, providing a snapshot in time. Purchasing practitioners will benefit most if they can compare the matrix with the matrix from an earlier period. After a reasonable amount of time the positions of the items should be assessed again, allowing for control and intervention. Shifts might require adjustment of the strategic actions.

A Portfolio Approach to the Development of Differentiated Purchasing Strategies
279
Portfolio analysis should be included in the overall process of planning and control. This means that the portfolio analysis should be conducted at least once a year. And it means that portfolio-based strategies should be aimed at specific portfolio-based objectives. These objectives should be concrete, measurable and they should be included in the purchasing plan. To conclude, practitioners might benefit from this 5-step approach. The approach is based on the observations and the interviews during the case studies. Distinctive features are: - it identifies the sequence and the substance of the main activities; - the approach is based on insights form experienced portfolio users; - it recognizes different possibilities of designing the matrix and of handling measurement problems; - it emphasizes that reflection on a (filled) matrix is more important than the matrix as such (‘the matrix is the starting point of the analysis, not the finishing point’); - it elaborates on the possibilities to formulate differentiated purchasing and supplier strategies, including a focus on moving items to better positions in the matrix, whenever the conditions allow for these strategic switches.
7.3.3 Conditional dynamics in the matrix: managing power and dependence
In this section we will address the issue of strategic switch in the portfolio matrix: how are changes pursued and under which conditions? For these problems we have found the principle of conditional dynamics: switching to another position in the matrix will depend on the conditions that make it desirable and feasible. As we shall see, there is a close connection with the problems of how to manage power and dependence in supplier relations. We will provide guidelines for each category in the matrix, elaborating on practical questions: ‘what do we need to know?’ and ‘what can we do?’
(1) Bottleneck items
Guiding principle: The bottleneck quadrant should be as empty as possible Potential switch: Towards the non-critical quadrant Conditions: Possibilities for standardization and availability of alternative
suppliers. Dependence: Aimed at reducing the buyer’s dependence What do we need to know? For the assessment of bottleneck situation we need to have detailed information regarding suppliers and supply markets on the one hand and product specifications on the other hand. Some items have become a bottleneck as a result of over-specification. In many industrial companies there is a natural desire to want “the best”. It is imperative to find out whether limiting specifications are really necessary or merely desirable. The

280
leading principle should be: ‘fit-for-use’ (value analysis). Supply markets can be explored differently with new, less restrictive specifications in search for appropriate suppliers. Sometimes it will be possible to snare a supplier who is currently supplying a leverage or strategic items: cross sourcing. Purchasers should be alert to the possibilities within the current supply base. Insourcing might be another option, resulting from a make-or-buy analysis. What can we do? Our study revealed that the logistical indispensability of bottleneck items has a significant impact on the level of buyer’s dependence. If we can reduce our dependence on the supplier, then the bottleneck item will be moved towards the non-critical quadrant. Should that not be possible, then we will have to accept and deal with the bottleneck position: ‘stay in the corner and make the best of it’. Without removing the causes for our dependence on the supplier, we should reduce any detrimental consequence of being dependent. The responsibility of the buyer might be: - to close long-term contracts, if necessary under unfavorable conditions; - to include a clause in the contract which says that the supplier should inform the buyer betimes whenever he is considering to terminate the production of the item; - to conduct a further risk analysis and make a contingency plan; - to keep extra safety stocks if no alternatives are feasible.
(2) Non-critical items
Guiding principle: The non-critical quadrant should only contain items that have to be ordered individually, otherwise they should be pooled.
Potential switch: Towards the leverage quadrant. Conditions: The pooling of requirements is possible, leading to a volume of
trade which is of sufficient financial magnitude from a supplier’s perspective.
Dependence: Aimed at increasing the supplier’s dependence. What do we need to know? We have to find out whether the pooling of requirements is possible, which will probably imply the standardization of specifications. The benefits of pooling can only be gained when implemented on a large scale, contracting a single, preferred supplier. A catalogues system (e-procurement) might be feasible. In terms of power and dependence, we are aiming at a more powerful position by increasing the supplier’s dependence (financial magnitude).

A Portfolio Approach to the Development of Differentiated Purchasing Strategies
281
What can we do? A switch toward the leverage quadrant has significant consequence: bundling of items into larger packages, supply base reduction, tendering and negotiating a beneficial contract with a single supplier (systems contracting). Whenever bundling is not an option, the items will have to be ordered individually at relatively high cost. Purchasers may have to deal with internal political arguments rather than technical or economical arguments against pooling. Companies with an underdeveloped purchasing function are likely to have a non-critical quadrant which is overflowed by a mass of ‘special’ items. They obviously are not making appropriate use of their potential buying power.
(3) Leverage items
Guiding principle: The leverage quadrant is allowed to be as full as possible. Potential switch: In exceptional cases, towards the strategic quadrant. Conditions: The supplier is able and willing to cooperate and contribute
more significantly to the company’s competitive position. Dependence: Aimed at an increase of mutual dependence. What do we need to know? It should be emphasized that a leverage position in the Kraljic matrix does not always imply buyer dominance. The vertical axis of the matrix measures the financial value of items (‘profit impact’) for the buyer. It should be recognized however, that the distinction between low and high values is not determined from the supplier’s perspective. A certain amount of money could be assessed as ‘ high’ by the buyer, but at the same time as ‘low’ by the supplier. This might be the case for commodities that are purchased in oligopolistic supply markets. It is therefore imperative that the buyer knows how important the volume of trade actually is for the supplier, largely indicating the level of supplier’s dependence. The purchaser is usually in a comfortable position, making advantage of his buying power. Occasionally there might be a possibility for a further development of the buyer-supplier relationship into a more balanced and mutually committed partnership. An in-depth assessment of the supplier, including his capabilities and intentions, should provide the required information. Manufacturing companies will only want key suppliers to enter the strategic quadrant. Such main suppliers are capable of co-design and co-makership in combination with a positive attitude toward the partnership. What can we do? In most cases leverage items will not be moved to the strategic quadrant. The buyer usually wants to make advantage of the many possibilities of a leverage position, such as: - obtaining favorable contractual conditions; - making use of the buying power in negotiations;

282
- applying competitive bidding; - closing short term contracts, aimed at maximum supplier performance; - periodical supplier evaluation in combination with a periodical decision process whether to switch or not to another supplier. In this thesis we have introduced the term ‘partner of convenience’ for suppliers in the leverage quadrant. The implication of the concept should not be misunderstood. Such suppliers are in fact usually very important for companies and not just for the delivery of office supplies (facility buying). Companies need to contract smaller technologically advanced firms with an excellent record on quality, delivery times, flexibility and prices. These firms are asked to contribute to the optimization of the logistical coordination in the supply chain. Alternatively, there is much more to the scope and the impact of a ‘real’ strategic partnership, compared to a partnership of convenience. The development of a strategic partnership entails mutual trust and commitment, which results in a higher level of mutual dependence. Obviously, from the perspective of the buying company a voluntary rise of the buyer’s dependence will have to be matched by a proportional increase of the supplier’s dependence. The partners will have a mutual need for each other’s technological expertise and will both face higher switching costs, due to relationship specific investments. The chosen supplier will have to enter a partnership program, based on a mutual agreement on the intention, direction and expectations of the partnership. Early supplier involvement is a logical consequence of the technological collaboration that will be important in any strategic supplier partnership.
(4) Strategic items
Guiding principle: The strategic quadrant should preferably only contain items that are purchased from high-performing suppliers on the basis of mutual trust, commitment and partnership.
Potential switch: In case of unsatisfactory ‘partnerships’ towards the leverage quadrant.
Conditions: Availability of alternative suppliers (not locked-in) and a limited need for the supplier’s technological expertise.
Dependence: Aimed at reducing the buyer’s dependence. What do we need to know? Mutual dependence is generally considered as a necessary condition for any long-lasting collaboration with suppliers that is to the satisfaction of both parties. From the perspective of the buyer it is important to guard against a disproportional increase of the supply risk and the vulnerability of the company. The dependence of the buyer could result in insurmountable switching costs. A critical point of interest however, is the actual supplier’s dependence. The buyer will have to gain in-depth knowledge of the position of
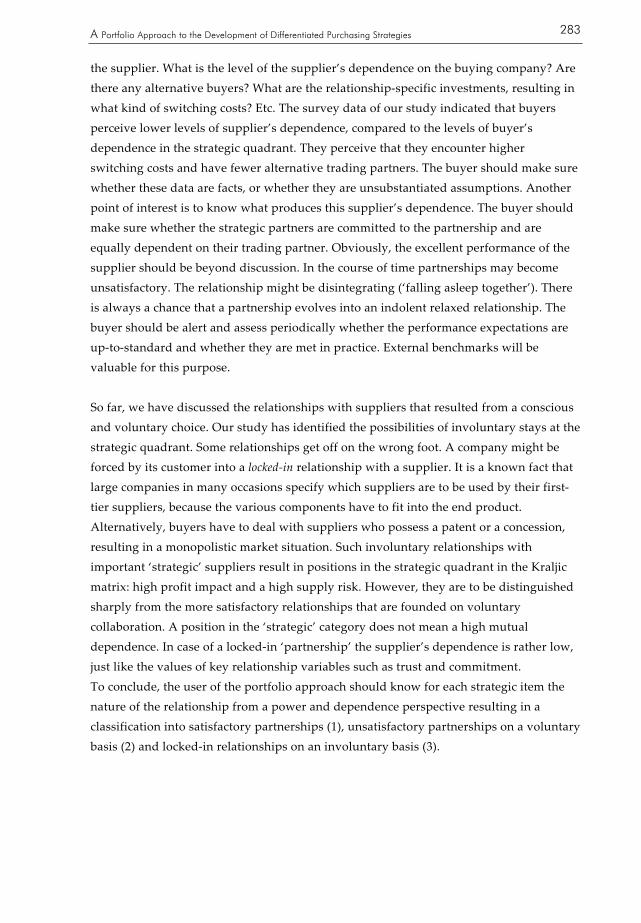
A Portfolio Approach to the Development of Differentiated Purchasing Strategies
283
the supplier. What is the level of the supplier’s dependence on the buying company? Are there any alternative buyers? What are the relationship-specific investments, resulting in what kind of switching costs? Etc. The survey data of our study indicated that buyers perceive lower levels of supplier’s dependence, compared to the levels of buyer’s dependence in the strategic quadrant. They perceive that they encounter higher switching costs and have fewer alternative trading partners. The buyer should make sure whether these data are facts, or whether they are unsubstantiated assumptions. Another point of interest is to know what produces this supplier’s dependence. The buyer should make sure whether the strategic partners are committed to the partnership and are equally dependent on their trading partner. Obviously, the excellent performance of the supplier should be beyond discussion. In the course of time partnerships may become unsatisfactory. The relationship might be disintegrating (‘falling asleep together’). There is always a chance that a partnership evolves into an indolent relaxed relationship. The buyer should be alert and assess periodically whether the performance expectations are up-to-standard and whether they are met in practice. External benchmarks will be valuable for this purpose. So far, we have discussed the relationships with suppliers that resulted from a conscious and voluntary choice. Our study has identified the possibilities of involuntary stays at the strategic quadrant. Some relationships get off on the wrong foot. A company might be forced by its customer into a locked-in relationship with a supplier. It is a known fact that large companies in many occasions specify which suppliers are to be used by their first-tier suppliers, because the various components have to fit into the end product. Alternatively, buyers have to deal with suppliers who possess a patent or a concession, resulting in a monopolistic market situation. Such involuntary relationships with important ‘strategic’ suppliers result in positions in the strategic quadrant in the Kraljic matrix: high profit impact and a high supply risk. However, they are to be distinguished sharply from the more satisfactory relationships that are founded on voluntary collaboration. A position in the ‘strategic’ category does not mean a high mutual dependence. In case of a locked-in ‘partnership’ the supplier’s dependence is rather low, just like the values of key relationship variables such as trust and commitment. To conclude, the user of the portfolio approach should know for each strategic item the nature of the relationship from a power and dependence perspective resulting in a classification into satisfactory partnerships (1), unsatisfactory partnerships on a voluntary basis (2) and locked-in relationships on an involuntary basis (3).
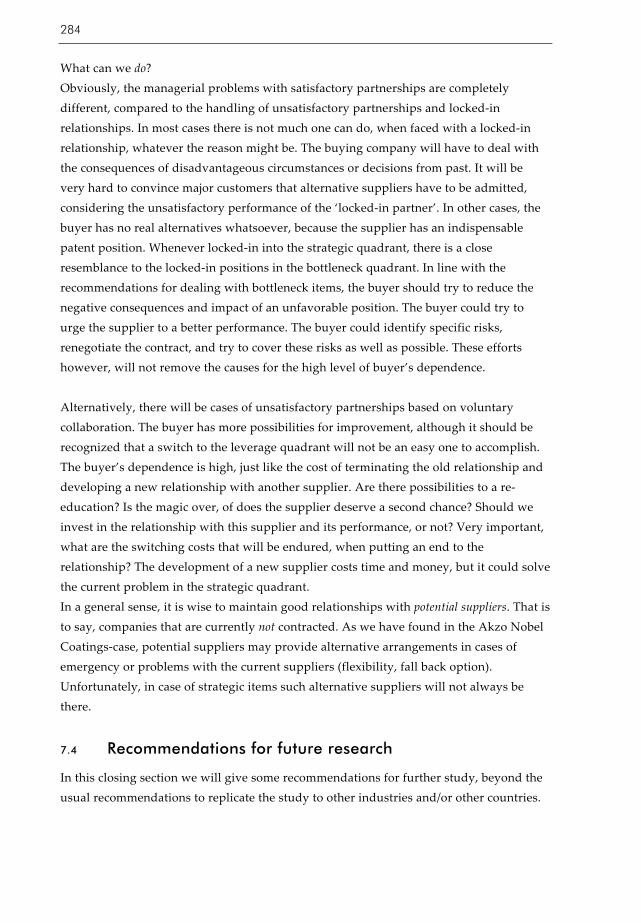
284
What can we do? Obviously, the managerial problems with satisfactory partnerships are completely different, compared to the handling of unsatisfactory partnerships and locked-in relationships. In most cases there is not much one can do, when faced with a locked-in relationship, whatever the reason might be. The buying company will have to deal with the consequences of disadvantageous circumstances or decisions from past. It will be very hard to convince major customers that alternative suppliers have to be admitted, considering the unsatisfactory performance of the ‘locked-in partner’. In other cases, the buyer has no real alternatives whatsoever, because the supplier has an indispensable patent position. Whenever locked-in into the strategic quadrant, there is a close resemblance to the locked-in positions in the bottleneck quadrant. In line with the recommendations for dealing with bottleneck items, the buyer should try to reduce the negative consequences and impact of an unfavorable position. The buyer could try to urge the supplier to a better performance. The buyer could identify specific risks, renegotiate the contract, and try to cover these risks as well as possible. These efforts however, will not remove the causes for the high level of buyer’s dependence. Alternatively, there will be cases of unsatisfactory partnerships based on voluntary collaboration. The buyer has more possibilities for improvement, although it should be recognized that a switch to the leverage quadrant will not be an easy one to accomplish. The buyer’s dependence is high, just like the cost of terminating the old relationship and developing a new relationship with another supplier. Are there possibilities to a re-education? Is the magic over, of does the supplier deserve a second chance? Should we invest in the relationship with this supplier and its performance, or not? Very important, what are the switching costs that will be endured, when putting an end to the relationship? The development of a new supplier costs time and money, but it could solve the current problem in the strategic quadrant. In a general sense, it is wise to maintain good relationships with potential suppliers. That is to say, companies that are currently not contracted. As we have found in the Akzo Nobel Coatings-case, potential suppliers may provide alternative arrangements in cases of emergency or problems with the current suppliers (flexibility, fall back option). Unfortunately, in case of strategic items such alternative suppliers will not always be there.
7.4 Recommendations for future research
In this closing section we will give some recommendations for further study, beyond the usual recommendations to replicate the study to other industries and/or other countries.
A Portfolio Approach to the Development of Differentiated Purchasing Strategies
285
(1) Impact and implementation
Future research could include an empirical study to the actual, direct impact of the application of a portfolio approach. The required research methodology should begin with the development of performance measures. A distinction should be made between the impact of the introduction of the tool in companies (first-time use) and the impact of a long-standing application (repeated use). Adopting a portfolio approach could work as a catalyst for change, leading the way to a more professional, mature and sophisticated purchasing function. Immediate success is warranted, considering the new insights that are to be attributed to portfolio use. To gain a deeper understanding of the adoption of the portfolio tool, we recommend a series of action research studies aimed at identifying normative guidelines for the implementation and the assessment of the full impact of the portfolio approach. These action research studies should include ‘before’ and ‘after’ measurement of key variables in order to determine accountable changes. Another possibility would be the use of critical incident techniques to shed more light on complex managerial problems relating to the development and implementation of portfolio-based purchasing strategies. Perhaps even more challenging would be some research focussed on the impact of a repeated use, in terms of performance measures that count to top management. Only longitudinal studies in companies could provide information about the long-term impact and usefulness of the portfolio approach. Such research requires a complex design. The researcher should overcome the difficulties of attributing results of portfolio use and of comparing the use of the tool in different companies, because several company-specific factors are likely to influence the impact and implementation of portfolio use. In addition the personality of individual purchasers could be included as well, describing and explaining the use and effectiveness of the portfolio approach.
(2) A network perspective
We have investigated the portfolio approach to the development and selection of purchasing and supplier strategies. A portfolio approach views the supply base of the company as a portfolio of items and/or supplier relationships that have to be managed in a differentiated as well as integrated way. A matrix serves as the framework and point of departure for the development of appropriate purchasing strategies, differentiated of the various types of dyadic relationships with suppliers. However, there is support for a research tradition that does not agree with the focus on dyadic relationships as the unit of analysis. We are referring to the basic principles of the Industrial Network approach, also known as the Markets-as-Networks tradition. In their view research should be focussed on the behavioral actions within the wider network. McLoughin and Horan (2000: 289) for instance claim that “if one wanted to understand the process of exchange in one relationship, this could only be done by understanding the wider network of relationships within which the exchange takes place”. As Gadde and Snehota (2000:315)

286
put it: “… if we are to understand the interactive nature of customer-supplier relationships (…) the scope of the analysis needs to be broadened. Each relationship is dependent with a number of other relationships, together forming a network.” For example, when sourcing a new supplier, a buyer should consider the relationships that that supplier has with competing firms and perhaps with major customers. Developing the relationship with a certain supplier might give access to the supplier’s other relationships and their capabilities and resources. Many large companies specify which suppliers are to be used by their first-tier suppliers, mainly because particular critical components have to fit with other critical components (Johnsen et al., 2000). In the TE STRAKE case study we have acknowledged that companies can be obliged to enter into forced ‘partnerships’, mainly because the purchasing and supply strategies have to support the overall business strategy that focuses on the demands and requirements of the major customers. Without adding to an alleged controversy between a dyadic approach and a network approach to buyer-supplier relationships, we feel that there might be a case of false dichotomy. A network perspective does not exclude research which seeks to understand the nature of single buyer-supplier relationships (e.g. Brennan and Turnbull, 1999; McLoughlin and Horan, 2000). After all, it is recognized that dyadic relationships are the building blocks of networks (e.g. Harland, 1996). Obviously, companies will have to manage their dyadic exchange relationships with suppliers and customers. There are academics who believe that industrial networks cannot be managed, actors within them merely cope (Håkansson and Snehota, 1995). Lamming et al. (2000) agreed that networks cannot be managed, as it is impossible to control the activities and directions of other companies, which led Johnsen (2000) to the conclusion that “A better focus is the relationship between firms as the manageable entity”. However, it would be worthwhile to investigate the possibilities of transferring ideas and concepts (such as interconnectedness) into a purchasing portfolio approach. Is it possible to conceive a network as a manageable portfolio of interconnected relationships between actors? From the network aggregation level several questions have to be addressed. What are the possibilities to develop a matrix with a classification of relationships that reflects the resource ties between companies and the contributions to the overall network performance? What strategic recommendations could be given on how to manage network positions, and how to defend or develop them? Alternatively, we could return to the buyer’s perspective and investigate the impact and adaptations when including a network perspective. Perhaps we could use the ‘old’ Decision Making Unit-concept, borrowed from the marketing discipline, identifying the different types of actors and their functions and influence in a network.

A Portfolio Approach to the Development of Differentiated Purchasing Strategies
287
(3) Measuring power and dependence
We have acknowledged that the relative power of an organization over another is the result of the net dependence of one on the other (cf. Pfeffer, 1981; Dickson, 1983; Kumar et al., 1995; Geyskens et al., 1996). Our study has used this conceptualization for the measurement and quantification of ‘power’. We have actually determined numerical values for the relative power in buyer-supplier relationships, calculated as the difference between the supplier’s dependence and the buyer’s dependence. In addition we have specified and quantified regression models to explain the buyer’s dependence and the supplier’s dependence in various portfolio-based scenarios. We have used corresponding variables to explain buyer’s and supplier’s dependence (see figure 7.7). The data that we have gathered allow for the numerical specification of a new type of model that aims to explain ‘power’ in buyer-supplier relationships by corresponding determinants of buyer’s and supplier’s dependence. If: P = balance of power = supplier’s dependence – buyer’s dependence supplier’s dependence = f (financial magnitude, need for buyer’s expertise, availability of alternative buyers, switching costs for supplier) = f (X1s, X2s, X3s, X4s) buyer’s dependence = f (logistical indispensability, need for supplier’s expertise, availability of alternative suppliers, switching costs for buyer) = f (X1b, X2b, X3b, X4b) then we could specify: P = a + ß1 (X1s – X1b) + ß2 (X2s – X2b) + ß3 (X3s – X3b) + ß4 (X4s – X4b) In words: the balance of power is to be explained by variables that are calculated as the differences between corresponding determinants of buyer’s and supplier’s dependence. Of course, other variables could be used as well. The proposed operationalization and model specification might be a promising point of departure for quantitative research to the issues of power and dependence in buyer-supplier relationships. The value of the balance of power might be contingent to the sizes of the buying and the supplying companies. Alternatively, network positions or the positions in the supply chain could be included as a contingent factor.

288
Perspective
dependency component
supplier’s dependence
buyer’s dependence
dependency for the fulfillment of the primary function
financial magnitude X1s
logistical indispensability X1b
technological dependency
need for buyer’s expertise X2s
need for supplier’s expertise X2b
sources dependency
availability of alternative buyers X3s
availability of alternative suppliers X3b
economic dependency
switching cost supplier X4s
switching cost buyer X4b
FIGURE 7.7 Corresponding determinants of buyer’s and supplier’s dependence
Cox (2001) argued in favor of a power perspective on extended networks of buyer-supplier relationships. An analytical framework was presented, emphasizing the value appropriation in complex power regimes. Value appropriation refers to the net operating profits earned by companies participating in a supply chain. The framework predicts which parties will benefit more than others, based on the power relations in the various dyadic buyer-supplier relationships. It would be a challenge to operationalize the concepts and control the predictions of the model. It is worthwhile to investigate the impact of power and dependence on the distribution of profits. More in general, further research should be directed towards the importance, impact and determinants of power relations in chains of interdependent companies (supply chain). We would like to break a lance for qualitative research which allows for in-depth listening to key informants, as opposed to ‘completing questionnaires’. Faria and Wensley (2002) investigated the ways in which first-tier suppliers responded to changes in customer requirements. Their research is based on the analysis of managerial narratives which revealed the discrepancies with mainstream management theories on networks and supply chain management. Surprising discoveries were for example the substantial expressions of power and conflict, the concerns with money and power, and the complete absence of the end customer in many of the narratives. To conclude, we would welcome research that is aimed at closing the gap between the mainstream management literature and the daily reality of power and dependence in buyer-supplier relations.

A Portfolio Approach to the Development of Differentiated Purchasing Strategies
289
(4) E-Procurement
Business world has observed an unprecedented hype regarding the Internet and e-business, which ended with the dotcom crisis of 2001. In the late nineties e-procurement was considered as the ‘revolution through electronic purchasing’. For instance Essig and Arnold (2001) predicted that “without doubt, e-procurement will dramatically change the way purchasing is done in the near future”. By now, we know that the predictions regarding revolutionary changes, have not proven correct. Leonard and Spring (2002) posited that the emphasis so far in applications of e-procurement has mainly been to release buyers from administrative chores, although such systems should support the strategic aspects of purchasing. Nevertheless, progress has been made, although at a much slower pace than expected. Companies are keeping distance from sky-high investments in e-procurement systems, whereas most e-market places are (mid 2002) faced with serious financial problems. Alternatively, more positive experiences can be observed with the implementation of catalogue systems, e-reverse auctions, e-tendering and e-sourcing. E-procurement applications have produced completely new subjects of research. In contrast, a rather limited number of empirical studies have reported on the actual implementations and impact of the various e-procurement solutions. In line with the issues raised in this study, we would recommend research to the relationship between e-procurement and the purchasing portfolio approach. Leonard and Spring (2002) have outlined some hypothesized effects of e-procurement in each of the quadrants of the Kraljic matrix: - Non-critical items: e-procurement can assist internally in building a catalogue of items against which decentralized units can place routine orders, consolidate these to facilitate logistics and the measurement of delivery and quality performance. - Leverage items: the role of e-procurement is in reducing the cost of requesting, receiving and analyzing tenders, so that it will be no more expensive (in time) to have fifty firms tendering than to have only three; ICT may also help interaction that precludes the need for visits and meetings (email, video conferencing, drawing exchange by CAD file, etc.). - Bottleneck items: e-procurement should offer some help, widening the search on the whole world at minimal expense, and could support iterative interaction with potential suppliers, for example in determining the design of a suitable replacement involving off-the-shelf parts. - Strategic items: the main active use of ICT within partnerships is anticipated to be in the reduction of cost and improvement of effectiveness and interaction and information transfer. This could range from simple messages transferred by e-mail, to virtual meetings of multi-site and multi-firm product-development teams. Future research could be of an explorative and descriptive nature, identifying actual e-procurement practice in relation to a portfolio approach. Conceivable research questions are: Which e-procurement solutions are actually deployed in the item categories of the

290
Kraljic matrix? Which strategies are selected and under which conditions? What is their impact on buyer-supplier relationships? What is their impact on performance measures like cost savings, reduced cycle times, and return on investments? As Van Weele (2001) pointed out, powerful suppliers will not always be willing to participate in the e-procurement solutions of buying companies. Virtual auctions seem appropriate for leverage items, while catalogue systems could be applied for the handling of non-critical items. Again, research should shed light on the relationship between e-procurement solutions and power and dependence in buyer-supplier relationships.

291
References
Achrol, R.S. and G.T. Gundlach (1999), ‘Legal and Social Safeguards Against Opportunism in Exchange’, Journal of Retailing, Vol. 75, No. 1, 107-124. Åhman, S. (2002), ‘Strategic Sourcing of Suppliers in a Supply Network’, Proceedings of the 11th International IPSERA Conference, Enschede, The Netherlands, 1-10. Aldrich, H. and S. Mindlin (1978), ‘Uncertainty and Dependence: Two Perspectives on Environment’, in: L. Karpik (ed.), Organization and Environment, Sage Publications Ltd, London, 149-170. Anderson, J.C. and J.A. Narus (1984), ‘A Model of the Distributor’s Perspective of Distributor-Manufacturer Working Relationships’, Journal of Marketing, Vol. 48, Fall, 62-74. Anderson, J.C. and J.A. Narus (1990), ‘A Model of Distributor Firm and Manufacturer Firm Working Partnerships’, Journal of Marketing, Vol. 54, January, 42-58. Anderson, J.C. and B.A. Weitz (1989), ‘Determinants of Continuity in Conventional Industrial Channel Dyads’, Marketing Science, Vol. 8, Fall, 310-323. Anderson, J.C. and B.A. Weitz (1992), ‘The Use of Pledges to Build and Sustain Commitment in Distribution Channels’, Journal of Marketing Research, Vol. 29, February, 18-34. Anderson, J.C., H. Håkansson and J. Johanson (1994), ‘Dyadic Business Relationships Within a Business Network Context’, Journal of Marketing, Vol. 58, October, 1-15. Ansoff, H.I. (1984), Implanting Strategic Management, Prentice Hall, New York. Araujo, L., A. Dubois, L.-E. Gadde (1999), ‘Dyadic Business Relationships within a Business Network Context, Journal of Marketing, Vol. 58, 1-15. Archer, N.P. and F. Ghasemzadeh (1999), ‘An Integrated Framework for Project Portfolio Selection’, International Journal of Project Management, Vol. 17, No. 4, 207-216. Armstrong, J.S. and T.S. Overton (1977), ‘Estimating Nonresponse Bias in Mail Surveys’, Journal of Marketing Research, Vol. 14, No. 8, August, 396-402. Armstrong, J.S., R.J. Brodie and J. Ringbeck (1988), ‘The Value of Portfolio Planning Methods for Strategic Marketing Decisions: Experimental Results’, Working Paper, August. Armstrong, J.S. and R.J. Brodie (1984), ‘Effects of Portfolio Planning Methods on Decision Making: Experimental Results’, International Journal of Research in Marketing, Vol. 11, 73-84. Arndt, J. (1983), ‘The Political Economy Paradigm: Foundation for Theory Building in Marketing’, Journal of Marketing, Vol. 47, October, 44-54.
292
Asanuma, B. (1989), ‘Manufacturing Supplier Relationships in Japan and the Concept of Relation-Specific Skill’, Journal of Japanese and International Economies, Vol. 3, 1-30. Axelsson, B., K. Frisk and A. Najib (2000), ‘From Buying to Supply Management – A Multifaceted Change Venture’, Proceedings of the 9th International IPSERA Conference, London, Canada, 55-66. Axelsson, B., J. Laage-Hellman and U. Nisson (2002), ‘Modern Management Accounting for Modern Purchasing’, European Journal of Purchasing & Supply Management, Vol. 8, No. 1, 53-62. Baatz, E. (1999), ‘How Purchasing Handles Intense Cost Pressure’, Purchasing, Vol. 126, No. 5, April 8, 61-66. Bacharach, S. and E. Lawler (1975), ‘Perception of Power: An Empirical Test of Exchange Theory’, Paper delivered at the Meetings of the Midwest Sociological Association, Chicago. Bacharach, S. and E. Lawler (1981), Power and Politics in Organizations, Jossey-Bass, San Fransisco. Barney, J.B. (1991), ‘Firm Resources and Sustained Competitive Advantage’, Journal of Management, Vol. 17, 99-120. Barney, J.B. and M.H. Hansen (1994), ‘Trustworthiness as a Source of Competitive Advantage’, Strategic Management Journal, Vol. 15, 175-190. Barney, J.B. (1996), Gaining and Sustaining Competitive Advantage, Addison-Wesley Publishing Company, Barringer, B.R. and J.S. Harrison (2000), ‘Walking a Tightrope: Creating Value Through Interorganizational Relationships’, Journal of Management, Vol. 26, No. 3, 367-403. Bauer, F. (1977), ‘Better Purchasing: High Rewards and Low Risks’, The Mac Kinsey Quarterly, Winter, 75-86. Bello, D.C., R. Lohtia and S.P. Dant (1999), ‘Collaborative Relationship for Component Development: The Role of Strategic Issues, Production Costs, and Transaction Costs’, Journal of Business Research, Vol. 45, 15-31. Benito, G.R.G., T. Pedersen and B. Petersen (1999), ‘Foreign Operation Methods and Switching Costs: Conceptual Issues and Possible Effects’, Scandinavian Journal of Management, Vol. 15, No. 2, 213-229. Bensaou, M. and N. Venkatraman (1995), ‘Configurations of Interorganizational Relationships: A Comparison Between U.S. and Japanese Automakers’, Management Science, Vol. 41, No. 9, 1471-1492. Bensaou, M. (1999), ‘Portfolios of Buyer-Supplier Relationships’, Sloan Management Review, Vol. 40, No. 4, Summer, 35-44.
A Portfolio Approach to the Development of Differentiated Purchasing Strategies 293
Berger, H., N.G. Noorderhaven and B. Nooteboom (1995), ‘Determinants of Supplier Dependence: An Empirical Study’, in: On Economic Institutions: Theory and Applications, J. Groenewegen, C. Pitelis and S. Sjöstrand (ed.), Edward Elgar Publishing Limited, Hants, England. Berry, L.L. and A. Parasuraman (1991), Marketing Services, The Free Press, New York. Blau, P.M. (1964), Exchange and Power in Social Life, John Wiley, New York. Blenkhorn, D.L. and H.F. Mackenzie (1994), ‘The importance of buyer-seller dependence in relationship marketing’, in: Sheth, J.N. and A. Parvatiyar (ed.), Relationship Marketing: Theory, Methods and Applications, 1994 Research conference proceedings, Emory University, Atlanta. Blois, K.J. (1999), ‘Trust in Business to Business Relationships: An Evaluation of its Status’, Journal of Management Studies, Vol. 36, No. 2, March, 197-215. Blomqvist, K. (1997), ‘The Many Faces of Trust’, Scandinavian Journal of Management, Vol. 13, No. 2, 271-286. Boodie, M.L.J. (1997), World Class Purchasing in Nederland is fictie en helaas nog geen werkelijkheid. Berenschot Inkoopenquête 1997, Berenschot Inkoopmanagement, Utrecht (Dutch text). Bourantas, D. (1989), ‘Avoiding Dependence on Suppliers and Distributors’, Long Range Planning, Vol. 22, No. 3, 140-149. Bowman, E.H. (1974), ‘Epistemology, Corporate Strategy and Academe’, Sloan Management Review, Winter, 35-50. Boyer, K.K., J.R. Olson, R.J. Calantone and E.C. Jackson (2002), ‘Print versus Electronic Surveys: A Comparison of Two Data Collection Methodologies’, Journal of Operations Management, Vol. 20, No. 4, 357-373. Brealy, R.A. and S.C. Myers (1996), Principles of Corporate Finance, McGraw-Hill, New York, international edition. Brennan, R. and P.W. Turnbull (1999), ‘The Managerial (Ir)relevance of IMP’, The 16th International Marketing and Purchasing Conference, University College Dublin, Ireland. Brown, J.R. and G.L. Frazier (1978), ‘The Application of Channel Power: Its Effects and Connotations’, in Research Frontiers in Marketing: Dialogues and Directions, S.C. Jain, ed., Chicago: American Marketing, 266-270. Brown, J.R., R.F. Lusch and D.D. Muehling (1983), ‘Conflict and Power-Dependence Relations in Retailer-Supplier Channels’, Journal of Retailing, Vol. 59, No. 4, Winter, 53-81. Brown, R. (1991), ‘Making the Product Portfolio a Basis for Action’, Long Range Planning, Vol. 24, No. 1, 102-110.
294
Buchanan, L. (1992), ‘Vertical Trade Relationships: The Role of Dependence and Symmetry in Attaining Organizational Goals’, Journal of Marketing Research, Vol. 29, February, 65-75. Burt, D.N. (1989), ‘Managing Suppliers Up to Speed’, Harvard Business Review, July-August, 127-135. Buvik, A. and T. Reve (2001), ‘A Symmetrical Deployment of Specific Assets and Contractual Safeguarding in Industrial Purchasing Relationships’, Journal of Business Research, Vol. 51, No. 2, 101-113. Buvik, A. and Ø. Halskau (2001), ‘Relationship Duration and Buyer Influence in Just-In-Time Relationships’, European Journal of Purchasing & Supply Management, Vol. 6, No. 7, 111-119. Buzzell, R.D., B.T. Gale and R.G.M. Sultan (1975), ‘Market Share - A Key to Profitability’, Harvard Business Review, 53, January/February. Buzzel, R.D. (1983), ‘Is Vertical Integration Profitable?’, Harvard Business Review, January-February, 99-102. Cagliano, R., F. Caniato and G. Spina (2002), ‘Supply Strategy Configurations: Linking Operational Integration with Supply Management Practices’, Paper Presented at the 11th International IPSERA Conference, Enschede, The Netherlands. Calabrese, G. (2000), ‘Small-medium Supplier-Buyer Relationships in the Car Industry: Evidence from Italy’, European Journal of Purchasing & Supply Management, Vol. 6, No. 1, 59-65. Caldwell, N.D., C.M. Harland, Ph. Dowell, M. Woerndl and J. Zheng (2002), ‘The Role of E-business in Large Firm Supply Chain Interactions with Manufacturing SMES: A Conceptual Framework’, Proceedings of the 11th International IPSERA Conference, Enschede, The Netherlands, 123-134. Campbell, N.C.G. and M.T. Cunningham (1983), ‘Customer Analysis for Strategy Development in Industrial Markets’, Strategic Management Journal, Vol. 4, No. 4, 369-380. Campbell, N.C.G. (1985), ‘An Interaction Approach to Organizational Buying Behavior’, Journal of Business Research, Vol. 13, No. 1, February, 35-50. Capon, N., J.U. Farley and J.M. Hulbert (1987), Corporate Strategic Planning, Colombia University Press, New York. Carter, J.R. and R. Narasimhan (1996), ‘Is Purchasing Really Strategic?’, International Journal of Purchasing and Materials Management, Vol. 32, No. 1, Winter, 20-28. Carter, J.R. (1997), ‘Supply positioning at SGX Corporation’, Best Practices in Purchasing & Supply Chain Management, December, 5-8. Carter, S. (1995), Successful Purchasing in a Week, Hodder & Stoughton, England. Catry, B. and M. Chevalier (1974), ‘Market Share Strategy and the Product Life Cycle’, Journal of Marketing, Vol. 38, No. 4, October, 29-34.
A Portfolio Approach to the Development of Differentiated Purchasing Strategies 295
Christopher, M. (1992; 1998), Logistics and Supply Chain Management, Pitman Publishing, London, 1st and 2nd ed. Christipher, M. and U. Jüttner (2000), ‘Developing Strategic Partnerships in the Supply Chain: A Practitioner Perspective’, European Journal of Purchasing & Supply Management, Vol. 6, No. 2, 117-127. Clauwaert, F. (1993), ‘Portfolioanalyse’, Handboek Inkoopmanagement, Samsom, Alphen aan den Rijn, C3500, 1-20 (Dutch text). Coate, M.B. (1983), ‘Pitfalls in Portfolio Planning’, Long Range Planning, Vol. 16, No. 3, 47-56. Cook, V. (1985), ‘The Net Present Value of Market Share’, Journal of Marketing, Vol. 49, Summer, 49-63. Cooper, R. and R.S. Kaplan (1991), ‘Profit Priorities from Activity-Based Costing’, Harvard Business Review, Vol. 69, May-June, 130-135. Cooper, R.G., S.J. Edgett and E.J. Kleinschmidt (1998), Portfolio Management for New Products, Addison-Wesley Longman, Inc. Cooper, R.G., S.J. Edgett and E.J. Kleinschmidt (1999), ‘New Product Portfolio Management: Practices and Performance’, The Journal of Product Innovation Management, Vol. 16, No. 4, 333-351. Cooper, R.G., S.J. Edgett and E.J. Kleinschmidt (2000), ‘New Products, New Solutions: Making Portfolio Management More Effective’, Research Technology Management, Vol. 16, No. 4, 18-33. Corsten, H. (1996), ‘Beschaffung’, in: Betriesbwirtschaftslehre, Corsten, H. and M. Reiss, München, 609-736. Cousins, P.D. (1999), ‘Supply Base Rationalisation: Myth or Reality?’, European Journal of Purchasing & Supply Management, Vol. 5, No. 3-4, 143-155. Cousins, P.D. (2002), ‘A Conceptual Model for Managing Long-term Inter-organisational Relationships’, European Journal of Purchasing & Supply Management, Vol. 8, No. 2, 71-82. Cox, A. (1995), ‘Strategic Procurement Management in the Public and Private Sectors’, in: The Relative Benefits of Competitive and Collaborative Approaches, eds. Lamming, R. and A. Cox. Cox, A. (1996), ‘Relational Competence and Strategic Procurement Management: Towards an Entrepreneurial and Contractual Theory of the Firm’, European Journal of Purchasing and Supply Management, Vol. 2, No. 1, 57-70. Cox, A. (1997), Business Success - a way of thinking about strategic, critical supply chain assets and operational best practice, Earlsgate Press, Great Britain. Cox, A. (2001), ‘Understanding Buyer and Supplier Power: A Framework for Procurement and Supply Competence’, The Journal of Supply Chain Management, Vol. 37, No. 2, Spring, 8-15. Cox, W.E. (1967), ‘Product Life Cycles as Marketing Models’, The Journal of Business, Vol. 40, October, 375-384.

296
Croom, S.R. (2000), ‘The Impact of Web-Based Procurement on the Management of Operating Resources Supply’, The Journal of Supply Chain Management, Vol. 36, No. 1, Winter, 4-13. Cunningham, M.T. and E. Homse (1982), ‘An Interaction Approach to Marketing Strategy’, in Håkansson, H. (ed.), (1982), International Marketing and Purchasing of Industrial Goods: an Interaction Approach, Wiley, Chichester, 328-345. Cunningham, M.T. (1982), ‘An Interaction Approach to Purchasing Strategy’, in Håkansson, H. (ed.), International Marketing and Purchasing of Industrial Goods: an Interaction Approach, Wiley, Chichester, 345-357. Cusumano, M. and A. Tekeshi (1991), ‘Supplier Relations and Management: A Survey of Japanse Auto Plants and U.S. Auto Plants’, Strategic Management Journal, Vol. 12, November, 563-588. Dacin, P.A. and D.C. Smith (1994), ‘The Effect of Brand Portfolio Characteristics on Consumer Evaluations of Brand Extensions’, Journal of Marketing Research, Vol. 31, No. 2, 229-242. Dahl, R.A. (1957), ‘The concept of power’, Behavioral Science, Vol. 2, July, 201-215. Dant, R.P. and G.T. Gundlach (1998), ‘The challenge of autonomy and dependence in franchised channels of distribution’, Journal of Business Venturing, Vol. 14, No. 1, 35-67. Day, G.S. (1981), ‘Strategic Market Analysis and Definition: An Integrated Approach’, Strategic Management Journal, Vol. 2, July-September, 29-38. Day, G.S. (1986), Analysis for strategic market decisions, St. Paul, MN: West Publishing. De Boer, L. (1997), ‘Het inkoopportfoliomodel van Kraljic nader beschouwd’, Praktijkboek Professioneel Inkoopmanagement, Kluwer Bedrijfsinformatie, Deventer, 2.9.B.1-01 - 2.9.B.1-10 (Dutch text). De Boer, L. (1998), Operations research in support of purchasing – design of a toolbox for supplier selection, Doctoral thesis, University of Twente, Enschede. De Jong, G. and B. Nooteboom (2000), The Causal Structure of Long-Term Supply Relationships - An Empirical Test of a Generalized Transaction Cost Theory, Kluwer Academic Publishers, Boston. DelVecchio, D. (2000), ‘Moving Beyond Fit: The Role of Brand Portfolio Characteristics in Consumer Evaluations of Brand Reliability’, Journal of Product and Brand Management, Vol. 9, No. 7, 457-471. Dhalla, N.K. and S. Yuspeh (1976), ‘Forget the Product Life Cycle Concept’, Harvard Business Review, Vol. 54, January/February, 102-112. Dick, A.S. and K. Basu (1994), ‘Customer Loyalty: Toward an Integrated Conceptual Framework’, Journal of the Academy of Marketing Science, Vol. 22, No. 2, 99-113. Dickson, P.R. (1983), ‘Distributor Portfolio Analysis and the Channel Dependence Matrix: New Techniques for Understanding and Managing the Channel’, Journal of Marketing, Vol. 47, Summer, 35-44.

A Portfolio Approach to the Development of Differentiated Purchasing Strategies 297
Dierickx, I. and K. Cool (1989), ‘Asset Stock Accumulation and Sustainability of Competitive Advantage’, Management Science, Vol. 35, No. 12, 1504-1513. Dobler, D.W. and D.N. Burt (1996), Purchasing and Supply Management, McGraw-Hill, New York, 6th ed. Donaldson, L. (2000), ‘Organizational Portfolio Theory: Performance-Driven Organizational Change’, Contemporary Economic Policy, Vol. 18, No. 4, October, 386-396. Doney, P.M. and J.P Cannon (1997), ‘An Examination of the Nature of Trust in Buyer-Seller Relationships’, Journal of Marketing, Vol. 61, April, 35-51. Dubinsky, A.J. and T.N. Ingram (1984), ‘A Portfolio Approach to Account Profitability’, Industrial Marketing Management, Vol. 13, 33-41. Dubois, A. and A.-C. Pedersen (2002), ‘Why Relationships do Not Fit into Purchasing Portfolio Models – A Comparison Between the Portfolio and Industrial Network Approaches’, European Journal of Purchasing & Supply Management, Vol. 8, No. 1, 35-42. Dwyer, F.R., P.H. Schurr, and S. Oh (1987), ‘Developing Buyer-Seller Relationships’, Journal of Marketing, Vol. 51, April, 11-27. Dyer, J.H. and W.G. Ouchi (1993), ‘Japanese-Style Business Partnerships: Giving Companies a Competitive Edge’, Sloan Management Review, Vol. 35, Fall, 51-63. Dyer, J.H. (1996), ‘Specialized Supplier Networks as a Source of Competitive Advantage: Evidence from the Auto Industry’, Strategic Management Journal, Vol. 17, April, 271-291. Dyer, J.J. and H. Singh (1998), ‘The Relational View: Cooperative Strategy and Resources of Interorganizational Competitive Advantage’, Academy of Management Review, Vol. 23, No. 4, 660-679. Dyer, J.H. and W. Chu (2000), ‘The Determinants of Trust in Supplier-automaker Relationships in the U.S., Japan and Korea’, Journal of International Business Studies, Vol. 31, No. 2, Second Quarter, 259-285. El-Ansary, A.I. and L.W. Stern (1972), ‘Power Measurement in the Distribution Channel’, Journal of Marketing Research, Vol. 9, February, 47-52. Elliott-Shircore, T.I. and P.T. Steele (1985), ‘Procurement Positioning Overview’, Purchasing and Supply Management, December, 23/26. Ellram, L.M. and A. Carr (1994), ‘Strategic Purchasing: A History and Review of the Literature’, International Journal of Purchasing and Materials Management, Vol. 30, No. 2, Spring, 10-18. Ellram, L.M. (1996), ‘A Structured Method for Applying Purchasing Cost Management Tools’, International Journal of Purchasing and Materials Management, Vol. 32, No. 1, Winter, 20-28.
298
Ellram, L.M. (1998), ‘Purchasing’, in Lambert, D.M., J.R. Stock and L.M. Ellram (eds.), Fundamentals of Logistics Management, Irwin Mc. Graw-Hill, 345-380. Emerson, R.M. (1962), ‘Power-Dependence Relations’, American Sociological Review, Vol. 27, February, 31-41. Erdogan, B.Z. and M.J. Baker (2002), ‘Increasing Mail Survey Response Rates from an Industrial Population’, Industrial Marketing Management, Vol. 31, No. 1, 65-73. Essig, M. and U. Arnold (2001), ‘Electronic Procurement in Supply Chain Management: An Information Economic-Based Analysis of Electronic Markets’, The Journal of Supply Chain Management, Vol. 37, No. 4, Fall, 43-49. Etgar, M. (1976), ‘Channel Domination and Countervailing Power in Distribution Channels’, Journal of Marketing Research, Vol. 13, August, 254-262. Faria, A. and R. Wensley (2002), ‘In Search of ‘Interfirm Management’ in Supply Chains: Recognizing Contradictions of Language and Power by Listening’, Journal of Business Research, Vol. 35, 603-610. Faulkner, T. (1996), ‘Applying “options thinking” to R&D Valuation’, Research Technology Management, Vol. 39, No. 3, 50-58. Field, A. (2000), Discovering Statistics Using SPSS for Windows, SAGE Publications Ltd, London. Fiocca, R. (1982), ‘Account Portfolio Analysis for Strategy Development’, Industrial Marketing Management, Vol. 11, 53-62. Ford, D. (ed.) (1997), Understanding Business Markets: Interaction, Relationships and Networks, The Dryden Press, 2nd edition. Forker, L.B. and P. Stannack (2000), ‘Cooperation versus Competition: Do Buyers and Suppliers Really See Eye-To-Eye?’, European Journal of Purchasing & Supply Management, Vol. 6, No. 1, 31-40. Foster, G. and M. Gupta (1994), ‘Marketing, Cost Management and Management Accounting’, Journal of Management Accounting Research, Vol. 6, Fall, 43-54. Foster, G., M. Gupta and L. Sjoblom (1996), ‘Customer Profitability Analysis: Challenges and New Directions’, Cost Management, Vol. 10, Spring, 5-17. Frazier, G.L., J.D. Gill and S.H. Kale (1989), ‘Dealer Dependence and Reciprocal Actions in a Channel of Distribution in a Developing Country’, Journal of Marketing, Vol. 53, January, 50-69. Frazier, G.L. and R.C. Rody (1991), ‘The Use of Influence Strategies in Interfirm Relationships in Industrial Product Channels’, Journal of Marketing, Vol. 60, October, 19-38. Frazier, G.L. and K.D. Antia (1995), ‘Exchange Relationships and Interfirm Power in Channels of Distribution’, Journal of the Academy of Marketing Science, Vol. 23, Fall, 321-326.
A Portfolio Approach to the Development of Differentiated Purchasing Strategies 299
Frederick, J. (1934), Industrial Marketing, Prentice Hal, New York. Frohlich, M.T. and R. Westbrook (2001), ‘Arcs of Integration: An International Study of Supply Chain Strategies’, Journal of Operations Management, Vol. 19, No. 2, 185-200. Frohlich, M.T. (2002), ‘Techniques for Improving Response Rates in OM Survey Research’, Journal of Operations Management, Vol. 20, No. 1, 53-62. Gadde, L.E. and I. Snehota (2000), ‘Making the Most of Supplier Relationships’, Industrial Marketing Management, Vol. 29, No. 4, 305-316. Ganesan, S. (1994), ‘Determinants of Long-Term Orientation in Buyer-Seller Relationships’, Journal of Marketing, Vol. 58, No. 2, April, 1-19. Garbarino, E. and M.S. Johnson (1999), ‘The Different Roles of Satisfaction, Trust, and Commitment in Customer Relationships’, Journal of Marketing, Vol. 63, April, 70-87. Gaski, J.F. (1984), ‘The Theory of Power and Conflict in Channel of Distribution’, Journal of Marketing, Vol. 48, Summer, 9-29. Gaski, J.F. (1986), ‘Interrelations Among a Channel Entity’s Power Sources: Impact of the Exercise of Reward and Coercion on Expert, Referent, and Legitimate Power Sources’, Journal of Marketing Research, Vol. 23, February, 62-77. Gassenheimer, J.B. and R. Ramsey (1994), ‘The Impact of Dependence on Dealer Satisfaction: A Comparison of Reseller-Supplier Relationships’, Journal of Retailing, Vol. 70, No. 3, 253-266. Gelderman, C.J. and R.S.J. Tuninga (1998), ‘Paradigmawisseling in marketing?’, Bedrijfskunde, Vol. 70, No. 1, 89-97 (Dutch text). Gelderman, C.J. and A.J. van Weele (2000), ‘New Perspectives on Kraljic’s Purchasing Portfolio Approach’, Proceedings of the 9th International IPSERA Conference, London, Canada, 291-298. Gelderman, C.J. (2000), ‘Rethinking Kraljic: Towards a Purchasing Portfolio Model, Based on Mutual Buyer-Supplier Dependence’, Danish Purchasing & Logistics Forum (Dansk Indkøbs- og Logistikforum), Vol. 37, No. 10, October, 9-15. Gelderman, C.J. and A.J. van Weele (2001), ‘Advancements in the Use of a Purchasing Portfolio Approach: A Case Study’, Proceedings of the 10th International IPSERA Conference, Jönköping, Sweden, 403-415. Gelderman, C.J. and L. de Boer (2001), ‘Stappenplan toepassing Kraljic inkoopportfolio analyse’, Handboek Inkoopmanagement: Stappenplannen, checklisten en modellen, Samsom, Alphen aan den Rijn, SE 2.1, 1-25 (Dutch text). Gelderman, C.J. and W.F. van Oppen (2001), ‘DSM brengt dynamiek in de inkoopportfolio’, Tijdschrift voor Inkoop & Logistiek, Vol. 17, No. 3, 31-34 resp. No. 4, 7 (Dutch text).

300
Gelderman, C.J. and A.J. van Weele (2002a), ‘Purchasing Portfolio Analysis: Towards a Comprehensive Model of Conditions, Goals and Strategies Based on Explorative Case Studies’, Proceedings of the 11th International IPSERA Conference, Enschede, The Netherlands, 212-226. Gelderman, C.J. and A.J. van Weele (2002b), ‘Strategic Direction Through Purchasing Portfolio Management: A Case Study’, International Journal of Supply Chain Management, Vol. 38, No. 2, Spring, 30-37. Gelderman, C.J. and P. van Haaster (2002), ‘De portfolio is veel werk en gezond verstand’, interview met Peter Kraljic, Tijdschrift voor Inkoop & Logistiek, Vol. 18, No. 9, September (Dutch text). Gelderman, C.J. (2002), ‘Handling the Main Issues and Initial Problems, Adopting a Purchasing Portfolio Approach’, Danish Purchasing & Logistics Forum (Dansk Indkøbs- og Logistikforum), Vol. 39, No. 12, December, 32-38. Gelderman, C.J. and A.J. van Weele (2003), ‘Explaining the Utilisation of Purchasing Portfolio Models in Business – Results of a Large Scale Survey’, Proceedings of the 12th International IPSERA Conference, Budapest, Hungary. Gellner, D.M. (1978), ‘Involvement in Role-Playing Simulations: A Demonstration with Studies on Obedience’, Journal of Personality and Social Psychology, Vol. 36, 219-235. Geyskens, I., J.E.M. Steenkamp, L.K. Scheer and N. Kumar (1996), ‘The Effects of Trust and Interdependence on Relationship Commitment: A Trans-Atlantic Study’, International Journal of Research in Marketing, Vol. 13, 303-317. Granovetter, M. (1985), ‘Economic Action and Social Structure: A Theory of Embeddedness’, American Journal of Sociology, Vol. 91, 481-510. Graves, S.B., J.L. Ringuest and R. H Case (2000), ‘Formulating Optimal R&D Portfolios’, Research Technology Management, Vol. 43, No. 3, 47-51. Greenwald, A.G., A.R. Pratknis, M.R. Leippe and M.H. Baumgardner (1986), ‘Under What Conditions Does Theory Obstruct Research Progress?’, Psychological Review, Vol. 93. , No. 2, 216-229. Greer, T.V., N. Chuchinprakarn, and S. Seshadri (2000), ‘Likehood of Participating in Mail Survey Research - Business Respondents’ Perspectives’, Industrial Marketing Management, Vol. 29, No. 2, 97-109. Grönroos, C. (1990), Service Management and Marketing: Managing the Moments of Truth in Service Competition, Lexington Books, Massachusetts/Toronto. Grönroos, Chr. (1994), ‘Quo Vadis Marketing? Toward a Relationship Marketing Paradigm’, Journal of Marketing Management, Vol. 10, No. 4, 347-360. Gummesson, E. (1987), ‘The New Marketing - Developing Long-term Interactive Relationships’, Long Range Planning, Vol. 20, No. 4, August, 10-20.

A Portfolio Approach to the Development of Differentiated Purchasing Strategies 301
Gundlach, G.T. and E.R. Cadotte (1994), ‘Exchange Interdependence and Interfirm Reaction: Research in a Simulated Channel Setting’, Journal of Marketing Research, Vol. 31, 516-532. Gundlach, G.T., R.S. Achrol and J.T. Mentzer (1995), ‘The Structure of Commitment in Exchange’, Journal of Marketing, Vol. 59, January, 78-92. Hadeler, B.J. and J.R. Evans (1994), ‘Supply Strategy: Capturing the Value’, Industrial Management, Vol. 36, No. 4, July/August, 3-4. Hahn, C.K., C.A. Watts, and K.Y. Kim (1990), ‘The Supplier Development Program: A Conceptual Model’, International Journal of Purchasing and Materials Management, Vol. 26, No. 2, Spring, 2-7. Håkansson, H. (ed.) (1982), International Marketing and Purchasing of Industrial Goods: an Interaction Approach, Wiley, Chichester. Håkansson, H, (1989), Corporate Technological Behaviour: Co-operation and Networks, Routledge, London. Håkansson, H. and A.K. Erikkson (1993), ‘Getting Innovations out of Supplier Networks’, Journal of Business-to-Business Marketing, Vol. 1, No. 3, 30-37. Håkansson, H. and I. Snehota (1995), Developing Business Relationships in Industrial Networks, Routledge, London. Hall, D.L. and A. Nauda (1990), ‘An Interactive Approach for Selecting IR&D Projects’, IEEE Transactions on Engineering Management, Vol. 37, No. 2, 126-135. Hallén, L., J. Johanson and N. Seyed-Mohamed (1991), ‘Interfirm Adaptions in Business Relationships’, Journal of Marketing, Vol. 55, April, 29-37. Hambrick, D.C., I.C. MacMillan and D.L. Day (1982), ‘Strategic attributes and performances in the BCG matrix - a PIMS based analysis of industrial product businesses’, Academy of Management Journal, Vol. 25, No. 3, 510-531. Hamermesh, R.G. (1986), ‘Making Planning Strategic’, Harvard Business Review, Vol. 64, July/August, 115-120. Handfield, R.B. (1993), ‘A Resource dependence perspective of Just-In-Time purchasing’, Journal of Operations Management, Vol. 11, No. 3, 289-311. Handfield, R.B, D. Krause, Th. V. Scannell and R. Monczka (2000), ‘Avoid the Pitfalls in Supplier Development’, Sloan Management Review, Vol. 41, No. 2, 37-49. Handfield, R.B. and C. Bechtel (2002), ‘The Role of Trust and Relationship Structure in Improving Supply Chain Responsiveness’, Industrial Marketing Management, Vol. 31, No. 4, 367-382. Harland, C.J. (1996), ‘Supply Chain Management: Relationships, Chain and Networks’, British Journal of Management, Vol. 7, Special Issue, March, S63-S80.
302
Harryson, S. (1995), Japanse R&D Management: A Holistic Network Approach, doctoral thesis, University of St. Gallen. Hartmann, E., Th. Ritter and H.G. Gemünden (2001), ‘Determining the Purchase Situation: Cornerstone of Supplier Relationship Management’, http://web.bi.no/imp2001, The 17th Annual IMP Conference, Oslo, Norway, 1-29, Haspeslagh, P. (1982), ‘Portfolio Planning: Uses and Limits’, Harvard Business Review, Vol. 60, No. 1, January/February, 58-73. Heege, F. (1981), ‘Portfolio-Management in der Beschaffung’, Der Betriebswirtschaft, February, Sonderdruck, 17-23 (German text). Heide, J.B. and G. John (1988), ‘The Role of Dependence Balancing in Safeguarding Transaction-Specific Assets in Conventional Channels’, Journal of Marketing, Vol. 52, No. 1, January, 20-35. Heide, J.B. and G. John (1990), ‘Alliances in Industrial Purchasing: The Determinants of Joint Action in Buyer-Seller Relationships’, Journal of Marketing Research, Vol. 27, February, 24-36. Heide, J.B. and G. John (1992), ‘Do Norms Matter in Marketing Relationships?’, Journal of Marketing, Vol. 56, April, 32-44. Heide, J.B. and A.S. Minor (1992), ‘The Shadow of the Future: Effects of Anticipated Interaction and Frequency of Contract on Buyer-Seller Cooperation’, Academy of Management Journal, Vol. 35, No. 2, 265-291. Heide, J.B. (1994), ‘Interorganizational Governance in Marketing Channels’, Journal of Marketing, Vol. 58, No. 1, 71-85. Helper, S. and M. Sako (1995), ‘Supplier Relations in Japan and the United States: Are They Converging?’, Sloan Management Review, Vol. 35, Spring, 77-84. Henderson, B.D. (1970), ‘The Product Portfolio’, Boston Consulting Group (Perspectives), Boston. Henderson, B.D. (1972), ‘Cash Traps’, Boston Consulting Group (Perspectives), Boston. Henderson, B.D. (1973), ‘The Experience Curve Reviewed: IV. The Growth Share Matrix of the Product Portfolio, Perspectives’, No. 135, The Boston Consulting Group, Boston, M.A. Hines, P., R. Lamming, D. Jones, P. Cousins and N. Rich (2000), Value Stream Management, Prentice-Hall, London, UK. Hofer, C.W. and D. Schendel (1978), ‘General Electric’s Nine-Cell Strategic Business Screen’, Strategy Formulation and Analytical Concepts. Homburg, Chr. (1995), ‘Single sourcing, double sourcing, multiple sourcing…? Ein ökonomischer Erklärungsansatz’, Zeitschrift für Betriebswirtschaft, Vol. 65, No. 8, 813-834 (German text). Homburg, Chr. and D. Daum (1997), ‘Die Kundenstruktur als Controlling Herausforderung’, Controlling, Heft 6, November/Dezember, 394-404 (German text).
A Portfolio Approach to the Development of Differentiated Purchasing Strategies 303
Hooley, G.J. and J. Saunders (1993), Competitive positioning: the key to marketing strategy, Prentice Hall International (UK) Ltd. C:\Documents and Settings\gel\Local Settings\Temporary Internet Files\OLK385\Multiple Comparisons with Repeated Measures.htm Howell, D.C. (2002), Statistical Methods for Psychology, Belmont, CA: Duxbury Press and http://www.uvm.edu/~dhowell/StatPages/More_Stuff/RepMeasMultComp/RepMeasMultComp.html#Return3 Hughes, M. (1981), ‘Portfolio Analysis’, Longe Range Planning, Vol. 14, February, 101-103. Hunt, S.D. and R.M. Morgan (1996), ‘The Resource-Advantage Theory of Competition: Dynamics, Path Dependencies, and Evolutionary Dimensions’, Journal of Marketing, Vol. 60, October, 107-114. Jackson, B.B. (1985), Winning and Keeping Industrial Customers, Lexington Books, Lexington MA. Jacobs, J. (1974), ‘Dependency and Vulnerability: An Exchange Approach to the Control of Organizations, Administrative Sciences Quarterly, Vol. 19, No. 1, 45-59. Jacobson, R. and D. Aaker (1985), ‘Is market share all that it’s cracked up to be?’, Journal of Marketing, Vol. 49, Fall, 11-21. Jacobson, R. (1988), ‘Distinguishing Among Competing Theories of the Market Share Effect’, Journal of Marketing, Vol. 52, October, 68-80. Jap, S.D. and S. Ganesan (2000), ‘Control Mechanisms and the Relationship Life Cycle: Implications for Safeguarding Specific Investments and Developing Commitment’, Journal of Marketing Research, Vol. 37, No. 2, May, 227-245. Jarillo, J.C. (1988), ‘On Strategic Networks’, Strategic Management Journal, Vol. 9, No. 1, 31-41. Jobber, D. and D. O’Reilly (1996), ‘Industrial Mail Surveys: Techniques for Inducing Response’, Marketing & Intelligence Planning, Vol. 14, No. 1, 29-34. Johansson, U.E. (1997), ‘Decision Making in Inter-Firm Networks as a Political Process’, Organization Studies, Vol. 18, No. 3, 361-384. John, G. (1984), ‘An Empirical Investigation of Some Antecedents of Opportunism in a Marketing Channel’, Journal of Marketing Research, Vol. 21, August, 278-289. Johnsen, T. (2000), ‘How Can Companies Manage Supply Networks?’, Danish Purchasing & Logistics Forum (Dansk Indkøbs- og Logistikforum), Vol. 37, December. Johnsen, R.E. and D. Ford (2001), ‘Asymmetrical and Symmetrical Customer-Supplier Relationships: Contrasts, Evolution and Strategy’, http://web.bi.no/imp2001, The 17th Annual IMP Conference, Oslo, Norway, 1-20,
304
Johnson, J.L. (1999), ‘Strategic Integration in Industrial Distribution Channels: Managing the Interfirm Relationship as a Strategic Asset’, Journal of the Academy of Marketing Science, Vol. 27, No.1, 4-18. Joshi, A.W. and S.J. Arnold (1997), ‘The Impact of Buyer Dependence on Buyer Opportunism in Buyer-Supplier Relationships: The Moderating Role of Relational Norms’, Psychology & Marketing, Vol. 14, No. 8, December, 823-845. Kamann, D.J.F. (2000a), ‘Kraljic krijgt extra dimensie’, Tijdschrift voor Inkoop & Logistiek, Vol. 16, April, No. 4, 8-12 (Dutch text). Kamann, D.J.F. (2000b), ‘Matrices, Cubes and Triangles in Purchasing’, Poster Presentation at the the 9th International IPSERA Conference, London, Canada, 1-6. Kamath, R.R. and J.K. Liker (1990), ‘Supplier dependence and innovation: a contingency model of suppliers’ innovative activities’, Journal of Engineering and Technology Management, Vol. 7, No. 2, 111-127. Keep, W.W., S.C. Hollander and R. Dickinson (1998), ‘Forces Impinging on Long-Term Business-to-Business Relationships in the United States: An Historical Perspective’, Journal of Marketing, Vol. 62, April, 31-45. Kempeners, M. and A.J. van Weele (1997), ‘Inkoopportfolio: basis voor inkoop- en marketingstrategie’, in: Van der Hart, H.W.C. and A.J. van Weele (eds), Dynamiek in commerciële relaties, F&G Publishing, Bunnik (Dutch text). Kirchhoff, B.A., M.J. Merges and J. Morabito (2001), ‘A Value Creation Model for Measuring and Managing the R&D Portfolio’, Engineering Management Journal, Vol. 13, No. 1, 19-22. Kim, K. (2001), ‘On the Effects of Customer Conditions on Distributor Commitment and Supplier Commitment in Industrial Channels of Distribution’, Journal of Business Research, Vol. 52, No. 2, 87-99. Knudsen, D. (2002), ‘Uncovering the Strategic Domain of E-Procurement’, Proceedings of the 11th International IPSERA Conference, Enschede, The Netherlands, 397-407. Kotler, Ph. (1971), Marketing Decision Making: A Model Building Approach, Holt, Rinehart and Winston, Inc., New York. Kotler, Ph. and G. Armstrong (1991), Principles of marketing, Prentice Hall, Englewood Cliffs, N.J., 5th ed. Kraljic, P. (1977), ‘Neue Wege im Beschaffungsmarketing’, Beschaffung Aktuell, December, 20-26. Kraljic, P. (1983), ‘Purchasing Must Become Supply Management’, Harvard Business Review, Vol. 61, No. 5, September-October, 109-117. Krapfel, R.E., D. Salmond and R.E. Spekman (1991), ‘A Strategic Approach to Managing Buyer-Seller Relationships’, European Journal of Marketing, Vol. 25, No. 9, 22-37.

A Portfolio Approach to the Development of Differentiated Purchasing Strategies 305
Krause, D.R. and L.M. Ellram (1997), ‘Critical Elements of Suppleir Development: The Buying Firm Perspective’, European Journal of Purchasing and Supply Management, Vol. 3, No. 1, 21-31. Kumar, N., J.D. Hibbard and L.W. Stern (1994), The Nature and Consequences of Marketing Channel Intermediary Commitment, Marketing Science Institute, No. 94-115, Cambridge MA. Kumar, N., L.K. Sheer and J.E.M. Steenkamp (1995), ‘The Effects of Perceived Interdependence on Dealer Attitudes’, Journal of Marketing Research, Vol. 32, August, 348-356. Kumar, N. (1996), ‘The Power of Trust in Manufacturer Relationships’, Harvard Business Review, Vol. 74, November-December, 93-106. Lado, A.A., N.G. Boyd and S.C. Hanlon (1997), ‘Competition, Cooperation, and the Search for Economic Rents: A Syncretic Model’, Academy of Management, Vol. 22, No. 1, 110-141. Lambert, D.M., M.A. Emmelhainz, and J.T. Gardner (1996), ‘Developing and Implementing Supply Chain Partnerships’, The International Journal of Logistics Management, Vol. 7, No. 2, 1-17. Lambert, D.M. and M.C. Cooper (2000), ‘Issues in Supply Chain Management’, Industrial Marketing Management, Vol. 29, 65-83. Lamming, R.C. (1993), Beyond Partnership, Prentice-Hall, UK. Lamming, R.C., Johnsen, T., C.M. Harland and J. Zheng (2000), ‘Managing in Supply Networks: Cascade and Intervention’, Proceedings of the 9th International IPSERA Conference, London, Canada, 393-404. Lamming, R.C. and D. Harrison (2001), ‘Smaller Customers and Larger Suppliers: The Potential for Strategic Purchasing Approach: A Case Study’, Proceedings of the 10th International IPSERA Conference, Jönköping, Sweden, 595-610. Laseter, T. (1998), Balanced Sourcing: Cooperation and Competition in Supplier Relationships, Jossey-Bass Publishers, San Francisco. Lazzarini, S.G., F.R. Chaddad and M.L. Cook (2001), ‘Integrating Supply Chain and Network Analyses: The Study of Netchains’, Chain and Network Science, Vol. 1, No. 1, 7-22. Leenders, M.R. and H.E. Fearon (1993), Purchasing and Materials Management, R.R. Irwin Inc., Homewood Illinois, 10th ed. Leonard, A. and M. Spring (2002), ‘ “E-Procurement Must Become Supply Management”: Portfolio Approaches and Electronic Procurement’, Proceedings of the 11th International IPSERA Conference, Enschede, The Netherlands, 456-470. Lilliecreutz, J. and L. Ydreskog (1999), ‘Supplier Classification as an Enabler for a Differentiated Purchasing Strategy’, Global Purchasing & Supply Chain Management, November, 66-74. Lockridge, R.K. (1981), ‘Strategy in the 1980’s’, BCG Perspectives, 241.
306
Lorenzoni, G. and A. Lipparini (1999), ‘The Leveraging of Interfirm Relationships as a Distinctive Organizational Capability: a Longitudinal Study, Strategic Management Journal, Vol. 20, 317-338. Louwers, D., W. van Oppen and G. Walravens (1999), ‘DSM werkt succesvol met multidisciplinaire inkoopteams’, Tijdschrift voor Inkoop & Logistiek, Vol. 15, January-February, 8-12 (Dutch text).. Lusch, R. and J.R. Brown (1996), ‘Interdependency, Contracting, and Relational Behavior in Marketing Channels’, Journal of Marketing, Vol. 60, October, 19-38. MacBeth, D.K. and N. Ferguson (1994), Partnership Sourcing – An Integrated Supply Chain Management Approach, Longman Group UK. Macneil, I.R. (1980), The New Social Contract: An Inquiry into Modern Contractual Relations, New Haven: Yale University Press. Maltz, A. and L. Ellram (1999), ‘Outsourcing Supply Management’, The Journal of Supply Chain Management, Vol 35, No. 2, 4-17. Mangione, Th. W. (1995), Mail Survey. Improving the Quality, Thousand Oaks, Sage. Markowitz, H. (1952), ‘Portfolio Selection’, Journal of Finance, 7, March, 77-91. Marshall, A. (1890), Principles of Economics, Macmillan, London. Marvin, Ph. (1972), Product Planning Simplified, American Management Association, New York. Matheson, D., J.E. Matheson and M.M. Menke (1994), ‘Making Excellent R&D Decisions’, Research Technology Management, Vol. 37, No. 6, November-December, 21-24. Matthyssens, P. and C. van den Bulte (1994), ‘Getting Closer and Nicer: Partnerships in the Supply Chain’, Longe Range Planning, Vol. 27, No. 1, 72-83. Mattieu, J.E. and D.M. Zajac (1990), ‘A Review and Meta-Analysis of the Antecedents, Correlates and Consequences of Organizational Commitment’, Psycological Bulletin, Vol. 108, No. 2, 171-194. McAllister, D.I. (1995), ‘Affect-and Cognition-Based Trust as Foundations for Interpersonal Cooperation in Organizations’, Academy of Management Journal, Vol. 38, February, 24-59. McCutcheon and F.I. Stuart (2000), ‘Issues in the Choice of Supplier Alliance Partners’, Journal of Operations Management, Vol. 18, No. 3, 279-301. McDonald, M.H.B. (1990), ‘Some Methodological Comments on The Directional Policy Matrix’, Journal of Marketing Management, Vol. 6, No. 1, 59-68. McIvor, R. and M. McHugh (2000), ‘Partnership Sourcing: An Organization Change Management Perspective’, The Journal of Supply Chain Management, Vol. 36, No. 3, Summer, 12-20. McKiernan, P. (1997), ‘Strategy Past; Strategy Futures’, Long Range Planning, Vol. 30, No. 5, 790-798.

A Portfolio Approach to the Development of Differentiated Purchasing Strategies 307
McLagan, P.A. (2000), ‘Portfolio Thinking’, Training & Development, Vol. 54, No. 2, 44-51. McLoughlin, D. and C. Horan (2000), ‘Business Marketing: Perspectives from the Markets-as-Networks Approach’, Industrial Marketing Management, Vol. 29, 285-292. Mickwitz, G. (1959), Marketing and Competition, Helsingfors, Finland: Centraltrykeriet. Miles, G., S.B. Preece and M.C. Baetz (1999), ‘Dangers of Dependence: The Impact of Strategic Alliance Use by Small Technology-Based Firms’, Journal of Small Business Management, Vol. 37, No. 2, April, 20-29. Miles, M.B. and A.M. Huberman (1994), Qualitative Data Analysis, Sage Publications, London, 2nd ed. Mintzberg, H. (1983), Power in and around organizations, Prentice Hall, Englewood Cliffs, N.J. Mol, M.J., J. Schreuder and R. Goedegebuure (2001), ‘Het Belang van Inkoop in de Nederlandse Industrie en de Veranderende Rol van de Inkoper’, Tijdschrift voor Inkoop & Logistiek, Vol. 17, No. 11, November, 69-72 (Dutch text). Mol, M.J. (2002), Outsourcing, Supplier Relations and Internationalisation: Global Sourcing Strategy as a Chinese Puzzle, Doctoral thesis, Erasmus Research Institute of Management, Erasmus University Rotterdam. Møller, M. and J. Momme (2000), ‘Supplier segmentation in theory and practice – towards a competence perspective’, Proceedings of the 9th International IPSERA Conference, London, Canada, 508-519. Monckza, R.M., R. Trent and R. Handfield (1998), Purchasing and supply chain management, International Thomsom Publishing, Cincinnati, Ohio. Moorman, C., G. Zaltman and R. Dehpandé (1992), ‘Relationships Between Providers and Users of Market Research: The Dynamics of Trust Within and Between Organizations’, Journal of Marketing Research, Vol. 29, August, 314-328. Moorman, C., R. Dehpandé and G. Zaltman (1993), ‘Factors Affecting Trust in Market Research Relationships’, Journal of Marketing, Vol. 57, January, 81-101. Morgan R.M. and S.D. Hunt (1994), ‘The Commitment-Trust Theory of Relationship Marketing’, Journal of Marketing, Vol. 58, July, blz. 20-38. Morgan, R.D. and E.W. Garnsey (1994), ‘The Integration of Suppliers inot the Product Development Process’, R&D Management, Vol. 24, No. 2, 28-35. Morrison, A. and R. Wensley (1991), ‘Boxing up or boxed in? A short history of the Boston Consulting Group share/growth matrix’, Journal of Marketing Management, 7, 105-129. Neef, D. (2001), E-Procurement – From Strategy to Implementation, Prentice Hall PTR, Upper Saddle River, NJ.

308
Nellore, R. and K. Söderquist (2000), ‘Portfolio Approaches to Procurement – Analysing the Missing Link to Specifications’, Long Range Planning, Vol. 33, No. 2, 245-267. Nellore, R. and J.E. Taylor (2000), ‘Using Portfolio Approaches to Manage Engineering-Purchasing-Supplier Interaction’, Production and Inventory Management, Vol. 41, No. 1, First Quarter, 6-12. Nicholson, A. (1993), ‘Strategic Management for the Purchasing Professional (Part 2)’, Purchasing & Supply Management, Vol. 27, October, 32-36. Neuman, W.L. (1997), Social Research Methods, Allyn and Bacon, London, 2nd ed. Noordewier, T.G., G. John and J.R. Nevin (1990), ‘Performance Outcomes of Purchasing Arrangements in Industrial Buyer-Vendor Relationships’, Journal of Marketing, Vol. 54, October, 80-93. Nooteboom, B. (1996), ‘Trust, Opportunism and Governance: A Process and Control Model’, Organization Studies, Vol. 17, No. 6, 985-1010. Nooteboom, B., H. Berger and N.G. Noorderhaven (1997), ‘Effects of Trust and Governance on Relational Risk’, Academy of Management Journal, Vol. 40, No. 2, 308-338. Nooteboom, B., G. de Jong, R.W. Vossen, S. Helper and M. Sako (2000), ‘Network Interactions and Mutual Dependence: A Test in the Car Industry’, Industry and Innovation, Vol. 7, No. 1, June, 117-144. Oliver, A.L. and M. Ebers (1998), ‘Networking Network Studies: An Analysis of Conceptual Configurations in the Study of Inter-organizational Relationships’, Organizational Studies, Vol. 19, No. 4, 549-583. Olsen, R.F. and L.M. Ellram (1997), ‘A Portfolio Approach to Supplier Relationships’, Industrial Marketing Management, Vol. 26, No. 2, 101-113. Ouchi, W.G. (1984), The M-Form Society, Avon Books, New York. Parker, D. and K. Hartley (1997), ‘The Economics of Partnership Sourcing versus Adversarial Competition: A Critique’, European Journal of Purchasing & Supply Management, Vol. 3, No. 2, 115-125. Partnership Sourcing, (1991), Partnership Sourcing Ltd, London. Patel, P. and M. Younger (1978), ‘A Frame of Reference for Strategy Development’, Long Range Planning, Vol. 11, April, 6-12. Peppers, D. and M. Rogers (2001), Customer Development Strategies for the Business-to-Business World, Doubleday – Random House Inc., New York. Pfeffer, J. and G.R. Salancik (1978), The External Control of Organizations - A Resource Dependence Perspective, Harper & Row Publishers, New York.

A Portfolio Approach to the Development of Differentiated Purchasing Strategies 309
Pfeffer, J. (1981), Power in Organizations, Pitman Publishing Inc., Massachusetts. Pine II, B.J. (1993), Mass Customization: The New Frontier in Business Competition, Harvard Business School Press, Boston. Polli, R. and V.J. Cook (1969), ‘Validity of the Product Life Cycle’, The Journal of Business, Vol. 42, October, 385-400. Pooley, J. and S.C. Dunn (1994), ‘A Longitudinal Study of Purchasing Positions: 1960-1989’, Journal of Business Logistics, Vol. 15, No. 1, 193-214. Porter, M.E. (1980), Competitive Strategy, The Free Press, New York. Prahalad, C.K. and F. Hamel (1990), ‘The Core Competence of the Corporation’, Harvard Business Review, May/June. Provan, K.G. and J.B. Gassenheimer (1994), ‘Supplier Commitment in Relational Contract Exchanges with Buyers: A Study of Interorganizational Dependence and Exercised Power’, Journal of Management Studies, Vol. 31, No. 1, 55-68. Provan, K.G. and S.J Skinner (1989), ‘Interorganizational dependence and control as predictors of opportunism in dealer-supplier relations’, Academy of Management Journal, Vol. 32, No. 1, 202-212. Quinn, J.B. and F.G. Hilmer (1994), ‘Strategic Outsourcing’, Sloan Management Review, Summer, 43-55. Rangan, V.K. and G.T. Bowman (1995), ‘Beating the Commodity Magnet’, in: Rangan, V.K., B.P. Shapiro and R.T. Moriarty (ed), Business Marketing Strategy: Concepts and Applications, Irwin Inc., Chicago. Ramsay, J. (1996a), ‘The Case Against Purchasing Partnerships’, International Journal of Purchasing and Materials Management, Vol. 32, No. 4, Fall, 13-19. Ramsay, J. (1996b), ‘Power Measurement’, European Journal of Purchasing and Supply Management, Vol. 2, No. 2/3, 129-143. Ramsay, J. (2001), ‘Purchasing’s Strategic Irrelevance’, European Journal of Purchasing and Supply Management, Vol. 7, No. 4, 257-263. Remenyi, D., B. Williams, A. Money and E. Swartz (1998), Doing Research in Business and Management – An Introduction to Process and Method, Sage Publications, London. Reilly, F.K and E.A. Norton (1999), Investments, The Dryden Press, Orlando, 5th ed. Ries, A. and J. Trout (1981), Positioning: the battle for your mind, McGraw-Hill, London. Rietveld, G.J. (1998), ‘De opmars van inkoop’, Internet publication, http://www.compendium.nl, (Dutch text).
310
Rozemeijer, F.A. (2000), Creating Corporate Advantage in Purchasing, Doctoral thesis, Eindhoven Centre for Innovation Studies, Eindhoven University of Technology. Ruyter, J.C. de, L. Moorman and J.G.A.M. Lemmink (2001), ‘Antecedents of Commitment and Trust in Customer-Supplier Relationships in High Technology Markets’, Industrial Marketing Management, Vol. 30, No. 3, 271-286. Sako, M. (1992), Prices, Quality and Trust – Inter-firm Relationships In Britain and Japan, Cambridge UK: Cambridge University Press. Saunders, M.(1997), Strategic Purchasing and Supply Chain Management, Pitman Publishing, London, 2nd ed. Saunders, M.N.K., Ph. Lewis and A. Thornhill (2000), Research Methods for Business Students, Pearson Educational Limited, Harlow, 2nd ed. Schary, Ph.B. and T. Skjøtt-Larsen, (2001), Managing the Global Supply Chain, Copenhagen Business School Press, Denmark, 2nd ed. Schijns, J.M.C. (1998), Het meten en managen van klant-organisatie relaties, dissertation, the University of Maastricht (Dutch text). Scott, C. and R. Westbrook (1991), ‘New Strategic Tools for Supply Chain Management’, International Journal of Physical Distribution, Vol. 21, No. 1, 23-33. Shapiro, B.P. V.K. Rangan, R.T. Moriarty and E.B. Ross (1987), ‘Manage Customers for Profits (not just sales)’, Harvard Business Review, September/October, 101-108. Sharpe, W.F. (1963), ‘A Simplified Model for Portfolio Analysis’, Management Science, January, 277-293. Slade, B.N. (1993), Compressing the Product Development Cycle from Research to Marketplace, American Management Association, New York. Smeltzer, L.R. and S.P. Siferd (1998), ‘Proactive Supply Management: The Management of Risk’, International Journal of Purchasing and Materials Management, Vol. 34, No. 1, Winter, 38-45. Smith, J.B. and D.W. Barclay (1997), ‘The Effects of Organizational Differences and Trust on the Effectiveness of Selling Partner Relationships’, Journal of Marketing, Vol. 61, January, 3-21. Spekman, R.E. and D. Strauss (1986), ‘An Exploratory Investigation of a Buyer’s Concern for Factors Affecting more Co-operative Buyer-Seller Relationships’, Industrial Marketing and Purchasing, Vol. 1, No. 3, 26-43. Sriram, V., R. Krapfel and R. Spekman (1992), ‘Antecedents to Buyer-Seller Collaboration: An Analysis From the Buyers’ Perspective’, Journal of Business Research, Vol. 25, No. 4, 303-320.

A Portfolio Approach to the Development of Differentiated Purchasing Strategies 311
Stannack, P. (1996), ‘Purchasing Power and Supply Chain Management Power - Two Different Paradigms? - A Response to Ramsay’s ‘Purchasing power’ (1995)’, European Journal of Purchasing and Supply Management, Vol. 2, No. 1, 47-56. Steele, P.T. and B.H. Court (1996), Profitable Purchasing Strategies: A Manager’s Guide for Improving Organizational Competitiveness through the Skills of Purchasing, McGraw-Hill Book Company, London. Stevens, J.P. (2001), Applied Multivariate Statistics for the Social Sciences, Lawrence, Erlbaum Associates, Inc. Mahwah, NJ, 4th ed. Stinchcombe, A.L. (1985), ‘Contracts as Hierarchical Documents’, in A.L. Stinchcombe and C. Heimer (eds.), Organizational Theory and Project Management, Norwegian University Press, Oslo, 121-171. Storbacka, K. (1994), ‘Customer Relationship Profitability - Propositions for Analysis of Relationships and Customer Bases’, in: Sheth, J.N. and A. Parvatiyar (ed.), Relationship Marketing: Theory, Methods and Applications, 1994 Research conference proceedings, Emory University, Atlanta. Strandvik, T. and V. Liljander (1994), ‘Relationship Strength in Bank Services’, in: Sheth, J.N. and A. Parvatiyar (ed.), Relationship Marketing: Theory, Methods and Applications, 1994 Research conference proceedings, Emory University, Atlanta. Swift, C.O. (1995), ‘Preference for Single Sourcing and Supplier Selection Criteria’, Journal of Business Research, Vol. 32, No. 2, 105-111. Syson, R. (1992), Improve Purchase Performance, Pitman Publishing, London. Szymanski, D.M., S.G. Bharadwaj and P.R. Varadarajan (1993),’An Analysis of the Market Share-Profitability Relationship, Journal of Marketing, Vol. 57, July, 1-18. Tabacknick, B.G. and L.S. Fidell (2001), Using Multivariate Statistics, Allyn & Bacon, Needham Heights, MA, 4th ed. Thibaut, J.W. and H.H. Kelley (1959), The Social Psychology of Groups, John Wiley & Sons, New York. Thompson, J.D., (1967), Organizations in Action, McGraw -Hill, New York. Thorelli, H.B. (1986), ‘Networks: Between Markets and Hierarchies’, Strategic Management Journal, Vol. 7, 37-51. Treacy, M. and F. Wiersema (1993), ‘Customer Intimacy and Other Value Disciplines’, Harvard Business Review, Vol. 71, January-February, 499-504. Trent, R.J. and R.M. Monczka (1998), ‘Purchasing and Supply Management: Trends and Changes Throughout the 1990s’, International Journal of Purchasing and Materials Management, Vol. 34, No. 4, Fall, 2-11. Turnbull, P.W. (1990), ‘A Review of Portfolio Planning Models for Industrial Marketing and Purchasing Management’, European Journal of Marketing, Vol. 24, 7-22.

312
Turnbull, P.W. and J. Valla (ed.) (1986), Strategies for International and Industrial Marketing: The Management of Customer Relationships in European Industrial Markets, Croom Helm, London. Turnbull, P.W. and S. Topcu (1994), ‘Customer’ Profitability in Relationship Life Cycles’, Proceedings of the 10th IMP Conference, Groningen, The Netherlands. Turnbull, P.W. and J. Zolkiewski (1997), ‘Profitability in Customer Portfolio Planning’, in: Ford, D. (ed), Understanding Business Markets: Interactions, Relationships and Networks, The Dryden Press, London, 2nd edition. Tully, S. (1995), ‘Purchasing’s New Muscle’, Fortune, Vol. 65, February 20, 45-51. Tuten, T.L. and D.J. Urban (2001), ‘An Expanded Model of Business-to-Business Partnership Formation and Success’, Industrial Marketing Management, Vol. 30, 149-164. Ulrich, D. and J.B. Barney (1984), ‘Perspectives in Organizations: Resource Dependence, Efficiency, and Population’, Academy of Management Review, Vol. 9, No. 3, 471-481. Vammen, S. (2000), ‘Purchasing Should be Blamed for its Low Status and Invisibility’, Danish Purchasing & Logistics Forum (Dansk Indkøbs- og Logistikforum), Vol. 37, No. 7, July, 22-27. Van der Hart, H.W.C. and A.J. van Weele (ed.) (1997), Dynamiek in commerciële relaties. F&G Publishing, Bunnik (Dutch text). Van de Ven, A. (1976), ‘On the Nature, Formation, and Maintenance of Relations among Organizations, Administrative Science Quarterly, Vol. 21, December, 598-621. Van Weele, A.J. (1984), ‘Purchasing Performance Measurement and Evaluation’, Journal of Purchasing and Materials Management, Vol. 20, No. 3, Fall, 16-24. Van Weele, A.J. (1988, 1992, 1997, 2001), Inkoop in strategisch perspectief. Analyse, planning en praktijk, Samsom Bedrijfsinformatie, Alphen aan den Rijn, 1st, 2nd 3rd and 4th ed (Dutch text). Van Weele, A.J. and F.A. Rozemeijer (1996), Revolution in purchasing: building competitive power through pro-active purchasing, Eindhoven University of Technology, Eindhoven. Van Weele, A.J. and F.A. Rozemeijer and G. Rietveld (1998), ‘Professionalising Purchasing in Organizations: Toward a Purchasing Development Model’, Holland Consulting Group, Amsterdam, The Netherlands. Van Weele, A.J. (2000), Purchasing Management: Analysis, Planning and Practice, Chapman & Hall, London, 2nd edition. Van Weele, A.J. (2002), ‘Measuring Purchasing Performance’, Presentation at the Nordisk Konference ‘Strategic Challenges for Leading Edge Purchasing Executives’, October 2, Copenhagen, Denmark. Van Weele, A.J. and F.A. Rozemeijer (1999), Ondernemend samenwerken: ontwikkelen van concurrentiekracht in netwerken’, Samsom, Alphen aan den Rijn, The Netherlands (Dutch text).

A Portfolio Approach to the Development of Differentiated Purchasing Strategies 313
Venkatesan, R (1992), ‘Strategic Sourcing: To Make or Not To Make’, Harvard Business Review, November/December, blz. 98-107. Venkatraman, N. and V. Ramanujam (1986), ‘Measurement of Business Performance in Strategy Research: A Comparison of Approaches’, Academy of Management Review, Vol. 11, No. 4, 901-813. Verhage, B.J. and E. Waarts (1988), ‘Marketing Planning for Improved Performance: A Comparative Analysis’, International Marketing Review, Vol. 5, 20-30. Verheul, Th. A.M. and S.C. Santema (1998), ‘Relatie tussen inkoper en verkoper gedoemd tot mislukken?’, Tijdschrift voor Inkoop & Logistiek, Vol. 14, No. 9, 60-64 (Dutch text). Webster, F.E., Jr. (1992), "The Changing Role of Marketing in the Corporation", Journal of Marketing, Vol. 56, October, blz. 1-17. Webster’s Third New International Dictionary (1993), Merriam-Webster, Incorporated, Chicago. Weinfurt, K.P. (2000), ‘Repeated Measures Analysis: ANOVA, MANOVA, and HLM’, in: Grimm, L.G. and P.R. Yarnold (eds), Reading and Understanding More Multivariate Statistics, Washington, DC: American Psychological Association, 317-361. Wensley, R. (1981), ‘Strategic marketing: Betas, boxes, or basics?’, Journal of Marketing, Vol. 45, 173-181. Wensley, R. (1994), ‘Making better decisions: The challenge of marketing strategy techniques’, International Journal of Research in Marketing, Vol. 11, 85-90. Wesselink, R., L.J. Pagrach, M. Mulder, J.Chr.J. Bruijstens and H. Miltenburg (2001), De Inkoopprofessie in Beeld – Een Onderzoek naar de Beroeps- en Opleidingsprofielen voor Inkoopprofessionals, Stichting NEVI Examens, Zoetermeer, The Netherlands (Dutch text). Wilemon, D.L. (1971), ‘Power and Negotiation Strategies in Marketing Channels’, The Southern Journal of Business, 71-82. Wilkinson, I. and L.C. Young (2002), ‘On Cooperating Firms, Relations and Networks’, Journal of Business Research, Vol. 55, 123-132 Williamson, O.E. (1975), Markets and Hierarchies: Analysis and Antitrust Implications, Free Press, New York. Williamson, O.E. (1985), The Economic Institutions of Capitalism, Free Press, New York. Williamson, O.E. (1991), ‘Comparative Economic Organization: An Analysis of Discrete Structural Alternatives’, Administrative Science Quarterly, Vol. 36, June, 269-296. Wind, Y. (1980), ‘New twists for some old tricks’, The Wharton Magazine, Spring, 34-39. Wind, Y. and V. Mahajan (1981), ‘Designing Product and Business Portfolios’, Harvard Business Review, Vol. 59, January/February, 156-165.

314
Wind, Y., V. Mahajan and D.J. Swire (1983), ‘An Empirical Comparison of Standardized Portfolio Models’, Journal of Marketing, Vol. 47 (Spring), 89-99. Wiseman, F. and M. Billington (1984), ‘Comment on a Standard Definition of Response Rates’, Journal of Marketing Research, Vol. 21, 336-338. Womack, J.L, D.T. Jones and D. Roos (1990), The Machine That Changed The World, Rawson Associates, New York. Wood, L. (1990), ‘The End of the Product Life Cycle’, Journal of Marketing Management, Vol. 6, 145-155. Wynstra, J.Y.F. (1998), Purchasing Involvement in Product Development, Doctoral thesis, Eindhoven Centre for Innovation Studies, Eindhoven University of Technology. Wynstra, J.Y.F. and E. ten Pierick (2000), ‘Managing Supplier Involvement in New Product Development: A Portfolio Approach’, European Journal of Purchasing & Supply Management, Vol. 6, No. 1, 49-57. Yin, R.K. (1994), Case Study Research: Design and Methods, Sage Publications, Thousand Oaks, CA, 2nd ed. Yorke, D.A. (1984), ‘An Interaction Approach to the Management of a Portfolio of Customer Opportunities’, Market Intelligence & Planning, Vol. 2, no. 3, 5-22. Yorke, D.A. and G. Droussiotis (1994), ‘The Use of Customer Portfolio Theory: An Empirical Study’, Journal of Business & Industrial Marketing, Vol. 9, No. 3, 6-18. Young, L.C. and I.F. Wilkinson (1997), ‘The Space Between: Towards a Typology of Interfirm Relations’, Journal of Business-to-Business Marketing, Vol. 4, No. 2, 53-97. Yu, J. and H. Cooper (1983), ‘A Quantitative Review of Research Design Mail Survey Response Behavior’, Public Opinion Quarterly, Vol. 55, 613-639. Zaheer, A., B. McEvily, and V. Perrone (1998), ‘The Strategic Value of Buyer-Supplier Relationships’, International Journal of Purchasing and Materials Management, Vol. 34, No. 3, Summer, 20-26. Zallocco, R.L., D.W. Scotton and D.A. Jeresko (1983), ‘Strategic market planning in the commercial airline industry’, Journal of Academy of Marketing Science, Vol. 11, 404-416. Zand, D.E. (1972), ‘Trust and Managerial Problem Solving’, Administrative Science Quarterly, Vol. 17, June, 229-239. Zolkiewski, J. and P.W. Turnbull (2001), ‘Relationships Portfolios – Past, Present and Future’, http://web.bi.no/imp2001, The 17th Annual IMP Conference, Oslo, Norway.

A Portfolio Approach to the Development of Differentiated Purchasing Strategies
315
Appendix A
Interview guide for the case studies
1 Background information on the company
- main activities - principal products and markets - organizational structure (business units) - company’s strategic focus - annual sales - number of employees
2 Background information on purchasing
- annual purchase spend - main purchasing categories - purchase spend, divided according to purchasing categories - centralized and/or decentralized purchasing - development of the purchasing function - position and perceived importance of purchasing
3 Purchasing and supply strategies
- main objectives of purchasing - basic principles for purchasing practice - buyer-supplier relationship strategies - connection between purchasing and business strategy - development of purchasing plans and strategies
4 Purchasing portfolio analysis
- main purposes and use - occasions, frequency, situations and timing - Kraljic-based or otherwise - choice of dimensions - factors per dimension - labels for quadrants

316
- generic strategic recommendations per category - measurement of dimensions/variables (establishing positions in the matrix) - attributed results
5 Portfolio based purchasing strategies
- basic principles for portfolio based purchasing strategies - procedures and additional tools for strategy development - specific purchasing strategies for specific categories - objectives of specific, portfolio based strategies - conditions and contingencies for strategies and categories
A Portfolio Approach to the Development of Differentiated Purchasing Strategies
317
Appendix B
Sources of the case studies
1. DSM
Guide to Purchasing Marketing Planning (1998), DSM N.V. Internet http://www.dsm.nl/, updated 00 02 09. Interviews with: - Willem F. van Oppen, Director Purchasing Services, DSM Services, 00 02 18, 00 03 20, 00 04 21, and 00 05 22 - Wim A. B. Donners, President of DSM Elastomers Europe/Asia, 00 03 31 - Jan H. Kruit, Business Group Director DSM Hydrocarbons, 00 08 02 and 00 07 23 - Andriëtte Dobbelsteen, Business Process Analyst, DSM Services, 00 10 26 - Kees Aartsen, Marketing Manager Aromatics, DSM Hydrocarbons, 00 10 26 - Malcolm Saggers, Director Chemicals & Raw Materials, DSM Services, 00 10 26 - Hans Timmermans, Global Program Manager E-Procurement, DSM, 00 11 03. Louwers, D, W. van Oppen and G. Walravens (1999), ‘DSM werkt succesvol met multidisciplinaire inkoopteams’, Tijdschrift voor Inkoop & Logistiek, Vol. 15, January-February, 8-12 (Dutch text). State of the Union between BG/BU’s & Purchasing Services (1999, 2000), DSM Purchasing Services.
318
2. Akzo Nobel Coatings
Internet, http://www.akzonobel.com/ updated 00 09 11 Interviews with: - Dick L. Bartelse, Purchasing Vice President Decorative Coatings International, Akzo Nobel Decorative Coatings, 00 09 22 and 00 11 01 - Bert van den Heuvel, Purchasing Manager Raw Materials/Packaging, Akzo Nobel Decorative Coatings, 00 10 25 - Ruben Manniën, Purchaser Raw Materials, Akzo Nobel, Car Refinishes, 00 11 09 - Wynanda de Vries, Purchaser Packaging, Akzo Nobel, Car Refinishes, 00 11 09. Bartelse, D.L. (2000), ‘Het inkopen van grondstoffen’, Handboek Internationaal Inkopen, April, B 1300-1 – B 1300-20 (Dutch text). Annual Report 1999, Februay 2000, Akzo Nobel.
3. TE STRAKE – Engineering & Production
TE STRAKE – Jaarverslag 1999 (annual report). Internet, http://www.testrake.nl/, updated 01 02 05 Interviews with: - Wilfred van der Made, Strategic Buyer, Business Unit Engineering & Production, 01 02 09, 01 04 17, and 01 06 11. - Hans Goedhart, Demand Chain Manager, Business Unit Engineering & Production, 01 05 02 and 01 06 11. - Jos Gunsing, Technology Coordinator, Business Unit Engineering & Production, 01 05 02 - Peter Hamers, Initial Purchasing Electronics, Business Unit Engineering & Production, 01 05 02 and 01 06 11. - Charmaine Kuijpers, Technical Purchasing/Marketing, Business Unit Engineering & Production, 01 05 02 and 01 06 11.

A Portfolio Approach to the Development of Differentiated Purchasing Strategies
319
Appendix C
Reactions to the mutual dependence model
1. Reactions DSM
Buyer’s dependence
1. Financial magnitude is not considered as a determinant of DSM’s dependence on suppliers. 2. There are different forms of criticality to buyer’s dependence. In some cases there is a logistic dependence, because products are indispensable in business operations (production processes). In other cases, there is a technological dependence, because products and services are technologically very complex. DSM has important service level agreements for the maintenance and repair of critical machinery. 3. The number of alternative suppliers is an important determinant to DSM’s dependence on suppliers. More specific, in several cases DSM has no actual alternatives, because suppliers hold critical patent positions. 4. Finally, switching cost is considered as an important determinant too.
Supplier’s dependence
1. Financial magnitude is generally considered as the most important determinant of supplier’s dependence. Financial magnitude, to be more specific, refers to sales and profit, based on current business and on potential business. 2. Criticality is a determinant of supplier’s dependence, in the sense that DSM provided unique know how. Suppliers are dependent of DSM, because they enhance their competences, capabilities and possibilities for development. 3. The number of alternative buyers is, in a general way, important to the supplier’s dependence. 4. The same goes for switching cost.

320
2. Reactions Akzo Nobel Coatings
Buyer’s dependence
1. Financial magnitude is not considered as a determinant of dependence on suppliers. 2. Criticality can raise problems of dependence, in case of dedicated products. To be more specific, technical dependence is usually caused by specifications that limit alternative possibilities. 3. The number of alternative suppliers is the most important determinant to Akzo Nobel’s dependence on suppliers. 4. In case of leverage and non-critical items switching costs are usually low, while in case of strategic and bottleneck items switching costs can be high.
Supplier’s dependence
1. Financial magnitude is generally considered as the most important determinant of supplier’s dependence. 2. Criticality can be a determinant of supplier’s dependence, if the supplier considers Akzo Nobel as an important customer for reasons of image and reference. Suppliers might want to use Akzo Nobel as a referent customer in their communication with other buying companies. 3. The number of alternative buyers is not an important determinant to the supplier’s dependence. 4. The same goes for switching cost.
3. Reactions TE STRAKE - Engineering & Production
Buyer’s dependence
1. Financial magnitude is not considered as a determinant of dependence on suppliers. 2. There are different forms of criticality to buyer’s dependence. There is a logistic dependence, because a large number of items have to be delivered on a tight schedule for the assembly of the end product. The business unit needs reliable and short lead. In case of the key preferred suppliers, there is a technological dependence, because of the technological expertise of suppliers. 3. The number of alternative suppliers is a very important determinant to TE STRAKE’s dependence on suppliers. On occasions, a major customer lists a number of second tier suppliers that have to be contracted. The interference and the demands of major customer can create dependence on certain suppliers. 4. To conclude, switching costs are usually high, especially in case of dedicated suppliers with whom long-term relationships are maintained.

A Portfolio Approach to the Development of Differentiated Purchasing Strategies
321
Supplier’s dependence
1. Financial magnitude is generally considered as the most important determinant of supplier’s dependence. 2. Criticality as such is not considered as a determinant of supplier’s dependence, although some key suppliers depend to a certain extent on the technological input of the buyer. 3. In a general sense, the number of alternative buyers is a determinant to the supplier’s dependence. 4. Some suppliers are very dependent on TE STRAKE, partly due to the relative financial value of purchases, partly due to the switching costs that have to be made, when partnering with another buyer.
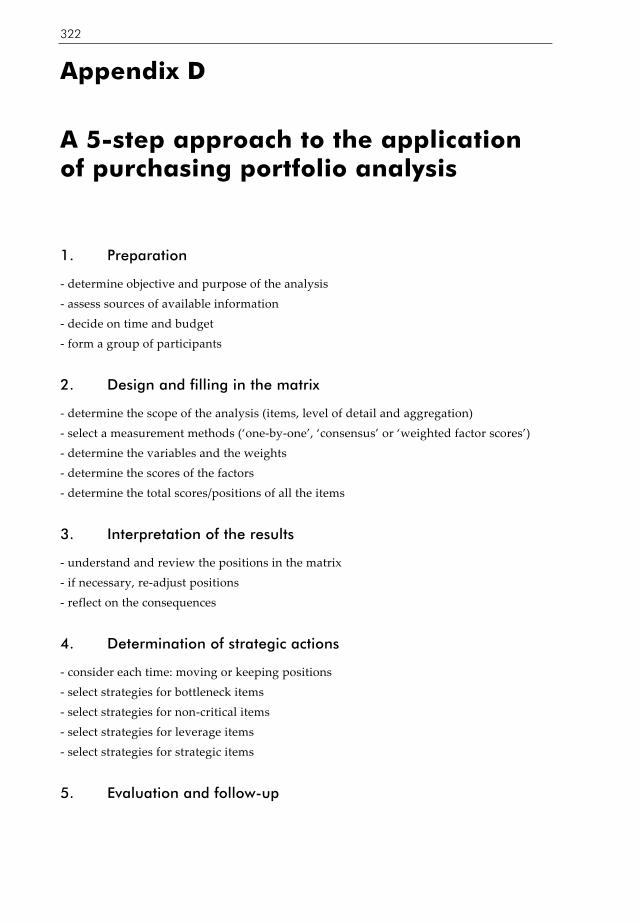
322
Appendix D
A 5-step approach to the application of purchasing portfolio analysis
1. Preparation
- determine objective and purpose of the analysis - assess sources of available information - decide on time and budget - form a group of participants
2. Design and filling in the matrix
- determine the scope of the analysis (items, level of detail and aggregation) - select a measurement methods (‘one-by-one’, ‘consensus’ or ‘weighted factor scores’) - determine the variables and the weights - determine the scores of the factors - determine the total scores/positions of all the items
3. Interpretation of the results
- understand and review the positions in the matrix - if necessary, re-adjust positions - reflect on the consequences
4. Determination of strategic actions
- consider each time: moving or keeping positions - select strategies for bottleneck items - select strategies for non-critical items - select strategies for leverage items - select strategies for strategic items
5. Evaluation and follow-up

A Portfolio Approach to the Development of Differentiated Purchasing Strategies
323
Appendix E
Action research: using the outline in practice
E Action research: using the outline in practice
This appendix summarizes the results of an action research project that was carried out within Emtec High Tech Industrial Solutions, a Dutch company that provides industrial production equipment for the high-tech industry. The project was aimed at developing differentiated purchasing and supplier strategies for a new product, based on a portfolio analysis. In the Spring of 2002 the research was carried out by Edwin Noordman (Manager Logistics at Emtec) for his end-term project of the Executive MBA Programme of TSM Business School. It was supervised by Cees J. Gelderman (Open University of the Netherlands).
Background information
The semiconductor industry, with 70% of Emtec’s sales, is the company’s most important market. Emtec is positioned in four market segments, the largest of which is the supply of (sub) assemblies to the OEM market. Emtec is both a main supplier and a second tier supplier. The other segments include the MRO market, engineering services, and the design and manufacturing of customer-specific equipment. In 2001 approximately 400 employees realized a total turnover of about 45 million Euro. The semiconductor industry is very cyclical. The overall growth rate is at least 15% per year, varying from 30% growth in good years to a 20% decline in a normal downturn. The latest downturn started in the first half of 2001 and lasted for more than a year. With a 30% to 40% declining market it was one of the severest downturns ever. For Emtec this downturn had serious consequences. The order intake dropped to almost zero and in a time frame of a couple of months the workload dropped 30% to 40%. Especially in the production unit this led to a big reorganization, including a head count reduction of over 25%. This downturn showed in a painful way the weak position in the supply chain. Customers simply cancelled or postponed orders without any financial compensation. An attempt to pass this risk further down to the suppliers did not succeed. The power position of Emtec was too weak and its dependency on a limited number of customers was too high. In order to reduce this dependency, the strategy of Emtec was to start up a new OEM
324
business alongside the current activities. One of the main initiatives was the introduction of a new product, the ASIGS (Automated Silicon on Insulator Gluing System). The ASIGS is a tool for Substrate Transfer Technology (STT) in the semiconductor industry, jointly developed with Philips Research. The ASIGS was designed specifically for semiconductor manufacturers to develop Semiconductor On Anything process capability. In the STT process silicon wafers, including the Integrated Circuits, are glued on insulating substrates like glass. Removing the performance limiting silicon substrate results in reduced power consumption and higher performance of Radio Frequency components.
Research questions
This research was aimed at developing differentiated purchasing strategies for the ASIGS, based on a portfolio analysis in order to contribute to Emtec’s competitive advantage. Within the boundaries of the research a reduction of costs and of risk, and a better use of suppliers should increase the company’s competitive advantage. In accordance with this objective three research questions were formulated: 1. How should the components and materials of the ASIGS be positioned in the purchasing portfolio matrix? 2. How should these positions be assessed, in view of the problems and developments in the semiconductor industry? 3. What strategies could be recommended in order to improve the positions that are found in the matrix? In the semiconductor industry the pace of new developments is very high. The investments and capacity required for this continuous development are also very high. Involving suppliers in this development can reduce costs and the time to market (Wynstra, 2000). Involving suppliers in an early stage might increase the dependency and can therefore be contradictory to reducing risk. The key issue is to find the balance between involving suppliers and reducing the risk. An analysis of the current situation made it clear that Emtec had been very dependent on a limited number of suppliers. Obviously, this resulted in a high supply risk. Non-performance of a single supplier would have a great influence on Emtec’s own performance. In the semiconductor industry reliability and short delivery times are key issues. A low price is an important factor in the competitive advantage but certainly not the only one. Reliability of the organization (and not only the product) is very important. The portfolio analysis should therefore include a critical review of the positions in the matrix that are likely to be achieved. Are they acceptable? Are certain positions likely to cause problems? Before strategic actions are determined, it is imperative to complete a further process of interpreting and reflecting on the results. The filling in of a matrix should be considered

A Portfolio Approach to the Development of Differentiated Purchasing Strategies
325
as the starting point of portfolio analysis, not the finishing point (Gelderman and Van Weele, 2002a).
Design and results
To address the research questions it was concluded that the Kraljic matrix would be the most suitable model, as it aims at minimizing supply risk and making the most of buying power. The Kraljic model is generally accepted and used, although there is little literature on the actual use and application of the portfolio analysis. Gelderman and De Boer (2001) suggested a 5-step approach for the portfolio analysis, based on empirical research. The 5 steps are: 1) Preparation. 2) Design and filling in the matrix. 3) Interpretation of the results. 4) Defining strategic actions. 5) Evaluations and follow-up. In this research project, this stepwise approach was used, because it closely fitted the research objectives and the research questions.
Step 1 Preparation
In this preparation phase a cross-functional team was formed. Most of the preparation time was spent on getting the organization ready for this research. Although the top management was interested in the research, other parts of the organization had to be convinced as well, and not just the people that were needed on the team, but their line managers as well. At the end of the day they were the ones to decide how much time their people were allowed to spend on the project. In this preparation phase close-working relationships were developed with the project manager responsible for the product design and the manager of the purchasing department.
What was the objective?
The objective of the study was to define differentiated purchasing strategies. During the preparation some complementary objectives seemed to be important as well. In the second half of 2002 a new model of the ASIGS was to be designed, based on the current system. The engineers needed the outcome of this analysis to improve the design. Furthermore, the purchasing manager was interested in using the Kraljic method more frequently. Additional objectives were: - to give input for the design of the next generation tool, - to introduce the Kraljic portfolio analysis to improve the professionalism of the purchasing department and to improve the co-operation between the engineering and purchasing departments.
What information was available?
For the portfolio analysis the team needed the complete Bill Of Materials (BOM) of the ASIGS and specific purchasing information of all these components. The PDM (Product

326
Data Management) system contained the BOM. The purchasing information, if available, should be in the ERP system. The ERP system also contained a duplicate of the BOM. But it turned out that the information in the DPM application was the most reliable. As a starting point the BOM from the DPM system was used.
What was the available time and budget?
The available time was limited by the start of the next generation design. The time available for the portfolio analysis was about 2 months. This relatively short time frame meant that in some of the steps the team would be unable to go through every detail. In some cases assumptions had to be made. As far as the budget was concerned, there were no constraints, although the number of hours the team members could spend on the project was not unlimited.
Who were to participate in the team?
Taking the objectives of the research into account representatives of various departments had to form part of the team. The team should include a purchaser, an engineer and someone from the production department. The role of the last one was to translate the engineering data into production and purchasing information. He also decided which custom-made parts should be made inhouse and which should be outsourced. Since there is a distinction between a mechanical part and an electro-technical and software part it was imperative to include representatives from both disciplines. In addition, the head of the purchasing department and project manager in charge of the design had to be on the team as well. The role of the manager of the research project was mostly to provide the theoretical framework and to direct the process by chairing meetings and processing the collected data. With a total of 9 individuals, the team was quite large. In collecting and processing data this was likely to cause some coordination problems. Therefore, it was decided to split up the team in a mechanical and an electro-technical group. After selecting the factors with the whole group, the groups filled in the two matrices. When the matrices were completed, they were combined and strategic actions were planned by the group as a whole. As all departments were involved, a sense of awareness and acceptance was created, which helped to keep the situation workable.
Step 2 Designing and filling in the Matrix
To answer the first research question, the project team had to design the matrix by defining the level of aggregation, the variables and their weight. During the first meeting with the team these issues were discussed.
Level of aggregation or detail:
In discussing the level of aggregation the purchasers at first wanted to group items as much as possible and reduce the number of suppliers. In their opinion one group per

A Portfolio Approach to the Development of Differentiated Purchasing Strategies
327
supplier was sufficient. The engineers on the other hand wanted to see as much detail as possible. If they got detailed information out of the portfolio analysis it would be easier to improve the design. By excessive grouping of individual items the outcome would not be specific enough to be used as input for a redesign. For the grouping of items the right balance had to be found between the level of aggregation and detail. Too much detail meant that the analysis would take too long, which would cause serious problems as time was limited. Special attention had to be paid to specific components (e.g. machined parts), since it was unknown at the time how these should be purchased. Were all these parts going to be purchased as individual components or as complete sub-assemblies? As a starting point the criteria for grouping were: - Simple standard components like fasteners, pneumatics, bearings etc. were grouped. - Standard components critical for the function of the ASIGS were not grouped with other non-critical components. - The type of manufacturing method combined specific components. - Exceptions to these were specific components that have to be processed together. These were combined into one group.
Determining the variables and their weight:
In setting the variables the team came to the conclusion that the analysis still had to be manageable. This meant that only a limited number of variables could be taken into account. However, with only a small number of groups, more factors could be taken into account. As a starting point the team set the following factors: - Profit impact:
- Price of the item / group as a % of the total price - Supply risk:
- Number of suppliers. - Replaceability in the current design. - Risk of failure. What is the risk when an item/group does not meet the required
specification or is failing? In discussing the weights of the three factors on the supply risk axis the team could not determine which factor was the most important. From the purchaser point of view the number of suppliers was the most important factor. For the designer the replaceability carried more weight. But after some discussion the team concluded that the strategy and the customer point of view were also very important. At this point in the analysis it was decided that (for the moment) all factors were to be equally weighted.
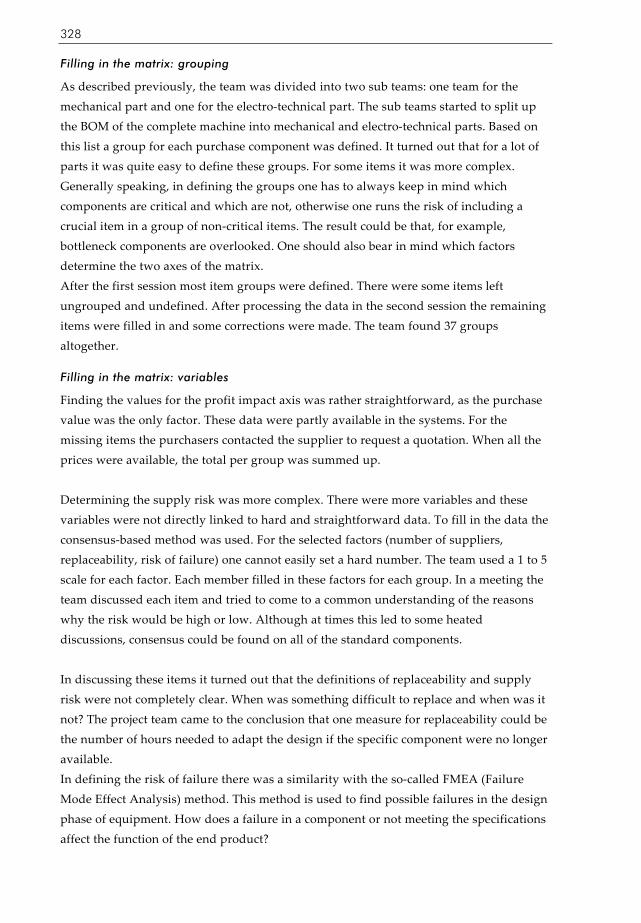
328
Filling in the matrix: grouping
As described previously, the team was divided into two sub teams: one team for the mechanical part and one for the electro-technical part. The sub teams started to split up the BOM of the complete machine into mechanical and electro-technical parts. Based on this list a group for each purchase component was defined. It turned out that for a lot of parts it was quite easy to define these groups. For some items it was more complex. Generally speaking, in defining the groups one has to always keep in mind which components are critical and which are not, otherwise one runs the risk of including a crucial item in a group of non-critical items. The result could be that, for example, bottleneck components are overlooked. One should also bear in mind which factors determine the two axes of the matrix. After the first session most item groups were defined. There were some items left ungrouped and undefined. After processing the data in the second session the remaining items were filled in and some corrections were made. The team found 37 groups altogether.
Filling in the matrix: variables
Finding the values for the profit impact axis was rather straightforward, as the purchase value was the only factor. These data were partly available in the systems. For the missing items the purchasers contacted the supplier to request a quotation. When all the prices were available, the total per group was summed up. Determining the supply risk was more complex. There were more variables and these variables were not directly linked to hard and straightforward data. To fill in the data the consensus-based method was used. For the selected factors (number of suppliers, replaceability, risk of failure) one cannot easily set a hard number. The team used a 1 to 5 scale for each factor. Each member filled in these factors for each group. In a meeting the team discussed each item and tried to come to a common understanding of the reasons why the risk would be high or low. Although at times this led to some heated discussions, consensus could be found on all of the standard components. In discussing these items it turned out that the definitions of replaceability and supply risk were not completely clear. When was something difficult to replace and when was it not? The project team came to the conclusion that one measure for replaceability could be the number of hours needed to adapt the design if the specific component were no longer available. In defining the risk of failure there was a similarity with the so-called FMEA (Failure Mode Effect Analysis) method. This method is used to find possible failures in the design phase of equipment. How does a failure in a component or not meeting the specifications affect the function of the end product?

A Portfolio Approach to the Development of Differentiated Purchasing Strategies
329
In determining the supply risk for the special components (custom made) the team faced an unforeseen problem. The first factor (number of suppliers) was easy to determine. The purchasers had a good view on the supply market. But as far as the replaceability and the risk of failure was concerned, it turned out to be impossible to make a judgement. At first the team combined all the outsource parts into three groups, one group for each process category (machine parts, sheet metal & welding, and plastics). It was concluded that the level of aggregation was too high. It was not possible to determine the risk of failure. The replaceability was not applicable for the outsourced parts. Since those parts were specifically designed for the machine they could not be replaced anyhow.
Step 3 Interpretation of the results
At this stage, all data were collected and the supply risk of the items was determined, so that the portfolio could be filled in (see figure E1). The supply risk axis is the sum of the scores of the three factors: number of suppliers, replaceability, and risk of failure. For some items the replaceability was not applicable. To be able to compare these items with the other items the sum of the two remaining factors was multiplied by 1,5 to fit in the same scale. For the profit impact the factor was the total purchase value of the item in that group. The values varied from less then 100 Euro to almost 10,000 Euro per group. For reasons of interpretation, a logarithmic scale was used to represent the profit impact axis. In the matrix 15 items were located in the leverage and the strategic quadrant, representing 90% of total value.
Figure E1 Current ASIGS portfolio

330
In evaluating the individual items one item was placed in the wrong quadrant. One bottleneck item seemed to be misinterpreted and was therefore moved to the routine quadrant. For the remaining items some discussion arose about the position within the quadrant. But these were all minor issues and in the project meeting the group decided that it would not be worthwhile to make additional adjustments to the portfolio. The over-all picture and the relative position of the items made sense. The project team found this to be a good representation of the current situation. The first research question of the project was answered by the matrix (figure E1) that was found for ASIGS. It was concluded that the quality of the portfolio was sufficient to start with the development of the strategic actions, addressing the second research question. “How should these positions be assessed, in view of the problems and developments in the semiconductor industry?” Would Emtec encounter the same problems with the ASIGS as during the last semiconductor downturn? What would the power position be if no improvement could be made? Would Emtec be able to keep pace with the fast development of new technology? Assessing the matrix, in view of these problems, the project team concluded that improvement was required to prevent future problems. With the current portfolio there was a realistic risk of falling back into the same problems again. Looking at the over-all matrix the team concluded that the number of items in the strategic and bottleneck quadrant was too high. This resulted in a too high dependency on the suppliers. This had been one of the main problems in the recent downturn. So a strong desire existed to reduce this dependency. If dependency cannot be reduced it should be managed in a proper way. Furthermore, the team concluded that the number of routine items was relatively high. With an increasing market demand these time-consuming items could hinder the efficiency of the purchasing department. Extra capacity might be needed, but this would increase the cost price. There was a wish to improve the efficiency by reducing the number of suppliers.
Step 4 Defining strategic actions
Kraljic (1983) defined a set of generic strategies. Gelderman and Van Weele (2002a) elaborated these strategies into a larger number of strategies, taking into account different conditions and circumstances. A distinction is made between strategic actions to switch to another position and strategic actions that imply ‘staying in the same category’. The first type of strategy is of a more pro-active, aggressive nature. The second type of strategy is of a more re-active nature, accepting the status quo. Obviously, moving in the matrix is not always possible or desirable. Figure E2 shows these different strategies, in the ASIGS portfolio.

A Portfolio Approach to the Development of Differentiated Purchasing Strategies
331
Figure E2 Generic strategies in the matrix
(Based on Gelderman and Van Weele , 2002a)
In this phase all the items in the ASIGS portfolio could be assessed with these generic strategies. In assessing the position in the matrix and defining strategic actions, special attention had to be paid to the problems that Emtec had faced in the recent semiconductor downturn. In the downturn, Emtec’s dependency on suppliers resulted in serious problems. As described by Gelderman (2000), the Kraljic matrix can be seen as a buyer-supplier dependency matrix. Reducing the supply risk will lead to a lower dependency. In some cases a strategic partnership, and therefore a higher dependency, is desirable. This, however, can only be the case in a win-win situation. In terms of the research objective, a partnership should contribute to the competitive advantage. When a partnership is not contributing, the items in the strategic quadrant should be moved to the leverage quadrant by reducing the dependency. To translate these strategies into strategies applicable for Emtec, and to answer the third and final research question, the project team was split up into three subgroups. Discussing all the items in the whole group would not have been very efficient. After completing the homework in the sub-groups the results were combined. The homework for the three groups was to: - analyze the design to find whether improvements in the position of the bottleneck and the strategic items were possible. This group consisted of the two engineers and the project manager for the redesign.
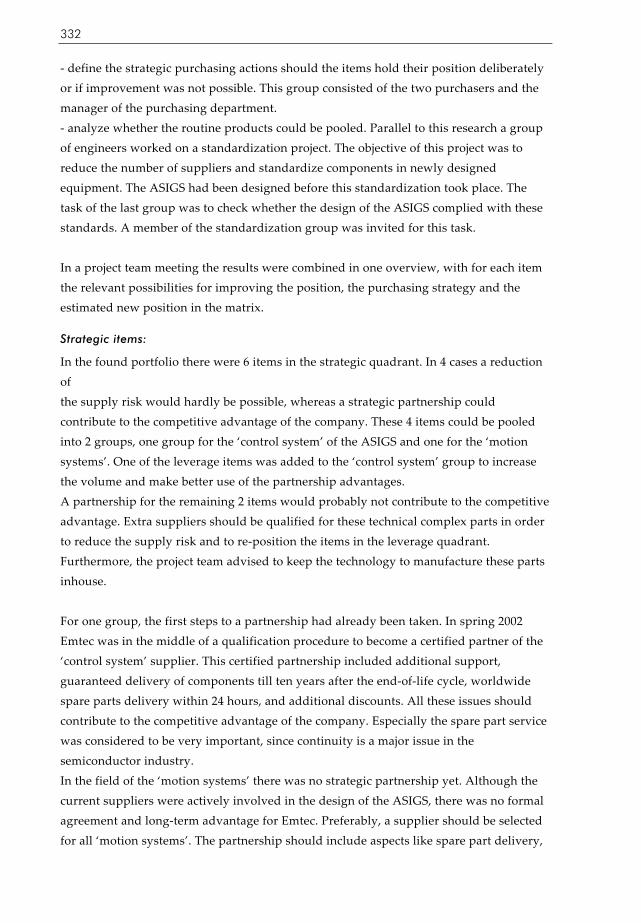
332
- define the strategic purchasing actions should the items hold their position deliberately or if improvement was not possible. This group consisted of the two purchasers and the manager of the purchasing department. - analyze whether the routine products could be pooled. Parallel to this research a group of engineers worked on a standardization project. The objective of this project was to reduce the number of suppliers and standardize components in newly designed equipment. The ASIGS had been designed before this standardization took place. The task of the last group was to check whether the design of the ASIGS complied with these standards. A member of the standardization group was invited for this task. In a project team meeting the results were combined in one overview, with for each item the relevant possibilities for improving the position, the purchasing strategy and the estimated new position in the matrix.
Strategic items:
In the found portfolio there were 6 items in the strategic quadrant. In 4 cases a reduction of the supply risk would hardly be possible, whereas a strategic partnership could contribute to the competitive advantage of the company. These 4 items could be pooled into 2 groups, one group for the ‘control system’ of the ASIGS and one for the ‘motion systems’. One of the leverage items was added to the ‘control system’ group to increase the volume and make better use of the partnership advantages. A partnership for the remaining 2 items would probably not contribute to the competitive advantage. Extra suppliers should be qualified for these technical complex parts in order to reduce the supply risk and to re-position the items in the leverage quadrant. Furthermore, the project team advised to keep the technology to manufacture these parts inhouse. For one group, the first steps to a partnership had already been taken. In spring 2002 Emtec was in the middle of a qualification procedure to become a certified partner of the ‘control system’ supplier. This certified partnership included additional support, guaranteed delivery of components till ten years after the end-of-life cycle, worldwide spare parts delivery within 24 hours, and additional discounts. All these issues should contribute to the competitive advantage of the company. Especially the spare part service was considered to be very important, since continuity is a major issue in the semiconductor industry. In the field of the ‘motion systems’ there was no strategic partnership yet. Although the current suppliers were actively involved in the design of the ASIGS, there was no formal agreement and long-term advantage for Emtec. Preferably, a supplier should be selected for all ‘motion systems’. The partnership should include aspects like spare part delivery,
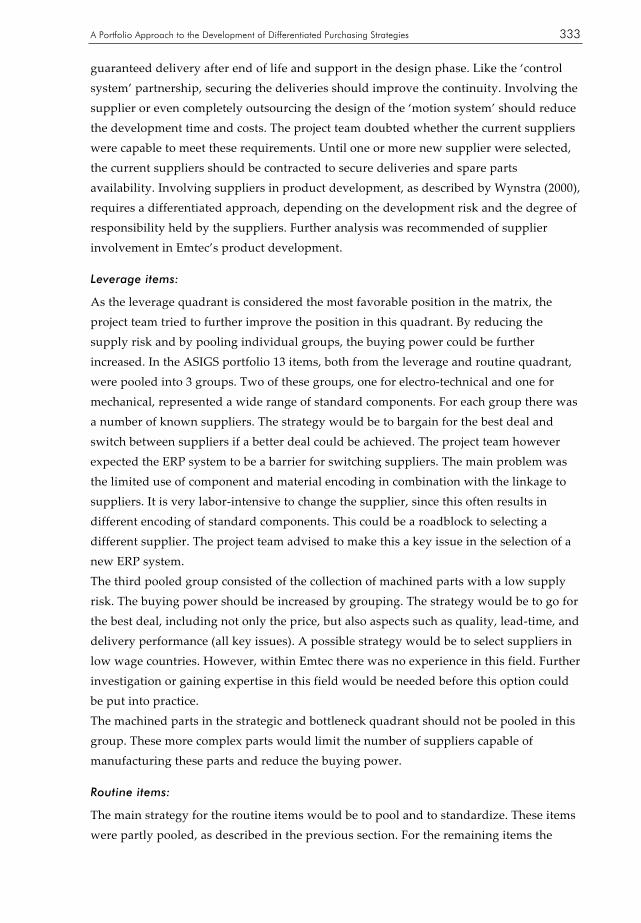
A Portfolio Approach to the Development of Differentiated Purchasing Strategies
333
guaranteed delivery after end of life and support in the design phase. Like the ‘control system’ partnership, securing the deliveries should improve the continuity. Involving the supplier or even completely outsourcing the design of the ‘motion system’ should reduce the development time and costs. The project team doubted whether the current suppliers were capable to meet these requirements. Until one or more new supplier were selected, the current suppliers should be contracted to secure deliveries and spare parts availability. Involving suppliers in product development, as described by Wynstra (2000), requires a differentiated approach, depending on the development risk and the degree of responsibility held by the suppliers. Further analysis was recommended of supplier involvement in Emtec’s product development.
Leverage items:
As the leverage quadrant is considered the most favorable position in the matrix, the project team tried to further improve the position in this quadrant. By reducing the supply risk and by pooling individual groups, the buying power could be further increased. In the ASIGS portfolio 13 items, both from the leverage and routine quadrant, were pooled into 3 groups. Two of these groups, one for electro-technical and one for mechanical, represented a wide range of standard components. For each group there was a number of known suppliers. The strategy would be to bargain for the best deal and switch between suppliers if a better deal could be achieved. The project team however expected the ERP system to be a barrier for switching suppliers. The main problem was the limited use of component and material encoding in combination with the linkage to suppliers. It is very labor-intensive to change the supplier, since this often results in different encoding of standard components. This could be a roadblock to selecting a different supplier. The project team advised to make this a key issue in the selection of a new ERP system. The third pooled group consisted of the collection of machined parts with a low supply risk. The buying power should be increased by grouping. The strategy would be to go for the best deal, including not only the price, but also aspects such as quality, lead-time, and delivery performance (all key issues). A possible strategy would be to select suppliers in low wage countries. However, within Emtec there was no experience in this field. Further investigation or gaining expertise in this field would be needed before this option could be put into practice. The machined parts in the strategic and bottleneck quadrant should not be pooled in this group. These more complex parts would limit the number of suppliers capable of manufacturing these parts and reduce the buying power.
Routine items:
The main strategy for the routine items would be to pool and to standardize. These items were partly pooled, as described in the previous section. For the remaining items the

334
design should conform to the prescribed standards. The project team found several items that did not conform to Emtec’s design standard. The project team advised to modify the design, where possible, to meet these standards. Not only should the number of suppliers be reduced, but the number of different components as well. When items conform to the standard, the over-all buying power would increase. Looking solely at the position in the ASIGS portfolio, the position would probably remain in the routine quadrant. But due to standardization the number of suppliers would reduce, which would lead to a more efficient processing. Other possibilities to reduce the purchasing costs would be the use of electronic data interchange or putting items on stock.
Bottleneck items:
The project team defined 3 strategic actions for the bottleneck items. The first was to move the items to the routine quadrant by reducing the supply risk. In case of the machined parts qualifying extra suppliers and keeping the manufacturing technology inhouse could reduce the supply risk. For the standard component placed at the top of the bottleneck quadrant, the project team advised to contract the supplier to secure deliveries. The bottleneck item with very low profit impact should be put on stock.
Step 5 Evaluation and follow-up
Some of the strategic actions could be easily implemented in the short term. Others would require more time and energy. In the implementation a distinction can be made between the actions that require a modification of the design (e.g. standardization) and actions without any modification of the design (e.g. pooling). The engineering department should make these design modifications. It makes sense to combine this action with the design of the new fully automated ASIGS. This new system is based on the current ASIGS, combined with a fully automated robot system for use in mass fabrication. By combining the modification of the current system and the design of the new system an optimal effect should be achieved with relatively little effort. In the redesign, a high level of standardization should be aimed for. Most of the improvements without modifications of the design are the responsibility of the purchasing department. Extra suppliers should be selected, bottleneck suppliers should be contracted, routine items could be pooled. These are all issues within the responsibility of the purchasing department. Completing the partnership for the ‘control systems’ and selecting a strategic partner for the ‘motion systems’ should be a joint effort from the purchasing manager and the managers in charge of the engineering and OEM units. To make the best use of suppliers all departments should be committed and involved in the selection process. The project team advised to complete these actions before starting with the design of the next generation machine. This new design could be the ideal test case for these newly formed partnerships.

A Portfolio Approach to the Development of Differentiated Purchasing Strategies
335
The 2001-downturn and the subsequent liquidity problems resulted in a lot of pressure on relations with suppliers. Many suppliers became very reserved in starting new business with Emtec. This would be hindering the purchasing manager and could be a serious threat in the implementation of the strategic actions. Therefore, it was seen as a top priority to solve the liquidity problems and stabilize the relations with the suppliers. Solving these problems was far beyond the influence of the members on the project team. Top management would have to deal with these problems. When all actions are implemented the portfolio will look differently, probably much like figure E3. This future portfolio is based on estimated values. Of course, the actual portfolio can only be filled in when the strategic actions are implemented and the effect on the supply risk and profit impact can be determined.
Figure E3 Future, improved ASIGS portfolio
Comparing the current portfolio with the future portfolio, the improvements are: - Reduction of groups from 37 to 25 by pooling. - Reduced number of bottleneck items from 3 to 2 and secured the delivery of these bottleneck products. - Reduced number of strategic items from 6 to 3 and partnerships for these items, which contributes to the competitive advantage. - Increased value in the leverage quadrant from 47% to 61% of the total purchase value. The objective of this research was to contribute to the competitive advantage of Emtec by developing differentiated purchasing strategies. Within the boundaries of this research the competitive advantage can be expressed in terms of reducing costs in the broad sense, reducing risk, and making better use of suppliers (for instance, reducing development

336
time and costs). Translating the above mentioned improvements into these three aspects produces the following results: - The increased value in the leverage quadrant, from 47% to 61% of the total purchase value, results in more buying power. With more buying power better deals can be made, resulting in a lower cost price. Also, the reduced number of suppliers by pooling and standardization of the routine items leads to a more efficient purchasing process. - At the end of the research project, spring 2002, it was not possible to calculate the achievable cost price reduction. The project team estimated that a cost price reduction of at 10% to 20% would be realistic. - Repositioning the bottleneck and strategic items by reducing the supply risk leads to less dependency. The number of items with a high supply risk will be reduced from 9 to 5. For the remaining items the risk should be covered by strategic partnerships, contracts securing delivery and extra stock. Completely eliminating all the risk is not possible. Also the items in the leverage and routine quadrant are not 100% risk free. The project team evaluated the remaining risk as acceptable. - By starting partnerships for the items in the strategic quadrant a win-win situation could be achieved. Emtec can make better use of these suppliers in two ways. Involving the supplier in the design of new equipment will reduce development time and costs. Especially for Emtec, a partnership in the field of ‘motion systems’ is seen as valuable. The supplier is not only delivering the hardware but is responsible for the complete motion system, including the performance and part of the implementation. By involving the supplier specialized knowledge will be available. Once the equipment is installed in the field, the supplier can be used to take care of the spare part supply and operational support. In the semiconductor industry reliability and continuity are key issues. Making the supplier responsible for part of these issues is evaluated as very helpful. To conclude, the project team was convinced that implementing these strategic actions would significantly contribute to the competitive advantage of Emtec. The 5-step approach for the portfolio analysis provided sufficient and appropriate guidance to successfully complete the purchasing portfolio analysis. The project team experienced this project and the introduction of a purchasing portfolio approach as very useful. It helped to get a better understanding and more insight into purchasing issues in general and the ASIGS in particular. By close co-operation, the engineers and the purchasers started to develop a better understanding of each other’s worlds and accompanying problems. In the new strategy of Emtec, starting an OEM business, the purchasing function should get a more prominent place and should significantly contribute to the competitive advantage of the company. This project can be seen as a first step in the professionalization of the purchasing function within Emtec.

A Portfolio Approach to the Development of Differentiated Purchasing Strategies
337
Appendix F Elaboration and overview of the 9 scenario’s
Scenario Purchasing strategy
Kraljic category: treatment variables
Additional information Strategic direction
# 1 safety stocks bottleneck: - low profit impact - high supply risk
- stay in the same category
# 2 decomplex and new supplier
bottleneck: - low profit impact - high supply risk
- move to non-critical
# 3 pooling non-critical: - low profit impact - low supply risk
- move to leverage
# 4 individual ordering non-critical: - low profit impact - low supply risk
- efficient ordering - e.g. Yellow Pages or purchase card
stay in the same category
# 5 partner of convenience
leverage: - high profit impact - low supply risk
- price, quality, delivery and flexibility - only short term cooperation on buyer’s terms
stay in the same category
# 6 towards a strategic partnership
leverage: - high profit impact - low supply risk
- high expectations for the supplier (value, partnering, expertise)
move to strategic
# 7 strategic partnership strategic: - high profit impact - high supply risk
- good relationship with the supplier - excellent performance
stay in the same category
# 8 locked-in ‘partnership’
strategic: - high profit impact - high supply risk
- poor relationship with the supplier - forced relationship
stay in the same category
# 9 terminate partnership, find new supplier
strategic: - high profit impact - high supply risk
- poor relationship with the supplier
move to leverage
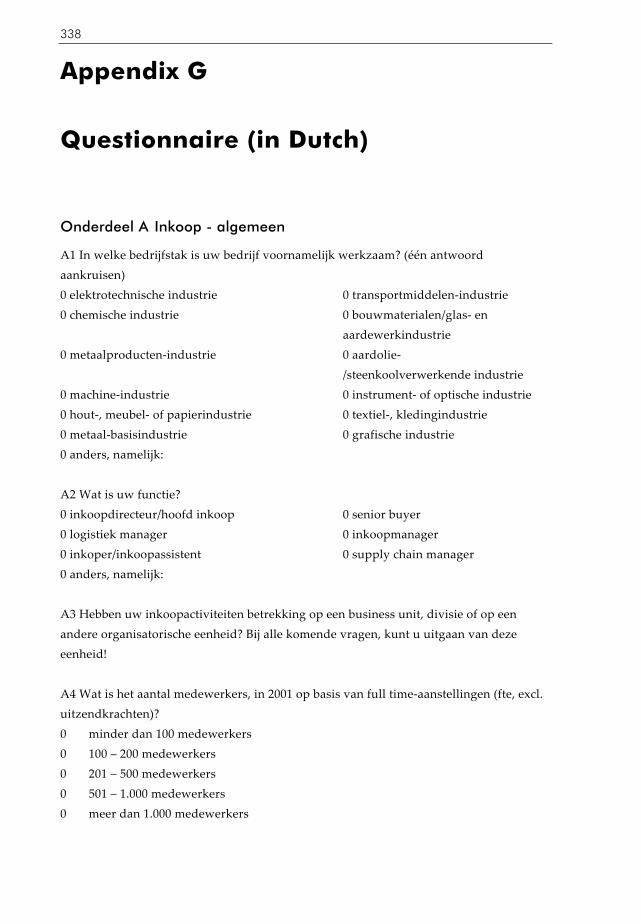
338
Appendix G
Questionnaire (in Dutch)
Onderdeel A Inkoop - algemeen
A1 In welke bedrijfstak is uw bedrijf voornamelijk werkzaam? (één antwoord aankruisen) 0 elektrotechnische industrie 0 transportmiddelen-industrie 0 chemische industrie 0 bouwmaterialen/glas- en
aardewerkindustrie 0 metaalproducten-industrie 0 aardolie-
/steenkoolverwerkende industrie 0 machine-industrie 0 instrument- of optische industrie 0 hout-, meubel- of papierindustrie 0 textiel-, kledingindustrie 0 metaal-basisindustrie 0 grafische industrie 0 anders, namelijk: A2 Wat is uw functie? 0 inkoopdirecteur/hoofd inkoop 0 senior buyer 0 logistiek manager 0 inkoopmanager 0 inkoper/inkoopassistent 0 supply chain manager 0 anders, namelijk: A3 Hebben uw inkoopactiviteiten betrekking op een business unit, divisie of op een andere organisatorische eenheid? Bij alle komende vragen, kunt u uitgaan van deze eenheid! A4 Wat is het aantal medewerkers, in 2001 op basis van full time-aanstellingen (fte, excl. uitzendkrachten)? 0 minder dan 100 medewerkers 0 100 – 200 medewerkers 0 201 – 500 medewerkers 0 501 – 1.000 medewerkers 0 meer dan 1.000 medewerkers
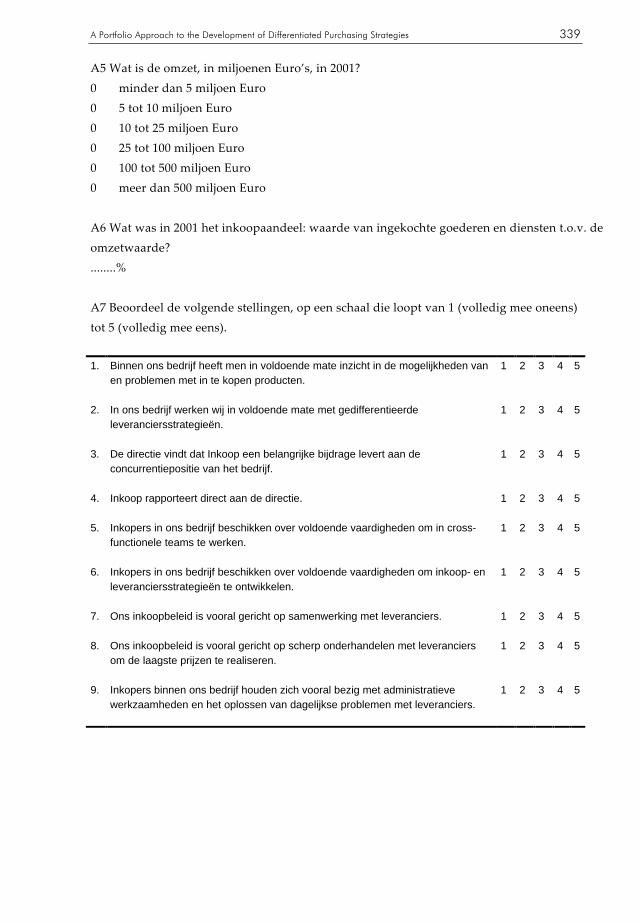
A Portfolio Approach to the Development of Differentiated Purchasing Strategies
339
A5 Wat is de omzet, in miljoenen Euro’s, in 2001? 0 minder dan 5 miljoen Euro 0 5 tot 10 miljoen Euro 0 10 tot 25 miljoen Euro 0 25 tot 100 miljoen Euro 0 100 tot 500 miljoen Euro 0 meer dan 500 miljoen Euro A6 Wat was in 2001 het inkoopaandeel: waarde van ingekochte goederen en diensten t.o.v. de omzetwaarde? ........% A7 Beoordeel de volgende stellingen, op een schaal die loopt van 1 (volledig mee oneens) tot 5 (volledig mee eens). 1. Binnen ons bedrijf heeft men in voldoende mate inzicht in de mogelijkheden van
en problemen met in te kopen producten.
1 2 3 4 5
2. In ons bedrijf werken wij in voldoende mate met gedifferentieerde leveranciersstrategieën.
1 2 3 4 5
3. De directie vindt dat Inkoop een belangrijke bijdrage levert aan de concurrentiepositie van het bedrijf.
1 2 3 4 5
4. Inkoop rapporteert direct aan de directie.
1 2 3 4 5
5. Inkopers in ons bedrijf beschikken over voldoende vaardigheden om in cross-functionele teams te werken.
1 2 3 4 5
6. Inkopers in ons bedrijf beschikken over voldoende vaardigheden om inkoop- en leveranciersstrategieën te ontwikkelen.
1 2 3 4 5
7. Ons inkoopbeleid is vooral gericht op samenwerking met leveranciers.
1 2 3 4 5
8. Ons inkoopbeleid is vooral gericht op scherp onderhandelen met leveranciers om de laagste prijzen te realiseren.
1 2 3 4 5
9. Inkopers binnen ons bedrijf houden zich vooral bezig met administratieve werkzaamheden en het oplossen van dagelijkse problemen met leveranciers.
1 2 3 4 5

340
Onderdeel B Inkoop- en leveranciersstrategieën
Het doel van dit onderdeel van de vragenlijst is om te weten welke omstandigheden in de praktijk leiden tot de keuze van bepaalde inkoop- en leveranciersstrategieën. Daartoe vragen wij aan u om zich in te leven in specifieke inkoopsituaties die we telkens eerst zullen schetsen. Iedere situatie beschrijft omstandigheden en een bepaalde oplossing, een strategie die wordt gekozen. Aan u de vraag om een vergelijkbare, typerende situatie in herinnering te brengen, zoals die zich binnen uw bedrijf heeft voorgedaan. Vervolgens kunt u vragen beantwoorden die betrekking hebben op uw organisatie (als koper) en de leverancier (als verkoper) van het betreffende product. In totaal gaat het om 9 situaties, waarover telkens dezelfde serie vragen wordt gesteld.
Situatie (1)
Het gaat om een product met een relatief lage inkoopwaarde, maar met een hoog inkooprisico. Uw organisatie is daarmee kwetsbaar voor wat betreft de toelevering van één leverancier X. Getracht wordt de toelevering zeker te stellen door relatief grote voorraden aan te houden. Probeert u zich een vergelijkbare situatie voor te stellen, zoals u die in uw eigen bedrijf heeft meegemaakt. Beantwoord nu de volgende vragen, op een schaal die loopt van 1 tot 5. in
beperkte
mate
in
hoge
mate
1. In hoeverre herkent u de beschreven situatie in uw praktijk?
1 2 3 4 5
B1 Beantwoord de volgende vragen, op een schaal die loopt van 1 (volledig mee oneens) tot 5 (volledig mee eens).
Volledig
mee
oneens
Volledig
mee
eens 2. U bent afhankelijk van leverancier X.
1 2 3 4 5
3. Betrouwbare levertijden van dit product zijn belangrijk voor een ongestoorde voortgang van productieprocessen.
1 2 3 4 5
4. U heeft die technologische expertise nodig waarover leverancier X beschikt.
1 2 3 4 5
5. Er zijn andere leveranciers die het product ook kunnen leveren.
1 2 3 4 5

A Portfolio Approach to the Development of Differentiated Purchasing Strategies
341
6. U moet hoge kosten maken, als u leverancier X wilt vervangen.
1 2 3 4 5
7. Leverancier X is afhankelijk van u.
1 2 3 4 5
8. U bent, wat omzet betreft, een belangrijke klant voor leverancier X.
1 2 3 4 5
9. Leverancier X heeft uw technologische expertise nodig.
1 2 3 4 5
10.
Er zijn andere kopers waar leverancier X zijn producten kan verkopen.
1 2 3 4 5
11.
Leverancier X moet hoge kosten maken als hij u wilt vervangen door een andere koper.
1 2 3 4 5
12.
De specificaties van het product zijn in hoge mate toegesneden op de wensen en eisen binnen ons bedrijf.
1 2 3 4 5
13.
Het is mogelijk om voor vergelijkbare artikelen standaard-specificaties te gaan hanteren, door te werken met minder specifieke eisen.
1 2 3 4 5
14.
Wij kunnen erop vertrouwen dat leverancier X gemaakte beloften en afspraken daadwerkelijk nakomt.
1 2 3 4 5
15.
Wij kunnen erop vertrouwen dat leverancier X geen misbruik maakt van zijn positie en daadwerkelijk rekening houdt met onze belangen.
1 2 3 4 5
16.
We doen zaken met leverancier X, voornamelijk omdat we goed en plezierig kunnen samenwerken.
1 2 3 4 5
17.
We doen zaken met leverancier X, voornamelijk omdat het te veel tijd, energie en geld zou kosten om de relatie te beëindigen.
1 2 3 4 5
Situatie (2)
Het gaat om een product met een relatief lage inkoopwaarde, maar met een hoog inkooprisico. Uw organisatie is daarmee kwetsbaar voor wat betreft de toelevering van leverancier X. Als antwoord op dit probleem wordt nu gekozen voor het gaan zoeken naar andere oplossingen, met name door te werken met meer gangbare specificaties (minder complex) en zo nodig met een andere leverancier. Probeert u zich een vergelijkbare situatie voor te stellen, zoals u die in uw eigen bedrijf heeft meegemaakt.
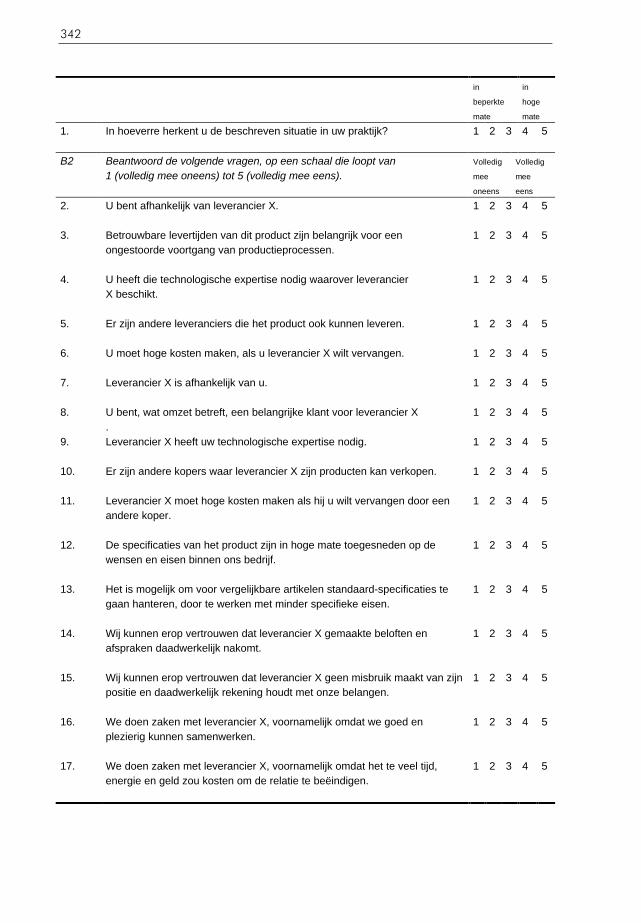
342
in
beperkte
mate
in
hoge
mate
1. In hoeverre herkent u de beschreven situatie in uw praktijk?
1 2 3 4 5
B2 Beantwoord de volgende vragen, op een schaal die loopt van 1 (volledig mee oneens) tot 5 (volledig mee eens).
Volledig
mee
oneens
Volledig
mee
eens
2. U bent afhankelijk van leverancier X.
1 2 3 4 5
3. Betrouwbare levertijden van dit product zijn belangrijk voor een ongestoorde voortgang van productieprocessen.
1 2 3 4 5
4. U heeft die technologische expertise nodig waarover leverancier X beschikt.
1 2 3 4 5
5. Er zijn andere leveranciers die het product ook kunnen leveren.
1 2 3 4 5
6. U moet hoge kosten maken, als u leverancier X wilt vervangen.
1 2 3 4 5
7. Leverancier X is afhankelijk van u.
1 2 3 4 5
8. U bent, wat omzet betreft, een belangrijke klant voor leverancier X .
1 2 3 4 5
9. Leverancier X heeft uw technologische expertise nodig.
1 2 3 4 5
10. Er zijn andere kopers waar leverancier X zijn producten kan verkopen.
1 2 3 4 5
11. Leverancier X moet hoge kosten maken als hij u wilt vervangen door een andere koper.
1 2 3 4 5
12. De specificaties van het product zijn in hoge mate toegesneden op de wensen en eisen binnen ons bedrijf.
1 2 3 4 5
13. Het is mogelijk om voor vergelijkbare artikelen standaard-specificaties te gaan hanteren, door te werken met minder specifieke eisen.
1 2 3 4 5
14. Wij kunnen erop vertrouwen dat leverancier X gemaakte beloften en afspraken daadwerkelijk nakomt.
1 2 3 4 5
15. Wij kunnen erop vertrouwen dat leverancier X geen misbruik maakt van zijn positie en daadwerkelijk rekening houdt met onze belangen.
1 2 3 4 5
16. We doen zaken met leverancier X, voornamelijk omdat we goed en plezierig kunnen samenwerken.
1 2 3 4 5
17. We doen zaken met leverancier X, voornamelijk omdat het te veel tijd, energie en geld zou kosten om de relatie te beëindigen.
1 2 3 4 5

A Portfolio Approach to the Development of Differentiated Purchasing Strategies
343
Situatie (3)
Hier gaat het om een relatief goedkoop product met een relatief laag inkooprisico. Het product is daarom niet erg belangrijk voor de organisatie, maar moet toch worden ingekocht. Het product wordt ingekocht bij leverancier X. Als benadering van deze situatie wordt ervoor gekozen om het product in een pakket onder te gaan brengen met vergelijkbare producten. Door het bundelen van producten kunnen inkoopbehoeften worden geconcentreerd bij een enkele leverancier. Probeert u zich een vergelijkbare situatie voor te stellen, zoals u die in uw eigen bedrijf heeft meegemaakt. Beantwoord de volgende vragen op basis van de situatie voordat deze bundeling heeft plaatsgevonden. in
beperkte
mate
in
hoge
mate
1. In hoeverre herkent u de beschreven situatie in uw praktijk?
1 2 3 4 5
B3 Beantwoord de volgende vragen, op een schaal die loopt van 1 (volledig mee oneens) tot 5 (volledig mee eens).
Volledig
mee
oneens
Volledig
Mee
eens
2. U bent afhankelijk van leverancier X.
1 2 3 4 5
3. Betrouwbare levertijden van dit product zijn belangrijk voor een ongestoorde voortgang van productieprocessen.
1 2 3 4 5
4. U heeft die technologische expertise nodig waarover leverancier X beschikt.
1 2 3 4 5
5. Er zijn andere leveranciers die het product ook kunnen leveren.
1 2 3 4 5
6. U moet hoge kosten maken, als u leverancier X wilt vervangen.
1 2 3 4 5
7. Leverancier X is afhankelijk van u.
1 2 3 4 5
8. U bent, wat omzet betreft, een belangrijke klant voor leverancier X.
1 2 3 4 5
9. Leverancier X heeft uw technologische expertise nodig.
1 2 3 4 5
10. Er zijn andere kopers waar leverancier X zijn producten kan verkopen.
1 2 3 4 5
11. Leverancier X moet hoge kosten maken als hij u wilt vervangen door een andere koper.
1 2 3 4 5
12. De specificaties van het product zijn in hoge mate toegesneden op de wensen en eisen binnen ons bedrijf.
1 2 3 4 5
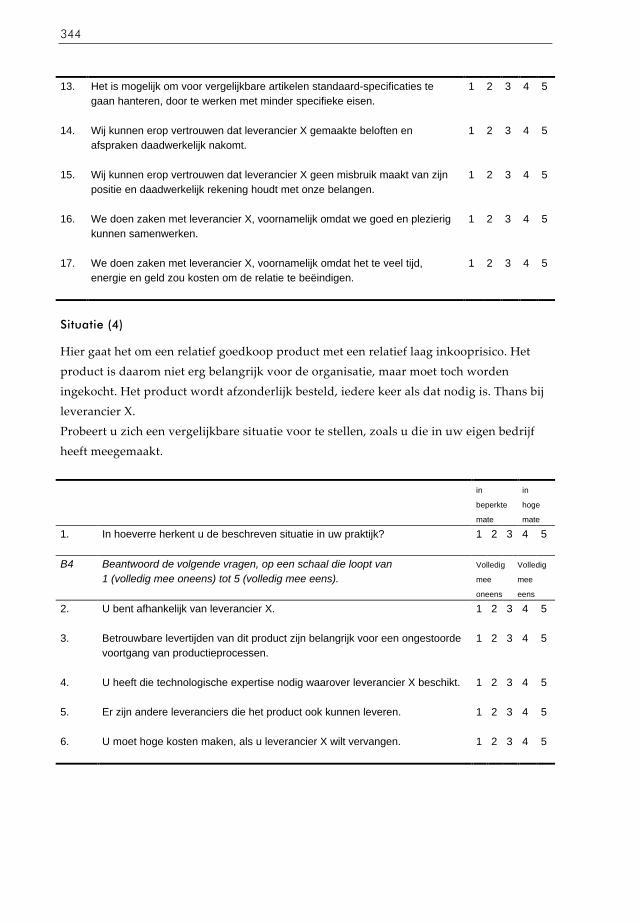
344
13. Het is mogelijk om voor vergelijkbare artikelen standaard-specificaties te
gaan hanteren, door te werken met minder specifieke eisen.
1 2 3 4 5
14. Wij kunnen erop vertrouwen dat leverancier X gemaakte beloften en afspraken daadwerkelijk nakomt.
1 2 3 4 5
15. Wij kunnen erop vertrouwen dat leverancier X geen misbruik maakt van zijn positie en daadwerkelijk rekening houdt met onze belangen.
1 2 3 4 5
16. We doen zaken met leverancier X, voornamelijk omdat we goed en plezierig kunnen samenwerken.
1 2 3 4 5
17. We doen zaken met leverancier X, voornamelijk omdat het te veel tijd, energie en geld zou kosten om de relatie te beëindigen.
1 2 3 4 5
Situatie (4)
Hier gaat het om een relatief goedkoop product met een relatief laag inkooprisico. Het product is daarom niet erg belangrijk voor de organisatie, maar moet toch worden ingekocht. Het product wordt afzonderlijk besteld, iedere keer als dat nodig is. Thans bij leverancier X. Probeert u zich een vergelijkbare situatie voor te stellen, zoals u die in uw eigen bedrijf heeft meegemaakt. in
beperkte
mate
in
hoge
mate
1. In hoeverre herkent u de beschreven situatie in uw praktijk?
1 2 3 4 5
B4 Beantwoord de volgende vragen, op een schaal die loopt van 1 (volledig mee oneens) tot 5 (volledig mee eens).
Volledig
mee
oneens
Volledig
mee
eens
2. U bent afhankelijk van leverancier X.
1 2 3 4 5
3. Betrouwbare levertijden van dit product zijn belangrijk voor een ongestoorde voortgang van productieprocessen.
1 2 3 4 5
4. U heeft die technologische expertise nodig waarover leverancier X beschikt.
1 2 3 4 5
5. Er zijn andere leveranciers die het product ook kunnen leveren.
1 2 3 4 5
6. U moet hoge kosten maken, als u leverancier X wilt vervangen.
1 2 3 4 5
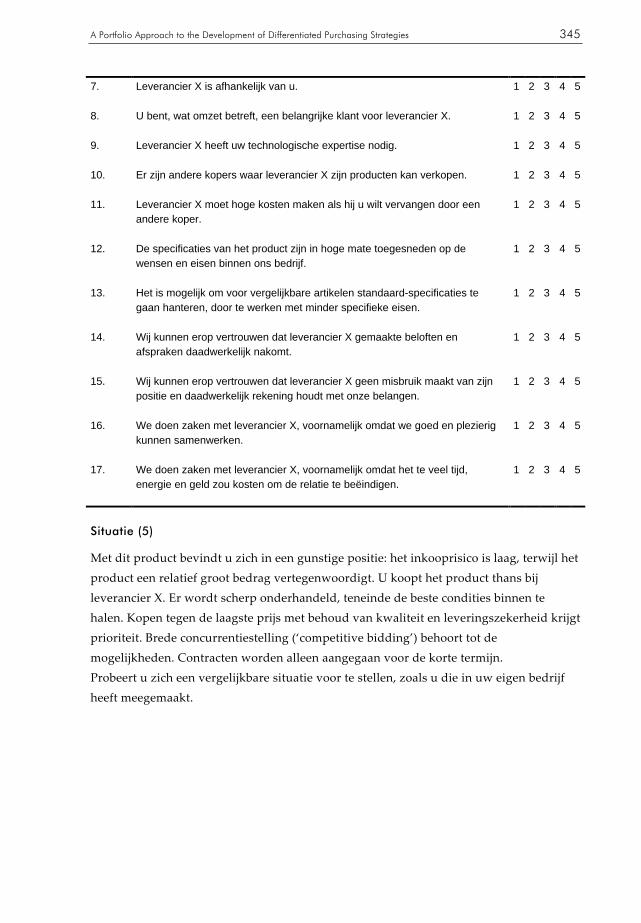
A Portfolio Approach to the Development of Differentiated Purchasing Strategies
345
7. Leverancier X is afhankelijk van u.
1 2 3 4 5
8. U bent, wat omzet betreft, een belangrijke klant voor leverancier X.
1 2 3 4 5
9. Leverancier X heeft uw technologische expertise nodig.
1 2 3 4 5
10. Er zijn andere kopers waar leverancier X zijn producten kan verkopen.
1 2 3 4 5
11. Leverancier X moet hoge kosten maken als hij u wilt vervangen door een andere koper.
1 2 3 4 5
12. De specificaties van het product zijn in hoge mate toegesneden op de wensen en eisen binnen ons bedrijf.
1 2 3 4 5
13. Het is mogelijk om voor vergelijkbare artikelen standaard-specificaties te gaan hanteren, door te werken met minder specifieke eisen.
1 2 3 4 5
14. Wij kunnen erop vertrouwen dat leverancier X gemaakte beloften en afspraken daadwerkelijk nakomt.
1 2 3 4 5
15. Wij kunnen erop vertrouwen dat leverancier X geen misbruik maakt van zijn positie en daadwerkelijk rekening houdt met onze belangen.
1 2 3 4 5
16. We doen zaken met leverancier X, voornamelijk omdat we goed en plezierig kunnen samenwerken.
1 2 3 4 5
17. We doen zaken met leverancier X, voornamelijk omdat het te veel tijd, energie en geld zou kosten om de relatie te beëindigen.
1 2 3 4 5
Situatie (5)
Met dit product bevindt u zich in een gunstige positie: het inkooprisico is laag, terwijl het product een relatief groot bedrag vertegenwoordigt. U koopt het product thans bij leverancier X. Er wordt scherp onderhandeld, teneinde de beste condities binnen te halen. Kopen tegen de laagste prijs met behoud van kwaliteit en leveringszekerheid krijgt prioriteit. Brede concurrentiestelling (‘competitive bidding’) behoort tot de mogelijkheden. Contracten worden alleen aangegaan voor de korte termijn. Probeert u zich een vergelijkbare situatie voor te stellen, zoals u die in uw eigen bedrijf heeft meegemaakt.
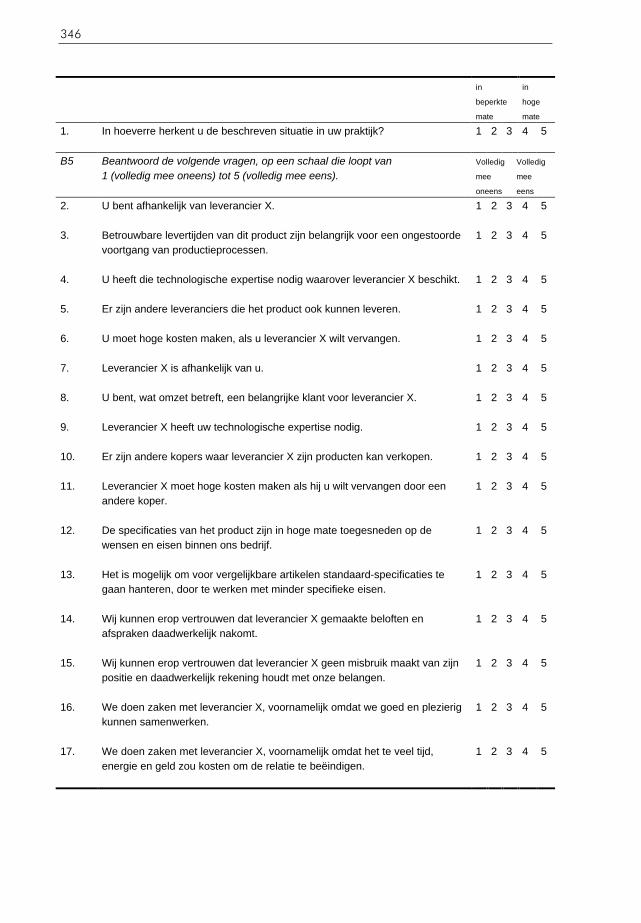
346
in
beperkte
mate
in
hoge
mate
1. In hoeverre herkent u de beschreven situatie in uw praktijk?
1 2 3 4 5
B5 Beantwoord de volgende vragen, op een schaal die loopt van 1 (volledig mee oneens) tot 5 (volledig mee eens).
Volledig
mee
oneens
Volledig
mee
eens
2. U bent afhankelijk van leverancier X.
1 2 3 4 5
3. Betrouwbare levertijden van dit product zijn belangrijk voor een ongestoorde voortgang van productieprocessen.
1 2 3 4 5
4. U heeft die technologische expertise nodig waarover leverancier X beschikt.
1 2 3 4 5
5. Er zijn andere leveranciers die het product ook kunnen leveren.
1 2 3 4 5
6. U moet hoge kosten maken, als u leverancier X wilt vervangen.
1 2 3 4 5
7. Leverancier X is afhankelijk van u.
1 2 3 4 5
8. U bent, wat omzet betreft, een belangrijke klant voor leverancier X.
1 2 3 4 5
9. Leverancier X heeft uw technologische expertise nodig.
1 2 3 4 5
10. Er zijn andere kopers waar leverancier X zijn producten kan verkopen.
1 2 3 4 5
11. Leverancier X moet hoge kosten maken als hij u wilt vervangen door een andere koper.
1 2 3 4 5
12. De specificaties van het product zijn in hoge mate toegesneden op de wensen en eisen binnen ons bedrijf.
1 2 3 4 5
13. Het is mogelijk om voor vergelijkbare artikelen standaard-specificaties te gaan hanteren, door te werken met minder specifieke eisen.
1 2 3 4 5
14. Wij kunnen erop vertrouwen dat leverancier X gemaakte beloften en afspraken daadwerkelijk nakomt.
1 2 3 4 5
15. Wij kunnen erop vertrouwen dat leverancier X geen misbruik maakt van zijn positie en daadwerkelijk rekening houdt met onze belangen.
1 2 3 4 5
16. We doen zaken met leverancier X, voornamelijk omdat we goed en plezierig kunnen samenwerken.
1 2 3 4 5
17. We doen zaken met leverancier X, voornamelijk omdat het te veel tijd, energie en geld zou kosten om de relatie te beëindigen.
1 2 3 4 5

A Portfolio Approach to the Development of Differentiated Purchasing Strategies
347
Situatie (6)
Met dit product bevindt u zich in een gunstige positie: het inkooprisico is laag, terwijl het product een relatief groot bedrag vertegenwoordigt. U koopt het product thans bij leverancier X. U ziet echter mogelijkheden om de relatie te verdiepen, zodat leverancier X in de toekomst meer zal gaan bijdragen aan de concurrentiepositie van uw organisatie. Van leverancier X wordt verwacht dat hij zich als partner gaat gedragen en diens technologische expertise in dienst stelt van de koper, uw organisatie. Probeert u zich een vergelijkbare situatie voor te stellen, zoals u die in uw eigen bedrijf heeft meegemaakt. Beantwoord de vragen op basis van de situatie voordat de samenwerking met leverancier X is gestart. in
beperkte
mate
in
hoge
mate
1. In hoeverre herkent u de beschreven situatie in uw praktijk?
1 2 3 4 5
B6 Beantwoord de volgende vragen, op een schaal die loopt van 1 (volledig mee oneens) tot 5 (volledig mee eens).
Volledig
mee
oneens
Volledig
mee
eens
2. U bent afhankelijk van leverancier X.
1 2 3 4 5
3. Betrouwbare levertijden van dit product zijn belangrijk voor een ongestoorde voortgang van productieprocessen.
1 2 3 4 5
4. U heeft die technologische expertise nodig waarover leverancier X beschikt.
1 2 3 4 5
5. Er zijn andere leveranciers die het product ook kunnen leveren.
1 2 3 4 5
6. U moet hoge kosten maken, als u leverancier X wilt vervangen.
1 2 3 4 5
7. Leverancier X is afhankelijk van u.
1 2 3 4 5
8. U bent, wat omzet betreft, een belangrijke klant voor leverancier X.
1 2 3 4 5
9. Leverancier X heeft uw technologische expertise nodig.
1 2 3 4 5
10. Er zijn andere kopers waar leverancier X zijn producten kan verkopen.
1 2 3 4 5
11. Leverancier X moet hoge kosten maken als hij u wilt vervangen door een andere koper.
1 2 3 4 5

348
12. De specificaties van het product zijn in hoge mate toegesneden op de wensen
en eisen binnen ons bedrijf.
1 2 3 4 5
13. Het is mogelijk om voor vergelijkbare artikelen standaard-specificaties te gaan hanteren, door te werken met minder specifieke eisen.
1 2 3 4 5
14. Wij kunnen erop vertrouwen dat leverancier X gemaakte beloften en afspraken daadwerkelijk nakomt.
1 2 3 4 5
15. Wij kunnen erop vertrouwen dat leverancier X geen misbruik maakt van zijn positie en daadwerkelijk rekening houdt met onze belangen.
1 2 3 4 5
16. We doen zaken met leverancier X, voornamelijk omdat we goed en plezierig kunnen samenwerken.
1 2 3 4 5
17. We doen zaken met leverancier X, voornamelijk omdat het te veel tijd, energie en geld zou kosten om de relatie te beëindigen.
1 2 3 4 5
Situatie (7)
Dit product vertegenwoordigt een bijzondere positie: het inkooprisico is hoog, evenals de financiële waarde van het product. Het gaat dus om een belangrijk product. U beschouwt leverancier X als een belangrijke partner, waarmee een waardevolle relatie van strategische samenwerking bestaat. Beide partijen hebben een zakelijk belang bij het instandhouden van de relatie. De verhoudingen zijn goed en de prestaties van leverancier X worden als uitstekend beoordeeld. Probeert u zich een vergelijkbare situatie voor te stellen, zoals u die in uw eigen bedrijf heeft meegemaakt. in
beperkte
mate
in
hoge
mate
1. In hoeverre herkent u de beschreven situatie in uw praktijk?
1 2 3 4 5
B7 Beantwoord de volgende vragen, op een schaal die loopt van 1 (volledig mee oneens) tot 5 (volledig mee eens).
Volledig
mee
oneens
Volledig
mee
eens
2. U bent afhankelijk van leverancier X.
1 2 3 4 5
3. Betrouwbare levertijden van dit product zijn belangrijk voor een ongestoorde voortgang van productieprocessen.
1 2 3 4 5

A Portfolio Approach to the Development of Differentiated Purchasing Strategies
349
4. U heeft die technologische expertise nodig waarover leverancier X beschikt.
1 2 3 4 5
5. Er zijn andere leveranciers die het product ook kunnen leveren.
1 2 3 4 5
6. U moet hoge kosten maken, als u leverancier X wilt vervangen.
1 2 3 4 5
7. Leverancier X is afhankelijk van u.
1 2 3 4 5
8. U bent, wat omzet betreft, een belangrijke klant voor leverancier X.
1 2 3 4 5
9. Leverancier X heeft uw technologische expertise nodig.
1 2 3 4 5
10. Er zijn andere kopers waar leverancier X zijn producten kan verkopen.
1 2 3 4 5
11. Leverancier X moet hoge kosten maken als hij u wilt vervangen door een andere koper.
1 2 3 4 5
12. De specificaties van het product zijn in hoge mate toegesneden op de wensen en eisen binnen ons bedrijf.
1 2 3 4 5
13. Het is mogelijk om voor vergelijkbare artikelen standaard-specificaties te gaan hanteren, door te werken met minder specifieke eisen.
1 2 3 4 5
14. Wij kunnen erop vertrouwen dat leverancier X gemaakte beloften en afspraken daadwerkelijk nakomt.
1 2 3 4 5
15. Wij kunnen erop vertrouwen dat leverancier X geen misbruik maakt van zijn positie en daadwerkelijk rekening houdt met onze belangen.
1 2 3 4 5
16. We doen zaken met leverancier X, voornamelijk omdat we goed en plezierig kunnen samenwerken.
1 2 3 4 5
17. We doen zaken met leverancier X, voornamelijk omdat het te veel tijd, energie en geld zou kosten om de relatie te beëindigen.
1 2 3 4 5
Situatie (8)
Dit product vertegenwoordigt een bijzondere positie: het inkooprisico is hoog, evenals de financiële waarde van het product. Het gaat dus om een belangrijk product. De verhoudingen met leverancier X laten echter te wensen over. Uw organisatie (de koper) was destijds in hoge mate gedwongen om bij leverancier X te kopen. De organisatie kan thans niets anders doen, dan zich neerleggen bij de feiten en de onvrijwillige relatie met leverancier X zo goed mogelijk houden. Probeert u zich een vergelijkbare situatie voor te stellen, zoals u die in uw eigen bedrijf heeft meegemaakt.

350
in
beperkte
mate
in
hoge
mate
1. In hoeverre herkent u de beschreven situatie in uw praktijk?
1 2 3 4 5
B8 Beantwoord de volgende vragen, op een schaal die loopt van 1 (volledig mee oneens) tot 5 (volledig mee eens).
Volledig
mee
oneens
Volledig
mee
eens
2. U bent afhankelijk van leverancier X.
1 2 3 4 5
3. Betrouwbare levertijden van dit product zijn belangrijk voor een ongestoorde voortgang van productieprocessen.
1 2 3 4 5
4. U heeft die technologische expertise nodig waarover leverancier X beschikt.
1 2 3 4 5
5. Er zijn andere leveranciers die het product ook kunnen leveren.
1 2 3 4 5
6. U moet hoge kosten maken, als u leverancier X wilt vervangen.
1 2 3 4 5
7. Leverancier X is afhankelijk van u.
1 2 3 4 5
8. U bent, wat omzet betreft, een belangrijke klant voor leverancier X.
1 2 3 4 5
9. Leverancier X heeft uw technologische expertise nodig.
1 2 3 4 5
10. Er zijn andere kopers waar leverancier X zijn producten kan verkopen.
1 2 3 4 5
11. Leverancier X moet hoge kosten maken als hij u wilt vervangen door een andere koper.
1 2 3 4 5
12. De specificaties van het product zijn in hoge mate toegesneden op de wensen en eisen binnen ons bedrijf.
1 2 3 4 5
13. Het is mogelijk om voor vergelijkbare artikelen standaard-specificaties te gaan hanteren, door te werken met minder specifieke eisen.
1 2 3 4 5
14. Wij kunnen erop vertrouwen dat leverancier X gemaakte beloften en afspraken daadwerkelijk nakomt.
1 2 3 4 5
15. Wij kunnen erop vertrouwen dat leverancier X geen misbruik maakt van zijn positie en daadwerkelijk rekening houdt met onze belangen.
1 2 3 4 5
16. We doen zaken met leverancier X, voornamelijk omdat we goed en plezierig kunnen samenwerken.
1 2 3 4 5
17. We doen zaken met leverancier X, voornamelijk omdat het te veel tijd, energie en geld zou kosten om de relatie te beëindigen.
1 2 3 4 5

A Portfolio Approach to the Development of Differentiated Purchasing Strategies
351
Situatie (9)
Dit product vertegenwoordigt een bijzondere positie: het inkooprisico is hoog, evenals de financiële waarde van het product. Het gaat dus om een belangrijk product. Van leverancier X wordt verwacht dat hij zich als partner opstelt. De samenwerking verloopt echter niet naar wens en het blijkt niet mogelijk om leverancier X bij te sturen. In antwoord op deze situatie wordt besloten om te gaan zoeken naar een andere leverancier, waarmee vervolgens een relatie moet worden opgebouwd. Het is duidelijk dat dit geen eenvoudige opgave is. Probeert u zich een vergelijkbare situatie voor te stellen, zoals u die in uw eigen bedrijf heeft meegemaakt. Beantwoord de vragen op basis van de situatie voordat er naar een andere leverancier wordt gezocht. in
beperkte
mate
in
hoge
mate
1. In hoeverre herkent u de beschreven situatie in uw praktijk?
1 2 3 4 5
B9 Beantwoord de volgende vragen, op een schaal die loopt van 1 (volledig mee oneens) tot 5 (volledig mee eens).
Volledig
mee
oneens
Volledig
mee
eens
2. U bent afhankelijk van leverancier X.
1 2 3 4 5
3. Betrouwbare levertijden van dit product zijn belangrijk voor een ongestoorde voortgang van productieprocessen.
1 2 3 4 5
4. U heeft die technologische expertise nodig waarover leverancier X beschikt.
1 2 3 4 5
5. Er zijn andere leveranciers die het product ook kunnen leveren.
1 2 3 4 5
6. U moet hoge kosten maken, als u leverancier X wilt vervangen.
1 2 3 4 5
7. Leverancier X is afhankelijk van u.
1 2 3 4 5
8. U bent, wat omzet betreft, een belangrijke klant voor leverancier X.
1 2 3 4 5
9. Leverancier X heeft uw technologische expertise nodig.
1 2 3 4 5
10. Er zijn andere kopers waar leverancier X zijn producten kan verkopen.
1 2 3 4 5
11. Leverancier X moet hoge kosten maken als hij u wilt vervangen door een andere koper.
1 2 3 4 5

352
12. De specificaties van het product zijn in hoge mate toegesneden op de wensen
en eisen binnen ons bedrijf.
1 2 3 4 5
13. Het is mogelijk om voor vergelijkbare artikelen standaard-specificaties te gaan hanteren, door te werken met minder specifieke eisen.
1 2 3 4 5
14. Wij kunnen erop vertrouwen dat leverancier X gemaakte beloften en afspraken daadwerkelijk nakomt.
1 2 3 4 5
15. Wij kunnen erop vertrouwen dat leverancier X geen misbruik maakt van zijn positie en daadwerkelijk rekening houdt met onze belangen.
1 2 3 4 5
16. We doen zaken met leverancier X, voornamelijk omdat we goed en plezierig kunnen samenwerken.
1 2 3 4 5
17. We doen zaken met leverancier X, voornamelijk omdat het te veel tijd, energie en geld zou kosten om de relatie te beëindigen.
1 2 3 4 5

A Portfolio Approach to the Development of Differentiated Purchasing Strategies
353
Onderdeel C Gebruik van de inkoopportfolio analyse
Bedrijven hebben al gauw te maken met 100’en leveranciers die 1.000’en artikelen leveren. Als hulpmiddel wordt daarom wel gebruik gemaakt van de inkoopportfolio-analyse, ontwikkeld door Kraljic. De benadering van Kraljic komt erop neer dat alle producten in een 2x2 matrix worden geplaatst en dat voor iedere categorie een bijpassende aanbeveling wordt gegeven. C1 Hoe vaak wordt de inkoopportfolio analyse binnen uw organisatie toegepast? 0 nooit 0 minder dan 1x per jaar 0 ongeveer 1x per jaar 0 meer dan 1x per jaar Als u hier ‘nooit’ aankruist, dan hoeft u in dit onderdeel alleen vraag C2 te beantwoorden. Als u een ander antwoord heeft aangekruist, dan hoeft u vraag C2 juist niet te beantwoorden. C2 Indien ‘nooit’, waarom wordt de portfolio analyse niet toegepast? (meer antwoorden mogelijk) 0 omdat het te veel tijd kost 0 omdat de uitkomsten niet bruikbaar zijn 0 omdat er onvoldoende kennis aanwezig is binnen de organisatie 0 omdat het hoofd inkoop/de inkoopdirecteur de portfolio analyse niet wil gebruiken 0 omdat te weinig factoren worden meegenomen in de analyse 0 omdat complexe, strategische inkoopbeslissingen niet kunnen worden gebaseerd op de te eenvoudige portfolio analyse 0 omdat, ............. C3 Indien de inkoopportfolio analyse wel wordt toegepast, wat zijn de belangrijkste redenen? (meer antwoorden mogelijk) 0 de analyse levert een belangrijke bijdrage aan het inzicht in producten en leveranciers 0 de analyse levert een belangrijke bijdrage aan het realiseren van inkoopbesparingen 0 de analyse identificeert eventuele problemen en mogelijkheden op inkoopgebied

354
0 de analyse is een belangrijke bron van informatie voor het ontwikkelen van gedifferentieerde inkoop- en leveranciersstrategieën 0 anders, namelijk .............................. C4 Indien de inkoopportfolio analyse wel wordt toegepast, bent u dan tevreden over dit hulpmiddel? 0 zeer tevreden 0 tevreden 0 niet tevreden/niet ontevreden 0 ontevreden 0 zeer ontevreden C5 Indien de inkoopportfolio analyse wel wordt toegepast, op welke manier worden de posities van artikelen in de matrix bepaald? 0 met een gewogen factor score methode, waarbij de score op een variabele (dimensie) wordt bepaald door deelscores op factoren te vermenigvuldigen met gewichten en deze bij elkaar te tellen 0 op basis van overleg waarin consensus wordt gezocht naar de meest passende plaats in de matrix 0 met een matrix waarbij op de ene as ‘de inkoopwaarde’ staat en op de andere as ‘het aantal leveranciers’, zodat alle waarden objectief en eenduidig kunnen worden bepaald 0 op een andere manier, namelijk ................................................................. ................. .....................
We danken u hartelijk voor uw medewerking!
0 ja, ik wil een samenvatting van de onderzoeksresultaten 0 ja, ik wil het boek ‘Ondernemend Samenwerken: ontwikkelen van concurrentiekracht in netwerken’ Sturen naar: Naam:
Adres: Postcode/plaats:

A Portfolio Approach to the Development of Differentiated Purchasing Strategies
355
Appendix H
Measurement and operationalization of organizational dependence
source
perspective: dependence of a(n)
measurement of dependence
operationalization
El-Ansary and Stern (1972)
wholesaler and dealer
indirect wholesaler’s and dealer’s perceptions
3 items on a 5-point scale: - percentage of a channel member’s business - commitment to channel member - difficulty and cost in replacing a channel member
Etgar (1976) insurance agent
indirect agent’s perceptions
4 measures of agent’s dependence: - number of insurers that the agent represents - percentage of agent’s premiums with his leading insurer - difficulty in replacing the insurer - reliance on casualty income
Brown, Lusch and Muehling (1983)
retailer indirect retailer’s perceptions and estimates
5 items: - number of brands - percentage of store’s sales derived from the major brand - percentage of store’s profit derived from the major brand - percentage of customers lost, if the major supplier was changed - difficulty in replacing the major supplier (7-point Likert scale)
Frazier (1983)
automobile dealer
direct, proxy measure dealer’s perceptions
6 measures of role performance of the manufacturer on an 11-point scale
Heide and John (1988) manufactu-rers’ agency
indirect buyer’s perceptions
6 items on a 7-point scale measuring consequences of the loss of a manufacturer: - hurting sales of related products - switching to other lines - replacement with a similar line from another firm
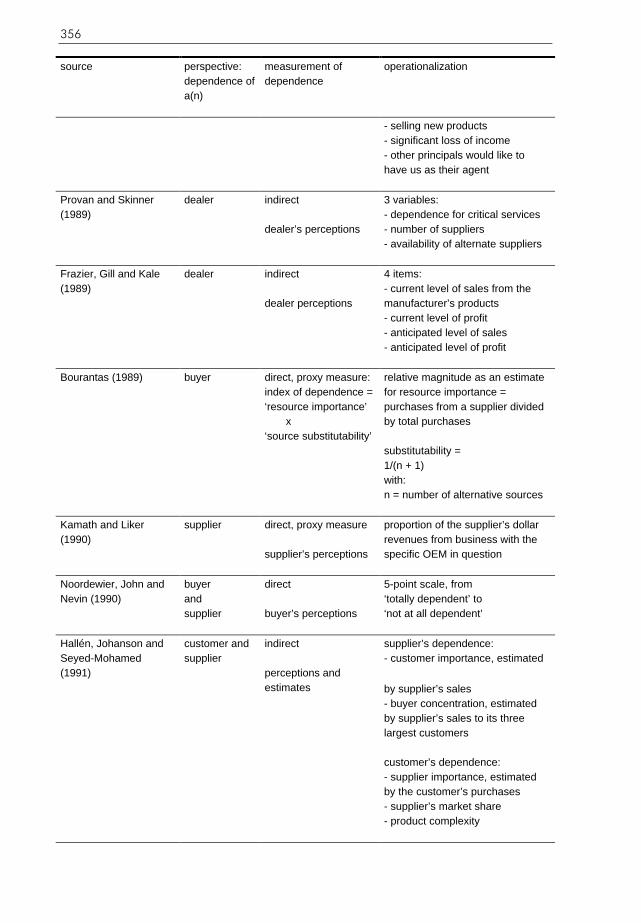
356
source
perspective: dependence of a(n)
measurement of dependence
operationalization
- selling new products - significant loss of income - other principals would like to have us as their agent
Provan and Skinner (1989)
dealer indirect dealer’s perceptions
3 variables: - dependence for critical services - number of suppliers - availability of alternate suppliers
Frazier, Gill and Kale (1989)
dealer indirect dealer perceptions
4 items: - current level of sales from the manufacturer’s products - current level of profit - anticipated level of sales - anticipated level of profit
Bourantas (1989) buyer direct, proxy measure: index of dependence = ‘resource importance’ x ‘source substitutability’
relative magnitude as an estimate for resource importance = purchases from a supplier divided by total purchases substitutability = 1/(n + 1) with: n = number of alternative sources
Kamath and Liker (1990)
supplier direct, proxy measure supplier’s perceptions
proportion of the supplier’s dollar revenues from business with the specific OEM in question
Noordewier, John and Nevin (1990)
buyer and supplier
direct buyer’s perceptions
5-point scale, from ‘totally dependent’ to ‘not at all dependent’
Hallén, Johanson and Seyed-Mohamed (1991)
customer and supplier
indirect perceptions and estimates
supplier’s dependence: - customer importance, estimated
by supplier’s sales - buyer concentration, estimated by supplier’s sales to its three largest customers customer’s dependence: - supplier importance, estimated by the customer’s purchases - supplier’s market share - product complexity
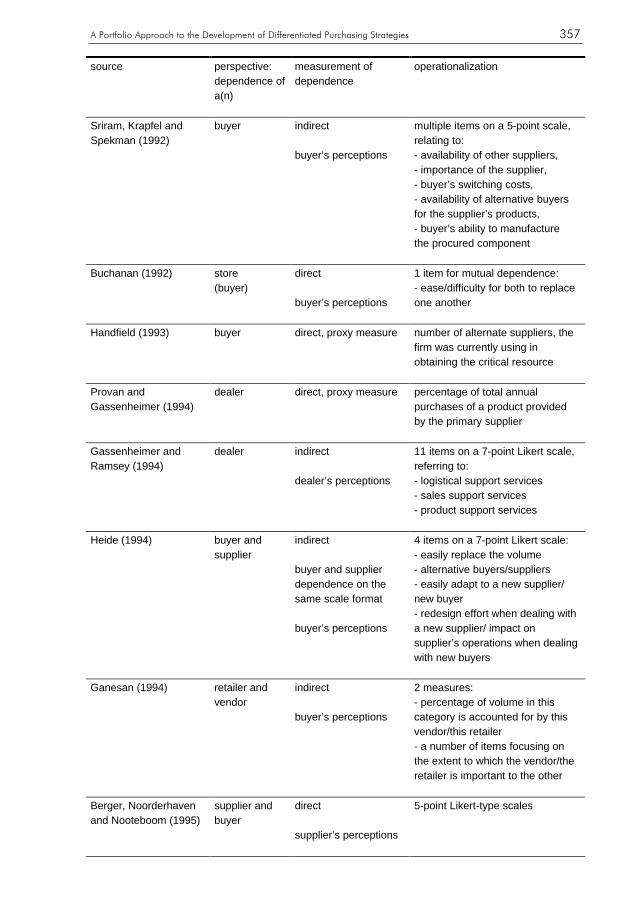
A Portfolio Approach to the Development of Differentiated Purchasing Strategies
357
source
perspective: dependence of a(n)
measurement of dependence
operationalization
Sriram, Krapfel and Spekman (1992)
buyer indirect buyer’s perceptions
multiple items on a 5-point scale, relating to: - availability of other suppliers, - importance of the supplier, - buyer’s switching costs, - availability of alternative buyers for the supplier’s products, - buyer’s ability to manufacture the procured component
Buchanan (1992)
store (buyer)
direct buyer’s perceptions
1 item for mutual dependence: - ease/difficulty for both to replace one another
Handfield (1993) buyer direct, proxy measure
number of alternate suppliers, the firm was currently using in obtaining the critical resource
Provan and Gassenheimer (1994)
dealer
direct, proxy measure
percentage of total annual purchases of a product provided by the primary supplier
Gassenheimer and Ramsey (1994)
dealer indirect dealer’s perceptions
11 items on a 7-point Likert scale, referring to: - logistical support services - sales support services - product support services
Heide (1994)
buyer and supplier
indirect buyer and supplier dependence on the same scale format buyer’s perceptions
4 items on a 7-point Likert scale: - easily replace the volume - alternative buyers/suppliers - easily adapt to a new supplier/ new buyer - redesign effort when dealing with a new supplier/ impact on supplier’s operations when dealing with new buyers
Ganesan (1994)
retailer and vendor
indirect buyer’s perceptions
2 measures: - percentage of volume in this category is accounted for by this vendor/this retailer - a number of items focusing on the extent to which the vendor/the retailer is important to the other
Berger, Noorderhaven and Nooteboom (1995)
supplier and buyer
direct supplier’s perceptions
5-point Likert-type scales

358
source
perspective: dependence of a(n)
measurement of dependence
operationalization
Lusch and Brown (1996)
wholesaler and major supplier
indirect wholesaler’s perceptions
items on a Likert scale wholesaler’s dependence: - we are dependent on our major supplier - our major supplier would be difficult to replace - our major supplier would be costly to replace supplier’s dependence: - our supplier is dependent on us - our major supplier would find it difficult to replace us - our major supplier would find it costly to lose us
Geyskens, Steenkamp, Scheer and Kumar (1996)
dealer and supplier
indirect dealer’s perceptions
items on a 7-point Likert scale dealer dependence: - expectations on profit and sales, accounted for by this supplier - other suppliers with comparable product lines supplier dependence: - relationship with us is very important to the supplier - other firms who could provide the supplier with comparable distribution
Young and Wilkinson (1997)
firm indirect seller’s and buyer’s perceptions
2 items on a 6-point Likert-scale: - ease of replacing the other firm - impact of being let down by the other firm
Joshi and Arnold (1997)
buyer indirect buyer’s perceptions
a high dependence and a low dependence scenario, based on: - number of alternative suppliers - switching costs
Dant and Gundlach (1998)
franchisee indirect franchisee’s perceptions
4 items on a 5-point Likert scale: - easily replace franchisor - loss in income, if the relationship with franchisor was terminated - difficult to generate income from other sources - easily adapt to selling a different product line

A Portfolio Approach to the Development of Differentiated Purchasing Strategies
359
source
perspective: dependence of a(n)
measurement of dependence
operationalization
Miles, Preece and Beatz (1999)
technology based firm
indirect manager’s perceptions
dependence on alliances; 5 items on a 5-point Likert scale: - take advantage of opportunities without an alliance partner - need a partner for customers - need a partner for investors - need a partner to achieve critical mass in production - need to develop strategic alliances to reach potential
Johnson (1999)
distributor indirect distributor’s perceptions
3 items on a 7-point Likert scale: - easily switch sales to other lines - easily replace supplier’s product line with a similar line from another company - significant loss in income, if the relationship was terminated
De Jong and Nooteboom (2000)
supplier indirect supplier’s perceptions
supplier’s dependence: 4 items on a 5-point Likert scale: - lost in investments - manufacturing complexity - average piece price - location specificity customer’s dependence: 2 items on a 6-point scale: - number of months to replace the supplier - supplier’s share in customer’s product
Kim (2001) distributor and supplier
indirect distributor’s perceptions and supplier’s perceptions
distributor’s dependence: 4 items on a 7-point Likert scale: - effort to find a good alternative - effort to compensate for the loss by switching to other lines - effort do develop a profitable relationship with another supplier - effort to diversify into selling new products, dropping the supplier supplier’s dependence: 4 items on a 7-point Likert scale: - effort to find a good alternative - effort to compensate for the loss

360
source
perspective: dependence of a(n)
measurement of dependence
operationalization
by switching to other distributors - effort do develop a profitable relationship with another distributor - effort to use our own salesforce to sell this product line
Buvik and Holskau (2001)
buyer indirect buyer’s perceptions
supplier’s dependence: 2 items on a 7-point Likert scale: - the difficulty for the supplier, replacing our company - economic problems for the supplier, should the sales to our company cease
Handfield and Bechtel (2002)
buyer indirect buyer’s perceptions
buyer’s dependence: 3 items on a 5-point scale: - supplier is only source of input - key-input material is not produced/available in the U.S. - many suppliers
A Portfolio Approach to the Development of Differentiated Purchasing Strategies
361
Summary
In the last 30 years the role of purchasing has changed dramatically in many companies, from a clerical, administrative function into a strategic function that contributes to the competitive advantage. This ‘revolution in purchasing’ has lead to tremendous changes in the scope, the impact and the responsibilities of purchasing management (e.g. Van Weele and Rozemeijer, 1996). In accordance with an increased focus on the management of supplier relationships, there is a growing acceptance and use of purchasing portfolio approaches, aimed at developing appropriate and differentiated purchasing and supplier strategies. However, hardly any empirical research has been conducted into this subject, which is why we initiated this study. Chapter 1 clarifies the background of the research project, starting with an overview of recent developments in purchasing management. Major developments all point at the importance of the management of supplier relationships. Companies need a variety of relationships, where no general ‘best’ type of relationship exists (e.g. Young and Wilkinson, 1997; Gadde and Snehota, 2000). For long, the ABC-analysis was the only tool for differentiating between important and less important purchases. However, the ABC-analysis is limited to a single dimension (the financial value of items), and it does not provide differentiated strategies. In a seminal paper Kraljic (1983) introduced the first comprehensive portfolio approach for the use in purchasing and supply management. His approach includes the construction of a 2x2 matrix that classifies products in four categories (bottleneck, non-critical, leverage and strategic items) on the basis of two dimensions: profit impact and supply risk (‘low’ and ‘high’). Each of the four categories requires a distinctive approach towards suppliers. Non-critical items require efficient processing, leverage items allow the buying company to exploit its full purchasing power, for instance through tendering. Bottleneck items cause significant problems and risks which should be handled by volume insurance, vendor control, security of inventories, and backup plans. Three general strategies (diversify, balance, or exploit) are recommended for items in the strategic quadrant, according to the relative power position of the company in the corresponding supply markets.

362
In the course of time purchasing portfolio models, and especially the Kraljic matrix, have gained ground in purchasing practice. However, in contrast to the increased adoption, there is a lack of (academic) research into the actual practice, the possibilities, and the theoretical foundations of purchasing portfolio models. This research project has addressed this gap, in its pursuit of gaining a better understanding of: - the theoretical and conceptual foundations of purchasing portfolio models, - the actual use of purchasing portfolio models in practice, and - how they could be used in order to pursue differentiated purchasing strategies. The research project includes three successive research methods: literature study, case studies, and a survey. The literature study covers three main areas: portfolio models in purchasing management, portfolio models in related disciplines, and a discussion on power and dependence in buyer-supplier relationships. We have started the literature study with a review of portfolio models in related business areas, namely investment theory, strategic management, and marketing management (chapter 2). The main reason for starting with other areas than purchasing management was that we wanted to learn from disciplines with a longer tradition and experience in the use of such models. Chapter 3 provides a review of the main portfolio approaches in purchasing and supply management. The models are discussed and evaluated on their (1) dimensions, (2) categories, (3) strategic recommendations, and (4) use issues (acceptance and adoption). The analysis of literature made clear that there are more similarities than differences between the various models in purchasing. Most models use similar dimensions to those

A Portfolio Approach to the Development of Differentiated Purchasing Strategies
363
of the Kraljic model, they use the same categories and they provide identical recommendations. Based upon our literature analysis we have concluded that the Kraljic matrix is the dominant approach in the profession. In addition, in chapter 3 we identified and discussed the main problems and critique of the Kraljic matrix, referring to the measurement of variables, the alleged disregard for the supplier’s side, the selection of strategies based on two dimensions, the limited and deterministic character of the strategic recommendations, and the absence of explicit movements within the matrix. The findings of the literature study have been used as input for the case studies, to investigate how experienced practitioners handle these issues in practice. In a recent interview Kraljic explained that he, as a consultant, was asked to develop a new tool for purchasing, similar to the portfolio approaches that were introduced in marketing and strategic management, e.g. BCG matrix. Kraljic acknowledged that the selection of dimensions was based on discussions with purchasing professionals, in search for ‘things that really matter in purchasing’. Basically, a matter of common sense (Gelderman and Van Haaster, 2002). The Kraljic approach does not explicitly deal with issues of power and dependence, nor does it provide any reference to a theoretical foundation or comprehensive perspective. However, there are indications that power and dependence are important in the Kraljic approach, considering some of the recommendations and the general idea of the portfolio approach: “to minimize supply vulnerability and make the most of potential buying power” (Kraljic, 1983, 112). Chapter 4 therefore elaborates on issues of power and dependence in buyer-supplier relationships with a special focus of relevance on the Kraljic approach. We have analyzed the dimensions and the categories of the Kraljic matrix, and its strategic recommendations. We have argued that the resource dependence theory (Pfeffer and Salancik, 1978) should be considered as the (implicitly applied) theoretical foundation for the Kraljic portfolio approach. In addition, we have concluded that a comprehensive view of the dyadic nature of buyer-supplier relationships should include the assessment of (1) the difference between buyer’s and supplier’s dependence (net dependence) which corresponds with the relative power between parties, and (2) the sum of buyer’s and supplier’s dependence (total interdependence) which indicates the mutual dependence and the intensity of the relationship between parties. These concepts have been applied to the Kraljic matrix, which

364
resulted in the following propositions (to be tested by the survey data): - strategic: balanced power, highest interdependence - non-critical: balanced power, lowest interdependence (independent) - leverage: buyer dominated, moderate interdependence - bottleneck: supplier dominated, moderate interdependence. Chapter 5 reports on the results of the case studies, which are used to identify and describe advanced practices with respect to purchasing portfolio models. The critique of portfolio models, such as the Kraljic approach, does not include the experience of practitioners. Our explorative case studies addressed this gap. The sample consisted of a selection of Dutch companies, restricted to manufacturing companies, where purchasing is by nature an important business area. Three case companies were selected on their advanced and ongoing use of purchasing portfolio analysis. The case studies revealed three distinctive methods: the consensus method (1), the one-by-one method (2), and the weighted factor score method (3). Each method satisfies the needs and expectations of the different users. The reason for this was found in the additional steps that have to be taken in the portfolio analysis. Before strategic actions are determined, it is imperative to complete a further process of interpreting and reflecting on the results. The positioning of items in the matrix should be considered as the starting point of portfolio analysis, definitely not the finishing point. In-depth discussions on the positions in the matrix are considered as the most important phase of the analysis. It is felt by the users that the Kraljic framework facilitates strategic discussions to a large extent. Some argue that the complexity of business decisions does not allow for simple recommendations. How could one deduce strategies from a portfolio analysis that is based on just two basic dimensions (e.g. Dubois and Pedersen, 2002: 40)? Actually, the answer is simple: one cannot. In addition to the various factors that constitute the two dimensions of any matrix, it was found that experienced portfolio users always included additional information on: - the overall business strategy (related situations on end markets), - the specific situations on supply markets, and - capacities, intentions and competences of individual suppliers. Comparative analysis of the case studies resulted in a conceptual model of strategic directions, providing an overview of the main strategic choices for the categories in the matrix. A dichotomy has been identified between strategies to hold a position (1) and strategies to move to another position (2) in the matrix. At the right side of the matrix (in the bottleneck and the strategic areas) movements are pursued in order to reduce a high
A Portfolio Approach to the Development of Differentiated Purchasing Strategies
365
level of supply risk. In terms of the matrix, this means moving to the left. Non-critical items are preferably moved upwards and exceptional leverage positions are exchanged for strategic positions. These are the most common movements within the matrix. From the buyer’s perspective a new classification of partnerships was found, related to the portfolio matrix: - partners of convenience, located in the leverage quadrant, which is dominated by the buyer; - strategic partnerships, located somewhere in the middle of the leverage and strategic quadrant, further characterized as balanced relationships based on a high level of mutual dependence; - locked-in ‘partnerships’, located at the right side of the strategic quadrant, which is dominated by suppliers, who are indispensable for the buyer. Chapter 6 explains the design of the survey method and it reports on the main findings. The survey method was aimed at measuring the variables and relationships in the conceptual models: - the variables to discriminate and explain the differences between users and non-users of a purchasing portfolio approach, - the conditions for the selection of portfolio based strategies, - the power and dependence structure in the Kraljic matrix, and - the determinants of buyer’s and supplier’s dependence in the Kraljic matrix. The last three items required the development of scenarios which describe a number of situations in terms of the Kraljic dimensions (profit impact and supply risk) and in terms of the selection of a corresponding purchasing strategy. These scenarios are based on the findings of the case studies. The design of the study can be characterized as a repeated measures design, because the same respondent participates in all conditions of the experiment. The levels of the conditions (scenarios) describe the within-subjects (W-S) variable. Respondents were asked to evaluate the scenarios on multiple dependent variables, which are associated with determinants of buyer’s and supplier’s dependence, the nature of specifications, trust and commitment. Each scenario can be characterized by a specific combination of these factors, constituting a unique relationship-dependence profile. The survey procedure included a pilot study aimed at enhancing the reliability and the validity of the questionnaire. The final questionnaire was administered (in three rounds) to 1,153 individuals, mostly purchasing managers of manufacturing companies who are member of the Dutch Association of Purchasing Management (NEVI). Answering more than 175 questions was likely to produce non-response problems. However, the special

366
measures turned out to be rather effective, resulting in a satisfactory response rate of 20.6% (n=238). The survey resulted in facts and figures about the actual utilization of the purchasing portfolio analysis. Taking differences in company size into account, we found a weighted average use frequency of almost 60% for manufacturing companies in The Netherlands. With respect to the explanation of the use, the most important findings are: - Portfolio analysis delivers what it is supposed to: it provides additional understanding of problems and possibilities of purchasing and it provides assistance in the process of developing differentiated purchasing strategies. - Users contrast in a positive way with non-users of the portfolio, especially on their purchasing’s professionalism (skills) and their contributions to the competitive position of the company. In addition it was found that the portfolio was relatively more used by larger companies with higher purchasing shares. With respect to the conditions-research question, statistical tests revealed the significant differences between the relationship-dependence profiles of the scenarios in our search for conditions under which the various purchasing strategies are selected. Estimated Marginal Means (EMMEANS) was used for the multiple pair-wise comparisons of profiles, within the SPSS-procedure GLM-repeated measures. In addition we have explained the buyer’s dependence and the supplier’s dependence from a limited number of explanatory variables (‘determinants of dependence’). We have established different conditional relationships in the categories of the Kraljic matrix for most of the explanatory variables. For instance, we found a positive relationship between the logistical indispensability of a product and the buyer’s dependence in cases of high supply risk (strategic and bottleneck items on the right side of the matrix), but no relationship in cases of low supply risk (leverage and non-critical items on the left side of the matrix). Finally, we have analyzed the issue of power-and-dependence in the portfolio matrix. We have calculated interdependencies and the power positions of the buyer in the Kraljic categories and we have compared them with prior, theoretical expectations. The observed levels of total interdependence were in accordance with prior expectations: ‘highest’ in the strategic quadrant, ‘moderate’ in the bottleneck and leverage quadrant, and ‘lowest’ in the non-critical quadrant. The observed buyer dominance in the non-critical quadrant seemed to be caused by slightly lower switching costs for the buyer and by slightly more alternative trading partners, both in comparison with the supplier. We found an expected supplier dominance in the bottleneck quadrant, and an expected buyer dominance in the leverage

A Portfolio Approach to the Development of Differentiated Purchasing Strategies
367
quadrant. Most remarkably however, was the observed overall supplier dominance in the strategic quadrant, which may shed a different light on the buyer’s view on issues of power and dependence: even satisfactory partnerships are considered to be dominated by the supplier. Chapter 7 summarizes the main conclusions and recommendations of this study, including a 5-step approach to the application of purchasing portfolio analysis, accompanied by a number of practical guidelines for assessing and improving positions in a portfolio matrix, conform to the principle of ‘conditional dynamics’: switching to another position in the matrix depends on the conditions that make it desirable and feasible. A close connection appears with the problems of how to manage power and dependence in supplier relations. The chapter is completed by a critical reflection on the research project and recommendations for further research. Future research could address the immediate and long-term impact of the application of the portfolio approach, overcoming the difficulties of attributing results to portfolio use. Another challenge would be the development of a portfolio approach from a network perspective, in addition to the well-known dyadic perspective. We have broken a lance for quantitative and qualitative research to the importance, impact and determinants of power relations in chains of interdependent companies (supply chain). Finally, we have recommended research to the relationship between e-procurement and the purchasing portfolio approach.
368
Samenvatting (summary in Dutch)
In de afgelopen 30 jaar is de rol van inkoop drastisch veranderd in veel bedrijven, van een administratieve naar een strategische bedrijfsfunctie die bijdraagt aan de concurrentiepositie van bedrijven. Deze ‘inkooprevolutie’ heeft geleid tot enorme veranderingen in het belang, de invloed en de verantwoordelijkheden van inkoopmanagement (Van Weele en Rozemeijer, 1996). In aansluiting op de toegenomen aandacht voor leveranciersrelaties, constateren we steeds meer acceptatie en gebruik van portfoliobenaderingen binnen het inkoopmanagement, gericht op het ontwikkelen van passende en gedifferentieerde inkoop- en leveranciersstrategieën. Echter, tegelijkertijd moeten we constateren dat er nauwelijks onderzoek is gedaan naar dit onderwerp, hetgeen ons ertoe heeft gebracht om dit onderzoek te beginnen. Hoofdstuk 1 verklaart de achtergronden van dit onderzoeksproject, beginnend met een overzicht van recente ontwikkelingen in inkoopmanagement. De belangrijkste ontwikkelingen benadrukken het belang van het managen van leveranciersrelaties. Bedrijven hebben behoefte aan verschillende soorten relaties, zonder dat er sprake is van ‘een beste’ type relatie (zie bijvoorbeeld Young en Wilkinson, 1997; Gadde en Snehota, 2000). Heel lang was de ABC-analyse het enige instrument om onderscheid te maken tussen belangrijke en onbelangrijke aankopen. Echter, de ABC-analyse beperkt zich tot de financiële waarde van producten én het verschaft geen gedifferentieerde inkoopstrategieën. In een baanbrekend artikel introduceerde Kraljic (1983) de eerste, omvattende portfoliobenadering voor inkoop- en leveranciersmanagement. Deze benadering omvat de constructie van een matrix waarin producten worden ingedeeld in vier categorieën (knelpunt-, routine-, hefboom- en strategische producten) op basis van twee dimensies: invloed op de winst en inkooprisico (‘laag’ en ‘hoog’). Elke categorie vraagt een eigen benadering van leveranciers. Routineproducten vereisen vooral efficiënte afhandeling en bestelroutines, met hefboomproducten kan de onderneming zijn inkoopmacht gebruiken, bijvoorbeeld brede concurrentiestelling. Knelpuntproducten veroorzaken ernstige risico’s en problemen, waarvoor het inkoopbeleid gericht moet zijn op het zekerstellen van levering, extra controle van de leverancier, bewaking van voorraden en dergelijke. Voor de strategische producten worden drie generieke benaderingen aanbevolen (nastreven van diversificatie, een evenwichtige relatie of exploitatie), al naar gelang de relatieve machtspositie van de onderneming in de bijbehorende leveranciersmarkten.
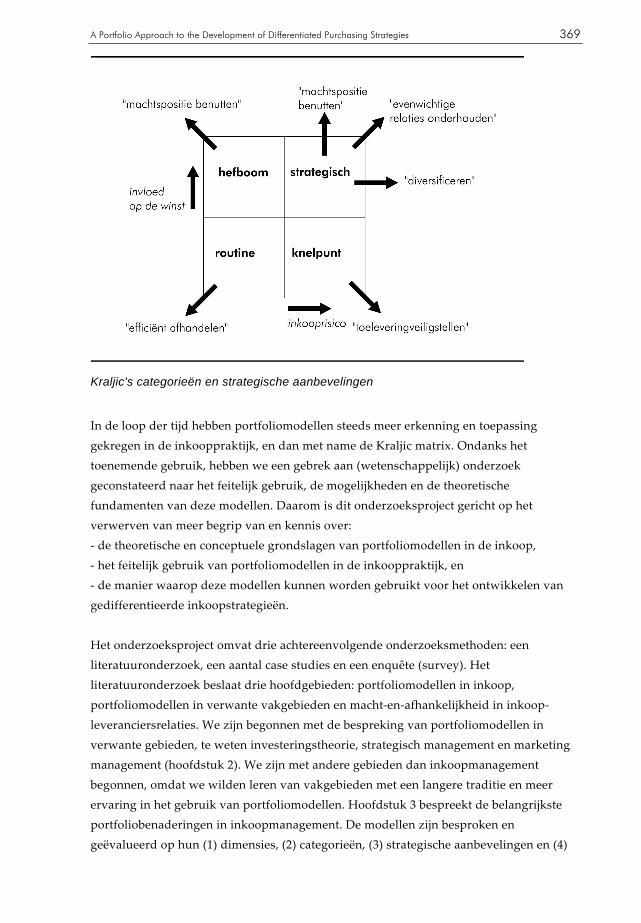
A Portfolio Approach to the Development of Differentiated Purchasing Strategies
369
Kraljic's categorieën en strategische aanbevelingen
In de loop der tijd hebben portfoliomodellen steeds meer erkenning en toepassing gekregen in de inkooppraktijk, en dan met name de Kraljic matrix. Ondanks het toenemende gebruik, hebben we een gebrek aan (wetenschappelijk) onderzoek geconstateerd naar het feitelijk gebruik, de mogelijkheden en de theoretische fundamenten van deze modellen. Daarom is dit onderzoeksproject gericht op het verwerven van meer begrip van en kennis over: - de theoretische en conceptuele grondslagen van portfoliomodellen in de inkoop, - het feitelijk gebruik van portfoliomodellen in de inkooppraktijk, en - de manier waarop deze modellen kunnen worden gebruikt voor het ontwikkelen van gedifferentieerde inkoopstrategieën. Het onderzoeksproject omvat drie achtereenvolgende onderzoeksmethoden: een literatuuronderzoek, een aantal case studies en een enquête (survey). Het literatuuronderzoek beslaat drie hoofdgebieden: portfoliomodellen in inkoop, portfoliomodellen in verwante vakgebieden en macht-en-afhankelijkheid in inkoop-leveranciersrelaties. We zijn begonnen met de bespreking van portfoliomodellen in verwante gebieden, te weten investeringstheorie, strategisch management en marketing management (hoofdstuk 2). We zijn met andere gebieden dan inkoopmanagement begonnen, omdat we wilden leren van vakgebieden met een langere traditie en meer ervaring in het gebruik van portfoliomodellen. Hoofdstuk 3 bespreekt de belangrijkste portfoliobenaderingen in inkoopmanagement. De modellen zijn besproken en geëvalueerd op hun (1) dimensies, (2) categorieën, (3) strategische aanbevelingen en (4)

370
hun acceptatie en adoptie (gebruik). De literatuuranalyse maakt duidelijk dat er meer overeenkomsten zijn dan verschillen tussen de modellen. Ze gebruiken vrijwel dezelfde dimensies als de Kraljic matrix, ze hebben dezelfde categorieën en geven vergelijkbare aanbevelingen. Op basis van het literatuuronderzoek concluderen we dat de Kraljic matrix de dominante benadering is binnen inkoop. Ook hebben we in hoofdstuk 3 de belangrijkste problemen van en kritiek op de Kraljic matrix geïnventariseerd en besproken: het meten van variabelen, de vermeende gebrekkige aandacht voor de leverancierszijde, de selectie van strategieën gebaseerd op twee dimensies, het beperkte en deterministische karakter van de strategische aanbevelingen en de afwezigheid van expliciete bewegingen binnen de matrix. De bevindingen van de literatuurstudie zijn gebruikt voor de opzet van de case studies, waarin is onderzocht hoe ervaren inkoopprofessionals met deze problemen omgaan in de praktijk. In een recent interview verklaarde Kraljic dat hij, als adviseur, was gevraagd om een nieuw instrument te ontwikkelen voor inkoopmanagement, vergelijkbaar met de destijds net ontwikkelde marketing matrices, zoals de BCG matrix. Kraljic bevestigde dat de selectie van dimensies was gebaseerd op discussies met inkoopprofessionals, op zoek naar ‘zaken die echt belangrijk zijn voor inkoop’. Kortom, een kwestie van gezond verstand (Gelderman en Van Haaster, 2002). De Kraljic benadering is niet expliciet over zaken als macht en afhankelijkheid, evenmin wordt verwezen naar theoretische grondslagen of een overkoepelend perspectief. Desondanks zijn er aanwijzingen dat ‘macht’ en ‘afhankelijkheid’ belangrijke begrippen zijn in de Kraljic benadering. Dit blijkt onder meer uit enkele aanbevelingen en het algemene idee van de portfoliobenadering waarin verwezen wordt naar “het minimaliseren van kwetsbaarheid in de bevoorrading en zo goed mogelijk gebruik maken van potentiële inkoopmacht” (Kraljic, 1983, 112). Derhalve zijn we in hoofdstuk 4 nader ingegaan op kwesties van macht en afhankelijkheid in de relaties tussen inkopers en leveranciers in het algemeen en de betekenis voor de Kraljic benadering in het bijzonder. We hebben de dimensies en de categorieën van de Kraljic matrix nader bestudeerd, alsmede de strategische aanbevelingen. We hebben beredeneerd dat de resource dependence theory (Pfeffer en Salancik, 1978) beschouwd moet worden als de (impliciet gekozen) theoretische grondslagen van de Kraljic portfoliobenadering. Vervolgens hebben we geconcludeerd dat een omvattend perspectief op het tweezijdige karakter van inkoop-leveranciersrelaties inhoudt, dat we moeten vaststellen (1) het verschil tussen de afhankelijkheid van de inkoper en de afhankelijkheid van de leverancier hetgeen overeenkomt met de relatieve machtsverhouding tussen partijen en (2) de som van de afhankelijkheid van de inkoper en de afhankelijkheid van de leverancier (interdependentie) hetgeen aangeeft de mate van wederzijdse afhankelijkheid en de intensiteit van de relatie tussen partijen. Deze concepten hebben we toegepast op

A Portfolio Approach to the Development of Differentiated Purchasing Strategies
371
de Kraljic matrix, hetgeen geleid heeft tot de volgende veronderstellingen ten aanzien van de categorieën in de matrix: - strategisch: evenwichtige machtsverhouding met een hoge wederzijdse afhankelijkheid - routine: evenwichtige machtsverhouding met een lage wederzijdse
afhankelijkheid - hefbooom: inkoopzijde is dominant met een gematigde wederzijdse afhankelijkheid - knelpunt: leverancierszijde is dominant met een gematigde wederzijdse
afhankelijkheid. Deze veronderstellingen zijn getoetst met behulp van de survey data. Hoofdstuk 5 doet verslag van de resultaten van de exploratieve case studies, waarin geavanceerde toepassingen van de inkoopportfoliomodellen zijn beschreven. De kritiek op portfoliomodellen, zoals met name op de Kraljic benadering, houdt geen rekening met de ervaringen uit de praktijk. De case studies zijn met name gericht om dit hiaat te vullen. De steekproef bestond uit een selectie van Nederlandse bedrijven uit de industrie, waar inkoop van nature een belangrijke bedrijfsfunctie is. Drie bedrijven zijn geselecteerd op hun geavanceerde en continue toepassing van de inkoopportfolio analyse. In de cases studies werden drie verschillende meetmethoden gevonden: de consensus methode (1), de één-op-één methode (2) en de methode van gewogen factorscores (3). Iedere methode komt tegemoet aan de wensen en verwachtingen van de diverse gebruikers. Dit valt te verklaren uit de additionele stappen die moeten worden ondernomen in iedere portfolio analyse. Voordat strategische acties kunnen worden bepaald, is het noodzakelijk om de matrix te onderwerpen aan een nader proces van interpretatie en reflectie. De posities in de matrix moeten worden beschouwd als vertrekpunt van de analyse, zeker niet als het eindpunt. Grondige discussies over de gevonden matrixposities worden beschouwd als het meest belangrijke onderdeel van de portfolio analyse. De gebruikers zijn van mening dat het Kraljic raamwerk deze belangrijke discussies in hoge mate faciliteert. Sommigen beweren dat eenvoudige aanbevelingen niet mogelijk zijn voor complexe beslissingen in het bedrijfsleven. Hoe kunnen strategieën worden afgeleid uit een portfolio analyse die gebaseerd is op slechts twee dimensies (zie bijvoorbeeld Dubois en Pedersen, 2002: 40)? Het antwoord is simpel: dat is niet mogelijk. In aanvulling op de diverse factoren die worden gebruikt voor de twee dimensies, blijken ervaren portfolio gebruikers altijd additionele informatie nodig te hebben over: - de algemene bedrijfsstrategie (met name situaties op eindmarkten), - de specifieke situaties op leveranciersmarkten en - capaciteiten, intenties en competenties van individuele leveranciers.

372
Een vergelijkende analyse van de case studies heeft geresulteerd in een conceptueel model dat een overzicht geeft van de belangrijkste strategische keuzes in alle categorieën van de matrix. Een tweedeling is vastgesteld tussen strategieën waarmee een positie wordt behouden (1) en strategieën waarmee een andere positie wordt nagestreefd (2). Aan de rechterkant van de matrix (in de knelpunt- en strategische kwadranten) kan men proberen het hoge inkooprisico te beperken, bijvoorbeeld door naar alternatieve leveranciers te zoeken. Bezien vanuit de matrix betekent dit een beweging naar links. Routineproducten kunnen wellicht worden gebundeld en naar boven verplaatst (richting hefboom), terwijl hefboomposities slechts bij uitzondering worden ingeruild voor strategische posities door de relatie te verdiepen tot strategische samenwerking (naar rechts in de matrix). Vanuit inkoopperspectief werd een nieuwe indeling van partnerships gevonden, gerelateerd aan de portfolio matrix: - partners of convenience (gemaksleveranciers), te vinden in het hefboomkwadrant waar relaties worden gedomineerd door de inkoopzijde; - strategische partnerships, te vinden rond het midden tussen het hefboom- en het strategische kwadrant, waar relaties worden gekenmerkt door een evenwichtige machtsverhouding en hoge wederzijdse afhankelijkheid; - locked in ‘partnerships’ (gedwongen ‘partnerships’), te vinden in de rechterhelft van het strategische kwadrant, waar relaties worden gedomineerd door onmisbare leveranciers. Hoofdstuk 6 beschrijft het ontwerp van de survey en belangrijkste bevindingen. De survey is gericht op het meten van variabelen en relaties in de conceptuele modellen: - de variabelen die de verschillen aangeven tussen gebruikers en niet-gebruikers van de inkoopportfolio-benadering, - de condities voor het selecteren van inkoopstrategieën in de matrix; - de machts- en afhankelijkheidsstructuur in de Kraljic matrix, en - de determinanten van inkopersafhankelijkheid en leveranciersafhankelijkheid in de Kraljic matrix. De laatste drie onderdelen vereisten de ontwikkeling van scenario’s, waarin een aantal situaties worden beschreven in termen van de Kraljic dimensies (invloed op de winst en inkooprisico) en in termen van een gekozen inkoopstrategie. De scenario’s zijn gebaseerd op de resultaten van de case studies. Het ontwerp van de studie is een repeated measures design, omdat alle respondenten alle condities van het experiment ondergaan. De niveaus van de condities (scenario’s) beschrijven de within-subjects (W-S) variabele. Aan respondenten is gevraagd om de scenario’s te beoordelen aan de hand van een aantal (afhankelijke) variabelen, gerelateerd aan de determinanten van de mate waarin inkopers afhankelijk zijn van leveranciers, idem voor de mate waarin leveranciers afhankelijk zijn

A Portfolio Approach to the Development of Differentiated Purchasing Strategies
373
van de inkopende partij, de aard van de specificaties, vertrouwen en commitment. Ieder scenario kan worden gekenmerkt door een specifieke combinatie van deze factoren, dat een uniek relatie-afhankelijkheidsprofiel oplevert. Een vooronderzoek is gehouden met het oog op de betrouwbaarheid en de validiteit van de vragenlijst. De uiteindelijke vragenlijst is (in drie ronden) aan 1.153 individuen gestuurd, veelal inkoopmanagers van industriële bedrijven die lid zijn van de Nederlandse Vereniging voor Inkoopmanagement (NEVI). Het beantwoorden van meer dan 175 vragen leidt al gauw tot non-response problemen. Echter, de genomen maatregelen bleken effectief te zijn, gezien de bevredigende response van 20,6% (n=238). De enquête heeft onder meer geresulteerd in feiten met betrekking tot het gebruik van de portfolio analyse. Als we rekening houden met verschillen in bedrijfsomvang, dan komen we tot een gewogen gemiddeld gebruik van bijna 60% voor Nederlandse industriële bedrijven. Het literatuuronderzoek heeft onder meer geleid tot de identificatie van variabelen waarmee de verschillen tussen gebruiken en niet-gebruikers kunnen worden beschreven en verklaard: de bedrijfsomvang, het inkoopaandeel, de positie van inkoop in het bedrijf, de inkoopprofessionaliteit en de oriëntatie van inkoop. De belangrijkste resultaten met betrekking tot het verklaren van portfoliogebruik zijn: - Portfolio analyse ‘doet wat het belooft’: het voorziet in meer begrip voor de problemen en mogelijkheden van inkoop en het biedt ondersteuning voor het ontwikkelen van gedifferentieerde inkoopstrategieën. - Gebruikers onderscheiden zich op positieve wijze van niet-gebruikers, vooral gezien hun inkoopprofessionaliteit (vaardigheden) en hun bijdragen aan de concurrentiepositie van het bedrijf. Verder blijkt dat de portfolio relatief vaker wordt gebruikt door grotere bedrijven en door bedrijven met relatief grotere inkoopaandelen. Teneinde vast te stellen onder welke condities welke strategieën worden gekozen, hebben we Estimated Marginal Means (EMMEANS) toegepast voor de paarsgewijze vergelijking van de profielen, binnen de SPSS-procedure GLM-repeated measures. Tevens hebben we de mate waarin inkopers afhankelijk zijn van leveranciers verklaard uit een beperkt aantal verklarende variabelen. Hetzelfde hebben we gedaan voor de mate waarin leveranciers afhankelijk zijn van de inkopende partij (‘determinanten van afhankelijkheid’). Het onderzoek heeft geleid tot een aantal voorwaardelijk relaties in de Kraljic categorieën, bijvoorbeeld tussen de logistieke onmisbaarheid van een product en de mate waarin de inkoper afhankelijk is van de leverancier: een positieve relatie in geval van hogere inkooprisico’s (aan de rechterzijde van de matrix) en geen relatie in geval van lagere inkooprisico’s (aan de linkerzijde van de matrix).

374
Tot slot hebben een nadere analyse gemaakt van het vraagstuk van macht en afhankelijkheid in de Kraljic matrix. Daarbij zijn berekeningen gemaakt voor de mate van wederzijdse afhankelijkheid en de machtsverhoudingen in de Kraljic categorieën. De uitkomsten hebben we vergeleken met eerdere, theoretische verwachtingen. De niveaus van de wederzijdse afhankelijkheid waren in overeenstemming met de verwachtingen: het hoogst in het strategische kwadrant, matig in het knelpunt- en het hefboomkwadrant en het laagst in het routinekwadrant. De dominantie van de inkoper in het routinekwadrant lijkt veroorzaakt te worden door lagere switching costs voor de inkoper en bij meer alternatieve handelspartners, beide in vergelijking met de positie van de leverancier. We vonden bevestiging voor de verwachte dominantie van de leverancier in het knelpuntkwadrant. Meest opvallend echter was de waargenomen, algemene dominantie van de leverancier in het strategisch kwadrant, vanuit inkoopperspectief. Deze resultaten kunnen aanleiding geven om een ander licht te werpen op macht en afhankelijkheid bezien vanuit inkoopperspectief: zelfs bevredigende partnerships worden blijkbaar gedomineerd door de leverancier. Hoofdstuk 7 geeft de belangrijkste conclusies en de aanbevelingen, inclusief een 5-stappenplan voor de toepassing van de inkoopportfolio en een aantal praktische aanbevelingen voor het beoordelen en verbeteren van matrixposities, volgens de principes van ‘conditionele dynamiek’: een beweging naar een andere positie in de matrix is afhankelijk van de condities en omstandigheden die dit mogelijk maken. Daarbij geldt een nauwe relatie met het managen van macht en afhankelijkheid in leveranciersrelaties. Het hoofdstuk wordt afgesloten met een kritische reflectie op het onderzoeksproject en aanbevelingen voor nader onderzoek. Toekomstig onderzoek zou zich kunnen richten op het onmiddellijke, maar ook op de lange termijn effecten van portfoliogebruik, waarbij de onderzoeker zich moet bezighouden met vraagstuk van het toerekenen van resultaten. Een andere uitdaging zou zijn het ontwikkelen van een portfoliobenadering vanuit een netwerkperspectief, in aanvulling op het bekende dyadische perspectief. Verder zouden we kwalitatief en kwantitatief onderzoek verwelkomen naar het belang, de invloed en de determinanten van machtsverhoudingen binnen ketens van bedrijven (supply chains). Tot slot hebben we aangegeven dat er onderzoek zou moeten worden gedaan naar de relatie tussen e-procurement en de inkoopportfolio.
A Portfolio Approach to the Development of Differentiated Purchasing Strategies
375
About the author
Cees J. Gelderman (1956) studied Business Economics at the State University of Groningen. During his study he was a teacher at a secondary school (‘Ommelandercollege’ in Appingedam). He graduated in 1984 (cum laude) in the field of Marketing and Marketing Research. After graduating he worked as an assistant professor of marketing at the State University of Groningen until 1986. In the same year he joined the Open University of the Netherlands as an assistant professor of marketing and purchasing management. He developed several courses, all based on the principles of distance education in various fields such as Purchasing management, Marketing management, Marketing Research, Marketing Planning and Business Marketing. In the nineties he published the book “Business marketing” which he co-authored with professor Hein van der Hart (Eindhoven University of Technology). In collaboration with Bé Albronda he also wrote and edited the book “Professioneel inkopen” (professional purchasing). In 1998, he started the Ph.D. research project on the possibilities of a portfolio approach to the development of differentiated purchasing and supplier strategies. Cees Gelderman has written many papers for journals, magazines, handbooks and international conferences. He continues to work at the open University of the Netherlands, where he will combine research activities with the development of courses in the areas of marketing and purchasing management.