Embed Size (px)
Citation preview
A pilot indicator set from the Doing Business project
A PILO
T IND
ICATO
R SET COM
PARIN
G A
CCESS TO
ELECTRIC
ITY FOR 140 ECO
NO
MIES

Getting Electricity
A pilot indicator set from the Doing Business project
A P
ILO
T IN
DIC
AT
OR
SE
T C
OM
PA
RIN
G A
CC
ES
S T
O E
LE
CT
RIC
ITY
FO
R 1
40
EC
ON
OM
IES

© 2010 The International Bank for Reconstruction and Development / The World Bank
1818 H Street NW
Washington, D.C. 20433
Telephone 202-473-1000
Internet www.worldbank.org
E-mail [email protected]
All rights reserved.
This volume is a product of the staff of the World Bank Group and serves as a consultation paper for the development of a new indicator set. The findings, interpretations, and conclusions expressed in this volume do not necessarily reflect the views of the Executive Directors of The World Bank or the governments they represent. The World Bank Group does not guarantee the accuracy of the data included in this work. Publication was made possible by the Norwegian Ministry of Foreign Affairs. The opinions expressed herein are those of author(s) and do not necessarily reflect the views of the Norwegian Government.
Rights and PermissionsThe material in this publication is copyrighted. Copying and/or transmitting portions or all of this work without permission may be a violation of applicable law. The World Bank Group encourages dissemination of its work and will normally grant permission to reproduce portions of the work promptly.
For permission to photocopy or reprint any part of this work, please send a request with complete information to the Copyright Clearance Center Inc., 222 Rosewood Drive, Danvers, MA 01923, USA; telephone: 978-750-8400; fax: 978-750-4470; Internet: www.copyright.com.
All other queries on rights and licenses, including subsidiary rights, should be addressed to the Office of the Publisher, The World Bank, 1818 H Street NW, Washington, DC 20433, USA; fax: 202-522-2422; e-mail: [email protected].

Table of Contents
Introduction 1
How electricity services matter for businesses 2
Building a new indicator set 4
Who makes it easy to get an electricity connection and how? 7
Dealing with the public service environment 9Dealing with safety concerns and electrical efficiency 10Ensuring availability of material and equipment 12Setting legal time limits 14Delegating connection works 18
What does it cost to get connected? 20
What to expect next? 25
References 26
Data notes 27
Getting Electricity indicators 31
Acknowledgments 33


1
Introduction
A young entrepreneur in Lagos is under pressure. The first in her family to fin-ish college, she has big hopes of taking her family’s shirt-making business to the next level by exporting to Europe and the United States. That means setting up a larger garment manufacturing unit. The entrepreneur has negotiated financ-ing with the bank, spent weeks dealing with the authorities to get building and operating permits and invested in a new building and new machinery. She has new employees lined up, and she is ready to get started.
But the young Nigerian entrepreneur will have to wait. Even though she took great care to build where access to the electricity grid would not be a problem, electricity is still an obstacle. She has just learned from her electrical contractor that obtaining an electricity connection from the local utility will probably take a few more months. Indeed, on average in Nigeria, obtaining an electricity con-nection takes more than 8.5 months and costs the equivalent of more than 10 times income per capita.
Compare the experience of a similar entrepreneur in Germany. He is construct-ing a warehouse in Berlin-Westhafen and is surprised to find out how easy it is to obtain an electricity connection. All he needs to do is sign a supply contract with a retailer for electricity. His electrical contractor takes care of the electric-ity application process, and the utility then completes the external connection works. The warehouse is hooked up to electricity in less than 3 weeks, for a total connection cost of $2,151 (equivalent to 5.1% of income per capita). Germany’s process for obtaining a new commercial electricity connection is among the fastest and most efficient: it takes 3 interactions with the utility and 17 days from signing the supply contract to having the electricity turned on.
Doing Business has 6 years of experience in analyzing the real implications of the interactions of private businesses with government agencies. Over the years the project has expanded the set of indicators measuring such transactions.1
Using the Doing Business methodology, Getting Electricity has developed a pilot set of indicators on the process a private business must go through to obtain an electricity connection. By applying the standard Doing Business methodol-ogy to the question of electricity provision, Getting Electricity aims to illustrate the implications for entrepreneurs of weak commercial services by distribution companies and to complement existing data sets. Consistent and objective data on connection services can inform utilities, regulators and governments seeking to strengthen sector performance, and serve as an input for research on links to economic outcomes.
1. Doing Business provides indicators of government regulation of business across 183 economies. The project currently covers 10 areas of regulation—from starting to closing a business. The set of indicators has been expanded over time, and the team continues to develop new indicators of regulations that help or hinder businesses in investing, in creating jobs and in achieving growth. Doing Business, in capturing some key dimensions of regulatory regimes, has been found useful for benchmarking, which can expose potential challenges and identify where policy makers might look for lessons and good practices.

2 GETTING ELECTRICITY
Electricity matters for private businesses, along with other infrastructure services such as roads, water and telecommunications. Where the quality and accessibil-ity of infrastructure services are good, they encourage investment, productivity and growth. But where they are poor, companies’ productivity and growth suf-fer. World Bank Enterprise Surveys in 89 economies show that firms consider electricity one of the biggest constraints to their business.1The constraints stem from inadequacies in several aspects of electricity service—access to electricity, availability of electricity and reliability of supply—as well as from cost.
Many businesses lack access to electricity connections and so are prevented from moving into higher-value-added activities that rely on electricity-based technologies.2 In 2005, according to the International Energy Agency, more than a quarter of the world’s population lacked access to electricity.3 Sub-Sa-haran Africa and South Asia have the lowest electrification rates. With nearly 1 billion people, Africa accounts for more than a sixth of the world’s population but generates only 4% of the world’s electricity. Seen from space, Africa appears unlit at night.4
Whether businesses can gain access to an electricity connection depends largely on the availability of electricity supply. In the Kyrgyz Republic and Tajikistan, the research team found, connection requests were denied in the winter of 2008 because low water levels in the reservoirs supplying the hydropower generation plants led to energy shortages. Similarly, in Afghanistan, Guinea-Bissau and Si-erra Leone electricity shortages are so chronic that when new customers with moderately high electricity needs (such as the commercial customer assumed by the case study underlying this report) request a connection, utilities instead advise them to buy their own generator.5
Once electricity is available, the reliability of supply over time becomes critical. Businesses need reliable supply to operate efficiently. But according to World Bank Enterprise Survey data, firms in low-income economies see their electricity supply interrupted an average of 18 times in a typical month (figure 1). Frequent drops in voltage levels damage electronic equipment such as computers, shorten-ing their lifespan. And service interruptions force staff to adjust their workflow. Managers responding to World Bank Enterprise Surveys estimated losses due to electricity outages at an average 3.2% of annual sales. In Malawi losses run as high as 22.6%. To counter such reliability problems, firms can install backup gen-erators. It has been estimated that generators owned by firms account for about 6% of total installed generation capacity in Sub-Saharan Africa.6
How electricity services matter for businesses
Lowincome
Lowermiddleincome
Uppermiddleincome
Note: Data include 66 economies in East Asia and the Pacific, Eastern Europe and Central Asia, Latin America and the Caribbean, the Middle East and North Africa, South Asia and Sub-Saharan Africa. No comparable data available for high-income economies.
Source: World Bank Enterprise Surveys.
FIGURE 1
Interruptions in electricity
service plague companies
in low-income economies
Average number of power outagesfor a firm in a typical month
18
8
3
3
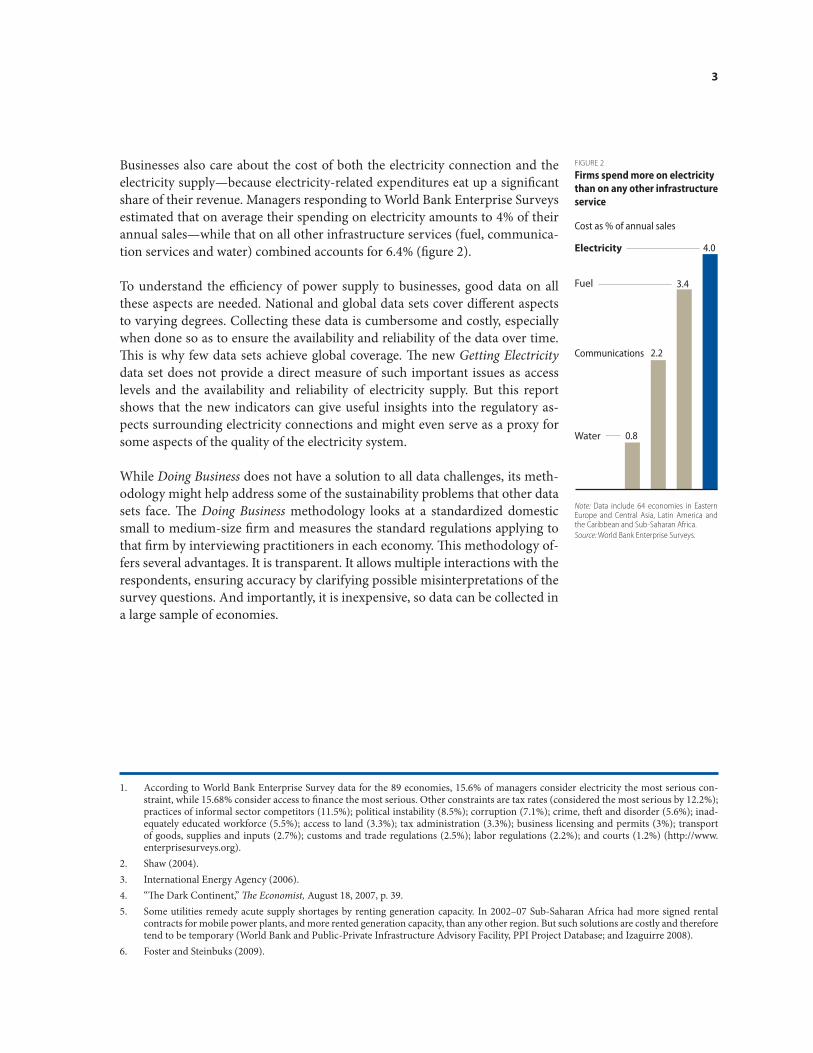
Businesses also care about the cost of both the electricity connection and the electricity supply—because electricity-related expenditures eat up a significant share of their revenue. Managers responding to World Bank Enterprise Surveys estimated that on average their spending on electricity amounts to 4% of their annual sales—while that on all other infrastructure services (fuel, communica-tion services and water) combined accounts for 6.4% (figure 2).
To understand the efficiency of power supply to businesses, good data on all these aspects are needed. National and global data sets cover different aspects to varying degrees. Collecting these data is cumbersome and costly, especially when done so as to ensure the availability and reliability of the data over time. This is why few data sets achieve global coverage. The new Getting Electricity data set does not provide a direct measure of such important issues as access levels and the availability and reliability of electricity supply. But this report shows that the new indicators can give useful insights into the regulatory as-pects surrounding electricity connections and might even serve as a proxy for some aspects of the quality of the electricity system.
While Doing Business does not have a solution to all data challenges, its meth-odology might help address some of the sustainability problems that other data sets face. The Doing Business methodology looks at a standardized domestic small to medium-size firm and measures the standard regulations applying to that firm by interviewing practitioners in each economy. This methodology of-fers several advantages. It is transparent. It allows multiple interactions with the respondents, ensuring accuracy by clarifying possible misinterpretations of the survey questions. And importantly, it is inexpensive, so data can be collected in a large sample of economies.
FIGURE 2
Firms spend more on electricity
than on any other infrastructure
service
Electricity
Fuel
Communications
0.8
2.2
3.4
4.0
Cost as % of annual sales
Note: Data include 64 economies in Eastern Europe and Central Asia, Latin America and the Caribbean and Sub-Saharan Africa.
Source: World Bank Enterprise Surveys.
Water
1. According to World Bank Enterprise Survey data for the 89 economies, 15.6% of managers consider electricity the most serious con-straint, while 15.68% consider access to finance the most serious. Other constraints are tax rates (considered the most serious by 12.2%); practices of informal sector competitors (11.5%); political instability (8.5%); corruption (7.1%); crime, theft and disorder (5.6%); inad-equately educated workforce (5.5%); access to land (3.3%); tax administration (3.3%); business licensing and permits (3%); transport of goods, supplies and inputs (2.7%); customs and trade regulations (2.5%); labor regulations (2.2%); and courts (1.2%) (http://www.enterprisesurveys.org).
2. Shaw (2004).3. International Energy Agency (2006). 4. “The Dark Continent,” The Economist, August 18, 2007, p. 39. 5. Some utilities remedy acute supply shortages by renting generation capacity. In 2002–07 Sub-Saharan Africa had more signed rental
contracts for mobile power plants, and more rented generation capacity, than any other region. But such solutions are costly and therefore tend to be temporary (World Bank and Public-Private Infrastructure Advisory Facility, PPI Project Database; and Izaguirre 2008).
6. Foster and Steinbuks (2009).

4 GETTING ELECTRICITY
Getting Electricity tracks all the procedures, the time and the cost required for a business to obtain an electricity connection for a newly constructed building, including an extension or expansion of the existing infrastructure.1 To ensure that the data are comparable across the 140 economies covered, respondents were presented with a standard case study:
The case study was carefully chosen to reflect the electricity needs of a relatively electricity-intensive small to medium-size enterprise. The estimated load of 140 kVA is consistent with the electricity needs of a small warehouse that relies on refrigeration and therefore depends on a relatively modest yet nontrivial elec-tricity supply.2
For each economy, using information collected between June 2008 and June 2009, Getting Electricity summarizes the process of obtaining an electricity con-nection in an area where warehouses usually locate in the main business city. Based on the case study, distribution utilities providing electricity connections in the main business city were asked to describe the procedures for obtaining an electricity connection, along with the time and cost of completing them. Be-cause utilities might have an incentive to represent their own performance too positively, the information gathered was submitted to a rigorous cross-check with independent private practitioners. From the utilities’ responses a list of procedures was drawn up and verified through e-mail and telephone interviews with independent professionals such as electrical technicians, electricians and electrical engineers as well as construction companies.3 Detailed lists of proce-dures for each economy are published on the Doing Business website.4
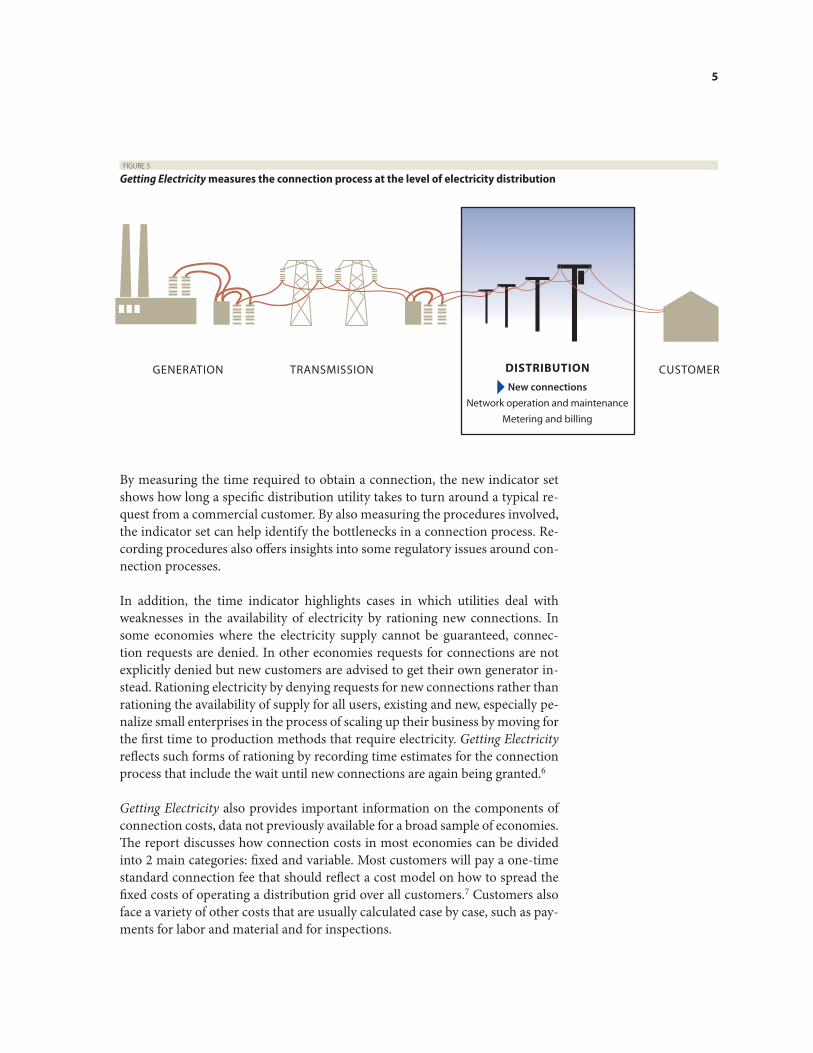
The Getting Electricity indicator set sheds light on the interactions of businesses with distribution utilities. In doing so it covers only a small part of electricity service (figure 3). Yet it provides information on a number of issues for which data previously did not exist for such a large number of countries, including the efficiency and cost of the services provided to commercial customers by distri-bution utilities, the complexity of procedures and the resources expended by businesses in obtaining a connection.5
Building a new indicator set
An entrepreneur would like to connect his newly built warehouse for cold meat storage to electricity. The internal wiring up to the metering point has already been completed by the electrical contractor employed by the construction firm, and the entrepreneur would now like to obtain the final electricity connection from the local distribution utility. The electrical con-tractor working for the entrepreneur estimates that the warehouse will need a 140-kVA (kilovolt-ampere) connection. The future monthly electricity consumption of the warehouse is estimated at 0.07 gigawatt-hour (GWh).
5
By measuring the time required to obtain a connection, the new indicator set shows how long a specific distribution utility takes to turn around a typical re-quest from a commercial customer. By also measuring the procedures involved, the indicator set can help identify the bottlenecks in a connection process. Re-cording procedures also offers insights into some regulatory issues around con-nection processes.
In addition, the time indicator highlights cases in which utilities deal with weaknesses in the availability of electricity by rationing new connections. In some economies where the electricity supply cannot be guaranteed, connec-tion requests are denied. In other economies requests for connections are not explicitly denied but new customers are advised to get their own generator in-stead. Rationing electricity by denying requests for new connections rather than rationing the availability of supply for all users, existing and new, especially pe-nalize small enterprises in the process of scaling up their business by moving for the first time to production methods that require electricity. Getting Electricity reflects such forms of rationing by recording time estimates for the connection process that include the wait until new connections are again being granted.6
Getting Electricity also provides important information on the components of connection costs, data not previously available for a broad sample of economies. The report discusses how connection costs in most economies can be divided into 2 main categories: fixed and variable. Most customers will pay a one-time standard connection fee that should reflect a cost model on how to spread the fixed costs of operating a distribution grid over all customers.7 Customers also face a variety of other costs that are usually calculated case by case, such as pay-ments for labor and material and for inspections.
FIGURE 3
Getting Electricity measures the connection process at the level of electricity distribution
DISTRIBUTION
New connectionsNetwork operation and maintenance
Metering and billing
CUSTOMERGENERATION TRANSMISSION

6 GETTING ELECTRICITY
But the methodology also has limitations that should be considered when in-terpreting the data. First, the collected data refer to businesses in the economy’s largest business city and may not be representative of experience in other parts of the economy. Second, the measures of time involve an element of judgment by the expert respondents. When sources provide different time estimates, the time measure reported represents the median values of several responses given under the assumptions of the standardized case. Finally, the methodology as-sumes that the entrepreneur has full information on what is required and does not waste time when completing procedures.
1. An extension involves extending the network by laying low-voltage underground cables or installing low-voltage overhead wires from the metering point to the closest substation. An expansion involves installing a pole- or pad-mounted distribution transformer and connect-ing it between the customer’s metering point and the utility’s medium-voltage network.
2. By comparison, a residential customer would need 20–40 kVA.3. For the sake of simplicity, the paper uses electrical contractors throughout the rest of the text to refer to electrical professionals of varying
qualifications. Depending on the economy, this term may include electricians, electrical technicians or electrical engineers.4. http://www.doingbusiness.org.5. Other studies (such as McCotter and Academy for Educational Development 2005, Nexant 2004 and CEER 2008) have benchmarked
commercial services of distribution utilities in smaller numbers of countries.6. The time estimates recorded for economies where new connections are rationed reflect connection moratoriums by including the wait
time until connections will again be granted. For example, for the Kyrgyz Republic, where a 6-month moratorium on new connections is in effect for the winter months, the time for the usual connection process was recorded plus 3 months of wait time due to the connection moratorium (3 rather than 6 additional months were recorded because 3 months is the average wait time for the year as a whole). Where the connection moratorium is considered indefinite and the utility cannot give a clear time frame for connections, a full additional year of wait time (365 days) is recorded to reflect the fact that a new time estimate can be provided only when the indicator is updated in the next annual round of data collection.
7. This one-time fee is not the only way utilities spread fixed costs over their customers. Utilities may also do so by charging customers a monthly fixed fee as part of their consumption bills. However, Getting Electricity records only the one-time costs associated with obtain-ing a connection.
7
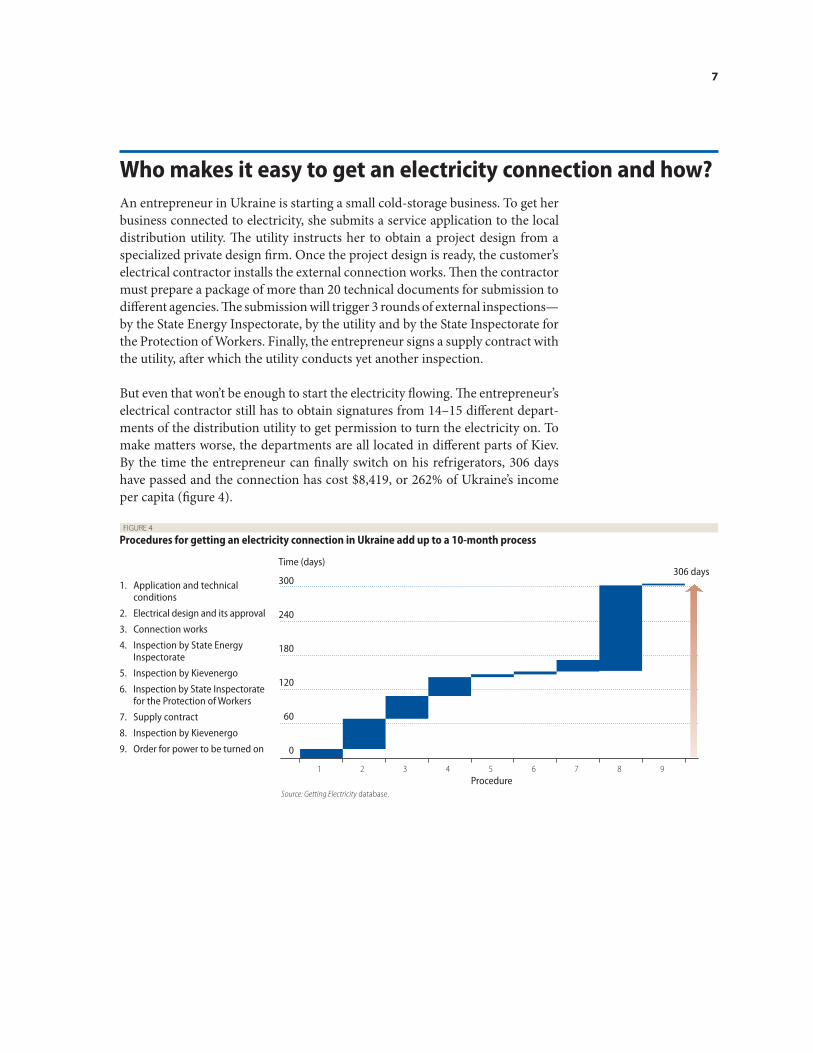
An entrepreneur in Ukraine is starting a small cold-storage business. To get her business connected to electricity, she submits a service application to the local distribution utility. The utility instructs her to obtain a project design from a specialized private design firm. Once the project design is ready, the customer’s electrical contractor installs the external connection works. Then the contractor must prepare a package of more than 20 technical documents for submission to different agencies. The submission will trigger 3 rounds of external inspections—by the State Energy Inspectorate, by the utility and by the State Inspectorate for the Protection of Workers. Finally, the entrepreneur signs a supply contract with the utility, after which the utility conducts yet another inspection.
But even that won’t be enough to start the electricity flowing. The entrepreneur’s electrical contractor still has to obtain signatures from 14–15 different depart-ments of the distribution utility to get permission to turn the electricity on. To make matters worse, the departments are all located in different parts of Kiev. By the time the entrepreneur can finally switch on his refrigerators, 306 days have passed and the connection has cost $8,419, or 262% of Ukraine’s income per capita (figure 4).
Who makes it easy to get an electricity connection and how?
1 2 3 4 5 6 7 8 9
FIGURE 4
Procedures for getting an electricity connection in Ukraine add up to a 10-month process
Time (days)
Source: Getting Electricity database.
Procedure
1. Application and technical conditions
2. Electrical design and its approval
3. Connection works
4. Inspection by State Energy Inspectorate
5. Inspection by Kievenergo
6. Inspection by State Inspectorate for the Protection of Workers
7. Supply contract
8. Inspection by Kievenergo
9. Order for power to be turned on
300
240
180
120
60
0
306 days

8 GETTING ELECTRICITY
Among the 140 economies surveyed, Ukraine ranks in the bottom 10 on the number of procedures required to connect a new customer to electricity (table 1). Econo-mies such as Denmark, Germany, Japan and Mauritius make it much easier for businesses to connect to elec-tricity. Procedures tend to be few in economies where:
Approvals that customers must obtain for the connection are consolidated with other approvals. In Romania the private contractor hired to complete the connection works must get a separate construction license for the distribution transformer needed for the connection. In both Montenegro and Serbia this construction license can be obtained from the municipality together with the main construction permit.
Responsibility for the safety compliance of the building’s internal wiring is trans-ferred to private electrical contractors, and customers do not have to go through inspection procedures instead. In Denmark, Germany, Japan and Mauritius the customer’s electri-cal contractor is required to submit an electrical in-stallation certificate with the service application. But in such economies as Ukraine customers must obtain multiple approvals from different agencies to comply with safety standards. Economies in which responsi-bility for safety compliance is transferred to private
electrical contractors usually have a well-regulated industry of electrical con-tractors and electrical engineers with a national accreditation system and pro-fessional licensing.
Utilities have the materials needed to connect customers readily available, and customers are not asked to obtain materi-als themselves. In economies like Bangladesh, the Central African Republic and Tanzania customers may be asked to provide such materials as poles, meter boxes or transformers because the utility does not have them in stock.
Mauritius is one country that makes it easy for businesses to get connected to electricity. Getting connected in Port Louis, the country’s capital, takes only 3 procedures and 44 days. The customer interacts only with the utility, and no pri-or clearances from other agencies are required. The responsibility for the inter-nal wiring is transferred to the customer’s electrical contractor, who is required
TABLE 1
Who makes it easy to get electricity— and who does not?
Procedures (number per connection)
Fewest Most
Denmark 3 Angola 8Germany 3 Armenia 8Japan 3 Azerbaijan 8Mauritius 3 Guinea-Bissau 8Qatar 3 Honduras 8Saudi Arabia 3 Nigeria 8St. Vincent and the 3 Russian Federation 8Grenadines Tajikistan 8Sweden 3 Ukraine 9Switzerland 3 Bosnia and 10Antigua and Barbuda 4 Herzegovina
Time (days)
Fastest Slowest
Germany 17 Russian Federation 272St. Kitts and Nevis 18 Czech Republic 279Iceland 22 Cyprus 306Austria 23 Ukraine 306St. Lucia 25 Kyrgyz Republic 325Fiji 29 Tanzania 382Grenada 30 Madagascar 419Chile 31 Afghanistan 424Puerto Rico 32 Guinea-Bissau 437Honduras 33 Sierra Leone 441
Source: Getting Electricity database.

WHO MAKES IT EASY TO GET AN ELECTRICITY CONNECTION AND HOW? 9
to submit an electrical installation certificate with the service application. All external works are completed by the utility, which can guarantee that the materials needed are generally available.
The number of interactions customers have with the utility and other agencies is the biggest determinant of connection delays (figure 5). In economies where busi-nesses have to go through 6–10 procedures to get con-nected, the process takes 144 days on average. In econo-mies with 3–5 procedures, it takes 104 days on average. In the 10 economies with the fewest procedures, the average is only 56 days. In the 10 economies with the most, it is 215.
Because connection times are more likely to be long where entrepreneurs must go through many procedures, it is important to understand why particular procedures are needed and how they can delay connections.
Dealing with the public service environment
No matter where in the world entrepreneurs are seeking an electricity connec-tion, they will always have to go through certain procedures, such as submitting an application, receiving connection works and getting a meter installed. But the process does not always end there. Why do entrepreneurs face 9 procedures in some economies but just 3 in others? As the next 2 sections point out, impor-tant differences arise from how economies choose to deal with safety require-ments and how well utilities do in having materials available. But beyond this, additional procedures can arise where utilities cannot rely on a strong public service environment.
Connection delays increase where opportunities are missed to streamline ap-provals with other public agencies. In Antigua and Barbuda, the Arab Republic of Egypt, the Democratic Republic of Congo and Oman customers seeking a new electricity connection must get their electricity application cleared by the building authority, which certifies that the building was constructed with a valid building permit. Why can’t customers simply submit a copy of the building per-mit to the utility?
In another common procedure customers have to apply to the municipality for an excavation permit so that the utility can lay the cables for the connection. The team found such procedures in Jordan, Luxembourg, Tajikistan and West Bank and Gaza. In Egypt customers even have to contact 2 agencies to obtain an excavation permit: the district office and the Greater Cairo Utility Data Center.
Note: Relationships are signficant at the 5% level and remain significant when controlling for income per capita.
Source: Getting Electricity database.
Procedures
FIGURE 5
The more procedures required, the longer the wait
Average time to obtain an electricity connection (days)
0
100
200
300
400
0 1 2 3 4 5 6 7 8 9 10

10 GETTING ELECTRICITY
In most other economies utilities deal with excavation permits themselves. But while this sometimes means fewer procedures for customers, it leads to delays within the utility. Take Cyprus. Before the utility can issue an estimate to a new customer, it must contact several government authorities, including the tele-communications authority, sewerage authority, public works department, mu-nicipality, archeological department and fire brigade. This clearance process alone takes 3–6 months.
Sometimes customers have to obtain separate construction permits just for the connection works. These too could be consolidated. In Romania the private con-tractor charged with undertaking the connection works needs to get a separate construction license for the distribution transformers that the utility requires him to install. Obtaining this construction license at the municipality can take 1–2 months. In Montenegro and Serbia there would be no wait, because this license could already have been obtained from the municipality together with the main construction permit for the warehouse.
Customers also lose time where utilities cannot rely on such basic public ser-vices as a functioning system of addressing.1 Utilities must be able to locate buildings to identify the corresponding connection point in their distribution network. They also have to know the exact location to ensure efficient billing later on. In Sub-Saharan Africa 87% of electricity utilities invest in creating their own mail delivery system because they cannot rely on a proper addressing system to ensure that bills reach their customers.2 Because of less-than-reliable street addressing in Lebanon and the Republic of Yemen, applicants there must obtain an electricity bill from a neighbor to help the utility identify the location of the nearest connection point.
Dealing with safety concerns and electrical efficiency
In Pakistan fires caused by poor-quality wiring are becoming a major concern. In the past few years several such fires have broken out in shopping centers and plazas, leading to losses of billions of rupees.3 There is no system of checks for electrical wiring in Pakistan, nor is there an established licensing system for electrical contractors. Entrepreneurs seeking to get their business connected to electricity must take their own measures to ensure that the connection is in-stalled in a way that minimizes safety risks for their workers.
Electrical fires due to substandard internal wiring are not a concern only in low- and lower-middle-income economies. In the United States during a typical year, home electrical problems account for 67,800 fires, 485 deaths and $868 million in property losses.4 In urban areas faulty wiring accounts for 33% of residential electrical fires.
WHO MAKES IT EASY TO GET AN ELECTRICITY CONNECTION AND HOW? 11
The quality of internal wiring is a concern not only for those using a building but also for utilities. One customer’s faulty internal wiring can lead to power outages, affecting a utility’s other customers connected to the same distribution line.5 Badly designed internal wiring can also have financial implications for the utility.6 Because of the importance of the quality of the internal installation for the customer and the utility, and because of public safety considerations (relat-ing to electrical fires), in most economies customers seeking an electricity con-nection for their business need to go through some sort of procedure dealing with the quality of their internal wiring.
In addressing safety issues, policy makers have 2 main choices: They can regu-late each transaction that has safety implications (that is, each connection). Or they can regulate the profession that regularly deals with these transactions (the electrical profession). The implications for customers are obvious: Regulating the transaction means that they need to get involved. Regulating the profes-sion instead can minimize their involvement. The difference between these ap-proaches can be illustrated by how different groups of economies deal with the internal wiring question.
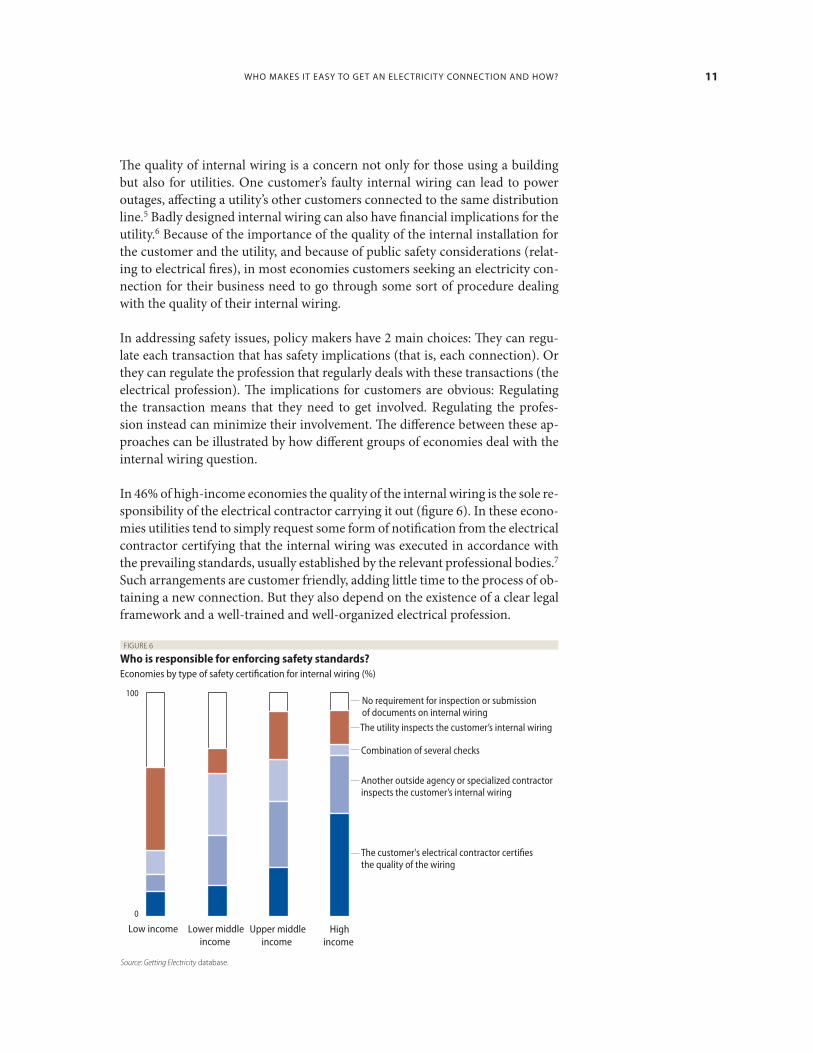
In 46% of high-income economies the quality of the internal wiring is the sole re-sponsibility of the electrical contractor carrying it out (figure 6). In these econo-mies utilities tend to simply request some form of notification from the electrical contractor certifying that the internal wiring was executed in accordance with the prevailing standards, usually established by the relevant professional bodies.7 Such arrangements are customer friendly, adding little time to the process of ob-taining a new connection. But they also depend on the existence of a clear legal framework and a well-trained and well-organized electrical profession.
Source: Getting Electricity database.
FIGURE 6
Who is responsible for enforcing safety standards?
Economies by type of safety certification for internal wiring (%)
100
0
Highincome
Upper middleincome
Lower middleincome
Low income
No requirement for inspection or submission of documents on internal wiringThe utility inspects the customer’s internal wiring
Combination of several checks
Another outside agency or specialized contractor inspects the customer’s internal wiring
The customer's electrical contractor certifies the quality of the wiring

12 GETTING ELECTRICITY
In other economies customers are required to obtain a certification that quality standards were met from the utility or an outside agency. Using specialized out-side agencies or specifically licensed electrical contractors to carry out inspections is popular in high- and upper-middle-income economies. In 13 of the 27 Latin American and Caribbean economies surveyed, customers are required to contact an outside agency to obtain an inspection of the internal wiring. Such agencies often are regulatory agencies—as in Chile (Superintendencia de Electricidad y Combustibles) and Colombia (Superintendencia de Industria y Comercio)—or municipalities or fire departments—as in Nicaragua or Panama.
Many middle-income economies combine the 2 approaches, regulating both the profession and the transaction. This leaves room to streamline procedures for the benefit of the customers. In these economies electrical contractors need to submit certifications of the quality of the internal wiring, but the utility or another agency will also conduct an inspection. And in some economies cus-tomers face the burden of additional inspections by other agencies. In Ukraine, for example, customers can count on an inspection by the State Inspectorate for the Protection of Workers. The inspectorate checks the quality of the external connection to ensure the safety of workers, even though 2 other state agencies have already inspected the same works.
In 25 of the 140 economies surveyed, the research team could not determine whether there were any procedures related to the quality of the internal wir-ing. These economies are mainly in the low- and lower-middle-income group. Whether the lack of such procedures suggests that these economies suffer from “underregulation” could not be determined within the scope of the pilot project and remains to be established by research in the coming year.
Ensuring availability of material and equipment
Connecting a new customer to an electricity network requires material and equipment. If the new connection is through an overhead line, wires have to be extended; if it is through an underground connection, cables must be laid. Often the utility will also have to install new electricity poles, meters and such heavy equipment as distribution transformers. Getting Electricity records the cost of such materials where they are charged directly to the customer. But in-vestments in materials not only translate into costs; they can also lead to longer wait times.
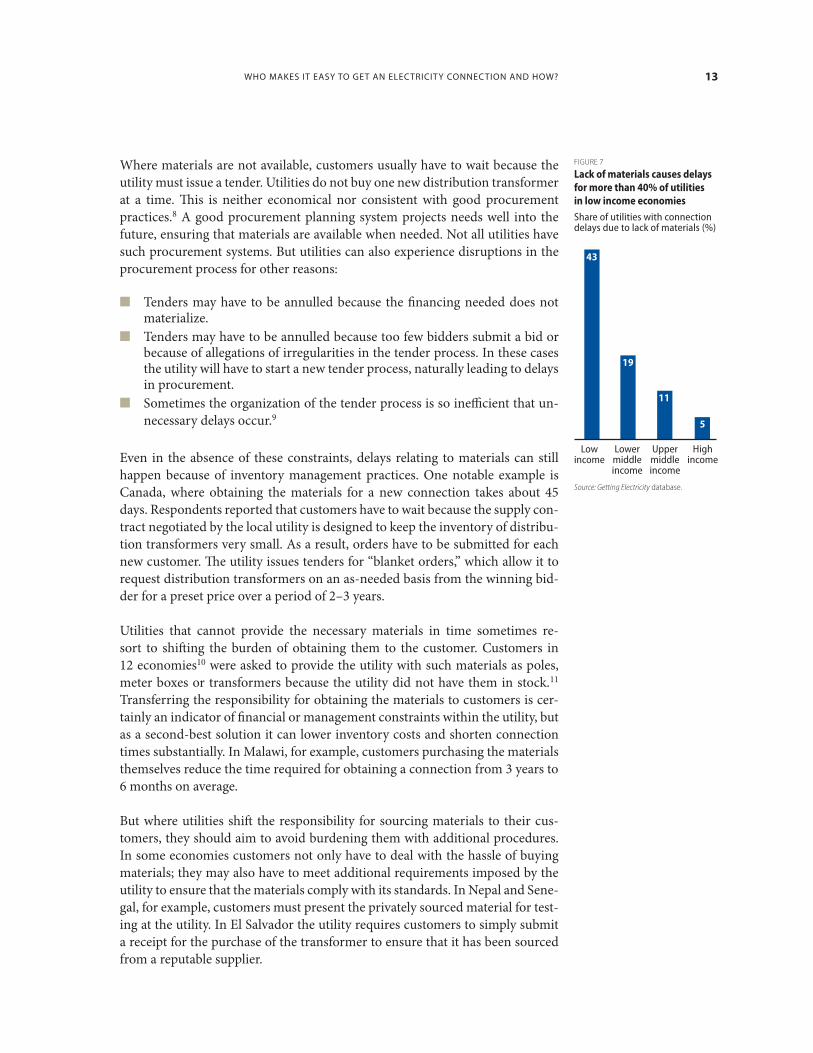
In low- and lower-middle-income economies especially, utilities sometimes lack the materials needed to establish a new connection (figure 7). In 25 economies survey respondents reported additional wait times of up to 150 days because, when new connections were requested, in more than 50% of cases the utility did not have such critical materials as distribution transformers or meters in stock and had to order them specially. In Tanzania lack of materials in stock adds an entire year to the time required to get a new connection.
WHO MAKES IT EASY TO GET AN ELECTRICITY CONNECTION AND HOW? 13
Where materials are not available, customers usually have to wait because the utility must issue a tender. Utilities do not buy one new distribution transformer at a time. This is neither economical nor consistent with good procurement practices.8 A good procurement planning system projects needs well into the future, ensuring that materials are available when needed. Not all utilities have such procurement systems. But utilities can also experience disruptions in the procurement process for other reasons:
Tenders may have to be annulled because the financing needed does not materialize.
Tenders may have to be annulled because too few bidders submit a bid or because of allegations of irregularities in the tender process. In these cases the utility will have to start a new tender process, naturally leading to delays in procurement.
Sometimes the organization of the tender process is so inefficient that un-necessary delays occur.9
Even in the absence of these constraints, delays relating to materials can still happen because of inventory management practices. One notable example is Canada, where obtaining the materials for a new connection takes about 45 days. Respondents reported that customers have to wait because the supply con-tract negotiated by the local utility is designed to keep the inventory of distribu-tion transformers very small. As a result, orders have to be submitted for each new customer. The utility issues tenders for “blanket orders,” which allow it to request distribution transformers on an as-needed basis from the winning bid-der for a preset price over a period of 2–3 years.
Utilities that cannot provide the necessary materials in time sometimes re-sort to shifting the burden of obtaining them to the customer. Customers in 12 economies10 were asked to provide the utility with such materials as poles, meter boxes or transformers because the utility did not have them in stock.11
Transferring the responsibility for obtaining the materials to customers is cer-tainly an indicator of financial or management constraints within the utility, but as a second-best solution it can lower inventory costs and shorten connection times substantially. In Malawi, for example, customers purchasing the materials themselves reduce the time required for obtaining a connection from 3 years to 6 months on average.
But where utilities shift the responsibility for sourcing materials to their cus-tomers, they should aim to avoid burdening them with additional procedures. In some economies customers not only have to deal with the hassle of buying materials; they may also have to meet additional requirements imposed by the utility to ensure that the materials comply with its standards. In Nepal and Sene-gal, for example, customers must present the privately sourced material for test-ing at the utility. In El Salvador the utility requires customers to simply submit a receipt for the purchase of the transformer to ensure that it has been sourced from a reputable supplier.
Lowermiddleincome
Uppermiddleincome
Highincome
43
19
11
5
Lowincome
Source: Getting Electricity database.
FIGURE 7
Lack of materials causes delays
for more than 40% of utilities
in low income economies
Share of utilities with connection delays due to lack of materials (%)

14 GETTING ELECTRICITY
Setting legal time limits
In the hope of disciplining utilities, regulators in many economies set legal time limits for connecting customers. The Council of European Energy Regulators, in its latest benchmarking report, records that 10 of 20 European energy regu-lators set such time limits in their regulatory frameworks.12 In collecting data for Getting Electricity, the team researched publicly available information on the websites of utilities and regulators and in electricity laws to establish how common this practice is around the world. In this initial study the team found legal time limits in 37 economies—from Angola to West Bank and Gaza, from Bolivia to the United States.
The preliminary data collected in the pilot study suggest 3 things: First, even where there are no legal time limits, many utilities connect their customers to electricity quickly. Of the 10 utilities with the fastest times for connecting a new business to electricity, not one is subject to such regulations.13 Second, of the utilities operating in economies that do have legal time limits, less than half are meeting them. Third, legal limits vary widely across economies—and not surprisingly, noncompliance is greater where limits are relatively tight. The re-search on this issue will be expanded in the coming year.
Some time limits relate to the usual first step for a new customer seeking an electricity connection: to submit a service request to the utility, which will then carry out a feasibility study and prepare a cost estimate. The pilot study found legal limits for the time from the application until the utility issues a cost esti-mate in 27 economies (table 2). The compliance results are mixed—and suggest that getting the legal time limit right is no easy task.
Time limits for quotations range from 3 days to 84, and in half the economies with such time limits, utilities do not comply with them. The reason may be that the time limits are too ambitious. In the 13 economies where utilities fail to comply, the average legal time limit is less than half as long as in the 14 econo-mies where utilities do comply. And in 9 of the 13 economies, the utilities could manage to comply if the legal time limit were as long as the average set in the 14 economies where utilities do comply.
A similar picture emerges for legal time limits set for the time from the quota-tion until the connection works are completed and the electricity is turned on. Getting Electricity found such time limits in 26 economies (table 3). Just as for the time limits for quotations, less than half the utilities in the sample comply, and many of those that do not comply could manage to do so if time limits were closer to the average used in the group of “compliant” economies.
What are the repercussions of not complying with legal time limits? Getting Electricity found penalty payments stipulated in the relevant regulatory sources in only 6 economies (see tables 2 and 3).14 In India, for example, the Maharash-

WHO MAKES IT EASY TO GET AN ELECTRICITY CONNECTION AND HOW? 15
TABLE 2
Economies with legal time limits for quotations
Economies in which utilities comply
Economy
Legaltime limit
(days)
Actual time recorded
(days) Penalty levied
Angola 40 14Belgium 30 21Canada 60 22Czech Republic 30 20Egypt, Arab Rep. 21 14Estonia 30 23Gambia, The 30 25Georgia 30 16Jordan 15 14Kyrgyz Republic 28 15Namibia 42 13 N$100 per week of delay, paid to customer upon complaint
Oman 14 10Spain 84 22West Bank and Gaza 28 20Average 34 18
Economies in which utilities do not comply
Economy
Legaltime limit
(days)
Actual time recorded
(days) Penalty levied
Cambodia 15 30Ethiopia 3 21Ireland 14 15 €135 for delay in quotation
per instance of delay, paid to customer upon complaint
Jamaica 10 14 J$8,400 per instance of delay, paid automatically to customer
Kazakhstan 5 14Lesotho 40 53Nigeria 5 151Russian Federation 30 45Senegal 14 30Singapore 14 21United Kingdom 15 37 £40 per instance of delay, paid automatically to customer
Uzbekistan 3 16Yemen, Rep. 10 14Average 14 36
Overall average 24 27
Note: Legal time limits usually differ depending on the type of customer. Legal time limits in this table refer to commercial customers with the profile of the customer assumed by the Getting Electricity case study only.
Source: Getting Electricity database.

16 GETTING ELECTRICITY
TABLE 3
Economies with legal time limits from quotation to final connection
Economies in which utilities comply
Economy
Legaltime limit
(days)
Actual time recorded
(days) Penalty levied
Angola 60 27Bolivia 10 7Côte d’Ivoire 30 18Egypt, Arab Rep. 94 23Jamaica 30 19 J$8,400 per instance of delay, paid automatically to customer
Lesotho 60 33Namibia 180 29 N$100 per week of delay, paid to customer upon complaint
Oman 90 55Russian Federation 365 272St. Lucia 29 8Turkey 30 25Average 89 47
Economies in which utilities do not comply
Economy
Legaltime limit
(days)
Actual time recorded
(days) Penalty levied
Ethiopia 13 54Gambia, The 60 153India 30 52 Rs 100 per week of delay, paid upon complaint to customer
Ireland 90 93 €65 for delay in connection; €50 for delay in meter installa-tion per instance of delay, paid automatically to customerNetherlands 84 96
Nigeria 10 109Pakistan 73 233Romania 62 207Senegal 30 88Serbia 15 49Singapore 11 55St. Kitts and Nevis 7 18United States 10 48West Bank and Gaza 30 48Yemen, Rep. 10 20Average 36 88
Overall average 62 68
Note: Legal time limits usually differ depending on the type of customer. Legal time limits in this table refer to commercial customers with the profile of the customer assumed by the Getting Electricity case study only.
Source: Getting Electricity database.

WHO MAKES IT EASY TO GET AN ELECTRICITY CONNECTION AND HOW? 17
tra Electricity Regulatory Commission establishes a penalty in its performance standards: for every week of delay beyond the legal time limit for connecting a new customer, the utility has to pay the customer the equivalent of $2 (100 rupees).15 In Pakistan the penalty is a flat fee equivalent to $123 (10,000 rupees) for every breach of the standard, and the utility pays the regulatory authority, not the customer.16 In The Gambia the Public Utilities Regulatory Authority will just “seek an explanation” if the utility fails to provide a connection within 60 working days after the customer has accepted the quotation.17
Are penalty payments effective? Results in the small number of economies using them suggest not. In the 6 cases in which penalty payments were found, only the utility in Namibia complies with the legal time limit, set at a generous 220 days from the submission of the application to the final connection.18 One reason that penalty payments might not be an effective tool is that monitoring service quality outcomes is no easy task—because regulators usually have to rely on in-formation provided voluntarily by utilities. As the Council of European Energy Regulators points out in its most recent benchmarking report, the monitoring of such outcomes is not widespread in Europe. For other regions such bench-marking studies do not even exist.
Delegating connection works
Many utilities delegate completion of the connection works at least in part to private contractors, sometimes hired by the customer and sometimes by the utility. Only 60% of the utilities surveyed still complete the external connec-tion works themselves. In 39 economies the work is done by a private contrac-tor hired by the customer. In 17 economies the utility shares the work with a privately hired contractor. The practice of outsourcing the connection works is particularly prevalent in lower-middle-income economies. Among regions, the practice is most common in Eastern Europe and Central Asia, where 17 of 26 utilities ask the customer to hire a private firm to complete at least part of the external connection works (figure 8).
Utilities may prefer to delegate work to private contractors for several reasons, including to shed the overhead costs of employing technical staff in response to financing constraints or to increase the efficiency of the connection process through competition. Efficiency could be increased by either lowering the costs for connections or speeding up the process.
But the initial data collected for Getting Electricity suggest that delegating work does not shorten connection times. Indeed, regardless of the type of work that needs to be done, outsourcing it to private contractors does not guarantee speedier service (figure 9). Only in South Asia and the Middle East and North Africa are connection times faster when private contractors are involved. One reason might be that the contractors have to obtain additional permits for each connection contract.

18 GETTING ELECTRICITY
Take the example of Belarus. The customer must first hire a private design firm to design the external connection. But before delivering the design, the design firm must obtain permits from various state agencies. A different specialized agency completes the connection works, but not before obtaining yet another set of per-mits. In Burkina Faso the outsourcing of work also leads to delay. Each time the utility must issue a tender for companies to bid on before it can choose the firm that will do the work. This delays the connection process by 2–3 months.
FIGURE 8
More utilities outsource connection works in Eastern Europe and Central Asia
Number of utilities
Outsource all connection works
Outsource some connection works
No outsourcing
0
5
10
15
20
25
30
Sub-SaharanAfrica
EasternEurope &
Central Asia
LatinAmerica
& Caribbean
Middle East& North Africa
East Asia &Pacific
SouthAsia
OECDhigh
income
Some or all connection works outsourced
No connection works outsourced
Source: Getting Electricity database.
Source: Getting Electricity database.
FIGURE 9
Outsourcing connection works to private contractors does not guarantee speedier service
Average time spent on connection works (days)
LatinAmerica
& Caribbean
0
30
60
90
120
150
Sub-SaharanAfrica
EasternEurope &
Central Asia
Middle East& North Africa
East Asia &Pacific
SouthAsia
OECDhigh
income

WHO MAKES IT EASY TO GET AN ELECTRICITY CONNECTION AND HOW? 19
1. Farvacque-Vitkovic and others (2005).2. Toledano and Ansón (2008). 3. Pakistan Housing (2009).4. U.S. Fire Administration (2008).5. For example, an electrical fire could require the utility to shut down the line to which other customers are also connected, either because
of damage to the line or to make necessary repairs at the affected customer’s site.6. For example, a bad power factor, leading to the use of excessive current to operate machinery, could lead to financial losses for the utility
if the customer is billed for only the active (real) power (kilowatt-hours). (One way to deal with this problem is to measure the customer’s power factor or reactive energy consumption.) Utilities are not otherwise particularly affected by a customer’s faulty internal wiring as long as their network is well equipped with protective devices (at the customer’s end, such devices as a feeder and distribution transform-er) ensuring that failures of a customer’s internal installation usually do not propagate too far in the system. It could therefore be argued that internal wiring inspections are only to some degree in the interest of the utility and required mainly for the customer’s safety.
7. With this certification the electrical contractor assumes responsibility for any problems arising from the internal wiring installation up to the meter box.
8. Utilities are especially likely to be subject to public procurement rules in low- and lower-middle-income economies, where many are still government owned. These rules usually require utilities or other government agencies to have an annual procurement plan and to tender contracts for large quantities of distribution transformers at a time, following certain steps and procedures with corresponding time limits.
9. For example, the duration of each stage of the tender process and the interval between the stages—such as between bid opening and con-tract award, or between contract award and contract signature—may be unnecessarily prolonged. Ultimately a balance needs to be struck between transparent and competitive tender processes allowing enough time to prepare and evaluate tenders and to appeal decisions, and efficient processes creating burdensome layers of administration and bureaucracy that give room for corruption and fraud.
10. Bangladesh, Bolivia, Bulgaria, Burundi, Finland, the Islamic Republic of Iran, Madagascar, Malawi, Maldives, Nepal, the Seychelles and Sierra Leone.
11. Getting Electricity records such purchasing procedures only when the customer must purchase materials to help the utility out because it does not have those materials in stock.
12. CEER (2008).13. The data refer only to regulations that are publicly available, not to utilities’ own rules, which are beyond the scope of the study.14. India, Ireland, Jamaica, Namibia, Pakistan and the United Kingdom. 15. Maharashtra Electricity Regulatory Commission (2005). 16. Pakistan National Electric Power Regulatory Authority (2005).17. The Gambia Public Utilities Regulatory Authority (2008).18. Namibia Electricity Control Board (2004).

20 GETTING ELECTRICITY
What does it cost to get connected?
Differences in the voltage level to which customers need to connect are the big-gest driver of differences in the absolute connection cost across economies. In some economies the Getting Electricity customer requesting a 140-kVA con-nection would simply be connected to an existing distribution transformer through an overhead line or underground cable connection. But in most of the economies surveyed the customer’s warehouse would have to be connected to higher-voltage lines, a more complicated connection effectively leading to an expansion of the distribution network. Because this means installing distribu-tion transformers, the connection requires significant capital investments, often incurred by the new customer.
All this drives up the connection cost. A 140-kVA connection could be provided through a simple line or cable extension in only 41 of the 140 economies sur-veyed. The average cost for these simple connections was $14,504. Where the more complicated connection was needed, the average was $35,876.
Because the absolute connection cost differs so significantly between simple and more complicated connections, the team collecting the data put particu-lar care into establishing which type of connection would be required in each economy. Both the utility and at least 2 private practitioners were asked which would be more likely for the case study. Where answers diverged significantly, the research team sought additional private opinions and followed up by e-mail and phone with all those interviewed to find out whether views diverged be-cause of differences in interpretation of the case study. In the few cases in which no agreement could be found or all parties considered both types of connection equally likely, a median case between a simple and a more complicated connec-tion was recorded.
Not surprisingly, the Getting Electricity data show that accommodating the additional demand of the case study customer is more likely to require additional capital investment in low- and lower-middle-income economies. That drives up the absolute connection cost and has a big effect on the cost as a share of income per capita, the terms in which Getting Electricity records it. The 10 lowest-cost economies are all high-income economies except Panama.1 The 10 highest-cost cases are all low-income economies (table 4).
TABLE 4
Who makes it least costly to get electricity—and who most costly?
Cost to obtain an electricity connection (% of income per capita)
Least Most
Japan 0 Ethiopia 6,967Hong Kong, China 2 Gambia, The 6,975Qatar 4 Senegal 7,007Germany 5 Madagascar 8,466Iceland 9 Malawi 11,655Panama 11 Central African 14,378Israel 13 Republic
Norway 14 Burkina Faso 15,443
Australia 15 Benin 15,817United Arab Emirates 16 Congo, Dem. Rep. 28,304
Burundi 43,020
Source: Getting Electricity database.

21
Yet the connection cost varies significantly among economies within income groups, suggesting room to reduce the cost regardless of existing infrastruc-ture (figure 10). In the 10 lowest-cost economies the average cost for a connec-tion is $4,065, only about a fifth of the average for all high-income economies ($21,385). In the 10 highest-cost economies the average is $52,560, 1.8 times the average for the low-income group ($29,335).
Building and maintaining a distribution network and connecting customers to electricity are a costly enterprise with significant fixed costs. Because fixed costs are high, creating and operating an electricity grid is most cost-effective in densely populated areas with customers that can afford to consume a lot of energy. This is the main reason that rural areas in lower-income economies of-ten remain unconnected if economic criteria are the main drivers of connection policy. To recoup these fixed costs across its entire service area, a utility seeks to spread them across all its customers, usually through standard connection fees set for groups of comparable customers.2 Getting Electricity found such standard connection fees in 77 of the 140 economies surveyed.3
Besides the standard connection fee, most customers seeking an electricity con-nection also have to shoulder variable costs, the costs for labor and material that vary with each connection. Customers pay these costs to the utility or to a private contractor, depending on who is completing the connection works. In many economies the bill also includes the costs of a security deposit and pay-ments to other public agencies for inspections, permits and approvals.
Income group Income group
Connection involving only an extension
of an overhead line or underground cable
Source: Getting Electricity database.
FIGURE 10
Connection costs vary by type of connection
and among economies within income groups
US$ thousands
Low Lowermiddle
Uppermiddle
High Low Lowermiddle
Uppermiddle
High
Highest
Lowest
Average
100
80
60
40
20
0
$435,000
Connection involving an extension and
installation of a distribution transformer
22 GETTING ELECTRICITY
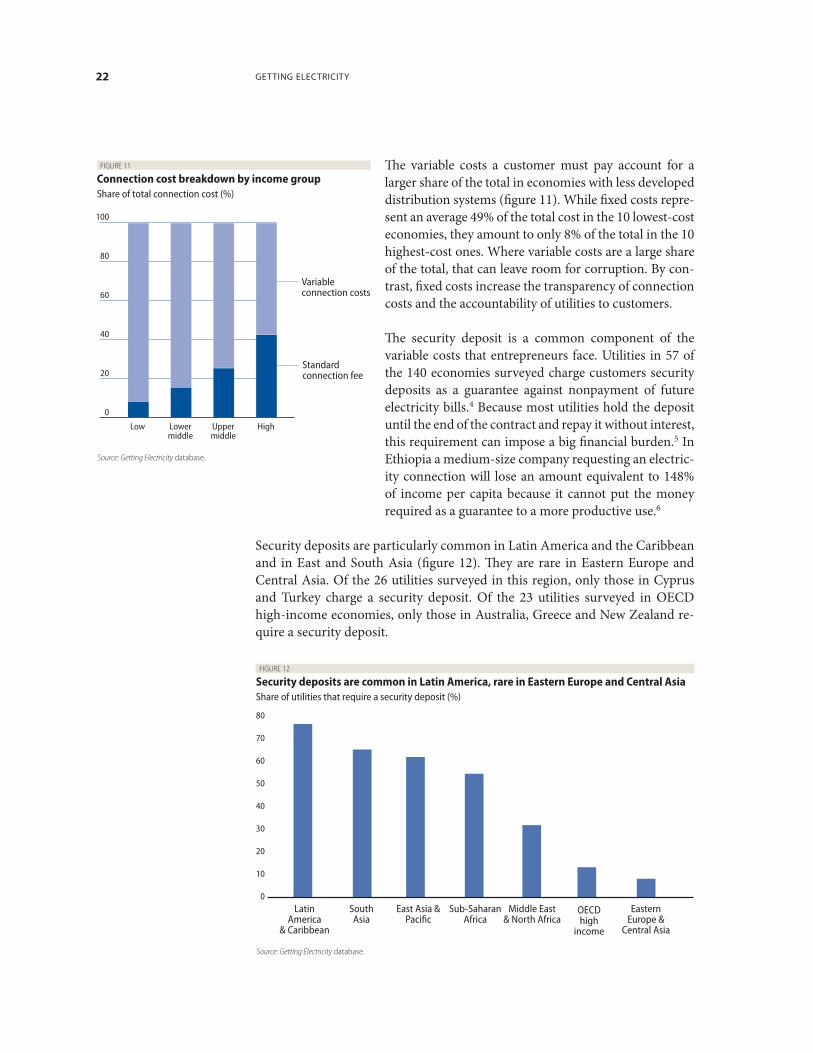
The variable costs a customer must pay account for a larger share of the total in economies with less developed distribution systems (figure 11). While fixed costs repre-sent an average 49% of the total cost in the 10 lowest-cost economies, they amount to only 8% of the total in the 10 highest-cost ones. Where variable costs are a large share of the total, that can leave room for corruption. By con-trast, fixed costs increase the transparency of connection costs and the accountability of utilities to customers.
The security deposit is a common component of the variable costs that entrepreneurs face. Utilities in 57 of the 140 economies surveyed charge customers security deposits as a guarantee against nonpayment of future electricity bills.4 Because most utilities hold the deposit until the end of the contract and repay it without interest, this requirement can impose a big financial burden.5 In Ethiopia a medium-size company requesting an electric-ity connection will lose an amount equivalent to 148% of income per capita because it cannot put the money required as a guarantee to a more productive use.6
Security deposits are particularly common in Latin America and the Caribbean and in East and South Asia (figure 12). They are rare in Eastern Europe and Central Asia. Of the 26 utilities surveyed in this region, only those in Cyprus and Turkey charge a security deposit. Of the 23 utilities surveyed in OECD high-income economies, only those in Australia, Greece and New Zealand re-quire a security deposit.
Source: Getting Electricity database.
FIGURE 11
Connection cost breakdown by income group
Share of total connection cost (%)
Low Lowermiddle
Uppermiddle
High
100
80
60
40
20
0
Standardconnection fee
Variableconnection costs
Source: Getting Electricity database.
FIGURE 12
Security deposits are common in Latin America, rare in Eastern Europe and Central Asia
Share of utilities that require a security deposit (%)
80
70
60
50
40
30
20
10
0Sub-Saharan
AfricaEastern
Europe &Central Asia
LatinAmerica
& Caribbean
Middle East& North Africa
East Asia &Pacific
SouthAsia
OECDhigh
income

WHAT DOES IT COST TO GET CONNECTED? 23
The 57 utilities in the sample that charge a security deposit require $6,818 on av-erage. In St. Lucia the security deposit for a small to medium-size enterprise like the Getting Electricity customer is as high as $63,701. Although Getting Electrici-ty records only the present value of the interest lost on the security deposit, even those amounts can be high—in Puerto Rico, as high as $26,334. On average, the present value of the interest lost on the security deposit accounts for 16% of the entire connection cost for the customer. The present value of the interest lost represents on average 23% of the cost in upper-middle-income economies and 14% in lower-middle-income economies—the 2 income groups where require-ments for security deposits are most prevalent (table 5).
That security deposits are charged as a guarantee against nonpayment suggests that they might be used most by utilities that are unsuccessful in collecting on electric-ity bills. But the collection ratio—the ratio of revenues from bills collected to the electricity billed—is not nec-essarily lower in economies where security deposits are charged (table 6). That raises an obvious question: Are security deposits charged for reasons other than to se-cure payment—for example, to improve the financial position of the utility? Because security deposits are usually returned to customers only when they cancel their contract with the utility, and rarely with interest, the deposits effectively represent a free credit granted to the utility over the life of a supply contract.
TABLE 5
How common—and how costly—are security deposits?
Income group
Utilities charging a security deposit
(%)
Average present value of interest lost Utilities allowing
customers to use a bond (%) in US$
as % of total connection cost
Low income 39.3 1,629.1 5.6 0.0Lower middle income 47.2 1,948.5 14.4 23.5Upper middle income 48.7 5,148.5 23.2 27.8High income 28.2 727.0 14.7 45.5
World 40.7 2,661.6 15.5 24.6
Source: Getting Electricity database.
TABLE 6
Problems with bill collection do not make requirements for security deposits more likely
Economy
Averagecollection ratio
(%)
Securitydeposit
charged?
Azerbaijan 30 NoGeorgia 55 NoIndia 71 YesUganda 74 YesKenya 75 NoColombia 77 YesMoldova 80 NoPeru 80 NoArgentina 81 NoMalaysia 82 YesNiger 84 NoCameroon 85 NoBrazil 87 NoGhana 89 NoTanzania 89 YesUkraine 95 NoRussian Federation 96 No
Mauritius 100 Yes
Note: Collection ratio is ratio of revenues collected to total electricity billed.
Source: Getting Electricity database; Pushak (2009); Public-Private Infrastructure Advisory Facility (PPIAF), Private Participation in Infrastructure Services database.

24 GETTING ELECTRICITY
Some utilities apply security deposits more selectively or at least lessen the finan-cial burden of the deposit for customers. Utilities in Austria ask only customers with a weak credit history to put up a security deposit. Those in Argentina re-quire security deposits only from customers that do not own the property being connected. In 14 economies utilities allow customers to settle the security de-posit with a bank guarantee rather than deposit the entire security amount with the utility. The service cost for such bank guarantees is usually lower than the interest that customers lose on the deposit.7 Even more important, the customers keep control of their assets.
1. The World Bank classifies Panama as an upper-middle-income economy.2. In most cases this effectively leads to cross-subsidization from low- to high-cost areas and from high- to low-income customers. 3. Where connection fees are fixed, they are usually calculated as a function of the peak electricity demand of the facility that is to be con-
nected. These connection fees can often be found on the website of the utility or the regulator.4. Some utilities also justify security deposits as a necessary guarantee of the return of material that the utility “lends” to the customer (such
as meters). The count of economies charging security deposits does not include those where security deposits are rolled over into con-sumption bills for the first 3 months (Malaysia, Tunisia and the United States).
5. In only 10 economies (The Bahamas, Grenada, India, Jamaica, Malawi, Nicaragua, Panama, the Philippines, St. Lucia and St. Vincent and the Grenadines) do the utilities surveyed return the deposit with interest in the case of a commercial customer like that assumed by Getting Electricity. And in only 3 of 57 economies is the security deposit returned before the end of the contract (Australia, Nicaragua and Panama).
6. Getting Electricity assumes a contract length of 5 years. For more details on the coding rules for security deposits, see the data notes.7. The annual service cost for a bank guarantee in the economies surveyed is in the range of 1.5–5% of the security amount.

25
Data reflecting the interactions between utility service providers and businesses as customers are still few and remain cumbersome and costly to collect. This is unfortunate, because while electricity sector reforms in developing economies have increased the operating efficiency of utilities, the efficiency gains have not always been passed on to customers (such as through lower costs).1 More data on the services provided by utilities could inform research and support future reform efforts. And such benchmarking exercises can particularly benefit the distribution utilities providing electricity connections, as they retain monopo-listic positions even in otherwise liberalized electricity markets.
By measuring the procedures, time and cost for obtain-ing a new electricity connection, Getting Electricity al-lows objective comparison across a wide range of econo-mies from the perspective of businesses. And it provides insights into the efficiency of distribution utilities and the sector environment in which they operate. The con-nection process is only part of the electricity services that matter to businesses, though it is a critical one. But ini-tial analysis of the pilot data shows correlations between measures of the connection process and available mea-sures of broader sector performance. There is a positive correlation, for example, between the efficiency of the connection process as measured by Getting Electricity and the efficiency of the electricity system as measured by technical losses in the distribution and transmission system as a percentage of output (figure 13).
This paper presents findings on the kinds of constraints entrepreneurs face around the world in getting access to electricity and illustrates patterns in con-nection processes. It highlights economies where this process is efficient and others where it could be made simpler and more efficient. Feedback from gov-ernments and utilities on the new Getting Electricity indicators and the findings presented is welcome and will be used to further refine the methodology.
This report contains data for 140 economies—and research is continuing.
What to expect next?
FIGURE 13
Easier connection is associated with a more efficient
electricity system
Transmission and distribution losses (% of electricity output)
Note: Relationships are signficant at the 1% level and remain significant when controllingfor income per capita.
Source: Getting Electricity database; World Bank, World Development Indicators database.
Economies ranked by procedures, time and cost to obtain an electricity connection (quintiles)
Higher
Lower
Least Most
1. Jamasb and others (2005).

26 GETTING ELECTRICITY
References
CEER (Council of European Energy Regulators). 2008. 4th Benchmarking Report on Quality of Electricity Supply 2008. Brussels. http://www.energy-regulators.eu/.
Farvacque-Vitkovic, Catherine, Lucien Godin, Hugues Leroux, Florence Verdet and Roberto Chavez. 2005. Street Addressing and the Management of Cities. Washington, DC: World Bank.
Foster, Vivien, and Jevgenijs Steinbuks. 2009. “Paying the Price for Unreliable Power Sup-plies: In-House Generation of Electricity by Firms in Africa.” Policy Research Working Paper 4913, World Bank, Washington, DC.
The Gambia Public Utilities Regulatory Authority (PURA). 2008. “Guidelines for Minimum Quality of Service and Reliability Standards for Electricity, Section 3.5.1.” Kololi. http://pura.gm/index.php?option=com_content&task=view&id=92&Itemid=146.
International Energy Agency. 2006. World Energy Outlook. Paris.Izaguirre, Ada Karina. 2008. “PPI in Energy in Developing Countries, 1990–2007: Recent
Trends.” World Bank and Public-Private Infrastructure Advisory Facility (PPIAF), Washington, DC. http://www.ppiaf.org/documents/Presentations/BBL_PPI_Ener-gy11-04-08.pdf.
Jamasb, Tooraj, Raffaella Mota, David Newbery and Michael Pollitt. 2005. “Electricity Sector Reform in Developing Countries: A Survey of Empirical Evidence on Determinants and Performance.” Policy Research Working Paper 3549, World Bank, Washington, DC.
Maharashtra Electricity Regulatory Commission. 2005. Maharashtra Electricity Regulatory Commission (Standards of Performance of Distribution Licensees, Period for Giving Sup-ply and Determination of Compensation) Regulations. Mumbai.
McCotter, Brian, and Academy for Educational Development. 2005. “Best Practices in Con-sumer Services: A Comparative Study.” Report prepared for U.S. Agency for Interna-tional Development, Washington, DC.
Namibia Electricity Control Board. 2004. “Namibia Electricity Supply Industry: Quality of Supply and Service Standards—Quality of Service Standard.” Windhoek. http://www.ecb.org.na/download.php?fl_id=22.
Nexant. 2004. “Performance Benchmarks for Electricity Distribution Companies in South Asia.” Concept paper prepared for U.S. Agency for International Development SARI/Energy Program, Washington, DC.
Pakistan Housing. 2009. “Rawalpindi: Commercial Buildings Fire Risk Looming Large.” January 3. http://www.pakistanhousing.pk/News/index.php/rawalpindi-commercial-buildings-fire-risk-looming-large/.
Pakistan National Electric Power Regulatory Authority. 2005. “Statutory Notification.” Islam-abad. http://www.nepra.org.pk/Standards/PSD%202004.pdf.
Pushak, Nataliya. 2009. “Describing and Exploring Private Participation in Infrastructure Services (PPIS) Database.” World Bank and Public-Private Infrastructure Advisory Fa-cility (PPIAF), Washington, DC.
Shaw, Judith. 2004. “Microenterprise Occupation and Poverty Reduction in Microfinance Programs: Evidence from Sri Lanka.” World Development 32 (7): 1247–64.
Toledano, Joëlle, and José Ansón, eds. 2008. Postal Economics in Developing Countries: Posts, Infrastructure of the 21st Century?. Berne: Universal Postal Union.
U.S. Fire Administration. 2008. “Electrical Fire Safety: A Factsheet on Home Electrical Fire Prevention.” http://www.usfa.dhs.gov/citizens/all_citizens/home_fire_prev/electrical.shtm.
World Bank. 2009. World Development Indicators 2009. Washington, DC: World Bank Group.
27
Getting Electricity records all procedures that are officially required for a busi-ness to obtain a permanent electricity connection and supply for a standardized warehouse. These procedures include applications and contracts with electricity utilities, all necessary clearances from other agencies and the external and final connection works.
Data are collected from the electricity distribution utility, then completed and verified by independent professionals such as electricians, electrical engineers and electrical contractors as well as construction companies. In some cases reg-ulatory agencies are also contacted. The electricity distribution utility surveyed is the one serving the area (or areas) where the warehouse is located. If a choice of distribution utilities is available, the one serving the largest number of cus-tomers is selected. The data presented in this report reflect contributions by 567 respondents in 140 economies. To make the data comparable across economies, several assumptions about the warehouse and the electricity connection are used.
Assumptions about the warehouseThe warehouse:
located (a nonresidential area).
connection is not eligible for subsidization or faster service under a special investment promotion regime. If several options for location are available, the warehouse is located where electricity is most easily available.
where it is located). It is being connected to electricity for the first time.
Assumptions about the electricity connection The electricity connection:
underground, whichever is more common in the economy and in the area where the warehouse is located.
consumption will be 0.07 gigawatt-hour (GWh).
The internal electrical wiring has already been completed.
Data notes

28 GETTING ELECTRICITY
Procedures A procedure is defined as any interaction of the company employees or the com-pany’s main electrical contractor (that is, the one who did the internal wiring) with external parties, such as the electricity distribution utility, electricity sup-ply utilities, government agencies and other electrical contractors. Interactions between company employees and steps related to the internal electrical wiring, such as the design and execution of the internal electrical installation plans, are not counted as procedures. Procedures that must be completed with the same utility but with different departments are counted as separate procedures. The list of procedures starts only after the internal wiring of the building has been completed and ends when the electricity is flowing.
The company employees are assumed to complete all procedures themselves unless the use of a third party is mandated (for example, only an electrical con-tractor registered with the utility is allowed to submit an application). If the company can, but is not required to, request the services of professionals (such as a private firm rather than the utility for the external works), these procedures are recorded if they are commonly done. For all procedures, only the most likely cases (for example, more than 50% of the time the utility has the material in stock) and those often followed in practice for connecting a warehouse to elec-tricity are counted (for example, connection works are more commonly com-pleted by private contractors than by the utility).
Time Time is recorded in calendar days. The measure captures the median duration that the electricity utility and experts indicate is necessary in practice, rather than required by law, to complete a procedure with minimum follow-up and no extra payments. It is also assumed that the minimum time required for each procedure is 1 day. Although procedures may take place simultaneously, they cannot start on the same day (that is, simultaneous procedures start on consecutive days). In extreme cases, where connection requests are denied or not carried out because only generators are used in the economy, additional wait times of up to one year are added. It is assumed that the company does not waste time and commits to completing each remaining procedure without delay. The time that the company spends on gathering information is ignored. It is assumed that the company is aware of all electricity connection require-ments and their sequence from the beginning.
Cost Cost is recorded as a percentage of the economy’s income per capita. Costs are recorded exclusive of value added tax. All the fees associated with completing the procedures to connect a warehouse to electricity are recorded, including those related to obtaining clearances from government agencies, applying for the connection, receiving inspections of both the site and the internal wiring, purchasing material, getting the actual connection works and paying a security deposit. Information from local experts and specific regulations and fee sched-ules are used as sources for costs. If several local partners provide different esti-mates, the median reported value is used. In all cases the cost excludes bribes.

DATA NOTES 29
Security depositUtilities charge security deposits as a guarantee against the possible failure of customers to pay their consumption bills. For this reason security deposits are most often calculated as a function of the estimated consumption of the new customer.
Getting Electricity does not record the full amount of the security deposit. In-stead, it records the present value of the losses in interest earnings experienced by the customer because the utility holds the security deposit over a prolonged period, in most cases until the end of the contract (assumed to be after 5 years). In cases in which the security deposit is used to cover the first monthly con-sumption bills, it is not recorded. To calculate the present value of the lost in-terest earnings, the end-2008 lending rates from the International Monetary Fund’s International Financial Statistics are used. In cases in which the security deposit is returned with interest, the difference between the lending rate and the interest paid by the utility is used to calculate the present value.
In some economies the security deposit can be put up in the form of a bond: the company can obtain from a bank or an insurance company a guarantee issued on the assets it holds with that financial institution. In contrast to the scenario in which the customer pays the deposit in cash to the utility, in this scenario the company does not lose ownership control over the full amount and can contin-ue using it. In return the company will pay the bank a commission for obtaining the bond. The commission charged may vary depending on the credit standing of the company. The best possible credit standing and thus the lowest possible commission are assumed. Where a bond can be used, the value recorded for the deposit is the annual commission times the 5 years assumed to be the length of the contract. If both options exist, the cheaper alternative is recorded.
In Belize in June 2009, a customer asking for a 140-kVA electricity connection would have had to put up a security deposit of 22,662 Belize dollars in cash or check, and the deposit would be returned only at the end of the contract. The customer could instead have invested this money at the prevailing lending rate of 14.4%. Over the 5 years of the contract this would imply a present value of lost interest earnings of BZ$11,073. In contrast, if the customer had been al-lowed to settle the deposit with a bank guarantee at an annual rate of 1.75%, the amount lost over the 5 years would have been just BZ$1,983.
Limits to what is measuredThe methodology has limitations that should be considered when interpreting the data. First, the collected data refer to businesses in the economy’s largest business city and may not be representative of regulation in other parts of the economy. Second, the measures of time involve an element of judgment by the expert respondents. When sources indicate different time estimates, the time indicators reported represent the median values of several responses given un-der the assumptions of the standardized case. Finally, the methodology assumes that the business has full information on what is required and does not waste

30 GETTING ELECTRICITY
time when completing procedures. In practice, a procedure may take longer if the business lacks information or is unable to follow up promptly. Alternatively, the business may choose to disregard some burdensome procedures. For both reasons the time delays reported could differ from the perceptions of entrepre-neurs reported in the World Bank Enterprise Surveys.
The data also differ in important ways from other electricity data sets. The Get-ting Electricity data do not reflect the costs associated with electricity consump-tion. They do not measure the percentage of households or businesses con-nected to electricity in each economy. And while the data are correlated with other measures of the quality of electricity services, they cannot be used as a direct measure of the quality of the electricity connection obtained. Quality problems such as the frequency of service interruptions, energy losses and volt-age drops—all of which represent a significant burden on businesses—are not directly reflected in the data set.
Economy characteristicsThe Getting Electricity study uses the World Bank regional and income groupings, available at http://www.worldbank.org/data/countryclass/coun-tryclass.html.
The study uses 2008 income per capita numbers, calculated using the At-las method (current US$), as published in the World Bank’s World Devel-opment Indicators 2009. For the cost indicator expressed as a percentage of income per capita, 2008 gross national income (GNI) in local currency units is used as the denominator. GNI data were not available from the World Bank for Afghanistan, The Bahamas, Bahrain, Cyprus, the Islamic Republic of Iran, Oman, Puerto Rico, Qatar, Saudi Arabia and the United Arab Emirates. In these cases GDP or GNP per capita data from the In-ternational Monetary Fund’s World Economic Outlook database and the Economist Intelligence Unit were used.

31
Getting Electricity indicatorsProcedures, time and cost to obtain an electricity connection
Procedures(number)
Time(days)
Cost(% of income
per capita)
Afghanistan 4 424 618.2Albania 5 162 614.5Angola 8 41 1,102.3Antigua and Barbuda 4 42 140Argentina 6 74 25.2Armenia 8 242 673Australia 5 46 15.4Austria 5 23 110.7Azerbaijan 8 225 624.4Bahamas, The 7 73 45Bahrain 5 72 47.8Bangladesh 7 109 3,171.4Belarus 6 218 1,291.4Belgium 4 50 44.2Belize 5 106 341.9Benin 5 172 15,816.9Bhutan 5 241 1,675.4Bolivia 7 51 1,484.4Bosnia and Herzegovina 10 127 276.7Botswana 5 117 465.4Brazil 6 36 163.2Bulgaria 6 102 295.1Burkina Faso 4 158 15,443Burundi 4 158 43,020.5Cambodia 4 169 3,854.1Cameroon 4 67 1,735.3Canada 8 133 164.4Cape Verde 4 46 1,112.9Central African Republic 6 210 14,377.7Chile 6 31 88.4China 4 118 835.7Colombia 5 150 1,243.6Congo, Dem. Rep. 6 73 28,304Costa Rica 5 62 329Côte d’Ivoire 5 43 4,303.7Croatia 5 70 319.8Cyprus 4 306 99.2Czech Republic 6 279 184.9Denmark 3 43 106.2Djibouti 4 180 6,473.4Dominica 5 73 1,188.1Ecuador 5 89 973.5Egypt, Arab Rep. 7 50 453.5El Salvador 7 74 467.3Estonia 4 99 206.1Ethiopia 4 75 6,967.3Fiji 6 29 794.8
Procedures(number)
Time(days)
Cost(% of income
per capita)
Finland 5 53 20.9France 5 123 27.9Gabon 5 160 256.9Gambia, The 4 178 6,975.1Georgia 4 71 666.3Germany 3 17 5.1Ghana 4 78 2,240.5Greece 6 77 35.6Grenada 4 30 244.6Guatemala 4 39 677.4Guinea-Bissau 8 437 4,125.8Honduras 8 33 963.4Hong Kong, China 4 101 1.8Hungary 6 252 98.3Iceland 4 22 8.7India 7 67 504.9Iran, Islamic Rep. 6 143 1,050.3Ireland 4 106 21.3Israel 6 113 12.7Jamaica 6 48 80.1Japan 3 105 0.0 Jordan 5 43 525.2Kazakhstan 5 103 300.5Kenya 5 162 1,405.3Kyrgyz Republic 6 325 2,478.4Lao PDR 5 127 3,245.2Latvia 5 193 335.1Lebanon 5 75 29.9Lesotho 5 86 2,675.7Lithuania 4 98 62.3Luxembourg 5 120 51.5Macedonia, FYR 5 90 924.9Madagascar 5 419 8,466.2Malawi 5 179 11,654.8Malaysia 6 51 42.6Maldives 6 101 823.1Mauritius 3 44 262.8Mexico 7 169 577.1Moldova 7 126 650.7Montenegro 4 67 409.3Morocco 5 71 2,295Namibia 7 40 403.9Nepal 6 73 2,890Netherlands 5 125 38.9New Zealand 5 47 73.3Nicaragua 6 70 1,695.3Niger 4 165 4,295.9

32 GETTING ELECTRICITY
Procedures, time and cost to obtain an electricity connection
Procedures(number)
Time(days)
Cost(% of income
per capita)
Nigeria 8 260 1,146.8Norway 4 59 14.1Oman 5 66 70.8Pakistan 5 233 2,334.7Panama 5 35 10.7Paraguay 4 53 409.8Peru 5 118 521.8Philippines 5 63 466.5Poland 4 143 233.2Puerto Rico 5 32 433.8Qatar 3 90 3.8Romania 7 207 312.8Russian Federation 8 272 4,521.6Saudi Arabia 3 71 78Senegal 6 125 7,007Serbia 4 81 513.4Seychelles 5 132 479.5Sierra Leone 8 441 1,279.1Singapore 5 76 34.2Slovenia 5 38 115.4South Africa 5 171 443.2Spain 4 85 169.6Sri Lanka 4 132 1,548.5St. Kitts and Nevis 4 18 377.3St. Lucia 4 25 469.9St. Vincent and the Grenadines 3 52 459.6Suriname 5 128 745.7Sweden 3 52 21.1Switzerland 3 39 68.8Syrian Arab Republic 5 71 994.2Tajikistan 8 211 1,456.8Tanzania 4 382 251.4Tonga 5 50 128.8Trinidad and Tobago 5 56 53.6Tunisia 4 58 1,136.1Turkey 4 62 812.6Uganda 5 151 5,209.9Ukraine 9 306 262United Arab Emirates 4 55 15.9United Kingdom 5 111 42.2United States 5 48 16.8Uzbekistan 7 123 2,532.8Vietnam 4 127 1,685.1West Bank and Gaza 6 70 1,567.1Yemen, Rep. 4 35 6,926.1Zambia 4 103 1,042.7

33
The two-and-a-half-year project to develop the Getting Electricity pilot indicator set was led by Carolin Geginat, initially under the general direction of Simeon Djankov and Michael Klein and since June 2008 under the direction of Sylvia Solf, Penelope Brook (through May 2009) and Neil Gregory (from June 2009). The core research team comprised Maya Choueiri, Nadia Ram, Jayashree Srini-vasan, Susanne Szymanski and Marina Turlakova.
The report was made possible by the generous contribution of 567 respondents in 140 economies. The respondents included officials at utilities, independent private professionals such as electricians and electrical engineers, and repre-sentatives of construction companies, technical bodies and, in some cases, reg-ulatory agencies. The names of those wishing to be acknowledged individually are listed on the Doing Business website at http://www.doingbusiness.org.
The team is grateful for valuable comments provided by colleagues across the World Bank Group, notably Katharina Gassner, Rita Ramalho, Jordan Schwartz and Dirk Sommer. The team would also like to thank the many regional staff of the World Bank Group who helped establish contacts with local contributors.
Alison Strong copyedited the manuscript. Gerry Quinn designed the report and the graphs.
The online service of the Getting Electricity database is managed by Ramin Ali-yev, Preeti Endlaw, Felipe Iturralde Escudero and Graeme Littler. All knowledge management and outreach activities are under the direction and guidance of Suzanne Smith.
The team is grateful for the generous contribution by the Norwegian Trust Fund that helped finance this new project.
Acknowledgments