Embed Size (px)
Citation preview

A Physics-based Analytical Model for Perovskite Solar Cells
Xingshu Sun1*, Reza Asadpour1, Wanyi Nie2, Aditya D. Mohite2, Muhammad A. Alam1
1School of Electrical and Computer Engineering, Purdue University, West Lafayette, USA 2 Materials Physics and Application Division, Los Alamos National Laboratory, Los Alamos, USA.
Abstract — Perovskites are promising next-generation absorber
materials for low-cost and high-efficiency solar cells. Although perovskite cells are configured similar to the classical solar cells, their operation is unique and requires development of a new
physical model for characterization, optimization of the cells, and prediction of the panel performance. In this paper, we develop such a physics-based analytical model to describe the operation of
different types of perovskite solar cells, explicitly accounting non-uniform generation, carrier selective transport layers, and voltage-dependent carrier collection. The model would allow
experimentalists to characterize key parameters of existing cells, understand performance bottlenecks, and predict performance of perovskite-based solar panel – the obvious next step to the
evolution of perovskite solar cell technology.
Index Terms — analytical model, drift-diffusion, panel simulation, characterization
I. INTRODUCTION
olar cells have emerged as an important source of
renewable energy; further reduction in cost will ensure a
broader and accelerated adoption. Recently, organic-inorganic
hybrid perovskites, such as CH3NH3PbI3, have shown great
promise as new absorber materials for low-cost, highly efficient
solar cells [1]–[3]. Despite a growing literature on the topic,
most of theoretical work to date has been empirical or fully
numerical [4]–[8]. The detailed numerical models provide deep
insights into the operation of the cells and its fundamental
performance bottlenecks; but are generally unsuitable for fast
characterization, screening, and/or prediction of panel
performance. Indeed, the field still lacks an intuitively simple
physics-based analytical model that can interpret the essence of
device operation with relatively few parameters, which can be
used to characterize, screen, and optimize perovskite-based
solar cells, provide preliminary results for more sophisticated
device simulation, and allow panel-level simulation for
pervoksites. This state-of-art reflects the fact that despite a
superficial similarity with p-n [9]–[11] or p-i-n [12]–[14] solar
cells, the structure, self-doping, and charge collection in
perovkite cells are unique, and cannot described by traditional
approaches [15], [16].
In this paper, we present a new physics-based analytical
model that captures the essential features of perovkites cells,
namely, position-dependent photo-generation, the role of
carrier transport layers, e.g., TiO2 and Spiro-OMeTAD, in
blocking charge loss at wrong contacts, voltage-dependent
carrier collection that depends on the degree of self-doping of
the absorber layer, etc. The model is systematically validated
against the four classes of perovkite solar cells reported in the
literature. We demonstrate how the model can be used to obtain
physical parameters of a cell and how the efficiency can be
improved. Our model can be easily converted into a physics-
based equivalent circuit that is essential for accurate and
complex large-scale network simulation to evaluate and
optimize perovskite-based solar modules and panels [13], [17]–
[20].
II. MODEL DEVELOPMENT AND VALIDATION
A typical cell consists of a perovskite absorber layer (300
~ 500 nm), a hole transport layer (p-type), an electron transport
layer (n-type), and front and back contacts, arranged in various
configurations. The traditional structure in Fig. 1 (a, b) has
PEDOT: PSS and PCBM as the front hole transport layer and
the back electron transport layer, respectively; in the inverted
structure, however, TiO2 is the front electron transport layer and
Spiro-OMeTAD is the back hole transport layer, as in Fig. 1 (c,
d). Moreover, for both the traditional and inverted
configurations, it has been argued that the absorber layer in
high-efficiency cells is essentially intrinsic [21], see Fig. 1 (a,c);
the mode of operation changes and the efficiency is reduced for
cells with significant p-type self-doping [22], see Fig. 1 (b,d).
Therefore, perovskite solar cells can be grouped into (Type-1)
p-i-n, (Type-2) p-p-n, (Type-3) n-i-p, (Type-4) n-p-p cells; the
corresponding energy band diagrams are shown in Fig. 1.
It has been suggested that the high dielectric constant of the
persovskites allows the photogenerated excitons to dissociate
immediately into free carriers [23], [24]. The photo-generated
electron and holes then drift and diffuse through the absorber
and transport layers before being collected by the contacts.
Consequently, an analytical model can be developed by solving
the steady state electron and hole continuity equations within
the absorber, namely,
𝐷𝜕2𝑛(𝑥)
𝜕𝑥2 + 𝜇𝐸(𝑥)𝜕𝑛(𝑥)
𝜕𝑥+ 𝐺(𝑥) − 𝑅(𝑥) = 0. (1)
𝐷𝜕2𝑝(𝑥)
𝜕𝑥2 − 𝜇𝐸(𝑥)𝜕𝑝(𝑥)
𝜕𝑥+ 𝐺(𝑥) − 𝑅(𝑥) = 0. (2)
S
This work is supported by the U.S. Department of Energy under DOE
Cooperative Agreement no. DE-EE0004946 (“PVMI Bay Area PV
Consortium”), the National Science Foundation through the NCN-NEEDS program, contract 1227020-EEC, and by the Semiconductor Research
Corporation.
The authors are with the Department of Electrical and Computer Engineering, Purdue University, West Lafayette, IN 47907 USA (e-mail:
[email protected]; [email protected]; [email protected]), the
materials physics and application division, Los Alamos National Laboratory

Here, 𝑛(𝑝) is the electron/hole concentration; 𝐷 and 𝜇 are the
diffusion coefficient and mobility, respectively; and 𝐺(𝑥)
represents the position-dependent photo-generation. The
extraordinarily long diffusion length in perovskite [25]–[27]
ensure that one can ignore carrier recombination within the
absorber layer, i.e., 𝑅(𝑥) = 0. Finally, 𝐸(𝑥) is the position-
resolved electric field within the absorber layer.
As shown in Fig. 1, 𝐸(𝑥) is a constant (linear potential
profile) for type-1 (n-i-p) and type-3 (p-i-n) cells, i.e., the
absence of doping or trapped charges ensure that 𝐸(𝑥) =
(𝑉𝑏𝑖 − 𝑉) 𝑡0⁄ , where 𝑉𝑏𝑖 is the build-in potential and 𝑡0 is the
thickness of the intrinsic layer. For type-2(p-p-n) and type -4
(n-p-p) devices, however, numerical simulation shows that the
field essentially linear within the depletion region, i.e., 𝐸(𝑥) =[1 − 𝑥 𝑊𝑑⁄ ] 𝐸𝑚𝑎𝑥(𝑉), where 𝑊𝑑 is the depletion width and
|𝐸𝑚𝑎𝑥(𝑉)| = 2(𝑉𝑏𝑖 − 𝑉)/𝑊𝑑(𝑉) ; 𝐸(𝑥) = 0 in the neutral
region defined by 𝑥 > 𝑊𝑑 . The position-dependent 𝐸(𝑥) is
reflected in the parabolic potential profiles shown in Fig. 1 (b)
and (d). Our extensive numerical simulation [21] shows that the
photogenerated carriers do not perturb the electric field
significantly, therefore, the following analysis will presume
𝐸(𝑥) is independent of photogeneration at 1-sun illumination.
Neglecting any parasitic reflectance from the back surface,
we approximate the generated profile in the absorber layer as
𝐺(𝑥) = 𝐺𝑒𝑓𝑓𝑒−𝑥/𝜆𝑎𝑣𝑒 , where 𝐺𝑒𝑓𝑓 and 𝜆𝑎𝑣𝑒(~100 nm) are the
material specific constants, averaged over the solar spectrum.
Note that the maximum absorption is 𝐺𝑚𝑎𝑥 =
∫ 𝐺𝑒𝑓𝑓𝑒−𝑥/𝜆𝑎𝑣𝑒∞
0𝑑𝑥 = 𝐺𝑒𝑓𝑓𝜆𝑎𝑣𝑒.
Finally, electron and hole transport layers are considered
perfect conductors for the majority carriers; while they act as
imperfect blocking layers for the minority carriers,
characterized by the effective surface recombination velocity
|𝐽𝑓(𝑏)| = 𝑞𝑠𝑓(𝑏)∆𝑛(𝑝). The ∆𝑛(𝑝) is the excess minority
carrier concentration, and the 𝑠𝑓(𝑏) is the effective surface
recombination velocity at the front (back) transport layer,
accounting for three recombination processes: 1) carrier escape
at the wrong contact; 2) recombination due to the interface
defects; 3) recombination within the bulk of the transport layer.
Remarkably, Eqs. (1) - (2) can be solved analytically to
derive the complete current-voltage characteristics of the four
types of perovkite cell, as follows
Fig. 1. The energy diagram of perovskite solar cells in traditional
structure (PEDOT: PSS/ Perovskite/PCBM): (a) Type-1 (p-i-n)
and (b) Type-2 (p-p-n) and Titania-based inverted cells
(TiO2/Perovskite/Spiro-OMeTAD): (c) Type-3 (n-i-p) and (d)
Type-4 (n-p-p).
(a) p-i-n
Perovskites
(b) p-p-n
PC
BM
Perovskites
Spiro-O
MeTA
D(c) n-i-p
Perovskites
TiO
2
(d) n-p-p
Perovskites
TiO
2 Spiro-O
MeTA
D
PE
DO
T: P
SS
PE
DO
T: P
SS
PC
BM
Co
nta
ct
Co
nta
ct
Co
nta
ct
Co
nta
ct
Co
nta
ct
Co
nta
ct
Co
nta
ct
Co
nta
ct
TABLE I. Model parameters of Eqs. (5)-(7) expressed in terms of the physical parameters of the cell. Here, (𝑉′ = 𝑞(𝑉 − 𝑉𝑏𝑖)/𝑘𝑇; 𝛽𝑓(𝑏) =
𝐷/(𝑡𝑜 × 𝑠𝑓(𝑏)); 𝑚 = 𝑡𝑜/𝜆𝑎𝑣𝑒; 𝑛 = 𝑊𝑑(0 𝑉)/𝑡𝑜; ∆= 1 − 𝑛√(𝑉𝑏𝑖 − 𝑉)/𝑉𝑏𝑖. The meaning of the parameters has been discussed in the text.
Variables p-i-n / n-i-p p-p-n n-p-p
1/𝛼𝑓
𝑒𝑉′
− 1
𝑉′+ 𝛽𝑓
∆ + 𝛽𝑓 (𝑉 ≤ 𝑉𝑏𝑖) ∆ × 𝑒𝑉′+ 𝛽𝑓 (𝑉 ≤ 𝑉𝑏𝑖)
𝑒𝑉′− 1
𝑉′+ 𝛽𝑓 (𝑉 > 𝑉𝑏𝑖)
1/𝛼𝑏 𝑒𝑉′− 1
𝑉′+ 𝛽𝑏
∆ × 𝑒𝑉′+ 𝛽𝑏 (𝑉 ≤ 𝑉𝑏𝑖) ∆ + 𝛽𝑏 (𝑉 ≤ 𝑉𝑏𝑖)
𝑒𝑉′− 1
𝑉′+ 𝛽𝑏 (𝑉 > 𝑉𝑏𝑖)
A 𝑎𝑓 × (
(1 − 𝑒𝑉′−𝑚)
𝑉′ − 𝑚− 𝛽𝑓) 𝛼𝑓 × (
1
𝑚(𝑒−𝑚×∆ − 1)−𝛽𝑓) (𝑉 ≤ 𝑉𝑏𝑖) 𝛼𝑓 × (
𝑒𝑉′
𝑚(𝑒−𝑚 − 𝑒𝑚×(∆−1)) − 𝛽𝑓) (𝑉 ≤ 𝑉𝑏𝑖)
𝑎𝑓 × ((1 − 𝑒𝑉′−𝑚)
𝑉′ − 𝑚− 𝛽𝑓) (𝑉 > 𝑉𝑏𝑖)
B 𝑎𝑏 × (
(1 − 𝑒𝑉′+𝑚)
𝑉′ + 𝑚− 𝛽𝑏) 𝛼𝑏 × (
𝑒𝑉′
𝑚(𝑒−𝑚×(∆−1) − 𝑒𝑚) − 𝛽𝑏) (𝑉 ≤ 𝑉𝑏𝑖) 𝛼𝑏 × (
1
𝑚(1 − 𝑒𝑚×∆) − 𝛽𝑏) (𝑉 ≤ 𝑉𝑏𝑖)
𝑎𝑏 × ((1 − 𝑒𝑉′+𝑚)
𝑉′ + 𝑚− 𝛽𝑏) (𝑉 > 𝑉𝑏𝑖)

𝐽𝑑𝑎𝑟𝑘 = (𝛼𝑓 × 𝐽𝑓0 + 𝛼𝑏 × 𝐽𝑏0) (𝑒𝑞𝑉
𝑘𝑇 − 1), (3)
𝐽𝑝ℎ𝑜𝑡𝑜 = 𝑞𝐺𝑚𝑎𝑥(𝐴 − 𝐵𝑒−𝑚), (4)
𝐽𝑙𝑖𝑔ℎ𝑡 = 𝐽𝑑𝑎𝑟𝑘 + 𝐽𝑝ℎ𝑜𝑡𝑜. (5)
The parameters of the model, namely, 𝛼𝑓(𝑏), 𝛽𝑓(𝑏), 𝐴(𝐵),
𝑚, 𝑛, and ∆ are functions of the following physical parameters
of the cell (see Table I): 𝑡0 is the thickness of the absorber layer;
𝐽𝑓0(𝑏0) is the dark diode current recombining at the front/back
transport layer; 𝑉𝑏𝑖 is the built in potential across the absorber
layer; D is the diffusion coefficient; 𝑠𝑓(𝑏)is the effective surface
recombination velocity at the front/back interface; 𝑊𝑑(0 V) is
the equilibrium depletion width for self-doped devices; and
𝐺𝑚𝑎𝑥 is the maximum absorption.
Among these parameters, 𝐺𝑚𝑎𝑥 is obtained by integrating
the position-dependent photon absorption calculated by the
transfer matrix method [28] (here q𝐺𝑚𝑎𝑥 = 23 mA/cm2); 𝐷 ≈
0.05 cm2s−1 is known for the material system for both electron
and hole [26]; 𝑉𝑏𝑖 can be estimated either by using the
capacitance-voltage characteristics [22] or by using the
crossover voltage of the dark and light IV [29]. The effective
surface recombination velocities can be fitted using the
photogenerated current 𝐽𝑝ℎ𝑜𝑡𝑜(𝐺, 𝑉) = 𝐽𝑙𝑖𝑔ℎ𝑡(𝐺, 𝑉) −
𝐽𝑑𝑎𝑟𝑘(𝑉) [30]. Finally, we can obtain the dark diode current
𝐽𝑓0/𝑏0 by fitting the dark current.
In order to validate the model, we fit both dark and light IV
characteristics for four different perovskite cells using the
model as shown in Fig. 2. See the supplementary material for
the details of the fitting algorithm implemented in Matlab®.
Samples #1 (15.7 %) and #2 (11.1 %) are solution-based PCBM
based architecture (Type-1 and Type-2) [21], whereas samples
#3 (15.4 %) and #4 (8.6 %) are titania-based inverted
architecture (Type-3 and Type-4) fabricated by vapor
deposition and solution process, respectively [31]. The fitting
parameters obtained for the four samples are summarized in
Table II. Remarkably, the analytical model not only reproduces
the key features of the I-V characteristics of very different cell
geometries, but also captures very well the known physical
parameters of the cell (e.g. thickness of the absorber).
III. RESULTS AND DISCUSSION
Fig. 2(b,d) shows that the light IV of the self-doped devices
has a steep decrease (~ 0 V – 0.5 V) in photocurrent much
before the maximum power point (MPP). Indeed, this
characteristic feature can be correlated to self-doping effects
arising from the defects or impurities introduced during the
manufacture of the cell. Our model interprets this linear
decrease in photocurrent of type-2 and type-4 cells to the well-
known voltage-dependent reduction of 𝑊𝑑(𝑉) (also the charge
collection region) of a PN junction. Without a physics-based
model, this feature can be easily mistaken as a parasitic
resistance. The self-doped devices also have an inferior 𝑉𝑏𝑖 and
greater 𝐽𝑓0(𝑏0) that leads to a lower VOC, compared to the
intrinsic cells with the same configuration, see Table II. Hence,
the main factor that limits the performance of samples #2 and
#4 is the reduction of charge collection efficiency due to self-
doping effect.
While examining the intrinsic samples #1 and #3, we note
that #1 has the highest fill-factor (FF), but its 𝑉𝑂𝐶 is 0.3V
smaller than that of #3. The reduction in 𝑉𝑜𝑐 can be explained
by lower 𝑉𝑏𝑖 and higher 𝐽𝑓0(𝑏0) caused by the combination of
band misalignment and lower doping concentration in the
transport layers of the perovskite cells with the traditional
Fig. 2. (a) Samples #1 (Type-1 (p-i-n), Efficiency = 15.7%, JSC =
22.7 mA/cm2, VOC = 0.85 V, FF = 81%). (b) Samples #2 (Type-2
(p-p-n), Efficiency = 11.1%, JSC = 21.9 mA/cm2, VOC = 0.75 V,
FF = 64%). (c) Samples #3 (Type-3 (n-i-p), Efficiency = 15.4%,
JSC = 21.5 mA/cm2, VOC = 1.07 V, FF = 67%). (d) Samples #4
(Type-4 (n-p-p), Efficiency = 8.6%, JSC = 17.6 mA/cm2, VOC =
0.84 V, FF = 58%). Note that i) 𝐺𝑚𝑎𝑥 = 23 mA/cm2 is used. ii)
Negligible parasitic resistors ( 𝑅𝑠𝑒𝑟𝑖𝑒𝑠 and 𝑅𝑠ℎ𝑢𝑛𝑡 ) except in
samples #4.
#3 (model)
#3 (measured)
(c)
#4 (model)
#4 (measured)
(d)
#1 (model)
#1 (measured)
(a)
#2 (model)
#2 (measured)
(b)
TABLE II. Extracted physical parameters of samples #1
(Fig 2 (a)), #2 (Fig 2 (b)), #3 (Fig 2 (c)), and #4 (Fig 2 (d)).
Sample #1 #2 #3 #4
Type p-i-n p-p-n n-i-p n-p-p
𝑡𝑜 (nm) 450 400 310 147
𝐽𝑓0 (mA/cm2) 2.7× 10⁻¹³
4× 10⁻¹²
1.6× 10⁻¹⁷
6× 10⁻¹⁵
𝐽𝑏0 (mA/cm2) 4× 10⁻¹³
5× 10⁻¹³
4.8× 10⁻¹⁷
4.1× 10⁻¹³
𝑉𝑏𝑖 (V) 0.78 0.67 1 0.75
𝑠𝑓 (cm/s) 2 × 10² 5 × 10² 1 × 10⁴ 13.1
𝑠𝑏 (cm/s) 19.2 8.6× 10²
5.4 ∞
𝑊𝑑𝑒𝑝𝑙𝑒𝑡𝑖𝑜𝑛(0 V)
(nm)
/ 300 / 146

structure, which is the major performance limitation of #1.
Sample #3, on the other hand, has the lower fill-factor, arising
from relatively high effective surface recombination velocities
at both contacts, indicating insufficient blocking of charge loss
to the wrong contact. Even though #1 and #3 have similar
efficiencies, our model demonstrates that the fundamental
performance limitations are completely different.
Using the model, we can also extract the thicknesses of the
four samples, which are in the expected range (~350 nm – 500
nm for #1 and #3, ~ 330 nm for #2) [21], [31]. Among the
samples, there is also a strong correlation between the absorber
thickness 𝑡0 and 𝐽𝑆𝐶 , related to the completeness of the
absorption. Moreover, we observe significant shunt resistance
( 𝑅𝑠ℎ𝑢𝑛𝑡 = 1 kΩ. cm2 ) in sample #4, which agrees with the
reports [31] that thin absorber might lead to shunting pinholes.
Further, except for sample #4, all devices have relatively poor
(high) 𝑠𝑓𝑟𝑜𝑛𝑡 , which may be caused by insufficient barrier
between PEDOT:PSS and perovskites [21] as well as low
carrier lifetime in TiO2 [32].
Once we extract the physical parameters associated with
high-efficiency samples (#1 and #3) with essentially intrinsic
absorbers, it is natural to ask if the efficiency could be improved
further, and if so, what factors would be most important. The
physics-based compact model allows us to explore the phase-
space of efficiency as a function of various parameters, as
follows.
For example, while keeping all other parameter equal to the
values extracted in Table II, one can explore the importance of
absorber thickness on cell efficiency, see Fig. 3. Our model
shows that both samples are close to their optimal thickness,
though there is incomplete absorption (𝐽𝑆𝐶 < q𝐺𝑚𝑎𝑥). Thinner
absorber cannot absorb light completely, while thicker absorber
suppresses charge collection and degrades the fill factor. This
is because the competition between the surface recombination
and the electric field determines the carrier collection efficiency
near the interface, and electric field 𝐸 = (𝑉𝑏𝑖 − 𝑉)/𝑡𝑜
decreases with the thickness. To summarize, for the samples
considered, thickness optimization would not improve
performance.
Similarly, we can investigate the effects of the front/back
surface recombination velocities on device efficiencies, with all
other parameters kept fixed to those in Table II. The deduced
surface recombination velocities for samples #1 and #3 are
listed in Table II as well as labeled as black dots in Fig. 4. The
results suggests that, in principle, improving the front surface
recombination velocities by two orders of magnitude can boost
the efficiency by ~ 3% and even ~5% for samples #1 and #3,
respectively. Any potential improvement in the back selective
blocking layer, however, offers very little gain, since most of
the photo-generation occurs close to the front contact. Hence,
engineering the front transport layer would be essential in
further improvement of cell efficiencies.
But even with the optimal surface recombination
velocities, we are still not close to the thermodynamic limit (~
30%), see Fig. 4. Towards this goal, one must improve the JSC,
FF, and VOC (thermodynamic limit: 𝐽𝑆𝐶 ~ 26 mA/cm2, FF
~90%, VOC ~ 1.3 V [33]). One may reduce the parasitic
absorption loss in the transport layers, which can increase 𝐺𝑚𝑎𝑥
in Eq. (4), to improve the 𝐽𝑆𝐶; one may still improve the FF by
increasing the charge diffusion coefficient 𝐷, since it is mainly
the variable 𝛽𝑓(𝑏) = 𝐷/(𝑡𝑜 × 𝑠𝑓(𝑏)) that determines the FF;
one may also increase the built-in potential 𝑉𝑏𝑖 , through
adjusting the band alignment at the interface as well as
increasing the doping of the transport layers, to improve the
VOC.
V. CONCLUSIONS
We have derived an analytical model that describes both
dark and light current-voltage characteristics for four different
types [p-i-n/p-p-n and n-i-p/n-p-p] of perovskite solar cells. An
important contribution of the model is that, along with other
measurement techniques, it provides a simple and
complementary approach to characterize, optimize, and screen
fabricated cells. Physical parameters that cannot be directly
measured, such as 𝑉𝑏𝑖 of a p-i-n device, can also be deduced
using the model.
Apart from determining the parameters of an existing cell
and suggesting opportunities for further improvement, an
analytical compact model serves another fundamental need,
namely, the ability to predict the ultimate performance of the
panel composed of individual perovsite cells. Panel efficiency
Fig. 3. (a) Efficiency vs. absorber thickness for samples #1 and
#3. (b) Fill factor vs. absorber thickness for samples #1 and #3.
sample #1
sample #3
(a) (b)
sample #1
sample #3
Fig. 4. (a) Contour plot of the front/back surface recombination
velocities vs. efficiency for sample #1. (b) Contour plot of the
front/back surface recombination velocities vs. efficiency for
sample #3.
(a) (b)Sample #1 Sample #3

is ultimately dictated by process variation reflected in various
parameters (as in Table II) as well as statistical distribution of
shunt and series resistances [13], [34]. Indeed, recent studies
[35], [36] show large efficiency gap between perovskites-based
solar cells and modules – an equivalent circuit based on the
physics-based analytical model developed in this paper will be
able to trace the cell-module efficiency gap to statistical
distribution of one or more cell parameters and suggest
opportunities for improvement. Closing this cell-to-module
gap is the obvious next step and an essential pre-requisite for
eventual commercial viability of the perovskite solar cells.
ACKNOWLEDGEMENT
The authors would like to thank Raghu Chavali and Ryyan
Khan for helpful discussion and Professor Mark Lundstrom for
kind guidance.
REFERENCES
[1] S. Kazim, M. K. Nazeeruddin, M. Grätzel, and S. Ahmad,
“Perovskite as light harvester: a game changer in photovoltaics.,”
Angew. Chem. Int. Ed. Engl., vol. 53, no. 11, pp. 2812–24, Mar. 2014. [2] M. A. Green, A. Ho-Baillie, and H. J. Snaith, “The emergence of
perovskite solar cells,” Nat. Photonics, vol. 8, no. 7, pp. 506–514,
Jun. 2014. [3] R. F. Service, “Energy technology. Perovskite solar cells keep on
surging.,” Science, vol. 344, no. 6183, p. 458, May 2014.
[4] T. Minemoto and M. Murata, “Impact of work function of back contact of perovskite solar cells without hole transport material
analyzed by device simulation,” Curr. Appl. Phys., vol. 14, no. 11,
pp. 1428–1433, Nov. 2014. [5] F. De Angelis, “Modeling Materials and Processes in Hybrid/Organic
Photovoltaics: From Dye-Sensitized to Perovskite Solar Cells.,” Acc.
Chem. Res., May 2014. [6] T. Minemoto and M. Murata, “Theoretical analysis on effect of band
offsets in perovskite solar cells,” Sol. Energy Mater. Sol. Cells, vol.
133, pp. 8–14, Feb. 2015. [7] B. Tripathi, P. Bhatt, P. Chandra Kanth, P. Yadav, B. Desai, M.
Kumar Pandey, and M. Kumar, “Temperature induced structural,
electrical and optical changes in solution processed perovskite material: Application in photovoltaics,” Sol. Energy Mater. Sol.
Cells, vol. 132, pp. 615–622, Jan. 2015.
[8] J. M. Foster, H. J. Snaith, T. Leijtens, and G. Richardson, “A model for the operation of perovskite based hybrid solar cells: formulation,
analysis and comparison to experiment,” vol. 74, no. 6, pp. 1935–
1966, 2014. [9] W. W. Gärtner, “Depletion-layer photoeffects in semiconductors,”
Phys. Rev., vol. 116, pp. 84–87, 1959.
[10] X. X. Liu and J. R. Sites, “Solar-cell collection efficiency and its variation with voltage,” J. Appl. Phys., vol. 75, no. 1, p. 577, Jan.
1994.
[11] S. Hegedus, D. Desai, and C. Thompson, “Voltage dependent
photocurrent collection in CdTe/CdS solar cells,” Prog.
Photovoltaics Res. Appl., vol. 15, no. 7, pp. 587–602, Nov. 2007. [12] R. S. Crandall, “Modeling of thin film solar cells: Uniform field
approximation,” J. Appl. Phys., vol. 54, no. 12, p. 7176, 1983.
[13] S. Dongaonkar and M. A. Alam, “End to end modeling for variability and reliability analysis of thin film photovoltaics,” in IEEE
International Reliability Physics Symposium Proceedings, 2012.
[14] S. S. Hegedus, “Current-voltage analysis of a-Si and a-SiGe solar cells including voltage-dependent photocurrent collection,” Prog.
Photovoltaics, vol. 5, no. 3, pp. 151–168, 1997.
[15] M. Hejri, H. Mokhtari, M. R. Azizian, M. Ghandhari, and L. Soder, “On the Parameter Extraction of a Five-Parameter Double-Diode
Model of Photovoltaic Cells and Modules,” IEEE J. Photovoltaics,
vol. 4, no. 3, pp. 915–923, May 2014.
[16] K. Ishaque, Z. Salam, and H. Taheri, “Simple, fast and accurate two-
diode model for photovoltaic modules,” Sol. Energy Mater. Sol. Cells, vol. 95, no. 2, pp. 586–594, 2011.
[17] S. Dongaonkar, C. Deline, and M. A. Alam, “Performance and
reliability implications of two-dimensional shading in monolithic thin-film photovoltaic modules,” IEEE J. Photovoltaics, vol. 3, no. 4,
pp. 1367–1375, 2013.
[18] K. Brecl and M. Topič, “Simulation of losses in thin-film silicon modules for different configurations and front contacts,” Prog.
Photovoltaics Res. Appl., vol. 16, no. 6, pp. 479–488, 2008.
[19] K. Brecl, M. Topič, and F. Smole, “A detailed study of monolithic contacts and electrical losses in a large-area thin-film module,” Prog.
Photovoltaics Res. Appl., vol. 13, no. 4, pp. 297–310, Jun. 2005.
[20] G. T. Koishiyev and J. R. Sites, “Impact of sheet resistance on 2-D modeling of thin-film solar cells,” Sol. Energy Mater. Sol. Cells, vol.
93, no. 3, pp. 350–354, Mar. 2009.
[21] W. Nie, H. Tsai, R. Asadpour, J.-C. Blancon, A. J. Neukirch, G. Gupta, J. J. Crochet, M. Chhowalla, S. Tretiak, M. A. Alam, H.-L.
Wang, and A. D. Mohite, “High-efficiency solution-processed
perovskite solar cells with millimeter-scale grains,” Science (80-. )., vol. 347, no. 6221, pp. 522–525, Jan. 2015.
[22] A. Guerrero, E. J. Juarez-Perez, J. Bisquert, I. Mora-Sero, and G.
Garcia-Belmonte, “Electrical field profile and doping in planar lead halide perovskite solar cells,” Appl. Phys. Lett., vol. 105, no. 13, p.
133902, Sep. 2014.
[23] V. D’Innocenzo, G. Grancini, M. J. P. Alcocer, A. R. S. Kandada, S. D. Stranks, M. M. Lee, G. Lanzani, H. J. Snaith, and A. Petrozza,
“Excitons versus free charges in organo-lead tri-halide perovskites.,” Nat. Commun., vol. 5, p. 3586, 2014.
[24] M. M. Lee, J. Teuscher, T. Miyasaka, T. N. Murakami, and H. J.
Snaith, “Efficient hybrid solar cells based on meso-superstructured organometal halide perovskites.,” Science, vol. 338, no. 6107, pp.
643–7, Nov. 2012.
[25] Q. Dong, Y. Fang, Y. Shao, P. Mulligan, J. Qiu, L. Cao, and J. Huang, “Electron-hole diffusion lengths >175 m in solution grown
CH3NH3PbI3 single crystals,” Science (80-. )., no. January, pp. 1–8,
2015. [26] S. D. Stranks, G. E. Eperon, G. Grancini, C. Menelaou, M. J. P.
Alcocer, T. Leijtens, L. M. Herz, A. Petrozza, and H. J. Snaith,
“Electron-hole diffusion lengths exceeding 1 micrometer in an organometal trihalide perovskite absorber.,” Science, vol. 342, no.
6156, pp. 341–4, Oct. 2013.
[27] V. Gonzalez-Pedro, E. J. Juarez-Perez, W.-S. Arsyad, E. M. Barea, F. Fabregat-Santiago, I. Mora-Sero, and J. Bisquert, “General
Working Principles of CH3NH3PbX3 Perovskite Solar Cells.,” Nano
Lett., vol. 14, no. 2, pp. 888–93, Mar. 2014. [28] L. A. a. Pettersson, L. S. Roman, O. Inganäs, and O. Inganäs,
“Modeling photocurrent action spectra of photovoltaic devices based
on organic thin films,” J. Appl. Phys., vol. 86, no. 1, p. 487, 1999. [29] J. E. Moore, S. Dongaonkar, R. Vamsi, K. Chavali, S. Member, M.
A. Alam, and M. S. Lundstrom, “Correlation of Built-In Potential and
I – V Crossover in Thin-Film Solar Cells,” vol. 4, no. 4, pp. 1138–1148, 2014.
[30] J. L. G. R. V. K. Chavali, J. E. Moore, X. Wang, M. A. Alam, M. S.
Lundstrom, “Frozen Potential Approach to Separate the Photo-Current and Diode Injection Current in Solar Cells,” IEEE J.
Photovoltaics, 2015.
[31] M. Liu, M. B. Johnston, and H. J. Snaith, “Efficient planar
heterojunction perovskite solar cells by vapour deposition.,” Nature,
vol. 501, no. 7467, pp. 395–8, Sep. 2013.
[32] Y. Zhao and K. Zhu, “Charge Transport and Recombination in Perovskite (CH 3 NH 3 )PbI 3 Sensitized TiO 2 Solar Cells,” J. Phys.
Chem. Lett., vol. 4, no. 17, pp. 2880–2884, Sep. 2013.
[33] M. A. Alam and M. Ryyan Khan, “Fundamentals of PV efficiency interpreted by a two-level model,” Am. J. Phys., vol. 81, no. 9, p. 655,
Sep. 2013.
[34] S. Dongaonkar, S. Loser, E. J. Sheets, K. Zaunbrecher, R. Agrawal, T. J. Marks, and M. a. Alam, “Universal statistics of parasitic shunt
formation in solar cells, and its implications for cell to module
efficiency gap,” Energy Environ. Sci., vol. 6, no. 3, pp. 782–787, 2013.
[35] F. Di Giacomo, V. Zardetto, A. D’Epifanio, S. Pescetelli, F.
Matteocci, S. Razza, A. Di Carlo, S. Licoccia, W. M. M. Kessels, M. Creatore, and T. M. Brown, “Flexible Perovskite Photovoltaic

Modules and Solar Cells Based on Atomic Layer Deposited Compact
Layers and UV-Irradiated TiO 2 Scaffolds on Plastic Substrates,” Adv. Energy Mater., p. n/a–n/a, 2015.
[36] F. Matteocci, L. Cinà, F. Di Giacomo, S. Razza, A. L. Palma, A.
Guidobaldi, A. D’Epifanio, S. Licoccia, T. M. Brown, A. Reale, and A. Di Carlo, “High efficiency photovoltaic module based on
mesoscopic organometal halide perovskite,” Prog. Photovoltaics
Res. Appl., vol. 20, no. 1, pp. 6–11, 2014.

1
A Physics-based Analytical Model for Perovskite Solar Cells
Xingshu Sun1, Reza Asadpour1, Wanyi Nie2, Aditya D. Mohite2 and Muhammad A.
Alam1.
1Purdue University School of Electrical and Computer Engineering, West Lafayette, IN, 47907, USA.
2Materials Physics and Application Division, Los Alamos National Laboratory, Los Alamos, NM 87545, USA.
Supplementary Information
1. Derivation of Eqs. (5) to (7)
Here we will discuss the analytical derivation of the dark and light IV for perovskite solar cells.
1.1 Intrinsic absorber: Type 1 (p-i-n) and Type 3 (n-i-p), see Fig. S1.1
Figure S1.1 (a) The energy diagram of (a) Type 1 (p-i-n) and (b) Type 3 (n-i-p) perovskite cells
We will begin with solving the electron and hole continuity equations given in [1]
𝜕𝑛
𝜕𝑡=
1
𝑞
𝜕𝐽𝑛
𝜕𝑥+ 𝐺(𝑥) − 𝑅(𝑥), (S1.1)
𝜕𝑝
𝜕𝑡= −
1
𝑞
𝜕𝐽𝑝
𝜕𝑥+ 𝐺(𝑥) − 𝑅(𝑥), (S1.2)
where 𝑛 and 𝑝 are the electron and hole concentrations, G(x) and R(x) denote the generation and
recombination processes, and 𝐽𝑛 and 𝐽𝑝 are the electron and hole currents expressed as follows:
𝐽𝑛 = 𝑞𝜇𝑛𝑛𝐸 + 𝑞𝐷𝑛𝜕𝑛
𝜕𝑥, (S1.3)
(a) p-i-n
Perovskites
PC
BM
PE
DO
T: P
SS
Co
nta
ct
Co
nta
ct S
piro
-OM
eTA
D(b) n-i-p
Perovskites
TiO
2
Co
nta
ct
Co
nta
ct

2
𝐽𝑝 = 𝑞𝜇𝑝𝑝𝐸 − 𝑞𝐷𝑝𝜕𝑝
𝜕𝑥. (S1.4)
In Eqs. (S1.3) and (S1.4), 𝐸 is the electric field, 𝜇𝑛 and 𝜇𝑝 are the electron and hole motilities, 𝐷𝑛
and 𝐷𝑝 are the electron and hole diffusion coefficients, respectively.
Assuming that the bulk recombination is negligible (𝑖. 𝑒., 𝑅(𝑥) = 0) [2], Eqs. (S1.1) to (S1.4)
reduce to,
𝐷𝑛𝜕2𝑛
𝜕𝑥2+ 𝜇𝑛𝐸
𝜕𝑛
𝜕𝑥+ 𝐺(𝑥) = 0, (S1.5)
𝐷𝑝𝜕2𝑝
𝜕𝑥2− 𝜇𝑝𝐸
𝜕𝑝
𝜕𝑥+ 𝐺(𝑥) = 0. (S1.6)
To solve the equations, we first need to calculate 𝐸 by solving the Poisson equation, and the
generation profile, 𝐺(𝑥), by solving the Maxwell equations.
The Poisson equation is written as
𝜕2𝜙
𝜕𝑥2 = −𝜌
𝜖. (S1.7)
Assuming that the absorber is intrinsic (so that 𝜌 = 0), therefore, 𝜙(𝑥) = 𝑎𝑥. Since the voltage
drops primarily across the absorber layer, therefore, 𝜙(𝑥 = 0) = 0 𝑎𝑛𝑑 𝜙(𝑥 = 𝑡0) = 𝑉𝑏𝑖 − 𝑉 in
the p-i-n structure. Hence, we can express the electric field as 𝑎 =𝑉𝑏𝑖−𝑉
𝑡0=
𝑑𝜙
𝑑𝑥= −𝐸, so that 𝐸 =
(𝑉 − 𝑉𝑏𝑖)/𝑡𝑜. Recall that 𝑉𝑏𝑖 is the built-in potential across the absorber that is mainly determined
by the doping of the selective transport layers as well as the band alignment at the interface, and
𝑡𝑜 is the absorber thickness, see Fig. S1.2 (a).
The generation profile within the absorber can be approximated as 𝐺(𝑥) = 𝐺𝑒𝑓𝑓𝑒−𝑥/𝜆𝑎𝑣𝑒 , provided
one neglects back reflectance, see Fig. S1.2 (b). The optical absorption depends on the photon
wavelength; 𝜆𝑎𝑣𝑒 should be interpreted as the average optical decay length that accounts for the
whole solar spectrum.

3
Figure S1.2 (a) The energy diagram of a p-i-n cell with boundary conditions labeled. (b) The approximated
generation profile in the absorber.
After inserting 𝐸 and 𝐺(𝑥) in Eqs. (S1.5) and (S1.6), the general solutions are given by
𝑛(𝑥) = 𝐴𝑛𝑒−𝜀𝑜𝑥 +𝐺𝑛𝜆𝑎𝑣𝑒
2 𝑒−
𝑥𝜆𝑎𝑣𝑒
𝜀𝑜𝑥−1+ 𝐵𝑛, (S1.9)
𝑝(𝑥) = 𝐴𝑝𝑒𝜀𝑜𝑥 −𝐺𝑝𝜆𝑎𝑣𝑒
2 𝑒−
𝑥𝜆𝑎𝑣𝑒
𝜀𝑜𝑥+1+ 𝐵𝑝, (S1.10)
where 𝜀𝑜 ≡ 𝑞𝐸/𝑘𝑇 is the normalized electric field, 𝐺𝑛 ≡𝐺𝑒𝑓𝑓
𝐷𝑛 and 𝐺𝑝 ≡
𝐺𝑒𝑓𝑓
𝐷𝑝 represent the
normalized generation rates, 𝐴𝑛(𝑝) and 𝐵𝑛(𝑝) are constants to be determined from the boundary
conditions.
In the case of Type 1 (p-i-n), the boundary conditions for Eqs. (S1.9) and (S1.10) at 𝑥 = 0 and
𝑥 = 𝑡𝑜 are depicted in Fig. S1.2 (a), where the effective doping concentration 𝑁𝐴,𝑒𝑓𝑓 and 𝑁𝐷,𝑒𝑓𝑓
are the equilibrium hole and electron concentrations at the ends of the i-layer. The concentrations
are determined by the doping and the electron affinities of the transport layers, the built-in potential
is 𝑉𝑏𝑖 =𝑘𝑇
𝑞log (
𝑁𝐴,𝑒𝑓𝑓𝑁𝐷,𝑒𝑓𝑓
𝑛𝑖2 ) , and 𝑠𝑛 and 𝑠𝑝 are the minority carrier surface recombination
velocities.
Using the boundary conditions, we solve for 𝐵𝑛 and 𝐵𝑝 as
(a) (b)

4
𝐵𝑛 =𝑁𝐷,𝑒𝑓𝑓𝑒𝜀𝑜𝑡𝑜−
𝑛𝑖2
𝑁𝐴,𝑒𝑓𝑓+
𝐺𝑛𝜆𝑎𝑣𝑒𝜀𝑜𝑡𝑜−1
(𝜆𝑎𝑣𝑒−𝐷𝑛𝜀𝑜𝑡𝑜−1
𝑠𝑛−𝜆𝑎𝑣𝑒𝑒
𝜀𝑜𝑡−𝑡𝑜
𝜆𝑎𝑣𝑒)
𝑒𝜀𝑜𝑡𝑜−1+𝜀𝑜𝜇𝑛
𝑠𝑛
𝑘𝑇
𝑞
, (S1.11)
𝐵𝑝 =𝑁𝐴,𝑒𝑓𝑓𝑒𝜀𝑜𝑡𝑜−
𝑛𝑖2
𝑁𝐷,𝑒𝑓𝑓−
𝐺𝑝𝜆𝑎𝑣𝑒
𝜀𝑜𝑡𝑜+1𝑒
−𝑡𝑜
𝜆𝑎𝑣𝑒(𝜆𝑎𝑣𝑒−𝐷𝑝𝜀𝑜𝑡𝑜+1
𝑠𝑝−𝜆𝑎𝑣𝑒𝑒
𝜀𝑜𝑡−𝑡𝑜
𝜆𝑎𝑣𝑒)
𝑒𝜀𝑜𝑡𝑜−1+𝜀𝑜𝜇𝑝
𝑠𝑝
𝑘𝑇
𝑞
. (S1.12)
Now utilizing Eqs. (S1.3) and (S1.4), the current density 𝐽 = 𝐽(0) = 𝐽𝑛(0) + 𝐽𝑝(0) can be
expressed as 𝐽 = 𝑞𝐸(𝜇𝑛𝐵𝑛 + 𝜇𝑝𝐵𝑝) . Substituting Eqs. (S1.11) and (S1.12), we can find the
current divided into two parts, a dark diode 𝐽𝑑𝑎𝑟𝑘 (independent of generation), and a voltage-
dependent photocurrent 𝐽𝑝ℎ𝑜𝑡𝑜 so that,
𝐽𝑑𝑎𝑟𝑘 = (𝐽𝑓0
𝑒𝑉′−1
𝑉′+𝛽𝑓
+𝐽𝑏0
𝑒𝑉′−1
𝑉′+𝛽𝑏
)(𝑒𝑞𝑉
𝑘𝑇 − 1), (S1.13)
𝐽𝑝ℎ𝑜𝑡𝑜 = 𝑞𝐺𝑚𝑎𝑥(
(1−𝑒𝑉′−𝑚)
𝑉′−𝑚−𝛽𝑓
𝑒𝑉′−1
𝑉′ +𝛽𝑓
−
(1−𝑒𝑉′+𝑚)
𝑉′+𝑚−𝛽𝑏
𝑒𝑉′−1
𝑉′+𝛽𝑏
𝑒−𝑚), (S1.14)
𝐽𝑙𝑖𝑔ℎ𝑡 = 𝐽𝑑𝑎𝑟𝑘 + 𝐽𝑝ℎ𝑜𝑡𝑜. (S1.15)
Here, 𝐽𝑓0(𝑏0) = 𝑞𝑛𝑖
2
𝑁𝐴,𝑒𝑓𝑓(𝐷,𝑒𝑓𝑓)
𝐷𝑛(𝑝)
𝑡𝑜 is the diode current for electrons and holes recombining at the
front or back contact; 𝛽𝑓(𝑏) =𝐷𝑛(𝑝)
𝑡𝑜𝑠𝑛(𝑝) depends on the diffusion coefficient and surface
recombination velocities; 𝑚 =𝑡𝑜
𝜆𝑎𝑣𝑒 is the ratio of the absorber thickness and the average
absorption decay length; 𝐺𝑚𝑎𝑥 = 𝐺𝑒𝑓𝑓𝜆𝑎𝑣𝑔 is the maximum generation ( 𝐺𝑚𝑎𝑥 =
∫ 𝐺𝑒𝑓𝑓𝑒−𝑥/𝜆𝑎𝑣𝑔𝑑𝑥∞
𝑜); 𝑉′ represents 𝑞(𝑉 − 𝑉𝑏𝑖)/𝑘𝑇.
Eqs. (S1.13) to (S1.15) can be further simplified to
𝛼𝑓(𝑏) = 1/(𝑒𝑉′
−1
𝑉′ + 𝛽𝑓(𝑏)), (S1.16)
𝐴 = 𝛼𝑓 × ((1−𝑒𝑉′−𝑚)
𝑉′−𝑚− 𝛽𝑓), (S1.17)
𝐵 = 𝛼𝑏 × ((1−𝑒𝑉′+𝑚)
𝑉′+𝑚− 𝛽𝑏). (S1.18)
Consequently,
𝐽𝑑𝑎𝑟𝑘 = (𝛼𝑓 × 𝐽𝑓0 + 𝛼𝑏 × 𝐽𝑏0)(𝑒𝑞𝑉
𝑘𝑇 − 1), (S1.19)
5
𝐽𝑝ℎ𝑜𝑡𝑜 = 𝑞𝐺𝑚𝑎𝑥(𝐴 − 𝐵𝑒−𝑚). (S1.20)
Similarly, one can derive the equations for Type 3 (n-i-p) perovskite solar cells with different
boundary conditions (i.e., 𝐽𝑝(𝑜) = 𝑞𝑠𝑝 (𝑛𝑖 −𝑛𝑖
2
𝑁𝐷,𝑒𝑓𝑓) and 𝑛(0) = 𝑁𝐷,𝑒𝑓𝑓 ; 𝐽𝑛(𝑡𝑜) = 𝑞𝑠𝑛(𝑛𝑖 −
𝑛𝑖2
𝑁𝐴,𝑒𝑓𝑓) and 𝑝(𝑡𝑜) = 𝑁𝐴,𝑒𝑓𝑓).
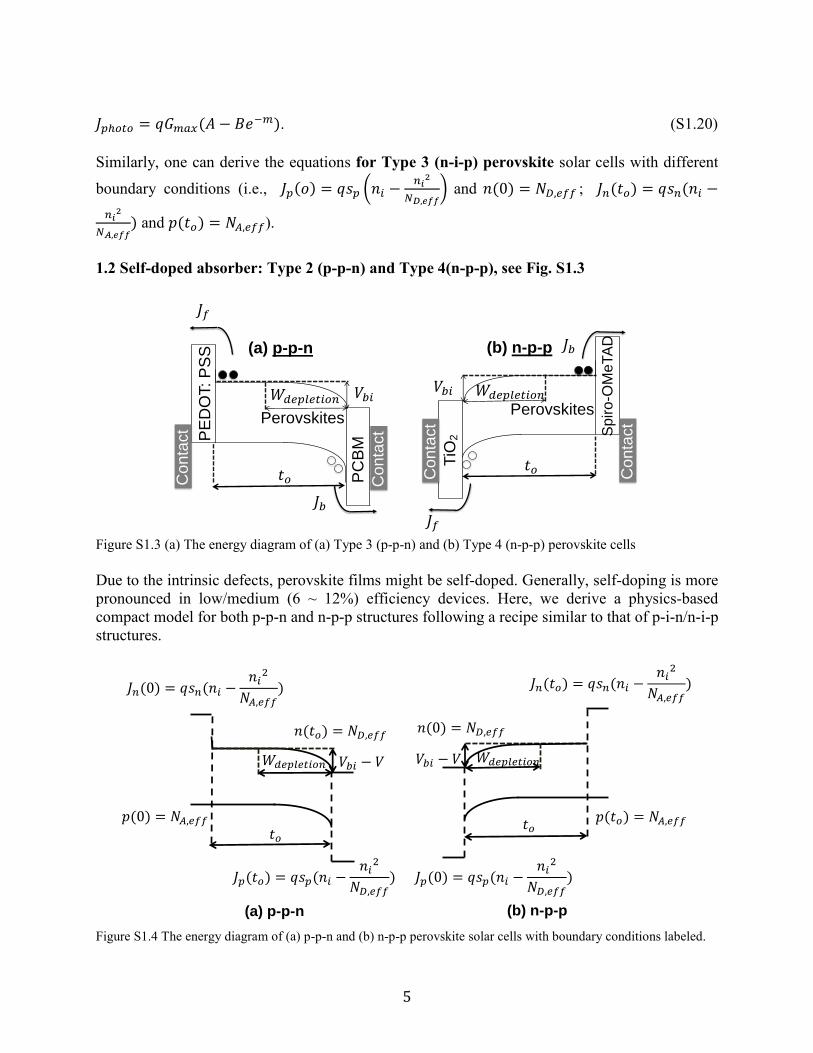
1.2 Self-doped absorber: Type 2 (p-p-n) and Type 4(n-p-p), see Fig. S1.3
Figure S1.3 (a) The energy diagram of (a) Type 3 (p-p-n) and (b) Type 4 (n-p-p) perovskite cells
Due to the intrinsic defects, perovskite films might be self-doped. Generally, self-doping is more
pronounced in low/medium (6 ~ 12%) efficiency devices. Here, we derive a physics-based
compact model for both p-p-n and n-p-p structures following a recipe similar to that of p-i-n/n-i-p
structures.
Figure S1.4 The energy diagram of (a) p-p-n and (b) n-p-p perovskite solar cells with boundary conditions labeled.
(a) p-p-n
Perovskites
PE
DO
T: P
SS
PC
BM
Co
nta
ct
Co
nta
ct
(b) n-p-p
Perovskites
TiO
2 Spiro
-OM
eTA
D
Co
nta
ct
Co
nta
ct
(a) p-p-n (b) n-p-p

6
The energy diagrams of p-p-n and n-p-p structures are shown in Fig. S1.4. The system can be
divided into two parts: 1) the depletion region, 𝑊𝑑𝑒𝑙𝑝𝑡𝑖𝑜𝑛(𝑉) = 𝑊𝑑𝑒𝑙𝑝𝑡𝑖𝑜𝑛(0 V)√(𝑉𝑏𝑖−𝑉)
𝑉𝑏𝑖 (𝑉 < 𝑉𝑏𝑖);
2) the neutral charge region, 𝑡0 − 𝑊𝑑𝑒𝑙𝑝𝑡𝑖𝑜𝑛(𝑉). Fig. S1.5 shows the corresponding electric field
profiles (𝑉 < 𝑉𝑏𝑖), where the field in the neutral charge regions are zero, while that in the depletion
region is presumed linear following |𝐸𝑚𝑎𝑥(𝑉)| =2(𝑉𝑏𝑖−𝑉)
𝑊𝑑𝑒𝑙𝑝(𝑉).
Figure S1.5 Electric field of (a) Type 2 (p-p-n) and (b) Type 4 (n-p-p) perovskite solar cells.
We adopt the same boundary conditions and generation profile as in Section 1.1 to solve Eqs.
(S1.5) and (S1.6). Additionally, the charges and the currents must be continuous at the boundary
between the depletion and neutral regions, i.e., 𝐽𝑛(𝑝)(𝑙−) = 𝐽𝑛(𝑝)(𝑙+) and 𝑛, 𝑝(𝑙−) = 𝑛, 𝑝(𝑙+),
where 𝑙 = 𝑡0 − 𝑊𝑑𝑒𝑙𝑝𝑡𝑖𝑜𝑛(𝑉) and 𝑙 = 𝑊𝑑𝑒𝑙𝑝𝑡𝑖𝑜𝑛(𝑉) for p-p-n and n-p-p, respectively.
Following the same procedures in Section 1.1, we can derived the equations for dark and photo
currents (𝑉 < 𝑉𝑏𝑖) following:
Type 2 (p-p-n):
𝛼𝑓,𝑝𝑝𝑛 = 1/(∆ + 𝛽𝑓), (S1.21)
𝛼𝑏,𝑝𝑝𝑛 = 1/(∆ × 𝑒𝑉′+ 𝛽𝑏), (S1.22)
𝐴𝑝𝑝𝑛 = 𝛼𝑓 × (1
𝑚(𝑒−𝑚×∆ − 1)−𝛽𝑓), (S1.23)
𝐵𝑝𝑝𝑛 = 𝛼𝑏 × (𝑒𝑉′
𝑚(𝑒−𝑚×(∆−1) − 𝑒𝑚) − 𝛽𝑏), (S1.24)
Type 4 (n-p-p):

7
𝛼𝑓,𝑛𝑝𝑝 = 1/(∆ × 𝑒𝑉′+ 𝛽𝑓), (S1.25)
𝛼𝑏,𝑛𝑝𝑝 = 1/(∆ + 𝛽𝑏), (S1.26)
𝐴𝑛𝑝𝑝 = 𝛼𝑓 × (𝑒𝑉′
𝑚(𝑒−𝑚 − 𝑒𝑚×(∆−1)) − 𝛽𝑓), (S1.27)
𝐵𝑛𝑝𝑝 = 𝛼𝑏 × (1
𝑚(1 − 𝑒𝑚×∆) − 𝛽𝑏). (S1.28)
The new parameter ∆= 1 − 𝑛√(𝑉𝑏𝑖 − 𝑉)/𝑉𝑏𝑖, where 𝑛 = 𝑊𝑑𝑒𝑝𝑙𝑒𝑡𝑖𝑜𝑛(0 V)/𝑡0 is the ratio of the
equilibrium depletion width and the absorber thickness.
We assume that the self-doped absorber behaves identically as an intrinsic cell when 𝑉 ≥ 𝑉𝑏𝑖.
Hence we use Eqs. (S1.16) to (S1.20) to describe the operation of a self-doped device at 𝑉 ≥ 𝑉𝑏𝑖.
Please note that Eqs. (S1.16) to (S1.20) give the same limit as Eqs. (S1.21) to (S1.28) when 𝑉 →𝑉𝑏𝑖.
2 Fitting algorithm
The parameters of the compact model are extracted by fitting the equations to experimental data.
The fitting algorithm has two parts: 1) Model choice 2) Iterative fitting. In the appendix, we
demonstrate an illustrative MATLAB® script that can be used for fitting.
2.1 Model choice
Before one fits the data, the structure of the cell must be known (e.g., PEDOT: PSS/
Perovskite/PCBM or TiO2/Perovskite/Spiro-OMeTAD) and whether the absorber is self-doped or
not. Ideally, the capacitance-voltage measurement provides the doping profile; as an alternative,
we find that the steepness (dI/dV) of the light I-V curve at low voltage can also differentiate self-
doped and intrinsic cells, see Fig. S2.1. Specifically, the light IV of the self-doped device (sample
#2) shows a steep decrease (~ 0 V – 0.5 V) in photocurrent much before the maximum power point
(MPP); an undoped device (sample #1), however, shows flat light IV before MPP . If the parasitic resistance extracted from dark IV is not significant, our model attributes this decrease in
photocurrent to voltage-dependent reduction of the depletion region (charge collection) of a doped
absorber. Such a feature helps one to choose the correct model for a device.

8
Figure S2.1 Fitting results of (a) Samples #1 (p-i-n, Efficiency = 15.7%, JSC = 22.7 mA/cm2, VOC = 0.85 V, FF = 81%).
(b) Samples #2 (p-p-n, Efficiency = 11.1%, JSC = 21.9 mA/cm2, VOC = 0.75 V, FF = 64%).
2.1 Iterative fitting
Estimating the initial guesses and limiting the range of each parameter (from physical
considerations) is an important step, since the fitting procedure utilize the iterative fitting function
“lsqcurvefit” in MATLAB®, whose results depend on the initial guesses significantly.
The physical parameters we attempt to deduce are: 𝐺𝑚𝑎𝑥 , 𝜆𝑎𝑣𝑒 , 𝑡𝑜 , 𝑊𝑑𝑒𝑝𝑙𝑒𝑡𝑖𝑜𝑛(0 V) (self-
doped), 𝐷, 𝑠𝑓, 𝑠𝑏, 𝑉𝑏𝑖, 𝐽𝑓0, and 𝐽𝑏0. Among these parameters, based on the transfer matrix method
[3], 𝑞𝐺𝑚𝑎𝑥 can be obtained by integrating the photon absorption (around 23 mA/cm2) and 𝜆𝑎𝑣𝑒 is
around 100 nm; 𝐷 ≈ 0.05 cm2s−1 is known for the material system for both electrons and holes.
2.1.1 Photocurrent
Extracted physical parameter list: 𝒕𝒐, 𝑾𝒅𝒆𝒑𝒍𝒆𝒕𝒊𝒐𝒏(𝟎 𝐕) (self-doped), 𝒔𝒇, 𝒔𝒃, 𝑽𝒃𝒊
Presuming the dark current is illumination-independent, one can calculate photocurrent following
𝐽𝑝ℎ𝑜𝑡𝑜(𝐺, 𝑉) = 𝐽𝑙𝑖𝑔ℎ𝑡(𝐺, 𝑉) − 𝐽𝑑𝑎𝑟𝑘(𝑉). (S2.1)
400 nm is a sensible initial guess for 𝑡𝑜, since the absorber thickness is around 300 nm to 500 nm
for perovskite solar cells. Though capacitance measurement can determine 𝑊𝑑𝑒𝑝𝑙𝑒𝑡𝑖𝑜𝑛(0 V) for a
self-doped device, one can make 𝑊𝑑𝑒𝑝𝑙𝑒𝑡𝑖𝑜𝑛(0 V) ≈ 300 nm as an initial guess. It has been shown
that 𝑠𝑓 is inferior to 𝑠𝑏 in most cases due to low insufficient barrier between PEDOT:PSS and
perovskites as well as low carrier lifetime in TiO2. Hence, the initial guesses for 𝑠𝑓 and 𝑠𝑏 could
be approximately 103 cm/s and 102 cm/s, respectively. The junction built-in 𝑉𝑏𝑖 is estimated to be
the cross-over voltage of dark and light IV curves.
Then one can use the “lsqcurvefit” function to fit the photocurrent based on the initial guesses.
#1 (model)
#1 (measured)
(a)
#2 (model)
#2 (measured)
(b)

9
2.1.2 Dark current
Extracted physical parameter: 𝑱𝒇𝟎, 𝑱𝒃𝟎
Since 𝐽𝑓0 and 𝐽𝑏0 is on the order of 10−13 to 10−15 mA/cm2, one can use zero as the initial
guesses. Afterwards, one can use the iterative fitting procedure for the dark current while the
parameters extracted from photocurrent are fixed.
Once the parameters are obtained, they must be checked for self-consistency and convergence
between light and dark characteristics.

10
Appendix: Example Matlab script
function [coeff_final] = perovskite_fitting(JV) % JV data format %1st column is voltage (V) %2nd column is light current (mA/cm2) %3rd column is dark current (mA/cm2) % the list of the physical parameters qgmax = 23; %mA/cm2 lambda = 100; %nm Dnp = 0.05; %0.05 cm2s-1 type = 3; % 1 for p-i-n/n-i-p; 2 for p-p-n; 3 for n-p-p; global parms parms =[qgmax;lambda;Dnp;type]; % set of input parameters %vbi = coeff(1); %V %to = coeff(2); %nm %sf = coeff(3); %cm/s %sb = coeff(4); %cm/s %jfo = coeff(5); %mA/cm2 %jbo = coeff(6); %mA/cm2 %wdepltion = coeff(7); %nm %calculate photocurrent JPdataH=JV(:,2)-JV(:,3); VdataH=JV(:,1); %initial guess coeff_init = [0.8;400;1e3;1e2;0;0; 300]; %fit photocurrent % now we run optimization. options = optimset('Display','iter','TolFun',1e-10,'TolX',1e-25); % Constraints lb=[0; 0; 1e-3; 1e-3; 0; 0; 0]; % lower bound constraints ub=[1.6; 500; 1e7; 1e7; 1; 1; 500]; % upper bound constraints [coeff_final,resnorm,residual,exitflag] = lsqcurvefit(@pero_p,coeff_init,VdataH,JPdataH,lb,ub,options); %plot photocurrent figure(1) plot(VdataH(:,1),pero_p(coeff_final,VdataH(:,1)),'or','LineWidth',2); hold on plot(VdataH(:,1),JPdataH,'-r','LineWidth',2); set(gca,'LineWidth',2,'FontSize',22,'FontWeight','normal','FontName','Times') set(get(gca,'XLabel'),'String','V (V)','FontSize',22,'FontWeight','bold','FontName','Times') set(get(gca,'YLabel'),'String','J (mA/cm^2)','FontSize',22,'FontWeight','bold','FontName','Times') set(gca,'box','on');

11
%fit dark IV coeffp = coeff_final; pero_d2 = @(coeff,vd) pero_d(coeff,coeffp,vd); lb=[0; 0; 1e-3; 1e-3; 0; 0; 0]; % lower bound constraints ub=[1.6; 500; 1e7; 1e7; 10; 10; 500]; % upper bound constraints [coeff_final,resnorm,residual,exitflag] = lsqcurvefit(pero_d2,coeff_final,VdataH,JV(:,3),lb,ub,options); %plot darkcurrent figure(2) plot(VdataH(:,1),pero_d2(coeff_final,VdataH(:,1)),'or','LineWidth',2); hold on plot(VdataH(:,1),JV(:,3),'r','LineWidth',2); set(gca,'LineWidth',2,'FontSize',22,'FontWeight','normal','FontName','Times') set(get(gca,'XLabel'),'String','V (V)','FontSize',22,'FontWeight','bold','FontName','Times') set(get(gca,'YLabel'),'String','J (mA/cm^2)','FontSize',22,'FontWeight','bold','FontName','Times') set(gca,'box','on'); coeff_final(5) = coeff_final(5)/1e10; %jfo normalized to mA/cm2 coeff_final(6) = coeff_final(6)/1e10; %jbo normalized to mA/cm2 %%function to calculate photocurrent function [jphoto] = pero_p(coeff,vd) qgmax = parms(1); lambda = parms(2); Dnp = parms(3); type = parms(4); kt = 0.0259; vbi = coeff(1)+1e-6; %for convergence to = coeff(2); sf = coeff(3); sb = coeff(4); wdelp = coeff(7); m = to/lambda; n = wdelp/to; bf = Dnp/to/1e-7/sf; bb = Dnp/to/1e-7/sb; y = (vd-vbi)./kt; if type == 1 % for p-i-n/n-i-p alphaf = 1./((exp(y)-1)./y+bf);

12
alphab = 1./((exp(y)-1)./y+bb); B = alphab .* ((1-exp(y+m))./(y+m)-bb); A = alphaf .* ((1-exp(y-m))./(y-m)-bf); jphoto = qgmax * (-B.*exp(-m)+A); elseif type == 2 % for p-p-n yyy = 1 - n.* sqrt((vbi-vd)./vbi); for i = 1:length(vd) if vd(i) >= vbi alphaf = 1/((exp(y(i))-1)/y(i)+bf); alphab = 1/((exp(y(i))-1)/y(i)+bb); B = alphab * ((1-exp(y(i)+m))/(y(i)+m)-bb); A = alphaf * ((1-exp(y(i)-m))/(y(i)-m)-bf); jphoto(i) = qgmax * (-B*exp(-m)+A); elseif vd(i) < vbi alphab = 1/(exp(y(i))*yyy(i)+bb); alphaf = 1/(yyy(i)+bf); A = alphaf * ((-1+exp(-yyy(i)*m))/m-bf); B = alphab * (exp(y(i))*(-exp(m)+exp(-m*(yyy(i)-1)))/m-bb); jphoto(i) = qgmax * (-B*exp(-m)+A); end end jphoto = jphoto'; elseif type == 3 % for n-p-p yyy = 1 - n.* sqrt((vbi-vd)./vbi); for i = 1:length(vd)

13
if vd(i) >= vbi alphaf = 1/((exp(y(i))-1)/y(i)+bf); alphab = 1/((exp(y(i))-1)/y(i)+bb); B = alphab * ((1-exp(y(i)+m))/(y(i)+m)-bb); A = alphaf * ((1-exp(y(i)-m))/(y(i)-m)-bf); jphoto(i) = qgmax * (-B*exp(-m)+A); elseif vd(i) < vbi alphaf = 1/(exp(y(i))*yyy(i)+bf); alphab = 1/(yyy(i)+bb); B = alphab * (-bb + (-exp(yyy(i)*m)+1)/m); A = alphaf * (exp(y(i))*(exp(-m)-exp(m*(yyy(i)-1)))/m-bf); jphoto(i) = qgmax * (-B*exp(-m)+A); end end jphoto = jphoto'; end end %%function to calculate darkcurrent function [jdark] = pero_d(coeff,coeffp,vd) Dnp = parms(3); type = parms(4); kt = 0.0259; vbi =coeffp(1)+1e-6; %for convergence; to = coeffp(2); sf = coeffp(3); sb = coeffp(4); jfo = coeff(5); jbo = coeff(6);

14
wdelp = coeffp(7); n = wdelp/to; bf = Dnp/to/1e-7/sf; bb = Dnp/to/1e-7/sb; y = (vd-vbi)./kt; if type == 1 alphaf = 1./((exp(y)-1)./y+bf); alphab = 1./((exp(y)-1)./y+bb); %1e10 here just make it easy to converge jdark = (exp(vd/kt)-1).*(alphaf*jfo+alphab*jbo)/1e10; elseif type == 2 yyy = 1 - n.* sqrt((vbi-vd)./vbi); for i = 1:length(vd) if vd(i) < vbi alphab = 1/(exp(y(i))*yyy(i)+bb); alphaf = 1/(yyy(i)+bf); jdark(i) = (exp(vd(i)/kt)-1).*(alphaf*jfo+alphab*jbo)/1e10; else alphaf = 1./((exp(y(i))-1)./y(i)+bf); alphab = 1./((exp(y(i))-1)./y(i)+bb); jdark(i) = (exp(vd(i)/kt)-1).*(alphaf*jfo+alphab*jbo)/1e10; end end jdark = jdark'; elseif type == 3 yyy = 1 - n.* sqrt((vbi-vd)./vbi); for i = 1:length(vd) if vd(i) < vbi

15
alphaf = 1/(exp(y(i))*yyy(i)+bf); alphab = 1/(yyy(i)+bb); jdark(i) = (exp(vd(i)/kt)-1)*(alphaf*jfo+alphab*jbo)/1e10; else alphaf = 1/((exp(y(i))-1)/y(i)+bf); alphab = 1/((exp(y(i))-1)/y(i)+bb); jdark(i) = (exp(vd(i)/kt)-1)*(alphaf*jfo+alphab*jbo)/1e10; end end jdark = jdark'; end end end

16
References
[1] R. F. Pierret, Semiconductor Device Fundamentals. Prentice Hall, 1996.
[2] S. D. Stranks, G. E. Eperon, G. Grancini, C. Menelaou, M. J. P. Alcocer, T. Leijtens, L.
M. Herz, A. Petrozza, and H. J. Snaith, “Electron-hole diffusion lengths exceeding 1
micrometer in an organometal trihalide perovskite absorber.,” Science, vol. 342, no. 6156,
pp. 341–4, Oct. 2013.
[3] L. a. a. Pettersson, L. S. Roman, and O. Inganas, “Modeling photocurrent action spectra of
photovoltaic devices based on organic thin films,” J. Appl. Phys., vol. 86, no. 1, p. 487,
1999.